performance measurement in north carolina cities and townsnorth carolina cities and towns david n....
TRANSCRIPT

p o p u l a r g ov e r n m e n t f a l l 2 0 0 1 11
N orth Carolina cities and townsoften are included on nationallists of local governments that
are noteworthy for the extent to whichthey measure their performance. Char-lotte, for example, has long been countedamong the leaders of the performancemeasurement movement in city govern-ment. Recently it has emerged as the na-tion’s premiere municipal example of the“balanced scorecard” approach to per-formance measurement.1
A handful of North Carolina’s largecities have long histories in the measure-ment of municipal services. Several oth-ers have made dramatic strides in recentyears. Additionally, twenty-four cities
Performance Measurement in North Carolina Cities and Towns
David N. Ammons
P O P U L A R G O V E R N M E N T
The author is an Institute of Governmentfaculty member who specializes in per-formance measurement, benchmarking,and productivity improvement. Contacthim at [email protected].
PHO
TOC
OU
RTES
YO
FN
C D
IVIS
ION
OF
TOU
RISM
, FIL
MA
ND
SPO
RTS
DEV
ELO
PMEN
T
Table 1. Performance Measurement and Reporting among a Sample ofNorth Carolina Cities and Towns
Do You Measure andReport Performance?
Population Number Yes (%) No (%)
200,000 or greater 3 100 0
100,000–199,999 3 67 33
50,000–99,999 8 75 25
25,000–49,999 7 71 29
Subtotal (25,000 or greater) 21 76 24
15,000–24,999 13 15 85
10,000–14,999 4 25 75
5,000–9,999 17 6 94
Subtotal (5,000–24,999) 34 12 88
Total 55 36 64
Note: This table is based on responses to a survey of 60 cities, including all 22 with 25,000 or morein population and a random sample of 38 with populations from 5,000 to 24,999. The response ratewas 91.7%.
Charlotte’s skyline
12 p o p u l a r g ov e r n m e n t f a l l 2 0 0 1
and towns have drawn national atten-tion through their participation in theNorth Carolina Local Government Per-formance Measurement Project. This pro-ject, designed to provide participatinggovernments with reliable, comparativedata on cost and performance, now isemulated in at least two other states.
From this information a person couldeasily conclude that performance mea-surement is deeply and firmly entrenchedin North Carolina local governments,permeating the state’s communities, largeand small. However, a 2001 Institute ofGovernment survey shows the practiceto be widespread only among the state’slarger communities, with a sharp drop-off among smaller units. This articlereports the results of that survey.
Review of PerformanceMeasurement Reports
In January and February 2001, theInstitute of Government asked officialsfrom 60 North Carolina cities and towns(hereinafter referred to as “cities”) to re-port on the status of performance mea-surement in their local government,either by submitting copies of the reportsthat they use to document municipal per-formance or by indicating that they nei-ther measure nor report performance.The 60 that were surveyed included all22 of the state’s cities with populationsof 25,000 or more and a random sampleof 38 cities with populations from 5,000to 24,999. A total of 55 cities respondedto the request, for a response rate of 91.7percent. Among the cities that reportedtheir performance, most did so byincluding measures in their budget, butsome prepared a separate annual orquarterly performance report (for exam-ples, see Exhibits 1 and 2).
Performance MeasurementActivity
Twenty-one of the 22 cities of 25,000 ormore in population responded to the re-quest. Three-fourths of the respondentsin this set of medium and large commu-nities provided performance-reportingdocuments, thereby corroborating the rep-utation of North Carolina’s cities for con-siderable activity in performance mea-surement (see Table 1).
Table 2. A Sample of Higher-Order Performance Measures Reported by North Carolina Cities and Towns
Effectiveness Measures
• Case clearance rates
• Investment yield
• Percentage of fires confined to room of origin
• Survival rate for patients found in cardiac arrest
• Percentage of fire code violations corrected
• Percentage of calls correctly dispatched
• Accuracy of revenue forecast
• Percentage of population registered in recreation center programs
• Utility bill collection rate
• Percentage of students in after-school program improving at least oneletter grade
Responsiveness (a subcategory of effectiveness)
• Response time to high-priority police calls
• Response time to fire emergency calls
• Percentage of accounting payments made within terms
• Percentage of potholes repaired within twenty-four hours of their being reported
• Percentage of monthly financial reports distributed within five days ofmonth’s end
• Percentage of 911 calls answered (telephone picked up) within nineteen seconds
• Average waiting time for customers
Customer Assessment (a subcategory of effectiveness)
• Percentage of citizens “satisfied” or “very satisfied” with service providedby police department
• Percentage of citizens seldom or never fearful of crime in theirneighborhood
• Percentage of recreation programs rated “satisfactory”
• Percentage of respondents rating athletic facilities as “good” or“excellent”
• Rating of landscape attractiveness
• Percentage of participants who rate fishing clinics as “helpful” or “very helpful”
Efficiency Measures
• Cost per dispatched police call
• Incoming calls per patrol officer
• Fire safety inspections completed per inspector (full-time equivalent)
• Cost per centerline mile of streets maintained
• Average cost to repair asphalt failure
• Average cost to repair sidewalk, per linear foot
• Person-hours per nonresidential building inspection
• Repairs per mechanic
• Cost per soccer field marked
• Maintenance cost per park acre
p o p u l a r g ov e r n m e n t f a l l 2 0 0 1 13
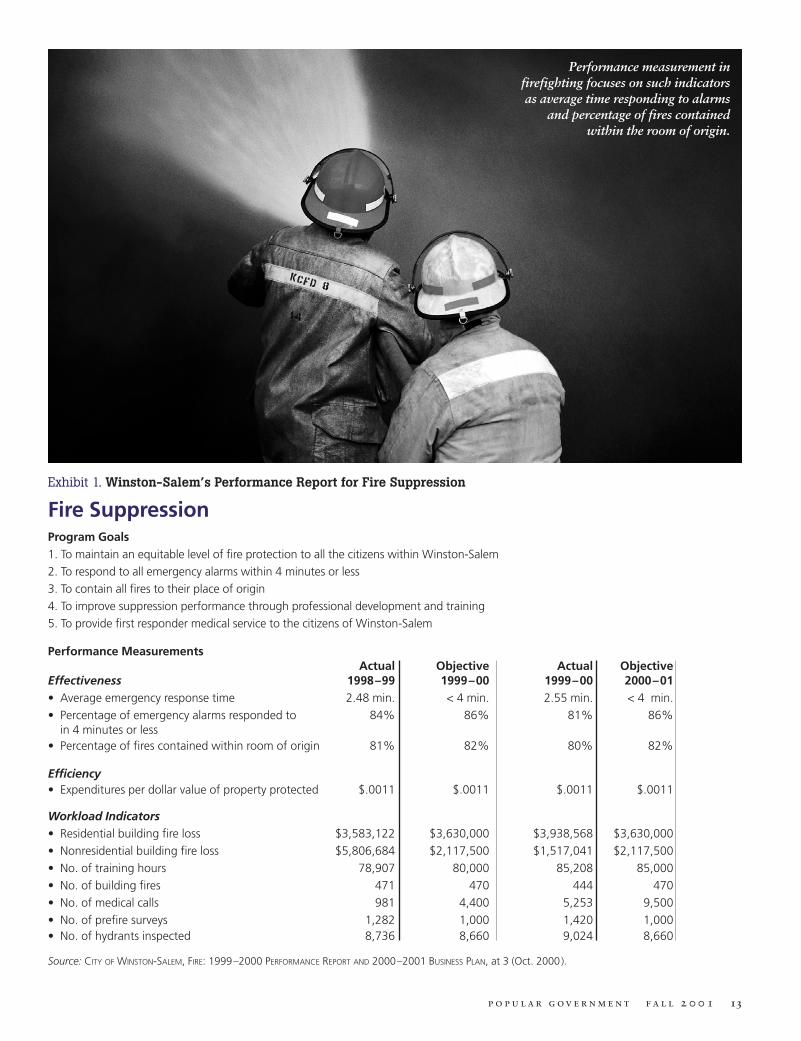
Exhibit 1. Winston-Salem’s Performance Report for Fire Suppression
Fire SuppressionProgram Goals1. To maintain an equitable level of fire protection to all the citizens within Winston-Salem2. To respond to all emergency alarms within 4 minutes or less3. To contain all fires to their place of origin4. To improve suppression performance through professional development and training5. To provide first responder medical service to the citizens of Winston-Salem
Performance MeasurementsActual Objective Actual Objective
Effectiveness 1998–99 1999–00 1999–00 2000–01• Average emergency response time 2.48 min. < 4 min. 2.55 min. < 4 min.• Percentage of emergency alarms responded to 84% 86% 81% 86%
in 4 minutes or less• Percentage of fires contained within room of origin 81% 82% 80% 82%
Efficiency• Expenditures per dollar value of property protected $.0011 $.0011 $.0011 $.0011
Workload Indicators• Residential building fire loss $3,583,122 $3,630,000 $3,938,568 $3,630,000• Nonresidential building fire loss $5,806,684 $2,117,500 $1,517,041 $2,117,500• No. of training hours 78,907 80,000 85,208 85,000• No. of building fires 471 470 444 470• No. of medical calls 981 4,400 5,253 9,500• No. of prefire surveys 1,282 1,000 1,420 1,000• No. of hydrants inspected 8,736 8,660 9,024 8,660
Source: CITY OF WINSTON-SALEM, FIRE: 1999–2000 PERFORMANCE REPORT AND 2000–2001 BUSINESS PLAN, at 3 (Oct. 2000).
Performance measurement infirefighting focuses on such indicatorsas average time responding to alarms
and percentage of fires containedwithin the room of origin.
14 p o p u l a r g ov e r n m e n t f a l l 2 0 0 1
0
10
20
30
40
50
60
70
1 5 10 15 20 25 30 35 40 45 50 55
Cities by Size, in Descending Order
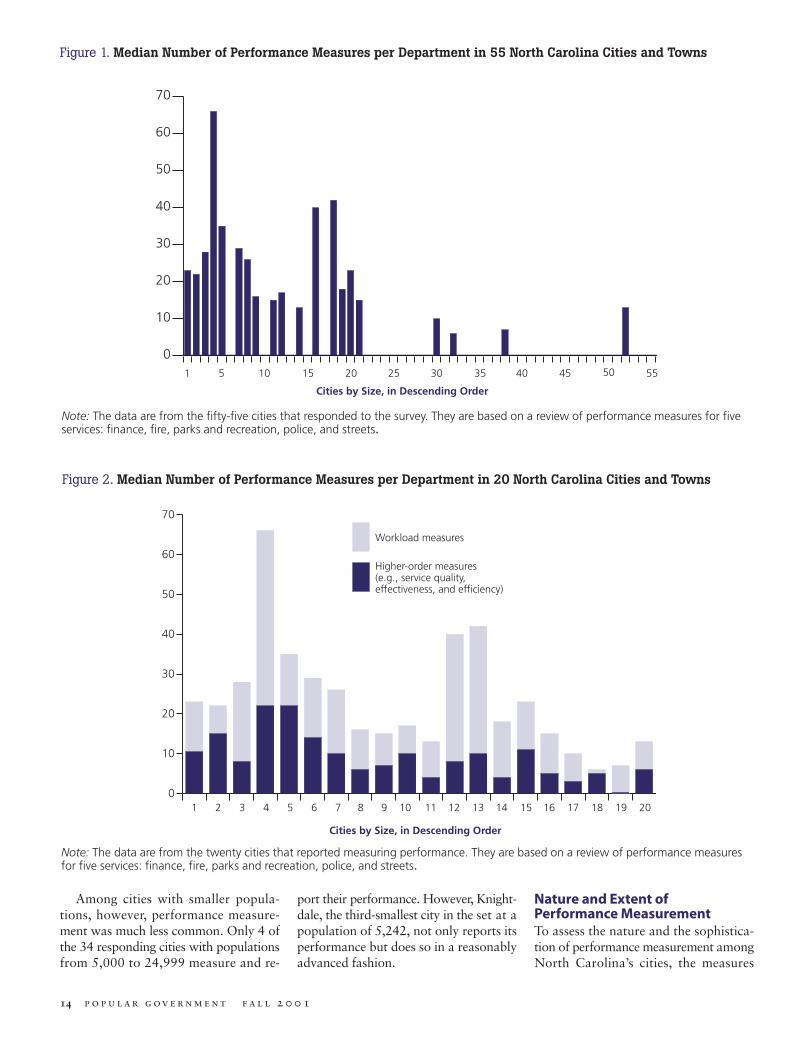
Figure 1. Median Number of Performance Measures per Department in 55 North Carolina Cities and Towns
Note: The data are from the fifty-five cities that responded to the survey. They are based on a review of performance measures for fiveservices: finance, fire, parks and recreation, police, and streets.
0
10
20
30
40
50
60
70
1 2 3 4 5 6 7 8 9 10 11 12 13 14 15 16 17 18 19 20
Higher-order measures (e.g., service quality, effectiveness, and efficiency)
Workload measures
Cities by Size, in Descending Order
Figure 2. Median Number of Performance Measures per Department in 20 North Carolina Cities and Towns
Note: The data are from the twenty cities that reported measuring performance. They are based on a review of performance measuresfor five services: finance, fire, parks and recreation, police, and streets.
Among cities with smaller popula-tions, however, performance measure-ment was much less common. Only 4 ofthe 34 responding cities with populationsfrom 5,000 to 24,999 measure and re-
port their performance. However, Knight-dale, the third-smallest city in the set at apopulation of 5,242, not only reports itsperformance but does so in a reasonablyadvanced fashion.
Nature and Extent ofPerformance MeasurementTo assess the nature and the sophistica-tion of performance measurement amongNorth Carolina’s cities, the measures

p o p u l a r g ov e r n m e n t f a l l 2 0 0 1 15
Exhibit 2. Knightdale’s Performance Report for Finance
Finance DepartmentPerformance Measures & Workload Indicator Results
Measure/Indicator Target FY 2000 Actual FY 1999 Actual
ACCOUNTING
√ Bank statement reconciled within seven days of receipt 83% 83% 91%
√ Month closed out within fifteen days of month end 83% 67% 75%
√ CAFR [comprehensive annual financial report]awards received since initial entry in 1991 N/A 9 8
√ Month-end financial reports complete within 83% 67% 75%20 days of month end
√ Accuracy of bank deposits submitted to the bank 100% 99% 98%
BUDGET
√ Annual operating budget submitted to GFOA [GovernmentFinance Officers Association] by three months after budget Yes Yes Yesis adopted
√ Number of budget amendments requiring council approval N/A 28 16
√ Average accuracy rate in forecasting all major revenues 90% 99% 88%
√ Accuracy rate in forecasting ad valorem taxes 90% 96% 95%
√ Number of GFOA budget awards since first awarded in 1995 N/A 6 5
INVESTMENTS
√ Average rate of return on investments
First Citizens N/A 5.93% 4.27%
North Carolina Capital Management Trust—Cash Portfolio N/A 6.37% 5.05%
LICENSING
√ Privilege licenses issued within 10 days of 90% 50% 95%application, except during the billing month
Some data for FY 2000 Actual did not meet target this year. The Finance Department installed new software for privilege licenses, all financial operations,and the utility billing process. Although the new software installation has been completed, the new system did cause some delays in our normaloperations, and therefore staff did not meet all targets.
Source: TOWN OF KNIGHTDALE, ANNUAL BUDGET: FISCAL YEAR ENDING JUNE 30, 2001, at 88–90 (May 17, 2000).
reported for five common local govern-ment services—finance, fire, parks andrecreation, police, and streets—wereexamined for each responding govern-ment. To the extent practical, acrossunits, various functions within thesedepartments were uniformly included inor excluded from analysis (for example,information technology and purchasingwere excluded from finance).
In some cities, many measures werereported for a given function. Charlotteand Winston-Salem, for instance, pub-lished more than 100 measures of po-
lice performance in the documents pro-vided for this analysis. High Point andWinston-Salem reported 221 and 145measures, respectively, in their parks andrecreation functions, although many ofthese were measures repeated from onerecreational facility to another.
In contrast, only a few measures ap-peared for selected functions in somecities. Among cities that measured andreported performance at all, the mediannumber of measures per departmentranged from a low of 6 in one city to ahigh of 66 in another (see Figure 1). The
median city in this group reported about20 measures per department.
Some performance measures are sim-ple to collect. Others may be a bit morecomplicated. Often, however, the moreadvanced measures are more informativeand of greater value for management ofoperations and for accountability. Al-though simple to collect, raw counts ofactivity or workload, often called “out-puts,” reveal nothing about the qualityof a service, its effectiveness, or its effi-ciency. Beyond their ability to gauge ser-vice demand and their usefulness in the

calculation of higher-order measures,they have relatively little managerial orpolicy value in their raw form. Measuresof efficiency and effectiveness, the latteroften called “outcomes,” are of muchgreater value to managers. An account-ing manager, for example, is unlikely tobe moved to action by a raw count ofaccounts payable checks produced theprevious quarter—a simple workloadmeasure. On the other hand, he or she islikely to investigate if measures show adecline in the number of checks pro-
duced per account clerk or an increase in the error rate for issued checks—measures of efficiency and effectiveness.
Many of the local governmentsacross the United States that measureperformance rely heavily or exclusivelyon workload measures. They report rawcounts of activities but seldom addressdepartmental efficiency, service quality,or effectiveness. This is rarely the case inNorth Carolina. Of the 20 respondingcities that measure performance, only 1uses workload measures alone. The oth-
16 p o p u l a r g ov e r n m e n t f a l l 2 0 0 1
Figure 3. Effectiveness Measurement among 20 Cities and Towns Measuring Performance
ers supplement workload measures withhigher-order measures of efficiency, ser-vice quality, or effectiveness, rangingfrom a median of 3 higher-order mea-sures per department in one communityto 22 per department in two other cities.(For the use of workload and higher-order measures among the respondingcities that measure performances, seeFigure 2.) Although larger units tendedto report more measures of varioustypes, the pattern is far from uniform.Many of the smaller units reported more
Figure 4. Citizen Assessment among 20 Cities and Towns Measuring Performance
Figure 5. Efficiency Measurement among 20 Cities and Towns Measuring Performance
5% reported no measures of effectiveness
95% reported measures of effectiveness
50% reportedno citizenassessment
50% reportedcitizen assessment
20% reported nomeasures of efficiency
80% reported measures of efficiency
The percentage of potholesrepaired within twenty-fourhours of their being reported
might be one measure of a city’s effectiveness in
street maintenance.

p o p u l a r g ov e r n m e n t f a l l 2 0 0 1 17
An efficiency measure for a government’srecycling program
might be cost per tonof recyclable material
collected.
measures, and more higher-order mea-sures, than at least some of their largercounterparts.
Types of Higher-Order Measures in Use
Local governments that move beyondthe tabulation of mere workload or out-put measures begin to address dimen-sions of performance in a manner that ismore significant to management andpolicy decisions than raw counts ofactivities and participants. These higher-order measures gauge efficiency, servicequality, and outcomes (see Table 2).They focus less on how busy a depart-ment is and more on how efficient andhow effective its services are. Within thebroad category of effectiveness mea-sures, two major subcategories used byNorth Carolina jurisdictions are serviceresponsiveness and citizen assessmentsof services or community conditions.
Nineteen of the 20 responding citiesthat measure performance included indi-cators of effectiveness among their mea-sures (see Figure 3). The typical unit
reported an average of six effectivenessmeasures per department.2 All 19 citiesincluded measures that gauged serviceresponsiveness, but only 10 includedmeasures that reported citizen assess-ments of services or conditions (seeFigure 4). Among the cities that reportedmeasures of responsiveness and citizenassessment, the typical unit reported anaverage of 1.4 measures of responsive-ness and 0.6 measures of citizen assess-ment per department.
Sixteen of the 20 responding citiesthat measure performance included indi-cators of efficiency among their mea-sures (see Figure 5). Among these, thetypical unit reported an average of 3.2efficiency measures per department.
Conclusion
Almost all North Carolina cities of25,000 or greater in population measureand report performance, and they do soin more than a rudimentary fashion. Thedrop-off in the practice of performancemeasurement among communities atlower population levels is sharp. Even
among small North Carolina cities,however, a few serve as models of goodperformance measurement. They demon-strate not only that performance measure-ment is possible in small communitiesbut also that the use of more sophisticat-ed, higher-order measures is not con-fined to their larger counterparts.
Notes
1. The “balanced scorecard” is an approach to measurement that provides balance between “short- and long-term objectives, between financial and non-financial measures, between lagging andleading indicators, and between external and internal performance perspectives.”ROBERT S. KAPLAN & DAVID P. NORTON, THE BALANCED SCORECARD at viii (Boston,Mass.: Harvard Business School Press, 1996).
2. In this and subsequent uses, the “typical” city is the one with the medianvalue in the range. In this particular case, the range extended from 0.0 effectivenessmeasures per department in one communityto an average of 27.4 effectiveness measuresper department in another. The median value was 6.0.