performance measurement and flowfield calculation...
TRANSCRIPT

Performance Measurement and Flowfield Calculation of an Electrothermal Pulsed Plasma Thruster with
a Propellant Feeding Mechanism
IEPC-2005-105
Presented at the 29th International Electric Propulsion Conference, Princeton University, October 31 – November 4, 2005
Toshiaki Edamitsu* and Hirokazu Tahara†
Graduate School of Engineering Science, Osaka University, Toyonaka, Osaka 560-8531, JAPAN
Abstract: We designed an electrothermal pulsed plasma thruster (PPT) with a propellant feeding mechanism using two poly-tetrafluoroethylene (PTFE) bars as propellants, referring results of preliminary study. Both the PPT and capacitors were mounted on a thrust stand with a 1-mm-long perpendicular pendulum which was developed for a precise measurement of an impulse bit. Initial thrust performance showed impulse bit per joule of 43-48 µNs/J, specific impulse of 470-500 s and thrust efficiency of 10-12% with initial stored energy of 4.5-14.6 J. A 10000-shot operation achieved a total impulse of approximately 3.6 Ns, and each PTFE bar was supplied in a length of approximately 2 mm. However, thrust performance gradually decreased with shot number because of uneven receding of the PTFE surface. In order to investigate unsteady phenomena, an unsteady numerical simulation of discharge, plasma flow, heat transfer to the PTFE, heat conduction inside the PTFE and ablation was performed. A calculated result explained the uneven distribution of ablated mass on the PTFE surface. And it was shown that ablation delaying to discharge for a few microseconds was not regarded as late time ablation (LTA) in an electrothermal PPT. Furthermore, an electrothermal PPT which can induce discharges in a number of cavities (discharge rooms) with an igniter was proposed as a substitute for the propellant feeding mechanism to use a large amount of propellant. A PPT with two cavities achieved a lower decreasing rate of impulse bit in a repetitive operation than a conventional PPT with a cavity. A PPT with three cavities was also operated successfully.
Nomenclature a = energy accommodation coefficient A = cross-sectional area of the cavity Cp = specific heat of the solid PTFE e = elementary electric charge k = Boltzmann constant Lcir = circumferential length of the cavity cross section me = mass of electron mi = weighted average mass of a carbon atom and two fluorine atoms n = number density rc = typical cavity radius (0.8 mm for the PPT with a propellant feeding mechanism) T = plasma temperature in local thermodynamic equilibrium * Graduate Student, Mechanical Science and Bioengineering, [email protected].
The 29th International Electric Propulsion Conference, Princeton University,
October 31 – November 4, 2005
1† Associate Professor, AIAA member, Mechanical Science and Bioengineering, [email protected].
Te = electron temperature in the plasma Te,w = electron temperature near the PTFE surface Th = temperature of heavy particles in the plasma Th,w = temperature of heavy particles near the PTFE surface Ts = temperature of the PTFE surface u = average velocity in a cross section U = radial distribution velocity in a cross section Vi = single ionization voltage κ = thermal conductivity of the solid PTFE ν = collision frequency ρ0 = density of the solid PTFE σ = collision cross-sectional area Θ = temperature inside the solid propellant subscript e = electron E = energy-transfer collision h = heavy particle (ion and neutral particle) i = ion n = neutral particle w = near the PTFE surface (Knudsen layer)
I. Introduction
PULSED plasma thrusters (PPTs) are expected to be used as a thruster for a small satellite. The PPT has some features superior to other electric propulsions. It has no sealing part, simple structure and high reliability, which
are benefits of using solid propellants, mainly Teflon® (poly-tetrafluoroethylene: PTFE). However, performances of PPTs are low compared with other electric thrusters1. In general, it is thought that the low performance mainly derives from unsteady phenomena in the PPT. Considerable amount of the propellant which is ablated delaying to a discharge and hardly accelerated, that is, late time ablation (LTA)2, 3 is a typical example. We regard an electrothermal-acceleration-type PPT as a more suitable thruster for a small satellite than an electromagnetic-acceleration-type PPT, because of higher thrust-to-power ratio of the electrothermal PPT. Lower specific impulse of the electrothermal PPT than the electromagnetic PPT is not a significant problem considering that the PPT has no propellant tank. We studied basic performance characteristics and energy balance in an electrothermal PPT with a preliminary model using a PTFE tube as a propellant. Then, the following results are obtained. 4, 5 1) A small cross-sectional area of a cavity (discharge room) improves the performance, because it decreases
transmission energy loss in the discharge circuit due to high plasma resistance and increases pressure in the cavity. 2) Due to interactions between the discharge circuit and the plasma, there is an optimum cavity length (distance
between electrodes) for thrust efficiency, because a short cavity increases transmission energy loss in the discharge circuit and a long cavity increases acceleration energy loss in the PPT. And the optimum cavity length decreases with direct-current resistance of discharge circuit (total of transmission cable resistance, equivalent series resistance inside capacitors and electrodes).
Considering these results, we designed and tested a PPT with a propellant feeding mechanism. In order to investigate physical phenomena in the discharge system including plasma, an unsteady numerical
simulation was performed. It mainly consists of models of discharge, generation of plasma, heat transfer to the PTFE, heat conduction inside the PTFE, ablation from the PTFE surface and acceleration of plasma, which are simultaneously calculated.
Furthermore, a multi-cavity electrothermal PPT is also proposed and examined as a mechanism to lower decreasing rate of impulse bit in a repetitive operation. The PPT has a number of cavities instead of the propellant feeding mechanism. In the PPT, an igniter can induce discharges at all cavities.
Main objectives in this study are to understand unsteady physical phenomena in the PPT system and to develop an electrothermal PPT with a high performance and a large total impulse (long life).
The 29th International Electric Propulsion Conference, Princeton University,
October 31 – November 4, 2005
2

PTFE bars
Ceramic
Igniter
Pyrex glass
Cathode Cavity
Anode
Spring load Spring load ≈ 3N ≈ 3N
a) Cross-section of cavity
Cross-sectional area: 6.52mm2
6mm
1.6mm
R6 Length: 12mm
b)
Figure 1. Electrothermal pulsed plasma thruster with a propellant feeding mechanism: a) thruster, and b) cross section of cavity.
Additional weight, kg
Am
plit
ude p
er Im
puls
e b
it,
μ
m/μ
Ns
2 3 4 5 60.01
0.1
1
10
Figure 3. Sensitiveness of thrust stand vs top weight.
1m
Knife edges Pendulum Weight
Ball and string for calibration
PPT
Capacitors
Vacuum chamber
Displacement sensor
Rotational axis
Electromagnetic damper
Figure 2. Thrust stand.
Table 1 Experimental condition of a PPT with a side-fed propellant feeding mechanism
Capacitance C 9.0 µF Charging voltage V0 1000-1800 V Stored energy E0 4.5-14.6 J
II. Experimental Apparatus The experimental facility mainly consists of a stainless steel vacuum chamber, an oil diffusion pump system,
several DC supplies, and devices explained below. The vacuum chamber pressure was kept at approximately 4×10⁻³ Pa under operations.
A. PPT with a propellant feeding mechanism Figure 1 shows a PPT with a propellant feeding mechanism 6 designed considering the results of the preliminary
PPT 4, 5 and Ref. 7. A cavity is formed between two PTFE bars of 6 mm in thickness and two Pyrex® glass bars of 5 mm in thickness. The cross-sectional area of the cavity is a little smaller than that of the preliminary model (7.1 mm2). The cavity length is 12 mm. The PTFE bars are provided due to spring loads of approximately 3 N. The glass bars are fixed to the body. The anode and the cathode are made of tungsten and stainless steel, respectively. Main discharge is initiated by an igniter mounted in the cathode nozzle. The nozzle has a length of 28 mm and a half angle of 30 degree. Table 1 shows operational conditions of the PPT.
B. Thrust stand
The 29th International Electric Propulsion Conference, Princeton University,
October 31 – November 4, 2005
3
Impulse bits are measured by a pendulum method, as shown in Fig. 2. To arrange the long arm of the thrust stand, a vacuum chamber is designed. The PPT and capacitors are mounted on the pendulum, which rotates around fulcrums of two knife edges without friction. Displacement of the pendulum is detected by an eddy-current-type gap sensor
(non-contacting micro-displacement meter) near the PPT, which measurement accuracy is ±0.5 µm. Sensitiveness of the thrust stand is variable by changing the weight mounted on the top of the pendulum as shown in Fig. 3.
An electromagnetic damper is used to suppress mechanical noises and to decrease the amplitude quickly for the next measurement after firing the PPT. It is useful for a sensitive thrust stand because it is non-contacting. The damper consists of a permanent magnet fixed to the pendulum and two coils fixed to the supporting stand. The control circuit differentiates the output voltage of the displacement sensor and supplies the current proportional to the differentiated voltage to the coils. As a result, the damper works as a viscosity resistor. The damper is turned off just before firing the PPT for measurements without damping, and turned on after the measurement to prepare for the next measurement.
A calibration of the thrust stand is carried out by collisions of balls to the pendulum8 with various balls from various distances corresponding to 15-1400 µNs.
C. Discharge circuit Six mica capacitors with a total capacitance of 9.0 µF are used to store energy. Discharge current waveforms are
measured with a Rogowski coil.
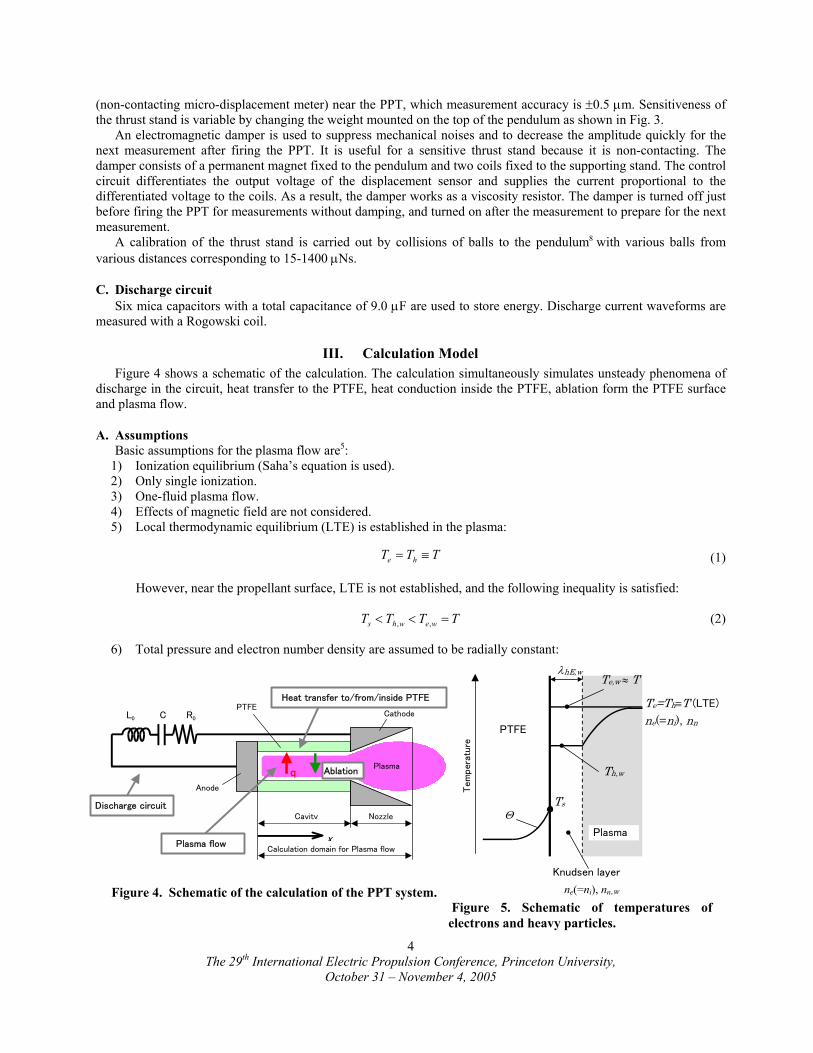
III. Calculation Model Figure 4 shows a schematic of the calculation. The calculation simultaneously simulates unsteady phenomena of
discharge in the circuit, heat transfer to the PTFE, heat conduction inside the PTFE, ablation form the PTFE surface and plasma flow.
A. Assumptions Basic assumptions for the plasma flow are5:
1) Ionization equilibrium (Saha’s equation is used). 2) Only single ionization. 3) One-fluid plasma flow. 4) Effects of magnetic field are not considered. 5) Local thermodynamic equilibrium (LTE) is established in the plasma:
TTT he ≡= (1)
However, near the propellant surface, LTE is not established, and the following inequality is satisfied:
(2) TTTT wewhs =<< ,,
6) Total pressure and electron number density are assumed to be radially constant:
onference, Princeton University, ber 4, 2005
Knudsen layer
ne(=ni), nn,w
Ts
Te,w ≈ T
Θ
Th,w
λhE,w
PTFE
Plasma
Te=Th≡T (LTE)
ne(=ni), nn
Tem
per
ature
Figure 5. Schematic of temperatures of electrons and heavy particles.
Figure 4. Schematic of the calculation of the PPT system.
L0 C R0
PTFE
Cavity Nozzle
x
Cathode
Anode
Discharge circuit
Calculation domain for Plasma flow
Plasma
Plasma flow
Heat transfer to/from/inside PTFE
Ablation
q
The 29th International Electric Propulsion C
October 31 – Novem
4
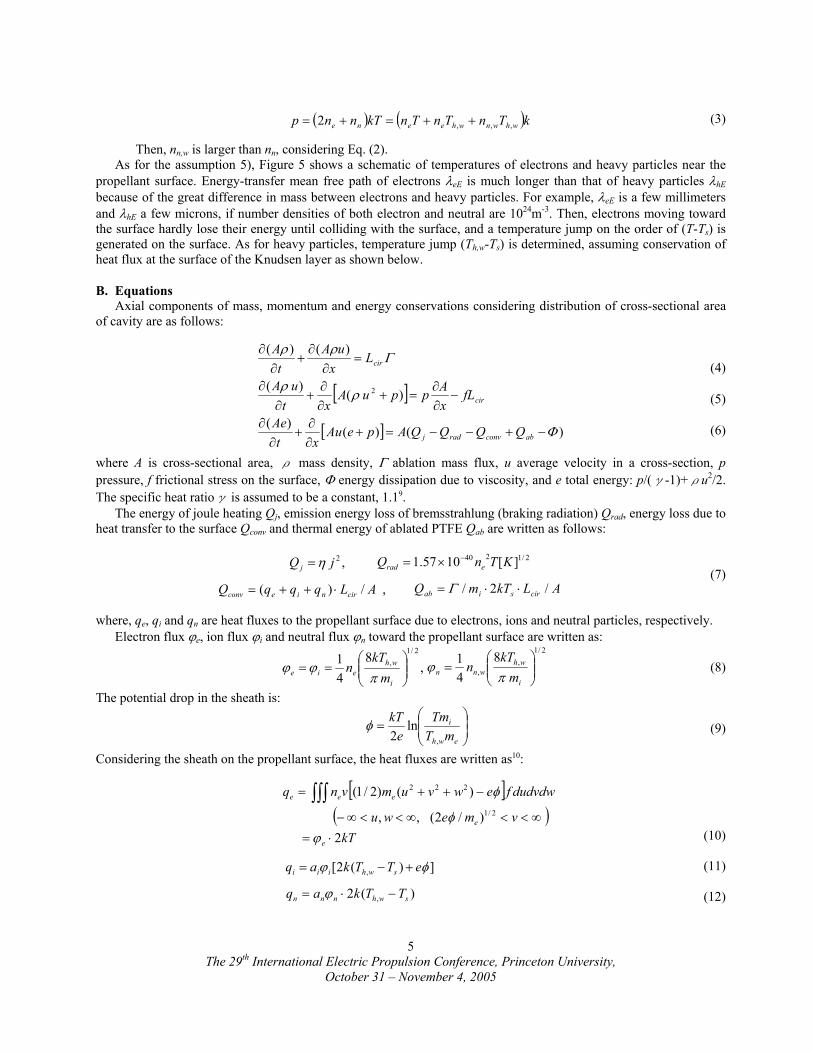
( ) ( )kTnTnTnkTnnp whwnwheene ,,,2 ++=+= (3)
Then, nn,w is larger than nn, considering Eq. (2).
As for the assumption 5), Figure 5 shows a schematic of temperatures of electrons and heavy particles near the propellant surface. Energy-transfer mean free path of electrons λeE is much longer than that of heavy particles λhE because of the great difference in mass between electrons and heavy particles. For example, λeE is a few millimeters and λhE a few microns, if number densities of both electron and neutral are 1024m-3. Then, electrons moving toward the surface hardly lose their energy until colliding with the surface, and a temperature jump on the order of (T-Ts) is generated on the surface. As for heavy particles, temperature jump (Th,w-Ts) is determined, assuming conservation of heat flux at the surface of the Knudsen layer as shown below.
B. Equations Axial components of mass, momentum and energy conservations considering distribution of cross-sectional area
of cavity are as follows:
[ ]
[ ] )()()(
)()(
)()(
2
Φ
ρρ
Γρρ
−+−−=+∂∂
+∂
∂
−∂∂
=+∂∂
+∂
∂
=∂
∂+
∂∂
abconvradj
cir
cir
QQQQApeAuxt
Ae
fLxAppuA
xtuA
Lx
uAt
A(4)
(5)
(6)
where A is cross-sectional area, ρ mass density, Γ ablation mass flux, u average velocity in a cross-section, p pressure, f frictional stress on the surface, Φ energy dissipation due to viscosity, and e total energy: p/(γ-1)+ρu2/2. The specific heat ratioγ is assumed to be a constant, 1.19.
The energy of joule heating Qj, emission energy loss of bremsstrahlung (braking radiation) Qrad, energy loss due to heat transfer to the surface Qconv and thermal energy of ablated PTFE Qab are written as follows:
2/1240 ][1057.1 KTnQ erad
−×=,2jQ j η=(7)
ALkTmQ cirsiab /2/ ⋅⋅= Γ,/)( ALqqqQ cirnieconv ⋅++=
where, qe, qi and qn are heat fluxes to the propellant surface due to electrons, ions and neutral particles, respectively. Electron flux ϕe, ion flux ϕi and neutral flux ϕn toward the propellant surface are written as: 2/1
,,
841
=
i
whwnn m
kTn
πϕ,
841
2/1,
==
i
wheie m
kTn
πϕϕ (8)
The potential drop in the sheath is:
=
ewh
i
mTTm
ekT
,
ln2
φ (9)
Considering the sheath on the propellant surface, the heat fluxes are written as10:
(10)
[ ]( )
kTvmewu
dudvdwfewvumvnq
e
e
eee
2)/2(,,
)()2/1(2/1
222
⋅=∞<<∞<<∞−
−++= ∫∫∫
ϕφ
φ
(11) ])(2[ , φϕ eTTkaq swhiii +−=
)(2 , swhnnn TTkaq −⋅= ϕ (12)
The 29th International Electric Propulsion Conference, Princeton University,
October 31 – November 4, 2005
5
where f is Maxwellian function, v electron velocity component vertical to the surface, and Ts PTFE surface temperature. Energy accommodation coefficients of ion and neutral ai, an are written as follows for high temperature gas over a few hundred Kelvin11:
(13) 2)1/(2 µµ +== ni aa
where µ is the ratio of mass of gas atom M and solid atom m: µ=M/m. In this model, µ = 1, i.e., ai = an = 0.5 is assumed. Heat flux of heavy particles from the Knudsen layer surface to the propellant surface is written as:
( ) ( )swhniiconvh TTkaq −⋅+= ,, 2ϕϕ (14) Heat flux of heat conduction by heavy particles from the central axis of the cavity to the Knudsen layer surface is approximated as follows:
c
whwhhcondh r
TTKKq ,,
, 2−+
= (15) where Kh and Kh,w are coefficients of thermal conductivity by heavy particles at the central axis and the Knudsen layer surface, respectively. They are written as:
( )nEniEei
hnih nn
mTkKKK νν //
23 2
+=+= (16)
( )wnEwnwiEei
whwnwiwh nn
mTk
KKK ,,,,
2
,,, //2
3νν +=+= (17)
Frequencies of energy-transfer collision of heavy particles are as follows, considering that energy-transfer collisions of ion-electron, ion-ion and neutral-electron are negligible compared with the other collisions:
Eniwni
whwiE n
mkT
−
= σν )(,
2/1)(,
)(,
3 (18)
( )EnieEnnwni
whwnE nn
mkT
−− +
= σσν )(,
2/1)(,
)(,
3(19)
where σi-nE and σn-nE are cross-sectional area of energy-transfer collision of ion-neutral and neutral-neutral, respectively.
Conservation of heat flux due to heavy particles requires qh,conv=qh,cond. This equation is simultaneously solved with Eq. (3) using Newton method, and Th,w and nn,w are obtained.
Plasma resistivity η is calculated with the following equation, considering electron collision with both ion and neutral:
2/1
22/32
3][1053.1
ln
⋅+
×= −−
enne
e
e
mkTn
enm
KTσΛη (20)
where σe-n is cross-sectional area of electron-neutral, and ln Λ the Coulomb logarithm. The discharge circuit is modeled as a LCR series circuit including the plasma resistance:
0/)()( =+++++ CQQRRRQLL pCtranCtran&&&
(21) dxARQJ
L
p ∫=−=0
)/(, η&
where R, L, C and Q are, respectively, resistance, inductance, capacitance and electric charge, and subscriptions tran and C, respectively, represent the cables including electrodes of the circuit and the capacitors. The resistance and inductance measured with frequency response method 4 are used in this model (Rtran+RC =5.0 mΩ, Ltran+LC =0.35 µH).
The 29th International Electric Propulsion Conference, Princeton University,
October 31 – November 4, 2005
6
Energy flux due to surface recombination of ion and electron is written as follows, assuming all ions coming to the surface recombine electrons:
(22) iirec eVq ϕ=
Assuming heat-layer thickness is much smaller than the radius of the PTFE curvature,13 a heat conduction equation inside the PTFE is:
p
vol
p CQ
rxCt 02
2
2
2
0 ρΘΘ
ρκΘ
+
∂∂
+∂∂
=∂
∂(23)
where Qvol is energy absorbed by unit volume. Boundary condition on the propellant surface is:
sursurface
qr
=∂∂
−Θκ (24)
where qsur is energy flux onto the surface. The details of Qvol and qsur will be discussed later. Considering latent heat effect, the temperature is kept at constant after temperature reached 600 K until total supplied energy per unit volume comes to ρ∆H (∆H: unzipping energy; 1.5×10⁶ J/kg).
Ablation flux Γ is calculated with Langmuir’s law 12:
vaps
i pkT
m21
2
=
πΓ (25)
Equilibrium vaporizing pressure pvap of PTFE1), 13) is:
( )sccvap TTpp /exp −= (26)
where pc = 1.84×10¹⁵ Pa and Tc = 20815 K are characteristic pressure and temperature, respectively . Energy dissipation and frictional stress was approximately estimated, assuming radial distribution of velocity U(r) with an average velocity of u (=∫U(r)2πrdr/A). The U(r) is locally determined at each time as a profile of either laminar (parabolic profile) or turbulent (1/7th power profile) flow, referring the local Reynolds number at the time estimated using the equivalent diameter of cross section 4A/Lcir. The threshold local Reynolds number is assumed as 2500. Energy and momentum loss due to divergence at the nozzle exit is approximately estimated by regarding the average exhaust velocity in the cross section at the nozzle exit uex as the following velocity:
(27)
[ ] exnoz urdrrUrdrLrrU ⋅∫∫ − ππ 2)(2)/(tancos)( 1
where Lnoz is nozzle length, and U(r) radial distribution of velocity at the nozzle exit.
C. Calculation schemes The calculation domain for plasma flow is between the anode and the nozzle exit. The plasma flow and the LCR
series circuit are calculated with the TVD MacCormack scheme and the Runge-Kutta scheme, respectively.
D. Initial conditions Initial energy is arranged in capacitors at the beginning of calculation. In order to start the discharge, initial plasma
is arranged in the calculation domain. Total energy and total mass of the initial plasma are, respectively, 8.1×10⁻⁴ J and 0.5µg, which are much less than the initial energy in capacitors and mass shot (mass loss of propellant per shot).
IV. Results and Discussions for the PPT with a Propellant Feeding Mechanism
A. Heat supply model to the propellant The energy flux of surface recombination is absorbed with the following distribution inside the propellant derived from Lambert -Beer’s law:
The 29th International Electric Propulsion Conference, Princeton University,
October 31 – November 4, 2005
7
Tem
pera
ture
, K
Depth, µm Time, µs
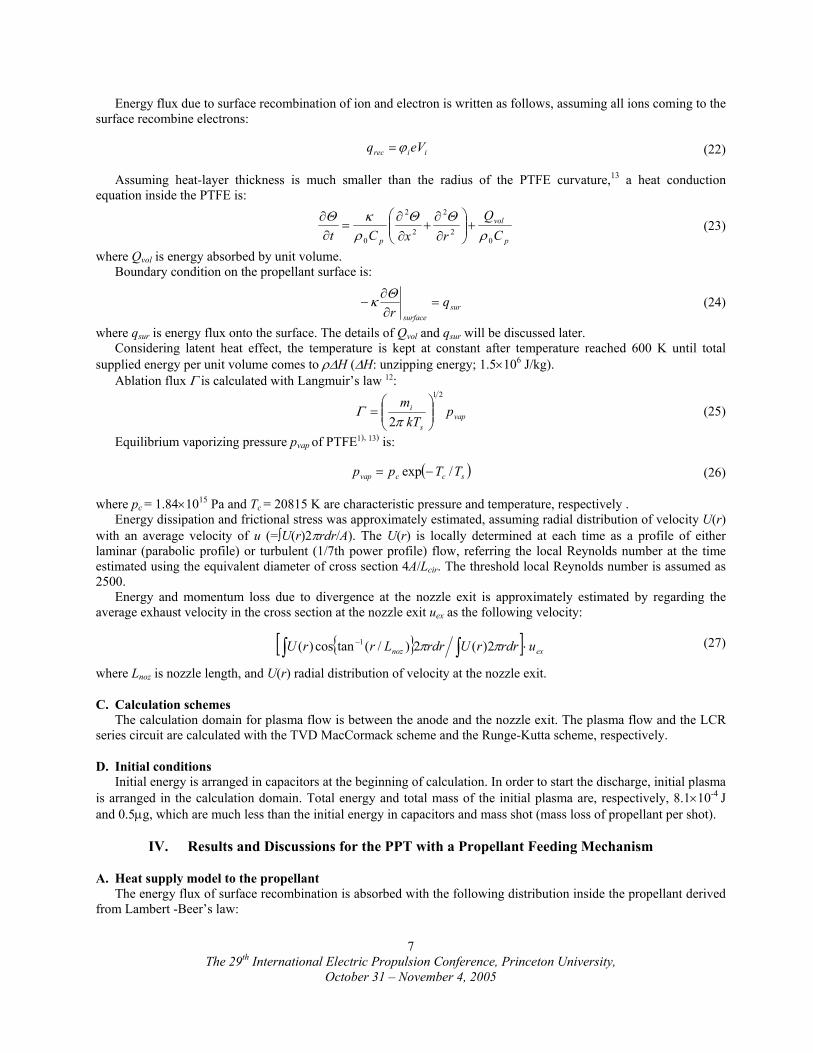
Figure 6. Calculated temperature distribution inside PTFE (E0=8.8 J,x = 6 mm).
Time, μs
Ioni
zation d
egr
ee α
(Th,w -
Ts)
,
(T -
Ts)
, K
T-Ts
Th,w-Ts
α E0=8.8J, x=6mm
λeE ,
m
λeE
L(12mm)
rc(0.8mm)
0 5 10 1510-4
10-2
100
102
104
106
10-4
10-3
10-2
10-1
100
Figure 7. Calculated energy-transfer mean free path of electron, temperature jumps of electron and heavy particle, and ionization degree (E0=8.8 J,x = 6 mm).
( ) 11111 /)ln(,exp tTCrCCqQ recvol −=−= (28)
where T1 is transmittance through a sample with a thickness t1. Although we have no available data of C1 for PTFE, assuming constant values of T1=1×10⁻⁵ (0.001%) for t1=25µm, calculated mass shots agreed well with the experimental results. The assumed C1 is equivalent to T1=0.25 (25%) through t1=3µm, and temperature rise is observed within approximately 10 µm from the surface as shown in Fig. 6. Therefore, value of C1 has considerable influence on the temperature distribution and mass shot. Energy emitted due to bremsstrahlung should also be added in Qvol as Qrad(A/Lcir)C2exp(-C2r). However, the energy flux due to bremsstrahlung is much smaller than qrec. In this model, Qrad(A/Lcir) is included in the energy flux onto the surface qsur for simplicity:
cirabradconvsur L
AQQQq ⋅−+= )( (29)
Figure 7 shows calculated energy-transfer mean free path of electron, temperature jumps of electron and heavy particle, and ionization degree. The assumption of Eq. (1) is valid because the energy-transfer mean free path of electron is longer than the typical cavity radius (0.8 mm) at any time. The mean free path is shorter than the cavity length most of the time, and energy-transfer mean free times of all particles are shorter than 0.05µs. Accordingly, LTE in the axial direction is roughly established. The temperature jump of heavy particle increases when the ionization degree increases because collision between ion and neutral decreases. The assumption of one-fluid plasma flow is valid, because momentum-transfer mean free paths and times of all particles are, respectively, shorter than 5 µm and 10-11 s most of the time.
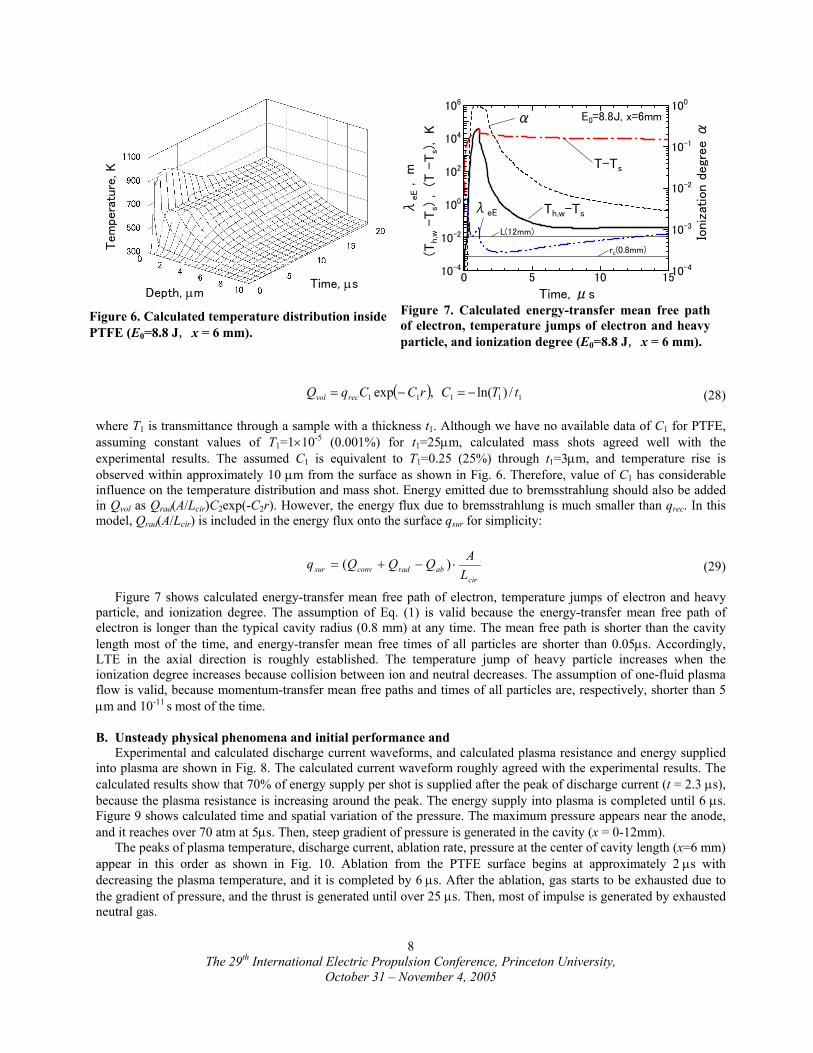
B. Unsteady physical phenomena and initial performance and Experimental and calculated discharge current waveforms, and calculated plasma resistance and energy supplied
into plasma are shown in Fig. 8. The calculated current waveform roughly agreed with the experimental results. The calculated results show that 70% of energy supply per shot is supplied after the peak of discharge current (t = 2.3 µs), because the plasma resistance is increasing around the peak. The energy supply into plasma is completed until 6 µs. Figure 9 shows calculated time and spatial variation of the pressure. The maximum pressure appears near the anode, and it reaches over 70 atm at 5µs. Then, steep gradient of pressure is generated in the cavity (x = 0-12mm).
The peaks of plasma temperature, discharge current, ablation rate, pressure at the center of cavity length (x=6 mm) appear in this order as shown in Fig. 10. Ablation from the PTFE surface begins at approximately 2 µs with decreasing the plasma temperature, and it is completed by 6 µs. After the ablation, gas starts to be exhausted due to the gradient of pressure, and the thrust is generated until over 25 µs. Then, most of impulse is generated by exhausted neutral gas.
The 29th International Electric Propulsion Conference, Princeton University,
October 31 – November 4, 2005
8
Time, μsEnerg
y su
pplie
d int
o pl
asm
a (E
in), J
Dis
char
ge c
urr
ent
, kA
Pla
sma
resi
stan
ce (
Rp),
ΩCal. Ein
Cal. Current
E0=8.8J
Exp. Current
0 5 1
0
2
4
6
8
10
0
0.2
0.4
Figure 8. Experimental and calculated discharge current waveforms, and calculated plasma resistance and energy supplied into plasma (E0=8.8 J).
Cal. Rp
1.6×1024 m-3
0Axial distance, mm
Tim
e,
µs
Pressure, atm
Cavity Nozzle
7050
30
10
Axial distance, mm
Tim
e,
µs
Pressure, atm
Cavity Nozzle
7050
30
10
Figure 9. Calculated time and spatial distribution of pressure (E0=8.8 J).
Pre
ssure
, atm
Pla
sma
tem
pera
ture
, eV
Time, μs
E0=8.8J, x=6mmC
urr
ent, k
A
Current
Plasma tremperature
Presssure
Ablation rate
Thrust by neutral
Abla
tion R
ate, g/
s
Thru
st b
y io
n a
nd
neutr
al p
article
, N
Thrust by ion
0 5 10 15
0
20
40
60
80
100
0
2
4
6
8
10
Figure 10. Calculated plasma temperature, discharge current, ablation rate, total pressure, and thrust due to ion and neutral (E0=8.8 J, x = 6 mm).
Time, μs
Ele
ctr
on n
um
ber
densi
ty a
nd
Neutr
al n
um
ber
dens
ity
, m
-3
Pre
ssure
, at
m
ne nn Pressure
E0=8.8J, x=6mm
3.3×1025 m-3
0 5 10 151023
1024
1025
1026
1027
0
20
40
60
80
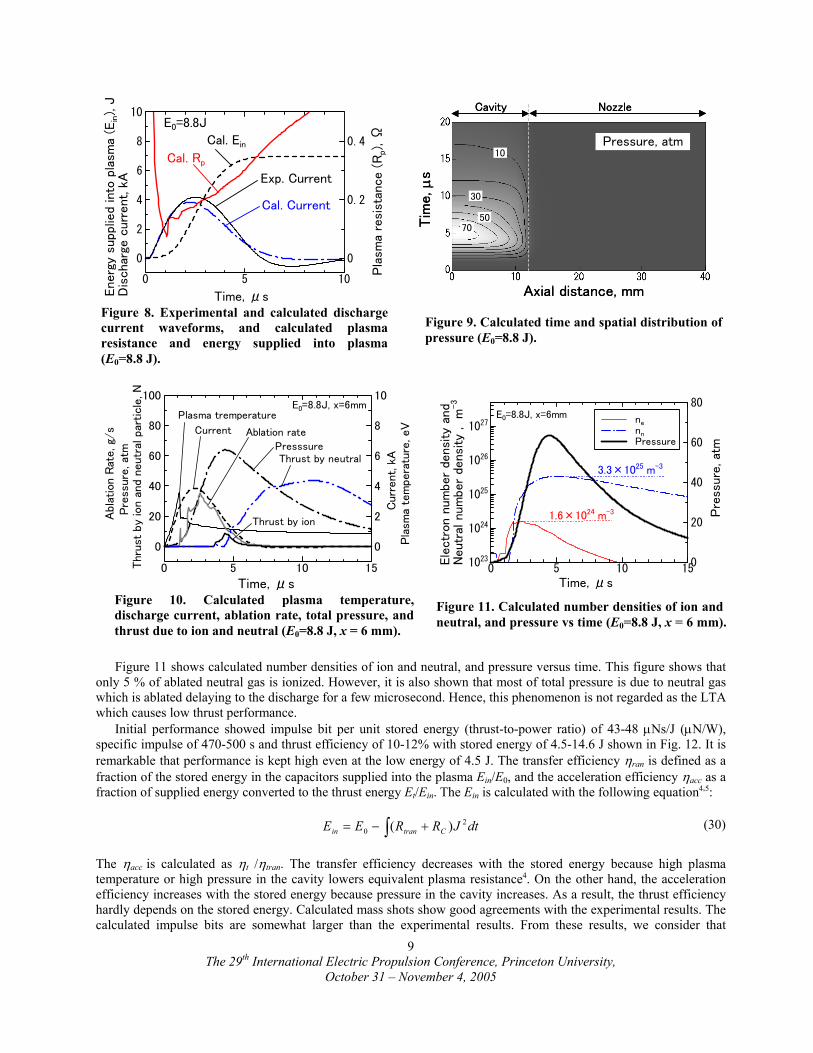
Figure 11. Calculated number densities of ion and neutral, and pressure vs time (E0=8.8 J, x = 6 mm).
Figure 11 shows calculated number densities of ion and neutral, and pressure versus time. This figure shows that only 5 % of ablated neutral gas is ionized. However, it is also shown that most of total pressure is due to neutral gas which is ablated delaying to the discharge for a few microsecond. Hence, this phenomenon is not regarded as the LTA which causes low thrust performance.
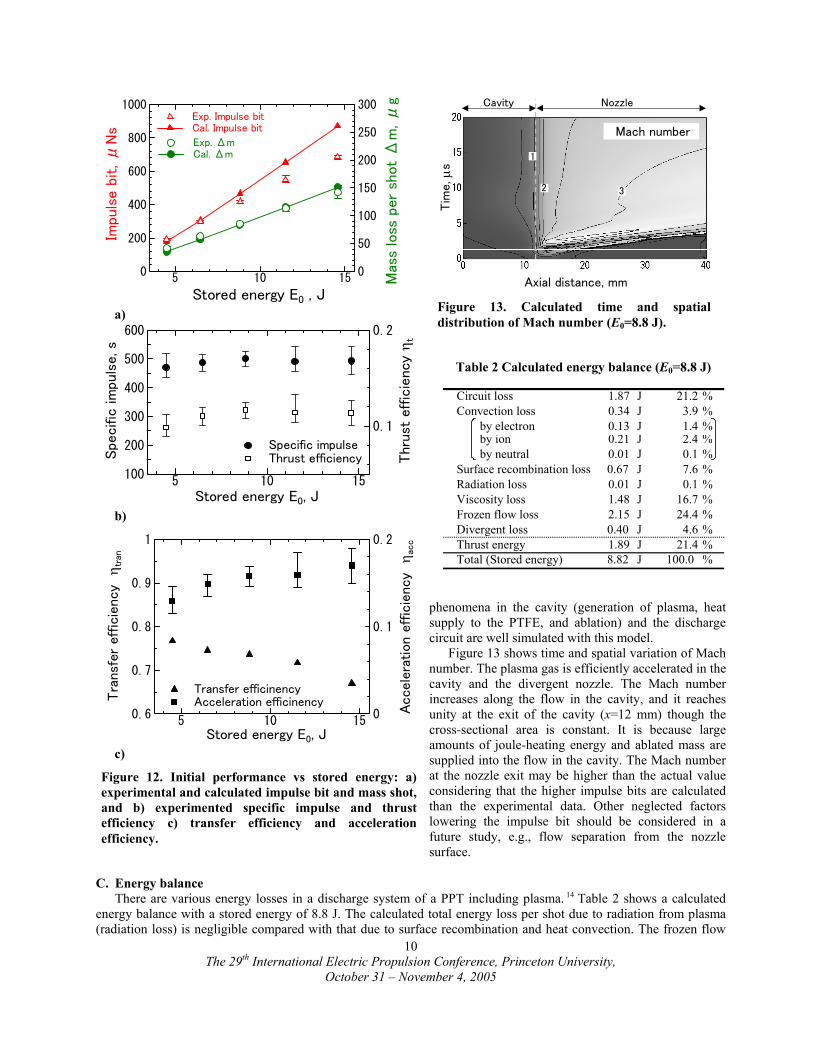
Initial performance showed impulse bit per unit stored energy (thrust-to-power ratio) of 43-48 µNs/J (µN/W), specific impulse of 470-500 s and thrust efficiency of 10-12% with stored energy of 4.5-14.6 J shown in Fig. 12. It is remarkable that performance is kept high even at the low energy of 4.5 J. The transfer efficiency ηran is defined as a fraction of the stored energy in the capacitors supplied into the plasma Ein/E0, and the acceleration efficiency ηacc as a fraction of supplied energy converted to the thrust energy Et/Ein. The Ein is calculated with the following equation4,5:
∫ +−= dtJRREE Ctranin2
0 )( (30)
The ηacc is calculated as ηt /ηtran. The transfer efficiency decreases with the stored energy because high plasma temperature or high pressure in the cavity lowers equivalent plasma resistance4. On the other hand, the acceleration efficiency increases with the stored energy because pressure in the cavity increases. As a result, the thrust efficiency hardly depends on the stored energy. Calculated mass shots show good agreements with the experimental results. The calculated impulse bits are somewhat larger than the experimental results. From these results, we consider that
The 29th International Electric Propulsion Conference, Princeton University,
October 31 – November 4, 2005
9
phenomena in the cavity (generation of plasma, heat supply to the PTFE, and ablation) and the discharge circuit are well simulated with this model.
Figure 13 shows time and spatial variation of Mach number. The plasma gas is efficiently accelerated in the cavity and the divergent nozzle. The Mach number increases along the flow in the cavity, and it reaches unity at the exit of the cavity (x=12 mm) though the cross-sectional area is constant. It is because large amounts of joule-heating energy and ablated mass are supplied into the flow in the cavity. The Mach number at the nozzle exit may be higher than the actual value considering that the higher impulse bits are calculated than the experimental data. Other neglected factors lowering the impulse bit should be considered in a future study, e.g., flow separation from the nozzle surface.
C. Energy balance There are various energy losses in a discharge system of a PPT including plasma. 14 Table 2 shows a calculated
energy balance with a stored energy of 8.8 J. The calculated total energy loss per shot due to radiation from plasma (radiation loss) is negligible compared with that due to surface recombination and heat convection. The frozen flow
Table 2 Calculated energy balance (E0=8.8 J)
Circuit loss 1.87 J 21.2 %Convection loss 0.34 J 3.9 %
by electron 0.13 J 1.4 %by ion 0.21 J 2.4 %by neutral 0.01 J 0.1 %
Surface recombination loss 0.67 J 7.6 %Radiation loss 0.01 J 0.1 %Viscosity loss 1.48 J 16.7 %Frozen flow loss 2.15 J 24.4 %Divergent loss 0.40 J 4.6 %Thrust energy 1.89 J 21.4 %Total (Stored energy) 8.82 J 100.0 %
Stored energy E0 , J
Mas
s lo
ss p
er
shot
Δm
, μ
g
Exp. Δm Cal. Δm
5 10 150
200
400
600
800
1000
0
50
100
150
200
250
300
a)
Specific
im
puls
e, s
Stored energy E0, J
Thru
st e
ffic
iency
η t
Specific impulse Thrust efficiency
5 10 15100
200
300
400
500
600
0.1
0.2
b)
Tra
nsfe
r ef
fici
ency
η t
ran
Stored energy E0, J
Acce
lera
tion
eff
icie
ncy
η a
cc
Transfer efficinency Acceleration efficinency
5 10 150.6
0.7
0.8
0.9
1
0
0.1
0.2
c)
Figure 12. Initial performance vs stored energy: a) experimental and calculated impulse bit and mass shot, and b) experimented specific impulse and thrust efficiency c) transfer efficiency and acceleration efficiency.
Axial distance, mm
Tim
e,
µs
Cavity Nozzle
Figure 13. Calculated time and spatial distribution of Mach number (E0=8.8 J).
Mach number
3 2
1
Impul
se b
it, μ
Ns
Exp. Impulse bit Cal. Impulse bit
The 29th International Electric Propulsion Conference, Princeton University,
October 31 – November 4, 2005
10
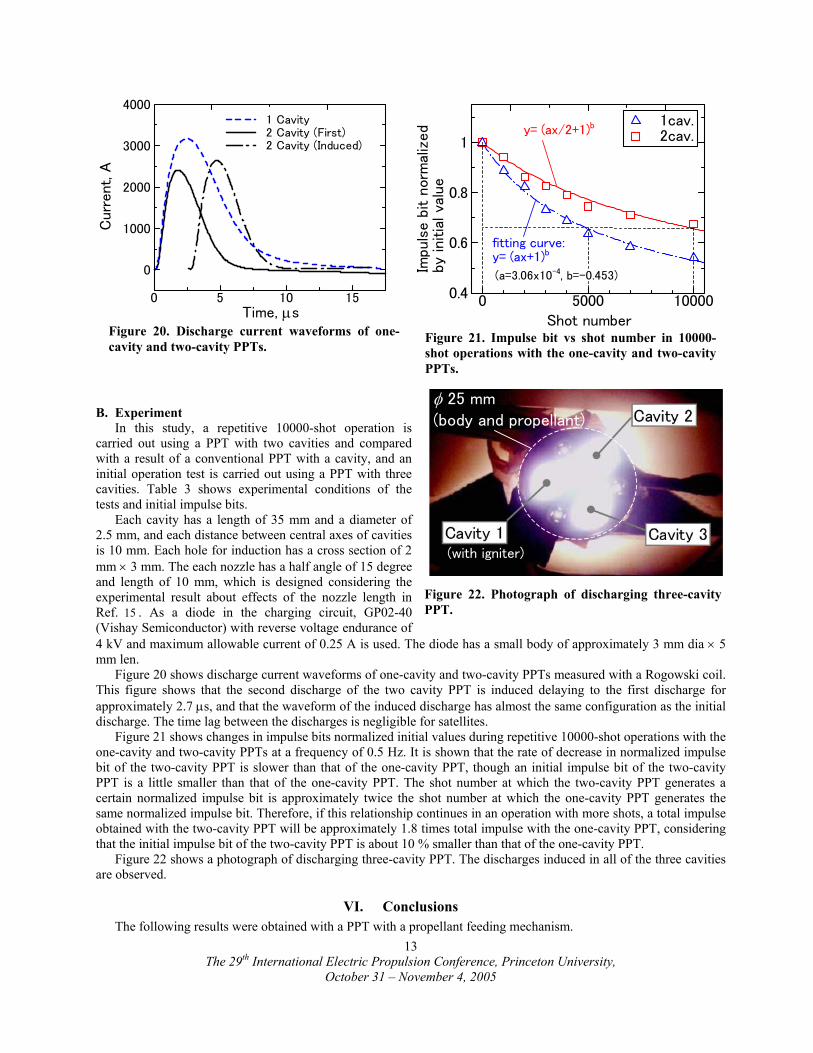
Before After Cavity
Flow direction Gap
Figure 15. Schematics of PTFE bar before/after a 10000-shot operation.
Im
pul
se b
it, μ
Ns
Mas
s lo
ss p
er
shot, μ
gSpe
cific
im
puls
e, s
Thru
st e
ffic
iency
, %
Impulse bit Mass loss per shot Specific impulse Thrust efficiency
0 2000 4000 6000 8000 10000
100
200
300
400
500
600
700
800
0
5
10
15
20
Shot number
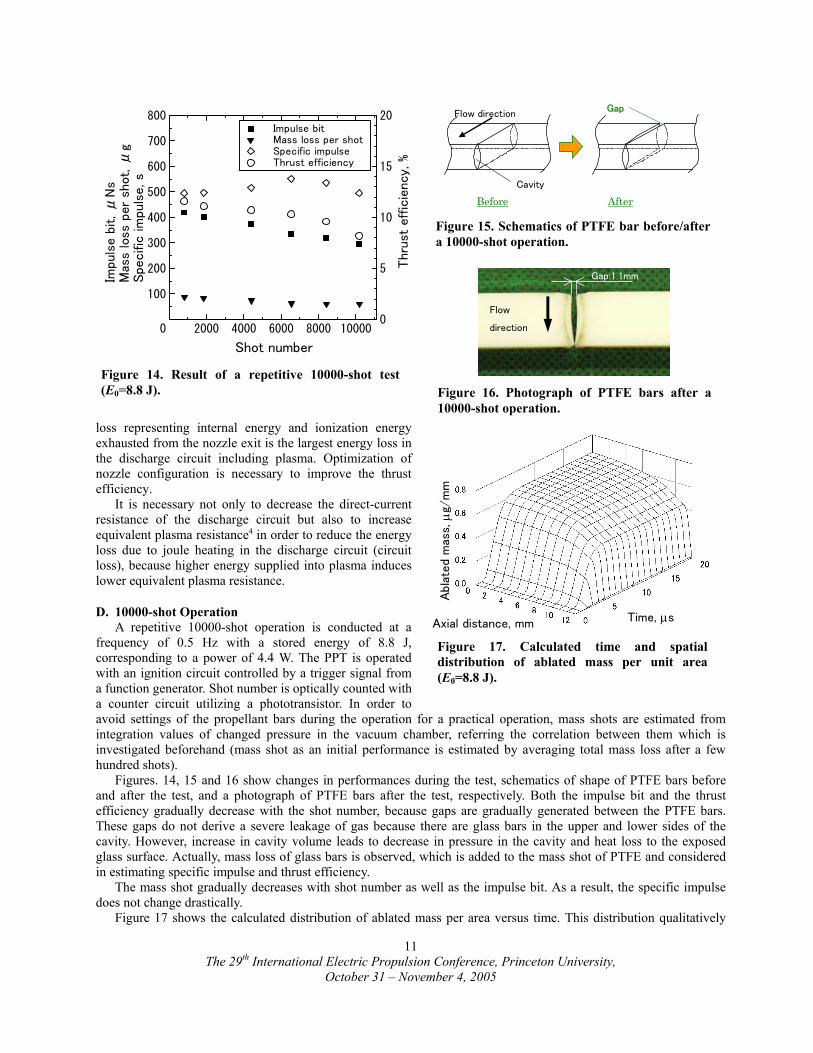
Figure 14. Result of a repetitive 10000-shot test (E0=8.8 J).
loss representing internal energy and ionization energy exhausted from the nozzle exit is the largest energy loss in the discharge circuit including plasma. Optimization of nozzle configuration is necessary to improve the thrust efficiency.
It is necessary not only to decrease the direct-current resistance of the discharge circuit but also to increase equivalent plasma resistance4 in order to reduce the energy loss due to joule heating in the discharge circuit (circuit loss), because higher energy supplied into plasma induces lower equivalent plasma resistance.
D. 10000-shot Operation A repetitive 10000-shot operation is conducted at a
frequency of 0.5 Hz with a stored energy of 8.8 J, corresponding to a power of 4.4 W. The PPT is operated with an ignition circuit controlled by a trigger signal from a function generator. Shot number is optically counted with a counter circuit utilizing a phototransistor. In order to avoid settings of the propellant bars during the operation for a practical operation, mass shots are estimated from integration values of changed pressure in the vacuum chamber, referring the correlation between them which is investigated beforehand (mass shot as an initial performance is estimated by averaging total mass loss after a few hundred shots).
Abla
ted
mas
s, µ
g/m
m
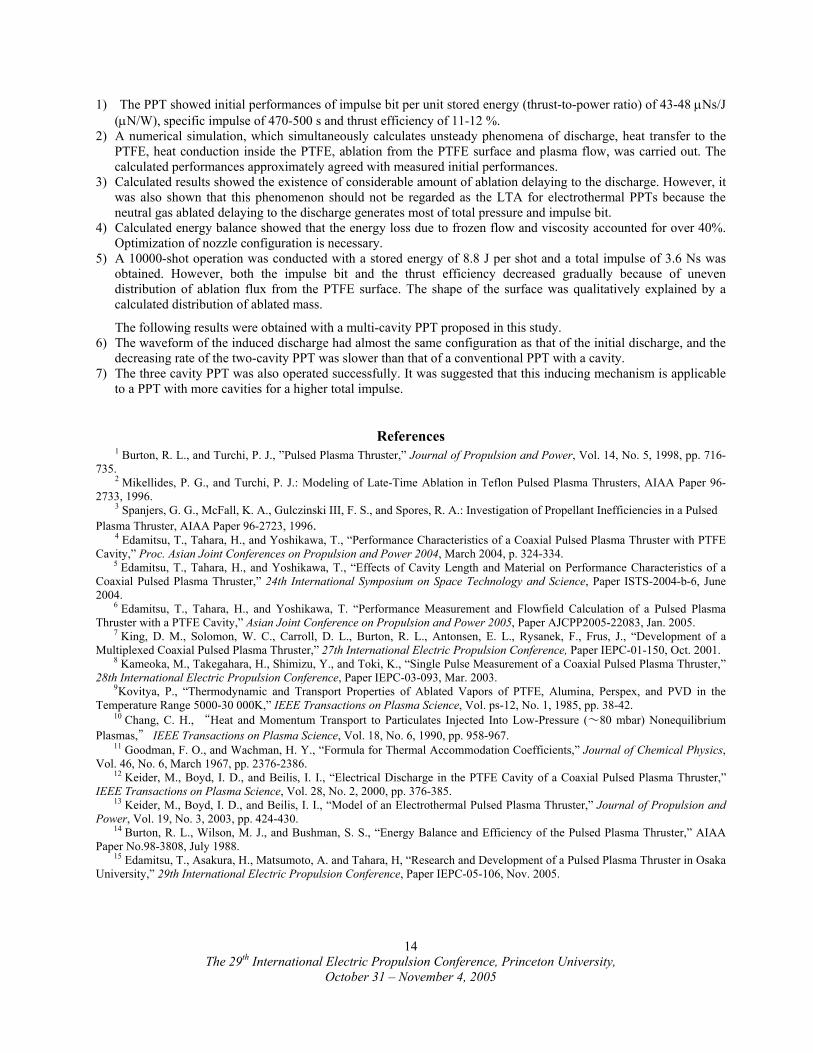
Axial distance, mm Time, µs
Figure 17. Calculated time and spatial distribution of ablated mass per unit area (E0=8.8 J).
Gap:1.1mm
Flow
direction
Figure 16. Photograph of PTFE bars after a 10000-shot operation.
Figures. 14, 15 and 16 show changes in performances during the test, schematics of shape of PTFE bars before and after the test, and a photograph of PTFE bars after the test, respectively. Both the impulse bit and the thrust efficiency gradually decrease with the shot number, because gaps are gradually generated between the PTFE bars. These gaps do not derive a severe leakage of gas because there are glass bars in the upper and lower sides of the cavity. However, increase in cavity volume leads to decrease in pressure in the cavity and heat loss to the exposed glass surface. Actually, mass loss of glass bars is observed, which is added to the mass shot of PTFE and considered in estimating specific impulse and thrust efficiency.
The mass shot gradually decreases with shot number as well as the impulse bit. As a result, the specific impulse does not change drastically.
Figure 17 shows the calculated distribution of ablated mass per area versus time. This distribution qualitatively
The 29th International Electric Propulsion Conference, Princeton University,
October 31 – November 4, 2005
11

agrees with the observed uneven surface which causes the gaps. The reason for this phenomenon is as follows. Plasma density near the cavity exit is smaller than that near the anode, because the velocity of gas is higher near the cavity exit. Then, heat transfer to the PTFE is small near the cavity exit.
In spite of the uneven ablation, the each PTFE bar was supplied in the distance of 2 mm toward the cavity during the 10000-shot operation. Then, a total impulse of approximately 3.6 Ns is obtained.
V. Multi-Cavity Electrothermal PPT
A. Concept of multi-cavity electrothermal PPT We propose a multi-cavity electrothermal PPT in order to lower decreasing rate of impulse bit in a repetitive
operation as a substitute for the propellant feeding mechanism to use a large amount of propellant. The PPT can induce discharges in a number of cavities with an igniter mounted in a nozzle.
Figure 18. Schematic diagram of a multi-cavity electrothermal PPT (a PPT with three cavities as an example).
Figure 18 shows a schematic diagram of a multi-cavity electrothermal PPT (a PPT with three cavities as an example). The PPT has a cathode and an igniter for multiple cavities and anodes. If the first discharge is generated in the cavity with the igniter, a discharge is induced in the next cavity because of a hole connecting the two cavities near the nozzle exit. Diodes as many as the cavities are used in the charging circuit in order to prevent the supply of all stored energy into a cavity. Then, stored energy is evenly divided and supplied into the cavities.
Applying this mechanism to a PPT with a number of cavities, discharges can be induced in all of the cavities. Figure 19 shows a schematic diagram of a multi-cavity PPT with 24 cavities and 4 igniters as an example. In the PPT, any line consisting of 6 cavities can be discharged by selecting the igniter of the line without using any high-voltage switch.
Although impulse bit gradually decreases in a repetitive operation, the decreasing rate of the multi-cavity PPT is expected to be slower than that of a conventional PPT with a cavity, because increasing rate of the cavity diameter of the multi-cavity PPT is slower than the conventional PPT due to the lower discharge energy per cavity and lower mass shot per cavity.
Igniters
Igniters
Holes for inducing discharges
Cathode
Anodes
Nozzles
CavitiesDirection of induction
C/6C/6C/6C/6C/6 C/6 Figure 19 Schematic of a multi-cavity PPT with 24 cavities as an example (without charging circuit).
Table 3 Experimental conditions and initial impulse bits
Number of cavities
Total stored energy
Stored energy per cavity
Initial impulse bit (total of cavities)
1 14.6 J 14.6 J 1229 µNs
2 14.6 J 7.3 J 1098 µNs
3 14.6 J 4.9 J 992 µNs
In practical use, a satellite can know an impulse bit at a shot number, referring the record of impulse bit depending on shot number obtained beforehand in a repetitive operation in a grand test.
The 29th International Electric Propulsion Conference, Princeton University,
October 31 – November 4, 2005
12
Curr
ent, A
Time, µs
1 Cavity 2 Cavity (First) 2 Cavity (Induced)
0 5 10 15
0
1000
2000
3000
4000
Figure 20. Discharge current waveforms of one-cavity and two-cavity PPTs.
Impuls
e b
it n
orm
aliz
ed
by
initia
l va
lue
Shot number
1cav. 2cav.
fitting curve:y= (ax+1)b
(a=3.06x10⁻⁴, b=-0.453)
0 5000 100000.4
0.6
0.8
1
Figure 21. Impulse bit vs shot number in 10000-shot operations with the one-cavity and two-cavity PPTs.
y= (ax/2+1)b
B. Experiment In this study, a repetitive 10000-shot operation is
carried out using a PPT with two cavities and compared with a result of a conventional PPT with a cavity, and an initial operation test is carried out using a PPT with three cavities. Table 3 shows experimental conditions of the tests and initial impulse bits.
Each cavity has a length of 35 mm and a diameter of 2.5 mm, and each distance between central axes of cavities is 10 mm. Each hole for induction has a cross section of 2 mm × 3 mm. The each nozzle has a half angle of 15 degree and length of 10 mm, which is designed considering the experimental result about effects of the nozzle length in Ref. 15 . As a diode in the charging circuit, GP02-40 (Vishay Semiconductor) with reverse voltage endurance of 4 kV and maximum allowable current of 0.25 A is used. The diode has a small body of approximately 3 mm dia × 5 mm len.
φ 25 mm (body and propellant)
(with igniter)
Figure 22. Photograph of discharging three-cavity PPT.
Figure 20 shows discharge current waveforms of one-cavity and two-cavity PPTs measured with a Rogowski coil. This figure shows that the second discharge of the two cavity PPT is induced delaying to the first discharge for approximately 2.7 µs, and that the waveform of the induced discharge has almost the same configuration as the initial discharge. The time lag between the discharges is negligible for satellites.
Figure 21 shows changes in impulse bits normalized initial values during repetitive 10000-shot operations with the one-cavity and two-cavity PPTs at a frequency of 0.5 Hz. It is shown that the rate of decrease in normalized impulse bit of the two-cavity PPT is slower than that of the one-cavity PPT, though an initial impulse bit of the two-cavity PPT is a little smaller than that of the one-cavity PPT. The shot number at which the two-cavity PPT generates a certain normalized impulse bit is approximately twice the shot number at which the one-cavity PPT generates the same normalized impulse bit. Therefore, if this relationship continues in an operation with more shots, a total impulse obtained with the two-cavity PPT will be approximately 1.8 times total impulse with the one-cavity PPT, considering that the initial impulse bit of the two-cavity PPT is about 10 % smaller than that of the one-cavity PPT.
Figure 22 shows a photograph of discharging three-cavity PPT. The discharges induced in all of the three cavities are observed.
VI. Conclusions The following results were obtained with a PPT with a propellant feeding mechanism.
The 29th International Electric Propulsion Conference, Princeton University,
October 31 – November 4, 2005
13
1) The PPT showed initial performances of impulse bit per unit stored energy (thrust-to-power ratio) of 43-48 µNs/J (µN/W), specific impulse of 470-500 s and thrust efficiency of 11-12 %.
2) A numerical simulation, which simultaneously calculates unsteady phenomena of discharge, heat transfer to the PTFE, heat conduction inside the PTFE, ablation from the PTFE surface and plasma flow, was carried out. The calculated performances approximately agreed with measured initial performances.
3) Calculated results showed the existence of considerable amount of ablation delaying to the discharge. However, it was also shown that this phenomenon should not be regarded as the LTA for electrothermal PPTs because the neutral gas ablated delaying to the discharge generates most of total pressure and impulse bit.
4) Calculated energy balance showed that the energy loss due to frozen flow and viscosity accounted for over 40%. Optimization of nozzle configuration is necessary.
5) A 10000-shot operation was conducted with a stored energy of 8.8 J per shot and a total impulse of 3.6 Ns was obtained. However, both the impulse bit and the thrust efficiency decreased gradually because of uneven distribution of ablation flux from the PTFE surface. The shape of the surface was qualitatively explained by a calculated distribution of ablated mass.
The following results were obtained with a multi-cavity PPT proposed in this study. 6) The waveform of the induced discharge had almost the same configuration as that of the initial discharge, and the
decreasing rate of the two-cavity PPT was slower than that of a conventional PPT with a cavity. 7) The three cavity PPT was also operated successfully. It was suggested that this inducing mechanism is applicable
to a PPT with more cavities for a higher total impulse.
References 1 Burton, R. L., and Turchi, P. J., ”Pulsed Plasma Thruster,” Journal of Propulsion and Power, Vol. 14, No. 5, 1998, pp. 716-
735. 2 Mikellides, P. G., and Turchi, P. J.: Modeling of Late-Time Ablation in Teflon Pulsed Plasma Thrusters, AIAA Paper 96-
2733, 1996. 3 Spanjers, G. G., McFall, K. A., Gulczinski III, F. S., and Spores, R. A.: Investigation of Propellant Inefficiencies in a Pulsed
Plasma Thruster, AIAA Paper 96-2723, 1996. 4 Edamitsu, T., Tahara, H., and Yoshikawa, T., “Performance Characteristics of a Coaxial Pulsed Plasma Thruster with PTFE
Cavity,” Proc. Asian Joint Conferences on Propulsion and Power 2004, March 2004, p. 324-334. 5 Edamitsu, T., Tahara, H., and Yoshikawa, T., “Effects of Cavity Length and Material on Performance Characteristics of a
Coaxial Pulsed Plasma Thruster,” 24th International Symposium on Space Technology and Science, Paper ISTS-2004-b-6, June 2004.
6 Edamitsu, T., Tahara, H., and Yoshikawa, T. “Performance Measurement and Flowfield Calculation of a Pulsed Plasma Thruster with a PTFE Cavity,” Asian Joint Conference on Propulsion and Power 2005, Paper AJCPP2005-22083, Jan. 2005.
7 King, D. M., Solomon, W. C., Carroll, D. L., Burton, R. L., Antonsen, E. L., Rysanek, F., Frus, J., “Development of a Multiplexed Coaxial Pulsed Plasma Thruster,” 27th International Electric Propulsion Conference, Paper IEPC-01-150, Oct. 2001.
8 Kameoka, M., Takegahara, H., Shimizu, Y., and Toki, K., “Single Pulse Measurement of a Coaxial Pulsed Plasma Thruster,” 28th International Electric Propulsion Conference, Paper IEPC-03-093, Mar. 2003.
9Kovitya, P., “Thermodynamic and Transport Properties of Ablated Vapors of PTFE, Alumina, Perspex, and PVD in the Temperature Range 5000-30 000K,” IEEE Transactions on Plasma Science, Vol. ps-12, No. 1, 1985, pp. 38-42.
10 Chang, C. H., “Heat and Momentum Transport to Particulates Injected Into Low-Pressure (~80 mbar) Nonequilibrium Plasmas,” IEEE Transactions on Plasma Science, Vol. 18, No. 6, 1990, pp. 958-967.
11 Goodman, F. O., and Wachman, H. Y., “Formula for Thermal Accommodation Coefficients,” Journal of Chemical Physics, Vol. 46, No. 6, March 1967, pp. 2376-2386.
12 Keider, M., Boyd, I. D., and Beilis, I. I., “Electrical Discharge in the PTFE Cavity of a Coaxial Pulsed Plasma Thruster,” IEEE Transactions on Plasma Science, Vol. 28, No. 2, 2000, pp. 376-385.
13 Keider, M., Boyd, I. D., and Beilis, I. I., “Model of an Electrothermal Pulsed Plasma Thruster,” Journal of Propulsion and Power, Vol. 19, No. 3, 2003, pp. 424-430.
14 Burton, R. L., Wilson, M. J., and Bushman, S. S., “Energy Balance and Efficiency of the Pulsed Plasma Thruster,” AIAA Paper No.98-3808, July 1988.
15 Edamitsu, T., Asakura, H., Matsumoto, A. and Tahara, H, “Research and Development of a Pulsed Plasma Thruster in Osaka University,” 29th International Electric Propulsion Conference, Paper IEPC-05-106, Nov. 2005.
The 29th International Electric Propulsion Conference, Princeton University,
October 31 – November 4, 2005
14