performance investigation on plate heat …studentsrepo.um.edu.my/7999/1/performance... ·...
TRANSCRIPT

PERFORMANCE INVESTIGATION
ON PLATE HEAT EXCHANGER
USING NANOFLUID AS WORKING FLUID
LER CHERK YONG
RESEARCH REPORT SUBMITTED
IN PARTIAL FULFILMENT OF THE REQUIREMENTS
FOR THE DEGREE OF MASTER OF ENGINEERING
FACULTY OF ENGINEERING
UNIVERSITY OF MALAYA
KUALA LUMPUR
2011

ii
ABSTRACT
Plate heat exchanger (PHE) is a kind of heat transfer equipment that made up of
a pack of thin corrugated metal plate that promote heat transfer between two fluids.
Water as the most common heat transfer medium has low thermal conductivity that
result in lower overall heat transfer coefficient. With rising interest in fluid with higher
thermal conductivity offered by dispersing nanoparticles in base fluid, called
―nanofluids‖, researchers are investigating the advantages of applying this fluid in
conventional heat transfer devices. In this study the performance of an existing PHE in
oil and gas industry is investigated when the alumina (Al2O3) and silicon dioxide (SiO2)
nanofluids of various particle size and volume fraction was introduce as the hot fluid
medium. In addition, the advantages of utilizing nanofluids as the heat transfer medium
in the PHE design are examined. In this study, it‘s found that the application of Al2O3
with 3% particle volume concentration nanofluids in the existing PHE system resulted
the heat transfer rate increased by 1.29% and correspondingly 2.66% of the volumetric
flow rate can be reduce to achieve the similar rated heat transfer rate. For SiO2
nanofluids, it‘s distinguished that the highest heat transfer rate could be achieved by
1.5% particle volume concentration. In PHE design, the heat transfer area to achieve the
rated PHE heat transfer rate of 460kW was reduce by 3.08% to 3.21% depending on the
desired NTU when using Al2O3 nanofluids of 3% volume fraction. Meanwhile, it‘s
observed that the reduction of heat transfer area is dependent on the nanoparticles size
as the nanofluids with 25nm SiO2 particles require less heat transfer area compare to the
nanofluids with 100nm SiO2 particles.

iii
ABSTRAK
PHE ialah sejenis alat pemidahan haba yang terdiri daripada satu pek plat logam yang
nipis dan beralur untuk meningkatkan kadar pemindahan haba antara dua jenis cecair.
Air adalah jenis medium yang paling popular bagi tujuan pemidahan haba, tetapi ia
hanya mempunyai kekonduksian terma yang rendah. Dengan adanya ―bendalir-nano‖,
sejenis bendalir yang mempunyai kekonduksian terma yang tinggi, penyelidik mula
menyiasat kelebihan menggunakan bendalir-nano sebagai medium pemindahan haba di
alat-alat pemindahan haba yang kini ada. Dalam kajian ini, prestasi PHE yang
digunakan dalam sektor petrolium dan gas akan dikaji apabila bendalir-nano diperbuat
daripada zarah-zarah nano alumina (Al2O3) dan silicon dioksida (SiO2) digunakan
sebagai medium sebelah panas. Tambahan pula, kelebihan daripada menggunakan
bendalir-nano pada masa reka bentuk PHE akan diperiksa. Dalam kajian ini, didapati
bahawa dengan menggunakan 3% kepekatan zarah Al2O3, kadar pemindahan haba dari
PHE yang sedia ada meningkat sebanyak 1.29% atau sepadan dengan menggunakan
2.66% lebih rendah kadar aliran isipadu untuk memindahkan haba yang sedia ada.
Manakala, untuk SiO2 bendalir-nano, ia hanya menujukkan peningkatan maksima pada
1.5% kepekatan zarah. Dalam reka bentuk PHE, keluasan pemindah haba yang
diperlukan untuk memindahkan 460kW haba telah dikurangkan sebanyak 3.08% hingga
3.21% bergantung kepada NTU yang diinginkan apabila bendalir-nano Al2O3
digunakan. Sementara itu, didapati bahawa pengurangan keluasan pemindah haba yang
diperlukan juga bergantung kepada saiz zarah yang digunakan. Sebagai contoh, SiO2
bendalir-nano diperbuat daripada 25 nm saiz zarah memerlukan keluasan yang kurang
jika dibandingkan dengan keluasan yang diperlukan oleh SiO2 bendalir-nano daripada
100 nm saiz zarah.

iv
ACKNOWLEDGEMENTS
I, Ler Cherk Yong would like to take this opportunity to express my gratitude to my
project supervisor, Assoc. Prof. Dr. Saidur Rahman for his precious guidance,
discussion and encouragement throughout the process of this project.

v
TABLE OF CONTENTS
ABSTRACT ii
ACKNOWLEDGEMENTS iv
TABLE OF CONTENTS v
LIST OF TABLE vii
LIST OF FIGURE x
NOMENCLATURE xii
LIST OF APPENDICES xv
1.0 INTRODUCTION 1
1.1 Background 1
1.2 Scope of Study 3
1.3 Objectives 3
2.0 LITERATURE REVIEW 4
2.1 Introduction 4
2.2 Fundamentals of Plate Heat Exchanger (PHE) 4
2.2.1 Types of PHE 4
2.2.2 General Characteristics of PHE 7
2.2.3 Typical Operating Range and Construction of PHE 8
2.2.4 Factors That Influence the Performance of PHE 8
2.3 Single Phase Flow on Chevron Plate 13
2.3.1 Characteristic of Chevron Plate 14
2.3.2 Heat Transfer and Pressure Drop Correlations 16
2.4 Nanofluids 21
2.4.1 Nanofluids Thermophysical Properties Correlations 23
2.4.2 Force Convective Heat Transfer of Nanofluids 28
3.0 RESEARCH METHODOLOGY 30
3.1 Introduction 30
3.2 Research Procedure 30
3.3 Input Data 32
3.4 General Assumptions in Thermal and Hydrodynamic Analysis of PHE 35
3.4.1 General Assumptions in Thermal Analysis of PHE 35
3.4.2 General Assumptions in Pressure Drop Analysis of PHE 36
3.5 Nanofluids Thermophysical Properties Estimation 37
3.5.1 Nanofluids Thermal Conductivity 37

vi
3.5.2 Nanofluids Dynamic Viscosity 38
3.5.3 Nanofluids Density 38
3.5.4 Nanofluids Specific Heat 39
3.5.5 Nanofluids Prandtl Number 39
3.6 Performance Analysis of Existing PHE System Uses Nanofluids as Hot Side
Working Fluid 40
3.6.1 Thermal Analysis 40
3.6.2 Pressure Drop Analysis 44
3.7 Application of Nanofluids in PHE Design 46
3.7.1 Heat Transfer Area Reduction Estimation 46
3.7.2 Pressure Drop Estimation from Desire NTU 48
3.8 Validation of Correlations and Mathematical Formulation 49
4.0 RESULTS AND DISCUSSION 52
4.1 Introduction 52
4.2 Thermophysical Properties of Nanofluids 52
4.2.1 Thermal Conductivity 52
4.2.2 Viscosity 54
4.2.3 Density 55
4.2.4 Specific Heat 56
4.2.5 Prandtl Number 57
4.3 Thermal and Hydrodynamic Performance of Existing PHE System Operating
With Nanofluids as Hot Side Working Fluid 58
4.3.1 Thermal Performance Analysis 58
4.3.2 Hydrodynamic Performance (Pressure Drop) Analysis 69
4.4 Application of Nanofluids at PHE Design Stage 74
4.4.1 Heat Transfer Area Reduction Analysis 74
4.4.2 Pressure Drop Analysis 78
5.0 CONCLUSION 84
BIBLIOGRAPHY 86
APPENDIX A 90
APPENDIX B 96
APPENDIX C 98
APPENDIX D 106
APPENDIX E 111
APPENDIX F 116
APPENDIX G 121

vii
LIST OF TABLE
Table Content Page
2.1 General Operating Range and Typical Geometrical Characteristic
of PHE 8
2.2 Important Geometrical Characteristic of Chevron Plate 15
2.3 Heat Transfer Correlation and Their Validity Range. 19
2.4 Friction Factor Correlations 20
2.5 Correlations for Prediction of Thermal Conductivity 24
2.6 Correlations for Prediction of Viscosity 26
2.7 Correlations for Prediction of Specific Heat 27
2.8 Equations for Prediction of Density 28
3.1 Characteristics of PHE 33
3.2 Operating Condition 34
3.3 Thermophysical Properties of Water at 311.5K 34
3.4 Thermophysical Properties of Nanoparticles at 300K 34
3.5 Thermophysical Properties of Sea Water (4% salinity) at 307K 35
3.6 Comparison of Performance Details 50
B1 Thermophysical Properties for Al2O3 Nanofluids 96
B2 Thermophysical Properties for SiO2 25 nm Nanofluids 96
B3 Thermophysical Properties for SiO2 50 nm Nanofluids 97
B4 Thermophysical Properties for SiO2 100 nm Nanofluids 97
C1 Convection Heat Transfer Coefficient and Heat Capacity Rate at
Cold Side 98
C2 Thermal and Hydrodynamic Performances for Al2O3 Nanofluids 98
C3 Thermal and Hydrodynamic Performances for SiO2 25 nm
Nanofluids 100
C4 Thermal and Hydrodynamic Performances for SiO2 50 nm
Nanofluids 102
C5 Thermal and Hydrodynamic Performances for SiO2 100 nm
Nanofluids 104
D1
Effectiveness, Minimum Heat Capacity Rate, Mass Flow Rate and
Convective Heat Transfer Coefficient for Cold Side Working
Fluid
106
D2 Hot Side Channel Mass Flow Rate, ṁchannel, hot 106
D3 Hot Side Reynolds Number, Renf 107
D4 Hot Side Nusselt Number, Nunf 107
D5 Hot Side Convective Heat Transfer Coefficient, hnf 107
D6 Overall Heat Transfer Coefficient, U 108
D7 Heat Transfer Area Required, Arequired 108
D8 Friction Factor for Hot Side Fluid, ƒ 108
D9 Estimated Port to Port Vertical Length, L 109
D10 Channel Pressure Drop, Δpchannel 109

viii
Table Content Page
D11 Port Pressure Drop, Δpport 109
D12 Pressure Drop Due to Elevation Change, Δpelevation 110
D13 Total Pressure Drop, Δptotal 110
E1
Effectiveness, Minimum Heat Capacity Rate, Mass Flow Rate and
Convective Heat Transfer Coefficient for Cold Side Working
Fluid
111
E2 Hot Side Channel Mass Flow Rate, ṁchannel, hot 111
E3 Hot Side Reynolds Number, Renf 112
E4 Hot Side Nusselt Number, Nunf 112
E5 Hot Side Convective Heat Transfer Coefficient, hnf 112
E6 Overall Heat Transfer Coefficient, U 113
E7 Heat Transfer Area Required, Arequired 113
E8 Friction Factor for Hot Side Fluid, ƒ 113
E9 Estimated Port to Port Vertical Length, L 114
E10 Channel Pressure Drop, Δpchannel 114
E11 Port Pressure Drop, Δpport 114
E12 Pressure Drop Due to Elevation Change, Δpelevation 115
E13 Total Pressure Drop, Δptotal 115
F1
Effectiveness, Minimum Heat Capacity Rate, Mass Flow Rate and
Convective Heat Transfer Coefficient for Cold Side Working
Fluid
116
F2 Hot Side Channel Mass Flow Rate, ṁchannel, hot 116
F3 Hot Side Reynolds Number, Renf 117
F4 Hot Side Nusselt Number, Nunf 117
F5 Hot Side Convective Heat Transfer Coefficient, hnf 117
F6 Overall Heat Transfer Coefficient, U 118
F7 Heat Transfer Area Required, Arequired 118
F8 Friction Factor for Hot Side Fluid, ƒ 118
F9 Estimated Port to Port Vertical Length, L 119
F10 Channel Pressure Drop, Δpchannel 119
F11 Port Pressure Drop, Δpport 119
F12 Pressure Drop Due to Elevation Change, Δpelevation 120
F13 Total Pressure Drop, Δptotal 120
G1
Effectiveness, Minimum Heat Capacity Rate, Mass Flow Rate and
Convective Heat Transfer Coefficient for Cold Side Working
Fluid
121
G2 Hot Side Channel Mass Flow Rate, ṁchannel, hot 121
G3 Hot Side Reynolds Number, Renf 122
G4 Hot Side Nusselt Number, Nunf 122
G5 Hot Side Convective Heat Transfer Coefficient, hnf 122
G6 Overall Heat Transfer Coefficient, U 123

ix
Table Content Page
G7 Heat Transfer Area Required, Arequired 123
G8 Friction Factor for Hot Side Fluid, ƒ 123
G9 Estimated Port to Port Vertical Length, L 124
G10 Channel Pressure Drop, Δpchannel 124
G11 Port Pressure Drop, Δpport 124
G12 Pressure Drop Due to Elevation Change, Δpelevation 125
G13 Total Pressure Drop, Δptotal 125

x
LIST OF FIGURE
Figure Content Page
2.1 Exploded View of Gasketed Plate Heat Exchanger 5
2.2 Effectiveness of 1-1 Pass Counterflow PHE 10
2.3 Effectiveness-NTU Chart for Counterflow Heat Exchanger 11
2.4 Type of 1-1 Pass PHE Arrangement 12
2.5 Correction Factor for 1-1 Pass Arrangement at Heat Capacity Rate
Ratio Equal to 1 and NTU Equal to 1 13
2.6 Types of Thermal Plate 14
2.7 Geometrical Characteristic of Chevron Plate 15
3.1 Research Flow Chart 31
3.2 Schematic Diagram of PHE System 32
3.3 Flow Direction of Working Fluids 33
3.4 Comparison of knf 50
4.1 Thermal Conductivity of Nanofluids at Different Particle Volume
Concentration 53
4.2 Viscosity of Nanofluids at Different Particle Volume
Concentration 55
4.3 Density of Nanofluids at Different Particle Volume Concentration 56
4.4 Specific Heat of Nanofluids at Different Particle Volume
Concentration 57
4.5 Prandtl Number of Nanofluids at Different Particle Volume
Concentration 58
4.6 Mass Flow Rate of Nanofluids with Respect to Particle Volume
Concentration 59
4.7 Reynolds Number for Different Particle Volume Concentration. 60
4.8 Nusselt Number of Nanofluids at Various Particle volume
concentration 60
4.9 Convective Heat Transfer Coefficient of Nanofluids at Different
Particle Volume Concentration. 62
4.10 Overall Heat Transfer Coefficient of Nanofluids at Different
Particle Volume Concentration 64
4.11 Heat Capacity Rate of Nanofluids at Various Particle Volume
Concentration 65
4.12 Maximum Heat Transfer Rate at Various Particle Volume
Concentration 66

xi
Figure Content Page
4.13 NTU of PHE at Different Nanofluids Particle Volume
Concentration 67
4.14 Effectiveness of PHE at Different Nanofluids Particle Volume
Concentration 67
4.15 Actual Heat Transfer Rate of PHE at Various Particle Volume
Concentration. 69
4.16 Friction Coefficient of Nanofluids at Different Particle Volume
Concentration 70
4.17 Channel Pressure Drop at Various Particle Volume Concentration 70
4.18 Port Pressure Drop at Various Particle Volume Concentration 71
4.19 Pressure Drop Due to Elevation Change at Various Particle
Volume Concentration 72
4.20 Total Pressure Drop of PHE at Various Particle Volume
Concentration 72
4.21 Pressure Drop of PHE for Al2O3 Nanofluids 73
4.22 Pumping Power Required at Different Particle Volume
Concentration 74
4.23 Required Heat Transfer Area at NTU = 1 75
4.24 Required Heat Transfer Area at NTU = 2 75
4.25 Required Heat Transfer Area at NTU = 3 76
4.26 Required Heat Transfer Area at NTU = 4 76
4.27 Required Heat Transfer Area at NTU = 5 77
4.28 Heat Transfer Area Reduction Due to 3% Particle Volume
Concentration of Nanofluids 78
4.29 Total Pressure Drop of PHE at NTU = 1 79
4.30 Total Pressure Drop of PHE at NTU = 2 79
4.31 Total Pressure Drop of PHE at NTU = 3 80
4.32 Total Pressure Drop of PHE at NTU = 4 80
4.33 Total Pressure Drop of PHE at NTU = 5 81
4.34 Percentage of Pressure Drop Increase at NTU = 5 81
4.35 Total Pressure Drop for 3% Particle Volume Concentration
Nanofluids 82
4.36 Pressure Drop for Al2O3 Nanofluids at 3% Particle Volume
Concentration 83

xii
NOMENCLATURE
L Port to port vertical length, m
w Effective width of plate, m
b Corrugation depth, m
Ac Channel flow cross sectional area, m2
De Equivalent diameter, m
Dport Port diameter, m
β Chevron angle, degree
ϕ Surface enlargement factor
δ Plate thickness, m
N Number of channel
N Avogadro number, 6.022 x 10²³
mol-1
M Molecular weight of base fluid, kg/mol
k Thermal conductivity, W/mK
kb Boltzmann constant, 1.38066 x 10⁻²³
J/K
T Temperature, K
T0 Temperature at 293K
Re Reynolds number
Pr Prandtl number
Nu Nusselt number
C Heat capacity rate, W/K
CF Correction factor
C* Heat capacity rate ratio
dp Particle diameter, m
df Equivalent diameter for base fluid, m
G Mass velocity, kg/m2s

xiii
g Gravitational accerelation
f Friction factor
um Mean fluid velocity, m/s
U Overall heat transfer coefficient, W/m2K
q Heat transfer rate, W
h Convection heat transfer coefficient, W/m2K
⩒ Volumetric flow rate, m3/s
ṁ Mass flow rate, kg/s
cp Specific heat, J/kgK
μ Dynamic viscosity, Ns/m2
φ Particle volume concentration/ volume fraction
ρ Density, kg/m3
ρf0 Density of base fluid calculated at T0, kg/m3
Vport Mean port velocity, m/s
NTU Number of transfer unit
ԑ Effectiveness
ΔPtotal Total pressure drop, Pa
ΔPchannel Channel pressure drop, Pa
ΔPport Port pressure drop, Pa
ΔPelevation Pressure drop due to elevation change, Pa
Arequired Required heat transfer area
PP Pumping power

xiv
Subscript
nf Nanofluids
f Base fluid
fr Freezing point
p Particle
i Inlet
o Outlet
hot Hot fluid side
cold Cold fluid side
avg Average
wall Wall condition
min Minimum
max Maximum

xv
LIST OF APPENDICES
APPENDIX A
Sample Calculation for Thermal and Hydrodynamic Analysis on Existing PHE
APPENDIX B
Calculated Thermophysical Properties of Nanofluids
APPENDIX C
Thermal and Hydrodynamic Performance of Existing PHE System Operating With
Nanofluids
APPENDIX D
Require Heat Transfer Area at a Given NTU Value and Its Corresponding Pressure
Drop for Al2O3 Nanofluids
APPENDIX E
Require Heat Transfer Area at a Given NTU Value and Its Corresponding Pressure
Drop for SiO2-25nm Nanofluids
APPENDIX F
Require Heat Transfer Area at a Given NTU Value and Its Corresponding Pressure
Drop for SiO2-50nm Nanofluids
APPENDIX G
Require Heat Transfer Area at a Given NTU Value and Its Corresponding Pressure
Drop for SiO2-100nm Nanofluids

1
1.0 INTRODUCTION
1.1 Background
The advancement of technologies and growth of industrial processes as well as
environmental and energy concern have increase the need for heat exchange system that
can transfer the heat more efficiently. Apart from improving the equipment design itself,
augmenting the thermal performance of the working fluids has increasingly attract the
attention of scientists.
The development in heat transfer equipment design has brought to the creation
of plate heat exchanger (PHE). PHE is a kind of heat exchanging device which is
getting popular in industrial due to its compactness and high heat transfer coefficient
together with relatively low hydraulic pressure losses compare to the shell and tube heat
exchanger. Thermal plate corrugation designs that promote turbulence and increase the
heat transfer surface area are the main features that provide PHE the advantages over
traditional shell and tube heat exchanger. Among various corrugation designs, Wang,
Sunden and Manglik (2007) commented that chevron or herringbone type design is the
most successful design offer by most manufacturers. Therefore, it seems to be the
development in the PHE design has almost reached its edge.
With this, working fluids has become an essential element to further improve the
heat transfer performance of heat exchanger. Colloidal mixture of particles in nanometer
size and traditional heat transfer fluid, usually term as nanofluids is gaining popularity
as next generation heat transfer fluid due to its high heat transfer performance.
Researches such as Eastman, Choi, Li, Yu and Thompson (2001), Nguyen, Roy,
Gauthier and Galanis (2007), Vajjha and Das (2009a) and Wang and Mujumdar (2007)
indicated that high thermal conductivity is the essential characteristic of nanofluids and

2
this feature is strongly dependent on particle volume concentration, size, geometry,
material as well as the temperature and type of base fluid. The applications of
nanofluids had been reviewed by Saidur, Leong and Mohammad (2011), although the
numbers of research related to nanofluids application has been growing but these
researches are mostly more towards the nanofluids application in electronics cooling
and domestic cooling while only few are related to the industrial heat exchanging
system.
In industrial heat exchanging system, an ideal heat exchanger must not only be
able to handle a given heat duty, but it must also has energy efficient characteristics and
these features may be done by using more efficient drive system and optimum heat
exchanger design. Theoretically, nanofluids with its high thermal conductivity feature
may help in increasing the heat transfer rate and resulting the reduction of working fluid
flow rate supply to the system at a given heat duty. Consequently, energy can be
conserved from reducing of pumping power required. However, it must be noted that
the increase of thermal conductivity of working fluids itself is not sufficient to rise the
performance of heat exchanger, the viscosity and specific heat of the fluids also play an
important role in determine the thermal performance of heat exchanging system.
Therefore, in current study, the investigation on application of nanofluids as hot
side working fluid in an industrial PHE will be carried out. The thermal and
hydrodynamic performance of this PHE will be analyzed.

3
1.2 Scope of Study
The investigations in this study can be divided into major 2 sections,
1. Application of nanofluids in existing PHE system
2. Application of nanofluids in PHE design
The nanofluids use in this study is water (H2O) base, with nanoparticles volume
concentration ranging from 0% (i.e. fresh water) to 3% at 0.5% step size and it is made
of:
1. Alumina (Al2O3) particles at 45nm diameter
2. Silicon dioxide (SiO2) particles at 25nm, 50nm and 100nm diameter.
In each investigation, the effect of nanofluids as the hot fluid medium in PHE is
thermally and hydro-dynamically analyzed.
1.3 Objectives
The objectives of this study are:
1. To compare the thermal performance of nanofluids and conventional
cooling liquid (i.e. water) in a PHE.
2. To determine the pressure drop in PHE if nanofluids is use as hot side
working fluid.
3. To investigate the effect of nanofluids particle volume concentration, size
and material in heat transfer enhancement.
4. To determine the potential reduction in heat transfer area required and
pressure drop if nanofluids is apply as hot side working fluids in PHE
design.

4
2.0 LITERATURE REVIEW
2.1 Introduction
The literature review for this study can be divided into two main sections. In the first
section, the fundamentals for PHE will be briefly discussed. In this section, types of
PHE and their basic feature, the typical operating range and construction parameters, the
factors that influence the performance, the characteristic of chevron plate and the
common correlations for plate heat exchanger performance analysis will be discuss.
Meanwhile, the second section revealed the literature review related to
nanofluids. This section summarizes the essence of previous researches regarding basics
of nanofluids, the development of nanofluids thermophysical properties evaluation and
nanofluids in force convective heat transfer.
2.2 Fundamentals of Plate Heat Exchanger (PHE)
2.2.1 Types of PHE
The common types of PHE are:
1. Gasketed Plate Heat Exchanger (plate and frame heat exchanger)
2. Brazed Plate Heat Exchanger
3. Semi welded and fully welded Plate Heat Exchanger
Gasketed Plate Heat Exchanger (GPHE) is the traditional plate and frame
heat exchanger. The major components of this PHE are the pack of thermal
plates, gasket, cover plates with ports (act as the supporting end frames with one
fix and another moveable), carrying and guiding bars, and tightening bolts. The

5
thermal plates are made from thin and rectangular pressed metal sheet. The
gaskets are placed in between the thermal plates and cover the plates
peripherally to form the flow channels. The cover ring or edge gaskets prevent
the mixing of fluid between two adjoining channels. The plates and gaskets are
clamp in between the fixed and movable cover plates to a prescribe length with
the use of tightening bolt. In order to have a perfectly aligned pack of plates, this
clamping process is supported by the carrying and guiding bars. Where, the
plates are hanged along the carrying bar and the guiding bar permits only linear
horizontal direction movement. Figure 2.1 shows the typical plate and frame
heat exchanger in exploded view.
Figure 2.1: Exploded View of Gasketed Plate Heat Exchanger
(Gut & Pinto, 2004)
Brazed Plate Heat Exchanger (BPHE) offer advantages over GPHE in the
sense of compactness and it can withstand higher pressure and temperature
operation condition. Similar to the GPHE, BPHE consist of a pack of thermal
plates and end plates. Unlike GPHE, the plates are brazed together by braze
material such as copper and nickel alloy. Therefore, it omits the use of gaskets,
frame and tightening bolts. The lack of gaskets as the streams and channels

6
confining component is the main reason that BPHE is suitable to operate at high
temperature and pressure condition. However, this plate attachment method
eliminate the possibility to being flexible (expandable) and easy cleaning feature
as offer by GPHE.
Semi welded PHE or sometime called twin plate heat exchanger is
similar to GPHE. The only distinctive feature is that two plates are weld together
to form a channel for a fluid stream and the channel for another stream is made
up from the gasketing between two set of twin plates. Usually, this type of PHE
is used when one of the fluid streams is relatively corrosive. This corrosive
media will be directed to flow into the twin plate and the only gasket connection
in this stream is at the porthole. Therefore, the reliability of the system is
maximized. This type of heat exchanger are commonly use in chemical process
plant, petroleum refinery and refrigeration industry.
Fully weld PHE is the gasket free version of plate and frame heat
exchanger. The welded pack of thermal plates is bolted between the cover plates
as in GPHE. The plate pack is attached by laser weld in two spatial dimensions
along the edges in the plane of the plates so that it allows the expansion and
contraction of the plate packs as the pressure and temperature changes. Hence,
the pack has higher fatigue resistant. Besides, due to the elimination of gaskets
in the system, the structural reliability is enhanced and therefore it can operate at
higher temperature and pressure compare to GPHE. The downside of this
exchanger is that it only can be clean chemically and it is not possible to expand
or reduce the heat transfer surface.

7
2.2.2 General Characteristics of PHE
Compare to traditional shell and tube heat exchanger, the PHE offer numerous of
advantages as shown below:
1. High heat transfer coefficient. The thermal plates which have corrugated
surface promote the swirl flow to induce turbulence at low velocity.
Together with the small hydraulic diameter and high effective heat
transfer area, the heat transfer coefficient is significantly higher than
shell and tube heat exchanger at comparable fluid condition.
2. Due to high heat transfer coefficient, the size of the PHE is much smaller
than the shell and tube heat exchanger. Wang et al. (2007) stated that, the
weight of PHE is about 30% lower and the volume of the system is
approximately 20% lesser than shell and tube heat exchanger at same
effective heat transfer area.
3. High heat recovery rate compare to shell and tube heat exchanger. Wang
et al. (2007) commended that with high heat transfer coefficient and
counter flow arrangement. The PHE is able to operate at very close
approach temperature. Therefore, about 90% of heat can be recovered
compare to that 50% from shell and tube heat exchanger.
4. No cross contaminant problem between fluids. This is due to the streams
that are separated by gaskets or by other means and each channel are vent
to atmosphere.
5. Low fouling resistance. This is cause by the high turbulence flow inside
the channels and surface condition of the plates which is relatively
smooth.

8
6. Possible for high viscosity flow. Because turbulent flow can be achieved
at low velocity, the fluid mediums with higher viscosity are applicable in
PHE.
2.2.3 Typical Operating Range and Construction of PHE
The typical operating range and geometrical characteristic of PHE are shown in
Table 2.1.
Table 2.1 General Operating Range and Typical Geometrical Characteristic of
PHE (Wang et al., 2007)
Descriptions
Maximum operating pressure 25 bar
Maximum operating
temperature 160 °C
Maximum flow rate 3600 m3/h
Heat transfer coefficient up to 7500 W/m2K
Heat transfer area 0.1 - 2200 m2
Approach temperature
difference As low as 1 °C
Heat recovery As high as 93%
NTU 0.3 - 6
Pressure drop Up to 100 kPa per channel
length
Number of plates Up to 700
Ports size Up to 435 mm
Plate thickness 0.4 - 1.2 mm
Plate size 0.3 - 3.5 m in length
Plate spacing 1.5 - 5.4 mm
Corrugation depth 1.5 - 5.4 mm
2.2.4 Factors That Influence the Performance of PHE
The performance of PHE is directly influence by several factors such as end
plate effect, number of transfer unit (NTU), fouling effect, and heat capacity rate
ratio as well as passes arrangement.

9
2.2.4 (a) End Plate Effect
Typically, the end plates or the two outer plates surface of the PHE do not have
fluid flow, hence ideally there are no heat transfer on these plate. Therefore, the
outer most channels in the PHE are heated or cold from one side only. This end
plates effect will have significant influence on the overall heat transfer
coefficient; consequently the thermal performance of the PHE will drop. It is
know that, the best heat transfer will occur at a true counterflow arrangement. In
order for the PHE to operate approximately to a true counterflow heat
exchanger, there are only two methods. The first one, which is likely to be
unrealistic, is operating the PHE with a single plate i.e. two channels with one
hot fluid and one cold fluid flowing in opposite direction. Secondly, the PHE
must have sufficiently large number of channels or plates that the end plate
effect can be neglected.
There are several literatures recommended the minimum number of
plates or channels in order for the PHE to be modeled as a true counterflow heat
exchanger. Among them, Zaleski and Klepacka (1992) found that if the number
of channels is more than 24 the effectiveness of PHE approach a true
counterflow heat exchanger. Kandlikar and Shah (1989) concluded that in most
operating range, the end plates effect can be neglected when the thermal plates is
more than 40. Wang et al. (2007) recommended that to achieve inaccuracy of
1% compare to the effectiveness of true counterflow heat exchanger, the PHE
should have at least 39 thermal plates. Figure 2.2 shows the effectiveness of 1-1
pass counterflow PHE with respect to NTU and number of thermal plates.

10
Figure 2.2: Effectiveness of 1-1 Pass Counterflow PHE (Wang et al. 2007)
2.2.4 (b) Number of Transfer Unit (NTU)
NTU is a measure of how near the heat exchanger operates as a true counterflow
heat exchanger. The higher the NTU, the closer the heat exchanger approximates
the effectiveness of true counterflow heat exchanger. The phenomenon is shown
in Figure 2.2. From that figure, the effectiveness of the PHE increases sharply at
low NTU. When the NTU goes higher, the effectiveness approaches an
asymptotic value to 1.
2.2.4 (c) Fouling Effect
Every heat exchanger is subjected to fouling effect. The collection of unwanted
material i.e. dirt, metal dust, etc. on the surface of heat transfer will decrease the
heat transfer rate. However, due to its high turbulence, PHE are less prone to this
particulate fouling. Meanwhile, the consideration on the fouling effect in the
design will result the increase of required heat transfer area. For PHE, the

11
fouling resistance was only 25% of what shell and tube heat exchanger has as
commended by Schlunder (1983). It is also recommended that in PHE design,
less than one fifth of the publish value for shell and tubes heat exchanger should
be use.
2.2.4 (d) Heat Capacity Flow Rate Ratio
Take the effectiveness NTU relation of the true counterflow heat exchanger in
consideration. At a given NTU, the smaller heat capacity rate ratio will give the
higher effectiveness to the heat exchanger. The effectiveness is lowest when the
heat capacity rate ratio is equal to 1. Figure 2.3 shows the relationship between
the effectiveness and heat capacity rate ratio of a counterflow heat exchanger. As
for PHE, the heat capacity rate ratio is usually given in the design and it is a fix
value.
Figure 2.3: Effectiveness-NTU Chart for Counterflow Heat Exchanger
(Shah & Sekulic, 2003)

12
2.2.4 (e) Pass Arrangement
The PHE can be design in such a way that it has different number of passes in
each fluid. Normally, for 1-1 pass (one pass at hot side and one pass at cold side)
the flow arrangement will be in counterflow because it has higher effectiveness
and heat transfer rate than parallel flow system. Therefore, in the design, the
pass arrangement must be carefully selected to yield the highest possible thermal
performance. For ease of comparison, the correction factor is use where
correction factor equal to 1 for true counterflow heat exchanger. The types of
arrangement for 1-1 pass system are shown in Figure 2.4 and the correction
factor with respect to the arrangement is shown in Figure 2.5. With reference to
Figure 2.4, the type of arrangement also depends on the numbers of thermal
plate i.e. odd or even number. From Figure 2.5, at low thermal plates number,
the arrangement with even number of plate posses higher performance. This
phenomenon was also observed by Shah and Kandlikar (1988)
Figure 2.4: Type of 1-1 pass PHE Arrangement (Wang et al., 2007)

13
Figure 2.5: Correction Factor for 1-1 Pass Arrangement at Heat Capacity Rate
Ratio Equal to 1 and NTU Equal to 1 (Wang et al., 2007)
2.3 Single Phase Flow on Chevron Plate
The corrugation pattern on the thermal plates serves two main purposes, that is, induce
turbulence and increase the heat transfer surface area. Generally, there are two types of
corrugation pattern for thermal plate as shown in Figure 2.6. The most common
corrugation pattern use in the industry is in chevron or herringbone type. Since the PHE
in this study uses chevron type corrugation and the heat transfer process is from liquid
to liquid, the literature only focus on the single phase flow on chevron plate.

14
Figure 2.6: Types of Thermal Plate (DHP Engineering)
2.3.1 Characteristic of Chevron Plate
Chevron plate is distinctive from its V-shape corrugation pattern. The most
important parameter for chevron plate is the chevron angle β, this parameter
directly related to the thermal and hydrodynamic performance of PHE. Khan,
Khan, Chyu and Ayub (2010) in their experiment found that at a given Reynolds
number, the Nusselt number increase by 4 to 9 times at various β compare to flat
plate. Plate with low chevron angle will have lower heat transfer coefficient but
flow frictional losses is lower. Conversely, high chevron angle has higher heat
transfer coefficient and correspondingly higher frictional loss. The low and high
chevron angle plates can be stacked symmetrically i.e. low-low and high-high,
or mixing between high and low plate depending on the desire thermal and
hydrodynamic output. Figure 2.7 shows the basic geometrical characteristic of
chevron plate while Table 2.2 listed the description of these important geometric
characteristic.

15
Figure 2.7: Geometrical Characteristic of Chevron Plate (Khan et al., 2010)
Table 2.2: Important Geometrical Characteristic of Chevron Plate
Characteristic Description
Chevron angle, β
Induce turbulence flow. As a basic measurement
for thermal performance of the plate. High β,
greater thermal efficiency. Low β has lower heat
transfer coefficient.
Effective width of plate, w Width of plate inside the boundary of gasket.
Port to port vertical length,
L
Distance between center of top and bottom ports.
Important parameters in pressure drop calculation
Surface enlargement factor,
ϕ
The ratio of actual (developed) heat transfer area
to projected area ( )
Corrugation depth, b Difference between plate pitch and plate thickness
Equivalent diameter, De
Important in Reynolds number, heat transfer
coefficient and channel frictional losses
calculation,
Channel flow cross
sectional area, Ac
Important for Reynold number and channel
frictional losses calculation,

16
2.3.2 Heat Transfer and Pressure Drop Correlations
2.3.2 (a) Heat Transfer Correlation
Generally, empirical correlations for single phase flow heat transfer are in the
form of
The specific value for coefficient C and exponent of m and n vary with the
nature of the surface geometry and type of flow but often independent of the
nature of the fluid. Khan et al. (2010), in their experimental study on commercial
PHE with symmetry (30°/30° & 60°/60°) and mix (30°/60°) chevron plate
configuration found that the Nusselt number was increase as the Reynolds
number and chevron angle increase. Therefore, they proposed a heat transfer
correlation that accounting the effect of various chevron angles. This correlation
is valid on Reynolds number from 500 to 2500, Prandtl number from 3.5 to 6.5,
chevron angle from 30° to 60° and surface enlargement factor of 1.117.
Muley and Manglik (1999) carried out an experiment for single phase
flow in a single pass U-type counterflow PHE using water as heat transfer
medium. In this study, two symmetry chevron plate arrangements namely
(30°/30° & 60°/60°) and mix plates arrangement (30°/60°) was consider. They
observed that compare to flat plate, 2 to 5 times higher Nusselt number can be
obtained from different chevron angle and the increase in surface enlargement
factor also poses similar trend but smaller effect. They also found that at
constant pumping power, the heat transfer can be enhanced by a factor of 2.8
compare to equivalent flat plate depending on Reynolds number, chevron angle
and surface enlargement factor. Base on the experimental data, they came out
17
with a correlation to predict the Nusselt number that is valid for chevron plate
with sinusoidal corrugation, Reynolds number range from 600 to 10000, Prandtl
number of 2 to 6, chevron angle from 30° to 60°, and surface enlargement factor
from 1 to 1.5.
In the same year, Muley, Manglik and Metwally (1999) used similar
experimental set up to study the viscous fluid flow in PHE. They found that the
chevron plate achieved 2.9 times higher heat transfer rate as compare to flat
plate at constant pumping power and required 48% less surface area to achieve a
given heat transfer rate at a predetermined pressure drop limit. Similarly, a
correlation to predict the heat transfer performance was developed and this
correlation is valid for viscous laminar flow at Reynolds number from 2 to 400,
Prandtl number in between 130 and 290, chevron angle from 30° to 60°, surface
enlargement factor of 1.29 and corrugation profile aspect ratio of 0.56.
Among other earlier researches, Okada et al. (1972) in their research,
proposed heat transfer correlations for different symmetric plate arrangement.
These correlations are valid for water at Reynolds number from 700 to 25,000.
Focke, Zachariades and Olivier (1985) constructed several set of correlations for
different chevron angle at different range of Reynold number. Chrisholm and
Wanniarachchi (1992) correlated their experimental data for both symmetric and
mix plate arrangement for chevron angle 30° to 80° at Reynold number in
between 1000 and 40,000. Heavner, Kumar and Wanniarachchi (1993) studied
turbulent flow of water in symmetric and mixed chevron plate arrangement at
chevron angle 23° 45° and 90°, they developed correlations that valid for
Reynolds number in between 400 and 10,000. For summary, all the correlations
mentioned above and their validity ranges are tabulated in Table 2.3.

18
2.3.2 (b) Pressure Drop Correlations
Friction factor is the key parameter in pressure drop calculation. In
hydrodynamic performance analysis, researchers use the experimental data to
find the factor that represent the shear losses within the PHE channels. Muley
and Manglik (1999) found that the increase in chevron angle leads to 13 to 44
times higher friction factor within the flow passages. They proposed a friction
factor correlation that valid in same range as the heat transfer correlation
mentioned above. Similarly, Muley et al. (1999) found that the friction factor is
6.6 times higher than the equivalent flat plate at same flow condition. In their
study a friction factor correlation was constructed for viscous flow in PHE.
The friction factor for both aforementioned studies and other researches
namely (Chrisholm & Wanniarachchi, 1992; Focke et al., 1985; Heavner et al.,
1993) are presented in Table 2.4.

19
Table 2.3: Heat Transfer Correlation and Their Validity Range.
Reference Chevron
angle
Reynolds
number
Prandtl
number
Surface
enlargement
factor
Correlation
(Okada et al., 1972) 30, 45, 60,
75 700 – 25,000 water - (2.2)
(Focke et al., 1985) 30, 45, 60 20 – 50,000 - - (2.3)
(Chrisholm &
Wanniarachchi, 1992) 30 - 80 1000 - 4000 - -
(2.4)
(Heavner et al., 1993) 23, 45, 90 400 – 10,000 - -
(2.5)
(Muley & Manglik,
1999) 30 - 60 600 – 10,000 2 - 6 1 - 1.5
(2.6)
(Muley et al., 1999) 30 - 60 30 - 400 130 -
290 1.29
(2.7)
(Khan et al., 2010) 30 - 60 500 - 2500 3.5 - 6.5 1.117
(2.8)

20
Table 2.4: Friction Factor Correlations
Reference Chevron
angle
Reynolds
number
Prandtl
number
Surface
enlargement
factor
Correlation
(Focke et al., 1985) 30, 45,
60 90 – 50,000 - -
For β = 30°
For β = 45°
For β = 60°
(2.9)
(Chrisholm &
Wanniarachchi, 1992) 30 - 80 1000 - 4000 - -
(2.10)
(Heavner et al., 1993) 23, 45,
90 400 – 10,000 - -
(2.11)
(Muley & Manglik,
1999) 30 - 60 600 – 10,000 2 - 6 1 - 1.5
(2.12)
(Muley et al., 1999) 30 - 60 2 - 300 130 - 290 1.29
(2.13)
21
2.4 Nanofluids
The term ―nanofluids‖ was first introduced by Choi and Eastman (1995) to describe a
colloidal mixture of nanoparticle with size from 1 to 100 nm and a base fluid. These
heat transfer fluids exhibit superior thermal properties compare to the base fluid i.e.
water and ethylene glycol (EG). For example, Eastman et al. (2001) found that the
effective thermal conductivity of copper oxide CuO-EG nanofluids is 40% higher
compare to the base fluid at 0.3% particle volume concentration. This enhancement on
thermal conductivity means there are chances to further improve the heat transfer on
commercial system nowadays. Hence, there is growth in research activities related to
this field.
Literatures indicated that the enhancement in thermal conductivity is strongly
dependent on the nanoparticle size, volume fraction, geometry, material, temperature of
fluid and properties of base fluid. Among them, Nguyen et al. (2007) investigated the
heat transfer behaviour of a water block cooled by alumina (Al2O3) water nanofluids
with two different particles average diameter (36nm and 47nm) and various volume
concentrations (1%, 3.1% and 6.8%). They noticed at a given flow rate, the thermal
conductivity of water block increased by 12%, 18% and 38% for nanofluids with
particle volume concentration of 1%, 3.1% and 6.8% respectively compare to water
block cooled by water. They also found that, for a given Reynolds number and particle
volume concentration, the value of Nusselt number obtained for 36 nm particle
nanofluids is higher than 47 nm particles, hence they commented that nanofluids with
smaller particle size will have greater number of particles in the fluid that lead to the
rise in total contact area that provide a more effective heat exchange between the
particles and the continuous liquid phase. Meanwhile, they also noticed that the
corresponding increase of Nusselt number due to Reynolds number appears generally
less significant than that due to an increase of particle volume concentration. The
22
similar trend on the effect of particle volume fraction and size were observed by Li and
Peterson (2007), Teng, Hung, Teng, Mo and Hsu (2010), Vajjha and Das (2009a) and
Zamzamian, Oskouie, Doosthoseini, Joneidi and Pazouki (2011).
The effect of particle geometry to the thermal conductivity can be shown by
study of Liu, Wang, Zhang, Zhang and Liu (2008). In the study they found that multi
wall carbon nano tube (MWCNT) poses greater thermal enhancement than CuO and
silicon dioxide (SiO2) at same volume fraction. This result can be link to the geometry
(aspect ratio) of the MWCNT which is larger than oxide particle normally assume to be
in spherical shape with aspect ratio equal to 1. Similarly, Wang and Mujumdar (2007)
in their study commended that the particle shape or aspect ratio of the particle is a
significant parameter to affect the thermal performance of nanofluids.
Meanwhile, the effect of temperature to the thermal conductivity of nanofluids is
shown in (Vajjha & Das, 2009a). In the study, they found that for Al2O3 nanofluids, the
thermal conductivity increase as the square of the temperature. Take for example, at 6%
particle volume concentration; a rise of 21% to the thermal conductivity ratio was
observed when the temperature increased from 298K to 363K. Das, Putra, Thiesen and
Roetzel (2003) used temperature oscillating technique to measure the thermal diffusivity
of nanofluids and calculated the thermal conductivity; they found that 2 to 4 fold
increase in thermal conductivity enhancement is obtained from temperature range of
294 K to 324 K. Yu, Xie, Chen and Li (2010) in their investigation on thermal transport
properties of EG base nanofluids containing copper nanoparticles concluded that the
thermal conductivity strongly dependant on the temperature of the fluid and it is due to
the higher degree of Brownian motion when temperature of fluid increase.

23
For the effect of particle material wise, Godson, Raja, Lal and Wongwises
(2010) reviewed that the enhancement of thermal conductivity using metal particles
nanofluids is higher compare to the metal oxide nanofluids, for example, metal oxide
nanofluids with volume concentration at 5% typically has thermal conductivity
enhancement up to 30%, while metal nanofluids with just less than 1.5% volume
concentration can enhance the thermal conductivity up to 40%.
Finally, the effect of base fluid properties can best shown by study of Lee, Choi,
Li and Eastman (1999). In their experiment, thermal conductivity of four types of
nanofluids namely Al2O3-water, Al2O3-EG, CuO-water and CuO-EG are measured by
transient hot wire method, they observed that for nanofluids using the same
nanoparticle, the thermal conductivity ratio of nanofluids for EG based systems are
always higher than that of water based one.
2.4.1 Nanofluids Thermophysical Properties Correlations
2.4.1 (a) Thermal Conductivity
The earliest model to estimate the effective thermal conductivity of solid-liquid
mixture is from (Maxwell, 1904) commented by Vajjha and Das (2009a). This
model assumed particles are in spherical shape and the parameters involve are
only particles volume concentration and thermal conductivity of particles and
base fluid. Hamilton and Crosser (1962) modified Maxwell‘s model to include
the shape factor in the thermal conductivity prediction to account for the effect
of the shape of particles. However, these theoretical equations are not suitable
for the prediction on the thermal conductivity of nanofluids as noted by Hwang
et al. (2006), Jang and Choi (2007) and Vajjha and Das (2009a). Since the
thermal conductivity of nanofluids is related to the parameters mentioned in

24
previous section, numerous new correlations have been constructed
experimentally or theoretically. Among them, Koo and Kleinstreuer (2004) took
account of Brownian motion of particle in the thermal conductivity prediction.
Vajjha and Das (2009a) used larger experimental data to improve Koo and
Kleinstreuer (2004) correlation. Recently, Corcione (2011) constructed a
correlation to predict the thermal conductivity of nanofluids base on large
number of experimental data available in literature. With only 1.86% standard
deviation of error, this correlation can predict nanofluids made from Al2O3,
CuO, titania (TiO2) and other material with base fluid of water or EG. This
correlation is applicable to nanoparticle range from 10 nm to 150 nm diameter,
particle volume fraction from 0.2% to 9% and temperature from 294K to 324K.
As summary, the correlations mentioned above are shown in Table 2.5.
Table 2.5: Correlations for Prediction of Thermal Conductivity
References Correlation Note
(Maxwell, 1904)
(2.14)
(Hamilton &
Crosser, 1962)
(2.15)
(Koo &
Kleinstreuer,
2004)
(2.16)
β is the
curve-fit
relations
obtained in
their
experiment
(Vajjha & Das,
2009a)
(2.17)
β is the
curve-fit
relations
obtained in
their
experiment
(Corcione, 2011)
(2.18)

25
2.4.1 (b) Viscosity
For heat transfer systems that employ fluid flow, viscosity of the working fluid
is as crucial as its thermal conductivity. Fluid viscosity is the main reason for
exists of frictional losses in the flow system and ultimately causing increase of
needed pumping power. For nanofluids, the viscosity also affects the thermal
conductivity in the sense of Brownian motion. At increase of temperature, the
nanofluids viscosity will decrease and causing an increase in the average
velocity of Brownian motion of the nanoparticles. In open literatures, there are
significantly less researches on the nanofluids viscosity compare to its thermal
conductivity. Hence, there are only a few correlations to predict the nanofluids
viscosity.
The widely use theoretical model is from (Brinkman, 1952), this equation
was develop to relate the viscosity to the function of particle volume fraction.
However, Corcione (2011), Hosseini, Mohebbi and Ghader (2011) and Nguyen
et al. (2008) observed that the prediction of viscosity by Brinkman‘s equation
underestimated the actual viscosity of nanofluids.
Namburu, Kulkarni, Misra and Das (2007) found that the viscosity of
CuO-60:40 EG/water nanofluids reduced as the temperature increased and the
viscosity increased as the particle volume fraction increased. Therefore, they
constructed a correlation for nanofluids viscosity that accounted the effect of
temperature and particle volume fraction. Nguyen et al. (2008) found that Al2O3-
water nanofluids viscosity calculated by Brinkman‘s equation underestimate
their experimental data, except for nanofluids with particle volume concentration
less than 1%. Furthermore, they observed that the viscosity of nanofluids
depends strongly on both temperature and volume concentration; while effect of
26
particle size only significant at high volume concentration. In this study, they
proposed two set of correlations, the first one is due to particle size while the
second one is temperature dependent. However, these correlations are only
applicable only to Al2O3-water nanofluids.
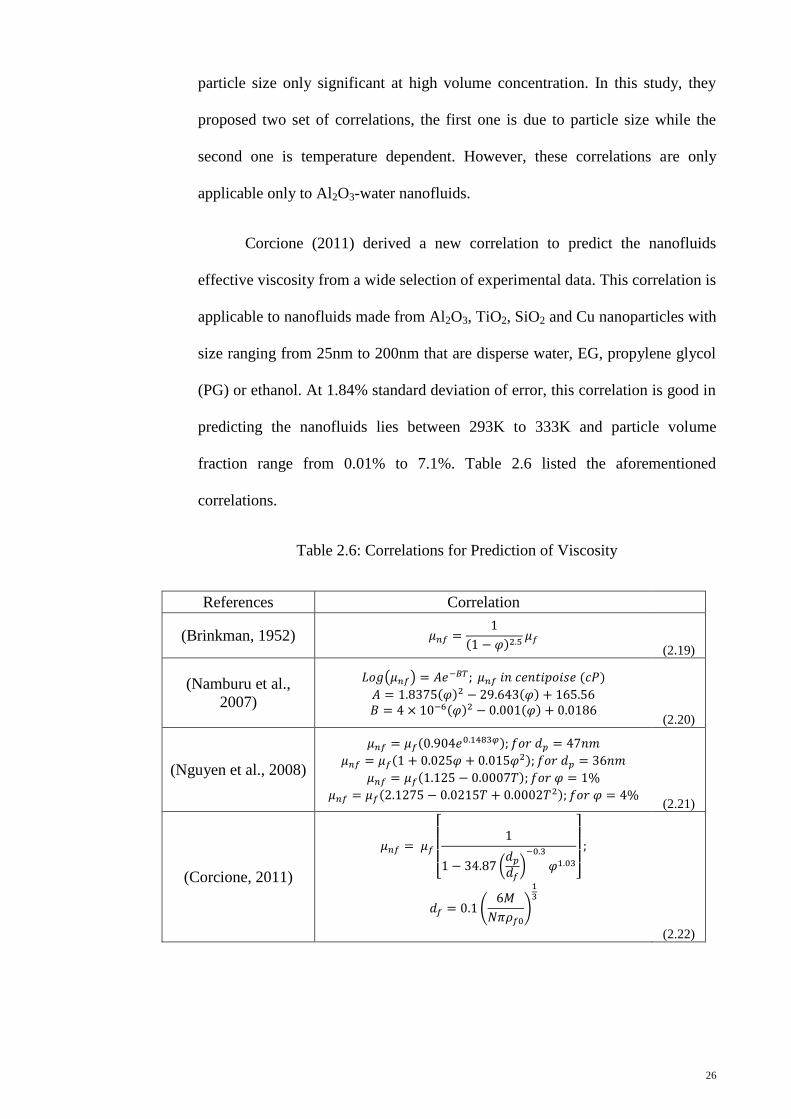
Corcione (2011) derived a new correlation to predict the nanofluids
effective viscosity from a wide selection of experimental data. This correlation is
applicable to nanofluids made from Al2O3, TiO2, SiO2 and Cu nanoparticles with
size ranging from 25nm to 200nm that are disperse water, EG, propylene glycol
(PG) or ethanol. At 1.84% standard deviation of error, this correlation is good in
predicting the nanofluids lies between 293K to 333K and particle volume
fraction range from 0.01% to 7.1%. Table 2.6 listed the aforementioned
correlations.
Table 2.6: Correlations for Prediction of Viscosity
References Correlation
(Brinkman, 1952)
(2.19)
(Namburu et al.,
2007)
(2.20)
(Nguyen et al., 2008)
(2.21)
(Corcione, 2011)
(2.22)

27
2.4.1 (c) Specific Heat
Dispersing nanoparticle in the base fluid may enhance the thermal conductivity
of the fluid but the thermal enhancement might be offset by the increased of
viscosity and specific heat of nanofluids. Therefore, specific heat of nanofluids
plays an important role in thermal enhancement. However, the investigation on
nanofluids specific heat seems to be not as attractive as thermal conductivity of
nanofluids. In open literatures, the first theoretical equation to predict nanofluids
specific heat is the one used by Pak and Cho (1998), this equation calculate the
specific heat of nanofluids by considering only the particle volume
concentration. Later on, Xuan and Roetzel (2000) modified this equation to
involve the density of nanofluids with assumption that thermal equilibrium can
be achieve in between the solid particle and base fluid. This equation was widely
use by researchers in estimating the specific heat of nanofluids. Vajjha and Das
(2009b) experimentally investigate the specific heat of Al2O3, SiO2 and ZnO
nanofluids and found that equation proposed by Pak and Cho (1998)
overestimated the actual specific heat of nanofluids while equation by Xuan and
Roetzel (2000) underestimated them. Hence, they proposed a correlation to
predict specific heat of all three above-mentioned nanofluids. Table 2.7 listed the
correlations for predicting specific heat of nanofluids.
Table 2.7: Correlations for Prediction of Specific Heat
Reference Correlation Note
(Pak & Cho, 1998) (2.23) (Xuan & Roetzel,
2000)
(2.24)
(Vajjha & Das,
2009b)
(2.25)
A,B and C are curve
fit coefficient
obtained from their
experiment

28
2.4.1 (d) Density
The broadly use equation in calculating density of nanofluids is from (Pak &
Cho, 1998), this equation accounting only the effect of particle volume
concentration to the density. Vajjha, Das and Mahagaonkar (2009) found that
density calculated by this equation provide very good agreement to their
experimental results for Al2O3 and antimony-tin oxide (Sb2O5:SnO2) nanofluids,
while for ZnO nanofluids the calculated result has an absolute average deviation
of 3.29% compare to measured data. Hence, for ZnO nanofluids, they introduced
a correction factor that must be subtracted from density calculated by Pak and
Cho (1998) equation.
Table 2.8: Equations for Prediction of Density
Reference Correlation
(Pak & Cho, 1998) (2.26)
(Vajjha, et al., 2009)
(2.27)
2.4.2 Force Convective Heat Transfer of Nanofluids
Due to its high thermal conductivity, nanofluids show its potential as working
fluid in heat transfer devices. There are a lot of researches been carried out to
investigate the usefulness of nanofluids as heat transfer fluids and the potential
applications of nanofluids has been summarized by Saidur et al. (2011).
Force convective heat transfer systems involve the heat transfer fluid
flow by pump, application of nanofluids might increase the heat transfer rate and
consequently decrease the volumetric flow rate supply by pump to achieve the

29
required heat transfer rate. Conversely, the increase in viscosity of nanofluids
may also cause increase of frictional losses that lead the higher pressure drop
within the system. Therefore in energy conservation point of view, the aim of
using nanofluids to replace conventional heat transfer fluid is to maintain the
same amount of existing heat transfer rate by using less fluid and at the same
time reduce or maintain the same amount of pumping power.
Contrary to this, Pantzali, Mouza and Paras (2009) in their experimental
study on nanofluids as working fluid in welded plate heat exchanger found that
for a given Reynolds number, the nanofluids helps to increase the heat transfer
rate but at the same time the flow rate is higher compare to that of water. Detail
investigation revealed that for a given heat duty, there are no difference between
the volumetric flow rate of water and nanofluids. However, the required
pumping power of nanofluids is twice for the water.
Other than that, nanofluids may also helps in reduction of heat transfer
area by increasing the heat transfer rate. Leong, Saidur, Kazi and Mamun (2010)
found that by applying nanofluids as the coolant of car radiator, the heat transfer
was enhanced by 3.8%. This helps in reduction of air frontal area of about
18.7%.

30
3.0 RESEARCH METHODOLOGY
3.1 Introduction
In this chapter, the procedure to carry out the research will be briefly explained. At the
same time, the basic information of the PHE in this study such as the geometrical
characteristics, operating and rated condition is stated. Furthermore, the general
assumptions or idealizations involved in the thermal and hydrodynamic performance
analysis are also listed.
Then, the mathematical formulation to estimate the thermal and hydrodynamic
performance of PHE are shown and explained systematically. In addition, the important
correlations and equations chosen in the study such as correlation to estimate the
thermophysical properties of nanofluids, Nusselt number and friction factor are briefly
explained.
Thereafter, to validate the consistency of correlation used in the estimation of
nanofluids thermal conductivity, the calculated results are compared with the values
estimated by presently discovered experimental correlation. Similarly, to identify
whether the formulated mathematical steps are appropriate and reliable, they are
validated by comparing the calculated results with the actual rated condition given by
PHE manufacturer.
3.2 Research Procedure
To make this study successful, the foremost step is to determine the objectives for the
study. After that, literature review is carried out to observe the current trend of research
and to obtain the needed information such as experimental correlations, input data etc.

31
Then, calculation steps is constructed to obtain the require results corresponding to the
specify objective. At the same time, the mathematical formulation is validated by
comparing the result with rated value. After the mathematical model is validated, the
calculated results are analyzed. Finally, the research ended with the conclusions made
with respect to the analyzed results and findings. In brief, the research procedure is
illustrated in flow chat as shown in Figure 3.1.
Figure 3.1: Research Flow Chart
Conclusion
Analysis & Discussion
Results
Validation
Results
Mathematical Formulation
Literature Review & Input Data
Research Objectives
NO
YES

32
3.3 Input Data
In this study, the selected PHE is a gasketed PHE from DHP Engineering Co. Ltd. It is
used as centralize cooling system in oil and gas industries to cool the appliances in
offshore platform. Schematic diagram for the system is shown in Figure 3.2 and the
direction of flow for hot and cold side is schematically shown in Figure 3.3. In this PHE
system, fresh water is use as the medium to carry heat from the appliances and the
cooling fluid is sea water with 4% salinity. The thermal plates of this PHE are made of
titanium with chevron (herringbone) type corrugation. The geometrical characteristics
and the operating conditions of this PHE are listed in Table 3.1 and Table 3.2
respectively.
In the calculations, required properties of water and nanoparticles are obtained
from (Incropera & DeWitt, 2002) and are listed in Table 3.3 and Table 3.4 respectively.
Meanwhile, the properties of sea water shown in Table 3.5 are acquired from
(Sharqawy, Lienhard, & Zubair, 2010). For the hot and cold working fluid, interpolation
is made to obtain the values corresponding to the average of inlet and outlet
temperature. While, the particles properties are taken at 300K.
Figure 3.2 Schematic Diagram of PHE System (DHP Engineering)

33
Figure 3.3: Flow Direction of Working Fluids (DHP Engineering)
Table 3.1: Characteristics of PHE (DHP Engineering)
Description
Thermal plate material Titanium
Number of plates Nplate 51
Number of channels N 25
Number of passes Npass 1-1
Plate thermal conductivty kplate 21.9 W/mK
Plate thickness δplate 0.0005 m
Surface enlargement factor ϕ 1.1530
Effictive plate area Aplate 0.39 m2
Total effective plate area Atotal 19.11 m2
Corrugation depth b 0.0030 m
Effective diameter De 0.0060 m
Effective width of plate w 0.4088 m
Channel flow cross section area Ac 0.00123 m2
Chevron angle β 60 degree
Port to port Length L 0.9360 m

34
Table 3.2: Operating Condition (DHP Engineering)
Description Hot Side Cold Side
Heat transfer medium
Fresh water Sea Water 4%
salinity
Inlet temperature Ti 314 K 305 K
Outlet temperature To 309 K 309 K
Mean temperature Tavg 311.5 K 307 K
Mass flow rate ṁtotal 22.22 kg/s 28.34 kg/s
Total pressure drop Δptotal 34,548 Pa 53,701 Pa
Heat transfer rate q 460 kW
Overall heat transfer coefficient U 5475 W/m2K
Table 3.3: Thermophysical Properties of Water at 311.5K (Incropera & DeWitt, 2002)
Properties
Specific Heat cp 4178.30 J/kgK
Dynamic Viscosity μ 0.0006758 Ns/m2
Density ρ 992.46 kg/m3
Thermal Conductivity k 0.6298 W/mK
Prandlt Number Pr 4.482
Table 3.4: Thermophysical Properties of Nanoparticles at 300K
(Incropera & DeWitt, 2002)
Particles Properties Al2O3 SiO2
Thermal Conductivity k 36 W/mK 1.38 W/mK
Density ρ 3970 kg/m3 2220 kg/m
3
Specific Heat cp 765 J/kgK 745 J/kgK

35
Table 3.5: Thermophysical Properties of Sea Water (4% salinity) at 307K
(Sharqawy et al., 2010)
Properties
Specific Heat cp 3980.32 J/kgK
Dynamic Viscosity μ 0.0008090 Ns/m2
Density ρ 1024.32 kg/m3
Thermal Conductivity k 0.6202 W/mK
Prandlt Number Pr 5.194
3.4 General Assumptions in Thermal and Hydrodynamic Analysis of PHE
3.4.1 General Assumptions in Thermal Analysis of PHE
In order to analyze the thermal performance of PHE which use nanofluids as the
hot fluid medium, some conditions within the system are idealized. The
idealizations/ assumptions made to simplify the thermal analysis in this study
are:
1. The heat exchanger operates under steady state condition. Where, the
fluids flow rates and temperature within the heat exchanger and at the inlet
are independent of time.
2. There are negligible heat losses to the surrounding i.e. adiabatic walls at
outside of the exchanger. Kandlikar and Shah (1989) quoted that this
idealization is reasonable since there is an air gap between the end plate
and cover plate of the heat exchanger.
3. The individual and overall heat transfer coefficient is constant and uniform
throughout the heat exchanger.
4. The flow inside the channel is thermally fully developed.

36
5. The velocity of the fluid is assumed to be constant across the cross section
of the channel perpendicular to the axis of flow.
6. There are no misdistributions of fluid flow for every channel. Therefore,
the fluid flow is uniformly distributed to every channel on each side and
the fluid is perfectly mixed across the flow channels.
7. The heat transfer is assumed to be one dimensional only between the
channels and there is no heat exchange in the direction of the fluid flow
either by the fluid itself or by the channel wall.
8. The specific heat of fluid at each side is constant throughout the heat
exchanger. Hence, the heat capacity rate and number of transfer unit is
treated as constant throughout the heat exchanger.
3.4.2 General Assumptions in Pressure Drop Analysis of PHE
1. The fluid flow is hydro dynamically fully develop
2. The fluid flow is uniformly distributed to each flow channel. Therefore,
every channel has the equal mass flow rate.
3. The fluid flow is steady and isothermal; hence the fluid properties are
independent of time.
4. The friction factor along the flow length is assumed to be constant and
equal for every channel.
5. The flow inside the heat exchanger is assumed to be single phase flow.
Therefore, the pressure drop due to the flow acceleration is considered
negligible.

37
3.5 Nanofluids Thermophysical Properties Estimation
3.5.1 Nanofluids Thermal Conductivity
The calculation for effective thermal conductivity (knf) of the nanofluids is base
on correlation given by Corcione (2011).
Where Re is the nanoparticles Reynolds number calculated by
In which, ρf , μf, kf, Pr and Tfr is the density, dynamic viscosity, thermal
conductivity, Prandtl number and freezing point of the base fluid respectively. T
is the nanofluids temperature; kp is the thermal conductivity of nanoparticles; φ
is the nanoparticles volume fraction; dp is the nanoparticles diameter and kb is the
Boltmann‘s constant. This equation is constructed base on the assumption that
the nanoparticles are well disperse into the base fluid and the nanoparticles
Brownian velocity is calculated base on the ratio between the particle diameter
and the time required for a particle to move by a distance equal to its diameter
according to (Keblinski, Phillpot, Choi, & Eastman, 2002).
38
3.5.2 Nanofluids Dynamic Viscosity
Similar to thermal conductivity, the effective dynamic viscosity of nanofluids is
estimated base on the correlation given in (Corcione, 2011).
Where df is the equivalent diameter of base fluid molecule estimated by
For the equation above, N is the Avogadro number, ρf0 is the density of base
fluid at temperature T0 = 293 K and M is the molecular weight of base fluid.
3.5.3 Nanofluids Density
The nanofluids density ρnf is calculated base on equation obtained from (Pak &
Cho, 1998)
Where ρp is the nanoparticle density.
Base on Vajjha et al. (2009), the result of density calculated by this equation
presented good agreement with their experimental value and its use in (Vajjha,
Das, & Kulkarni, 2010). The same equation was also used by Tsai and Chein
(2007), Leong et al. (2010) and Lotfi, Saboohi and Rashidi (2010), in their
prediction of nanofluids density.

39
3.5.4 Nanofluids Specific Heat
In this study, correlation proposed by Xuan and Roetzel (2000) was adopted
since it was widely use by researchers to calculate the specific heat.
Where cp,p and cp,f is the specific heat of nanoparticle and base fluid
respectively.
This correlation was use by Tsai and Chein (2007), Duangthongsuk and
Wongwises (2008), Vajjha et al. (2010) and Leong et al. (2010).
3.5.5 Nanofluids Prandtl Number
The nanofluids Prandtl number was calculated using equation as below
It should be noted that, all the base fluid properties is taken with respect to the
average value of inlet and outlet temperature of the hot fluid side.

40
3.6 Performance Analysis of Existing PHE System Uses Nanofluids as Hot Side
Working Fluid
In this section, the operating condition of the PHE is maintained and the only thing
changing is the hot fluid medium. The hot fluid was changed from fresh water to
nanofluids with different particle volume concentration up to 3%.
The thermal and hydrodynamic performances of the PHE are estimated and
analyzed base on nanoparticle material, sizes and volume concentration.
3.6.1 Thermal Analysis
3.6.1 (a) Heat Transfer Coefficient of Both Fluid Sides
Since the PHE is operating at its existing conditions. The volumetric flow rate
supply to the PHE is assumed to be constant. Therefore, the existing volumetric
flow rate can be calculated from the given total mass flow rate of water at hot
fluid side base on Equation 3.9,
⩒
Base on the constant volumetric flow rate, the total mass flow rate of nanofluid
at each nanoparticles volume fraction supplied to the heat exchanger can be
estimated by,
⩒
Then Reynolds number at each channel can be calculated base on equation

41
Given that
And
Substitute Equation 3.12 into Equation 3.11 it becomes
Where De is the equivalent diameter of the channel, N is the number of channels,
Ac is the cross sectional area of channel.
The selected correlation to calculate the Nusselt number in this study is
from (Muley & Manglik, 1999) since it is able to represent much of the available
literature data very well as commended by Wang et al. (2007) and the geometry
of the PHE in this study is within the valid range of the equation.
In the equation above, β represent the plate chevron angle, ϕ is the surface
enlargement factor, Pr and μ is the Prandtl number and dynamic viscosity of the
fluid and μwall is the viscosity of the fluid measure at mean wall temperature.

42
With the availability of the Nusselt number the heat transfer coefficient is then
calculated by equation as below.
3.6.1 (b) Overall Heat Transfer Coefficient
Assuming that the fouling resistance for PHE is negligible (cause by the high
degree of turbulence flow in PHE, smooth plate surface and corrosion resistance
material use). The overall heat transfer coefficient is estimated by
3.6.1 (c) Heat Capacity Rate and Heat Capacity Rate Ratio
Heat capacity rate of hot and cold side is calculated by equations as below
Heat capacity rate ratio is calculated by
Cmin is the smaller value of Chot or Ccold, while the Cmax is the larger value of
them.

43
3.6.1 (d) Number of Transfer Unit (NTU)
The NTU of the PHE is estimated by
Where Atotal is the total effective heat transfer area
Aplate is the effective heat transfer area of a thermal plate and Nplate is the total
number of thermal plates.
3.6.1 (e) Effectiveness of PHE
Since the total number of channels in the current PHE is 25 on each side and the
total number of thermal plates is 51. It has greater value compare to the
minimum number of channels specified by Zaleski and Klepacka (1992) and
minimum number of thermal plates recommended by Kandlikar and Shah
(1989).
Therefore, the end plate effect of the current PHE is considered
negligible and the PHE can be modeled as a true counterflow heat exchanger.
The effectiveness of the PHE is then estimated by the ԑ-NTU relation for
counterflow heat exchanger from (Kays & London, 1984).

44
3.6.1 (f) Maximum Heat Transfer Rate
From (Incropera & DeWitt, 2002) the maximum heat transfer rate can be
achieved when one of the fluids experiences the maximum possible temperature
difference. Hence, a general expression as below was made
3.6.1 (g) Actual Heat Transfer Rate of PHE
The actual heat transfer rate of the PHE is computed from equation below
3.6.2 Pressure Drop Analysis
The total pressure drop of PHE consists of;
1. Pressure drop within the flow channel due to frictional losses,
2. Pressure drop associate with the inlet and outlet manifolds and ports
3. Pressure drop due to elevation change of the flow.
The total pressure drop of the system can be calculated by the equation as below.

45
3.6.2 (a) Channels Pressure Drop
The frictional pressure drop is estimated from equation stated in (White, 1999)
Where, L is the vertical distance between 2 ports center, G is the mass velocity
and ƒ is the friction factor calculated by correlation recommended by Muley and
Manglik (1999).
3.6.2 (b) Ports and Manifolds Pressure Drop
Base on (Kays, 1950; Kays & London, 1984; Shah & Focke, 1988); Muley and
Manglik (1999) used equation below to estimate the port losses in his study.
Where Vport = mean port velocity. With Equation 3.12 and 3.13, the port
pressure drop become
Where Dport is the internal diameter of port

46
3.6.2 (c) Pressure Drop due to Elevation Change
Elevation pressure drop can be calculated by
Here, the positive value of the pressure drop is use when the flow in the channel
is vertical up flow and negative value is taken when the flow is vertically
downward. In this study, since the direction of flow is downward. Therefore, the
negative value of elevation pressure drop is taken.
3.7 Application of Nanofluids in PHE Design
3.7.1 Heat Transfer Area Reduction Estimation
Here, the heat transfer area require in achieving the given heat transfer rate
(460kW) at desired NTU value and corresponding pressure drop are calculated.
The effects from the nanoparticle material, sizes and volume concentration are
also examined.
Apart from the general assumptions for thermal analysis shown in previous
section, the area reduction calculation is based on assumptions as below;
1. The PHE design is base on equal heat capacity for both side i.e.
2. The flow rate at cold side is fixed at the value given. While the flow rate at
hot side is adjusted to match the heat capacity rate of cold side when the
nanoparticles volume concentration is increase.
3. The effectiveness of the PHE is estimated base on ԑ-NTU relation for a
true counterflow heat exchanger.

47
4. The PHE design is base on the heat transfer rate required by the existing
PHE and desire value of NTU from 1 to 5.
5. The working temperature of the PHE is maintained and therefore the
thermophysical properties of the nanofluids from previous section can be
applied.
6. The general geometry of the PHE is similar to the existing one except the
dimension related to the effective plate area. In order to have the same
channel cross sectional area, the effective width of the plate is remains,
which mean only the port length of the PHE is changing.
To calculate required heat transfer area at desire NTU
Step 1: Estimation of PHE effectiveness
The effectiveness of the PHE base on desire NTU is calculated base on Equation
3.25 from previous section.
Step 2: Estimation of required heat capacity rate
The heat capacity rate of the fluid is calculated by
Step 3: Estimation of required mass flow rate and mass flow rate at each
channel
Required mass flow rate to achieve desire Cmin is calculated from
And the mass flow rate at each channel is calculated from Equation 3.13

48
Step 4: Estimation of Reynolds number
The Reynolds number is estimated from equation as below
Step 5: Estimation of Nusselt number and convective heat transfer coefficient of
working fluids
The calculation of the Nusselt number is done with using Equation 3.15. While
the convective heat transfer coefficient is calculated by Equation 3.17.
Step 6: Overall heat transfer coefficient
After the values of convective heat transfer coefficient for both side of fluid is
calculated. The overall heat transfer coefficient is then estimated from Equation
3.18.
Step 7: Required Heat transfer area for respected NTU
The heat transfer area required to achieve the rated heat transfer rate of 460kW
with respect to the desire NTU value is estimated from
3.7.2 Pressure Drop Estimation from Desire NTU
The value of NTU is directly associated with the pressure drop due to the larger
the NTU desire, the more heat transfer area is require and the thermal plate area
is directly related to the frictional losses in the flow channel.

49
With the available of channel Reynolds number calculated from Equation
3.37 the pressure drop can be estimated from using equations shown in previous
section. However, from the assumptions that the numbers and the effective width
of thermal plate is same as the existing PHE, the value of L in Equation 3.29 and
3.33 should be calculated from
Where w is the effective width of thermal plates
3.8 Validation of Correlations and Mathematical Formulation
In this study, the most important parameter of the nanofluids is the effective thermal
conductivity. Correlation selected to predict the nanofluids thermal conductivity is from
(Corcione, 2011). Since this correlation is constructed base on various numbers of
experimental data from year 1993 to 2009, it raises concern that those experimental
devices and setups in the earlier date are not technologically advance enough to have a
more accurate measurement. Therefore, to validate this correlation, nanofluids thermal
conductivity estimated from correlation by Vajjha and Das (2009a) which is not
considered in Corcione (2011) study was use to make comparison.
For comparison, the Al2O3 nanofluids thermal conductivity is estimated base on
mean temperature of the hot side fluid in the existing PHE and it is plotted in graph as
shown in Figure 3.4.
The maximum deviation from them is about 5% at particle volume concentration
of 0.5%. Therefore, it shows that both correlation posses good agreement to each other
in the estimation of nanofluids thermal conductivity.

50
Figure 3.4: Comparison of knf from (Corcione, 2011; Vajjha & Das, 2009a)
To validate the mathematical formulation shown in above section, the calculated
performance details of PHE are compared to the value rated by the manufacturer and
they are shown in Table 3.6
Table 3.6: Comparison of Performance Details
PHE Performance Detail Rated Calculated Deviation
Overall heat transfer coefficient, U
(W/m2K)
5475 5403.41 1.31%
Heat transfer rate, q (W) 460,000 460,743.57 0.16%
Total pressure drop, Δptotal (Pa) 34,548 31,587.65 8.57%
The comparison shows that the calculated overall heat transfer coefficient and
heat transfer rate is well agreed to the rated value. Both have only 1.31% and 0.16%
deviation respectively. Therefore, it can be concluded that the selected correlation to
calculate the Nusselt number, the assumptions in thermal analysis, the use of ԑ-NTU
relation for counterflow heat exchanger and the calculation steps are valid.
0.620
0.640
0.660
0.680
0.700
0.720
0.740
0.00 0.50 1.00 1.50 2.00 2.50 3.00 Nan
ofl
uid
s Th
erm
al C
on
du
ctiv
ity,
k n
f (W
/mK
)
Particle volume concentration %
knf (Vajjha & Das) knf (M. Corcione)

51
Meanwhile, for pressure drop, the difference is larger but it is still below 10%.
This might be caused by; (1) the different parameters used in the calculation i.e. the
friction factor, manufacturers always uses their own correlations based on the testing of
their product. The correlation used in this study is valid for general geometry of PHE
and it is not a specific one for the existing PHE. (2) The calculated value is base on
idealized situation. In actual case, there might have flow recirculation at the edge of
ports and manifold that increases the pressure drop.
Since the percent difference of rated and calculated pressure drop is only 8.57%
and together with the reasons discuss above. It can be concluded that the assumptions
and mathematical formulation for pressure drop calculation are applicable.
52
4.0 RESULTS AND DISCUSSION
4.1 Introduction
In this chapter, the calculated results will be shown and analyzed. In first section, the
calculated thermophysical properties will be analyzed based on particle volume
concentration and size. In addition, the comparison will be made between Al2O3-H2O
and SiO2-H2O nanofluids. After that, the thermal and hydrodynamic performance of
existing PHE system operating with nanofluids as hot side working fluid instead of
water will be discussed. Comparison of performance between nanofluids and the
original heat transfer fluid as well as different type of nanofluids will be revealed. The
efficacy of using nanofluids as working fluid in the designing stage of the PHE system
will be analyzed in third section. In this section, the heat transfer area reduction with
respect to desire NTU value will be estimated and corresponding pressure drop will be
investigated.
4.2 Thermophysical Properties of Nanofluids
4.2.1 Thermal Conductivity
Effective thermal conductivity of nanofluids are plotted in Figure 4.1. It is found
that at mean hot side working temperature T = 311.5K, the thermal conductivity
of nanofluids increase as particle volume concentration increase and as the
particle size decrease. Comparing to the base fluid, the thermal conductivity at 3%
particle volume concentration is 13.88% higher for Al2O3 nanofluids, while for
SiO2 nanofluids an enhancement of 9.15%, 12.07% and 15.93% is observed for
nanoparticles size of 100 nm, 50 nm and 25 nm respectively. Figure 4.1 clearly
shows that the thermal conductivity of Al2O3 nanofluids at every particle volume

53
concentration is lower than SiO2 nanofluids with 25 nm particle size although
the thermal conductivity of Al2O3 particle is 26 times higher than SiO2 particle.
The effect of particle material only can be notice when comparing the Al2O3
nanofluids to SiO2 nanofluids with 50 nm, noting that particle size for Al2O3 is
45 nm. This phenomenon indicates that at a fix temperature, the thermal
conductivity of nanofluids is strongly dependent on the particle volume
concentration and particle size while the effect of the thermal conductivity of
particles is minimal. Similar observation was revealed by Jang and Choi (2007),
they found that the thermal conductivity of nanofluids depends strongly on
temperature, particle size and volume fraction while the effect of ratio between
particle and base fluid thermal conductivity is small, which also means that the
effect of particle thermal conductivity is weak.
Figure 4.1: Thermal Conductivity of Nanofluids at Different Particle Volume
Concentration.
0.60
0.63
0.66
0.69
0.72
0.75
0.00 0.50 1.00 1.50 2.00 2.50 3.00
k nf (
W/m
K)
Particle Volume Concentration %
SiO₂ 25 nm SiO₂ 50 nm SiO₂ 100 nm Al₂O₃
54
The explanations for this occurrence are; (1) the thermal conductivity of
nanofluids not only depends on the static part of thermal conductivity i.e.
thermal conductivity of particle and base fluid and particle volume fraction.
Particle Brownian motion also plays an important part in thermal conductivity
enhancement; there will be more collision of particles due to Brownian motions
at a given volumetric concentration for smaller particle size because the amount
of nanoparticles is greater. The collisions provide thermal diffusion of
nanoparticles that indicate heat transfer between particles. (2) At the same
particle volume concentration, nanofluids with smaller particles size will have
larger amount of particles and hence there will be more surface area for transfer
of thermal energy. (3) Collision of particles and fluid molecules due to Brownian
motion with short wavelength by thermal induce fluctuation or termed as
nanoconvection (Jang & Choi, 2007). As the particles size decrease the
Brownian motion is greater and hence the nanoconvection become dominant.
Consequently, the nanofluids thermal conductivity increase.
4.2.2 Viscosity
The calculated effective dynamic viscosity for each nanofluids are plotted in
Figure 4.2. It shows that the viscosity of nanofluids increased as the particle
volume concentration increase. Results shows that at 3% particle volume
concentration, Al2O3 nanofluids and SiO2 nanofluids with particle size 25, 50
and 100 nm respectively exhibits 12.77%, 15.61%, 12.32% and 9.78%
increment over base fluids. From the figure, it is also notice that the effect of
particle size to viscosity is dependent on particle volume concentration. At high
particle volume concentration, the smaller the particle size the higher the

55
viscosity will be. This is due to when particle size is small, there will be larger
amount of particles in the nanofluids at a given volume fraction compare to
nanofluids with bigger particle size. Therefore, the total particle surface area
interacting with the base fluid is larger. However, at low particle volume
concentration, the effect of particle size is not significant. This might be due to
the fact that the amount of nanoparticles is not significant enough to provide the
aforementioned effect.
Figure 4.2: Viscosity of Nanofluids at Different Particle Volume Concentration
4.2.3 Density
The calculated results show that density of nanofluids increased with increase of
particle volume concentration. For Al2O3 nanofluids at 3% volume fraction, the
density increased by 9% compare to the base fluid. Meanwhile, at the same
particle volume concentration, SiO2 particles with lower density compare to
Al2O3 exhibit 3.71% increase on viscosity compare to base fluid. The relation of
0.00066
0.00069
0.00072
0.00075
0.00078
0.00081
0.00 0.50 1.00 1.50 2.00 2.50 3.00
μn
f (
Ns/
m2)
Particle Volume Concentration %
SiO₂ 25 nm SiO₂ 50 nm SiO₂ 100 nm Al₂O₃

56
nanofluids density to the particle volume concentration and density of
nanoparticles are shown in Figure 4.3.
Figure 4.3: Density of Nanofluids at Different Particle Volume Concentration
4.2.4 Specific Heat
The calculated results are plotted in graph as shown in Figure 4.4. It is observed
that the specific heat decreased as particle volume concentration increase. At 3%
particle volume concentration, the Al2O3 nanofluids posses 8.99% lower specific
heat compare to the base fluid while SiO2 exhibits 5.32% lower specific heat.
Similar to that of density, the specific heat of nanofluids depends on the volume
fraction and the specific heat as well as density of nanoparticle.
975
1000
1025
1050
1075
1100
0.00 0.50 1.00 1.50 2.00 2.50 3.00
ρn
f (k
g/m
3)
Particle Volume Concentration %
SiO₂ 25 nm SiO₂ 50 nm SiO₂ 100 nm Al₂O₃

57
Figure 4.4: Specific Heat of Nanofluids at Different Particle Volume Concentration
4.2.5 Prandtl Number
Prandtl number is a function of thermal conductivity, viscosity and specific heat.
Figure 4.5 shows the Prandtl number with respect to particle volume
concentration. It shows that the Prandtl number of Al2O3 nanofluids is more
sensitive to increase of particle volume concentration. Comparing to base fluid
the Al2O3 nanofluids at 3% particle volume concentration exhibit 9.89% drop in
Prandtl number. At the same volume fraction, SiO2 nanofluids posses 4.48%,
5.11% and 5.57% drop in Prandtl number for particle size of 100 nm, 50 nm and
25 nm respectively.
3700
3800
3900
4000
4100
4200
0.00 0.50 1.00 1.50 2.00 2.50 3.00
c p,n
f (J
/kgK
)
Particle Volume Concentration %
SiO₂ 25 nm SiO₂ 50 nm SiO₂ 100 nm Al₂O₃

58
Figure 4.5: Prandtl Number of Nanofluids at Different Particle Volume Concentration
4.3 Thermal and Hydrodynamic Performance of Existing PHE System Operating
With Nanofluids as Hot Side Working Fluid
4.3.1 Thermal Performance Analysis
The original volumetric flow rate of hot side fluid calculated from Equation 3.9
is 0.02239 m3/s. This value was treated as constant throughout the whole
analysis as the pump system does not change. Hence, total mass flow rate of the
nanofluids supplied to the PHE can be calculated using Equation 3.10. Due to
the increase in density of nanofluids with respect to the particle volume
concentration, the mass flow rate of nanofluids increased with particle volume
concentration. At 3% particles volume concentration, 9% increment on mass
flow rate is observed for Al2O3 nanofluids while for SiO2 nanofluids the
increment is 3.71% independent of nanoparticle size. An explanation to this
occurrence is that when volume concentration increases, the amount of the
particles inside the fluids increase and resulting the rise of nanofluids density.
4.00
4.10
4.20
4.30
4.40
4.50
4.60
0.00 0.50 1.00 1.50 2.00 2.50 3.00
Pr n
f
Particle Volume Concentration %
SiO₂ 25 nm SiO₂ 50 nm SiO₂ 100 nm Al₂O₃

59
From Figure 4.6, it is observed that the trend of mass flow rate is similar to that
of density shown in Figure 4.3; this is mainly due to the mass flow rate that is
only dependent to density when the volumetric flow rate is kept constant.
Figure 4.6: Mass Flow Rate of Nanofluids with Respect to Particle Volume
Concentration.
The calculated Reynolds number for nanofluids flow in each channel is
plotted in graph as shown in Figure 4.7. With the equivalent diameter and the
cross sectional area of flow channel remain constant, the Reynolds number is
only dependent on the mass flow rate and the nanofluids viscosity. Figure 4.7
shows that Reynolds number for nanofluids is decreasing with particle volume
concentration. Analysis on the relationship between the parameters revealed that
the increase of viscosity over particle volume concentration is greater than the
increased of density thus the Reynolds number drop. At 3% particles volume
concentration, the decrease of nanofluids Reynolds number compare to the
original fluid (water) is 3.34% for Al2O3 and 10.29%, 7.67% and 5.53% for SiO2
with particle size of 25 nm, 50 nm and 100 nm respectively. Therefore, it shows
22.00
22.50
23.00
23.50
24.00
24.50
0.00 0.50 1.00 1.50 2.00 2.50 3.00
Mas
s Fl
ow
Rat
e (k
g/s)
Particle Volume Concentration %
Al₂O₃ SiO₂ 25nm SiO₂ 50nm SiO₂ 100nm

60
that for the same nanoparticles material, the smaller particle size will have lower
Reynolds number.
Figure 4.7: Reynolds Number for Different Particle Volume Concentration.
With the available of Reynolds number, Prandtl number and viscosity of
nanofluids at fluid temperature and thermal plate temperature, the calculated
Nusselt number are plotted in the graph as Figure 4.8.
Figure 4.8: Nusselt Number of Nanofluids at Various Particle Volume Concentration.
5600
5800
6000
6200
6400
6600
0.00 0.50 1.00 1.50 2.00 2.50 3.00
Re
yno
lds
Nu
mb
er
Particle Volume Concentration %
Al₂O₃ SiO₂ 25nm SiO₂ 50nm SiO₂ 100nm
99
102
105
108
111
114
0.00 0.50 1.00 1.50 2.00 2.50 3.00
Nu
ssel
t N
um
ber
ParticlesVolume Concentration %
Al₂O₃ SiO₂ 25nm SiO₂ 50nm SiO₂ 100nm

61
It is observed that the SiO2 nanofluids with 100 nm in particle size have
Nusselt number similar to the Al2O3 while SiO2 nanofluids made of 25 nm
particle size has the lowest Nusselt number. At 3% particle volume
concentration, comparison between Al2O3 and SiO2 nanofluids with 100 nm
particle size shows that the Reynolds number for Al2O3 is higher by about 2.3%
while the Prandtl number is 5.68% lower. However, the tradeoff between these
two parameters consequently made them to have similar value of Nusselt
number. Meanwhile, for SiO2 nanofluids with particles size of 25 nm, it has
lowest Reynolds number which is cause by high viscosity value. The Reynolds
number is 7.2% lower than Al2O3 nanofluids. Although it has about 5% higher
Prandtl number compare to the former, the calculated Nusselt number still lower
than Al2O3 nanofluids. Thus, it shows that Reynolds number is an important
factor in Nusselt number estimation. An investigation on the Nusselt number
correlation shows that, with the geometrical characteristic of PHE unchanged,
the Reynolds number with exponent value of 0.782 has the highest impact on the
Nusselt number followed by Prandtl number with value of 0.333 and lastly the
ratio of nanofuids viscosity at bulk fluid temperature and thermal plate
temperature with value of 0.14. It is also notice that the viscosity ratio is a
constant with a value of 0.96 regardless of type and size of nanoparticles. This
can be explained by the correlation of viscosity that is only dependent on
particles size and the effect of temperature only shows on the viscosity of base
fluid. With this, the ratio of nanofluids viscosity at two different temperatures is
same as the viscosity ratio of water. In comparison to water, the drop in Nusselt
number cause by nanofluids is 5.94% for Al2O3, 9.89%, 7.67% and 5.90% for
SiO2 nanofluids with 25 nm, 50 nm and 100 nm particle size respectively.

62
The convective heat transfer coefficient for the nanofluids is estimated by
using Equation 3.17 and the results are plotted in graph as shown in Figure 4.9.
It shows that the convective heat transfer coefficient for Al2O3 is the highest
follow by SiO2 nanofluids with particle size of 25 nm, 50 nm and 100 nm
respectively. Compare to water, Al2O3 nanofluids posses 2.63% enhancement at
0.5% particles volume concentration, while 7.11% enhancement is observed at 3%
particle volume concentration. At low particle volume fraction, the enhancement
in convective heat transfer coefficient due to types of nanofluids is not obvious.
However, at high particle volume concentration, the effect from types of
nanofluids is significant. Take for example, at 0.5% particle volume
concentration, the difference between Al2O3 nanofluids and SiO2 nanofluid at 25
nm particle size is 24.86 W/m2K, while the difference become 311.80 W/m
2K at
3% particle volume concentration.
Figure 4.9 Convective Heat Transfer Coefficient of Nanofluids at Different Particle
Volume Concentration.
11500
11750
12000
12250
12500
12750
0.00 0.50 1.00 1.50 2.00 2.50 3.00
Co
nve
ctio
n H
eat
Tran
sfer
C
oef
fici
ent
(W/m
2K
)
Particle Volume Concentration %
Al₂O₃ SiO₂ 25 nm SiO₂ 50 nm SiO₂ 100 nm

63
Investigation on Equation 3.17 found that, with constant in equivalent
diameter, the convective heat transfer coefficient is dependent on both Nusselt
number and thermal conductivity of nanofluids. Hence, the thermal conductivity
plays the essential role in determine the enhancement of convection heat transfer
coefficient, when the Nusselt number decrease with particle volume
concentration. Meanwhile, the effect of particle size to the convective heat
transfer coefficient is also noticeable. For SiO2 nanofluids with particles size of
100 nm, although the Nusselt number is higher than both 25nm and 50 nm one,
the calculated results is lowest at every particle volume concentration. This
indicates that, SiO2 nanofluids with smaller particle size which has greater
thermal conductivity posses greater convective heat transfer coefficient. Similar
finding was reported by Nguyen et al. (2007).
The aforementioned findings demonstrated that the thermal conductivity
of nanofluids dominate the enhancement of convective heat transfer coefficient.
To obtain the overall heat transfer coefficient, the thermal plate wall
resistance and convection heat transfer coefficient for cold side working fluids
was calculated. The wall resistance of the titanium thermal plate is 0.00002283
m2K/W, while the cold side convection heat transfer coefficient is 12945.64
W/m2K. Noted that the thickness of the thermal plate is fix and the cold side
condition unchanged, these two values will remain constant throughout the
calculation. Therefore, the only parameter affecting the overall heat transfer
coefficient is hot side convection heat transfer coefficient. Base on Equation
3.18, the calculated results are plotted in graph as Figure 4.10. The results shows
that maximum enhancement of heat transfer coefficient occur at 3% particle
volume concentration for all nanofluids. Al2O3 nanofluids has heat transfer
coefficient enhancement of 170.02 W/m2K or 3.15% increment over original

64
value, while for SiO2 nanofluids, the enhancement are 108.18 W/m2K (2%),
84.49 W/m2K (1.56%) and 66.30 W/m
2K (1.23%) for particle size of 25 nm, 50
nm and 100 nm respectively. Figure 4.10 also shows that the slop of Al2O3
nanofluids is steeper than SiO2 nanofluids at 3% particle volume concentration;
this indicated that higher overall heat transfer coefficient can be expected
beyond this limit. However, for SiO2 nanofluid there will be little or no further
enhancement after 3% particle volume concentration.
Figure 4.10: Overall Heat Transfer Coefficient of Nanofluids at Different Particle
Volume Concentration
Nanofluids heat capacity rate is calculated base on Equation 3.19, the
results are plotted in graph as shown in Figure 4.11. The value of heat capacity
rate is dependent on both mass flow rate and specific heat of nanofluids. From
the figure, it shows that the heat capacity rate decrease with addition
nanoparticles into base fluid. This is logic since the increase of particle volume
fraction causes increase of thermal conductivity and decrease of thermal
resistivity. For 3% Al2O3 nanofluids, the heat capacity rate decreased by 0.8%
compare to water, while 1.80% drops of heat capacity rate for SiO2 nanofluids is
5400
5430
5460
5490
5520
5550
5580
0.00 0.50 1.00 1.50 2.00 2.50 3.00
Ove
rall
Hea
t Tr
ansf
er C
oef
fici
ent
(W/m
2K
)
Particle Volume Concentration %
Al₂O₃ SiO₂ 25nm SiO₂ 50nm SiO₂ 100nm

65
observed at the same particle volume concentration. Meanwhile, the calculated
heat capacity rate for cold side is 112,802.27 W/K and it remains constant
throughout the calculation. Therefore, the minimum heat capacity rate will
always belong to the nanofluids side and this will in turn affect the heat transfer
rate of PHE.
Figure 4.11: Heat Capacity Rate of Nanofluids at Various Particle Volume
Concentration
The abovementioned condition is clearly shown in the calculation for
maximum heat transfer rate of the PHE. As shown in Figure 4.12, the maximum
heat transfer rate of PHE is decreasing with increased of particle volume
concentration. It is found that, the magnitude of decrease for maximum heat
transfer rate is same to that of heat capacity rate for nanofluids.
90800
91200
91600
92000
92400
92800
93200
0.00 0.50 1.00 1.50 2.00 2.50 3.00
Hea
t C
apac
ity
Rat
e (
W/K
)
Particle Volume Concentration %
Al₂O₃ SiO₂ 25nm SiO₂ 50nm SiO₂ 100nm

66
Figure 4.12: Maximum Heat Transfer Rate at Various Particle Volume Concentration
NTU is calculated base on Equation 3.22, with total heat transfer area
remains constant, the NTU is dependent on both the overall heat transfer
coefficient and the minimum heat capacity rate. The estimated NTU with respect
to particle volume fraction is shown in Figure 4.13. It is found that the trend of
Al2O3 and SiO2-25 nm nanofluids are almost similar, both at the higher edge on
graph followed by SiO2-50 nm and SiO2-100 nm nanofluids. At 3% volume
concentration, the NTU for Al2O3 increase by 8.03% followed by SiO2-25 nm
7.82%, 6.92%, and 6.22% for SiO2 nanofluids with 50 nm and 100 nm particle
size respectively. This situation further indicated the importance of enhancement
on thermal conductivity by nanofluids.
816000
820000
824000
828000
832000
836000
840000
0.00 0.50 1.00 1.50 2.00 2.50 3.00 Max
imu
m H
eat
Tran
sfer
Rat
e (W
)
Particle Volume Concentration %
Al₂O₃ SiO₂ 25 nm SiO₂ 50 nm SiO₂ 100 nm

67
Figure 4.13: NTU of PHE at Different Nanofluids Particle Volume Concentration
Figure 4.14: Effectiveness of PHE at Different Nanofluids Particle Volume
Concentration
1.110
1.120
1.130
1.140
1.150
1.160
0.00 0.50 1.00 1.50 2.00 2.50 3.00
NTU
Particle Volume Concentration %
Al₂O₃ SiO₂ 25nm SiO₂ 50nm SiO₂ 100nm
0.549
0.552
0.555
0.558
0.561
0.564
0.567
0.00 0.50 1.00 1.50 2.00 2.50 3.00
Effe
ctiv
en
ess
Particle Volume Concentration %
Al₂O₃ SiO₂ 25nm SiO₂ 50nm SiO₂ 100nm

68
The effectiveness of PHE is calculated base on Equation 3.24, since the
heat capacity rate ratio is always lesser than 1. The estimated effectiveness is
plotted in graph as shown in Figure 4.14. It is noticed that SiO2-25 nm
nanofluids augmented the effectiveness of PHE the most. At 3% particle volume
concentration, the SiO2-25 nm increase the effectiveness by 2.27% followed by
Al2O3 2.10% and 2.06%, 1.89% for SiO2 nanofluids with 50 nm and 100 nm
particle size respectively. The analysis on the results shows that, the minimum
heat capacity rate plays a key role in the effectiveness, which is why the
enhancement of effectiveness due to Al2O3 is smaller than SiO2-25 nm
nanofluids. Take for example, at 2% particle volume concentration, where both
nanofluids has the similar NTU value, the higher heat capacity rate value of
Al2O3 nanofluids result in high heat capacity rate ratio hence causing lower
effectiveness. This phenomenon is clearly shown in Figure 2.3.
The actual heat transfer rate of the PHE system is calculated by Equation
3.27 and shown in Figure 4.15. The results show that Al2O3 nanofluids at 3%
particle volume concentration has heat transfer rate of 466,664.45 W which
represent 1.29% enhancement over original heat transfer rate. Reverse
calculation shows that, this amount of enhancement will reduce the hot side
volumetric flow rate by 2.66% if the PHE is operated to handle the original heat
duty. Moreover, the improvement of heat transfer rate by Al2O3 nanofluids
beyond 3% particle volume concentration is expected as it has not reach the
maximum achievable value. Meanwhile, for SiO2 nanofluids, the maximum
enhancement occur at 1.5% particle volume concentration for nanofluids with 25
nm and 50 nm particle size, while for 100 nm one the heat transfer enhancement
stop at 1% particle volume fraction. Beyond these limit, the heat transfer rate
begins to drop. The enhancement posses by SiO2 nanofluids at abovementioned

69
limit is 0.59%, 0.39%, and 0.26% respectively. The reason for this situation is
the rate of decrease in heat capacity rate for SiO2 nanofluids overcomes the
increase of effectiveness beyond the mentioned particle volume fraction.
Therefore, for heat transfer devices where turbulent flow occur, the
enhancement of heat transfer rate due to nanofluids is not solely dependent on
the thermal conductivity while other thermophysical properties such as specific
heat, viscosity and density also shows their contributions and this was also
concluded by Lee and Mudawar (2007).
Figure 4.15 Actual Heat Transfer Rate of PHE at Various Particle Volume
Concentration.
4.3.2 Hydrodynamic Performance (Pressure Drop) Analysis
Total pressure drop of the PHE consist of three elements as mentioned in section
3.6.2. The calculated friction factor and channel/core pressure drop is plotted in
graph as shown in Figure 4.16 and 4.17 respectively. It is found that the friction
factor increased with particle volume concentration increase.
460000
461500
463000
464500
466000
467500
0.00 0.50 1.00 1.50 2.00 2.50 3.00
Hea
t Tr
ansf
er R
ate
(W)
Particle Volume Concentration %
Al₂O₃ SiO₂ 25nm SiO₂ 50nm SiO₂ 100nm

70
Figure 4.16: Friction Coefficient of Nanofluids at Different Particle Volume
Concentration.
Figure 4.17: Channel Pressure Drop at Various Particle Volume Concentration
Unlike the Nusselt number correlations, the friction factor correlation is
only dependent on the Reynolds number in the flow channel. At the given
thermal plate geometry, the drop of Reynolds number as in Figure 4.7 resulted
the increase of friction factor, because the exponent value of Reynolds number
in the correlation has the value of -0.20028. At 3% particle volume
0.2260
0.2280
0.2300
0.2320
0.2340
0.00 0.50 1.00 1.50 2.00 2.50 3.00
Fric
tio
n C
oef
fici
ent
Particle Volume Concentration %
Al₂O₃ SiO₂ 25nm SiO₂ 50nm SiO₂ 100nm
37000
38000
39000
40000
41000
42000
0.00 0.50 1.00 1.50 2.00 2.50 3.00 Ch
ann
el P
ress
ure
Dro
p Δ
pch
ann
el (
Pa)
Particle Volume Concentration %
Al₂O₃ SiO₂ 25nm SiO₂ 50nm SiO₂ 100nm

71
concentration, the rise of friction factor for Al2O3 nanofluids is the lowest
(0.68%), while the SiO2-25 nm nanofluids has the highest increased (2.20%).
Figure 4.17 shows Al2O3 nanofluids has the highest channel pressure
drop at every particle volume concentration, while for SiO2 nanofluids the value
decreased as the particle size increase. Examination on the Equation 3.29
revealed that, the main contributor to the channel pressure drop is the mass flow
rate of nanoparticles which is a function of density and volumetric flow rate,
while the effect of viscosity only pronounce when the density of nanoparticles is
same.
The ports pressure drop and pressure drop due to elevation change is
calculated and plotted in Figure 4.18 and 4.19. With the geometry of PHE
unchanged, both type of pressure drop is a function of nanoparticles density.
Hence, Al2O3 nanofluids having higher density shows greater pressure drop than
SiO2.
Figure 4.18: Port Pressure Drop at Various Particle Volume Concentration
3225
3300
3375
3450
3525
3600
0.00 0.50 1.00 1.50 2.00 2.50 3.00
Po
rt P
ress
ure
Dro
p Δ
pp
ort
(P
a)
Particle Volume Concentration %
Al₂O₃ SiO₂ 25nm SiO₂ 50nm SiO₂ 100nm

72
Figure 4.19: Pressure Drop Due to Elevation Change at Various Particle Volume
Concentration
The total pressure drop in PHE is plotted in graph as shown in Figure
4.20. Al2O3 nanofluids has the highest total pressure drop among others. At 3%
particle volume concentration, the total pressure drop increase by 9.88% for
Al2O3 nanofluids followed by SiO2-25 nm 6.42%, SiO2-50 nm 5.69% and lastly
SiO2- 100 nm 5.12%.
Figure 4.20: Total Pressure Drop of PHE at Various Particle Volume Concentration
9000
9200
9400
9600
9800
10000
0.00 0.50 1.00 1.50 2.00 2.50 3.00 Elev
atio
n P
ress
ure
Dro
p Δ
pe
leva
tio
n
(Pa)
Particle Volume Concentration %
Al₂O₃ SiO₂ 25nm SiO₂ 50nm SiO₂ 100nm
31000
32000
33000
34000
35000
0.00 0.50 1.00 1.50 2.00 2.50 3.00
Tota
l Pre
ssu
re D
rop
Δp
tota
l (P
a)
Particle Volume Concentration %
Al₂O₃ SiO₂ 25nm SiO₂ 50nm SiO₂ 100nm

73
To monitor the contribution from types of pressure drop, the amount and
types of pressure drop from Al2O3 nanofluids is plotted in Figure 4.21. It is
found that, with relatively large value compare to the others, channel pressure
drop is the main contributor.
Figure 4.21: Pressure Drop of PHE for Al2O3 Nanofluids
In force convection heat transfer system, pumping power is an important
parameter that system designers need to pay attention on, because pumping
power directly reflect the operating cost of the system. To obtain pumping power,
the value of total pressure drop is multiply with the volumetric flow rate of
nanofluids. The calculated pumping power is shown in Figure 4.22. The trend of
pumping power is similar to the total pressure drop due to the fix volumetric
flow rate value. Therefore, it is found that for Al2O3 and SiO2 nanofluids, the
increment of pumping power has the same magnitude to the rise of total pressure
drop. A reverse calculation is done on the Al2O3 nanofluids, it is found that
application of Al2O3 nanofluids in the existing PHE system does not help in
decreasing the energy consumption in sense of pumping power. The pumping
0
10000
20000
30000
40000
50000
0.00 0.50 1.00 1.50 2.00 2.50 3.00
Pre
ssu
re D
rop
(P
a)
Particle Volume Concentration %
Δpchannel ΔPport Δpelevation

74
power required for Al2O3 nanofluids to handle the same heat duty has rise by
3.13% compare to the original pumping power required. However, the reduction
of pump size is possible when the required volumetric flow rate drop. Hence the
load on the drive may be reduce and consequently make the system more energy
efficient.
Figure 4.22: Pumping Power Required at Different Particles Volume Concentration
4.4 Application of Nanofluids at PHE Design Stage
4.4.1 Heat Transfer Area Reduction Analysis
The calculated heat transfer area required base on desire NTU are plotted in
graphs as in Figure 4.23 to Figure 4.27. It is found that require heat transfer area
reduce as the particle volume concentration increase. For every NTU, the Al2O3
nanofluids shows greater area reduction compare to SiO2 nanofluids. Take into
account that the calculation is based on equal heat capacity rate of hot and cold
working fluid and the heat capacity rate is a fixed value. The mass flow rate
supply to PHE is directly dependent on the specific heat of nanofluids. Therefore,
700
720
740
760
780
800
0.00 0.50 1.00 1.50 2.00 2.50 3.00
Pu
mp
ing
Po
wer
(W
)
Particle Volume Concentration %
Al₂O₃ SiO₂ 25nm SiO₂ 50nm SiO₂ 100nm

75
lower specific heat value of Al2O3 particles results the increased of mass flow
rate supply to the PHE. The combination of higher Reynolds number and
thermal conductivity make Al2O3 has higher overall heat transfer coefficient and
consequently lower heat transfer area required.
Figure 4.23: Required Heat Transfer Area at NTU = 1
Figure 4.24: Required Heat Transfer Area at NTU = 2
18.30
18.45
18.60
18.75
18.90
19.05
0.00 0.50 1.00 1.50 2.00 2.50 3.00
Hea
t Tr
ansf
er A
rea
(m2)
Particle Volume Concentration %
SiO₂ 25nm SiO₂ 50nm SiO₂ 100nm Al₂O₃
33.30
33.60
33.90
34.20
34.50
34.80
0.00 0.50 1.00 1.50 2.00 2.50 3.00
Hea
t Tr
ansf
er A
rea
(m2)
Particle Volume Concentration %
SiO₂ 25nm SiO₂ 50nm SiO₂ 100nm Al₂O₃

76
Figure 4.25: Required Heat Transfer Area at NTU = 3
Figure 4.26: Required Heat Transfer Area at NTU = 4
48.40
48.80
49.20
49.60
50.00
50.40
0.00 0.50 1.00 1.50 2.00 2.50 3.00
Hea
t Tr
ansf
er A
rea
(m2)
Particle Volume Concentration %
SiO₂ 25nm SiO₂ 50nm SiO₂ 100nm Al₂O₃
63.50
64.00
64.50
65.00
65.50
66.00
0.00 0.50 1.00 1.50 2.00 2.50 3.00
Hea
t Tr
ansf
er A
rea
(m2)
Particle Volume Concentration %
SiO₂ 25nm SiO₂ 50nm SiO₂ 100nm Al₂O₃
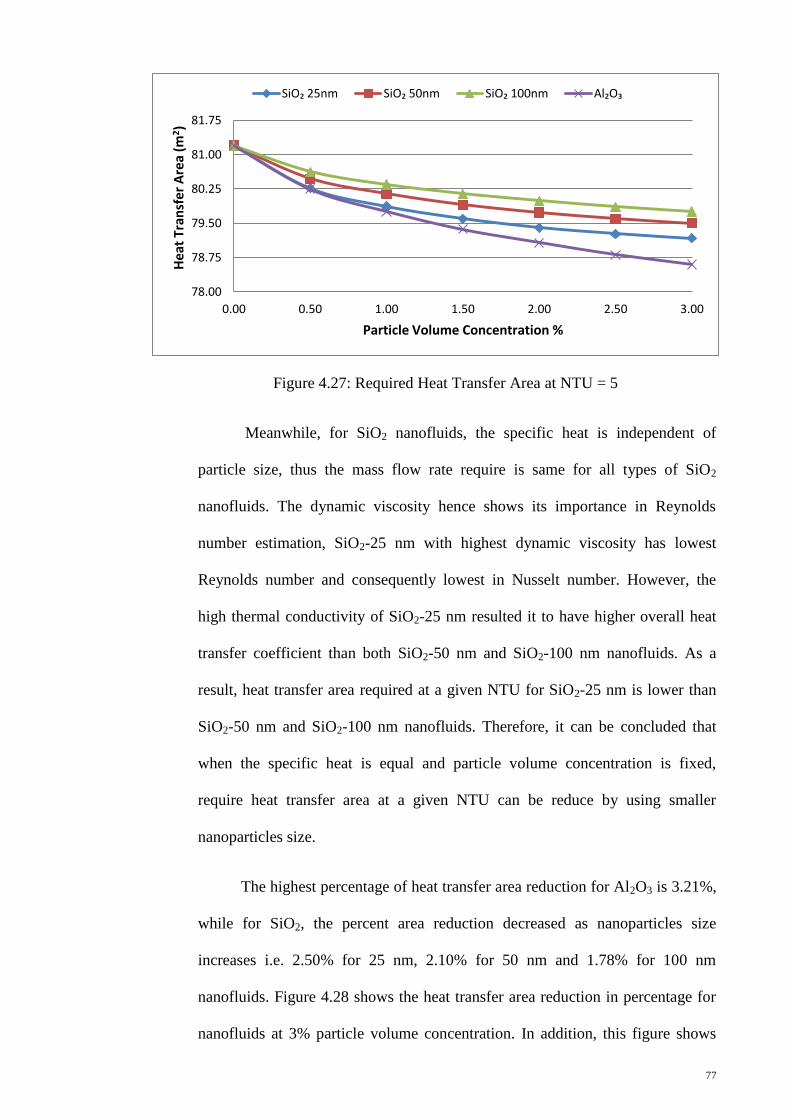
77
Figure 4.27: Required Heat Transfer Area at NTU = 5
Meanwhile, for SiO2 nanofluids, the specific heat is independent of
particle size, thus the mass flow rate require is same for all types of SiO2
nanofluids. The dynamic viscosity hence shows its importance in Reynolds
number estimation, SiO2-25 nm with highest dynamic viscosity has lowest
Reynolds number and consequently lowest in Nusselt number. However, the
high thermal conductivity of SiO2-25 nm resulted it to have higher overall heat
transfer coefficient than both SiO2-50 nm and SiO2-100 nm nanofluids. As a
result, heat transfer area required at a given NTU for SiO2-25 nm is lower than
SiO2-50 nm and SiO2-100 nm nanofluids. Therefore, it can be concluded that
when the specific heat is equal and particle volume concentration is fixed,
require heat transfer area at a given NTU can be reduce by using smaller
nanoparticles size.
The highest percentage of heat transfer area reduction for Al2O3 is 3.21%,
while for SiO2, the percent area reduction decreased as nanoparticles size
increases i.e. 2.50% for 25 nm, 2.10% for 50 nm and 1.78% for 100 nm
nanofluids. Figure 4.28 shows the heat transfer area reduction in percentage for
nanofluids at 3% particle volume concentration. In addition, this figure shows
78.00
78.75
79.50
80.25
81.00
81.75
0.00 0.50 1.00 1.50 2.00 2.50 3.00
Hea
t Tr
ansf
er A
rea
(m2)
Particle Volume Concentration %
SiO₂ 25nm SiO₂ 50nm SiO₂ 100nm Al₂O₃

78
that area reduction cause by nanofluids become greater at higher NTU as clearly
shown by Al2O3 nanofluids.
Figure 4.28: Heat Transfer Area Reduction Due to 3% Particle Volume
Concentration of Nanofluids
4.4.2 Pressure Drop Analysis
The total pressure drop with respect to NTU is plotted in graphs as shown in
Figure 4.29 to Figure 4.33. It is found that, total pressure drop increased as
particle volume concentration increase and the difference of pressure drop
between types of nanoparticles become significant at high NTU. This is mainly
due to the increase of required heat transfer surface area that makes the
influences of dynamic viscosity significant. The highest increase of pressure
drop occurs at NTU = 5 where 3% particle volume concentration nanofluids is
used.
1.00
1.50
2.00
2.50
3.00
3.50
1 2 3 4 5
Are
a R
ed
uct
ion
(%
)
NTU
SiO₂ 25nm SiO₂ 50 nm SiO₂ 100 nm Al₂O₃

79
Figure 4.29: Total Pressure Drop of PHE at NTU = 1
Figure 4.30: Total Pressure Drop of PHE at NTU = 2
39000
39750
40500
41250
42000
42750
43500
0.00 0.50 1.00 1.50 2.00 2.50 3.00
Tota
l Pre
ssu
re D
rop
Δp
tota
l (P
a)
Particle Volume Concentration %
Al₂O₃ SiO₂ 25nm SiO₂ 50nm SiO₂ 100nm
33750
34500
35250
36000
36750
37500
38250
0.00 0.50 1.00 1.50 2.00 2.50 3.00
Tota
l Pre
ssu
re D
rop
Δp
tota
l (P
a)
Particle Volume Concentration %
Al₂O₃ SiO₂ 25nm SiO₂ 50nm SiO₂ 100nm

80
Figure 4.31: Total Pressure Drop of PHE at NTU = 3
Figure 4.32: Total Pressure Drop of PHE at NTU = 4
34500
35250
36000
36750
37500
38250
39000
0.00 0.50 1.00 1.50 2.00 2.50 3.00
Tota
l Pre
ssu
re D
rop
Δp
tota
l (P
a)
Particle Volume Concentration %
Al₂O₃ SiO₂ 25nm SiO₂ 50nm SiO₂ 100nm
36000
37000
38000
39000
40000
41000
42000
0.00 0.50 1.00 1.50 2.00 2.50 3.00
Tota
l Pre
ssu
re D
rop
Δp
tota
l (P
a)
Particle Volume Concentration %
Al₂O₃ SiO₂ 25nm SiO₂ 50nm SiO₂ 100nm
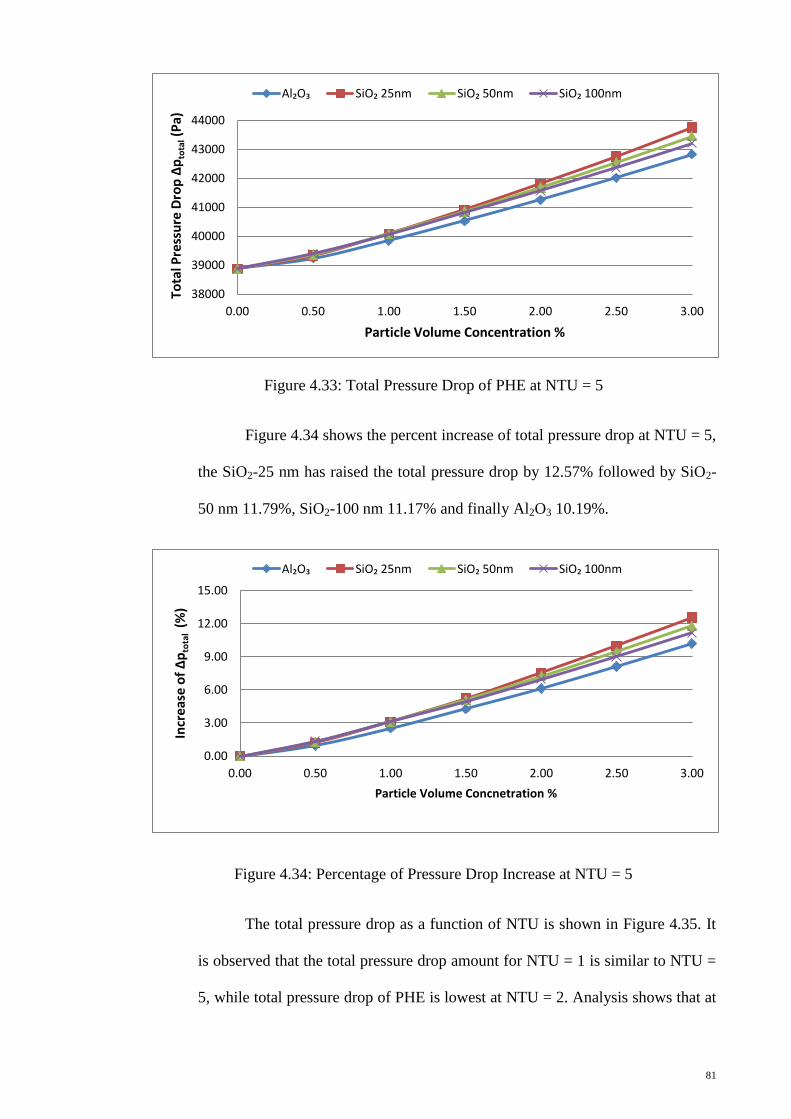
81
Figure 4.33: Total Pressure Drop of PHE at NTU = 5
Figure 4.34 shows the percent increase of total pressure drop at NTU = 5,
the SiO2-25 nm has raised the total pressure drop by 12.57% followed by SiO2-
50 nm 11.79%, SiO2-100 nm 11.17% and finally Al2O3 10.19%.
Figure 4.34: Percentage of Pressure Drop Increase at NTU = 5
The total pressure drop as a function of NTU is shown in Figure 4.35. It
is observed that the total pressure drop amount for NTU = 1 is similar to NTU =
5, while total pressure drop of PHE is lowest at NTU = 2. Analysis shows that at
38000
39000
40000
41000
42000
43000
44000
0.00 0.50 1.00 1.50 2.00 2.50 3.00
Tota
l Pre
ssu
re D
rop
Δp
tota
l (P
a)
Particle Volume Concentration %
Al₂O₃ SiO₂ 25nm SiO₂ 50nm SiO₂ 100nm
0.00
3.00
6.00
9.00
12.00
15.00
0.00 0.50 1.00 1.50 2.00 2.50 3.00
Incr
ease
of Δ
pto
tal
(%)
Particle Volume Concnetration %
Al₂O₃ SiO₂ 25nm SiO₂ 50nm SiO₂ 100nm

82
NTU = 1, the effectiveness of PHE is lowest and higher minimum heat capacity
rate is needed, hence the mass flow rate supply to PHE must be increased.
Although the increase of mass flow rate increases the Reynolds number and
lowering the friction factor, that lead to lower channel pressure drop. The
increased of mass flow rate causes the rise of port pressure drop.
Figure 4.35: Total Pressure Drop for 3% Particle Volume Concentration Nanofluids
Meanwhile, converting the require heat transfer area to the length/height
of the plate by assuming the width of plate remain constant shows that the height
of plates for NTU = 1 is shortest; as a result smaller elevation pressure drop is
obtained. However, due to the flow configuration of PHE as shown in Figure 3.3,
the pressure drop by elevation need to be subtracted from the total pressure drop.
Thus, less elevation pressure drop means lesser pressure drop deducted from
total pressure drop and consequently the total pressure drop is higher than that of
NTU = 2 to 4. The influence from type of pressure drop on the amount of total
pressure drop is shown in Figure 4.36.
33000
35000
37000
39000
41000
43000
45000
1 2 3 4 5
Tota
l Pre
ssu
re D
rop
Δp
tota
l (P
a)
NTU
water SiO₂ 25nm SiO₂ 50nm SiO₂ 100nm Al₂O₃

83
Figure 4.36: Pressure Drop for Al2O3 Nanofluids at 3% Particle Volume Concentration
As summary, the investigation on application of nanofluids at PHE designing
stage revealed that nanofluids helps in reduction of require heat transfer area at a desire
NTU value. Reduction in heat transfer area means PHE now can be more compact and
have lighter weight. In term of economy, the reduction on raw material and logistic cost
can be expected. It should be noted that, the calculation is based on heat capacity rate
ratio value of 1, the effectiveness calculated from NTU-effectiveness relation is the
lowest as shown in Figure 2.3. Therefore, more heat transfer area reduction can be
expected for actual PHE system where heat capacity rate ratio less than 1 is commonly
used. Meanwhile, it is also found that, Al2O3 nanofluids shows better result in area
reduction and total pressure drop consideration compare to SiO2 nanofluids. Specific
heat and thermal conductivity of nanofluids are essential parameters in heat transfer area
reduction estimation, while density is an important factor in pressure drop estimation in
addition of two aforementioned parameters.
1000
10000
100000
1 2 3 4 5
Pre
ssu
re D
rop
(P
a)
NTU
port pressure drop elevation pressure drop channel pressure drop

84
5.0 CONCLUSION
In this study, the application of nanofluids as hot side working fluids in existing PHE
system has been investigated. The thermal performance analysis on PHE running with
nanofluids shows positive results and conclusions drawn from the thermal analysis are:
a) The enhancement of heat transfer performance increase as particle volume
concentration increase and particle size decrease. Al2O3 nanofluids showed
better thermal performance compare to SiO2 nanofluids.
b) Al2O3 nanofluids with 3% particle volume concentration enhance the heat
transfer rate by 1.29%. For SiO2 nanofluids, the maximum enhancement
occurred at 1.5% for SiO2-25nm and SiO2-50nm while SiO2-100nm nanofluids
the enhancement stops at 1% particle volume concentration. Their percent of
enhancement is 0.59%, 0.39%, and 0.26% respectively.
c) The amount of heat transfer rate enhancement provided by Al2O3 nanofluids
may help to decrease the volumetric flow rate of hot side working fluid by
2.66%.
Meanwhile, investigation on pressure drop of existing PHE system that runs
with nanofluids showed that:
a) The friction factor and pressure drop increased as nanofluids particle volume
concentration increase. At equal density, the nanofluids with smaller particle
size that has higher dynamic viscosity result in higher increase in pressure drop.
b) The total pressure drop increase by 9.88% for Al2O3 nanofluids followed by
SiO2-25 nm 6.42%, SiO2-50 nm 5.69% and lastly SiO2- 100 nm 5.12%.

85
c) The pumping power required for Al2O3 nanofluids to handle the same heat duty
has risen by 3.13% compare to the original pumping power. However, the
reduction of pump size is possible when the required volumetric flow rate drop.
The application of nanofluids in PHE design stage shows encouraging results in
heat transfer area reduction. It can be concluded that:
a) Increase of particle volume concentration reduce the require heat transfer area to
achieve a desire NTU.
b) In the situation where specific heat is equal and particle volume concentration is
fixed, higher reduction of require heat transfer area at a given NTU can be
achieve by using smaller nanoparticles size.
c) Al2O3 nanofluids reduce the heat transfer area by approximately 3% for every
NTU value in the investigation. Highest percentage of heat transfer area
reduction for Al2O3 is 3.21%. For SiO2 nanofluids, 2.50%, 2.10% and 1.78% of
area reduction was obtained with 25 nm, 50 nm and 100 nm particle size
respectively.
d) The pressure drop increase as particles volume concentration increase.
e) Al2O3 nanofluids show better performance in heat transfer area reduction and its
corresponding pressure drop compare to SiO2 nanofluids.

86
BIBLIOGRAPHY
Brinkman, H. C. (1952). The viscosity of concentrated suspensions and solutions.
Journal Chemistry Physics, 20, 571-581.
Choi, S. U. S., & Eastman, J. A. (1995). Enhancing thermal conductivity of fluids with
nanoparticles. Paper presented at the ASME International Mechanical
Engineering Congress & Exposition, San Francisco, CA.
Chrisholm, D., & Wanniarachchi, A. S. (1992). Maldistribution in single-pass mixed
channel plate heat exchanger. Compact Heat Exchangers for Power and Process
Industries, HTD, 201, 95-99.
Corcione, M. (2011). Empirical correlating equations for predicting the effective
thermal conductivity and dynamic viscosity of nanofluids. Energy Conversion
and Management, 52, 789-793.
Das, S. K., Putra, N., Thiesen, P., & Roetzel, W. (2003). Temperature dependence of
thermal conductivity enhancement for nanofluids. Journal of Heat Transfer, 125,
567-574.
DHP Engineering. Manual: Plate Type Heat Exchangers.
Duangthongsuk, W., & Wongwises, S. (2008). Effect of thermophysical properties
models on the predicting of the convective heat transfer coefficient for low
concentration nanofluid. International Communications in Heat and Mass
Transfer, 35, 1320-1326.
Eastman, J. A., Choi, S. U. S., Li, S., Yu, W., & Thompson, L. J. (2001). Anomalously
increased effective thermal conductivities of ethylene glycol-based nanofluids
containing copper nanoparticles. Applied Physics Letters, 78(6), 718-720.
Focke, W. W., Zachariades, J., & Olivier, I. (1985). The effect of the corrugation
inclination angle on the thermohydraulic performance of plate heat exchangers.
International Journal of Heat and Mass Transfer, 28(8), 1469-1479.
Godson, L., Raja, B., Lal, D. M., & Wongwises, S. (2010). Enhancement of heat
transfer using nanofluids—An overview. Renewable and Sustainable Energy
Reviews, 14, 629-641.
Gut, J. A. W., & Pinto, J. M. (2004). Optimal configuration design for plate heat
exchangers. International Journal of Heat and Mass Transfer, 47, 4833–4848.
Hamilton, R. L., & Crosser, O. K. (1962). Thermal conductivity of heterogeneous two
component system. I & E C Fundamentals, 1(3), 187-191.
Heavner, R. L., Kumar, H., & Wanniarachchi, A. S. (1993). Performance of an
industrial plate heat exchanger: effect of chevron angle. AIChE Symposium
Series, 89(295), 262-267.
Hosseini, M. S., Mohebbi, A., & Ghader, S. (2011). Prediction of thermal conductivity
and convective heat transfer coefficient of nanofluid by local composition theory.
Journal of Heat Transfer, 133, 0524011-0524019.

87
Hwang, Y. J., Ahn, Y. C., Shin, H. S., Lee, C. G., Kim, G. T., Park, H. S., & Lee, J. K.
(2006). Investigation on characteristic of thermal conductivity enhancement of
nanofluids. Current Applied Physics, 6, 1068-1071.
Incropera, F. P., & DeWitt, D. P. (2002). Fundamentals of Heat and Mass Transfer (5
ed.): John Wiley & Sons, Inc.
Jang, S. P., & Choi, S. U. S. (2007). Effect of various parameters on nanofluid thermal
conductivity. Journal of Heat Transfer, 129, 617-623.
Kandlikar, S. G., & Shah, R. K. (1989). Multipass plate heat exchangers—
effectiveness-NTU results and guidelines for selecting pass arrangements.
Journal of Heat Transfer, 111, 300-313.
Kays, W. M. (1950). Loss coefficients for abrupt changes in flow cross section with low
Reynolds number flow in single and multiple tube system. Transactions of
ASME, 72, 1067-1074.
Kays, W. M., & London, A. L. (1984). Compact Heat Exchangers (3 ed.): McGraw-Hill.
Keblinski, P., Phillpot, S. R., Choi, S. U. S., & Eastman, J. A. (2002). Mechanisms of
heat flow in suspensions of nano-sized particles (nanofluids). International
Journal of Heat and Mass Transfer, 45, 855-863.
Khan, T. S., Khan, M. S., Chyu, M.-C., & Ayub, Z. H. (2010). Experimental
investigation of single phase convective heat transfer coefficient in a corrugated
plate heat exchanger for multiple plate configurations. Applied Thermal
Engineering, 30, 1058-1065.
Koo, J., & Kleinstreuer, C. (2004). A new thermal conductivity model for nanofluids.
Journal of Nanoparticle Research, 6, 577-588.
Lee, J., & Mudawar, I. (2007). Assessment of the effectiveness of nanofluids for
singler-phase and two-phase heat transfer in micro-channel. International
Journal of Heat and Mass Transfer, 50, 452-463.
Lee, S., Choi, S. U. S., Li, S., & Eastman, J. A. (1999). Measuring thermal conductivity
of fluids containing oxide nanoparticles. Journal of Heat Transfer, 121, 280-289.
Leong, K. Y., Saidur, R., Kazi, S. N., & Mamun, A. H. (2010). Performance
investigation of an automotive car radiator operated with nanofluid-based
coolants (Nanofluid as a coolant in a radiator). Applied Thermal Engineering, 30,
2685-2692.
Li, C. H., & Peterson, G. P. (2007). The effect of particle size on the effective thermal
conductivity of Al2O3-water nanofluids. Journal of Applied Physics, 101,
0443121-0443125.
Liu, H., Wang, X., Zhang, M., Zhang, W., & Liu, J. (2008). Heat transfer simulation of
nanofluids in micro channel cooler. Paper presented at the International
Conference on Electronic Packaging Technology & High Density Packaging
(ICEPT-HDP 2008).
Lotfi, R., Saboohi, Y., & Rashidi, A. M. (2010). Numerical study of forced convective
heat transfer of Nanofluids: Comparison of different approaches. International
Communications in Heat and Mass Transfer, 37, 74-78.

88
Maxwell, J. C. (1904). A treatis on electricity and magnetism. Oxford University Press.
Muley, A., & Manglik, R. M. (1999). Experimental study of turbulent flow heat transfer
and pressure drop in a plate heat exchanger with chevron plates. Journal of Heat
Transfer, 121, 110-117.
Muley, A., Manglik, R. M., & Metwally, H. M. (1999). Enhanced heat transfer
characteristic of viscous liquid flows in a chevron plate heat exchanger. Journal
of Heat Transfer, 121, 1011-1017.
Namburu, P. K., Kulkarni, D. P., Misra, D., & Das, D. K. (2007). Viscosity of copper
oxide nanoparticles dispersed in ethylene glycol and water mixture.
Experimental Thermal and Fluid Science, 32, 397-402.
Nguyen, C. T., Desgranges, F., Galanis, N., Roy, G., Mare, T., Boucher, S., & Mintsa,
H. A. (2008). Viscosity data for Al2O3 water nanofluid hysteresis: is heat
transfer enhancement using nanofluid reliable? International Journal of Thermal
Sciences, 47, 103-111.
Nguyen, C. T., Roy, G., Gauthier, C., & Galanis, N. (2007). Heat transfer enhancement
using Al2O3–water nanofluid for an electronic liquid cooling system. Applied
Thermal Engineering, 27, 1501-1506.
Okada, K., Ono, M., Tominura, T., Okuma, T., Konno, H., & Ohtani, S. (1972). Design
and heat transfer characteristics of new plate heat exchanger. Heat Transfer-
Japanese Research, 1(1), 90-95.
Pak, B. C., & Cho, Y. I. (1998). Hydrodynamic and heat transfer study of dispersed
fluids with submicron metallic oxide particles. Experimental Heat Transfer,
11(2), 151-170.
Pantzali, M. N., Mouza, A. A., & Paras, S. V. (2009). Investigating the efficacy of
nanofluids as coolants in plate heat exchanger (PHE). Chemical Engineering
Science 64, 3290-3300.
Saidur, R., Leong, K. Y., & Mohammad, H. A. (2011). A review on applications and
challenges of nanofluids. Renewable and Sustainable Energy Reviews, 15, 1646-
1668.
Schlunder, E. U. (1983). Heat Exchanger Design Handbook: Hemisphere Publishing
Corporation.
Shah, R. K., & Focke, W. W. (1988). Heat Transfer Equipment Design: Hemisphere
Publishing Corporation
Shah, R. K., & Kandlikar, S. G. (1988). The influence of the number of thermal plates
on plate heat exchanger performance.
Shah, R. K., & Sekulic, D. P. (2003). Fundamentals of Heat Exchanger Design: John
Wiley & Sons, Inc.
Sharqawy, M. H., Lienhard, J. H., & Zubair, S. M. (2010). Thermophysical properties
of seawater: A review of existing correlations and data. Desalination and Water
Treatment, 16, 354-380.

89
Teng, T. P., Hung, Y. H., Teng, T. C., Mo, H. E., & Hsu, H. G. (2010). The effect of
alumina/water nanofluid particle size on thermal conductivity. Applied Thermal
Engineering, 30, 2213-2218.
Tsai, T. H., & Chein, R. (2007). Performance analysis of nanofluid-cooled
microchannel heat sinks. International Journal of Heat and Fluid Flow, 28,
1013-1026.
Vajjha, R. S., & Das, D. K. (2009a). Experimental determination of thermal
conductivity of three nanofluids and development of new correlations.
International Journal of Heat and Mass Transfer, 52, 4675-4682.
Vajjha, R. S., & Das, D. K. (2009b). Specific heat measurement of three nanofluids and
development of new correlations. Journal of Heat Transfer, 131, 0716011-
0716017.
Vajjha, R. S., Das, D. K., & Kulkarni, D. P. (2010). Development of new correlations
for convective heat transfer and friction factor in turbulent regime for nanofluids.
International Journal of Heat and Mass Transfer, 53, 4607-4618.
Vajjha, R. S., Das, D. K., & Mahagaonkar, B. M. (2009). Density measurement of
different nanofluids and their comparison with theory. Petroleum Science and
Technology, 27(6), 612-624.
Wang, L., Sunden, B., & Manglik, R. M. (2007). Plate Heat Exchanger: Design,
Applications and Performance: WIT Press.
Wang, X. Q., & Mujumdar, A. S. (2007). Heat transfer characteristics of nanofluids: a
review. International Journal of Thermal Sciences, 46, 1-19.
White, F. M. (1999). Fluid Mechanics (4 ed.): McGraw-Hill.
Xuan, Y., & Roetzel, W. (2000). Conceptions for heat transfer correlation of nanofluids.
International Journal of Heat and Mass Transfer, 43, 3701-3707.
Yu, W., Xie, H., Chen, L., & Li, Y. (2010). Investigation on the thermal transport
properties of ethylene glycol-based nanofluids containing copper nanoparticles.
Powder Technology, 197, 218-221.
Zaleski, T., & Klepacka, K. (1992). Plate Heat Exchangers—method of calculation,
charts and guidelines for selecting plate heat exchanger configurations.
Chemical Engineering and Processing, 31, 49-56.
Zamzamian, A., Oskouie, S. N., Doosthoseini, A., Joneidi, A., & Pazouki, M. (2011).
Experimental investigation of forced convective heat transfer coefficient in
nanofluids of Al2O3/EG and CuO/EG in a double pipe and plate heat exchangers
under turbulent flow. Experimental Thermal and Fluid Science, 35, 495-502.
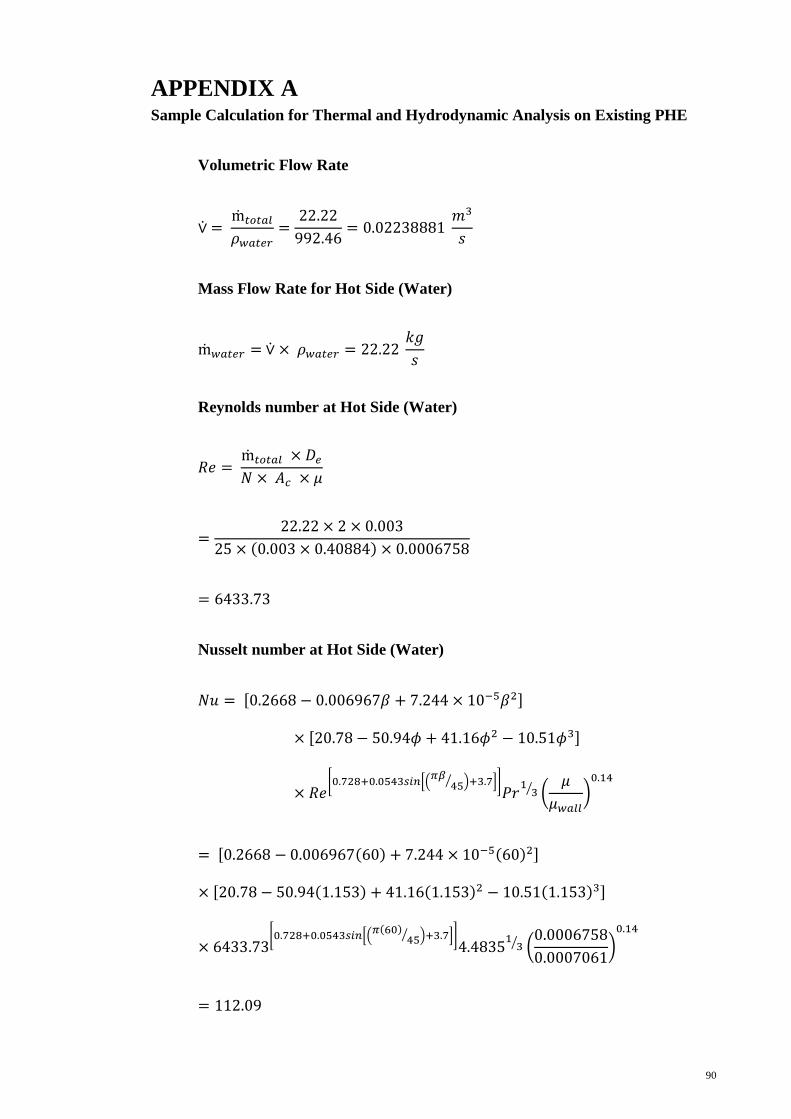
90
APPENDIX A Sample Calculation for Thermal and Hydrodynamic Analysis on Existing PHE
Volumetric Flow Rate
⩒
Mass Flow Rate for Hot Side (Water)
⩒
Reynolds number at Hot Side (Water)
Nusselt number at Hot Side (Water)
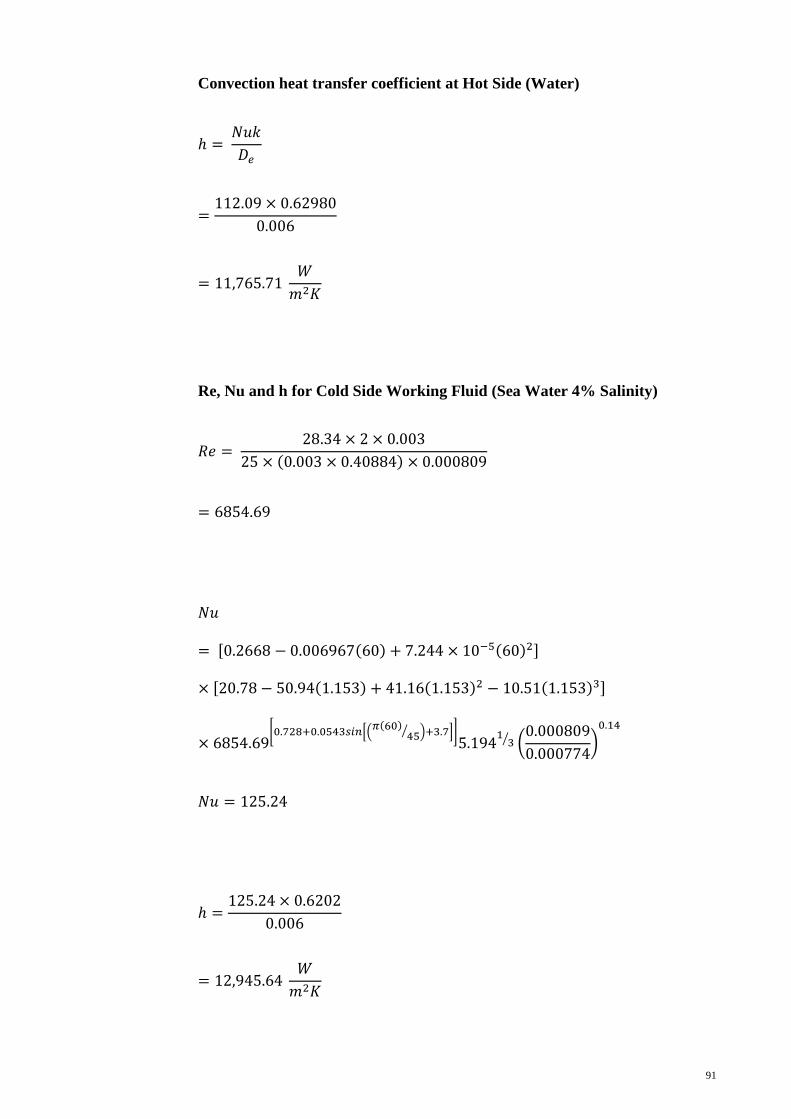
91
Convection heat transfer coefficient at Hot Side (Water)
Re, Nu and h for Cold Side Working Fluid (Sea Water 4% Salinity)

92
Overall Heat Transfer Coefficient
Heat Capacity
Heat Capacity Ratio

93
Number of Transfer Unit (NTU)
Effectiveness of PHE
Maximum Heat Transfer Rate
Actual Heat Transfer Rate of PHE

94
Pressure Drop Analysis for Hot Side Working Fluid (Water)
Friction Factor
226887
Channels Pressure Drop

95
Ports and Manifolds Pressure Drop
Pressure Drop due to Elevation Change
Negative value is taken since the direction of flow is downward
Total Pressure Drop
⩒

96
APPENDIX B Calculated Thermophysical Properties of Nanofluids
Table B1: Thermophysical Properties for Al2O3 Nanofluids
φ 0% 0.5% 1.0% 1.5% 2.0% 2.5% 3.0%
knf 0.629800 0.656598 0.672144 0.685136 0.696706 0.707322 0.717235
μnf 0.000676 0.000688 0.000701 0.000715 0.000730 0.000746 0.000762
μnf,wall 0.000706 0.000719 0.000733 0.000748 0.000763 0.000779 0.000796
ρ 992.46 1007.35 1022.24 1037.12 1052.01 1066.90 1081.79
cp,nf 4178.30 4111.04 4045.74 3982.31 3920.68 3860.77 3802.51
Prnf 4.483 4.308 4.222 4.159 4.109 4.071 4.040
Table B2: Thermophysical Properties for SiO2 25 nm Nanofluids
φ 0% 0.5% 1.0% 1.5% 2.0% 2.5% 3.0%
knf 0.629800 0.660541 0.678374 0.693278 0.706551 0.718729 0.730101
μnf 0.000676 0.000691 0.000707 0.000724 0.000742 0.000761 0.000781
μnf,wall 0.000706 0.000721 0.000738 0.000756 0.000775 0.000795 0.000816
ρ 992.46 998.60 1004.74 1010.87 1017.01 1023.15 1029.29
cp,nf 4178.30 4140.14 4102.44 4065.20 4028.41 3992.06 3956.15
Prnf 4.483 4.328 4.273 4.243 4.229 4.227 4.234

97
Table B3: Thermophysical Properties for SiO2 50 nm Nanofluids
φ 0% 0.5% 1.0% 1.5% 2.0% 2.5% 3.0%
knf 0.629800 0.653098 0.666612 0.677907 0.687966 0.697196 0.705814
μnf 0.000676 0.000688 0.000701 0.000714 0.000728 0.000743 0.000759
μnf,wall 0.000706 0.000719 0.000732 0.000746 0.000761 0.000777 0.000793
ρ 992.46 998.60 1004.74 1010.87 1017.01 1023.15 1029.29
cp,nf 4178.30 4140.14 4102.44 4065.20 4028.41 3992.06 3956.15
Prnf 4.483 4.360 4.312 4.283 4.265 4.257 4.255
Table B4: Thermophysical Properties for SiO2 100 nm Nanofluids
φ 0% 0.5% 1.0% 1.5% 2.0% 2.5% 3.0%
knf 0.629800 0.647456 0.657698 0.666259 0.673882 0.680876 0.687408
μnf 0.000676 0.000685 0.000696 0.000707 0.000718 0.000730 0.000742
μnf,wall 0.000706 0.000716 0.000727 0.000738 0.000750 0.000762 0.000775
ρ 992.46 998.60 1004.74 1010.87 1017.01 1023.15 1029.29
cp,nf 4178.30 4140.14 4102.44 4065.20 4028.41 3992.06 3956.15
Prnf 4.483 4.383 4.340 4.312 4.292 4.278 4.270

98
APPENDIX C Thermal and Hydrodynamic Performance of Existing PHE System Operating
With Nanofluids
Table C1: Convection Heat Transfer Coefficient and Heat Capacity Rate at Cold Side
Re 6854.69
Nu 125.24
hcold 12,945.64
Ccold 112,802.27
Table C2: Thermal and Hydrodynamic Performances for Al2O3 Nanofluids
⩒ 0.022389
φ 0% 0.5% 1.0% 1.5% 2.0%
ṁtotal 22.22 22.55 22.89 23.22 23.55
Re 6433.73 6413.47 6384.78 6350.52 6311.28
Thermal Performance
Nu 112.09 110.34 109.21 108.21 107.26
h 11,765.86 12,074.80 12,234.51 12,356.24 12,454.66
1/U 0.0001851 0.0001829 0.0001818 0.0001810 0.0001804
U 5403.41 5467.66 5500.17 5524.64 5544.23
Chot 92,841.83 92,717.60 92,593.37 92,469.14 92,344.91
C* 0.823 0.822 0.821 0.820 0.819
NTU 1.112 1.127 1.135 1.142 1.147
ԑ 0.551 0.555 0.557 0.559 0.561
qmax 835,576.43 834,458.37 833,340.30 832,222.24 831,104.18
q 460,743.58 463,250.84 464,414.01 465,236.02 465,851.82
Hydrodynamic Performance
ƒ 0.2269 0.2270 0.2272 0.2275 0.2278
Δpchannel 37,455.01 38,040.89 38,637.77 39,242.76 39,855.53
ΔPport 3245.57 3294.25 3342.94 3391.62 3440.31
Δpelevation 9112.93 9249.63 9386.33 9523.03 9659.73
Δptotal 31,587.65 32,085.51 32,594.38 33,111.35 33,636.10
PP 707.21 718.36 729.75 741.32 753.07

99
‗Table C2: Continue‘
φ 2.5% 3.0%
ṁtotal 23.89 24.22
Re 6267.34 6218.86
Thermal Performance
Nu 106.34 105.43
h 12,535.84 12,603.00
1/U 0.0001798 0.0001794
U 5560.25 5573.43
Chot 92,220.68 92,096.45
C* 0.818 0.816
NTU 1.152 1.156
ԑ 0.562 0.563
qmax 829,986.11 828,868.05
q 466,317.86 466,664.45
Hydrodynamic Performance
ƒ 0.2281 0.2284
Δpchannel 40,476.14 41,104.82
ΔPport 3489.00 3537.68
Δpelevation 9796.433 9933.134
Δptotal 34,168.70 34,709.37
PP 765.00 777.10

100
Table C3: Thermal and Hydrodynamic Performances for SiO2 25 nm Nanofluids
⩒ 0.022389 φ 0% 0.5% 1.0% 1.5% 2.0%
ṁtotal 22.22 22.36 22.50 22.63 22.77
Re 6433.73 6335.44 6229.62 6119.72 6006.51
Thermal Performance
Nu 112.09 109.46 107.56 105.83 104.18
h 11,765.86 12,049.94 12,161.19 12,228.13 12,267.90
1/U 0.0001851 0.0001831 0.0001823 0.0001819 0.0001816
U 5403.41 5462.55 5485.30 5498.88 5506.91
Chot 92,841.83 92,562.76 92,283.70 92,004.63 91,725.57
C* 0.823 0.821 0.818 0.816 0.813
NTU 1.112 1.128 1.136 1.142 1.147
ԑ 0.551 0.556 0.558 0.560 0.561
qmax 835,576.43 833,064.85 830,553.27 828,041.68 825,530.10
q 460,743.57 462,809.26 463,336.88 463,477.48 463,384.83
Hydrodynamic Performance
ƒ 0.2269 0.2276 0.2284 0.2292 0.2300
Δpchannel 37,455.01 37,803.02 38,163.90 38,534.15 38,913.38
ΔPport 3245.57 3265.64 3285.71 3305.78 3325.85
Δpelevation 9112.93 9169.28 9225.64 9282.00 9338.36
Δptotal 31,587.65 31,899.38 32,223.97 32,557.93 32,900.87
PP 707.21 714.19 721.46 728.93 736.61

101
‗Table C3: Continue‘
φ 2.5% 3.0%
ṁtotal 22.91 23.04
Re 5890.33 5771.39
Thermal Performance
Nu 102.58 101.01
h 12,287.65 12,291.20
1/U 0.0001815 0.0001814
U 5510.88 5511.60
Chot 91,446.50 91,167.44
C* 0.811 0.808
NTU 1.152 1.155
ԑ 0.563 0.564
qmax 823,018.52 820,506.93
q 463,122.48 462,723.97
Hydrodynamic Performance
ƒ 0.2309 0.2319
Δpchannel 39,301.66 39,699.28
ΔPport 3345.92 3366.00
Δpelevation 9394.71 9451.07
Δptotal 33,252.87 33,614.21
PP 744.49 752.58

102
Table C4: Thermal and Hydrodynamic Performances for SiO2 50 nm Nanofluids
⩒ 0.022389
φ 0% 0.5% 1.0% 1.5% 2.0%
ṁtotal 22.22 22.36 22.50 22.63 22.77
Re 6433.73 6361.36 6282.88 6201.09 6116.60
Thermal Performance
Nu 112.09 110.07 108.61 107.26 105.97
h 11,765.86 11,981.18 12,066.25 12,118.35 12,150.49
1/U 0.0001851 0.0001835 0.0001830 0.0001826 0.0001824
U 5403.41 5448.38 5465.90 5476.57 5483.12
Chot 92,841.83 92,562.76 92,283.70 92,004.63 91,725.57
C* 0.823 0.821 0.818 0.816 0.813
NTU 1.112 1.125 1.132 1.138 1.142
ԑ 0.551 0.555 0.557 0.559 0.560
qmax 835,576.43 833,064.85 830,553.27 828,041.68 825,530.10
q 460,743.57 462,218.93 462,533.46 462,557.49 462,407.27
Hydrodynamic Performance
ƒ 0.2269 0.2274 0.2280 0.2286 0.2292
Δpchannel 37,455.01 37,772.12 38,098.89 38,432.35 38,772.08
ΔPport 3245.57 3265.64 3285.71 3305.78 3325.85
Δpelevation 9112.93 9169.28 9225.64 9282.00 9338.36
Δptotal 31,587.65 31,868.47 32,158.96 32,456.14 32,759.58
PP 707.21 713.50 720.00 726.65 733.45

103
‗Table C4: Continue‘
φ 2.5% 3.0%
ṁtotal 22.91 23.04
Re 6029.70 5940.56
Thermal Performance
Nu 104.72 103.49
h 12,168.06 12,173.96
1/U 0.0001823 0.0001822
U 5486.70 5487.90
Chot 91,446.50 91,167.44
C* 0.811 0.808
NTU 1.147 1.150
ԑ 0.562 0.563
qmax 823,018.52 820,506.93
q 462,131.07 461,754.59
Hydrodynamic Performance
ƒ 0.2299 0.2305
Δpchannel 39,118.02 39,470.24
ΔPport 3345.92 3366.00
Δpelevation 9394.71 9451.07
Δptotal 33,069.23 33,385.16
PP 740.38 747.45

104
Table C5: Thermal and Hydrodynamic Performances for SiO2 100 nm Nanofluids
⩒ 0.02239
φ 0% 0.5% 1.0% 1.5% 2.0%
ṁtotal 22.22 22.36 22.50 22.63 22.77
Re 6433.73 6382.42 6326.14 6267.17 6206.02
Thermal Performance
Nu 112.09 110.55 109.43 108.39 107.40
h 11,765.86 11,929.77 11,995.34 12,036.28 12,062.42
1/U 0.0001851 0.0001839 0.0001834 0.0001832 0.0001830
U 5403.41 5437.72 5451.31 5459.75 5465.12
Chot 92,841.83 92,562.76 92,283.70 92,004.63 91,725.57
C* 0.823 0.821 0.818 0.816 0.813
NTU 1.112 1.123 1.129 1.134 1.139
ԑ 0.551 0.554 0.556 0.558 0.559
qmax 835,576.43 833,064.85 830,553.27 828,041.68 825,530.10
q 460,743.57 461,774.08 461,927.00 461,861.06 461,664.26
Hydrodynamic Performance
ƒ 0.2269 0.2273 0.2277 0.2281 0.2285
Δpchannel 37,455.01 37,747.13 38,046.57 38,350.84 38,659.55
ΔPport 3245.57 3265.64 3285.71 3305.78 3325.85
Δpelevation 9112.93 9169.28 9225.64 9282.00 9338.36
Δptotal 31,587.65 31,843.48 32,106.63 32,374.63 32,647.04
PP 707.21 712.94 718.83 724.83 730.93

105
‗Table C5: Continue‘
φ 2.5% 3.0%
ṁtotal 22.91 23.04
Re 6142.90 6077.97
Thermal Performance
Nu 106.43 105.48
h 12,077.86 12,084.81
1/U 0.0001829 0.0001828
U 5468.29 5469.71
Chot 91,446.50 91,167.44
C* 0.811 0.808
NTU 1.143 1.147
ԑ 0.561 0.562
qmax 823,018.52 820,506.93
q 461,373.24 461,007.62
Hydrodynamic Performance
ƒ 0.2290 0.2295
Δpchannel 38,972.56 39,289.88
ΔPport 3345.92 3366.00
Δpelevation 9394.71 9451.07
Δptotal 32,923.77 33,204.81
PP 737.12 743.42

106
APPENDIX D Require Heat Transfer Area at a Given NTU Value and Its Corresponding
Pressure Drop for Al2O3 Nanofluids
Table D1: Effectiveness, Minimum Heat Capacity Rate, Mass Flow Rate and
Convective Heat Transfer Coefficient for Cold Side Working Fluid
NTU 1 2 3 4 5
ԑ 0.500 0.667 0.750 0.800 0.833
Cmin 102,222.22 76,666.67 68,148.15 63,888.89 61,333.33
ṁtotal, cold 25.68 19.26 17.12 16.05 15.41
ṁchannel, cold 1.027 0.770 0.685 0.642 0.616
Re 6211.77 4658.83 4141.18 3882.36 3727.06
Nu 115.95 92.59 84.44 80.28 77.76
hcold 11,985.80 9570.44 8728.04 8298.33 8037.52
Table D2: Hot Side Channel Mass Flow Rate, ṁchannel, hot
NTU
φ 1 2 3 4 5
0% 0.979 0.734 0.652 0.612 0.587
0.5% 0.995 0.746 0.663 0.622 0.597
1.0% 1.011 0.758 0.674 0.632 0.606
1.5% 1.027 0.770 0.685 0.642 0.616
2.0% 1.043 0.782 0.695 0.652 0.626
2.5% 1.059 0.794 0.706 0.662 0.635
3.0% 1.075 0.806 0.717 0.672 0.645

107
Table D3: Hot Side Reynolds Number, Renf
NTU
φ 1 2 3 4 5
0% 7083.76 5312.82 4722.51 4427.35 4250.26
0.5% 7070.92 5303.19 4713.95 4419.33 4242.55
1.0% 7048.74 5286.55 4699.16 4405.46 4229.24
1.5% 7020.33 5265.25 4680.22 4387.71 4212.20
2.0% 6986.34 5239.75 4657.56 4366.46 4191.80
2.5% 6947.05 5210.28 4631.36 4341.90 4168.23
3.0% 6902.61 5176.96 4601.74 4314.13 4141.57
Table D4: Hot Side Nusselt Number, Nunf
NTU
φ 1 2 3 4 5
0% 120.86 96.50 88.01 83.68 81.05
0.5% 119.09 95.09 86.72 82.45 79.86
1.0% 118.00 94.22 85.93 81.70 79.13
1.5% 117.04 93.45 85.23 81.03 78.48
2.0% 116.13 92.73 84.57 80.40 77.88
2.5% 115.26 92.03 83.93 79.80 77.29
3.0% 114.39 91.34 83.30 79.20 76.71
Table D5: Hot Side Convective Heat Transfer Coefficient, hnf
NTU
φ 1 2 3 4 5
0% 12,685.97 10,129.51 9237.90 8783.09 8507.05
0.5% 13,032.71 10,406.37 9490.40 9023.16 8739.57
1.0% 13,218.95 10,555.08 9626.02 9152.10 8864.46
1.5% 13,364.50 10,671.30 9732.01 9252.87 8962.06
2.0% 13,485.13 10,767.62 9819.85 9336.38 9042.95
2.5% 13,587.32 10,849.22 9894.27 9407.14 9111.48
3.0% 13,674.53 10,918.85 9957.77 9467.52 9169.96

108
Table D6: Overall Heat Transfer Coefficient, U
NTU
φ 1 2 3 4 5
0% 5402.77 4423.98 4070.77 3888.14 3776.48
0.5% 5464.69 4475.99 4119.06 3934.48 3821.61
1.0% 5497.16 4503.28 4144.40 3958.80 3845.30
1.5% 5522.17 4524.30 4163.93 3977.54 3863.56
2.0% 5542.66 4541.52 4179.92 3992.89 3878.51
2.5% 5559.85 4555.97 4193.35 4005.78 3891.06
3.0% 5574.39 4568.21 4204.71 4016.69 3901.69
Table D7: Heat Transfer Area Required, Arequired
NTU
φ 1 2 3 4 5
0% 18.92 34.66 50.22 65.73 81.20
0.5% 18.71 34.26 49.63 64.95 80.25
1.0% 18.60 34.05 49.33 64.55 79.75
1.5% 18.51 33.89 49.10 64.25 79.37
2.0% 18.44 33.76 48.91 64.00 79.07
2.5% 18.39 33.66 48.75 63.80 78.81
3.0% 18.34 33.57 48.62 63.62 78.60
Table D8: Friction Factor for Hot Side Fluid, ƒ
NTU
φ 1 2 3 4 5
0% 0.2226 0.2358 0.2414 0.2445 0.2465
0.5% 0.2226 0.2358 0.2415 0.2446 0.2466
1.0% 0.2228 0.2360 0.2416 0.2448 0.2468
1.5% 0.2230 0.2362 0.2418 0.2450 0.2470
2.0% 0.2232 0.2364 0.2421 0.2452 0.2472
2.5% 0.2234 0.2367 0.2423 0.2455 0.2475
3.0% 0.2237 0.2370 0.2426 0.2458 0.2478

109
Table D9: Estimated Port to Port Vertical Length, L
NTU
φ 1 2 3 4 5
0% 0.944 1.730 2.507 3.281 4.054
0.5% 0.934 1.710 2.478 3.242 4.006
1.0% 0.928 1.700 2.462 3.222 3.981
1.5% 0.924 1.692 2.451 3.207 3.962
2.0% 0.921 1.685 2.442 3.195 3.947
2.5% 0.918 1.680 2.434 3.185 3.934
3.0% 0.915 1.675 2.427 3.176 3.923
Table D10: Channel Pressure Drop, Δpchannel
NTU
φ 1 2 3 4 5
0% 44,941.23 49,055.16 57,504.22 67,003.88 76,918.29
0.5% 45,235.90 49,362.38 57,858.25 67,412.72 77,385.04
1.0% 45,784.60 49,953.48 58,547.84 68,214.24 78,303.76
1.5% 46,402.87 50,622.06 59,328.93 69,122.76 79,345.59
2.0% 47,067.00 51,341.61 60,170.13 70,101.56 80,468.26
2.5% 47,767.72 52,101.75 61,059.19 71,136.28 81,655.24
3.0% 48,500.59 52,897.48 61,990.18 72,220.00 82,898.56
Table D11: Port Pressure Drop, Δpport
NTU
φ 1 2 3 4 5
0% 3934.54 2213.18 1748.68 1536.93 1416.43
0.5% 4004.27 2252.40 1779.67 1564.17 1441.54
1.0% 4074.36 2291.83 1810.83 1591.55 1466.77
1.5% 4144.81 2331.46 1842.14 1619.07 1492.13
2.0% 4215.63 2371.29 1873.61 1646.73 1517.63
2.5% 4286.81 2411.33 1905.25 1674.54 1543.25
3.0% 4358.37 2451.58 1937.05 1702.49 1569.01

110
Table D12: Pressure Drop Due to Elevation Change, Δpelevation
NTU
φ 1 2 3 4 5
0% 9195.21 16,844.43 24,407.97 31,943.01 39,465.02
0.5% 9227.39 16,898.45 24,483.66 32,040.32 39,583.92
1.0% 9308.45 17,044.28 24,693.58 32,314.10 39,921.47
1.5% 9401.24 17,212.16 24,935.74 32,630.28 40,311.53
2.0% 9500.95 17,393.02 25,196.88 32,971.41 40,732.52
2.5% 9605.62 17,583.20 25,471.65 33,330.45 41,175.69
3.0% 9714.24 17,780.82 25,757.28 33,703.77 41,636.56
Table D13: Total Pressure Drop, Δptotal
NTU
φ 1 2 3 4 5
0% 39,680.56 34,423.91 34,844.93 36,597.80 38,869.71
0.5% 40,012.78 34,716.33 35,154.26 36,936.57 39,242.65
1.0% 40,550.51 35,201.03 35,665.09 37,491.68 39,849.05
1.5% 41,146.44 35,741.36 36,235.33 38,111.55 40,526.19
2.0% 41,781.68 36,319.88 36,846.86 38,776.88 41,253.37
2.5% 42,448.92 36,929.87 37,492.79 39,480.37 42,022.80
3.0% 43,144.72 37,568.24 38,169.95 40,218.72 42,831.01

111
APPENDIX E Require Heat Transfer Area at a Given NTU Value and Its Corresponding
Pressure Drop for SiO2-25nm Nanofluids
Table E1: Effectiveness, Minimum Heat Capacity Rate, Mass Flow Rate and
Convective Heat Transfer Coefficient for Cold Side Working Fluid
NTU 1 2 3 4 5
ԑ 0.500 0.667 0.750 0.800 0.833
Cmin 102,222.22 76,666.67 68,148.15 63,888.89 61,333.33
ṁtotal, cold 25.68 19.26 17.12 16.05 15.41
ṁchannel, cold 1.027 0.770 0.685 0.642 0.616
Re 6211.77 4658.83 4141.18 3882.36 3727.06
Nu 115.95 92.59 84.44 80.28 77.76
hcold 11,985.80 9570.44 8728.04 8298.33 8037.52
Table E2: Hot Side Channel Mass Flow Rate, ṁchannel, hot
NTU
φ 1 2 3 4 5
0% 0.979 0.734 0.652 0.612 0.587
0.5% 0.988 0.741 0.658 0.617 0.593
1.0% 0.997 0.748 0.664 0.623 0.598
1.5% 1.006 0.754 0.671 0.629 0.603
2.0% 1.015 0.761 0.677 0.634 0.609
2.5% 1.024 0.768 0.683 0.640 0.615
3.0% 1.034 0.775 0.689 0.646 0.620

112
Table E3: Hot Side Reynolds Number, Renf
NTU
φ 1 2 3 4 5
0% 7083.76 5312.82 4722.51 4427.35 4250.26
0.5% 6996.58 5247.43 4664.38 4372.86 4197.95
1.0% 6900.52 5175.39 4600.34 4312.82 4140.31
1.5% 6799.35 5099.51 4532.90 4249.59 4079.61
2.0% 6693.86 5020.40 4462.58 4183.66 4016.32
2.5% 6584.42 4938.32 4389.61 4115.26 3950.65
3.0% 6471.21 4853.41 4314.14 4044.51 3882.73
Table E4: Hot Side Nusselt Number, Nunf
NTU
φ 1 2 3 4 5
0% 120.86 96.50 88.01 83.68 81.05
0.5% 118.29 94.45 86.14 81.90 79.33
1.0% 116.52 93.04 84.85 80.67 78.14
1.5% 114.92 91.76 83.68 79.56 77.06
2.0% 113.39 90.54 82.57 78.51 76.04
2.5% 111.92 89.36 81.50 77.49 75.05
3.0% 110.47 88.21 80.44 76.48 74.08
Table E5: Hot Side Convective Heat Transfer Coefficient, hnf
NTU
φ 1 2 3 4 5
0% 12,685.97 10,129.51 9237.90 8783.09 8507.05
0.5% 13,022.89 10,398.53 9483.25 9016.36 8732.98
1.0% 13,174.22 10,519.36 9593.44 9121.13 8834.46
1.5% 13,278.14 10,602.35 9669.12 9193.08 8904.15
2.0% 13,353.02 10,662.14 9723.65 9244.92 8954.36
2.5% 13,406.44 10,704.79 9762.55 9281.91 8990.18
3.0% 13,442.41 10,733.51 9788.74 9306.81 9014.30

113
Table E6: Overall Heat Transfer Coefficient, U
NTU
φ 1 2 3 4 5
0% 5402.77 4423.98 4070.77 3888.14 3776.48
0.5% 5462.96 4474.54 4117.71 3933.19 3820.35
1.0% 5489.41 4496.76 4138.35 3953.00 3839.65
1.5% 5507.37 4511.86 4152.37 3966.45 3852.75
2.0% 5520.21 4522.65 4162.39 3976.07 3862.12
2.5% 5529.32 4530.31 4169.51 3982.89 3868.77
3.0% 5535.43 4535.44 4174.28 3987.47 3873.23
Table E7: Heat Transfer Area Required, Arequired
NTU
φ 1 2 3 4 5
0% 18.92 34.66 50.22 65.73 81.20
0.5% 18.71 34.27 49.65 64.97 80.27
1.0% 18.62 34.10 49.40 64.65 79.87
1.5% 18.56 33.98 49.24 64.43 79.60
2.0% 18.52 33.90 49.12 64.27 79.40
2.5% 18.49 33.85 49.03 64.16 79.27
3.0% 18.47 33.81 48.98 64.09 79.18
Table E8: Friction Factor for Hot Side fluid, ƒ
NTU
φ 1 2 3 4 5
0% 0.2226 0.2358 0.2414 0.2445 0.2465
0.5% 0.2231 0.2363 0.2420 0.2451 0.2471
1.0% 0.2237 0.2370 0.2427 0.2458 0.2478
1.5% 0.2244 0.2377 0.2434 0.2465 0.2486
2.0% 0.2251 0.2384 0.2441 0.2473 0.2493
2.5% 0.2258 0.2392 0.2449 0.2481 0.2502
3.0% 0.2266 0.2401 0.2458 0.2490 0.2510

114
Table E9: Estimated Port to Port Vertical Length, L
NTU
φ 1 2 3 4 5
0% 0.944 1.730 2.507 3.281 4.054
0.5% 0.934 1.711 2.478 3.243 4.007
1.0% 0.930 1.702 2.466 3.227 3.987
1.5% 0.927 1.696 2.458 3.216 3.973
2.0% 0.924 1.692 2.452 3.208 3.964
2.5% 0.923 1.690 2.448 3.203 3.957
3.0% 0.922 1.688 2.445 3.199 3.952
Table E10: Channel Pressure Drop, Δpchannel
NTU
φ 1 2 3 4 5
0% 44,941.23 49,055.16 57,504.22 67,003.88 76,918.29
0.5% 45,102.72 49,217.45 57,688.55 67,215.10 77,158.26
1.0% 45,560.80 49,711.12 58,264.55 67,884.64 77,925.74
1.5% 46,103.39 50,298.86 58,951.62 68,684.07 78,842.64
2.0% 46,703.46 50,950.45 59,713.99 69,571.51 79,860.79
2.5% 47,350.73 51,654.36 60,538.04 70,531.02 80,961.81
3.0% 48,040.52 52,405.34 61,417.53 71,555.31 82,137.30
Table E11: Port Pressure Drop, Δpport
NTU
φ 1 2 3 4 5
0% 3934.54 2213.18 1748.68 1536.93 1416.43
0.5% 3982.78 2240.31 1770.12 1555.77 1433.80
1.0% 4031.53 2267.73 1791.79 1574.82 1451.35
1.5% 4080.80 2295.45 1813.69 1594.06 1469.09
2.0% 4130.60 2323.46 1835.82 1613.51 1487.01
2.5% 4180.93 2351.77 1858.19 1633.17 1505.13
3.0% 4231.80 2380.39 1880.80 1653.05 1523.45

115
Table E12: Pressure Drop Due to Elevation Change, Δpelevation
NTU
φ 1 2 3 4 5
0% 9195.21 16,844.43 24,407.97 31,943.01 39,465.02
0.5% 9150.13 16,757.10 24,278.93 31,772.45 39,253.03
1.0% 9162.01 16,776.76 24,306.32 31,807.56 39,295.84
1.5% 9187.92 16,822.77 24,372.24 31,893.31 39,401.39
2.0% 9222.20 16,884.52 24,461.17 32,009.32 39,544.44
2.5% 9262.58 16,957.71 24,566.82 32,147.32 39,714.73
3.0% 9307.86 17,040.12 24,685.95 32,303.03 39,906.96
Table E13: Total Pressure Drop, Δptotal
NTU
φ 1 2 3 4 5
0% 39,680.56 34,423.91 34,844.93 36,597.80 38,869.71
0.5% 39,935.37 34,700.67 35,179.74 36,998.42 39,339.03
1.0% 40,430.32 35,202.09 35,750.02 37,651.90 40,081.25
1.5% 40,996.27 35,771.54 36,393.07 38,384.82 40,910.34
2.0% 41,611.85 36,389.39 37,088.65 39,175.71 41,803.36
2.5% 42,269.08 37,048.42 37,829.41 40,016.88 42,752.22
3.0% 42,964.46 37,745.60 38,612.38 40,905.32 43,753.79

116
APPENDIX F Require Heat Transfer Area at a Given NTU Value and Its Corresponding
Pressure Drop for SiO2-50nm Nanofluids
Table F1: Effectiveness, Minimum Heat Capacity Rate, Mass Flow Rate and
Convective Heat Transfer Coefficient for Cold Side Working Fluid
NTU 1 2 3 4 5
ԑ 0.500 0.667 0.750 0.800 0.833
Cmin 102,222.22 76,666.67 68,148.15 63,888.89 61,333.33
ṁtotal, Cold 25.68 19.26 17.12 16.05 15.41
ṁchannel, Cold 1.027 0.770 0.685 0.642 0.616
Re 6211.77 4658.83 4141.18 3882.36 3727.06
Nu 115.95 92.59 84.44 80.28 77.76
hCold 11,985.80 9570.44 8728.04 8298.33 8037.52
Table F2: Hot Side Channel Mass Flow Rate, ṁchannel, Hot
NTU
φ 1 2 3 4 5
0% 0.979 0.734 0.652 0.612 0.587
0.5% 0.988 0.741 0.658 0.617 0.593
1.0% 0.997 0.748 0.664 0.623 0.598
1.5% 1.006 0.754 0.671 0.629 0.603
2.0% 1.015 0.761 0.677 0.634 0.609
2.5% 1.024 0.768 0.683 0.640 0.615
3.0% 1.034 0.775 0.689 0.646 0.620

117
Table F3: Hot Side Reynolds Number, Renf
NTU
φ 1 2 3 4 5
0% 7083.76 5312.82 4722.51 4427.35 4250.26
0.5% 7025.21 5268.90 4683.47 4390.75 4215.12
1.0% 6959.51 5219.63 4639.68 4349.70 4175.71
1.5% 6889.75 5167.31 4593.17 4306.09 4133.85
2.0% 6816.55 5112.41 4544.37 4260.34 4089.93
2.5% 6740.22 5055.16 4493.48 4212.63 4044.13
3.0% 6660.90 4995.68 4440.60 4163.06 3996.54
Table F4: Hot Side Nusselt Number, Nunf
NTU
φ 1 2 3 4 5
0% 120.86 96.50 88.01 83.68 81.05
0.5% 118.96 94.99 86.63 82.36 79.77
1.0% 117.65 93.94 85.67 81.46 78.90
1.5% 116.47 93.00 84.81 80.64 78.10
2.0% 115.34 92.10 83.99 79.86 77.35
2.5% 114.25 91.23 83.20 79.10 76.62
3.0% 113.18 90.37 82.42 78.36 75.90
Table F5: Hot Side Convective Heat Transfer Coefficient, hnf
NTU
φ 1 2 3 4 5
0% 12,685.97 10,129.51 9237.90 8783.09 8507.05
0.5% 12,948.59 10,339.20 9429.14 8964.91 8683.15
1.0% 13,071.36 10,437.23 9518.54 9049.91 8765.48
1.5% 13,158.95 10,507.17 9582.32 9110.56 8824.22
2.0% 13,225.23 10,560.09 9630.59 9156.45 8868.67
2.5% 13,275.96 10,600.60 9667.53 9191.57 8902.68
3.0% 13,314.19 10,631.13 9695.37 9218.04 8928.32

118
Table F6: Overall Heat Transfer Coefficient, U
NTU
φ 1 2 3 4 5
0% 5402.77 4423.98 4070.77 3888.14 3776.48
0.5% 5449.84 4463.51 4107.48 3923.37 3810.79
1.0% 5471.47 4481.69 4124.35 3939.56 3826.56
1.5% 5486.76 4494.53 4136.28 3951.01 3837.71
2.0% 5498.25 4504.19 4145.25 3959.61 3846.09
2.5% 5507.00 4511.54 4152.08 3966.17 3852.48
3.0% 5513.56 4517.06 4157.20 3971.09 3857.27
Table F7: Heat Transfer Area Required, Arequired
NTU
φ 1 2 3 4 5
0% 18.92 34.66 50.22 65.73 81.20
0.5% 18.76 34.35 49.77 65.14 80.47
1.0% 18.68 34.21 49.57 64.87 80.14
1.5% 18.63 34.12 49.43 64.68 79.91
2.0% 18.59 34.04 49.32 64.54 79.73
2.5% 18.56 33.99 49.24 64.43 79.60
3.0% 18.54 33.95 49.18 64.35 79.50
Table F8: Friction Factor for Hot Side Fluid, ƒ
NTU
φ 1 2 3 4 5
0% 0.2226 0.2358 0.2414 0.2445 0.2465
0.5% 0.2229 0.2361 0.2418 0.2449 0.2469
1.0% 0.2233 0.2366 0.2422 0.2454 0.2474
1.5% 0.2238 0.2371 0.2427 0.2459 0.2479
2.0% 0.2243 0.2376 0.2432 0.2464 0.2484
2.5% 0.2248 0.2381 0.2438 0.2470 0.2490
3.0% 0.2253 0.2387 0.2444 0.2476 0.2496

119
Table F9: Estimated Port to Port Vertical Length, L
NTU
φ 1 2 3 4 5
0% 0.944 1.730 2.507 3.281 4.054
0.5% 0.936 1.715 2.485 3.251 4.017
1.0% 0.933 1.708 2.474 3.238 4.000
1.5% 0.930 1.703 2.467 3.229 3.989
2.0% 0.928 1.699 2.462 3.222 3.980
2.5% 0.927 1.697 2.458 3.216 3.974
3.0% 0.925 1.694 2.455 3.212 3.969
Table F10: Channel Pressure Drop, Δpchannel
NTU
φ 1 2 3 4 5
0% 44,941.23 49,055.16 57,504.22 67,003.88 76,918.29
0.5% 45,174.34 49,298.65 57,785.02 67,328.28 77,288.73
1.0% 45,632.32 49,793.36 58,362.74 68,000.11 78,059.04
1.5% 46,154.35 50,359.37 59,024.61 68,770.35 78,942.57
2.0% 46,719.77 50,973.53 59,743.28 69,606.98 79,902.45
2.5% 47,320.52 51,626.84 60,508.09 70,497.52 80,924.33
3.0% 47,952.76 52,315.00 61,313.94 71,436.00 82,001.32
Table F11: Port Pressure Drop, Δpport
NTU
φ 1 2 3 4 5
0% 3934.54 2213.18 1748.68 1536.93 1416.43
0.5% 3982.78 2240.31 1770.12 1555.77 1433.80
1.0% 4031.53 2267.73 1791.79 1574.82 1451.35
1.5% 4080.80 2295.45 1813.69 1594.06 1469.09
2.0% 4130.60 2323.46 1835.82 1613.51 1487.01
2.5% 4180.93 2351.77 1858.19 1633.17 1505.13
3.0% 4231.80 2380.39 1880.80 1653.05 1523.45
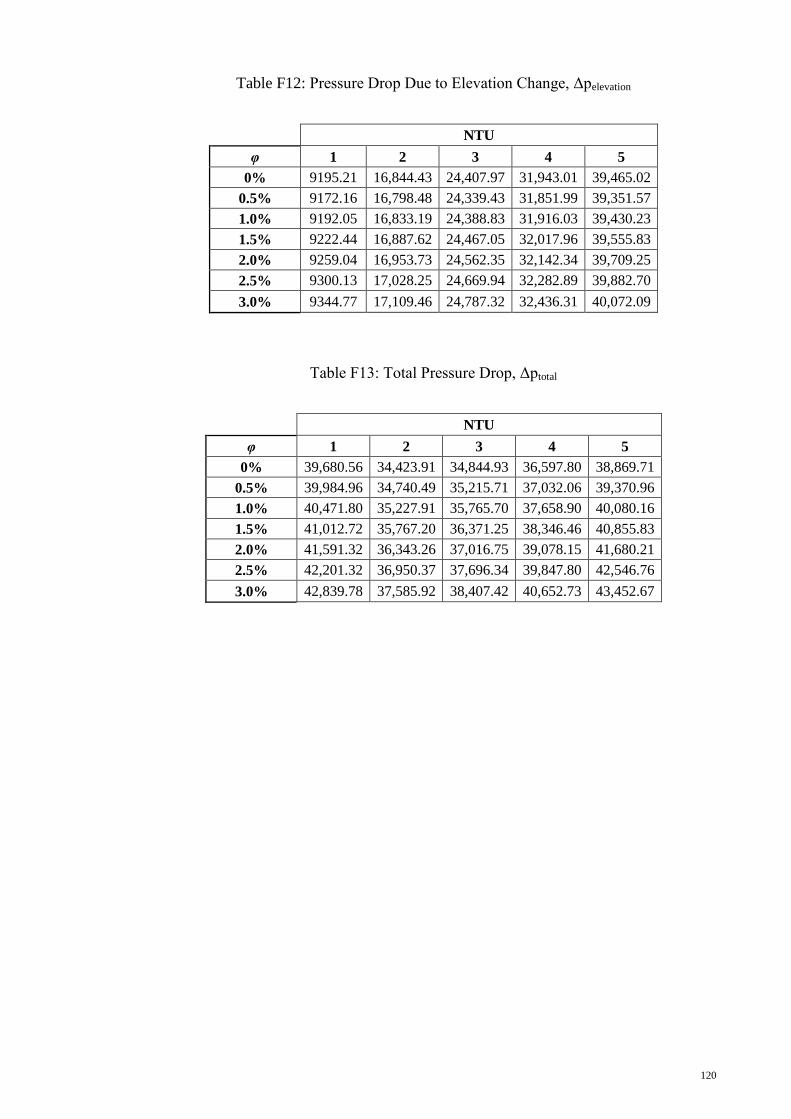
120
Table F12: Pressure Drop Due to Elevation Change, Δpelevation
NTU
φ 1 2 3 4 5
0% 9195.21 16,844.43 24,407.97 31,943.01 39,465.02
0.5% 9172.16 16,798.48 24,339.43 31,851.99 39,351.57
1.0% 9192.05 16,833.19 24,388.83 31,916.03 39,430.23
1.5% 9222.44 16,887.62 24,467.05 32,017.96 39,555.83
2.0% 9259.04 16,953.73 24,562.35 32,142.34 39,709.25
2.5% 9300.13 17,028.25 24,669.94 32,282.89 39,882.70
3.0% 9344.77 17,109.46 24,787.32 32,436.31 40,072.09
Table F13: Total Pressure Drop, Δptotal
NTU
φ 1 2 3 4 5
0% 39,680.56 34,423.91 34,844.93 36,597.80 38,869.71
0.5% 39,984.96 34,740.49 35,215.71 37,032.06 39,370.96
1.0% 40,471.80 35,227.91 35,765.70 37,658.90 40,080.16
1.5% 41,012.72 35,767.20 36,371.25 38,346.46 40,855.83
2.0% 41,591.32 36,343.26 37,016.75 39,078.15 41,680.21
2.5% 42,201.32 36,950.37 37,696.34 39,847.80 42,546.76
3.0% 42,839.78 37,585.92 38,407.42 40,652.73 43,452.67

121
APPENDIX G Require Heat Transfer Area at a Given NTU Value and Its Corresponding
Pressure Drop for SiO2-100nm Nanofluids
Table G1: Effectiveness, Minimum Heat Capacity Rate, Mass Flow Rate and
Convective Heat Transfer Coefficient for Cold Side Working Fluid
NTU 1 2 3 4 5
ԑ 0.500 0.667 0.750 0.800 0.833
Cmin 102,222.22 76,666.67 68,148.15 63,888.89 61,333.33
ṁtotal, cold 25.68 19.26 17.12 16.05 15.41
ṁchannel, cold 1.027 0.770 0.685 0.642 0.616
Re 6211.77 4658.83 4141.18 3882.36 3727.06
Nu 115.95 92.59 84.44 80.28 77.76
hcold 11,985.80 9570.44 8728.04 8298.33 8037.52
Table G2: Hot Side Channel Mass Flow Rate, ṁchannel, Hot
NTU
φ 1 2 3 4 5
0% 0.979 0.734 0.652 0.612 0.587
0.5% 0.988 0.741 0.658 0.617 0.593
1.0% 0.997 0.748 0.664 0.623 0.598
1.5% 1.006 0.754 0.671 0.629 0.603
2.0% 1.015 0.761 0.677 0.634 0.609
2.5% 1.024 0.768 0.683 0.640 0.615
3.0% 1.034 0.775 0.689 0.646 0.620

122
Table G3: Hot Side Reynolds Number, Renf
NTU
φ 1 2 3 4 5
0% 7083.76 5312.82 4722.51 4427.35 4250.26
0.5% 7048.46 5286.34 4698.97 4405.29 4229.08
1.0% 7007.43 5255.58 4671.62 4379.65 4204.46
1.5% 6963.18 5222.38 4642.12 4351.98 4177.91
2.0% 6916.21 5187.15 4610.80 4322.63 4149.72
2.5% 6866.76 5150.07 4577.84 4291.73 4120.06
3.0% 6814.97 5111.23 4543.32 4259.36 4088.98
Table G4: Hot Side Nusselt Number, Nunf
NTU
φ 1 2 3 4 5
0% 120.86 96.50 88.01 83.68 81.05
0.5% 119.48 95.40 87.01 82.72 80.12
1.0% 118.55 94.66 86.32 82.07 79.50
1.5% 117.70 93.98 85.71 81.49 78.93
2.0% 116.90 93.34 85.13 80.93 78.39
2.5% 116.12 92.72 84.56 80.40 77.87
3.0% 115.36 92.11 84.01 79.87 77.36
Table G5: Hot Side Convective Heat Transfer Coefficient, hnf
NTU
φ 1 2 3 4 5
0% 12,685.97 10,129.51 9237.90 8783.09 8507.05
0.5% 12,893.03 10,294.84 9388.68 8926.45 8645.90
1.0% 12,994.54 10,375.89 9462.60 8996.73 8713.97
1.5% 13,069.82 10,436.00 9517.42 9048.85 8764.45
2.0% 13,129.37 10,483.55 9560.79 9090.08 8804.39
2.5% 13,177.55 10,522.03 9595.87 9123.44 8836.70
3.0% 13,216.69 10,553.28 9624.37 9150.54 8862.94

123
Table G6: Overall Heat Transfer Coefficient, U
NTU
φ 1 2 3 4 5
0% 5402.77 4423.98 4070.77 3888.14 3776.48
0.5% 5439.97 4455.22 4099.78 3915.98 3803.59
1.0% 5457.96 4470.34 4113.81 3929.45 3816.71
1.5% 5471.20 4481.46 4124.14 3939.36 3826.36
2.0% 5481.61 4490.20 4132.26 3947.15 3833.96
2.5% 5489.99 4497.25 4138.80 3953.43 3840.07
3.0% 5496.77 4502.95 4144.10 3958.51 3845.02
Table G7: Heat Transfer Area Required, Arequired
NTU
φ 1 2 3 4 5
0% 18.92 34.66 50.22 65.73 81.20
0.5% 18.79 34.42 49.87 65.26 80.63
1.0% 18.73 34.30 49.70 65.04 80.35
1.5% 18.68 34.22 49.57 64.87 80.15
2.0% 18.65 34.15 49.48 64.74 79.99
2.5% 18.62 34.09 49.40 64.64 79.86
3.0% 18.60 34.05 49.33 64.56 79.76
Table G8: Friction Factor for Hot Side Fluid, ƒ
NTU
φ 1 2 3 4 5
0% 0.2226 0.2358 0.2414 0.2445 0.2465
0.5% 0.2228 0.2360 0.2416 0.2448 0.2468
1.0% 0.2230 0.2363 0.2419 0.2451 0.2471
1.5% 0.2233 0.2366 0.2422 0.2454 0.2474
2.0% 0.2236 0.2369 0.2425 0.2457 0.2477
2.5% 0.2239 0.2372 0.2429 0.2461 0.2481
3.0% 0.2243 0.2376 0.2433 0.2464 0.2484
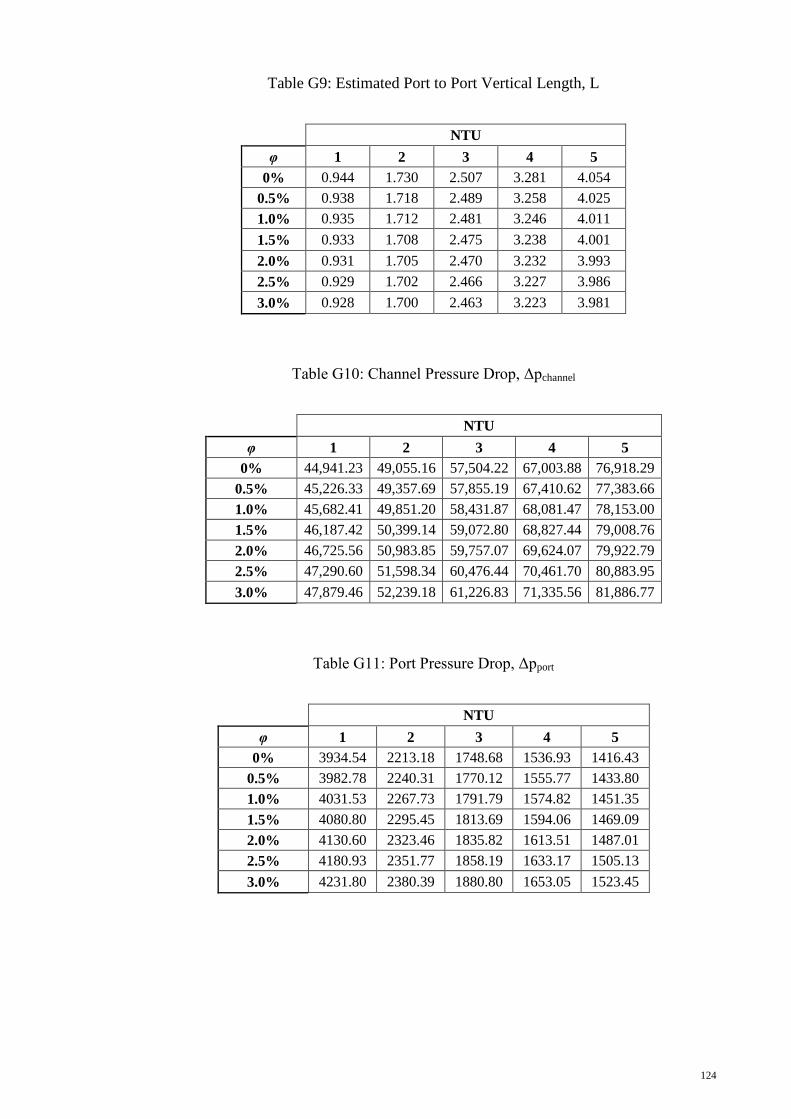
124
Table G9: Estimated Port to Port Vertical Length, L
NTU
φ 1 2 3 4 5
0% 0.944 1.730 2.507 3.281 4.054
0.5% 0.938 1.718 2.489 3.258 4.025
1.0% 0.935 1.712 2.481 3.246 4.011
1.5% 0.933 1.708 2.475 3.238 4.001
2.0% 0.931 1.705 2.470 3.232 3.993
2.5% 0.929 1.702 2.466 3.227 3.986
3.0% 0.928 1.700 2.463 3.223 3.981
Table G10: Channel Pressure Drop, Δpchannel
NTU
φ 1 2 3 4 5
0% 44,941.23 49,055.16 57,504.22 67,003.88 76,918.29
0.5% 45,226.33 49,357.69 57,855.19 67,410.62 77,383.66
1.0% 45,682.41 49,851.20 58,431.87 68,081.47 78,153.00
1.5% 46,187.42 50,399.14 59,072.80 68,827.44 79,008.76
2.0% 46,725.56 50,983.85 59,757.07 69,624.07 79,922.79
2.5% 47,290.60 51,598.34 60,476.44 70,461.70 80,883.95
3.0% 47,879.46 52,239.18 61,226.83 71,335.56 81,886.77
Table G11: Port Pressure Drop, Δpport
NTU
φ 1 2 3 4 5
0% 3934.54 2213.18 1748.68 1536.93 1416.43
0.5% 3982.78 2240.31 1770.12 1555.77 1433.80
1.0% 4031.53 2267.73 1791.79 1574.82 1451.35
1.5% 4080.80 2295.45 1813.69 1594.06 1469.09
2.0% 4130.60 2323.46 1835.82 1613.51 1487.01
2.5% 4180.93 2351.77 1858.19 1633.17 1505.13
3.0% 4231.80 2380.39 1880.80 1653.05 1523.45

125
Table G12: Pressure Drop Due to Elevation Change, Δpelevation
NTU
φ 1 2 3 4 5
0% 9195.21 16,844.43 24,407.97 31,943.01 39,465.02
0.5% 9188.80 16,829.73 24,385.12 31,912.06 39,425.99
1.0% 9214.80 16,875.92 24,451.30 31,998.16 39,531.99
1.5% 9248.66 16,936.88 24,539.07 32,112.64 39,673.14
2.0% 9287.15 17,006.52 24,639.54 32,243.83 39,834.98
2.5% 9328.93 17,082.36 24,749.06 32,386.92 40,011.58
3.0% 9373.32 17,163.09 24,865.73 32,539.39 40,199.80
Table G13: Total Pressure Drop, Δptotal
NTU
φ 1 2 3 4 5
0% 39,680.56 34,423.91 34,844.93 36,597.80 38,869.71
0.5% 40,020.31 34,768.27 35,240.19 37,054.34 39,391.47
1.0% 40,499.14 35,243.01 35,772.36 37,658.12 40,072.37
1.5% 41,019.56 35,757.72 36,347.42 38,308.86 40,804.71
2.0% 41,569.01 36,300.79 36,953.36 38,993.76 41,574.82
2.5% 42,142.59 36,867.75 37,585.57 39,707.96 42,377.51
3.0% 42,737.94 37,456.47 38,241.90 40,449.22 43,210.41