performance indicators and budgeting · performance indicators and budgeting board of control...
TRANSCRIPT

Board of Control Presentation January 24, 1997
Performance Indicators and Budgeting
Board of Control PresentationJanuary 24, 1997

Board of Control Presentation January 24, 1997
������������
�� ���� ��� ����� ���������� �
������������� �
Number 5, Fall 1995

Board of Control Presentation January 24, 1997
������������
�� ���� ��� ����� ���������� �
“Ascertaining how well an institution is doing is a subtle and
complex task, and indicators and other measures of institutional
performance can be instructive tools in this process.”
Board of Control Presentation January 24, 1997
������������
�� ���� ��� ����� ���������� �
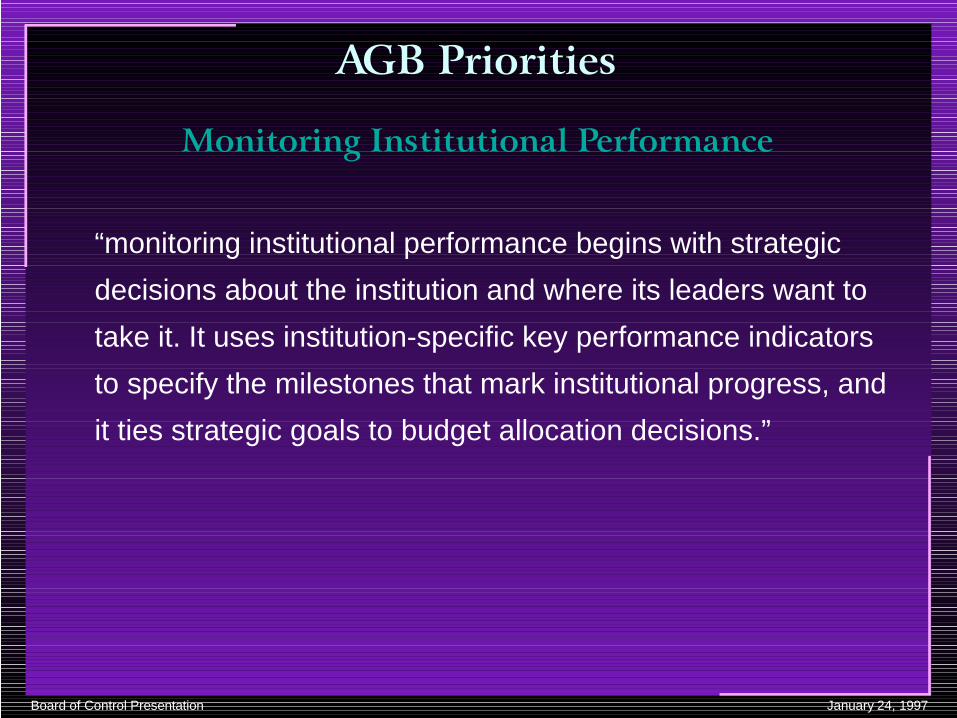
“monitoring institutional performance begins with strategic
decisions about the institution and where its leaders want to
take it. It uses institution-specific key performance indicators
to specify the milestones that mark institutional progress, and
it ties strategic goals to budget allocation decisions.”

Board of Control Presentation January 24, 1997
������������
�� ���� ��� ����� ���������� �
“Mission and strategic goals represent the desired
destination; indicators mark progress on the road. It is
essential not to confuse the two.”

Board of Control Presentation January 24, 1997
Benchmarking
Benchmark Measures
Goal 6Goal 1
Sustain and Enhance the Quality of Under-graduate Programs
Objectives
Strategies
Attract and Retain, Support and Develop Excellent Faculty
Goal 2
Objectives
Strategies
Strengthen and Develop Graduate Programs
Goal 3
Objectives
Strategies
Enhance and Expand Research, Scholarship, and Creative Activity within the University
Goal 4
Objectives
Strategies
Provide a Rewarding & Challenging Work Environment in which Staff Meet or Exceed Expectations
Goal 5
Objectives
Strategies
Provide Comprehensive Information Technology Services
Objectives
Strategies
Develop the MTU Campus and continuously Maintain the Physical Plant
Goal 7
Objectives
Strategies
Provide a Stable Financial Environment and Enhance Resource Acquisition
Goal 8
Objectives
Strategies
Mission
Vision
Quantitative Context
������������������������ � �������

Board of Control Presentation January 24, 1997
���� � �����������
Michigan Technological University will benefit the State of Michigan and society as a whole through a balance of quality education, theoretical and applied research, and public service. The University will continue to build upon its unique tradition of education in engineering, science, and related disciplines, and to provide the state and its industries with highly qualified graduates. In addition, the University will strive to promote diversity, creativity, leadership, and teamwork, and to educate all of its students to meet the changing needs of a global, technological, diverse, and environmentally sensitive society. The University will seek to enrich and benefit society through its research activities and will assist the community, the state, and the nation in economic and cultural development.
Board of Control Presentation January 24, 1997
���� � �����!���� ����
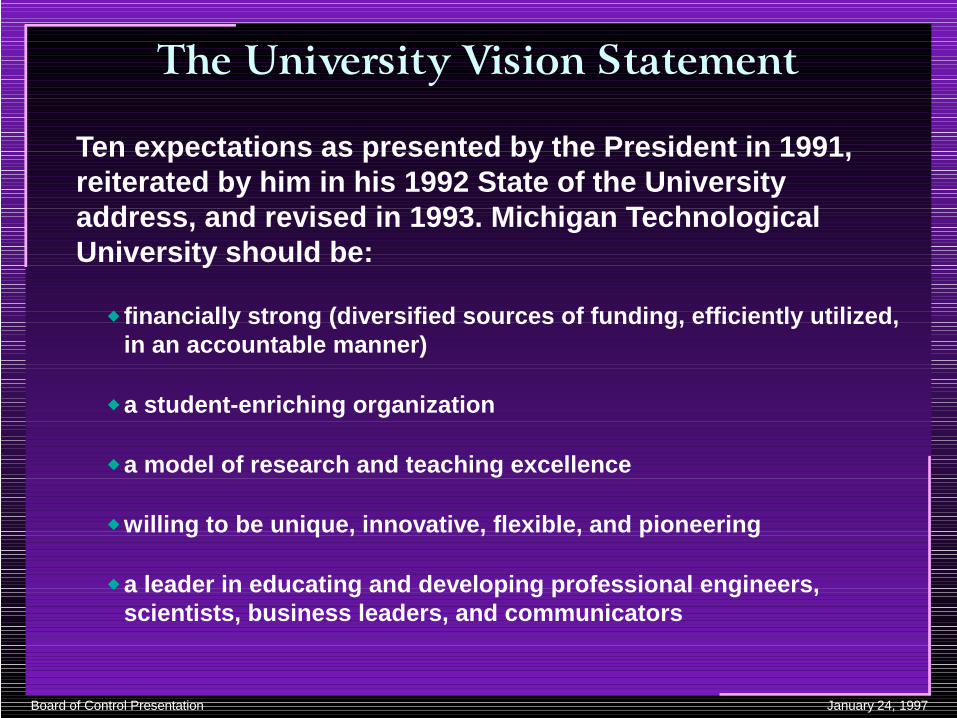
Ten expectations as presented by the President in 1991, reiterated by him in his 1992 State of the University address, and revised in 1993. Michigan Technological University should be:
financially strong (diversified sources of funding, efficiently utilized, in an accountable manner)
�
a student-enriching organization�
a model of research and teaching excellence�
willing to be unique, innovative, flexible, and pioneering�
a leader in educating and developing professional engineers, scientists, business leaders, and communicators
�
Board of Control Presentation January 24, 1997
���� � �����!���� ����
"#� � �$%
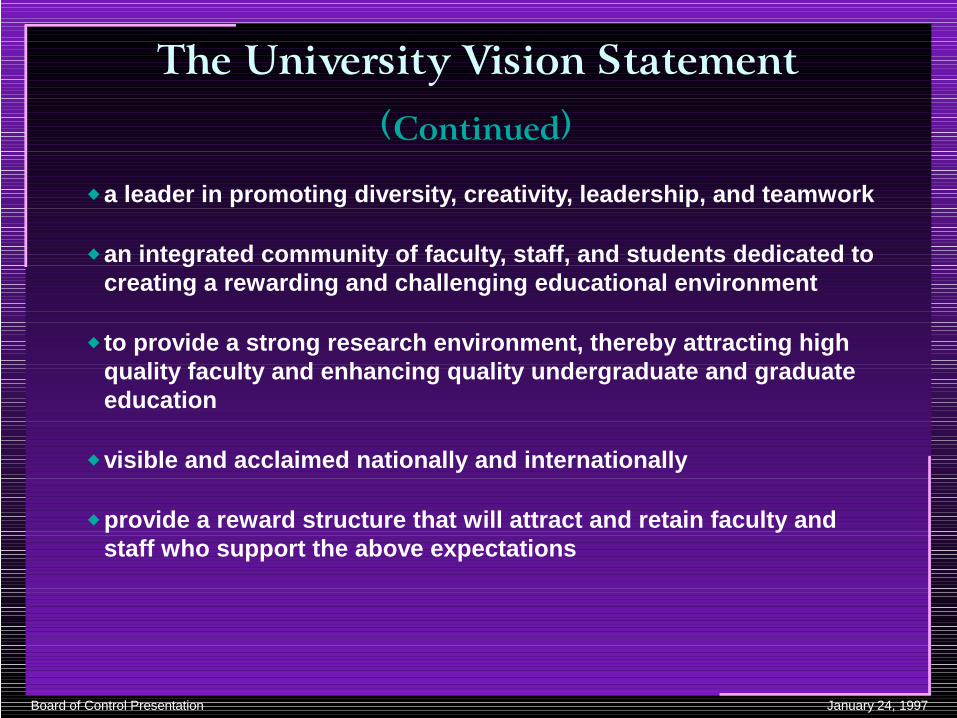
a leader in promoting diversity, creativity, leadership, and teamwork�
an integrated community of faculty, staff, and students dedicated to creating a rewarding and challenging educational environment
�
to provide a strong research environment, thereby attracting high quality faculty and enhancing quality undergraduate and graduate education
�
visible and acclaimed nationally and internationally�
provide a reward structure that will attract and retain faculty and staff who support the above expectations
�
Board of Control Presentation January 24, 1997
&�� ��� �#� '�������� � �
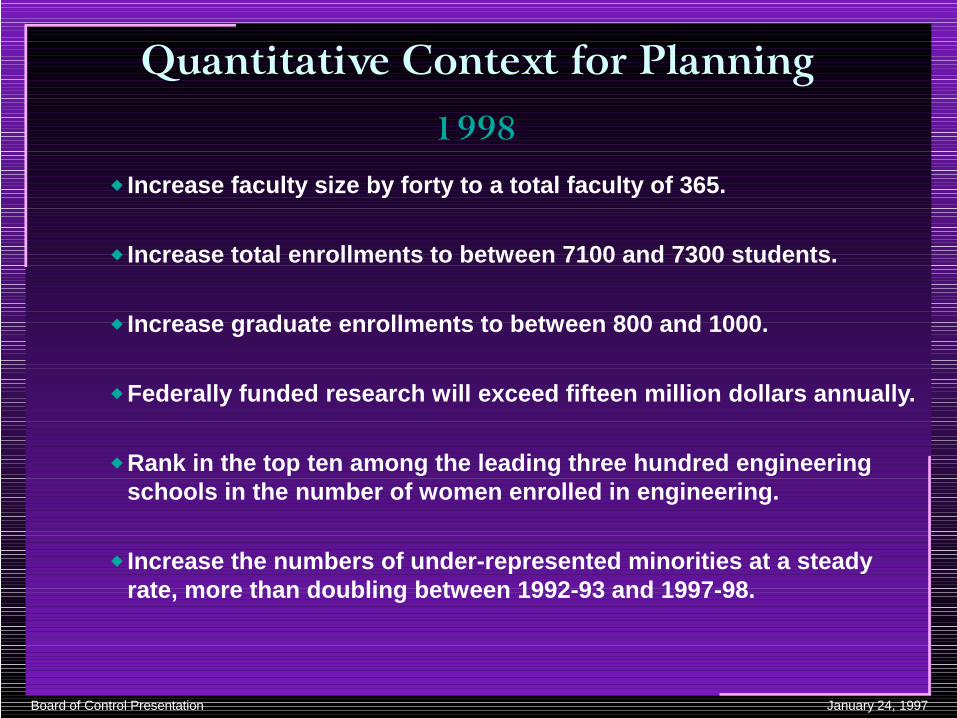
Increase faculty size by forty to a total faculty of 365.�
Increase total enrollments to between 7100 and 7300 students.�
Increase graduate enrollments to between 800 and 1000.�
Federally funded research will exceed fifteen million dollars annually.�
Rank in the top ten among the leading three hundred engineering schools in the number of women enrolled in engineering.
�
Increase the numbers of under-represented minorities at a steady rate, more than doubling between 1992-93 and 1997-98.
�
())*

Board of Control Presentation January 24, 1997
0
50
100
150
200
250
300
350
400
19851986
19871988
19891990
19911992
19931994
19951996
19971998
Tenured/Tenure-Track Faculty Headcount
Source: Institutional Analysis
0M
5M
10M
15M
20M
25M
19841985
19861987
19881989
19901991
19921993
19941995
19961997
1998
Federal Total
Research Expenditures
Source: Research Accounting
0
100
200
300
400
500
600
19821983
19841985
19861987
19881989
19901991
19921993
19941995
19961997
1998
MS PhD
Graduate Student Enrollment
Source: Fall Quarter Enrollment Reports
0
1500
3000
4500
6000
7500
19831984
19851986
19871988
19891990
19911992
19931994
19951996
19971998
Undergraduate Enrollment
Source: Fall Quarter Enrollment Reports
Quantitative Data
Board of Control Presentation January 24, 1997
� � ����������
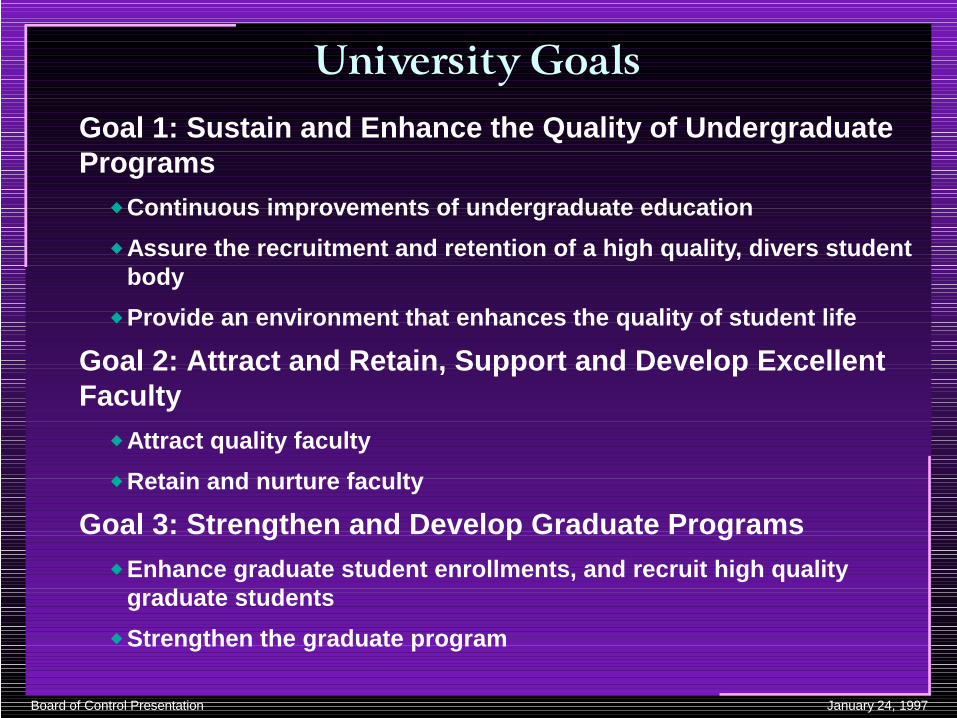
Goal 1: Sustain and Enhance the Quality of Undergraduate Programs
Continuous improvements of undergraduate education�
Assure the recruitment and retention of a high quality, divers student body
�
Provide an environment that enhances the quality of student life�
Goal 2: Attract and Retain, Support and Develop Excellent Faculty
Attract quality faculty�
Retain and nurture faculty�
Goal 3: Strengthen and Develop Graduate ProgramsEnhance graduate student enrollments, and recruit high quality graduate students
�
Strengthen the graduate program�
Board of Control Presentation January 24, 1997
� � ����������"#� � �$%
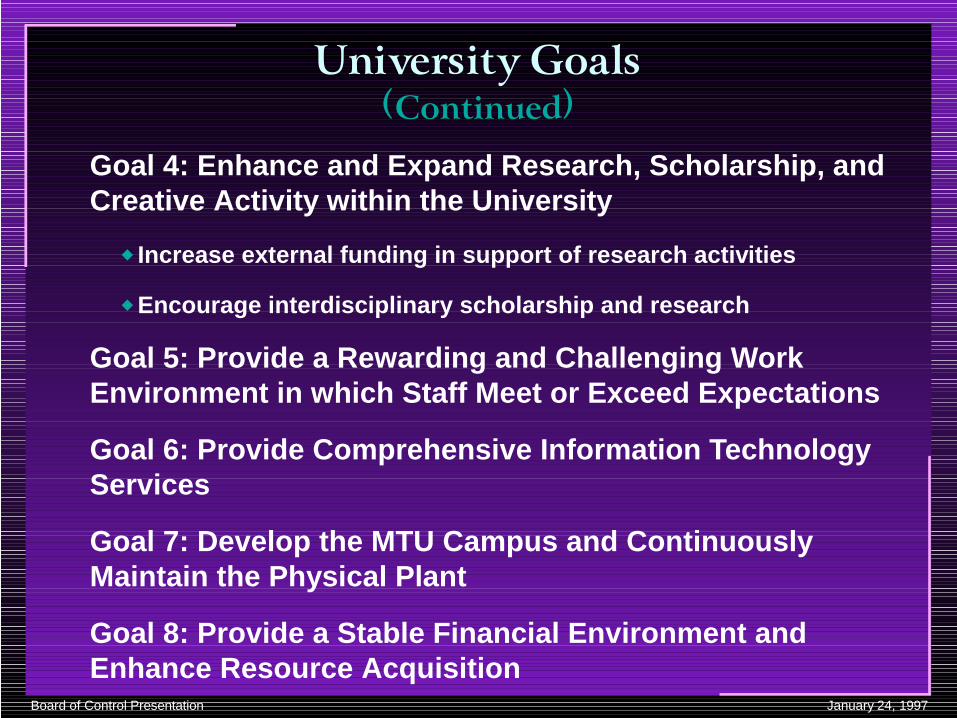
Goal 4: Enhance and Expand Research, Scholarship, and Creative Activity within the University
Increase external funding in support of research activities�
Encourage interdisciplinary scholarship and research�
Goal 5: Provide a Rewarding and Challenging Work Environment in which Staff Meet or Exceed Expectations
Goal 6: Provide Comprehensive Information Technology Services
Goal 7: Develop the MTU Campus and Continuously Maintain the Physical Plant
Goal 8: Provide a Stable Financial Environment and Enhance Resource Acquisition
Board of Control Presentation January 24, 1997
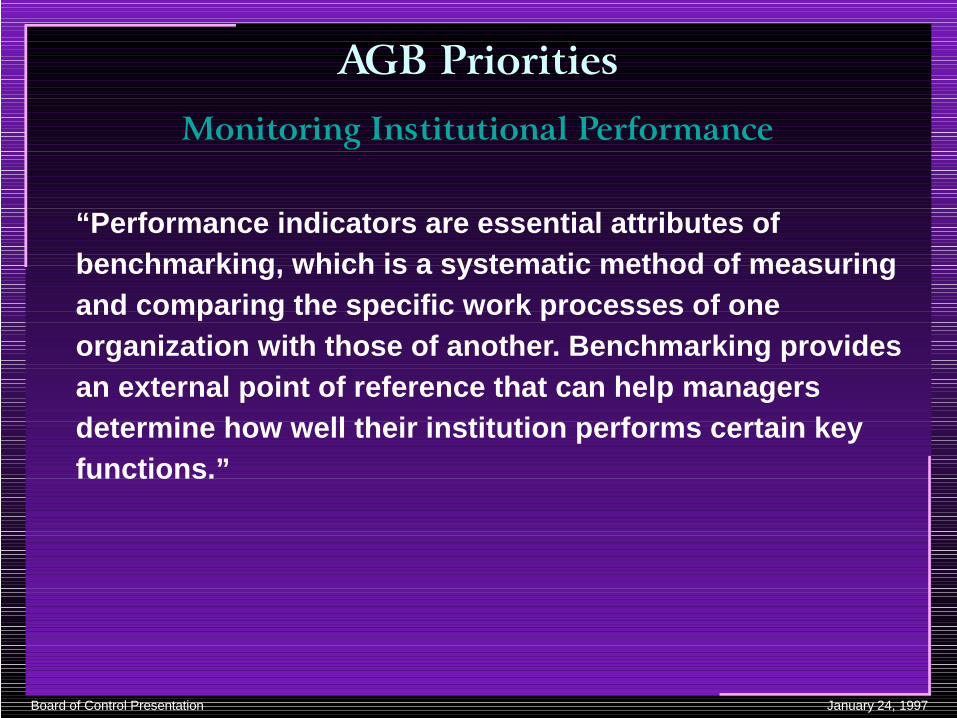
������������
�� ���� ��� ����� ���������� �
“Performance indicators are essential attributes of benchmarking, which is a systematic method of measuring and comparing the specific work processes of one organization with those of another. Benchmarking provides an external point of reference that can help managers determine how well their institution performs certain key functions.”
Board of Control Presentation January 24, 1997
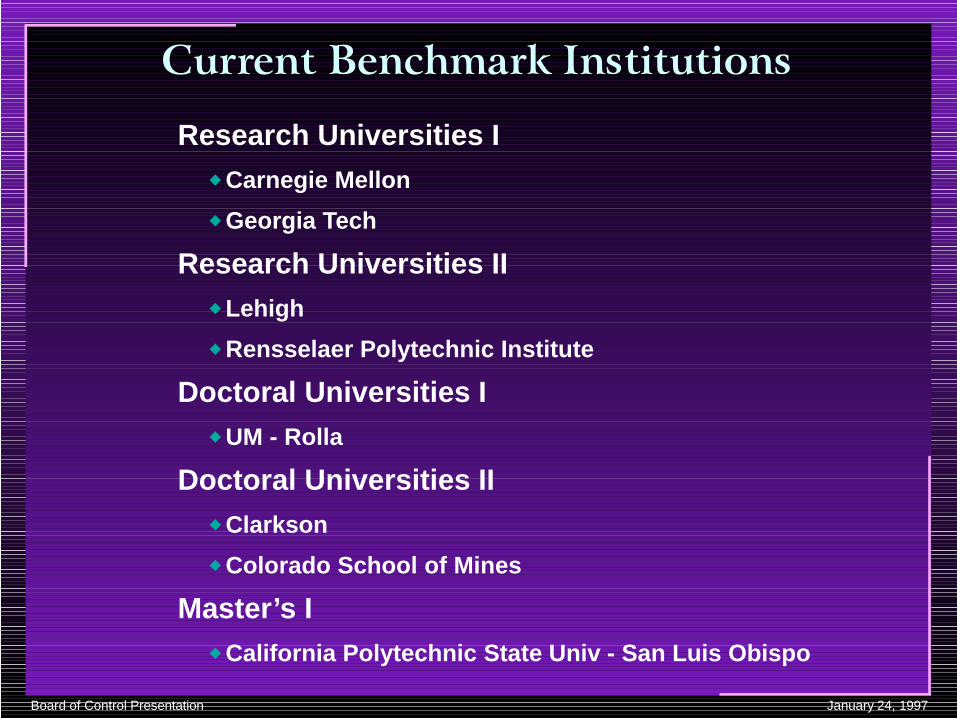
#��� �� �����+�� ����� �
Research Universities ICarnegie Mellon�
Georgia Tech�
Research Universities IILehigh�
Rensselaer Polytechnic Institute�
Doctoral Universities IUM - Rolla�
Doctoral Universities IIClarkson�
Colorado School of Mines�
Master’s ICalifornia Polytechnic State Univ - San Luis Obispo�

Board of Control Presentation January 24, 1997
������������
�� ���� ��� ����� ���������� �
“Every institution uses a variety of quantitative means to
understand how it is performing. The most common tools are
financial statements, which provide a general picture of
institutional viability. . . . a balanced budget actually tells little
about the underlying condition of the components that constitute
the budget. For example, a budget can be balanced by deferring
maintenance or underpaying faculty--both conditions that can
lead to future financial or academic difficulty.”
Board of Control Presentation January 24, 1997
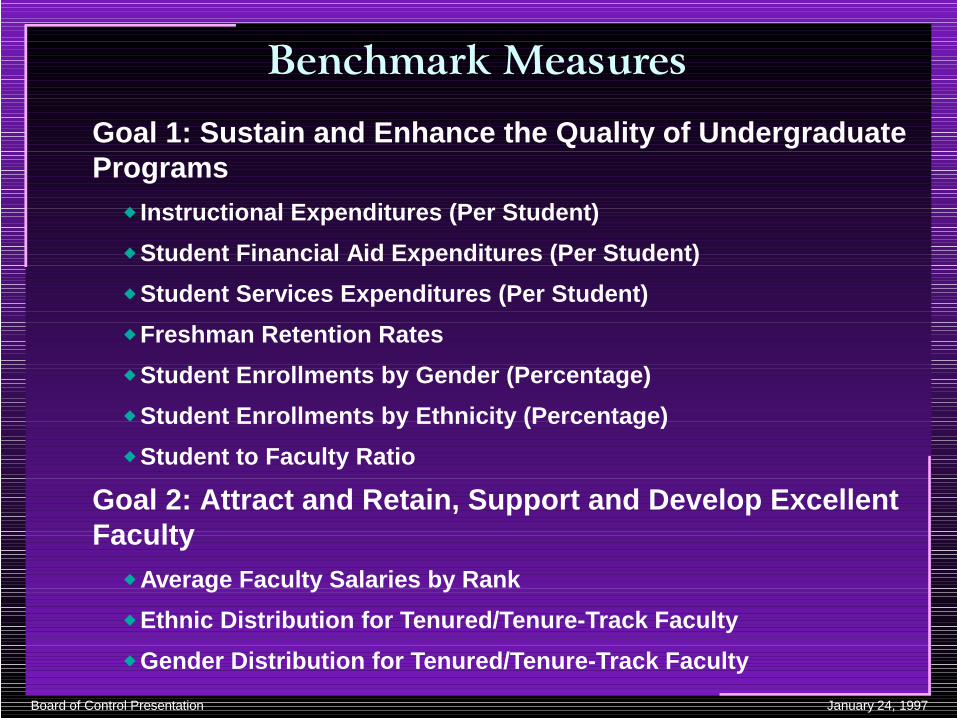
� �����+�������
Goal 1: Sustain and Enhance the Quality of Undergraduate Programs
Instructional Expenditures (Per Student)�
Student Financial Aid Expenditures (Per Student)�
Student Services Expenditures (Per Student)�
Freshman Retention Rates�
Student Enrollments by Gender (Percentage)�
Student Enrollments by Ethnicity (Percentage)�
Student to Faculty Ratio�
Goal 2: Attract and Retain, Support and Develop Excellent Faculty
Average Faculty Salaries by Rank�
Ethnic Distribution for Tenured/Tenure-Track Faculty�
Gender Distribution for Tenured/Tenure-Track Faculty�
Board of Control Presentation January 24, 1997
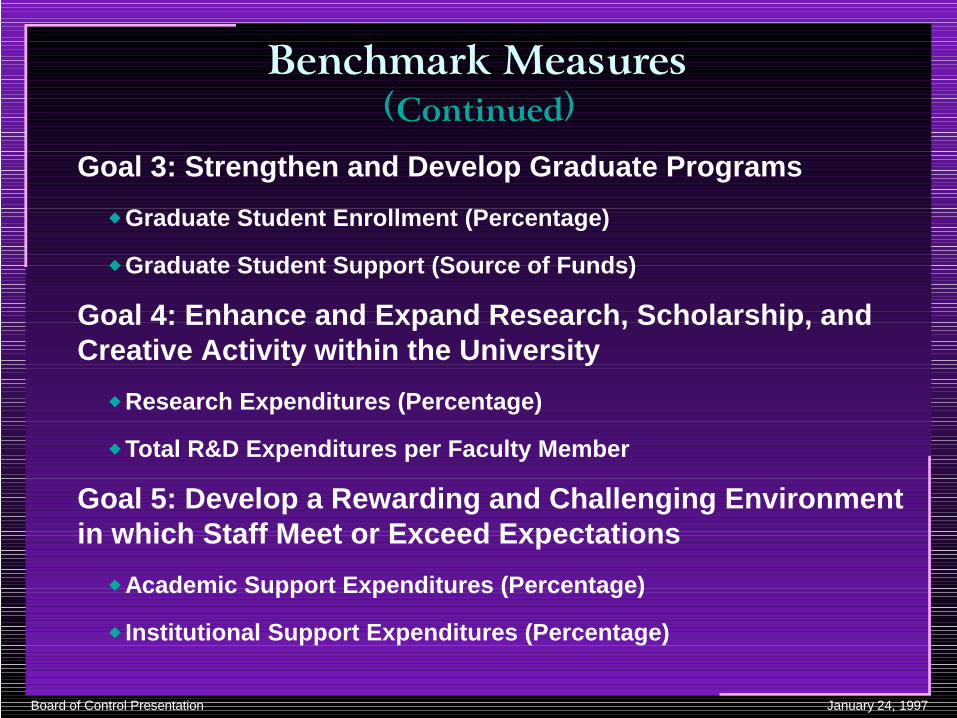
� �����+�������"#� � �$%
Goal 3: Strengthen and Develop Graduate Programs
Graduate Student Enrollment (Percentage)�
Graduate Student Support (Source of Funds)�
Goal 4: Enhance and Expand Research, Scholarship, and Creative Activity within the University
Research Expenditures (Percentage)�
Total R&D Expenditures per Faculty Member�
Goal 5: Develop a Rewarding and Challenging Environment in which Staff Meet or Exceed Expectations
Academic Support Expenditures (Percentage)�
Institutional Support Expenditures (Percentage)�
Board of Control Presentation January 24, 1997
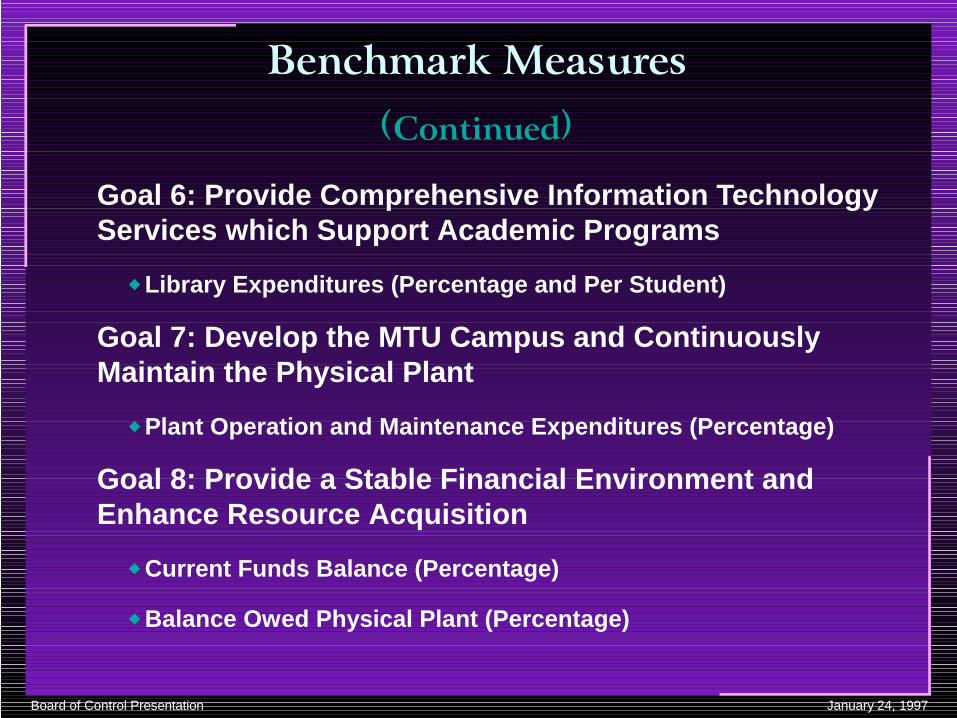
� �����+�������
"#� � �$%
Goal 6: Provide Comprehensive Information Technology Services which Support Academic Programs
Library Expenditures (Percentage and Per Student)�
Goal 7: Develop the MTU Campus and Continuously Maintain the Physical Plant
Plant Operation and Maintenance Expenditures (Percentage)�
Goal 8: Provide a Stable Financial Environment and Enhance Resource Acquisition
Current Funds Balance (Percentage)�
Balance Owed Physical Plant (Percentage)�
Board of Control Presentation January 24, 1997
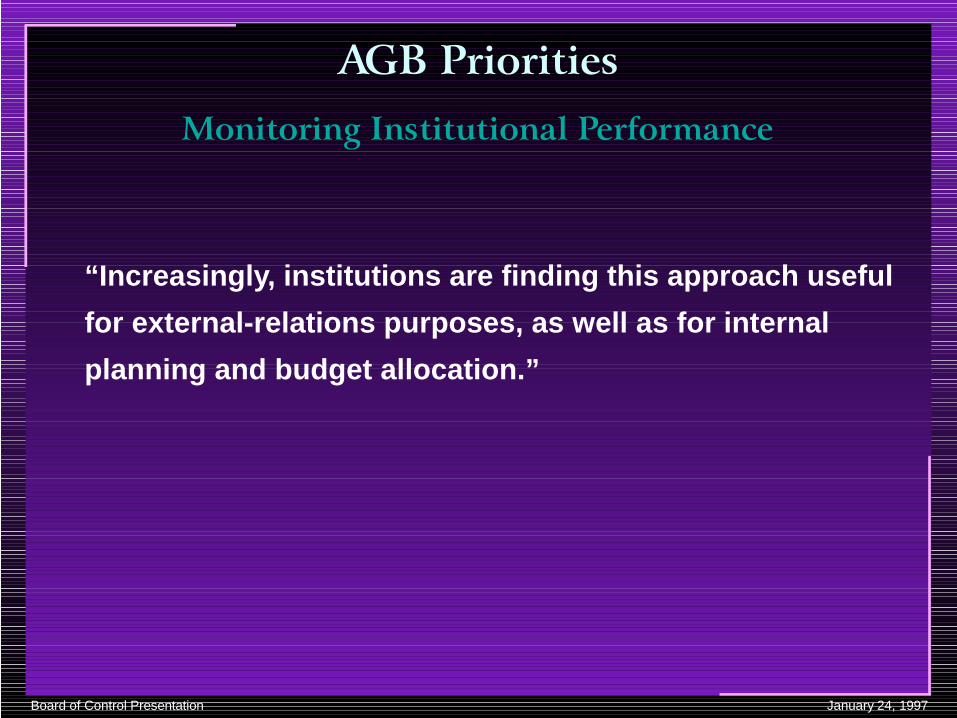
������������
�� ���� ��� ����� ���������� �
“Increasingly, institutions are finding this approach useful
for external-relations purposes, as well as for internal
planning and budget allocation.”

Board of Control Presentation January 24, 1997
� �����+�������
�����(,������ �� $�- �� ����&���������� $����$�����������
$0M
$10M
$20M
$30M
$40M
$50M
FY90 FY91 FY92 FY93 FY94 FY95 FY96
MTU Instructional Expenditures
Source: IPEDS Finance Surveys
Increase in Faculty Size�
Student Computing Labs�
AACSB (Business)�
Board of Control Presentation January 24, 1997
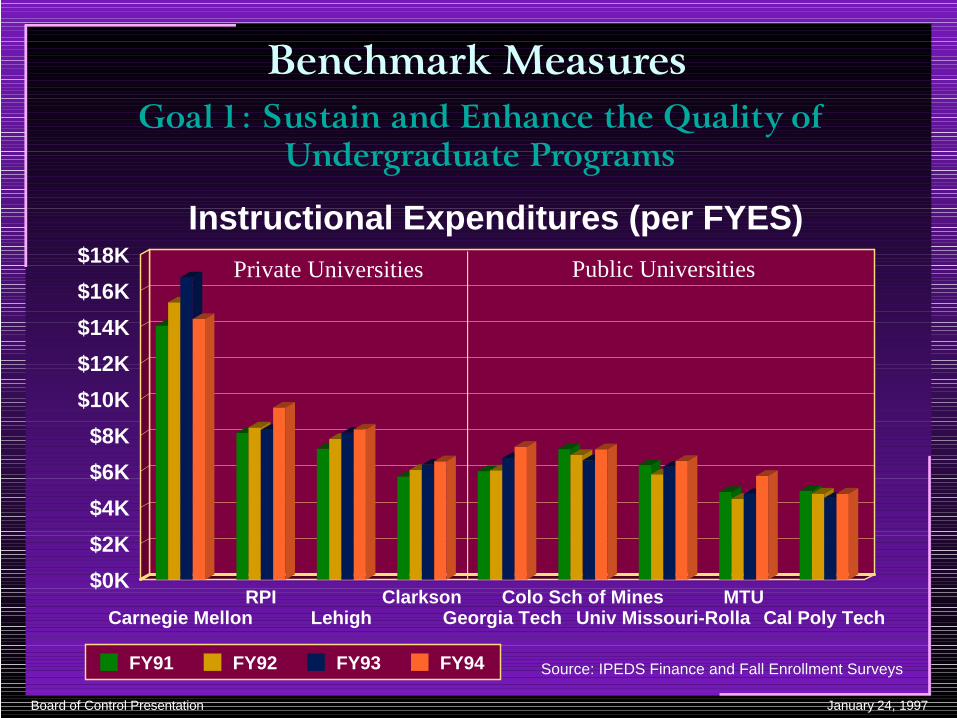
� �����+�������
�����(,������ �� $�- �� ����&���������� $����$�����������
$0K
$2K
$4K
$6K
$8K
$10K
$12K
$14K
$16K
$18K
Carnegie MellonRPI
LehighClarkson
Georgia TechColo Sch of Mines
Univ Missouri-RollaMTU
Cal Poly Tech
FY91 FY92 FY93 FY94
Instructional Expenditures (per FYES)
Source: IPEDS Finance and Fall Enrollment Surveys
Private Universities Public Universities

Board of Control Presentation January 24, 1997
� �����+�������
�����(,������ �� $�- �� ����&���������� $����$�����������
$0
$100
$200
$300
$400
$500
$600
$700
$800
FY91 FY92 FY93 FY94 FY95
MTU Student Services per FYES
Source: IPEDS Finance Surveys
Director of Orientation/ First-Year Programs
�
Coordinator of Residence Life�
Financial Aid Information Specialist
�
Job Fairs�
Retention Task Force�
Leadership Training�

Board of Control Presentation January 24, 1997
� �����+�������
�����(,������ �� $�- �� ����&���������� $����$�����������
$0
$200
$400
$600
$800
$1000
$1200
$1400
$1600
$1800
$2000
LehighClarkson
Carnegie MellonRPI
Univ Missouri-RollaCal Poly Tech
Colo Sch of MinesMTU
Georgia Tech
FY91 FY92 FY93 FY94
Student Services Expenditures (per FYES)
Source: IPEDS Finance and Fall Enrollment Surveys
Private Universities Public Universities
Board of Control Presentation January 24, 1997
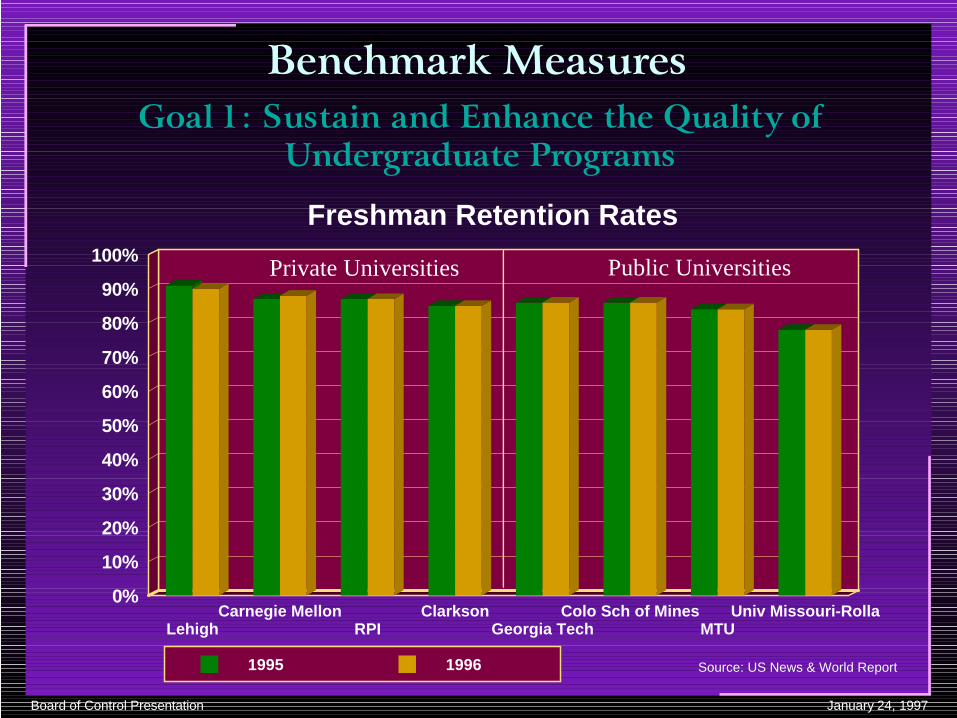
� �����+�������
�����(,������ �� $�- �� ����&���������� $����$�����������
0%
10%
20%
30%
40%
50%
60%
70%
80%
90%
100%
LehighCarnegie Mellon
RPIClarkson
Georgia TechColo Sch of Mines
MTUUniv Missouri-Rolla
1995 1996
Freshman Retention Rates
Source: US News & World Report
Private Universities Public Universities
Board of Control Presentation January 24, 1997
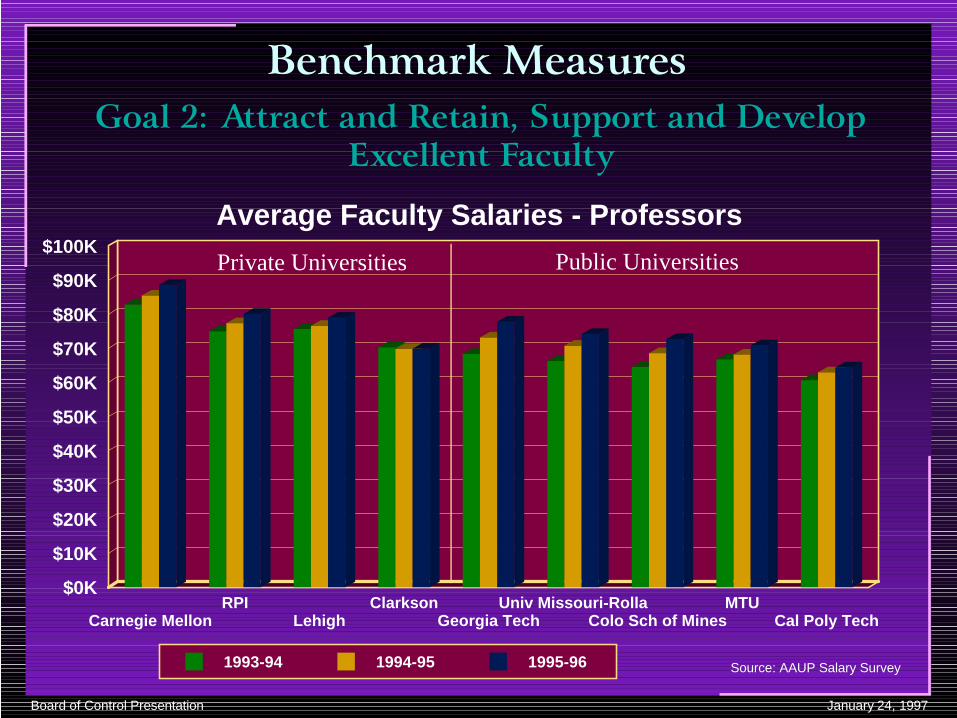
� �����+�������
�����.,������� $�/�� 0���11���� $�� ��1�-'��� �2�����
$0K
$10K
$20K
$30K
$40K
$50K
$60K
$70K
$80K
$90K
$100K
Carnegie MellonRPI
LehighClarkson
Georgia TechUniv Missouri-Rolla
Colo Sch of MinesMTU
Cal Poly Tech
1993-94 1994-95 1995-96
Average Faculty Salaries - Professors
Source: AAUP Salary Survey
Private Universities Public Universities
Board of Control Presentation January 24, 1997
$0K
$10K
$20K
$30K
$40K
$50K
$60K
$70K
Carnegie MellonRPI
LehighClarkson
Georgia TechUniv Missouri-Rolla
Colo Sch of MinesCal Poly Tech
MTU
1993-94 1994-95 1995-96
Avera ge Faculty Salaries - Associate Professors
Source: AAUP Salary Survey
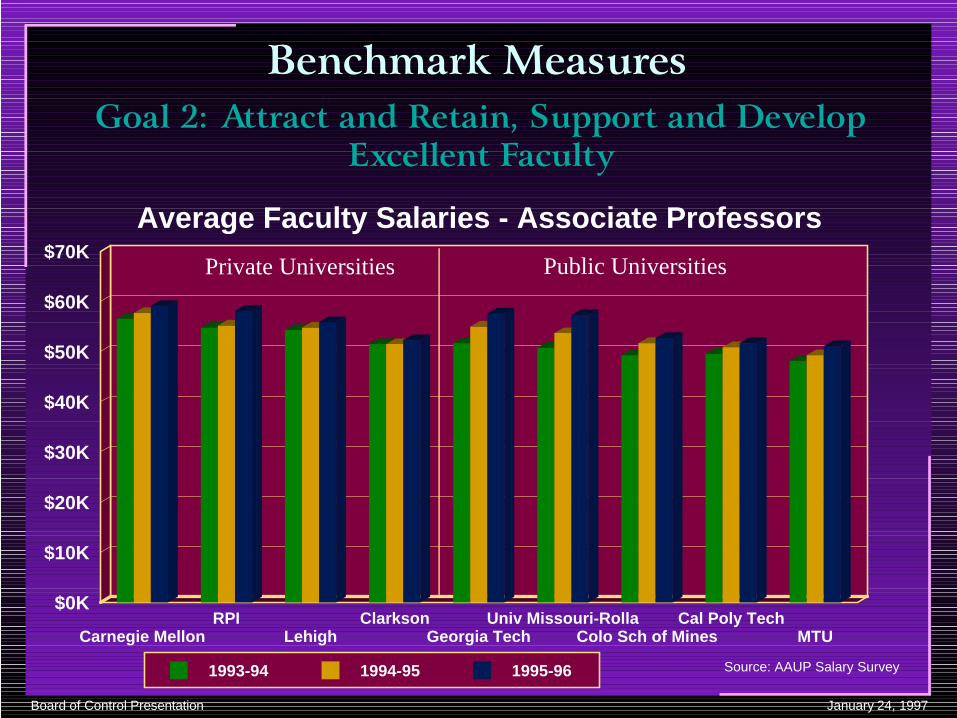
� �����+�������
�����.,������� $�/�� 0���11���� $�� ��1�-'��� �2�����
Private Universities Public Universities

Board of Control Presentation January 24, 1997
$0K
$10K
$20K
$30K
$40K
$50K
$60K
Carnegie MellonRPI
ClarksonLehigh
Colo Sch of MinesGeorgia Tech
Univ Missouri-RollaMTU
Cal Poly Tech
1993-94 1994-95 1995-96
Average Faculty Salaries - Assistant Professors
Source: AAUP Salary Survey
� �����+�������
�����.,������� $�/�� 0���11���� $�� ��1�-'��� �2�����
Private Universities Public Universities

Board of Control Presentation January 24, 1997
� �����+�������
�����.,������� $�/�� 0���11���� $�� ��1�-'��� �2�����
0
40
80
120
160
200
240
280
320
360
1991 1992 1993 1994 1995 1996
Male Female
MTU Tenured/Tenure-Track Gender Distribution
Source: Institutional Analysis
15.5% 15.1%15.9% 17.4% 18.4% 20.8%
Board of Control Presentation January 24, 1997
� �����+�������
�����.,������� $�/�� 0���11���� $�� ��1�-'��� �2�����
0
100
200
300
400
500
600
700
800
LehighCarnegie Mellon
RPIClarkson
MTUCal Poly Tech
Georgia TechColo Sch of Mines
Univ Missouri-Rolla
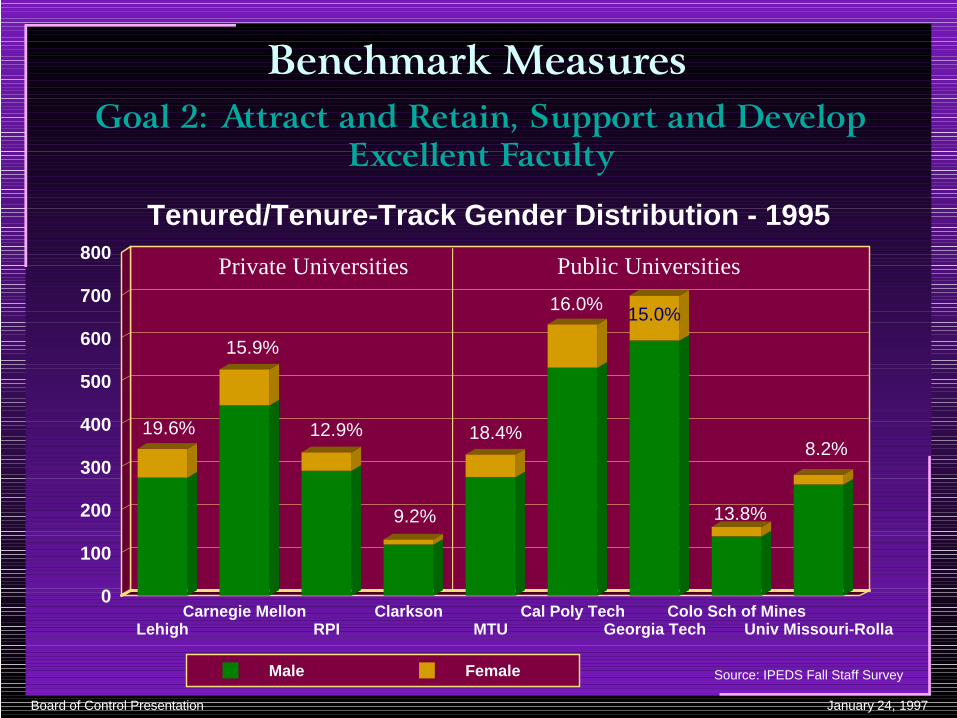
Male Female
Tenured/Tenure-Track Gender Distribution - 1995
Source: IPEDS Fall Staff Survey
Private Universities Public Universities
19.6%
15.9%
12.9%
9.2%
18.4%
16.0% 15.0%
13.8%
8.2%
Board of Control Presentation January 24, 1997
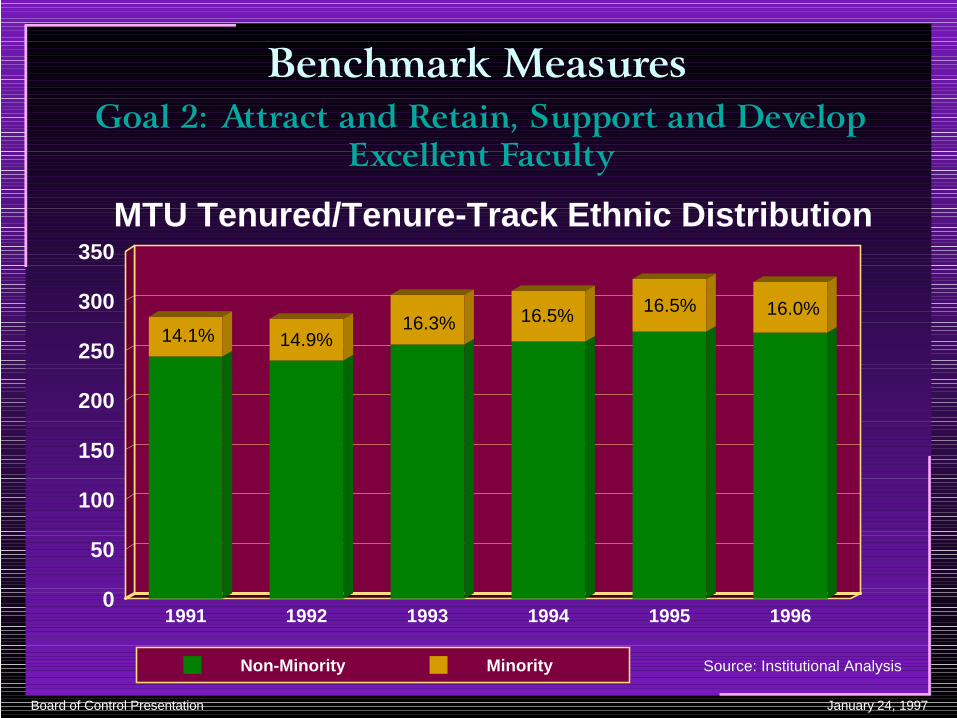
� �����+������������.,������� $�/�� 0���11���� $�� ��1�
-'��� �2�����
0
50
100
150
200
250
300
350
1991 1992 1993 1994 1995 1996
Non-Minority Minority
MTU Tenured/Tenure-Track Ethnic Distribution
Source: Institutional Analysis
14.1% 14.9%16.3% 16.5% 16.5% 16.0%
Board of Control Presentation January 24, 1997
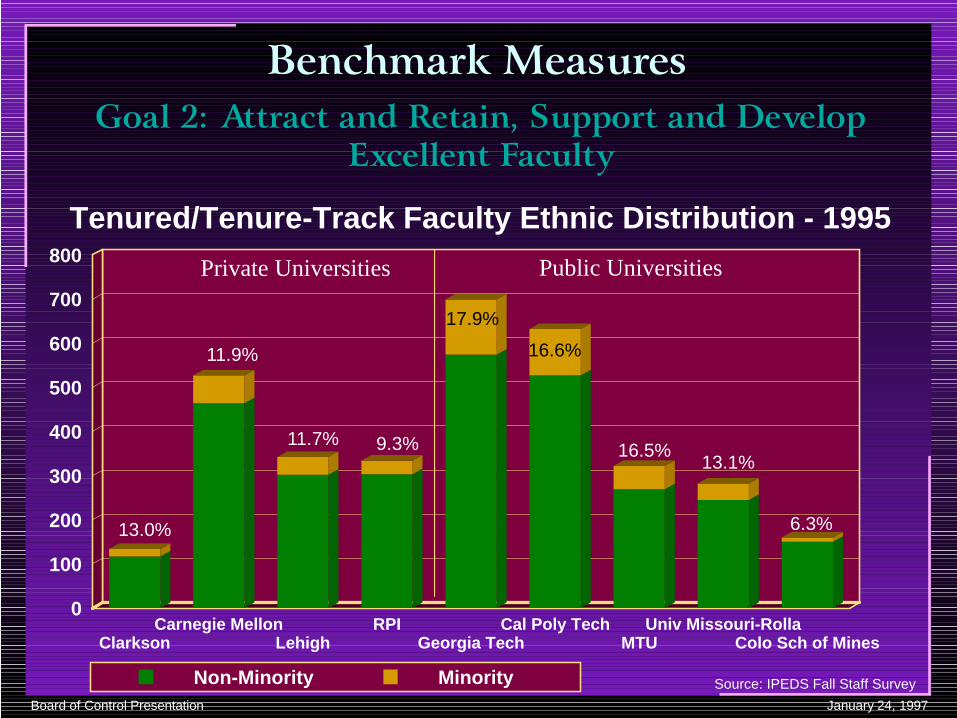
� �����+�������
�����.,������� $�/�� 0���11���� $�� ��1�-'��� �2�����
0
100
200
300
400
500
600
700
800
ClarksonCarnegie Mellon
LehighRPI
Georgia TechCal Poly Tech
MTUUniv Missouri-Rolla
Colo Sch of Mines
Non-Minority Minority
Tenured/Tenure-Track Faculty Ethnic Distribution - 1995
Source: IPEDS Fall Staff Survey
Private Universities Public Universities
13.0%
11.9%
11.7% 9.3%
17.9%
16.6%
16.5%13.1%
6.3%
Board of Control Presentation January 24, 1997
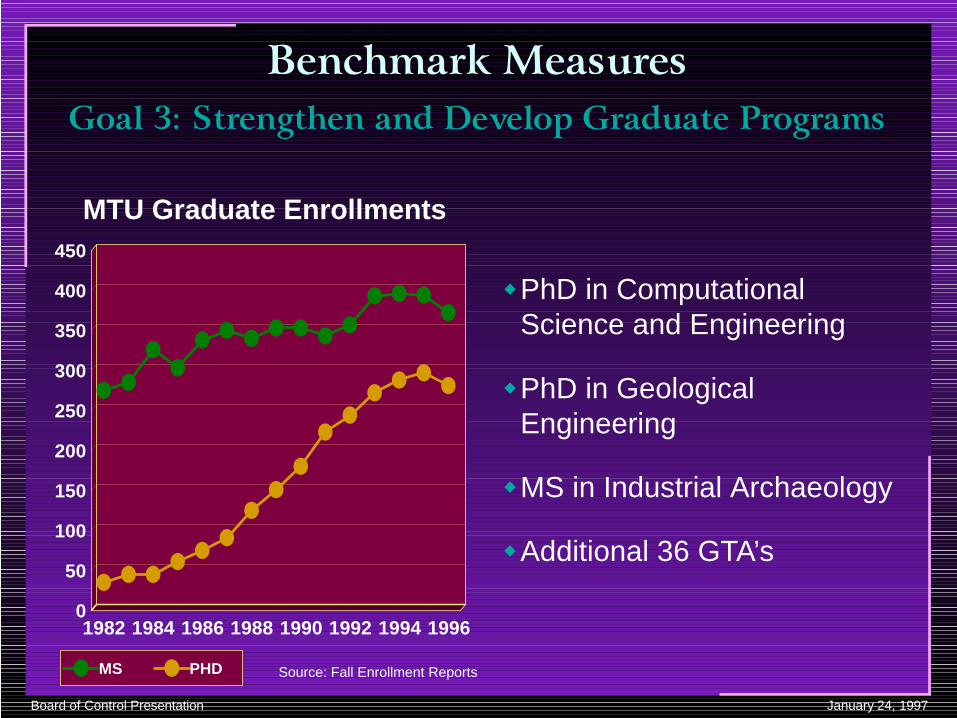
� �����+�������
�����3,��� �� �� $�� ��1����$�����������
0
50
100
150
200
250
300
350
400
450
1982 1984 1986 1988 1990 1992 1994 1996
MS PHD
MTU Graduate Enrollments
Source: Fall Enrollment Reports
PhD in Computational Science and Engineering
�
PhD in Geological Engineering
�
MS in Industrial Archaeology�
Additional 36 GTA’s�
Board of Control Presentation January 24, 1997
� �����+�������
�����3,��� �� �� $�� ��1����$�����������
0
500
1000
1500
2000
2500
3000
3500
Carnegie MellonRPI
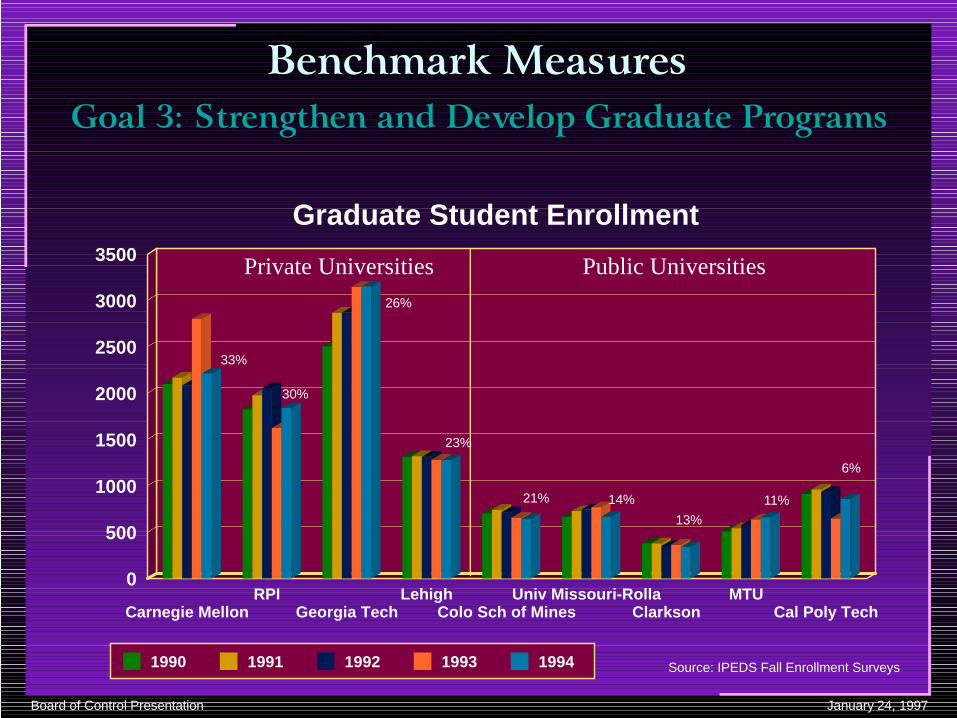
Georgia TechLehigh
Colo Sch of MinesUniv Missouri-Rolla
ClarksonMTU
Cal Poly Tech
1990 1991 1992 1993 1994
Graduate Student Enrollment
Source: IPEDS Fall Enrollment Surveys
Private Universities Public Universities
33%
30%
26%
23%
21% 14%
13%
11%
6%
Board of Control Presentation January 24, 1997
� �����+�������
�����4,�- �� ��� $�-'1� $�/�����0�����������10�� $�#��� ���� ���5��� ���� � ����
$0M
$5M
$10M
$15M
$20M
$25M
FY90 FY91 FY92 FY93 FY94 FY95 FY96
MTU Research Expenditures
Source: IPEDS Finance Surveys
Increase Faculty Size�
Grant Cost Share Pool�
Faculty Development Grants�
GA Program�

Board of Control Presentation January 24, 1997
� �����+������������4,�- �� ��� $�-'1� $�/�����0�����������10�
� $�#��� ���� ���5��� ���� � ����
0%
10%
20%
30%
40%
50%
60%
Carnegie MellonRPI
LehighClarkson
Georgia TechColo Sch of Mines
MTUUniv Missouri-Rolla
1990 1991 1992 1993 1994
Research Expenditures (Percenta ge of Total)
Source: IPEDS Finance Surveys
Private Universities Public Universities
Board of Control Presentation January 24, 1997
� �����+�������
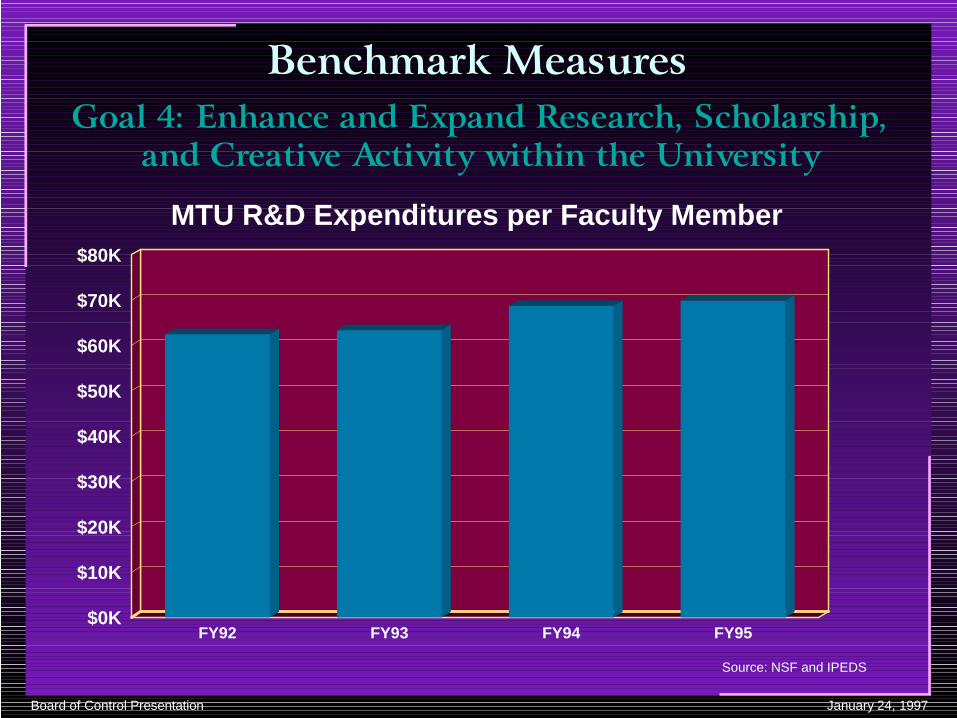
�����4,�- �� ��� $�-'1� $�/�����0�����������10�� $�#��� ���� ���5��� ���� � ����
$0K
$10K
$20K
$30K
$40K
$50K
$60K
$70K
$80K
FY92 FY93 FY94 FY95
MTU R&D Expenditures per Faculty Member
Source: NSF and IPEDS
Board of Control Presentation January 24, 1997
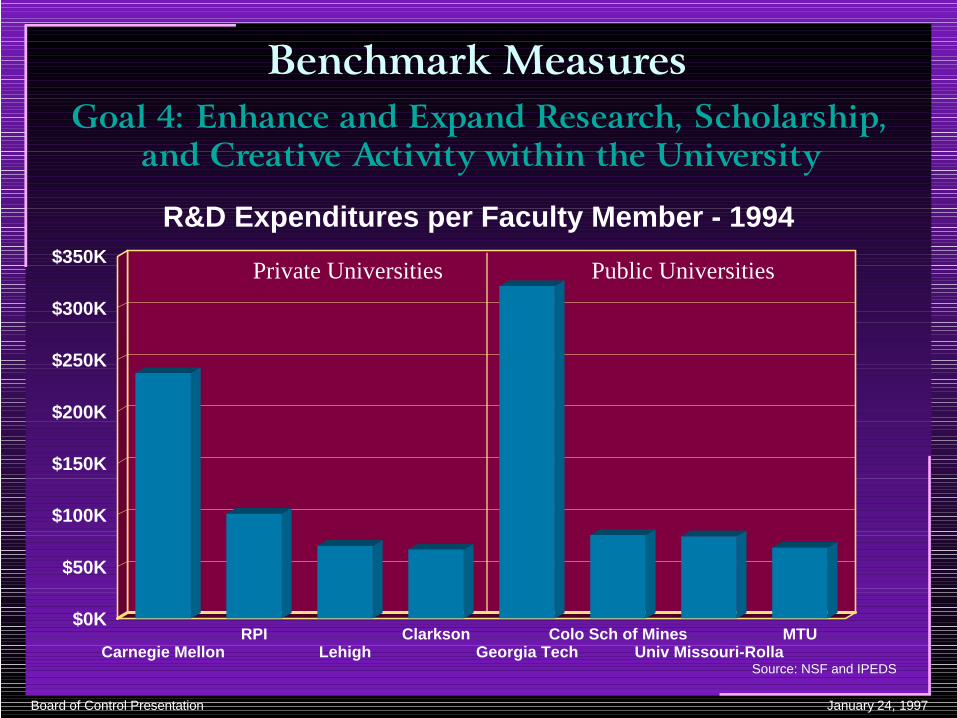
� �����+�������
�����4,�- �� ��� $�-'1� $�/�����0�����������10�� $�#��� ���� ���5��� ���� � ����
$0K
$50K
$100K
$150K
$200K
$250K
$300K
$350K
Carnegie MellonRPI
LehighClarkson
Georgia TechColo Sch of Mines
Univ Missouri-RollaMTU
R&D Expenditures per Faculty Member - 1994
Source: NSF and IPEDS
Private Universities Public Universities

Board of Control Presentation January 24, 1997
� �����+�������
�����6,�� ��1���/5��$� ��� $�#���� �� ��- ��� � �� �5���������������-'�$�
-'1���� �
Progress toward Salary Parity�
6.5% - 93/94�
3% - 94/95�
4% - 95/96 & 96/97�
Sick Leave Pool�
Wellness Program�
Staff Handbook�
University Senate Constituency Expansion�

Board of Control Presentation January 24, 1997
� �����+������������7,���� �$�#��1�� �� �� ������� ���� ������
�� ����5�������11������$������������
$0.00M
$0.40M
$0.80M
$1.20M
$1.60M
$2.00M
$2.40M
$2.80M
FY90 FY91 FY92 FY93 FY94 FY95 FY96
MTU Library Expenditures
Source: IPEDS Finance Surveys
Library Automation Project�
Electronic Database Access�
Banner�
Faculty/Staff Computing Support
�
Dorm Net Project�
Banner Web Site�
Board of Control Presentation January 24, 1997
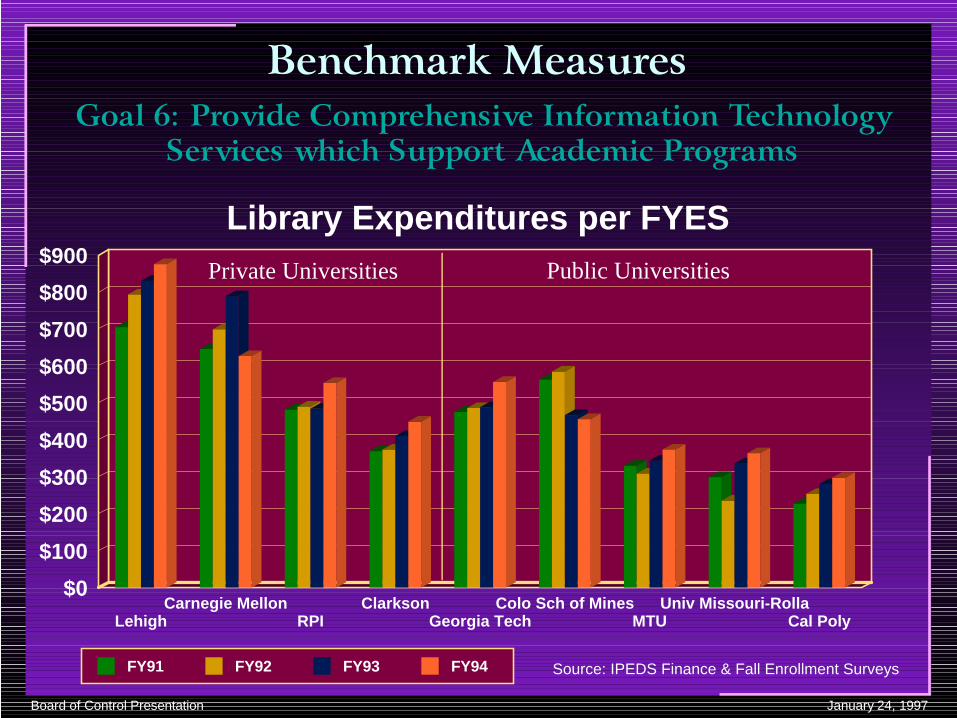
� �����+������������7,���� �$�#��1�� �� �� ������� ���� ������
�� ����5�������11������$������������
$0
$100
$200
$300
$400
$500
$600
$700
$800
$900
LehighCarnegie Mellon
RPIClarkson
Georgia TechColo Sch of Mines
MTUUniv Missouri-Rolla
Cal Poly
FY91 FY92 FY93 FY94
Library Expenditures per FYES
Source: IPEDS Finance & Fall Enrollment Surveys
Private Universities Public Universities

Board of Control Presentation January 24, 1997
� �����+�������
�����8,�� ��1�������#��1���� $�#� � ���������� �� ���������������
$0M
$1M
$2M
$3M
$4M
$5M
$6M
$7M
FY90 FY91 FY92 FY93 FY94 FY95 FY96
MTU Plant Operation Expenditures
Source: IPEDS Finance Surveys
Preventive Maintenance Program
�
Capital Projects�
Forestry Addition�
PAC�
ESE�
Meese Center�

Board of Control Presentation January 24, 1997
� �����+�������
�����8,�� ��1�������#��1���� $�#� � ���������� �� ���������������
0%
1%
2%
3%
4%
5%
6%
7%
8%
9%
10%
ClarksonLehigh
RPICarnegie Mellon
Cal Poly TechColo Sch of Mines
Univ Missouri-RollaMTU
Georgia Tech
FY90 FY91 FY92 FY93 FY94
Plant Operation & Maintenance Expenditures (Percenta ge)
Source: IPEDS Finance Surveys
Private Universities Public Universities

Board of Control Presentation January 24, 1997
� �����+�������
�����*,���� �$��������2� � �����- ��� � �� $�- �� ��/��������9������
-5%
0%
5%
10%
15%
20%
25%
30%
ClarksonCarnegie Mellon
RPILehigh
Cal Poly TechMTU
Georgia TechColo Sch of Mines
Univ Missouri-Rolla
FY91 FY92 FY93 FY94 FY95
Current Funds Balance as % of Total Expenditures
Source: IPEDS Finance Surveys
Private Universities Public Universities
Board of Control Presentation January 24, 1997
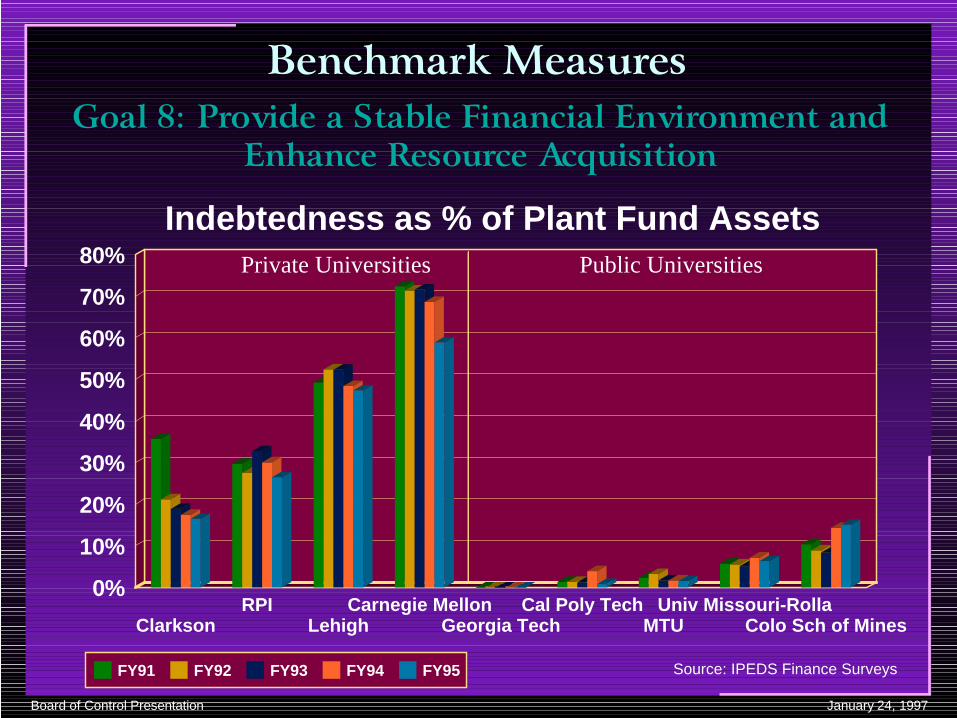
� �����+�������
�����*,���� �$��������2� � �����- ��� � �� $�- �� ��/��������9������
0%
10%
20%
30%
40%
50%
60%
70%
80%
ClarksonRPI
LehighCarnegie Mellon
Georgia TechCal Poly Tech
MTUUniv Missouri-Rolla
Colo Sch of Mines
FY91 FY92 FY93 FY94 FY95
Indebtedness as % of Plant Fund Assets
Source: IPEDS Finance Surveys
Private Universities Public Universities
Board of Control Presentation January 24, 1997
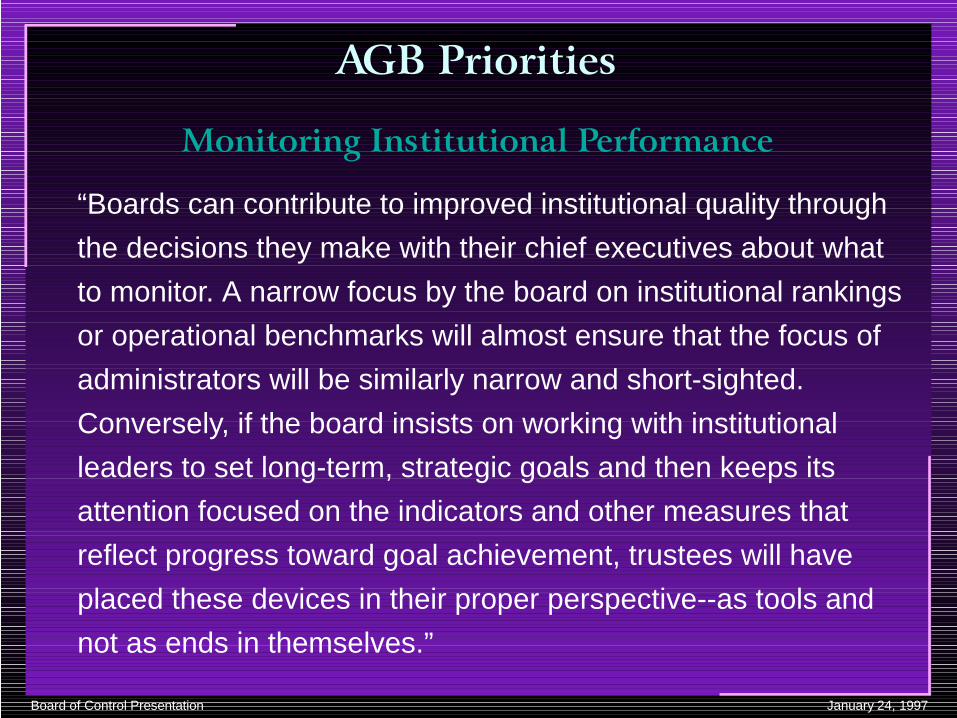
������������
�� ���� ��� ����� ���������� �
“Boards can contribute to improved institutional quality through
the decisions they make with their chief executives about what
to monitor. A narrow focus by the board on institutional rankings
or operational benchmarks will almost ensure that the focus of
administrators will be similarly narrow and short-sighted.
Conversely, if the board insists on working with institutional
leaders to set long-term, strategic goals and then keeps its
attention focused on the indicators and other measures that
reflect progress toward goal achievement, trustees will have
placed these devices in their proper perspective--as tools and
not as ends in themselves.”

Board of Control Presentation January 24, 1997
���� � �����!���� ����
"#� � �$%
The vision as described by the University Direction and Planning Committee in concert with the Executive Vice President and the President:
Michigan Technological University will be a nationally and internationally recognized leader in meeting challenges of the future through excellence in undergraduate and graduate education and research in sciences and engineering.
�
At the undergraduate level, we will have comprehensive, diverse, and relevant curricula that educate technically competent, intellectually vital graduates who are creative, effective leaders and communicators who are aware of the changing social, economic, and cultural values of the world.
�

Board of Control Presentation January 24, 1997
���� � �����!���� ����
"#� � �$%
At the graduate level and in research we will focus especially on growth in interdisciplinary approaches in areas of established strength and future need. Consistent with the increasing complexity of science and technology, we will substantially increase the proportion of graduate students.
�
At each educational level and within each segment of the University community, we will increase the proportion of individuals from under-represented racial and gender groups.
�

Board of Control Presentation January 24, 1997
� �����+�������
�����3,��� �� �� $�� ��1����$�����������
0%
10%
20%
30%
40%
50%
60%
70%
80%
90%
100%
RPICarnegie Mellon
ClarksonLehigh
Univ Missouri-RollaGeorgia Tech
Colo Sch of MinesMTU
Federal Institutional Outside Self
Graduate Student Source of Support - 1994
Source: NSF-NIH Survey
Private Universities Public Universities
Board of Control Presentation January 24, 1997
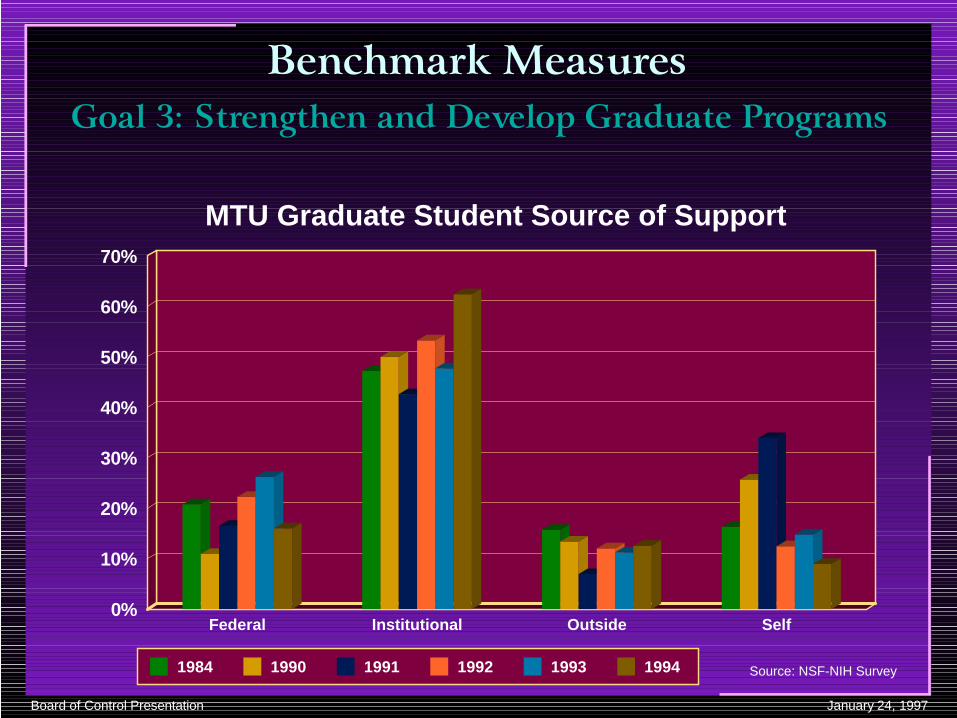
� �����+�������
�����3,��� �� �� $�� ��1����$�����������
0%
10%
20%
30%
40%
50%
60%
70%
Federal Institutional Outside Self
1984 1990 1991 1992 1993 1994
MTU Graduate Student Source of Support
Source: NSF-NIH Survey

Board of Control Presentation January 24, 1997
� �����+������������6,�� ��1���/5��$� ��� $�#���� �� ��- ��� � �
� �5���������������-'�$�-'1���� �
0M
2M
4M
6M
8M
10M
12M
Academic Support Institutional Support
FY90 FY91 FY92 FY93 FY94 FY95 FY96
MTU Academic and InstitutionalSupport Expenditures
Source: IPEDS Finance Surveys
Progress toward Salary Parity�
6.5% - 93/94�
3% - 94/95�
4% - 95/96 & 96/97�
Sick Leave Pool�
Wellness Program�
Staff Handbook�
University Senate Constituency Expansion
�

Board of Control Presentation January 24, 1997
� �����+������������6,�� ��1���/5��$� ��� $�#���� �� ��- ��� � �
� �5���������������-'�$�-'1���� �
0%
2%
4%
6%
8%
10%
12%
ClarksonLehigh
RPICarnegie Mellon
Cal Poly TechMTU
Univ Missouri-RollaColo Sch of Mines
Georgia Tech
1990 1991 1992 1993 1994
Academic Support Expenditures (Percenta ge)
Source: IPEDS Finance Surveys
Private Universities Public Universities
Board of Control Presentation January 24, 1997
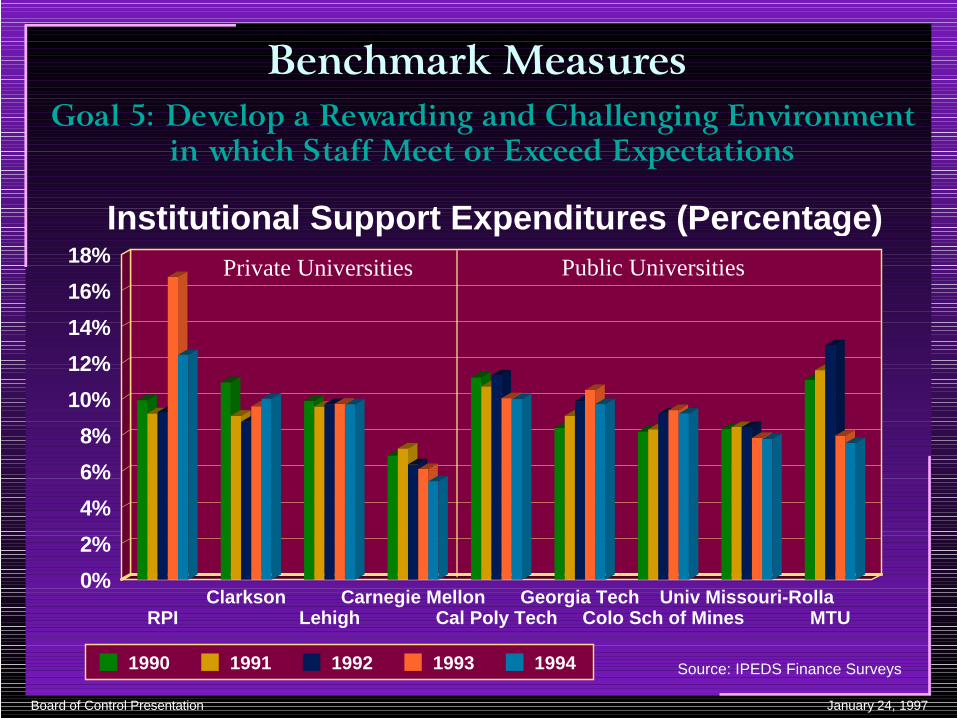
� �����+������������6,�� ��1���/5��$� ��� $�#���� �� ��- ��� � �
� �5���������������-'�$�-'1���� �
0%
2%
4%
6%
8%
10%
12%
14%
16%
18%
RPIClarkson
LehighCarnegie Mellon
Cal Poly TechGeorgia Tech
Colo Sch of MinesUniv Missouri-Rolla
MTU
1990 1991 1992 1993 1994
Institutional Support Expenditures (Percenta ge)
Source: IPEDS Finance Surveys
Private Universities Public Universities