performance indicator resource catalogue version 1.2 … · key performance indicators. is vital to...
TRANSCRIPT
Australian Government Department of Finance and Administration
Performance Indicator Resource Catalogue
Version 1.2
Australian Government Information Management Office Department of Finance and Administration
2006
Archive
d

Contact Information Team Leader ICT Investment Frameworks Branch The Australian Government Information Management Organisation (AGIMO) Department of Finance and Administration Minter Ellison Building, 25 National Circuit, Forrest, ACT 2603 Telephone: 61 02 6215 2222 Email : [email protected]
Acknowledgements AGIMO acknowledges the co-operation, contributions and support of:
- The Office of the Chief Information Officer, Victoria State Government (Department of Premier and Cabinet)
- The Society of Information Technology Management (SocITM) - Office of Evaluation and Audit (Indigenous Programs) Department of
Finance. - Cranfield University for allowing access to their unpublished paper - Office of Government Commerce (OGC) United Kingdom
Further acknowledgements are provided in footnotes.
Archive
d
PERFORMANCE INDICATOR RESOURCE CATALOGUE
CONTENTS How to use this document ......................................................................................................... 1 1. Introduction ........................................................................................................................... 1
1.1. Background – The Importance of ICT and its Management ......................................... 1 1.2. Management requires Measurement............................................................................. 1 1.3. CSFs and KPIs .............................................................................................................. 2 1.4. Performance Management ............................................................................................ 2 1.5. Best Practice Methodologies and Practices .................................................................. 3 1.6. Linking Results to Strategy............................................................................................ 3
2. Performance Indicators ........................................................................................................ 4 2.1. Introduction .................................................................................................................... 4 2.2. PI Types......................................................................................................................... 4 2.3. Performance Indicator Contexts .................................................................................... 5 2.4. Performance Indicator Categories................................................................................. 6 2.5. PI Principles................................................................................................................... 7 2.6. PI Stakeholders and Escalation..................................................................................... 7 2.7. Escalation ...................................................................................................................... 8 2.8. Data Collection .............................................................................................................. 9
2.8.1. Data Collection Methods ........................................................................................ 9 2.8.2. Automated versus Manual Collection................................................................... 11
2.9. Reporting and Visualisation......................................................................................... 11 2.9.1. Reporting .............................................................................................................. 11 2.9.2. Visualisation.......................................................................................................... 11
2.10. Resourcing................................................................................................................. 12 2.11. Span of Control.......................................................................................................... 12 2.12. Tips and Traps........................................................................................................... 13
3. Performance Indicators for Enterprise ICT Management.................................................. 14 3.1. Assessing ICT Management and Maturity .................................................................. 14
3.1.1. CobiT Category - Plan and Organise ................................................................... 14 3.1.2. CobiT Category - Acquire and Implement ............................................................ 15 3.1.3. CobiT Category - Deliver and Support ................................................................. 15 3.1.4. CobiT Category - Monitor and Evaluate ............................................................... 15
3.2. Performance Indicators ............................................................................................... 16 4. Performance Indicators for ICT Projects ............................................................................ 18
4.1. Types of ICT Projects .................................................................................................. 18 4.2. Project Success and Failure........................................................................................ 18
4.2.1. Success Factors ................................................................................................... 19 4.2.2. Reasons for Failure .............................................................................................. 19
Archive
d

AUSTRALIAN GOVERNMENT INFORMATION MANAGEMENT OFFICE
4.3. The Dynamic Nature of Performance Indicators ......................................................... 21 4.4. Performance Indicators ............................................................................................... 23
Glossary of Terms and Definitions: ......................................................................................... 25 Acronyms & Abbreviations ...................................................................................................... 29 Appendix A - Key Methodologies and Best Practices ............................................................. 32
A1 Development of Business Case, Investment Case and Economic Impacts ................. 32 A1.1 AGIMO – Demand and Value Assessment........................................................... 32 A1.2 Balanced Scorecard............................................................................................... 32 A1.3 Triple Bottom Line ................................................................................................. 32
A2 Project Management ..................................................................................................... 33 A2.1 PRINCE2................................................................................................................ 33
A3 ICT Services and Initiative Management ...................................................................... 35 A3.1 ITIL ......................................................................................................................... 35 A3.2 Capability Maturity Model....................................................................................... 35 A3.3 Control Objectives for Information & related Technology (CobiT) .......................... 36 A3.4 Six Sigma ............................................................................................................... 36
A4 Human Resource Management .................................................................................... 38 A4.1 Investors in People Standard ................................................................................. 38
A5 Systems Sizing, Cost Estimation and Management ..................................................... 39 A5.1 Southern Scope...................................................................................................... 39
A6 Risk Management and ICT Security Management ....................................................... 41 A6.1 AS/NZS 4360 – Risk Management ........................................................................ 41 A6.2 Protective Security Manual .................................................................................... 41 A6.3 ISO/IEC 17799 – IT Code of Practice for Information Security Management ....... 41 A6.4 ACSI 33 – Australian Government IT Security Manual.......................................... 42
Appendix B – Index of Further Resources............................................................................... 43 Appendix C - Sources of Performance Indicators & Other Materials ..................................... 45 Performance Indicator Resource Library................................................................................. 47
PIC 1 - Project Success Factors.......................................................................................... 48 PIC2 - Goal Indicators ......................................................................................................... 50 PIC3 - Stakeholders, Entities and People ........................................................................... 52 PIC4 - ICT Investment ......................................................................................................... 60 PIC5 - Alignment with Government Business ..................................................................... 63 PIC6 - Benefits Realisation.................................................................................................. 65 PIC7 - ICT Management...................................................................................................... 67 PIC8 - Incident Management............................................................................................... 76 PIC9 - Workstation Costs .................................................................................................... 78 PIC10 - Servers ................................................................................................................... 80 PIC11 - Mainframe............................................................................................................... 82 PIC12 - Software Development ........................................................................................... 84 PIC13 - Storage, Backup & Data Warehousing .................................................................. 86 PIC14 - e-Government, e-Publishing and Websites............................................................ 88
Performance Indicator Resource Catalogue - Version 1.2 Page 2 of 103
Archive
d

AUSTRALIAN GOVERNMENT INFORMATION MANAGEMENT OFFICE
PIC15 - Telecommunications .............................................................................................. 91 PIC16 - Security................................................................................................................... 94
Performance Indicator Resource Catalogue - Version 1.2 Page 3 of 103
Archive
d

AUSTRALIAN GOVERNMENT INFORMATION MANAGEMENT OFFICE
PERFORMANCE INDICATOR RESOURCE CATALOGUE
FIGURES
Figure 1 – Linking Results to Strategy....................................................................................... 3 Figure 2 – Exponential Escalation Approach ............................................................................ 9 Figure 3 – PIs for Project Lifecycle Stages ............................................................................. 23 Figure 4 - PRINCE2 Process Model........................................................................................ 33
Performance Indicator Resource Catalogue - Version 1.2 Page 4 of 103
Archive
d

How to use this document This document provides an introduction to the use of performance indicators to manage Australian Government ICT projects and the operation of ICT in agencies. The document provides the beginnings of a Performance Indicator Resource Library which details what should be measured, what the most appropriate measures are and how these need to be set up and managed.
This document is divided into two parts.
Part 1 provides an explanation of performance indicators and their application to managing an organisation’s ICT operations and to managing specific ICT projects. This part is linked to key methodologies and best practices for ICT performance management in Appendix A.
Part 2 contains a resource catalogue of performance indicators developed by a variety of government and non-government sources. The library includes web links to additional information and resources.
The document is not intended to be an exhaustive list of the performance indicators required to manage ICT operations and projects. Government agencies and organisations should use the resource library as a guide to selecting the indicators that are most relevant to their requirements. Alternatively, managers may use the library as a source of ideas for developing specific or unique indicators that better match the needs of their particular projects or organisations. Project managers may also use the library to explore additional resources within and external to government to assist them in managing the overall ICT lifecycle.
Archive
d
AUSTRALIAN GOVERNMENT INFORMATION MANAGEMENT OFFICE
1. Introduction
1.1. Background – The Importance of ICT and its Management
The effective operation of ICT is mission critical for the Australian Government. There are few if any programs or services that can operate without the constant underpinning of ICT. ICT represents one of the highest areas of ‘administrative’ spending for the Government, and one that constantly requires new funding for the maintenance and replacement of existing systems and the development and deployment of new systems. ICT also provides the capability that Government can most cost effectively use to improve service levels to customers, directly, through increasing the deployment of e-Government applications, or, indirectly, by providing an increasingly efficient and responsive workplace for Australian Government employees, service providers and suppliers to the Government. While the management of ICT in the Government is generally of a high standard, it is recognised that there is scope for continuous improvement. As in most comparable public and private sector environments there are increasing moves towards making the management of ICT highly:
- precise - predictable; and - professional.
Achieving improved precision, predictability and professionalism is seen as important for: - the overarching management and operation of the enterprise’s existing ICT infrastructure,
systems, and services; and - the planning, development and deployment of new ICT initiatives.
The primary objective of performance management is different for each organisation, but to most and to government it will generally be to obtain value for money. Consequently, this Performance Indicator Resource Library has been produced by AGIMO to assist Australian Government agencies and organisations with effectively using Performance Indicators. Value comes from the comparison of inputs to outputs or outcomes, such as the cost of accomplishment and the related value of net benefits realised. The idea is to ensure that the value of benefits realised exceeds the cost of investment – ie to maximise the return on investment (RoI).
1.2. Management requires Measurement
“If you can’t measure it you can’t manage it.”
The scale and complexity of most ICT environments, and many ICT development initiatives, makes it essential for ICT and Senior Executive Management to have a battery of indicators that reflect the performance of all key aspects of such environments and initiatives. Some indicators may need to be monitored minute by minute, with action taken immediately if performance is not as expected. The performance of systems and networks are examples of this. Other indicators may only need to be monitored at the end of an extended period based upon the happening of an event. Reaching key milestones in development projects or reaching the ‘renegotiation’ point of an outsourced service contract are examples of this. The highly regarded Six Sigma methodology (see Appendix A) has as one of its key themes that management should be “fact and data-driven”. This emphasises the importance of gathering data and analysing key variables. This in turn requires that two questions are answered:
- What information/data does the organisation really need? - How does the organisation use the information/data to its full potential?
These represent key framing questions for the consideration of Performance Indicators.
Performance Indicator Resource Catalogue - Version 1.2 Page 1 of 103
Archive
d
AUSTRALIAN GOVERNMENT INFORMATION MANAGEMENT OFFICE
1.3. CSFs and KPIs
The recognition of the essential nature and usefulness of Critical Success Factors and Key Performance Indicators is vital to effective ICT outcomes. An understanding of this document requires an understanding of the key differences between these two important concepts:
- Critical Success Factors: A critical success factor (CSF) represents a factor that must be present if an objective is to be attained. Achieving success and avoiding failure at an enterprise, business unit or project level depends upon organisations identifying and assuring ‘compliance’ with CSFs. Example: Management commitment and end-user involvement are CSFs for any ICT development initiative.
- Key Performance Indicators: A key performance indicator (KPI) is a specific measure of an organisation's performance in an area of its business. It is a general concept, with different implementations depending on the type of business and goals of the organisation. KPIs are a particular category of Performance Indicators and provide an organisation with quantifiable measurements of factors it has determined are important to its long-term success.
Example: Agency management’s ‘informed’ commitment has been documented and signed off.
The selection of Performance Indicators for enterprise ICT and/or ICT projects should be grounded in an initial identification of the applicable CSFs.
1.4. Performance Management
Performance Indicators are required to support Performance Management. This applies to all aspects of an Agency’s business. ICT Performance Management has to address all manageable aspects of:
- Operational ICT. This represents the mainstream day-to-day aspects of operating Agency ICT environments.
- ICT Projects. These represent new initiatives that, if and when successful, will be absorbed into the Operational ICT. For the purposes of this document the term “ICT Project” is used to denote projects that are of a certain scale relative to the size of the new organisation. These usually represent an addition to the ICT ‘stock’ of the organisation or a major replacement or upgrade of this ‘stock’.
The indicators required for monitoring and assessing of ICT initiatives and those required to monitor and assess operational ‘business as usual’ aspects of ICT are similar in nature but can often have different data sources, timing imperatives and risk profiles. In both it is essential to understand that Performance Management and therefore the indicators that enable the monitoring of the effectiveness of this, need to apply not just to ICT components (e.g. personnel, systems, infrastructure, etc) but to the business functions that the systems support (e.g. customer service, accounting, etc). There are an almost unlimited range of performance indicators available and many more that can be developed to suit specific projects. Performance indicators are not KPIs until selected and applied as key to a specific project. The skill in applying KPIs is in the selection of the optimum number and appropriateness of KPIs. This maximises the benefit of using them whilst minimising the cost of using them. This optimum will vary from, project and project management team, to another.
Performance Indicator Resource Catalogue - Version 1.2 Page 2 of 103
Archive
d
AUSTRALIAN GOVERNMENT INFORMATION MANAGEMENT OFFICE
1.5. Best Practice Methodologies and Practices
Widely accepted and easily accessible best practices (or best known models) are in existence covering all aspects of ICT performance management whether at an enterprise ICT management or project/initiative level. A number of these are showcased in Appendix A. These either embed a range of performance indicators or provide the basis for determining the values to be attributed to performance indicators.
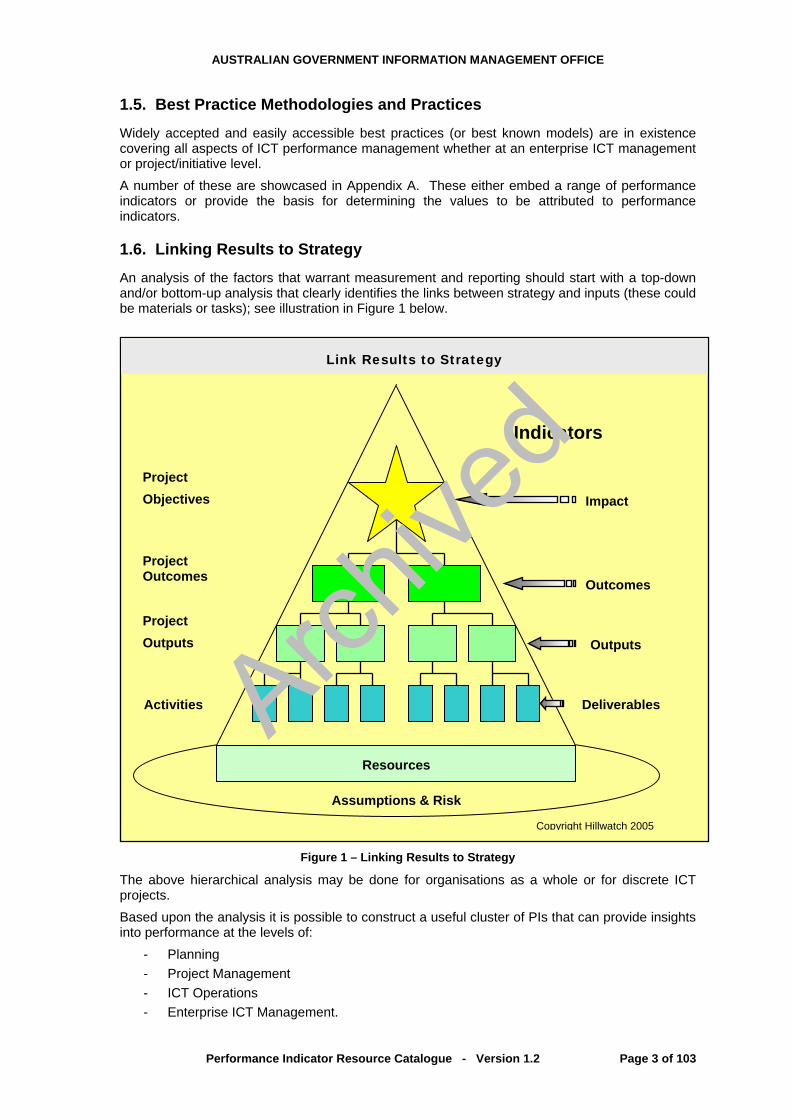
1.6. Linking Results to Strategy
An analysis of the factors that warrant measurement and reporting should start with a top-down and/or bottom-up analysis that clearly identifies the links between strategy and inputs (these could be materials or tasks); see illustration in Figure 1 below.
Project Objectives
Project Outcomes
Impact
Outputs
Assumptions & Risk
Activities
Project Outputs
Indicators
Outcomes
Deliverables
Link Results to Strategy
Resources
Copyright Hillwatch 2005
Figure 1 – Linking Results to Strategy
The above hierarchical analysis may be done for organisations as a whole or for discrete ICT projects. Based upon the analysis it is possible to construct a useful cluster of PIs that can provide insights into performance at the levels of:
- Planning - Project Management - ICT Operations - Enterprise ICT Management.
Performance Indicator Resource Catalogue - Version 1.2 Page 3 of 103
Archive
d

AUSTRALIAN GOVERNMENT INFORMATION MANAGEMENT OFFICE
2. Performance Indicators
2.1. Introduction
Performance Indicators (PI): - Are metrics or factors that tend to indicate the health, progress and/or success of a
project, process or area of service delivery. - Are process-oriented, but IT driven. - Focus on resources and processes that are most likely to lead to successful outcomes. - Are usually short, focused, relevant, measurable, repeatable and consistent. - Measure critical success factors.
‘Good’ performance indicators: - Deliver stakeholder intelligence, insights on program uptake and understanding of
programme impacts and outcomes. - Provide a reporting mechanism to identify, highlight and possibly prioritise corrective,
preventive and developmental action. - Integrate readily with and support governance. - Enhance the value of programs by facilitating insight and optimisation.
Performance Indicators may be: - Leading - if they are predictive of success or failure. - Lagging – if they reflect success or failure after the event. - Coincident – if they change at approximately the same time and in the same direction as
a Project or ICT Operations as a whole.
The management of particular situations will often require a combination of more than one of the above.
Performance indicators should be actionable in the sense that when an indicator reflects a situation or change that exceeds a pre-agreed tolerance, managerial intervention or corrective action should be possible.
The key principles associated with the selection, implementation and use of PIs are provided in section 2.3 below.
2.2. PI Types
All PIs are based upon measurement. Performance Indicators can be quantitative or qualitative. They can be precise and measurable to a high degree of ‘mathematical’ accuracy, or may need to be based upon expert or collective opinion. They can be:
- Binary or Absolute. These are in effect ‘yes’ or ‘no’ measures. They are indicators of whether a ‘desired state’ is present or not. Example: “Has an ICT strategy been prepared?” These indicators often need to be qualified by other less absolute measures. Example: In the case of an ICT Strategy these could represent the answers to the question: “How complete and current is the ICT Strategy?”
Performance Indicator Resource Catalogue - Version 1.2 Page 4 of 103
Archive
d
AUSTRALIAN GOVERNMENT INFORMATION MANAGEMENT OFFICE
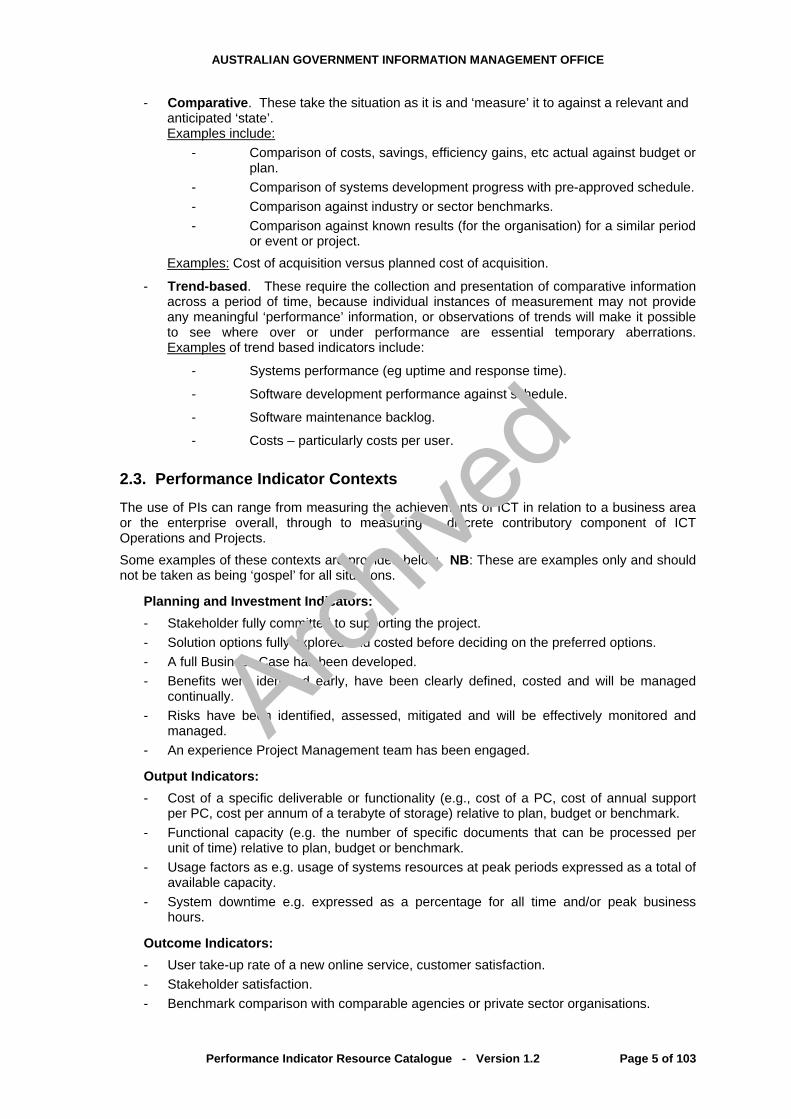
- Comparative. These take the situation as it is and ‘measure’ it to against a relevant and anticipated ‘state’. Examples include:
- Comparison of costs, savings, efficiency gains, etc actual against budget or plan.
- Comparison of systems development progress with pre-approved schedule. - Comparison against industry or sector benchmarks. - Comparison against known results (for the organisation) for a similar period
or event or project. Examples: Cost of acquisition versus planned cost of acquisition.
- Trend-based. These require the collection and presentation of comparative information across a period of time, because individual instances of measurement may not provide any meaningful ‘performance’ information, or observations of trends will make it possible to see where over or under performance are essential temporary aberrations. Examples of trend based indicators include:
- Systems performance (eg uptime and response time).
- Software development performance against schedule.
- Software maintenance backlog.
- Costs – particularly costs per user.
2.3. Performance Indicator Contexts
The use of PIs can range from measuring the achievements of ICT in relation to a business area or the enterprise overall, through to measuring a discrete contributory component of ICT Operations and Projects. Some examples of these contexts are provided below. NB: These are examples only and should not be taken as being ‘gospel’ for all situations.
Planning and Investment Indicators: - Stakeholder fully committed to supporting the project. - Solution options fully explored and costed before deciding on the preferred options. - A full Business Case has been developed. - Benefits were identified early, have been clearly defined, costed and will be managed
continually. - Risks have been identified, assessed, mitigated and will be effectively monitored and
managed. - An experience Project Management team has been engaged.
Output Indicators: - Cost of a specific deliverable or functionality (e.g., cost of a PC, cost of annual support
per PC, cost per annum of a terabyte of storage) relative to plan, budget or benchmark. - Functional capacity (e.g. the number of specific documents that can be processed per
unit of time) relative to plan, budget or benchmark. - Usage factors as e.g. usage of systems resources at peak periods expressed as a total of
available capacity. - System downtime e.g. expressed as a percentage for all time and/or peak business
hours.
Outcome Indicators: - User take-up rate of a new online service, customer satisfaction. - Stakeholder satisfaction. - Benchmark comparison with comparable agencies or private sector organisations.
Performance Indicator Resource Catalogue - Version 1.2 Page 5 of 103
Archive
d

AUSTRALIAN GOVERNMENT INFORMATION MANAGEMENT OFFICE
2.4. Performance Indicator Categories
PIs are required to support a wide range of strategic, tactical and operational contexts. PIs may be hierarchical – i.e. lower order PIs can feed up into higher order PIs. It is possible to categorise PIs in a variety of ways. The table below presents one particular treatment of this.
PI Category Purpose
Investment The investment category examines the returns relative to the outlays. The returns may be financial and/or economic and/or social. This indicator is of most interest to executive management in relation to ‘whole-of-enterprise’ ICT and to sponsors in the case of ICT Projects.
Financial These represent PIs covering costs and revenues relative to an expected (e.g. budget or plan) or benchmarked position. While these represent a key input to the Investment PI category, PIs relative to this category are extremely important in their own right. This category of PIs is relevant to both ICT Projects and ICT Operations.
Human Resources While there are many ‘human’ stakeholders, these PIs relate primarily to ICT staff and contractors. The indicators are required to provide insights into factors such as: productivity, skill and qualification levels, retention, and attendance.
Service These represent PIs covering aspects of service, usually to both end users and personnel within the ICT function. These indicators seek to measure timeliness, adequacy and efficiency of service responses. Whereas these would generally be associated with ICT Operations, there are instances that are highly relevant to ICT Projects.
Procurement and Contractual
These are intended to reflect the adequacy, efficiency, appropriateness and financial outcomes of vendor-related tasks such as procurement and development and management of contracts. These are relevant to both ICT Operations and Projects.
Development These are PIs covering the full Systems Development Lifecycle. While these are of most applicability to ICT Projects they also have applicability to software maintenance and enhancement initiatives.
Training & Support
These are PIs that relate to the completeness, timeliness an effectiveness of training and support provided both to end users and to those in the ICT function. These are relevant to both ICT Operations and Projects.
Operations These PIs reflect the state of operations of infrastructure and systems. They are primarily concerned with performance and reliability.
Systems These PIs relate to individual components of the ICT infrastructure and systems including hardware, software and networks.
Performance Indicator Resource Catalogue - Version 1.2 Page 6 of 103
Archive
d

AUSTRALIAN GOVERNMENT INFORMATION MANAGEMENT OFFICE
PI Category Purpose
Risk Management These PIs are intended to measure the preparedness for and effectiveness of responses to the wide diversity of risks affecting ICT systems and the functions they support. These are important for both ICT Projects and Operations. Different PIs would tend to apply to each of these.
Management and Governance
Whereas the indicators for each of the above categories are in effect indirect ‘commentators’ on the state of ICT Operations or Project Management and Governance, there are additional indicators that reveal the effectiveness, suitability and professionalism of agency approaches to these key disciplines.
2.5. PI Principles
The principles that apply to the selection and ‘implementation’ of Performance Indicators include:
- PIs must be able to lead to an action. In general PIs must be useful not just ‘interesting’.
- Where ‘top level’ PIs are used, an effective ‘drill down’ capacity must be present to enable the determination of the problematic or successful lower order PIs.
- The collection, analysis and reporting must have integrity (this implies accuracy and completeness). A strategy to detect and remedy ‘bias’ must be devised and implemented (see section 2.10).
- The measurement and reporting cost of PIs should be determined. As a general, but not absolute principle, the cost of ‘producing’ PIs should be orders of magnitude lower than the value of the ‘achievements’ or the cost of the ‘problems’ they are seeking to reveal.
- Measurement, and the collection of such measurements, should ideally be embedded into the specific systems and process clusters, and the ‘administrative’ systems and processes around these (eg Human Resources, Financial Accounting). Wherever possible this needs to be intrinsic to the architecting process.
- Consideration should be given as to whether a PI needs to be reported at all times, or only where the PI exceeds or falls below a pre-determined threshold.
- PIs are only indicators. Determination of the causes of performance aberrations will often require an analysis of the underlying situations and/or data.
2.6. PI Stakeholders and Escalation
PIs apply to all levels of stakeholders directly and indirectly involved in ICT. Determination of the PIs that are useful and relevant to particular stakeholders needs to be determined based upon:
- Their responsibility for performance in the category being measured by the PI. This relates to both indirect as well as direct responsibility. However the more indirect the level of responsibility the less granular the PI should be, and the more it should only be reported on an exception basis.
- Their responsibility for the business function that will be impacted by ICT performance. Such PIs are usually reflected in formal or informal Service Level Agreements between business divisions and the ICT division.
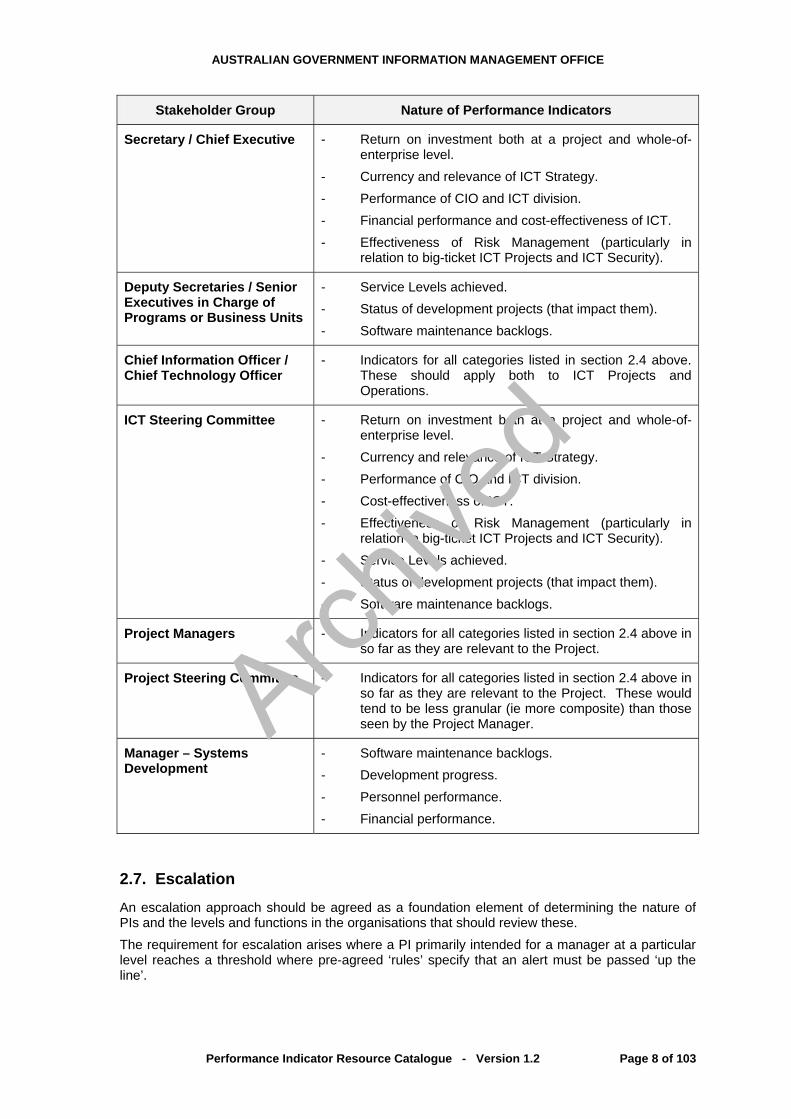
The table below makes some suggestions as to categories of stakeholders and the nature of appropriate PIs.
Performance Indicator Resource Catalogue - Version 1.2 Page 7 of 103
Archive
d
AUSTRALIAN GOVERNMENT INFORMATION MANAGEMENT OFFICE
Stakeholder Group Nature of Performance Indicators
Secretary / Chief Executive - Return on investment both at a project and whole-of-enterprise level.
- Currency and relevance of ICT Strategy. - Performance of CIO and ICT division. - Financial performance and cost-effectiveness of ICT. - Effectiveness of Risk Management (particularly in
relation to big-ticket ICT Projects and ICT Security).
Deputy Secretaries / Senior Executives in Charge of Programs or Business Units
- Service Levels achieved. - Status of development projects (that impact them). - Software maintenance backlogs.
Chief Information Officer / Chief Technology Officer
- Indicators for all categories listed in section 2.4 above. These should apply both to ICT Projects and Operations.
ICT Steering Committee - Return on investment both at a project and whole-of-enterprise level.
- Currency and relevance of ICT Strategy. - Performance of CIO and ICT division. - Cost-effectiveness of ICT. - Effectiveness of Risk Management (particularly in
relation to big-ticket ICT Projects and ICT Security). - Service Levels achieved. - Status of development projects (that impact them). - Software maintenance backlogs.
Project Managers - Indicators for all categories listed in section 2.4 above in so far as they are relevant to the Project.
Project Steering Committee - Indicators for all categories listed in section 2.4 above in so far as they are relevant to the Project. These would tend to be less granular (ie more composite) than those seen by the Project Manager.
Manager – Systems Development
- Software maintenance backlogs. - Development progress. - Personnel performance. - Financial performance.
2.7. Escalation
An escalation approach should be agreed as a foundation element of determining the nature of PIs and the levels and functions in the organisations that should review these. The requirement for escalation arises where a PI primarily intended for a manager at a particular level reaches a threshold where pre-agreed ‘rules’ specify that an alert must be passed ‘up the line’.
Performance Indicator Resource Catalogue - Version 1.2 Page 8 of 103
Archive
d

AUSTRALIAN GOVERNMENT INFORMATION MANAGEMENT OFFICE
An exponential approach, as illustrated in the diagram below is considered most appropriate. This shows that as performance falls below expectations (as indicated by the state of PIs) little escalation happens when the ‘deficit’ is small, but escalation ramps up significantly once the ‘deficit’ reaches a threshold point.
Figure 2 – Exponential Escalation Approach
How ‘high’ such alerts need to travel is a detailed matter, but one that must be agreed between all levels of management from the top down.
2.8. Data Collection
All PIs require the collection and presentation of information. In many cases aggregation and analysis of information is required. Once a PI is selected a collection ‘game plan’ must be put in place and responsibility assigned to the appropriate persons. The detailed rules should include coverage of:
- Who the custodian of the information is.
- Who may have access to this information.
- How long the information is to be held for.
- The nature of ‘audit trails’ to be held to enable verification of information and/or backtracking to enable e.g. identification of ‘cause and effect’ of a performance aberration.
2.8.1. Data Collection Methods
Data collection methods vary dependent upon whether the data to be collected is quantitative or qualitative.
Performance Indicator Resource Catalogue - Version 1.2 Page 9 of 103
Archive
d

AUSTRALIAN GOVERNMENT INFORMATION MANAGEMENT OFFICE
2.8.1.1. Quantitative
Approaches to data collection include:
- Quantitative descriptive or inferential data analysis.
- Statistical analysis. This involves the statistical interpretation of data.
- Synthetics. This represents the building of synthetic data from collected data.
- Exceptions technique. Results are produced by applying tolerances to data to producing an acceptable range. When results fall outside the range they are flagged for attention and possible managerial intervention (corrective action).
- Research standards and norms for benchmarking against other similar organisations and the private sector with similar systems, e.g. banks.
- Balanced scorecard method – see Appendix A.
- Dashboard readout of business intelligence reading real-time intelligent knowledge metrics from the business process.
- Financial and economic analysis, including various management accounting techniques, RoI (return on investment), NPV (net present value), cost-benefit analysis, IRR (internal rate of return).
- Operations Research Technique may be drawn for industrial engineering and work study which are generally quantitative.
- Observation studies using check lists or other systemic forms.
2.8.1.2. Qualitative
Approaches to data collection include: - Qualitative data analysis. This includes analysis of user records by webmasters, system
administrators, etc. - Surveys and/or questionaries of take-up, approval and acceptance. Survey
questionnaires can be conducted by: mail, email, web, or occasionally face to face. Needs to be well designed and piloted.
- Telephone survey / interview. Telephone interviews may be more valid than either written or face to face interview.
- Face to face. This is really a questionnaire for which the information is collected by and interviewer rather than being completed (penned) by the contributor.
- Automated e-survey by email to users. - Community consultation.
- Public, community, agency or stakeholder submissions. - Focus groups with 5-10 participants. - Nominal Groups. This is a brain storming type exercise to identify
problems, propose solutions and prioritise actions. - The normal group technique for brain storming, possibility thinking. - Observation of people should be “unobtrusive” (subjects should be
unaware so as to avoid influencing the result). - Diaries and activity logs. - Audit using different strategies, including interviews, desktop analysis and random or
targeted sampling across the following dimensions: vertical, horizontal, project, department, procedure, and process.
- Observation studies using check lists or other systemic forms. - Behavioural analysis. An analysis and interpretation of human behaviour, particularly in
terms of user behaviour changes, patterns, cycles, growth trends, but also of service providers, such as help desk and call centre staff.
- Custom analysis using: Demand and value (DAMVAM / DVAM); Accenture Public Sector Value Model (PSVM); Cap Gemini / EU Performance Framework.
Performance Indicator Resource Catalogue - Version 1.2 Page 10 of 103
Archive
d

AUSTRALIAN GOVERNMENT INFORMATION MANAGEMENT OFFICE
- SWOT analysis. SWOT = Strengths, Weakness, Opportunities and Threats. The objective is to identify the SWOT and then develop actions, because without appropriate action a SWOT is impotent. Actions should capitalise on strengths, minimise weakness, exploit opportunities and neutralise threats. Such action should be fully integrated with a business plan, or become a business plan.
- Case studies. Learning by examining previous cases of successful, partially successful or failed projects. These projects may have some area of commonality through the agency, management team, system of governance, technology or stakeholder/s, etc.
2.8.2. Automated versus Manual Collection
Manual data collection can be tedious and costly, especially if collection must be repeated regularly. It can, however, be useful for infrequent or small group sampling, special studies, etc. such as user surveys. Where frequent or large data samples are automated systems almost invariably collects and produces more accurate and less costly data. Well established automated data collection can be facilitated through a range of monitoring and collection utilities. Some utilities come bundled with operating systems, database management systems, security and network management and business application systems. Others may need to be purchased. In some situations it will even be necessary to modify business applications to ensure that they collect the required metrics. Automated systems enable traffic statistics of traffic densities, cycles, failures, etc., to be reported at low cost in terms of collection, processing and presentation. Automatic collection can more reliably and economically collect high volume of low to high importance data. Analysis and presentation of data is often part of such utilities, but in other cases it will be necessary to use generalised statistical analysis and presentation systems and general purpose tools such as spreadsheets. The use of automated collection (and analysis and reporting) tools enables a user to exceed their ‘span of control’.
2.9. Reporting and Visualisation
2.9.1. Reporting
In implementing a PI it is necessary to determine: - What is to be reported. While the PI itself will obviously be reported, it will be necessary
to determine what else needs to accompany this to make the information usable and actionable by the person/people to whom it is reported. Additional information could include e.g. trends relative to the PI over previous periods, the status of subsidiary PIs to provide more granularity of analysis, explanations for the good or bad ‘deviations’ provided by the responsible person.
- To whom. This may be one or more persons and may be dependent upon the status of the ‘indicator’. ‘Status’ is intended to convey the degree of ‘goodness’ or ‘badness’ and seriousness or lack of seriousness of the indicator. ‘Rules’ need to be created – e.g. if the PI is within acceptable limits it should only be reported to the project manager. If the PI is outside of acceptable limits it should also be reported to the CIO.
- How often or when. This needs to accommodate a regular frequency of reporting for some PIs, but an ‘event driven’ approach for other PIs. Examples of the latter would include project milestones or PIs reaching a trigger point where urgent action is required.
2.9.2. Visualisation
Visualisation relates to how the PI is represented. Whereas a text representation is obvious this is often not the clearest or most impact-full way of showing a PI or collective of PIs.
Performance Indicator Resource Catalogue - Version 1.2 Page 11 of 103
Archive
d

AUSTRALIAN GOVERNMENT INFORMATION MANAGEMENT OFFICE
Graphical approaches adopted by the private and public sector include: - Dashboard. This is an analogue of a vehicle dashboard or aircraft cockpit display. The
intention is to provide the person with a graphical representation of key PIs that enable them to take action. Techniques applied include digital, ribbon and dial displays, moving bar graphs, and ticker tape analogues.
- Traffic Light. The use of a ‘green, amber, red’ approach to PIs enables the reader to determine at a glance whether a situation is as expected (green), moving towards being below expectations (amber) or seriously below expectations (red).
- Graphs. These are particularly useful where the PI is most informative when viewed as part of a trend or when compared with other linked or comparable factors.
2.10. Resourcing
In most situations, preparing and presenting and effectively using PIs is not a trivial exercise. Many PIs require the gathering and analysis of data from a number of sources and its timely presentation in the most appropriate format. There are implications for the responsible person or people as well. For PIs to function properly the ‘readers’ or ‘consumers’ must be in a position to receive and react to the PIs within appropriate time windows. The strategy developed around PIs must factor detail of how both of the above will be handled. It must identify the persons responsible for collection, those responsible for analysis and presentation and those responsible for reading and reacting to the information. Logical points for the collection of data include:
- Program and/or project offices.
- Accounting functions – both financial and management accounting.
- Human resources functions.
- Quality assurance functions.
- Compliance functions.
- Help desks.
The analysis and reporting of PIs is ideally best handled by persons who understand the context of the Project or ICT Operations as a whole. They should be the first point to investigate anomalous results. In this way they take on an integrity checking function. It is important to have this function independent from and not responsible for the areas being measured by the PIs. In effect they provide a quasi-audit function.
2.11. Span of Control
‘Span of Control’ is a well understood concept relating to the number of ‘direct reports’ a manager could/should have or the number of functions a manager should manage. It has been found from organisational theory research that the typical span of control in a managerial situation is 5 to 9 and that 7 is optimal for a person that is competent in that discipline. However, the possible range is huge and certainly 1-20 for complex dependencies, 7-60 or more for less complex dependencies, 50-100s for low complex dependencies1. This concept can be applied to the area of Performance Indicators, the principle being that one person should only have to monitor a limited range of PIs. The Victoria State Government, in its new Benefits Management Programme, specifies that “7” benefits be measured and that each has no more than two KPIs.
1 Organizational Theory: Determinants of Structure, www.Analytictech.com; A9 general Search, a9.com Span of Control Theory Search Span of Control, Report No. 94-1, www.metrokc.gov
Performance Indicator Resource Catalogue - Version 1.2 Page 12 of 103
Archive
d

AUSTRALIAN GOVERNMENT INFORMATION MANAGEMENT OFFICE
In the case of managing metrics or performance indicators effectively within one’s span of control, professionals may monitor hundreds of metrics periodically if they require little and infrequent attention and if they are of low complexity. However, in reality where complex intervention or corrective action is necessary managers frequently have other responsibilities. In these situations the maximum might best be limited to 7.
2.12. Tips and Traps
The selection and use of Performance Indicators is as much of an art as a science. With this as a backdrop some tips and traps are covered below:
- Most PIs are intended to be indicative rather than conclusive. They are also intended to be an aid not a ‘ball and chain’. It is essential that any approach to the structuring and use of PIs is able to contend with situations where deviation from PIs is highly desirable and where single-mindedly managing Projects or Operations to achieve a ‘positive’ PI may be at odds with the best interests of the agency. Examples of such situations include: situations in which there have been changes to underlying ‘environmental’ variables, or where market conditions or stakeholder responses or prudent risk management have made particular actions essential (changing the time or priorities for a project; culling a project; culling functionality; etc)
- For PIs that rely upon comparing the current ‘achievement’ with e.g. benchmarks, plans, budgets, prior experiences, etc it is essential to ensure that an ‘apples-to-apples’ comparison is being made. This requires that the people compiling and using the PIs have significant insights into how both the ‘actual’ and ‘comparative’ components were derived.
- Some PIs may reflect a short term anomaly that does not require corrective action. Most often these relate to timing issues. Those preparing PIs need to be able to recognise such instances and, flag them for the attention of those using the PIs. It may also be necessary to apply smoothing to results to remove the impact of short term, irrelevant deviations.
- The potential for evaluation bias should be recognised and strategies put in place to manage this. The risk of evaluation bias will particularly arise where the outcomes could lead to loss of face or damage to reputation and threats to financial incentives or even tenure of employment. Approaches to avoidance of evaluation bias include:
- Ensuring an independent evaluation of PIs and the methods used to collect and report data. ‘Independent’ does not have to mean ‘external’. It will be sufficient for the efficacy of PIs to be evaluated by a sufficiently senior and knowledgeable person that is at arms length from the area to which the PI applies.
- Ensuring the ‘fairness’ of what is being evaluated particularly where the PI can be linked with a person or team. This involves measuring and reporting on ‘controllable’ areas – i.e. where the person or team not only has responsibility and accountability but also full authority. It also involves allowing for explanations of variances.
- Having a balance sheet approach to PIs. This has two meanings. Firstly, allow for an appropriate cluster of PIs (or their underlying factors) to be reported together so that pluses and minuses are seen together; often the one will explain the other. Secondly, attempt to identity PIs that can act as ‘check totals’. So, the aggregate of underlying PIs should be in balance with a ‘top level’ PI. The corollary is also true.
- Using external independent resources to conduct surveys that require qualitative responses based upon people’s perception of performance or satisfaction.
Performance Indicator Resource Catalogue - Version 1.2 Page 13 of 103
Archive
d

AUSTRALIAN GOVERNMENT INFORMATION MANAGEMENT OFFICE
3. Performance Indicators for Enterprise ICT Management
Performance indicators for the overarching management of an enterprise’s ICT Management should be primarily drawn from the following sources:
- The IT Infrastructure Library (ITIL). See Appendix A3.1
- The Capability Maturity Model Integration (CMMI). See Appendix A3.2
- Control Objectives for IT (CObIT). See Appendix A3.3
Each of these provides detailed guides to implementing processes and practices that are designed to yield optimal performance in both operations and development environments. Agency business expectations dictate that ICT Performance Indicators allow for transparent and timely registering of the levels attained in the areas of:
- Systems reliability and responsiveness. - Operational and user-support and training service delivery. - Value for money.
3.1. Assessing ICT Management and Maturity
A Key Performance Indicator relates to the core issue of how well organisations manage ICT. “Control Objectives for Information and related Technology (COBIT®)2 provides good practices across a domain and process framework and presents activities in a manageable and logical structure. COBIT’s good practices represent the consensus of experts. They are strongly focused on control and less on execution. These practices will help optimise IT-enabled investments, ensure service delivery and provide a measure against which to judge when things do go wrong.”3
“Goals and metrics are defined in CobiT at three levels: - IT goals and metrics that define what the business expects from IT (what the business
would use to measure IT). - Process goals and metrics that define what the IT process must deliver to support IT’s
objectives (how the IT process owner would be measured). - Process performance metrics (to measure how well the process is performing to indicate
if the goals are likely to be met).” CobiT lists four categories (and 34 sub-categories) of ICT activities that need to be managed effectively4. CobiT then provides organisations with a structured approach to determining the level of maturity of their management of ICT based upon a rating for each of the (relevant) categories/sub-categories.
3.1.1. CobiT Category - Plan and Organise
PO1 Define a strategic IT plan. PO2 Define the information architecture. PO3 Determine technological direction. PO4 Define the IT processes, organisation and relationships.
2 Key Reference Site: www.isaca.org/cobit3 This excerpt and others in this section are from: CobiT 4.0 – downloadable from www.isaca.org/cobit4 The CobiT Maturity Model derived from the Software Engineering Institute’s Capability Maturity Model –
see www.sei.cmu.edu/
Performance Indicator Resource Catalogue - Version 1.2 Page 14 of 103
Archive
d

AUSTRALIAN GOVERNMENT INFORMATION MANAGEMENT OFFICE
PO5 Manage the IT investment. PO6 Communicate management aims and direction. PO7 Manage IT human resources. PO8 Manage quality. PO9 Assess and Manage IT risks. PO10 Manage projects.
3.1.2. CobiT Category - Acquire and Implement
AI1 Identify automated solutions. AI2 Acquire and maintain application software. AI3 Acquire and maintain technology infrastructure. AI4 Enable operation and use. AI5 Procure IT resources. AI6 Manage changes. AI7 Install and accredit solutions and changes.
3.1.3. CobiT Category - Deliver and Support
DS1 Define and manage service levels. DS2 Manage third-party services. DS3 Manage performance and capacity. DS4 Ensure continuous service. DS5 Ensure system security. DS6 Identify and allocate costs. DS7 Educate and train users. DS8 Manage service desk and incidents. DS9 Manage the configuration. DS10 Manage problems. DS11 Manage data. DS12 Manage the physical environment. DS13 Manage operations.
3.1.4. CobiT Category - Monitor and Evaluate
M1 Monitor and evaluate IT performance. M2 Monitor and evaluate internal control. M3 Ensure regulatory compliance. M4 Provide IT governance.
The CobiT Maturity Model provides organisations with a structured approach to determining the level of maturity of their management of ICT based upon a rating for each of the (relevant) categories/sub-categories listed above.
Performance Indicator Resource Catalogue - Version 1.2 Page 15 of 103
Archive
d

AUSTRALIAN GOVERNMENT INFORMATION MANAGEMENT OFFICE
CobiT determines the level of ICT maturity as being at one of six levels:
CobiT Level ‘Shorthand Description’
Explanation
0 Non Existent Management processes are not applied at all.
1 Initial Processes are ad hoc and disorganised.
2 Repeatable Processes follow a regular pattern.
3 Defined Processes are documented and communicated.
4 Managed Processes are monitored and measured.
5 Optimised Good practices are followed and automated.
CobiT recommends that organisations identify where the organisation currently rates relative to where they want the organisation to be and relative to eg industry averages.
3.2. Performance Indicators
Overarching management of ICT for enterprises requires that the monitoring of performance across a wide range of factors. Whereas the methodologies and best practice approaches cited in section 3.1 above provide an overview of all factors, further detail is often required in relation to particular elements. Appendix A provides a synopsis of the methodologies and better practices that provide the basis for determining performance standards and performance measures. These are:
- Investment and Financial – see Appendix A1
- Project Management – see Appendix A2
- ICT Services and Initiatives Management – see Appendix A3
- Human Resources Management – see Appendix A4
- Systems Sizing, Cost Estimation and Management – see Appendix A5
- Risk Management & ICT Security Management – see Appendix A6
The table below provides a cross-reference to the Better Practice Approaches contained in Appendix A and the detailed PI Group Sheets contained in the Resource Catalogue.
PI Category Best Practice Methodologies (summarised in Appendix A)
Applicable Performance Group/s from the
Resource Catalogue
Investment Planning and Evaluation
- AGIMO ICT Business Case Guide & Tools
- Triple Bottom Line - Balanced Scorecard
PICs 1,2,4,5,6
Financial Management
- AGIMO ICT Business Case Guide & Tools
- Balanced Scorecard
PICs 4,5,6
Human Resources - Investors in People standard
PICs 3,7
Performance Indicator Resource Catalogue - Version 1.2 Page 16 of 103
Archive
d

AUSTRALIAN GOVERNMENT INFORMATION MANAGEMENT OFFICE
PI Category Best Practice Methodologies (summarised in Appendix A)
Applicable Performance Group/s from the
Resource Catalogue
Service - ITIL - Six Sigma - CobiT
PIC 7,8,9,10,11,12,13,14,15
Procurement and Contractual
- ITIL - CobiT
PICs 7, 9,10,11,12
Operations - ITIL - CobiT
PIC 7,8,9,10,11,12,13,14,15
Systems Maintenance
- ITIL - CMMI - Southern Scope
PICs 7,8,12,14
Training & Support
- ITIL PICs 3,7
Risk Management - AS/NZS 4360 - Protective Security
Manual
PICs 7,8,16
ICT Security Management
- ISO/IEC 17799 - ACSI33
PIC 16
Management and Governance
- CobiT PICs 2,3,5,7
Performance Indicator Resource Catalogue - Version 1.2 Page 17 of 103
Archive
d

AUSTRALIAN GOVERNMENT INFORMATION MANAGEMENT OFFICE
4. Performance Indicators for ICT Projects Performance Indicators for ICT projects are necessarily focused on a range of short and medium term objectives. The use of PIs for projects is warranted where the projects are discrete and ‘large’ in scale and/or cost and/or risk relative to the size of the organisation. Systems maintenance and small development and acquisition projects are seen as being effectively covered under the ‘mainstream’ areas described in section 3 above. PIs for short term objectives relate significantly to how well the project is being managed in relation to personnel and stakeholders, analysis and design, development and testing, procurement and budget management. PIs for medium term objectives relate significantly to how closely the project is tracking to reaching the key business objectives.
4.1. Types of ICT Projects
The major dimensions of ICT projects are:
- The components will consist of one or more of hardware, software, telecommunications, and other services.
- The intended user-base can be internal, or external (as in eGovernment applications) or both.
- The systems will be new or replacements of existing systems or a combination of both.
A recent analysis of ICT ‘development’ projects provides the following taxonomy:
- Developed from scratch.
- Developed some components and purchased others.
- Purchased application and modified.
- Purchased components and assembled the application.
- Purchased application and modified extensively.
- Purchased application and performed no modifications.
The level and areas of risk will vary dependent upon these dimensions and the scale and complexity of the underlying ‘business’ requirements. The selection and use of Performance Indicators will be significantly informed by these factors.
4.2. Project Success and Failure
In determining suitable Performance Indicators for ICT Projects it is useful to reflect on what are seen as the main reasons for success and the main causes of failures of such projects. Success, failure, and outcomes in between, are reflected in how the following questions are answered at the conclusion of an ICT project:
- Was the development delivered on time and on budget with most or all of the required features and functions?
- Was the system taken up and used by the anticipated user base? - Does the new system provide the required business benefits?
Performance Indicator Resource Catalogue - Version 1.2 Page 18 of 103
Archive
d

AUSTRALIAN GOVERNMENT INFORMATION MANAGEMENT OFFICE
4.2.1. Success Factors
The Standish Group, well known for their CHAOS report, identify the following ten ‘success’ factors:
Success Factor Weighting
Executive Support 18
User Involvement 16
Experienced Project Manager 14
Clear Business Objectives 12
Minimised Scope 10
Standard Software Infrastructure 8
Firm Basic Requirements 6
Formal Methodology 5
Reliable Estimates 5
Other (eg small milestones, proper planning, project ownership)
5
Further analyses of these factors are available from Extreme CHAOS (2001). In selecting PIs to monitor and assess ICT Projects it is important to ensure that they can act as indicators of the degree of ‘compliance’ of the project with these success factors.
4.2.2. Reasons for Failure
The UK Office of Government Commerce (OGC) identifies the causes of IT project failures as:
- Design and definition failures.
- Decision making failures.
- Project discipline failures.
- Supplier management failures.
- People failures. OGC provides the following more detailed analysis of the above5:
5 Source: Why IT Projects Fail – UK Office of Government Commerce – www.ogc.gov.uk
Performance Indicator Resource Catalogue - Version 1.2 Page 19 of 103
Archive
d

AUSTRALIAN GOVERNMENT INFORMATION MANAGEMENT OFFICE
Causes of Failure Impacts on Projects
Design and Definition Failures - Required outputs not described with
sufficient clarity – no scope definition prior to authorisation.
- Over-ambition – sweeping into a single project all “good ideas – all deliverables in one chunk”.
- Project seen as an IT project, not as part of wider process to deliver business objectives.
- End-goal too distant with too few review points to confirm business case.
Projects have little understanding of what they have to do to “succeed” and far too many stakeholders to satisfy. Without clear definition of interim success or assessment of what is achievable, projects drift into long term activities which become uncontrolled and uncontrollable.
Ultimately, failure is designed in.
Decision Making Failures - Prime responsibility rests with
committees. - Consensus must be achieved on all
issues. - No single individual in authority – project
manager makes decisions in absence of sponsor.
Key issues are logged, but remain unresolved as all people with an interest are consulted. Outcomes of consultation will be blurred in order not to trigger opposition and veto. Projects are not given clear direction – key actions are not taken or are inconsistent.
Ultimately, a failed project evolves.
Project Discipline Failures - Project documentation replaces project
management. - Milestones are too distant – slippage is
not managed. - Weak arrangements to identify and
evaluate risks and allocate them to managers with authority.
- Requirements changes not reflected in “immutable” deadlines.
- Contingency planning is weak or unrealistic.
- Project beyond the experience and capability of the Project Manager
Plans are constructed based on deadlines which are pre – determined; few people actually believe they reflect reality so slippage or the impact of change is not taken seriously. Prospect of failure is not allowed to be acknowledged so few preparations are made for problems which do arise.
Ultimately, the project moves, unacknowledged, into failure, costs escalate.
Performance Indicator Resource Catalogue - Version 1.2 Page 20 of 103
Archive
d

AUSTRALIAN GOVERNMENT INFORMATION MANAGEMENT OFFICE
Causes of Failure Impacts on Projects
Supplier Management Failures - Project has little understanding of
supplier commercial imperatives (e.g. in fixed price contracts).
- Supplier not selected on basis of value for money.
- Projects are launched without an agreed contractual completion date, acceptance criteria and cost limit.
- Insufficient transparency of management information between client and supplier.
- Suppliers managed to limit cost rather than risk – no validation of suppliers’ assumptions.
The key early part of the project is confused by contractual debate and positioning – often leaving both sides disappointed. This mistrust is then exacerbated by misunderstanding of supplier and project motivations creating further disputes and resort to contract – leading to a culture of secrecy and “sides”
Ultimately, the project focuses its energies on blame for failure.
People Failures - Disconnect between project and those
who own the need. - Culture in project teams to explain away
real risks and to hide not address problems.
- Needs of users not understood due to secrecy or haste during definition and design phase.
- Too few senior people with real authority
Project staff develops, what they believe to be “developable” and avoid asking for guidance – given the risk of veto and delay. Requirement “owners” fail to understand what is feasible and therefore request deliverables and change which are impracticable in the given timescales or budget. Ultimately, the project delivers failure.
In selecting PIs to monitor and assess ICT Projects it is important to ensure that they can act as indicators of the degree of ‘compliance’ of the project with these success factors.
4.3. The Dynamic Nature of Performance Indicators
In project environments it is important to be aware of the dynamic nature of performance indicators. This means that as projects go through lifecycle stages PIs will change. It is also true that some PIs will persist across all stages. A project lifecycle usually consists of three distinct evolutionary phases. These are analysed below:
1st Phase Planning
2nd Phase Contract
3rd Phase Operational
Pre-contract Contract Post-contract
Strategic Design
Project Implementation
Operational (Service Delivery)
Structural Planning
Development Monitoring
Budget Approval
System Testing & Acceptance
Continual Improvement
Performance Indicator Resource Catalogue - Version 1.2 Page 21 of 103
Archive
d

AUSTRALIAN GOVERNMENT INFORMATION MANAGEMENT OFFICE
1st Phase 2nd Phase 3rd Phase Planning Contract Operational
Intellectual Activity
Physical Activity
Service Delivery
Typical KPI-
Success KPI
Typical KPI- Progress, Testing,
Acceptance.
Typical KPI Service Delivery User Satisfaction
Growth
>>>>>>>>>>>>>>>>>>>>>>>>>>>>> Time >>>>>>>>>>>>>>>>>>>>>>>>>>>>
>>>>>>>>>>>>>>>>>>>>>>>>> Project Lifecycle >>>>>>>>>>>>>>>>>>>>>>>.
N.B. any time scale could be in months or years. The width of the coloured blocks above may be typical of some project, perhaps 1-2 years in planning 2-5 in implementation and 5-10 in operation
In the strategic design and planning phase activities should to be driven, or anchored by a strong focus on needs driven realisable benefits. These planned benefits should have realistic, attributed monetary values enabling comparison to investment costs. This focus on benefits will enable cost benefit planning. However, in the final assessment, after benefits have been established and demonstrated, assessment should be of the net realised benefits (NRB). The NRB will be compared to planned benefits. The NRB commonly differ from the planned benefits as a result of scope creep, unplanned benefits, planned benefits not realised and disbenefits. Different types of performance indicators may apply to different activities within different phases of the lifecycle. However, some indicators will be planned early for later measurement, e.g., benefits will be planned early in phase one, may be measured early in phase three, but can not be validated until service delivery is established and settled. Other KPIs may have similar common labels, but the content may be different, e.g., one might have output KPIs for phases 1 and 2, but one will relate to planning outputs and the other to project implementation outputs. The critical KPIs generated from planning (phase 1) will be predictive success indicators. Many success indicators may not be able to be fully identified until the phase is nearing closure. At the end of phase 1, success indicators will give the owner, ‘financier’ and Government a good indication of the likelihood of success and will contribute to the decision of whether or not to proceed with the project and commit resources to it, or whether to ‘return to the drawing board’. Figure 3 below is intended to illustrate both the hierarchical nature of PIs and KPIs, as well as their positioning across the systems development lifecycle.
Performance Indicator Resource Catalogue - Version 1.2 Page 22 of 103
Archive
d

AUSTRALIAN GOVERNMENT INFORMATION MANAGEMENT OFFICE
Phase 1 Planning
Phase 2 Contract
Phase 3 Operational
Evolutionary Progress of Performance Indicators
Time (Project Lifecycle)
PIs PIs
KPIs
PIs
KPIs
PIs PIs
KPIs
PIs
KPIs
Outputs
Project Success
Prediction
Operational
KPIs
Investment Validation Indicators
Project KPIs
Project Mgmt.
Verification
Benefits
KPIs
Benefits Realisation Indictors
Monitoring for Continual Improvement
High Level Strategic Priorities
and Outcomes
N.B. KPIs are
escalated to an
appropriate level
Concept Logic
>>>>>>>>>> >>>>>>>>>>>> >> Project Lifecycle >>>>>>>>>>>>
Figure 3 – PIs for Project Lifecycle Stages
4.4. Performance Indicators
The table below provides a cross-reference to the Better Practice Approaches contained in Appendix A and the detailed PI Group Sheets contained in the Resource Catalogue.
PI Category Best Practice Methodologies (summarised in Appendix A)
Applicable Performance Group/s from the
Resource Catalogue
Investment Planning and Evaluation
- AGIMO ICT Business Case Guide & Tools
- Triple Bottom Line - Balanced Scorecard
PICs 1,2,3,4,5,6,12
Performance Indicator Resource Catalogue - Version 1.2 Page 23 of 103
Archive
d

AUSTRALIAN GOVERNMENT INFORMATION MANAGEMENT OFFICE
PI Category Best Practice Methodologies (summarised in Appendix A)
Applicable Performance Group/s from the
Resource Catalogue
Financial Management
- AGIMO ICT Business Case Guide & Tools
- Balanced Scorecard
PICs 1,2,4,5,6
Human Resources - Investors in People standard
PICs 3,7
Service - ITIL - Six Sigma - CobiT
PICs 3,7,8,9,10,11,12,13,14,15
Procurement and Contractual
- ITIL - CobiT
PICs 7, 9,10,11,12
Project Management
- PRINCE2 PIC 1,3,7
Operations - ITIL - CobiT
PICs 3,7,8,9,10,11,12,13,14,15
Systems Analysis, Design, Effort Estimation, Management
- ITIL - CMMI - Southern Scope
PICs 1,3,4,5,7,12,14,15
Systems Testing - ITIL - CMMI
PICs 7,8,14
Training & Support
- ITIL PICs 3,7,8,14
Risk Management - AS/NZS 4360 - Protective Security
Manual
PICs 8,16
ICT Security Management
- ISO/IEC 17799 - ACSI33
PICs 8,16
Management and Governance
- CobiT - PRINCE2
PICs 1,2,3,4,5,6,7
Performance Indicator Resource Catalogue - Version 1.2 Page 24 of 103
Archive
d
AUSTRALIAN GOVERNMENT INFORMATION MANAGEMENT OFFICE
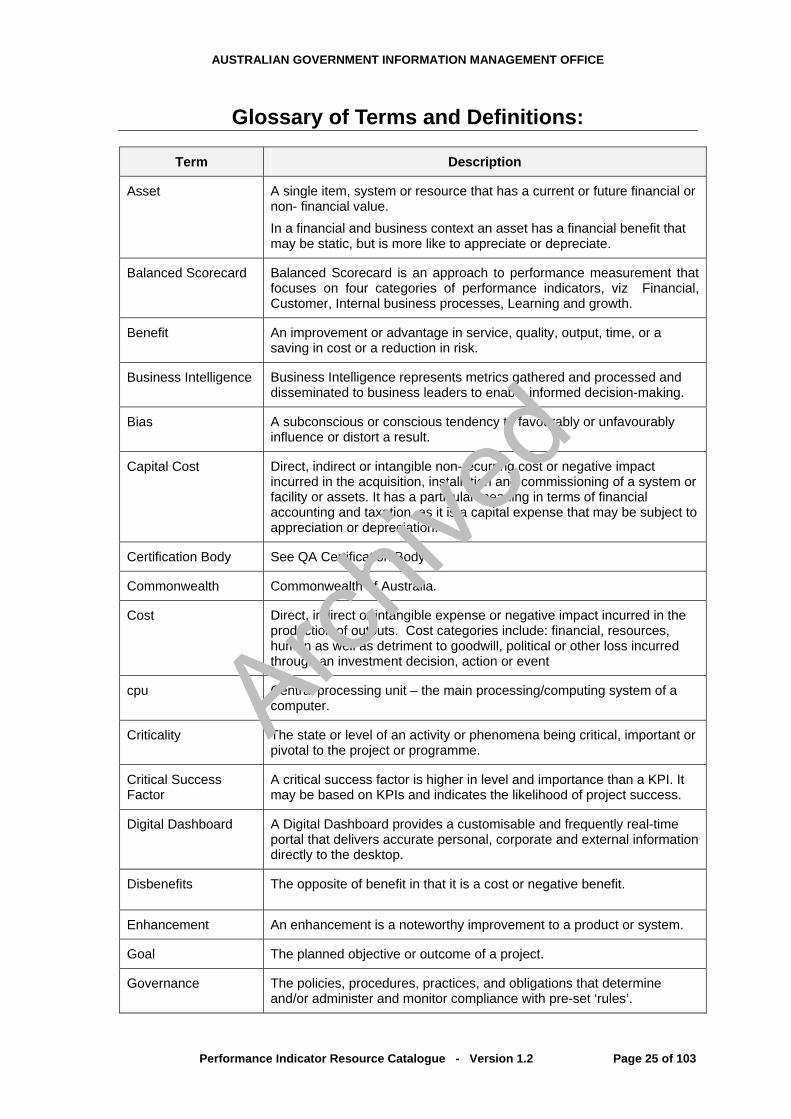
Glossary of Terms and Definitions:
Term Description
Asset A single item, system or resource that has a current or future financial or non- financial value. In a financial and business context an asset has a financial benefit that may be static, but is more like to appreciate or depreciate.
Balanced Scorecard Balanced Scorecard is an approach to performance measurement that focuses on four categories of performance indicators, viz Financial, Customer, Internal business processes, Learning and growth.
Benefit An improvement or advantage in service, quality, output, time, or a saving in cost or a reduction in risk.
Business Intelligence Business Intelligence represents metrics gathered and processed and disseminated to business leaders to enable informed decision-making.
Bias A subconscious or conscious tendency to favourably or unfavourably influence or distort a result.
Capital Cost Direct, indirect or intangible non-recurring cost or negative impact incurred in the acquisition, installation and commissioning of a system or facility or assets. It has a particular meaning in terms of financial accounting and taxation, as it is a capital expense that may be subject to appreciation or depreciation.
Certification Body See QA Certification Body.
Commonwealth Commonwealth of Australia.
Cost Direct, indirect or intangible expense or negative impact incurred in the production of outputs. Cost categories include: financial, resources, human as well as detriment to goodwill, political or other loss incurred through an investment decision, action or event
cpu Central processing unit – the main processing/computing system of a computer.
Criticality The state or level of an activity or phenomena being critical, important or pivotal to the project or programme.
Critical Success Factor
A critical success factor is higher in level and importance than a KPI. It may be based on KPIs and indicates the likelihood of project success.
Digital Dashboard A Digital Dashboard provides a customisable and frequently real-time portal that delivers accurate personal, corporate and external information directly to the desktop.
Disbenefits The opposite of benefit in that it is a cost or negative benefit.
Enhancement An enhancement is a noteworthy improvement to a product or system.
Goal The planned objective or outcome of a project.
Governance The policies, procedures, practices, and obligations that determine and/or administer and monitor compliance with pre-set ‘rules’.
Performance Indicator Resource Catalogue - Version 1.2 Page 25 of 103
Archive
d
AUSTRALIAN GOVERNMENT INFORMATION MANAGEMENT OFFICE
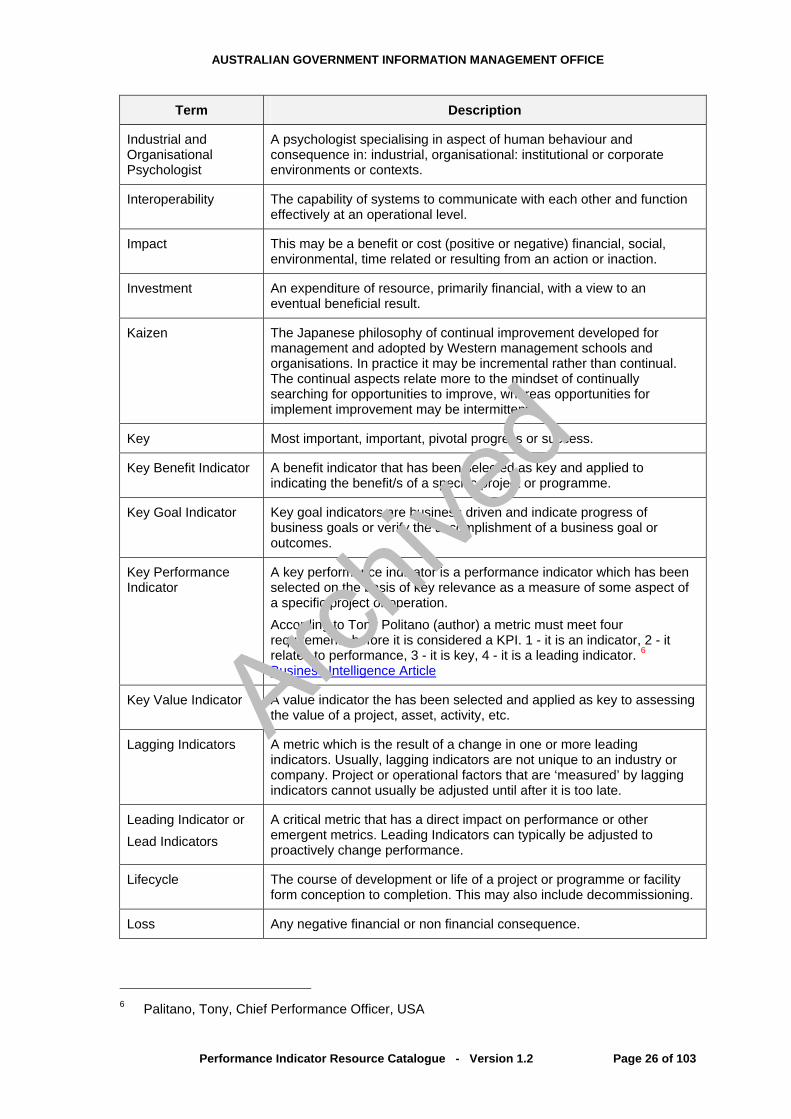
Term Description
Industrial and Organisational Psychologist
A psychologist specialising in aspect of human behaviour and consequence in: industrial, organisational: institutional or corporate environments or contexts.
Interoperability The capability of systems to communicate with each other and function effectively at an operational level.
Impact This may be a benefit or cost (positive or negative) financial, social, environmental, time related or resulting from an action or inaction.
Investment An expenditure of resource, primarily financial, with a view to an eventual beneficial result.
Kaizen The Japanese philosophy of continual improvement developed for management and adopted by Western management schools and organisations. In practice it may be incremental rather than continual. The continual aspects relate more to the mindset of continually searching for opportunities to improve, whereas opportunities for implement improvement may be intermittent.
Key Most important, important, pivotal progress or success.
Key Benefit Indicator A benefit indicator that has been selected as key and applied to indicating the benefit/s of a specific project or programme.
Key Goal Indicator Key goal indicators are business driven and indicate progress of business goals or verify the accomplishment of a business goal or outcomes.
Key Performance Indicator
A key performance indicator is a performance indicator which has been selected on the basis of key relevance as a measure of some aspect of a specific project or operation. According to Tony Politano (author) a metric must meet four requirements before it is considered a KPI. 1 - it is an indicator, 2 - it relates to performance, 3 - it is key, 4 - it is a leading indicator. 6 Business Intelligence Article
Key Value Indicator A value indicator the has been selected and applied as key to assessing the value of a project, asset, activity, etc.
Lagging Indicators A metric which is the result of a change in one or more leading indicators. Usually, lagging indicators are not unique to an industry or company. Project or operational factors that are ‘measured’ by lagging indicators cannot usually be adjusted until after it is too late.
Leading Indicator or Lead Indicators
A critical metric that has a direct impact on performance or other emergent metrics. Leading Indicators can typically be adjusted to proactively change performance.
Lifecycle The course of development or life of a project or programme or facility form conception to completion. This may also include decommissioning.
Loss Any negative financial or non financial consequence.
6 Palitano, Tony, Chief Performance Officer, USA
Performance Indicator Resource Catalogue - Version 1.2 Page 26 of 103
Archive
d

AUSTRALIAN GOVERNMENT INFORMATION MANAGEMENT OFFICE
Term Description
Management The philosophy, principles, processes or practices, whether human or otherwise, of gathering and applying resources to achieve intended outcomes.
Metric A measure or measurement.
Objective The planned goal, purpose or outcome of a project.
Operating Cost The cost incurred in the operation of facilities or delivery of services. These costs do not contribute to the value of assets, but are more akin to consumables.
Operations Research Operations research originated from Operational Research established in World War II to apply computational sciences to understanding operations. It is closed linked to industrial engineering and work study.
Outcome An ‘outcome’ is the planned or realised goal, objective, impact or consequences of a project.
Output Outputs are the deliverables in terms of goods and services that contribute to and facilitate outcomes.
Performance Indicator
A measure that indicates the absolute or relative performance of a project or operational factor. N.B. PIs may be leading or lagging indicators.
Probability The likelihood of a specific event, consequence or outcome expressed as a decimal between 0 and 1, for example 0.5, with 1 representing certainty.
Quality The attribute of excellence or fitness for purpose.
QA Certification Body A JAS-ANZ accredited Quality Assurance Certification Body, such as Standards Australia International (SAI) Global Services. Such bodies tend to specialise in Quality Management Systems (QMS) or IT. In October, 2005 JAS-ANZ lists over 40 QMS Certification Bodies specialising in IT.
Quality Assurance 1. All actions taken to ensure that standards and procedures are adhered to and that delivered products or services meet performance requirements. 2. The planned, systematic activities necessary to ensure that a component, module, or system conforms to established technical requirements. 3. The policy, procedures, and systematic actions established in an enterprise for the purpose of providing and maintaining a specified degree of confidence in data integrity and accuracy throughout the life cycle of the data, which includes input, update, manipulation, and output.
Replacement A replacement involves a system, plant or facility that takes over from and old system. It may or may not change in size or productivity upward or downward. The old system may be decommissioned as redundant, retained as a backup system, removed, or disposed of.
Resources Inputs, finance, labour, materials, technology, expertise, Intellectual Property (IP), facilities.
Resourcing The marshalling, provision, acquisition or procurement of resources.
Performance Indicator Resource Catalogue - Version 1.2 Page 27 of 103
Archive
d

AUSTRALIAN GOVERNMENT INFORMATION MANAGEMENT OFFICE
Term Description
Risk The possibility of an event or change that will have a negative impact on the status quo or outcome.
Risk Management Management directed towards the identification, assessment, acceptance or avoidance, containment or minimisation of negative impact from risk.
RoI Return on investment (RoI), a relationship where the value of benefits or returns is, considered against the cost of investment.
Scope Scope is the extent, range, coverage, area or space of the planned, potential or actual effectiveness of activity of functionality.
Scope Creep The expansion of scope whether conscious or unconscious, intended or unintended.
Six Sigma Six Sigma is a performance improvement methodology that focuses on aspects of quality which are critical to customers. It builds on ISO 9000 and focuses management on projects with the greatest financial impact. It focuses on the removal of steps that do not directly contribute to customer satisfaction and related bottom line. It provides management tools to facilitate the process and can be combined with Lean, ISO 9000 and Kaizen.
Span of Control This refers to the optimum or maximum number of responsibilities and projects that a single person can effectively manage and sustain simultaneously without detriment.
Stakeholder/s A person, persons, group, organisation or legal entity with a vested interest in or affected, or perceived to be affected by a decision, action, service, risk, change or consequence.
Total Cost Direct, indirect or intangible expense or negative impact incurred in the production of outputs including: financial, resources, human, detriment to goodwill, political or other loss incurred through an investment decision, action or event, including both capital cost and operation cost over the life of the facility.
Upgrade An upgrade is a new version or release or addition to a system or facility already in use.
Value The actual, estimated, assigned or perceived worth or significance of an item or benefit expressed in monetary or material terms.
Value Management Value Management is a management methodology that evolved from value engineering. It strives to optimise value maximisation with cost minimisation.
Performance Indicator Resource Catalogue - Version 1.2 Page 28 of 103
Archive
d
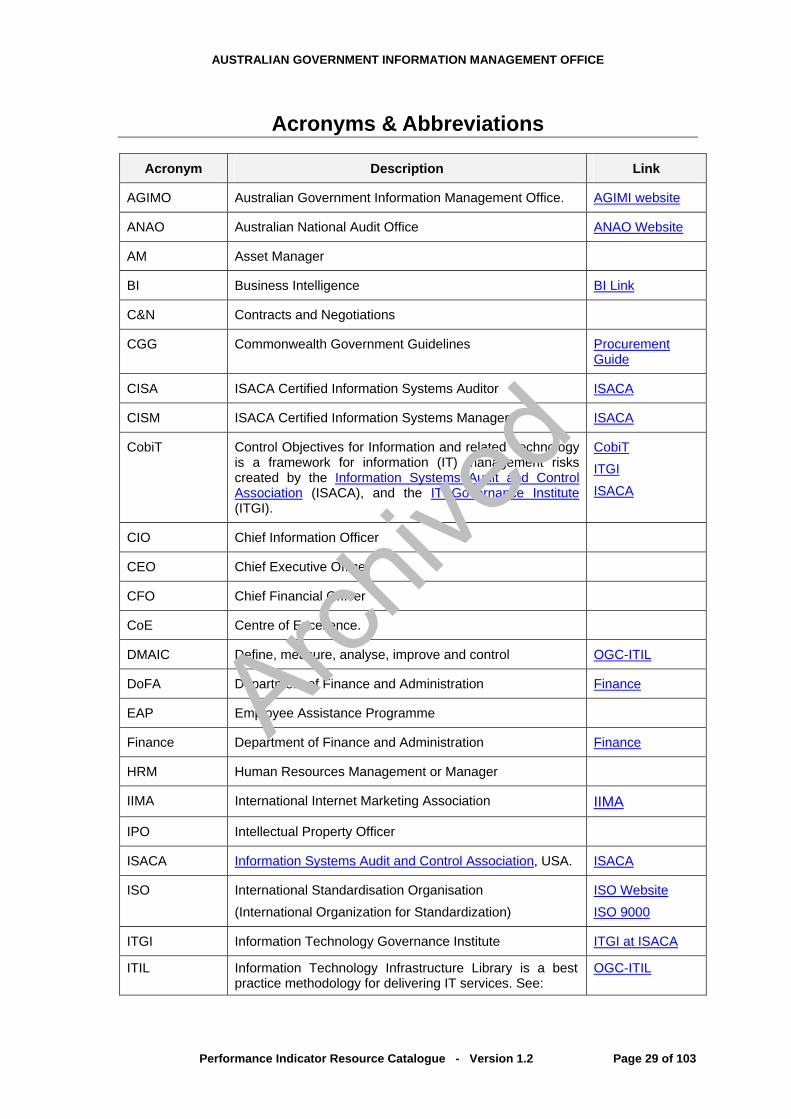
AUSTRALIAN GOVERNMENT INFORMATION MANAGEMENT OFFICE
Acronyms & Abbreviations
Acronym Description Link
AGIMO Australian Government Information Management Office. AGIMI website
ANAO Australian National Audit Office ANAO Website
AM Asset Manager
BI Business Intelligence BI Link
C&N Contracts and Negotiations
CGG Commonwealth Government Guidelines Procurement Guide
CISA ISACA Certified Information Systems Auditor ISACA
CISM ISACA Certified Information Systems Manager ISACA
CobiT Control Objectives for Information and related Technology is a framework for information (IT) management risks created by the Information Systems Audit and Control Association (ISACA), and the IT Governance Institute (ITGI).
CobiTITGIISACA
CIO Chief Information Officer
CEO Chief Executive Officer
CFO Chief Financial Officer
CoE Centre of Excellence.
DMAIC Define, measure, analyse, improve and control OGC-ITIL
DoFA Department of Finance and Administration Finance
EAP Employee Assistance Programme
Finance Department of Finance and Administration Finance
HRM Human Resources Management or Manager
IIMA International Internet Marketing Association IIMA
IPO Intellectual Property Officer
ISACA Information Systems Audit and Control Association, USA. ISACA
ISO International Standardisation Organisation (International Organization for Standardization)
ISO WebsiteISO 9000
ITGI Information Technology Governance Institute ITGI at ISACA
ITIL Information Technology Infrastructure Library is a best practice methodology for delivering IT services. See:
OGC-ITIL
Performance Indicator Resource Catalogue - Version 1.2 Page 29 of 103
Archive
d

AUSTRALIAN GOVERNMENT INFORMATION MANAGEMENT OFFICE
Acronym Description Link
JAS-ANZ Joint Accreditation System of Australian and New Zealand
JAS-ANZ
KISS Keep it Independent, Short and Simple, or Keep it short and Simple
KBI Key Benefit Indicator
KGI Key Goal Indicator
KPI Key Performance Indicator
KVI Key Value Indicator
LO Legal Officer or Legal Counsel
NOIE The National Office for the Information Economy, Australian Government.
OGC Office of Government Commerce, UK of GB. OGC
PI Performance Indicator
PM Project Manager
PMgr. Project Manager
PR Public Relations
PRINCE2 PRojects IN Controlled Environments is a project management methodology developed by OGC in the UK. PINCE2 is the second version of the methodology.
PRINCE2
PWC Price Waterhouse Coopers
QA Quality Assurance
QMS Quality Management System. This relates to Quality assurance Management Systems.
QMS at SAI Global
SAI Global Standards Australian International, formerly Standards Australia.
SAI Global
SLA SLAs Service Level Agreement. Supplier and client agreed repeatable KPIs related to service level.
ITIL - SLA
SocITM Society of Information Management. SocITM SocITM KPI set
SWOT Strength, Weaknesses, Opportunities and Threats analysis
UK or UK of GB
United Kingdom of Great Britain
US or USA United States of America
Performance Indicator Resource Catalogue - Version 1.2 Page 30 of 103
Archive
d

AUSTRALIAN GOVERNMENT INFORMATION MANAGEMENT OFFICE
APPENDICES
Performance Indicator Resource Catalogue - Version 1.2 Page 31 of 103
Archive
d

AUSTRALIAN GOVERNMENT INFORMATION MANAGEMENT OFFICE
Appendix A - Key Methodologies and Best Practices
A1 Development of Business Case, Investment Case and Economic Impacts
A1.1 AGIMO – Demand and Value Assessment
The Demand and Value Assessment Methodology (DAM-VAM) developed by the Australian Government Information Management Office (AGIMO) assists agencies in developing transparent and auditable assessments of demand and value propositions for online-government programs. At a project level it enables:
- Preparation of a business cases, justification of expenditure and policy decisions; - Assessment of progress towards project and program goals and targets; and - Impact assessment on agency business, customer base, demand and social value.
AGIMO is currently developing an expanded version called the ICT Business Case Guide and Tools as part of its ICT Investment Framework. This will incorporate the DAM-VAM. See: http://www.agimo.gov.au/government/damvam.
A1.2 Balanced Scorecard
The notion of Balanced Scorecard was first introduced by Drs. Robert Kaplan and David Norton in 1992. They based it on the premise that “measurement motivates”. It’s purpose is to provide an improved organisational performance measurement tool that overcomes the limitations of conventional financial investment measurements. Balanced Scorecard is focused on four categories of performance indicators:
- Financial. - Customer. - Internal business processes. - Learning and growth.
The approach is now widely used in corporations and some governments. The definitive book on the subject is: The Balance Scorecard – translating strategy into action by Robert S Kaplan and David P Norton – published by Harvard Business School Press.
A1.3 Triple Bottom Line
Triple Bottom Line (TBL) focuses corporations not just on the economic value they add, but also on the environmental and social value they add. The notion of reporting against the three components of economic, environmental, and social performance is directly tied to the concept of sustainable development. The Global Reporting Initiative (GRI) was established in late 1997 with the mission of developing globally applicable guidelines for reporting on the economic, environmental, and social performance, initially for corporations and eventually for any business, governmental, or non-governmental organisation (NGO). The publication Sustainability reporting Guidelines on Economic, Environmental and Social Performance can be downloaded from the Global Reporting Initiative web site - http://www.globalreporting.org/.
Performance Indicator Resource Library - Version 1.2 Page 32 of 103
Archive
d

AUSTRALIAN GOVERNMENT INFORMATION MANAGEMENT OFFICE
A2 Project Management
A2.1 PRINCE27
PRINCE (Projects in Controlled Environments) is a project management method covering the organisation, management and control of projects. PRINCE was first developed by the Central Computer and Telecommunications Agency (CCTA) now part of the Office of Government Commerce (OGC) in 1989 as a UK Government standard for IT project management. Since its introduction, PRINCE has become widely used in both the public and private sectors and is now the UK's de facto standard for project management. Although PRINCE was originally developed for the needs of IT projects, the method has also been used on many non-IT projects. The latest version of the method, PRINCE2, is designed to incorporate the requirements of existing users and to enhance the method towards a generic, best practice approach for the management of all types of projects. The design and development work was undertaken by a consortium of project management specialists, under contract to OGC, and over 150 public and private sector organisations were involved in a Review Panel which provided valuable input and feedback to the consortium. PRINCE2 is a process-based approach for project management providing an easily tailored and scaleable method for the management of all types of projects. Each process is defined with its key inputs and outputs together with the specific objectives to be achieved and activities to be carried out.
Figure 4 - PRINCE2 Process Model
The method describes how a project is divided into manageable stages enabling efficient control of resources and regular progress monitoring throughout the project. The various roles and responsibilities for managing a project are fully described and are adaptable to suit the size and complexity of the project, and the skills of the organisation. Project planning using PRINCE2 is product-based which means the project plans are focused on delivering results and are not simply about planning when the various activities on the project will be done.
7 Source: http://www.ogc.gov.uk/prince2/about_p2/about_intro.htm
Performance Indicator Resource Library - Version 1.2 Page 33 of 103
Archive
d

AUSTRALIAN GOVERNMENT INFORMATION MANAGEMENT OFFICE
A PRINCE2 project is driven by the project's business case which describes the organisation's justification, commitment and rationale for the deliverables or outcome. The business case is regularly reviewed during the project to ensure the business objectives, which often change during the lifecycle of the project, are still being met. Benefits PRINCE2 is a structured method providing organisations with a standard approach to the management of projects. The method embodies proven and established best-practice in project management. It is widely recognised and understood, and so provides a common language for all participants in the project. PRINCE2 provides benefits to the organisation, as well as the managers and directors of the project, through the controllable use of resources and the ability to manage business and project risk more effectively. PRINCE2 enables projects to have:
- A controlled and organised start, middle and end; - Regular reviews of progress against plan and against the Business Case; - Flexible decision points; - Automatic management control of any deviations from the plan; - The involvement of management and stakeholders at the right time and place during the
project; - Good communication channels between the project, project management, and the rest of
the organisation.
Performance Indicator Resource Library - Version 1.2 Page 34 of 103
Archive
d

AUSTRALIAN GOVERNMENT INFORMATION MANAGEMENT OFFICE
A3 ICT Services and Initiative Management
A3.1 ITIL
The IT Infrastructure Library (ITIL) developed by the UK Government and now managed by the Office of Government Commerce (OGC), provides what is probably the most comprehensive documentation of best practice for IT Service Management. It is used by many organisations around the world spawning an ITIL philosophy, multiple books and web resources, a professional qualification scheme, and a range of commercial consultancy services, software tools and training. At it most basic level ITIL consists of a series of books giving guidance on the provision of quality IT services, and on the accommodation and environmental facilities needed to support IT. ITIL provides the foundation for quality IT Service Management. Today ITIL books and related (often commercially providing tools, consultancy and training) cover the following subject areas:
- Software Asset Management.
- Service Support.
- Service Delivery.
- Planning to implement Service Management.
- ICT Infrastructure Management.
- Application Management.
- Security Management.
See: http://www.itil.co.uk/index.htm.
A3.2 Capability Maturity Model
The Capability Maturity Model (CMM), created in the mid-1980s by the Software Engineering Institute (SEI) at Carnegie Mellon University, provides an approach that enables organisations to better control their software development environments. The CMM specifies five levels of process maturity for an organisation:
1. Initial (chaotic, ad hoc, heroic) the starting point for use of a new process. 2. Repeatable (project management, process discipline) the process is used repeatedly. 3. Defined (institutionalised) the process is defined/confirmed as a standard business process. 4. Managed (quantified) process management and measurement takes place. 5. Optimising (process improvement) process management includes deliberate process
optimisation/improvement. Within each of these maturity levels are KPAs (Key Practice Areas) which characterise that level, and for each KPA there are five definitions identified:
1. Goals. 2. Commitment. 3. Ability. 4. Measurement. 5. Verification.
The SEI has defined a rigorous process assessment method to appraise how well a software development organisation meets the criteria for each level. The definitive book on the topis is Capability Maturity Model: Guidelines for Improving the Software Process – see http://www.sei.cmu.edu/publications/books/process/cmm-improving-sw-process.html
Performance Indicator Resource Library - Version 1.2 Page 35 of 103
Archive
d

AUSTRALIAN GOVERNMENT INFORMATION MANAGEMENT OFFICE
Although the CMM has proved useful to many organisations, the use of multiple models has been problematic. Further, applying multiple models that are not integrated within and across an organisation was seen as costly in terms of training, appraisals, and improvement activities. The CMM Integration project was formed to sort out the problem of using multiple CMMs. The resultant Capability Maturity Model® Integration (CMMI) is a process improvement approach that provides organisations with the essential elements of effective processes. It can be used to guide process improvement across a project, a division, or an entire organisation. CMMI helps integrate traditionally separate organisational functions, set process improvement goals and priorities, provide guidance for quality processes, and provide a point of reference for appraising current processes.
See: http://www.sei.cmu.edu/cmmi/cmmi.html.
A3.3 Control Objectives for Information & related Technology (CobiT)
IT Governance Institute (www.itgi.org) designed and created the Control Objectives for Information and related Technology (CobiT) primarily as an educational resource for chief information officers, senior management, IT management and control professionals. ITGI have positioned the need for this approach as follows:
“The need for assurance about the value of IT, the management of IT-related risks and increased requirements for control over information are now understood as key elements of enterprise governance. Value, risk and control constitute the core of IT governance. Control Objectives for Information and related Technology (COBIT) provides good practices across a domain and process framework and presents activities in a manageable and logical structure. COBIT’s good practices represent the consensus of experts. They are strongly focused on control and less on execution. These practices will help optimise IT-enabled investments, ensure service delivery and provide a measure against which to judge when things do go wrong.”
CobiT lists four categories (and 34 sub-categories) of ICT activities that need to be managed effectively8. CobiT then provides organisations with a structured approach to determining the level of maturity of their management of ICT based upon a rating for each of the (relevant) categories/sub-categories.
See www.isaca.org/cobit.
A3.4 Six Sigma
Six Sigma is a methodology that provides organizations with the tools to improve the capability of their business processes. In a nutshell, the goal of Six Sigma is to help people and processes deliver defect-free products and services against a backdrop of changing markets, technologies and customers. The history of Six Sigma stretches back over eighty years, from early Japanese management breakthroughs through to “Total Quality” efforts in the 1970s and 1980s. The latter were pioneered by Bill Smith of Motorola. Three key characteristics separate Six Sigma from other quality programs. It is:
1. Is a customer-centric approach. 2. Yields major returns on investment from projects. 3. Changes how management functions.
8 The CobiT Maturity Model derived from the Software Engineering Institute’s Capability Maturity Model – see
www.sei.cmu.edu/
Performance Indicator Resource Library - Version 1.2 Page 36 of 103
Archive
d

AUSTRALIAN GOVERNMENT INFORMATION MANAGEMENT OFFICE
Six Sigma efforts target three main goals: 1. To improve customer satisfaction. 2. To reduce cycle times. 3. To reduce defects.
The following outlines the six major themes of Six Sigma: Theme I: Focus on the customer.
Theme II: Fact and data-driven management.
Theme III: Processes are key.
Theme IV: Proactive management.
Theme V: Collaboration without boundaries.
Theme VI: Drive for perfection and tolerate failure.
There are two main methodologies in Six Sigma: DMAIC process: define, measure, analyse, improve, control. This is used for existing processes that are not at a six sigma level.
DMADV process: define, measure, analyse, design, verify.
DMAIC is used for processes already in place which do not meet Six Sigma specifications, to help bring them within the Six Sigma threshold. DMADV is used for the development of new products or processes, to ensure that they meet the world at Six Sigma levels of quality. There are three main certification levels of Six Sigma mastery: green belts, black belts, and master black belts. To achieve each ranking, candidates must undergo extensive training in Six Sigma techniques and methodologies, then pass a certification test. See: http://en.wikipedia.org/wiki/Six_Sigma.
Performance Indicator Resource Library - Version 1.2 Page 37 of 103
Archive
d
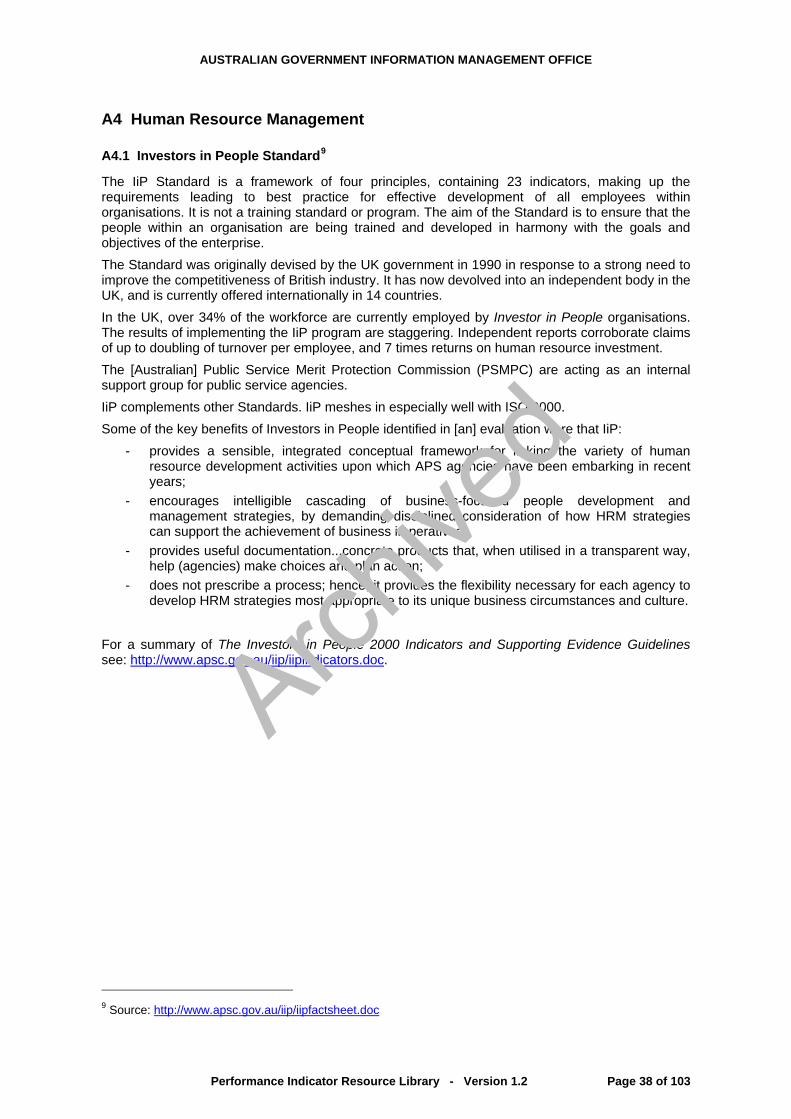
AUSTRALIAN GOVERNMENT INFORMATION MANAGEMENT OFFICE
A4 Human Resource Management
A4.1 Investors in People Standard9
The IiP Standard is a framework of four principles, containing 23 indicators, making up the requirements leading to best practice for effective development of all employees within organisations. It is not a training standard or program. The aim of the Standard is to ensure that the people within an organisation are being trained and developed in harmony with the goals and objectives of the enterprise. The Standard was originally devised by the UK government in 1990 in response to a strong need to improve the competitiveness of British industry. It has now devolved into an independent body in the UK, and is currently offered internationally in 14 countries. In the UK, over 34% of the workforce are currently employed by Investor in People organisations. The results of implementing the IiP program are staggering. Independent reports corroborate claims of up to doubling of turnover per employee, and 7 times returns on human resource investment. The [Australian] Public Service Merit Protection Commission (PSMPC) are acting as an internal support group for public service agencies. IiP complements other Standards. IiP meshes in especially well with ISO 9000. Some of the key benefits of Investors in People identified in [an] evaluation were that IiP:
- provides a sensible, integrated conceptual framework for linking the variety of human resource development activities upon which APS agencies have been embarking in recent years;
- encourages intelligible cascading of business-focused people development and management strategies, by demanding disciplined consideration of how HRM strategies can support the achievement of business imperatives;
- provides useful documentation...concrete products that, when utilised in a transparent way, help (agencies) make choices and plan action;
- does not prescribe a process; hence, it provides the flexibility necessary for each agency to develop HRM strategies most appropriate to its unique business circumstances and culture.
For a summary of The Investors in People 2000 Indicators and Supporting Evidence Guidelines see: http://www.apsc.gov.au/iip/iipindicators.doc.
9 Source: http://www.apsc.gov.au/iip/iipfactsheet.doc
Performance Indicator Resource Library - Version 1.2 Page 38 of 103
Archive
d

AUSTRALIAN GOVERNMENT INFORMATION MANAGEMENT OFFICE
A5 Systems Sizing, Cost Estimation and Management
A5.1 Southern Scope10
Previous approaches to paying for software development were either based on a fixed price proposal using specified requirements or paying an agreed rate for inputs such as time and materials. The southernSCOPE method is an alternative approach. The approach is similar to the building industry developing costings per square of floor space, the road construction industry costing projects by the kilometre, magazines paying freelance journalists by the word or builders subcontracting painters on a dollar price per square of house to paint. southernSCOPE now allows businesses to take the same kind of approach to software acquisitions. It allows project managers to set a price based on cost per function point, rather than on how much time has been spent on the development. A function point is a unit of measurement that puts a number to the amount of functionality delivered to the`users by a software application. Function points are to a software application what squares are to a house. Whereas the average house is 15 squares the average software application is 500 function points. These are the eight steps to the southernSCOPE method.
2. The customer identifies that a need exists to acquire application software and engages a ‘scope manager’. The scope manager is an independent person who specialises in software measurement.
3. The scope manager performs a preliminary function point count and provides an early but sound cost estimate and a realistic development timeframe for the project.
4. The customer prepares a short document outlining the need for the software and the constraints of the project and invites proposals to develop the software.
5. The customer selects the best proposal and engages the successful developer with payment for the software based on the dollars per function point of the software delivered.
6. The development begins with a phase of analysis that produces a Requirements Specification.
7. The scope manager conducts a function point count on the Requirements Specification. Using this count, the customer decides exactly what functionality will be needed to produce the business outcomes while meeting the budget and the delivery date.
8. During the project, the scope manager ensures changes to the scope are understood and that the customer and the developer agree upon their price impact.
9. At the conclusion of the project the customer makes payment to the developer on the basis of software delivered plus the agreed changes.
The following resources are available from the www.mmv.vic.gov.au website: - Case studies: examples of how the southernSCOPE method was applied successfully on
two Victorian government software projects. - Presentation for project sponsors: a Microsoft PowerPoint presentation of 30 minutes
duration providing project sponsors with information on the approach and benefits of the southernSCOPE method.
- Computer based training package: a two hour computer-based training course to support project managers during the software development and teaching the why, when and how to apply the southernSCOPE method.
10 Source: southernSCOPE avoiding Software Blowouts - http://www.egov.vic.gov.au/index.php?env=-innews/detail.tpl:m1816-1-1-7:l0-0-1-:n832-0-0 and
Performance Indicator Resource Library - Version 1.2 Page 39 of 103
Archive
d

AUSTRALIAN GOVERNMENT INFORMATION MANAGEMENT OFFICE
- Reference manual: specifying the approach and the roles of the different parties involved (also includes a draft contract between the developer and the customer).
Performance Indicator Resource Library - Version 1.2 Page 40 of 103
Archive
d

AUSTRALIAN GOVERNMENT INFORMATION MANAGEMENT OFFICE
A6 Risk Management and ICT Security Management
A6.1 AS/NZS 4360 – Risk Management
AS/NZS 4360 is the Australian Standard that provides a generic framework for establishing the context, identification, analysis, evaluation, treatment, monitoring and communication of risk. AS/NZS 4360 provides the basis for agencies development of Performance Indicators covering the effectiveness of risk management for IT projects and for the Enterprise Management of IT.
See: http://www.standards.com.au/
A6.2 Protective Security Manual
The Australian Government's Protective Security Manual (PSM) is issued by the Attorney-General's Department. It is the principal means for disseminating Australian Government protective security policies, principles, standards and procedures to be followed by all Australian Government agencies for the protection of official resources. The eight parts are:
A. Protective Security Policy.
B. Guidelines on Managing Security Risk.
C. Information Security.
D. Personnel Security.
E. Physical Security.
F. Security Framework for Competitive Tendering and Contracting (CTC).
G. Guidelines on Security Incidents and Investigations.
H. Security Guidelines on Home-based Work.
The PSM provides the basis for agencies development of Performance Indicators covering the protection of official resources (including all digital and written forms of information).
See: http://www.ag.gov.au/www/protectivesecurityhome.nsf.
A6.3 ISO/IEC 17799 – IT Code of Practice for Information Security Management
ISO/IEC 17999 is the international standard covering Information technology — Code of practice for information security management. The standard provides detailed guidance on:
- Security Policy.
- Organisational Security.
- Asset Classification and Control.
- Personnel Security.
- Physical and environmental security.
- Communications and operations management.
- Access control.
- Systems development and maintenance.
- Business continuity Management.
Performance Indicator Resource Library - Version 1.2 Page 41 of 103
Archive
d

AUSTRALIAN GOVERNMENT INFORMATION MANAGEMENT OFFICE
Performance Indicator Resource Library - Version 1.2 Page 42 of 103
- Compliance.
ISO/IEC 17799, together with ACSI33 (see below) provides the basis for agencies development of ICT security Performance Indicators covering the physical and logical (systems related) security for premises, hardware, software, networks and personnel. See: http://www.standards.com.au/
A6.4 ACSI 33 – Australian Government IT Security Manual
The Australian Government Information Technology Security Manual (usually referred to as ACSI33) provides detailed policies and guidance to Australian Government agencies on how to protect their ICT systems. ACSI33, together with ISO/IEC 17799 (see above) provides the basis for agencies development of ICT security Performance Indicators covering the physical and logical (systems related) security for premises, hardware, software, networks and personnel.
See: http://www.dsd.gov.au/library/infosec/acsi33.html.
Archive
d

AUSTRALIAN GOVERNMENT INFORMATION MANAGEMENT OFFICE
Appendix B – Index of Further Resources The table below provides pointers to further information in the form of Guides, Standards, Case Studies and other General Resources. The pointers are listed alphabetically according to Subject Area.
Subject Area Guides Standards Case Studies & General Resources
Business Case development AGIMO - Business Case Development Guide
Balanced Scorecard
Triple Bottom-line
Triple Bottom-line:
Global Reporting Initiative - http://www.globalreporting.org/
Enterprise Architecture Institute for Enterprise Architecture Developments
http://www.enterprise-architecture.info/
Human Resources Resources from the Australian Computer Society: www.acs.org.au
For a summary of The Investors in People 2000 Indicators and Supporting Evidence Guidelines see: http://www.apsc.gov.au/iip/iipindicators.doc
Investors in People Standard – see http://www.apsc.gov.au/iip/index.html
.
ICT Services Management ITIL: www.itil.co.uk www.itil.org.uk AS 8015-2005 Corporate governance of information and communication technology
Knowledge Management HB 275-2001 Knowledge Management: A framework for succeeding in the knowledge era
AS 5037(Int)-2003 Knowledge Management
Performance Indicator Resource Library - Version 1.2 Page 43 of 103
Archive
d

AUSTRALIAN GOVERNMENT INFORMATION MANAGEMENT OFFICE
Performance Indicator Resource Library - Version 1.2 Page 44 of 103
Subject Area Guides Standards Case Studies & General Resources
Process Management Six Sigma: www.isixsigma.com
Project Management PRINCE2: http://www.ogc.gov.uk/prince2/
Quality Assurance / Management ISO 9000
System sizing and cost estimation and management
southernSCOPE see: http://www.egov.vic.gov.au/index.php?env=-innews/detail.tpl:m1816-1-1-7:l0-0-1-:n832-0-0
southernSCOPE case studies see: http://www.egov.vic.gov.au/index.php?env=-innews/detail.tpl:m1816-1-1-7:l0-0-1-:n832-0-0
Risk Management HB 436:2004 Risk Management Guidelines - Companion to AS/NZS 4360:2004
AS/NZS 4360:2004 Risk management
Project Risk Evaluation – Standish Virtual Advisor - www.standishgroup.com/vas/index.php
Information Security Management AGAF - Better Practice Guide to Authentication: www.agimo.gov.au
AGAF - Better Practice Guide to Authorisation and Access Management: www.agimo.gov.au
HB 231:2000 Information security risk management guidelines
AS/NZS ISO/IEC 17799:2001 Information technology - Code of practice for information security management
AS/NZS 7799.2:2003 Information security management - Specification for information security management systems
Archive
d

AUSTRALIAN GOVERNMENT INFORMATION MANAGEMENT OFFICE
Appendix C - Sources of Performance Indicators & Other Materials
Performance Indicators and related material for this resource library were drawn from the following primary sources:
Organisation Reference Descriptions Resource Link/Ref.
Australian Government Australians’ Use of and Satisfaction with E-Government Services
AGIMO, Department of Finance and Administration
Australian Government Business Case Development Guide AGIMO, Department of Finance and Administration
Australian Government Centrelink Evaluation Handbook – a Guide for Planning and Conducting Evaluations in Centrelink
Hardcopy available from Centrelink
Australian Government Doing Evaluations – A Practical Guide. Also: The Outcomes and Outputs Framework Guidance Document
Library, Dept. of Finance and Administration
Cranfield University, UK Ward, John and Murray, Peter, Benefits Management – Best Practice Guidelines. Information systems research Centre, Cranfield School of Management, Copyright 2000
Doc. No ISRC-BM-200001. Not on web. [email protected]
Government of Victoria Office of the Chief Information Officer Victoria KPI Library
NOIE, 2002 Online Authentication ISBN 1 74082 013 4
PA Consulting Group Poe, Jonathan, Top Australian CIO Issues, for 2005- Executive Directions. Practice, 2338.
Price Waterhouse Coopers Sept., 1999
Shared Services – Opportunities for the Public Sector, Cameron Clyne & Greg Filed
Sida Dept. for Evaluation and Internal Audit, Sweden
Carlsson, Jerker, et al, Are Evaluations Useful
Sida documentSida Website
SocITM, UK The Society of Information Technology Management
SocITM KPI set
Standish Group, 2003, USA.
Johnson et al, Chaos Chronicles, III, Intro to Version 3 Chronicle
UK Government Information Technology Infrastructure Library (ITIL) OGC, UK
OGC-ITIL
UK Government Office of Government Commerce (OGC)
OGC
UK Government PRINCE2, OGC, UK PRINCE2
Performance Indicator Resource Library - Version 1.2 Page 45 of 103
Archive
d

AUSTRALIAN GOVERNMENT INFORMATION MANAGEMENT OFFICE
Performance Indicator Resource Library - Version 1.2 Page 46 of 103
Organisation Reference Descriptions Resource Link/Ref.
US - a framework for ICT Management created by ISACA and ITGI.
CobiT CobiT
Victoria State Government Office of the Chief Information Officer and the Department of Premier and Cabinet. e-Government Investment Evaluation – Framework and Methodology Guidelines. (Contains KPIs) MMV - southernSCOPE
OCIO Vic Govt.DPC @ Vic Govt.Vic Govt.
Eric T Peterson Peterson, Eric T, Web Analytics Demystified, the Marketer’s Guide to Understanding You’re your Web Site Affects Your Business, 1994
Web Analytics Demystified ISBN 0-9743584-2-8
Archive
d

AUSTRALIAN GOVERNMENT INFORMATION MANAGEMENT OFFICE
Performance Indicator Resource Library KEY: VALUE TYPE
Value Explanation Type Explanation
Y/N Yes or No A Absolute value
H/M/L High or Medium or Low P Comparison with Plan or Budget
% Percentage B Comparison with Benchmark
$ Dollar Value T Comparison against Total Available
# Number
Performance Indicator Resource Library - Version 1.2 Page 47 of 103
Archive
d
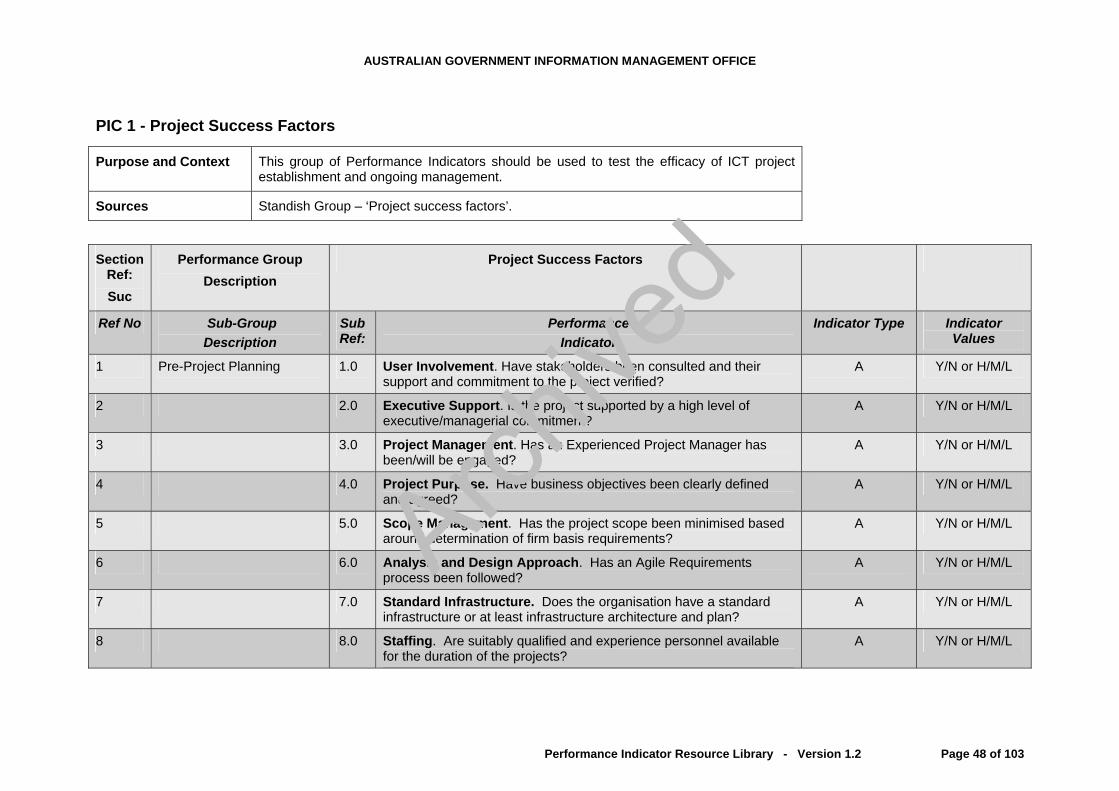
AUSTRALIAN GOVERNMENT INFORMATION MANAGEMENT OFFICE
PIC 1 - Project Success Factors
Purpose and Context This group of Performance Indicators should be used to test the efficacy of ICT project establishment and ongoing management.
Sources Standish Group – ‘Project success factors’.
Section Ref: Suc
Performance Group Description
Project Success Factors
Ref No Sub-Group Description
Sub Ref:
Performance Indicator
Indicator Type Indicator Values
1 Pre-Project Planning 1.0 User Involvement. Have stakeholders been consulted and their support and commitment to the project verified?
A Y/N or H/M/L
2 2.0 Executive Support. Is the project supported by a high level of executive/managerial commitment?
A Y/N or H/M/L
3 3.0 Project Management. Has an Experienced Project Manager has been/will be engaged?
A Y/N or H/M/L
4 4.0 Project Purpose. Have business objectives been clearly defined and agreed?
A Y/N or H/M/L
5 5.0 Scope Management. Has the project scope been minimised based around determination of firm basis requirements?
A Y/N or H/M/L
6 6.0 Analysis and Design Approach. Has an Agile Requirements process been followed?
A Y/N or H/M/L
7 7.0 Standard Infrastructure. Does the organisation have a standard infrastructure or at least infrastructure architecture and plan?
A Y/N or H/M/L
8 8.0 Staffing. Are suitably qualified and experience personnel available for the duration of the projects?
A Y/N or H/M/L
Performance Indicator Resource Library - Version 1.2 Page 48 of 103
Archive
d

AUSTRALIAN GOVERNMENT INFORMATION MANAGEMENT OFFICE
Section Performance Group Project Success Factors Ref: Description Suc
Ref No Sub-Group Sub Performance Indicator Type Indicator Description Ref: Values Indicator
9 9.0 Planning. Has project planning used an appropriate formal methodology?
A Y/N or H/M/L
10 10.0 Budgets. Are estimates of costs and time reliable? A Y/N or H/M/L
11 11.0 Milestones. Have detailed milestones been established for small stages / steps?
A Y/N or H/M/L
12 12.0 Ownership. Has the project ownership been clearly defined and has this been agreed by all relevant stakeholders?
A Y/N or H/M/L
13 13.0 Risk Management. Has a detailed risk management plan been developed?
A Y/N or H/M/L
Performance Indicator Resource Library - Version 1.2 Page 49 of 103
Archive
d
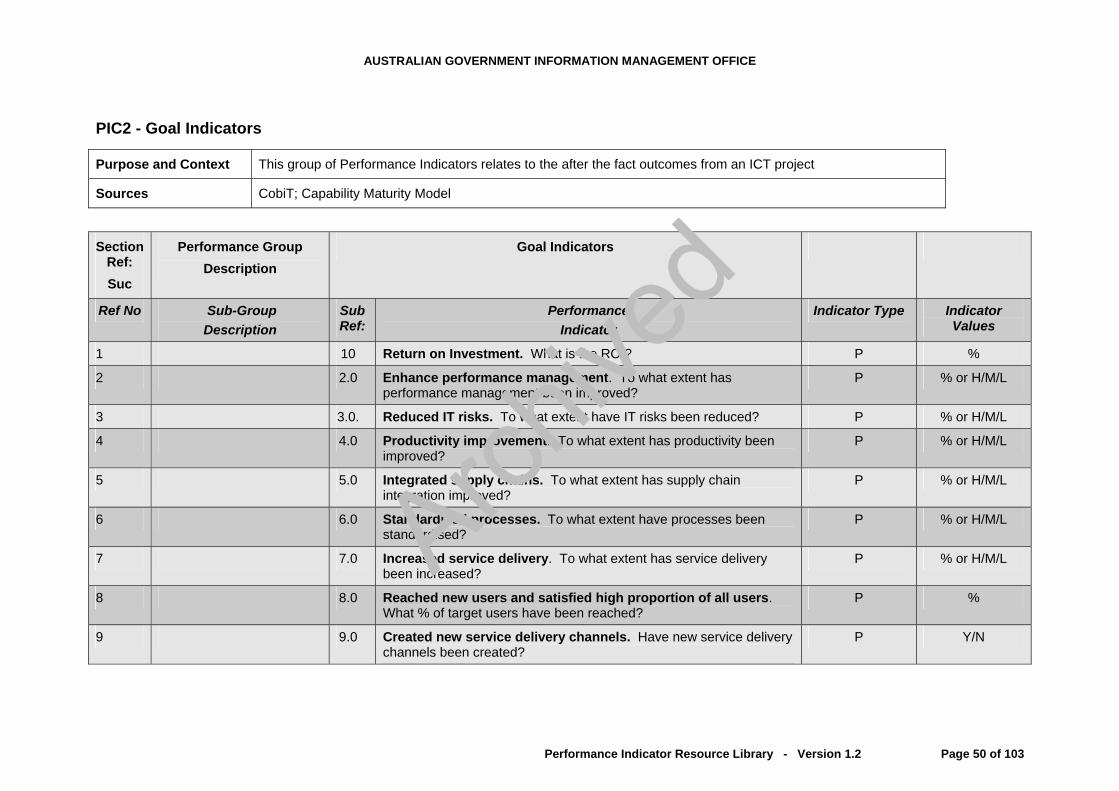
AUSTRALIAN GOVERNMENT INFORMATION MANAGEMENT OFFICE
PIC2 - Goal Indicators
Purpose and Context This group of Performance Indicators relates to the after the fact outcomes from an ICT project
Sources CobiT; Capability Maturity Model
Section Ref: Suc
Performance Group Description
Goal Indicators
Ref No Sub-Group Description
Sub Ref:
Performance Indicator
Indicator Type Indicator Values
1 10 Return on Investment. What is the ROI? P %
2 2.0 Enhance performance management. To what extent has performance management been improved?
P % or H/M/L
3 3.0. Reduced IT risks. To what extent have IT risks been reduced? P % or H/M/L
4 4.0 Productivity improvement. To what extent has productivity been improved?
P % or H/M/L
5 5.0 Integrated supply chains. To what extent has supply chain integration improved?
P % or H/M/L
6 6.0 Standardised processes. To what extent have processes been standardised?
P % or H/M/L
7 7.0 Increased service delivery. To what extent has service delivery been increased?
P % or H/M/L
8 8.0 Reached new users and satisfied high proportion of all users. What % of target users have been reached?
P %
9 9.0 Created new service delivery channels. Have new service delivery channels been created?
P Y/N
Performance Indicator Resource Library - Version 1.2 Page 50 of 103
Archive
d

AUSTRALIAN GOVERNMENT INFORMATION MANAGEMENT OFFICE
Section Performance Group Goal Indicators Ref: Description Suc
Ref No Sub-Group Sub Performance Indicator Type Indicator Description Ref: Values Indicator
10 10.0 Availability of bandwidth, computer power, ICT service delivery and their up-time. What are the performance results for bandwith, system response time and availability, and service personnel performance?
P # and %
11 11.0 Delivering service quality on time and within budget. To what extent was service delivery on time and within budget?
P % or H/M/L
12 12.0 Number of users and cost per user. What is the number of users and their unit cost?
P # and $
13 13.0 Satisfy or exceed government and industry standards. Did delivery satisfy or exceed government and industry standards?
P Y/N or H/M/L
Performance Indicator Resource Library - Version 1.2 Page 51 of 103
Archive
d
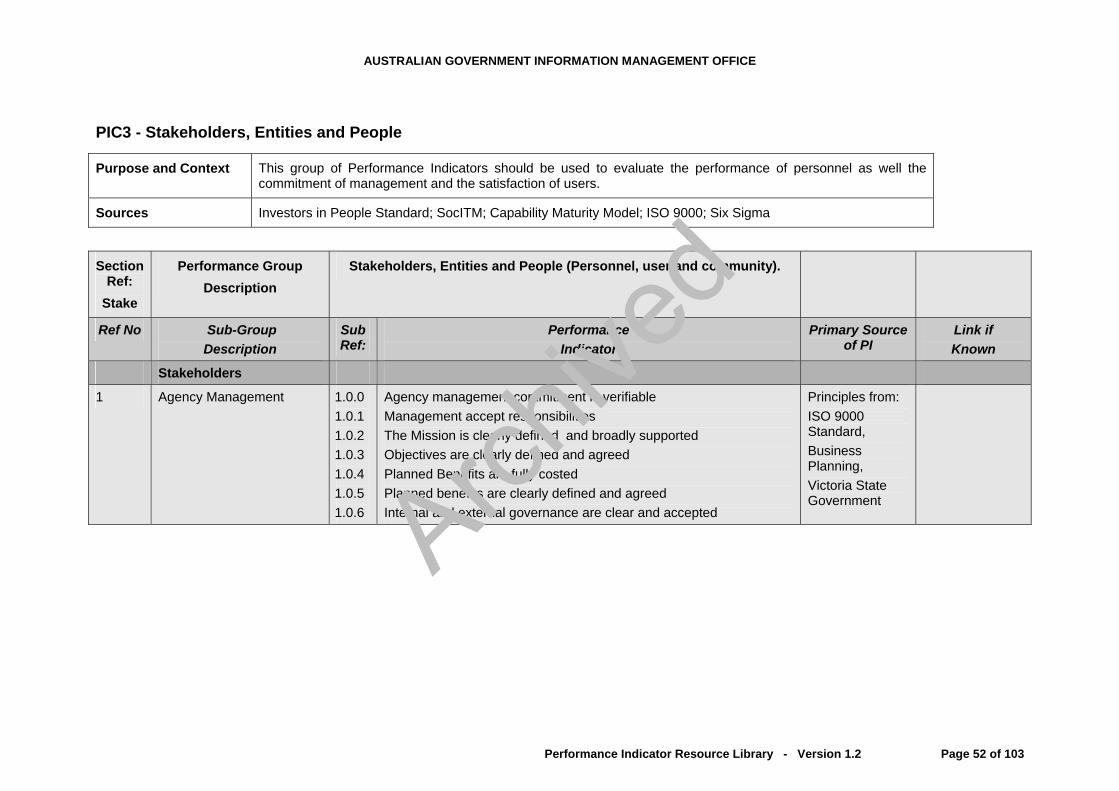
AUSTRALIAN GOVERNMENT INFORMATION MANAGEMENT OFFICE
PIC3 - Stakeholders, Entities and People
Purpose and Context This group of Performance Indicators should be used to evaluate the performance of personnel as well the commitment of management and the satisfaction of users.
Sources Investors in People Standard; SocITM; Capability Maturity Model; ISO 9000; Six Sigma
Section Ref:
Stake
Performance Group Description
Stakeholders, Entities and People (Personnel, user and community).
Ref No Sub-Group Description
Sub Ref:
Performance Indicator
Primary Source of PI
Link if Known
Stakeholders
1 Agency Management 1.0.0 1.0.1 1.0.2 1.0.3 1.0.4 1.0.5 1.0.6
Agency management commitment is verifiable Management accept responsibilities The Mission is clearly defined and broadly supported Objectives are clearly defined and agreed Planned Benefits are fully costed Planned benefits are clearly defined and agreed Internal and external governance are clear and accepted
Principles from: ISO 9000 Standard, Business Planning, Victoria State Government
Performance Indicator Resource Library - Version 1.2 Page 52 of 103
Archive
d

AUSTRALIAN GOVERNMENT INFORMATION MANAGEMENT OFFICE
Section Performance Group Stakeholders, Entities and People (Personnel, user and community). Ref: Description
Stake
Ref No Sub-Group Sub Performance Primary Source Link if Description Ref: of PI Indicator Known
Stakeholders 1.1.0 1.1.1 1.1.2
1.1.3 1.1.4
1.1.5 1.1.6 1.1.7
Needs and expectation are clearly identified and quantified. Mutual obligations have been fully considered and accepted. Regular communication, liaison with and consultation stakeholders
has been planned and established. Stakeholder relationship is fully managed. Strategies and plans have been communicated. Liaison, consultation
and relationship building with stakeholders has occurred. A scope has been developed and agreed. Options have been developed and analysed. Cost and risk of not meeting obligations have been identified and
evaluated.
PR, Legal Counsel or LO, PM Team, C&N, Risk Management Team,
Personnel
2 Personnel Security Plan 2.0 2.1 2.2 2.3
2.4
Personnel security assessment and development has been done. OH&S assessment and development has been done. Ergonomics have been evaluated. Built facilities plan, emergency egress, evacuation procedures, have been considered. Employee Assistance Plan has been considered and potentially implemented
HRM, Security, Iind’l & Org’l Psychologist, Facilities Manager
Performance Indicator Resource Library - Version 1.2 Page 53 of 103
Archive
d

AUSTRALIAN GOVERNMENT INFORMATION MANAGEMENT OFFICE
Section Performance Group Stakeholders, Entities and People (Personnel, user and community). Ref: Description
Stake
Ref No Sub-Group Sub Performance Primary Source Link if Description Ref: of PI Indicator Known
HR
3.0 3.1 3.2 3.3 3.4
Written job descriptions clearly define duties and responsibilities. Performance appraisal is regular (at least annual) and current. Performance targets are realistic and agreed. Employees are given regular briefings. Industry links are established to keep abreast of trends and issues.
Management & HRM. ITGI
www.ITGI.orgISACA.org
3.5 3.5.0 3.5.1 3.5.2
3.5.3
This may apply to politicians, top management, staff, teachers: % with e-government competencies % of users that used the Internet in the last day % of employees that are able to work from home have suitable infrastructure. % of those who have worked from home in the last month.
Based on Victoria State Government KPIs
ICT staff attrition rate (turnover) p.a. ICT staff attrition rate during the project. Percentage of public servants working on the project with relevant
industry qualifications. Percentage of non-ongoing staff (nogs) expressed as total of
permanent staff. Average number of days of training per permanent staff member. Average number of days training per temporary staff member. Average number of day of training per nogs
PA Consulting Group
3 HR
3.6 3.7 3.8
3.9
3.10 3.11 3.12 3.13 3.14
Ratio of internet versus intranet department email communications. Ratio of hard copy to e-copy communications.
AGIMO
Performance Indicator Resource Library - Version 1.2 Page 54 of 103
Archive
d
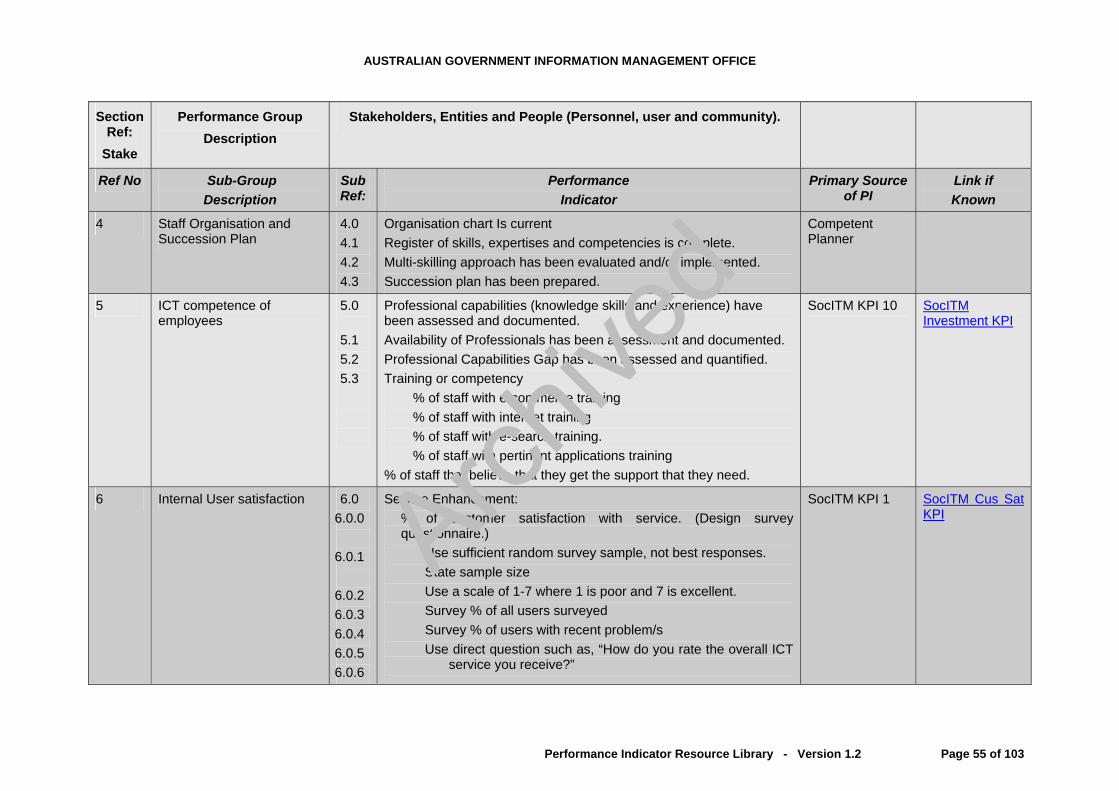
AUSTRALIAN GOVERNMENT INFORMATION MANAGEMENT OFFICE
Section Performance Group Stakeholders, Entities and People (Personnel, user and community). Ref: Description
Stake
Ref No Sub-Group Sub Performance Primary Source Link if Description Ref: of PI Indicator Known
4 Staff Organisation and Succession Plan
4.0 4.1 4.2 4.3
Organisation chart Is current Register of skills, expertises and competencies is complete. Multi-skilling approach has been evaluated and/or implemented. Succession plan has been prepared.
Competent Planner
5 ICT competence of employees
5.0
5.1 5.2 5.3
Professional capabilities (knowledge skills and experience) have been assessed and documented. Availability of Professionals has been assessment and documented. Professional Capabilities Gap has been assessed and quantified. Training or competency
% of staff with e-commerce training % of staff with internet training % of staff with e-search training. % of staff with pertinent applications training
% of staff that believe that they get the support that they need.
SocITM KPI 10 SocITM Investment KPI
6 Internal User satisfaction 6.0 6.0.0
6.0.1
6.0.2 6.0.3 6.0.4 6.0.5 6.0.6
Service Enhancement: % of customer satisfaction with service. (Design survey questionnaire.)
Use sufficient random survey sample, not best responses. State sample size Use a scale of 1-7 where 1 is poor and 7 is excellent. Survey % of all users surveyed Survey % of users with recent problem/s Use direct question such as, “How do you rate the overall ICT
service you receive?”
SocITM KPI 1 SocITM Cus Sat KPI
Performance Indicator Resource Library - Version 1.2 Page 55 of 103
Archive
d

AUSTRALIAN GOVERNMENT INFORMATION MANAGEMENT OFFICE
Section Performance Group Stakeholders, Entities and People (Personnel, user and community). Ref: Description
Stake
Ref No Sub-Group Sub Performance Primary Source Link if Description Ref: of PI Indicator Known
6.0.7 6.0.8 6.0.9
6.0.10 6.0.11 6.0.12 6.0.13
State whether internal or public users % of user responded State average score per respondent Indicate if independent/external surveyor engaged Date of survey Frequency of survey Change in survey result
Number of offline transactions.
7 Internal access to ICT 7.0
7.0.1 7.0.2 7.0.3 7.0.4 7.0.5
Purpose: to indicate the degree of maturity and dependence on ICT and employee access. Calculation = (No. of PC/Laptops, etc.) divided by (No. of personnel FTEs) X 100.
% of office staff with PC % of field staff with PCs % of office (or field) personnel with access to internal email Ditto for external email % of personnel using PDAs
SocITM KPI 9 SocITM Access KPI
Community (Public)
8 External use satisfaction 8.0.0 8.0.1 8.1.2 8.1.0 8.1.1 8.1.2 8.1.3
Services Generally Reasons for satisfaction Reason for dissatisfaction
Service Enhancement: See “Stake 6” above. User SatisfactionNumber of offline transaction. Ratio of online transaction growth and other channels growth.
SocITM KPI 1 Based on Victoria State Government KPIs
SocITM Cus Sat KPI
Performance Indicator Resource Library - Version 1.2 Page 56 of 103
Archive
d

AUSTRALIAN GOVERNMENT INFORMATION MANAGEMENT OFFICE
Section Performance Group Stakeholders, Entities and People (Personnel, user and community). Ref: Description
Stake
Ref No Sub-Group Sub Performance Primary Source Link if Description Ref: of PI Indicator Known
8.2.0 8.2.1 8.2.2 8.2.3 8.3.0 8.3.1 8.3.2 8.3.3 8.3.4 8.3.5
New Services: No. of new services. % of service available online and offline. % of services on line.
Service Enhancement Responsiveness: Number of people benefiting from increased responsiveness. Average transaction process time. Average cycle time. Average turnaround time. % of users satisfied with service responsiveness.
9 Community access to ICT 9.0.0
9.0.1 9.0.1.29.0..1.39.0.1.49.0.1.59.0.2 9.0.3 9.0.4 9.0.5 9.0.6 9.0.7 9.0.8
See ‘Stake 6’ above. User SatisfactionSurvey users in catchment area and ask questions such as: Have you in the past three months used the internet?
From home? From Work? From education institution From a public library of centre?
% of households with home internet access. % of primary school children with home internet access. % of high school children with home internet access. % of university students with home internet access. % of retirees with home internet access. % of disable persons with home internet access. % households in lower socio-economic groups.
SocITM KPI 91 Victoria State Government
SocITM Comm Access KPI
Performance Indicator Resource Library - Version 1.2 Page 57 of 103
Archive
d

AUSTRALIAN GOVERNMENT INFORMATION MANAGEMENT OFFICE
Section Performance Group Stakeholders, Entities and People (Personnel, user and community). Ref: Description
Stake
Ref No Sub-Group Sub Performance Primary Source Link if Description Ref: of PI Indicator Known
9.0.9 9.0.10 9.0.11
% of vulnerable population with internet access at home. Serviced offered to people with special needs. Serviced offered to the disadvantaged.
9 Community participation 9.1 9.2
9.3 9.4 9.5 9.6
9.7
Number of people participating in the specific community activity. Change in the number of people actively participating in voluntary
work. % of activities which the public can track electronically. Number of issues available on line. % of agencies with at least one issue trackable online. Number of public submissions on public issues submitted online. Diversity (social-economic, age, cultural) of contributors. Distribution of educational material on legal, civil rights, employment
and consumer affairs.
Victoria State Government,
Performance Indicator Resource Library - Version 1.2 Page 58 of 103
Archive
d
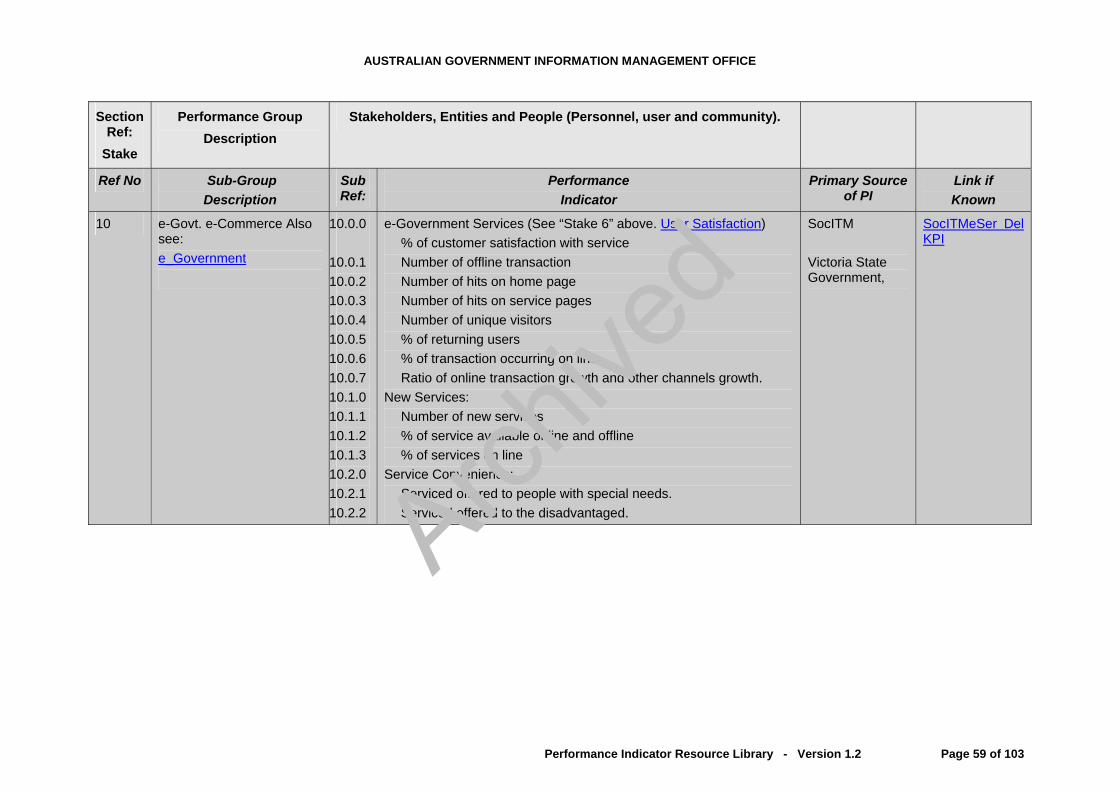
AUSTRALIAN GOVERNMENT INFORMATION MANAGEMENT OFFICE
Section Performance Group Stakeholders, Entities and People (Personnel, user and community). Ref: Description
Stake
Ref No Sub-Group Sub Performance Primary Source Link if Description Ref: of PI Indicator Known
10 e-Govt. e-Commerce Also see: e_Government
10.0.0
10.0.1 10.0.2 10.0.3 10.0.4 10.0.5 10.0.6 10.0.7 10.1.0 10.1.1 10.1.2 10.1.3 10.2.0 10.2.1 10.2.2
e-Government Services (See “Stake 6” above. User Satisfaction) % of customer satisfaction with service Number of offline transaction Number of hits on home page Number of hits on service pages Number of unique visitors % of returning users % of transaction occurring on line Ratio of online transaction growth and other channels growth.
New Services: Number of new services % of service available online and offline % of services on line
Service Convenience: Serviced offered to people with special needs. Serviced offered to the disadvantaged.
SocITM Victoria State Government,
SocITMeSer Del KPI
Performance Indicator Resource Library - Version 1.2 Page 59 of 103
Archive
d

AUSTRALIAN GOVERNMENT INFORMATION MANAGEMENT OFFICE
PIC4 - ICT Investment
Purpose and Context This group of Performance Indicators should be used to measure the investment effectiveness of Enterprise ICT and ICT Management
Sources AGIMO Demand and Value Assessment; Triple Bottom Line; Balanced Scorecard: Capability Maturity Model
Section Ref:
Invest
Performance Group Description
ICT Investment
Ref No Sub-Group Description
Sub Ref:
Performance Indicator
Primary Source of PI
Link if Known
1.0 All budgeted ICT and ICT related expenditure for the current financial year, including staffing, equipment and software for the whole agency, not just the ICT unit.
SocITM KPI 14 SocITM Investment KPI
1.1 As above – total annual ICT as a cost per FTE employee.
1.2 Distribution of ICT expenditure by business theme, to run the business versus transforming the business.
PA Consulting Group
1 In ICT by employee
1.3
1.4
No of in-house staff to total staff including contractors and consultants.
Distribution of staff by function, e.g. (process change, or planning, or development, or service delivery) to total
PA Consulting Group
2 In infrastructure 2.0 2.1
Total investment in infrastructure. Current asset value and valuation method used for example
market resale value.
PA Consulting Group
3 ICT per capita 3.0 Total cost (staffing equipment, software, communications, hired and contracted services, accommodation, HR and other overheads) divide by population of geographic area serviced.
SocITM KPI 90 SocITMInvest/Cap KPI
Performance Indicator Resource Library - Version 1.2 Page 60 of 103
Archive
d

AUSTRALIAN GOVERNMENT INFORMATION MANAGEMENT OFFICE
Section Performance Group ICT Investment Ref: Description
Invest
Ref No Sub-Group Sub Performance Primary Source Link if Description Ref: of PI Indicator Known
4 IP protection 4.0
4.1
Completed intellectual property register. Stating value and ownership or part ownership by the agency.
State any disputed ownership.
CIO, CFO, IPO, AM, Legal Counsel.
5 Project scope outline, interdependencies and constraints
5.0 5.1
5.2 5.3
Have project objectives been defined? Have project interdependencies been clearly defined and
documented? Has the project’s scope been outlined and documented? Have project constraints been identified and documented?
OGC PRINCE2
6 Project mandate or brief 6.0
6.1
6.2
A project mandate may authorise the preparation of a project brief.
A comprehensive project brief (PB) is completed. A PB may contain: background, need, scope, assumptions, priorities, focus, solution options, technology, interdependencies / interfaces, parameters constraints, risks and stakeholder expectations. Such a brief should provide what, why, who, how, when, authorisation and guidance to expend resources in the development of a Business Case. Scope and detail should match the complexity of the project.
Does the Project Brief meet or exceed the PRINCE2 standard?
OGC PRINCE2. AGIMO. Auckland University, NZ.
Project Scoping Template, Auckland University
7 Business Case 7.0 7.1
A comprehensive Business Case is under development. A comprehensive Business Case is complete.
AGIMO ICT Business Case Development Guide
Performance Indicator Resource Library - Version 1.2 Page 61 of 103
Archive
d
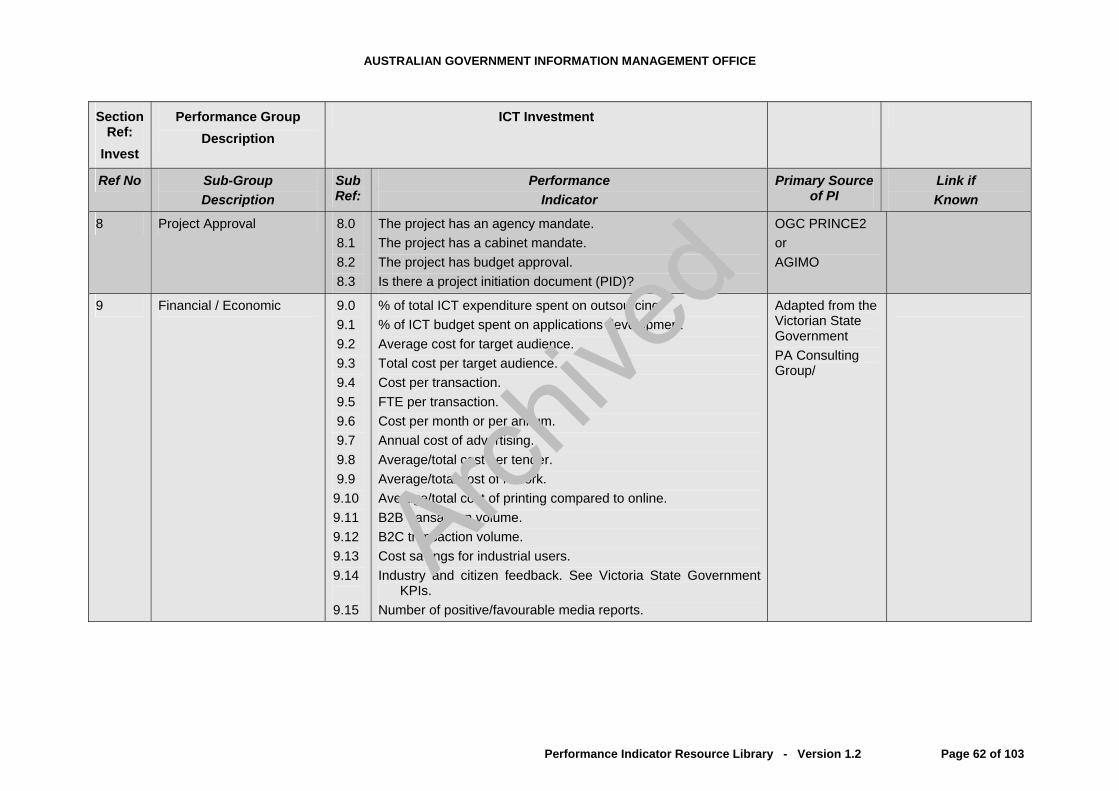
AUSTRALIAN GOVERNMENT INFORMATION MANAGEMENT OFFICE
Section Performance Group ICT Investment Ref: Description
Invest
Ref No Sub-Group Sub Performance Primary Source Link if Description Ref: of PI Indicator Known
8 Project Approval 8.0 8.1 8.2 8.3
The project has an agency mandate. The project has a cabinet mandate. The project has budget approval. Is there a project initiation document (PID)?
OGC PRINCE2 or AGIMO
9 Financial / Economic 9.0 9.1 9.2 9.3 9.4 9.5 9.6 9.7 9.8 9.9
9.10 9.11 9.12 9.13 9.14
9.15
% of total ICT expenditure spent on outsourcing % of ICT budget spent on applications development Average cost for target audience. Total cost per target audience. Cost per transaction. FTE per transaction. Cost per month or per annum. Annual cost of advertising. Average/total cost per tender. Average/total cost of rework. Average/total cost of printing compared to online. B2B transaction volume. B2C transaction volume. Cost savings for industrial users. Industry and citizen feedback. See Victoria State Government
KPIs. Number of positive/favourable media reports.
Adapted from the Victorian State Government PA Consulting Group/
Performance Indicator Resource Library - Version 1.2 Page 62 of 103
Archive
d

AUSTRALIAN GOVERNMENT INFORMATION MANAGEMENT OFFICE
PIC5 - Alignment with Government Business
Purpose and Context This group of Performance Indicators examines the alignment of ICT investment with Government business objectives
Sources OGC Portfolio Management Guide; Capability Maturity Model;
Section Ref: Biz
Performance Group Description
Alignment with Government Business
Ref No Sub-Group Description
Sub Ref:
Performance Indicator
Primary Source of PI
Link if Known
1 Alignment with agency 1.0 1.1
Alignment with business needs Alignment with business intelligence
Agency Strategic Business Planning Committee
2 Portfolio management 2.0 Verify that the project is being managed in the context of the Agencies Portfolio
OGC OGC Portfolio Mgmt guide
3 Alignment with whole of government
3.0 Alignment with w-o-g needs Agency Strategic Business Planning Committee
Performance Indicator Resource Library - Version 1.2 Page 63 of 103
Archive
d

AUSTRALIAN GOVERNMENT INFORMATION MANAGEMENT OFFICE
Section Performance Group Alignment with Government Business Ref: Description Biz
4 Interoperability with whole of government
4.0 4.1 4.2 4.3
4.3.0 4.3.1 4.3.2 4.3.3
Interoperability with pivotal stakeholders Interoperability with whole of government systems Interoperability with business intelligence systems Interoperability level in terms of systems: Systems interconnectivity Data integration and exchange Application integration - Industrial specific Application integration – Content.
Agency Secretary, LO and CIO Stakeholders
5 Shared services
5.0 5.1
N.B. Shared Services, such as administration, procurement, internal audit, HRM, EAP, ICT, etc.
The option of Shared Services is considered in the Business Case The potential of a Shared Services option has been assessed. And
includes strategy and a plan for: design, transition, implementation stabilisation and refining
Agency Secretary, LO and CIO. Shared Services, PWC, 9-01999
6 Governance or Compliance with governance
6.0 6.1 6.2 6.3 6.4 6.5 6.6
Project mandate Project brief Benefits case Governance plan Budget approval Approval Qualifications, e.g., comply with special condition Project plans
Agency, and Stakeholders, Secretary, CIO, Risk Manager, Budget Group, and AGIMO, Finance
7 7.0
7.1
% of total ICT expenditure of the organisations operating expenditure. Distribution of ICT expenditure by business theme: operating expense versus development
PA Consulting Group
Performance Indicator Resource Library - Version 1.2 Page 64 of 103
Archive
d
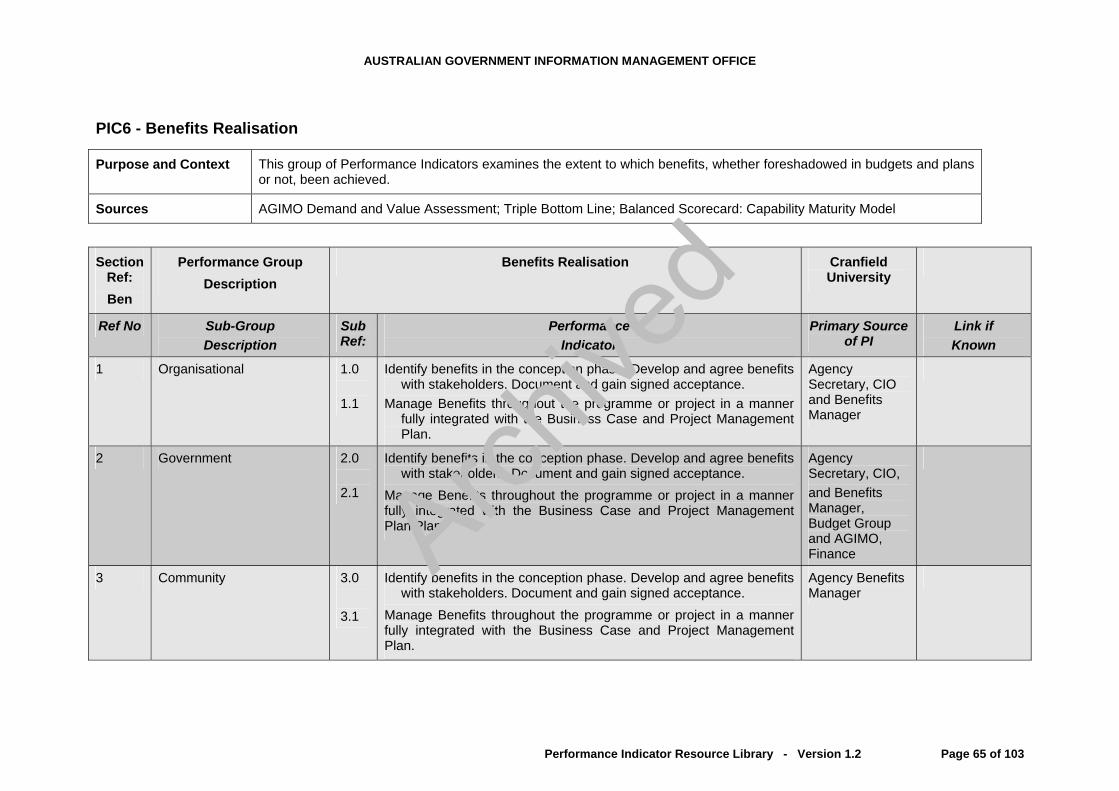
AUSTRALIAN GOVERNMENT INFORMATION MANAGEMENT OFFICE
PIC6 - Benefits Realisation
Purpose and Context This group of Performance Indicators examines the extent to which benefits, whether foreshadowed in budgets and plans or not, been achieved.
Sources AGIMO Demand and Value Assessment; Triple Bottom Line; Balanced Scorecard: Capability Maturity Model
Section Ref: Ben
Performance Group Description
Benefits Realisation Cranfield University
Ref No Sub-Group Description
Sub Ref:
Performance Indicator
Primary Source of PI
Link if Known
1 Organisational 1.0
1.1
Identify benefits in the conception phase. Develop and agree benefits with stakeholders. Document and gain signed acceptance.
Manage Benefits throughout the programme or project in a manner fully integrated with the Business Case and Project Management Plan.
Agency Secretary, CIO and Benefits Manager
2 Government 2.0
2.1
Identify benefits in the conception phase. Develop and agree benefits with stakeholders. Document and gain signed acceptance.
Manage Benefits throughout the programme or project in a manner fully integrated with the Business Case and Project Management Plan.Plan.
Agency Secretary, CIO, and Benefits Manager, Budget Group and AGIMO, Finance
3 Community 3.0
3.1
Identify benefits in the conception phase. Develop and agree benefits with stakeholders. Document and gain signed acceptance.
Manage Benefits throughout the programme or project in a manner fully integrated with the Business Case and Project Management Plan.
Agency Benefits Manager
Performance Indicator Resource Library - Version 1.2 Page 65 of 103
Archive
d

AUSTRALIAN GOVERNMENT INFORMATION MANAGEMENT OFFICE
Section Cranfield Performance Group Benefits Realisation Ref: University Description Ben
Ref No Sub-Group Sub Performance Primary Source Link if Description Ref: of PI Indicator Known
4 Financial 4.0 Attribute financial values to planned and net realised benefits and compare to cost.
Agency CIO Budget Group, Finance.
5 Acceptance Criteria 5.0 Determine and agree client or stakeholder acceptance criteria for ICT capability and services performance handover from provider to client.
Agency Secretary, CIO, Quality Manager and Benefits Manager
Performance Indicator Resource Library - Version 1.2 Page 66 of 103
Archive
d
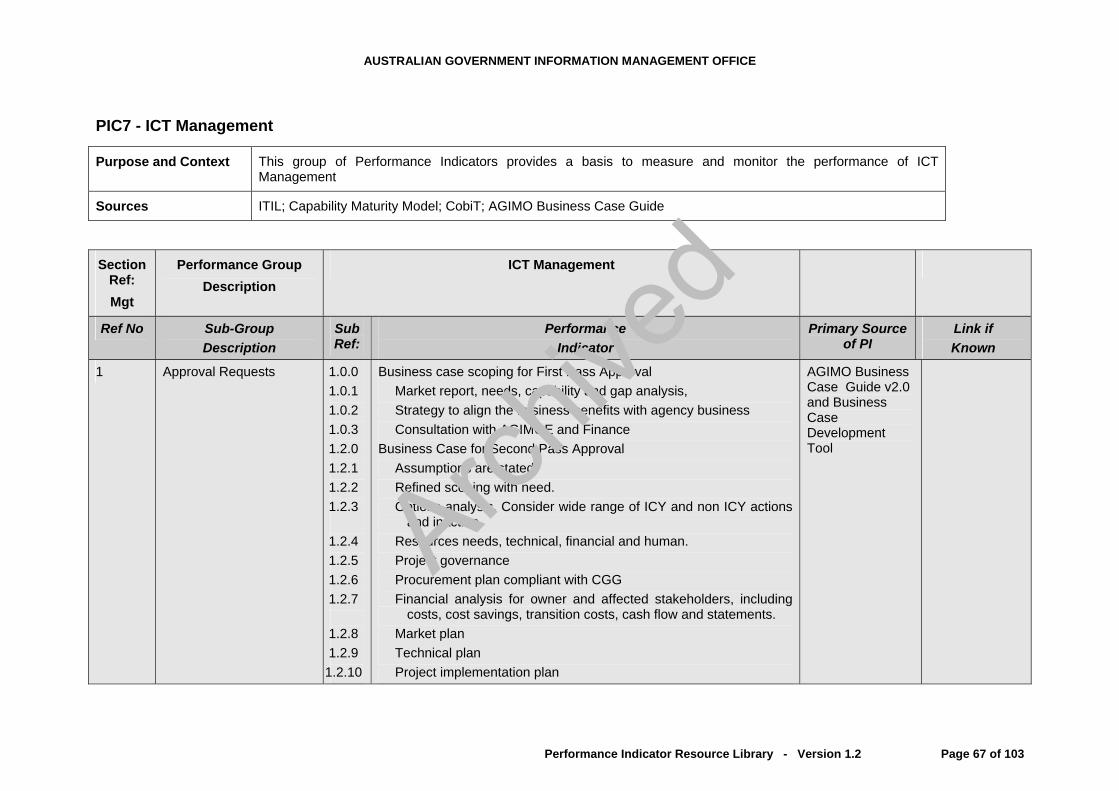
AUSTRALIAN GOVERNMENT INFORMATION MANAGEMENT OFFICE
PIC7 - ICT Management
Purpose and Context This group of Performance Indicators provides a basis to measure and monitor the performance of ICT Management
Sources ITIL; Capability Maturity Model; CobiT; AGIMO Business Case Guide
Section Ref: Mgt
Performance Group Description
ICT Management
Ref No Sub-Group Description
Sub Ref:
Performance Indicator
Primary Source of PI
Link if Known
1 Approval Requests 1.0.0 1.0.1 1.0.2 1.0.3 1.2.0 1.2.1 1.2.2 1.2.3
1.2.4 1.2.5 1.2.6 1.2.7
1.2.8 1.2.9 1.2.10
Business case scoping for First Pass Approval Market report, needs, capability and gap analysis, Strategy to align the business benefits with agency business Consultation with AGIMOE and Finance
Business Case for Second Pass Approval Assumptions are stated Refined scoping with need. Options analysis. Consider wide range of ICY and non ICY actions
and inaction. Resources needs, technical, financial and human. Project governance Procurement plan compliant with CGG Financial analysis for owner and affected stakeholders, including
costs, cost savings, transition costs, cash flow and statements. Market plan Technical plan Project implementation plan
AGIMO Business Case Guide v2.0 and Business Case Development Tool
Performance Indicator Resource Library - Version 1.2 Page 67 of 103
Archive
d

AUSTRALIAN GOVERNMENT INFORMATION MANAGEMENT OFFICE
Section Performance Group ICT Management Ref: Description Mgt
Ref No Sub-Group Sub Performance Primary Source Link if Description Ref: of PI Indicator Known
1.2.11 1.2.121.2.13 1.2.14
1.2.15 1.2.16
Risk management plan Benefits realisation plan has performance indicators. Reviews, internal and/or external independent consultants reports Stakeholder communication strategy Strategy to align benefits with agency and whole of the
Government business needs Consultation with AGIMO and Finance.
2.0
2.0.1
The agency has a current and comprehensive ICT plan aligned to the agencies business plan. Agency business cycles have been identify and taken into account
Agency Corporate Services
2.1 The project is fully congruent with whole of government principles and business needs.
Consult related agencies. AGIMO, Finance.
2.2 A business continuity plan is complete comprehensive and satisfies ANAO expectations.
ANAO Business Continuity Guide
ANAO BC GuideANAO BC Mgmt
2.3 A performance evaluation plan has been developed with the capability to realistically evaluate project performance at appropriate stages of implementation and completion.
Centrelink, Defence and Finance Handbooks PRINCE2
Not on Internet PRINCE2a
2 Business Plan
2.4 Causes of project failure have been evaluated. OGC Causes of Failure
Performance Indicator Resource Library - Version 1.2 Page 68 of 103
Archive
d

AUSTRALIAN GOVERNMENT INFORMATION MANAGEMENT OFFICE
Section Performance Group ICT Management Ref: Description Mgt
Ref No Sub-Group Sub Performance Primary Source Link if Description Ref: of PI Indicator Known
2.5 A Marketing plan been developed to market the concept. Agency Strategic Business Planning Group
3 Financial Plan 3.0 3.1
3.1.1 3.1.2 3.1.3 3.2 3.3 3.4
A financial plan is complete The financial plan includes:
Other funding (operational or financial leasing and loans). Savings from retrenchment of the old system. Transition costs.
The financial plan has been independently assessed. Cash flow plan has been prepared. Financial impact statement has been prepared.
Finance (DoFA) Contact Budget Group, Finance.
4 Governance Plan 4.0 4.1
4.2 4.3
4.4
4.5 4.6 4.7 4.8
A project steering committee has been formed. Steering committee responsibilities, governance, authority and limits are defined A project management committee has been formed. Project management committee responsibilities, governance, authority and limits are defined. Project management organisation structure, roles and responsibilities have been defined. Project management methodology has been defined. Appropriate involvement of stakeholders. Appropriate audit standard such as ISO 9000. Independently certified QMS.
AGIMO, OGC PRINCE2 ITIL, ITGI & ISACA SAI Global
ISACA.org www.ITGI.orgISACA.orgSAI GlobalISO 9000
Performance Indicator Resource Library - Version 1.2 Page 69 of 103
Archive
d

AUSTRALIAN GOVERNMENT INFORMATION MANAGEMENT OFFICE
Section Performance Group ICT Management Ref: Description Mgt
Ref No Sub-Group Sub Performance Primary Source Link if Description Ref: of PI Indicator Known
4.9
4.10 4.11
4.12
Established quality committee with authority to manage audits and implement corrective and preventative actions and auditor recommendations. Audit strategies are determined and appropriate. Frequency of internal and external audits are determined and deemed adequate. Is the project benchmarked to another or group or projects?
Architectural Plan 5.0.0 5.0.1 5.0.2 5.0.3
Expandability plan Refresh plan Change plan Life-cycle plan - longevity - refresh
Competent Expert / Consultant
5
Technical Management 5.1.0 5.1.1 5.1.2
5.1.3
5.1.4 5.1.5 5.1.6 5.1.7
Have all technical options been appraised? Is the technology mature and proven or developmental? Has the technology been previously implemented in a similar environment? Will the technical performance provide needed capability and capacity? Is the technology scaleable? Have all technical risks been assessed? Resolution of reported incidents. Percentage of successful projects in last 12 months or fiscal year. Success may be measured in terms of project or service delivery. Refer to Project Success. Also refer to SocITM KPI 3 which relates to deliverable.
SocITM KPI 3 ITIL
SocITM % of Suc prjts KPIOGC-ITIL ITIL 1ITIL 2
Performance Indicator Resource Library - Version 1.2 Page 70 of 103
Archive
d

AUSTRALIAN GOVERNMENT INFORMATION MANAGEMENT OFFICE
Section Performance Group ICT Management Ref: Description Mgt
Ref No Sub-Group Sub Performance Primary Source Link if Description Ref: of PI Indicator Known
6 Software Plan 6.0 Applications plan. Licensing plan.
Consultant
7.0 Security prevention plan – ACOI 33 / PSM. Consultant
7.1 Disaster recovery plan. ANAO guide ANAO BC GuideANAO BC Mgmt
7.2 Staff succession plan. Agency HRM and CIO
7.3 Personnel / security plan. Agency RRM and Security Manager
7 Security Management Systems (Policy, Procedures) and Plan
8 Risk Management Plan 8.0
8.1 8.2 8.3 8.4 8.5 8.6 8.7
A dynamic risk management plan that identifies, assesses and mitigates risks I complete
A risk log or register is established and maintained Risk owners have been identified and a risk manager appointed. Is risk assessment part of the change management process? Were risk probabilities and the cost of consequences assessed? Were contingency plans needed and developed to address risks? Were all obvious risks adequately addressed? OGC’s PRINCE2 Risk Potential Assessment Tool has been used?
SAI Global - AS/NZS 4360:1999 OGC PRINCE2
SAI GlobalPRINCE2 Risk Assessment Tools
9 Service Delivery & Support Plan
9.0 Service delivery plan covering identity management, availability, capacity, configuration, change, release, service, recovery and continuity and level, help desk, problem and incident management.
ITIL OGC-ITIL ITIL 1ITIL 2
Performance Indicator Resource Library - Version 1.2 Page 71 of 103
Archive
d

AUSTRALIAN GOVERNMENT INFORMATION MANAGEMENT OFFICE
Section Performance Group ICT Management Ref: Description Mgt
Ref No Sub-Group Sub Performance Primary Source Link if Description Ref: of PI Indicator Known
10.0.010.0.110.0.2
A project manager or executive has been appointed. Business case is fully documented. Have milestones been set?
AGIMO
10.1.010.1.1
10.1.210.1.310.1.410.1.5
PRINCE2 is fully applied. Program or project planning and management, including scheduling,
resourcing, co-ordinating, controlling time, quality, service, costs and risks, monitoring and reviewing. Also the integration of the project into the project portfolio.
Stakeholder management Issues management Risk management Benefits management
PRINCE2 PRINCE2aISO 9000
10.2.010.2.1
10.2.210.2.310.2.410.2.510.2.610.2.7
Project plan is comprehensive, complete and current. The project plan is fully compliant with PRINCE2 methodologies; it
comprehensively covers all elements found in PRINCE2. Was the project plan quality reviewed? Is there an inventory of key products? Have key products been specified? Are stage plans necessary and completed? Is the project committee required to sign off on project stages? Does the project schedule allow sufficient time for project
management activities?
PRINCE2 CIU guide to Preparing Implementation Plans OGC
PRINCE2a
10 Project Implementation Plan
10.3 Contract review process. All contractual commitments are fully reviewed and satisfy Commonwealth Procurement Guidelines, before entered into?
Legal Counsel ISO 9000 - 2000
Decision Map
Performance Indicator Resource Library - Version 1.2 Page 72 of 103
Archive
d

AUSTRALIAN GOVERNMENT INFORMATION MANAGEMENT OFFICE
Section Performance Group ICT Management Ref: Description Mgt
Ref No Sub-Group Sub Performance Primary Source Link if Description Ref: of PI Indicator Known
10.4 Gateway Review, provides (usually 6) major progress review before allowing a project to proceed. Reviews should be independent and objective and is a review or check of the state or readiness of a project for the next stage of a project. I identifies weaknesses that can then be addressed early and gives confidence to PMgrs, owners and stakeholders
AGIMO (coming soon. OGC
OGC Gateway Review Process
10.5
10.6
Benefits management plan has been fully committed to since the concept formulation and through business case development and project delivery to investment validation.
Benefits management methodology (policy, procedures and practices) such as employed by the Victorian Government.
OGC. Cranfield University, UK. Victoria Govt.
OGC Benefits Mgmt.
10.6.010.6.1
10.6.210.6.3
Logistics plans. A sourcing and procurement plan is comprehensive and fully compliant
with Commonwealth Procurement Guidelines. Have products been identified and specified? Is a supply plan complete?
CPGs. Finance (DoFA) OGC PRINCE2
10.7 Stakeholder management. PRINCE2 PRINCE2a
10.8 An issues log is established and maintained. OGC PRINCE2
10.9.010.9.1
A lessons learned log A lesson learned report is prepared
OGC PRINCE2
Performance Indicator Resource Library - Version 1.2 Page 73 of 103
Archive
d

AUSTRALIAN GOVERNMENT INFORMATION MANAGEMENT OFFICE
Section Performance Group ICT Management Ref: Description Mgt
Ref No Sub-Group Sub Performance Primary Source Link if Description Ref: of PI Indicator Known
11 Quality / Audit Plan 11.0 11.1 11.2 11.3
11.4 11.5 11.6
11.7
11.8 11.9 11.10
A comprehensive Quality Management System (QMS) in Place? Has a quality Manager has been appointed? Is the QMS consistent with ISO 9000 2000? Is the QMS Certified by and independently ISO 9000 2000 certification
body? Has a full-time project quality manager been appointed? Has a quality management committee been established? Are tools that supplement ISO 9000, 2000 in place? e.g.,
Lean, Six Sigma or Lean Six Sigma Customer Critical service focus.
Quality management methodologies apply to document and data control.
Audit schedule, strategy, plan and register are documented. Gateway reviews are planned. Post-Project review is planned and will include independent review of:
Business case; technical and managerial strategy; project management; planned and actual: scope, time, cost and quality; planned and net benefits realisation; investment decision validation. Success: failure rating and lesson.
SAI Global & ISO 9000 : 2000 OGC PRINCE2
SAI GlobalISO 9000
12 Project Delivery 12.0 12.1 12.2 12.3
% of completed projects delivered on time % of completed projects delivered on budget % of completed projects delivering planned functionality % of projects in process with R/A/G statue by project size
PA Consulting Group
Performance Indicator Resource Library - Version 1.2 Page 74 of 103
Archive
d
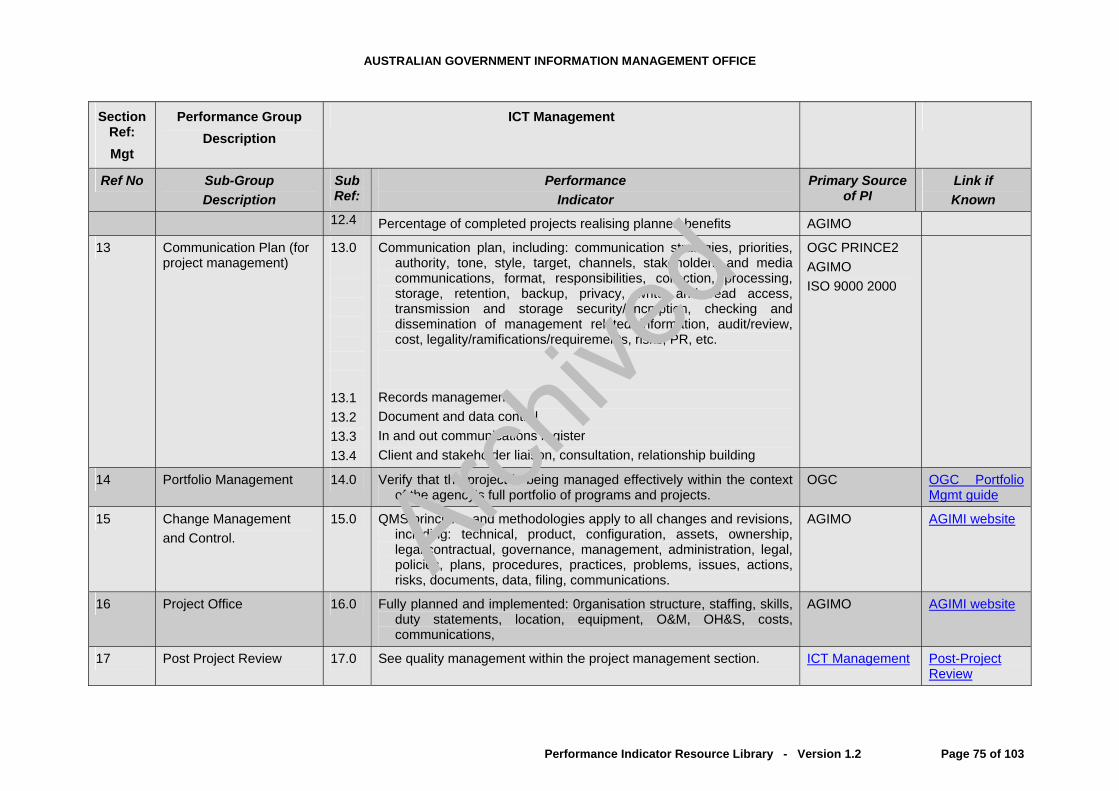
AUSTRALIAN GOVERNMENT INFORMATION MANAGEMENT OFFICE
Section Performance Group ICT Management Ref: Description Mgt
Ref No Sub-Group Sub Performance Primary Source Link if Description Ref: of PI Indicator Known
12.4 Percentage of completed projects realising planned benefits AGIMO
13 Communication Plan (for project management)
13.0
13.1 13.2 13.3 13.4
Communication plan, including: communication strategies, priorities, authority, tone, style, target, channels, stakeholders and media communications, format, responsibilities, collection, processing, storage, retention, backup, privacy, write and read access, transmission and storage security/encryption, checking and dissemination of management related information, audit/review, cost, legality/ramifications/requirements, risks, PR, etc.
Records management Document and data control In and out communications register Client and stakeholder liaison, consultation, relationship building
OGC PRINCE2 AGIMO ISO 9000 2000
14 Portfolio Management 14.0 Verify that the project is being managed effectively within the context of the agency’s full portfolio of programs and projects.
OGC OGC Portfolio Mgmt guide
15 Change Management and Control.
15.0 QMS principles and methodologies apply to all changes and revisions, including: technical, product, configuration, assets, ownership, legal/contractual, governance, management, administration, legal, policies, plans, procedures, practices, problems, issues, actions, risks, documents, data, filing, communications.
AGIMO AGIMI website
16 Project Office 16.0 Fully planned and implemented: 0rganisation structure, staffing, skills, duty statements, location, equipment, O&M, OH&S, costs, communications,
AGIMO AGIMI website
17 Post Project Review 17.0 See quality management within the project management section. ICT Management Post-Project Review
Performance Indicator Resource Library - Version 1.2 Page 75 of 103
Archive
d

AUSTRALIAN GOVERNMENT INFORMATION MANAGEMENT OFFICE
PIC8 - Incident Management
Purpose and Context This group of Performance Indicators examines performance related to incident management.
Sources ITIL; AS/NZS4360
Section Ref: Gen
Performance Group Description
Generic ITIL Incident Management which can apply to many groups, inc. PC, servers, coms.
Ref No Sub-Group Description
Sub Ref:
Performance Indicator
Primary Source of PI
Link if Known
1 Mission Statement 1.0 Completed and clearly defined mission statement ITIL OGC-ITIL ITIL 1ITIL 2
2 Identify Success Factors 2.0 Clearly defined critical success factors refer to Project Success.
ITIL OGC-ITIL ITIL 1ITIL 2
3 Maintaining Quality ICT Service
3.0 Independently validated quality service delivery. See Stake 6 above. User Satisfaction
ITIL OGC-ITIL ITIL 1ITIL 2ISO 9000
4.0 See Stakeholders above. Stakeholders
ITIL OGC-ITIL ITIL 1ITIL 2
4 Customer Satisfaction
4.1 Number of customer satisfaction Surveys conducted in the last 12 months, or for new projects the scheduled frequency
PA Consulting Group
Performance Indicator Resource Library - Version 1.2 Page 76 of 103
Archive
d

AUSTRALIAN GOVERNMENT INFORMATION MANAGEMENT OFFICE
Section Performance Group Generic ITIL Incident Management Ref: Gen
Description which can apply to many groups, inc. PC, servers, coms.
Ref No Sub-Group Sub Performance Primary Source Link if Description Ref: of PI Indicator Known
5 Incident Resolution and Service Time
5.0 5.1.0 5.1.1 5.1.2 5.1.3 5.1.4
Various SLA. Record of Incident occurrence
Definition of incident Resolution of incident Time take to resolve incident Confirmation to user that the issue has been resolved
ITIL OGC-ITIL ITIL 1ITIL 2
6 Capacity Management. (Applied to HR, PC, Middleware, Mainframe, LAN, WAN, Portals, etc.)
6.0 6.1 6.2 6.3 6.4
Total capacity Capacity expandability Peak volume Total volume Demand growth
AGIMO
7 Service Delivery 7.0 7.1 7.2 7.3
Average number of helpdesk requests per user per month Percentage of calls resolved with an agreed timescale In how many of the late six months did you fully meet your SLAs How many months ago was your business continuity plan audited.
PA Consulting Group
Performance Indicator Resource Library - Version 1.2 Page 77 of 103
Archive
d
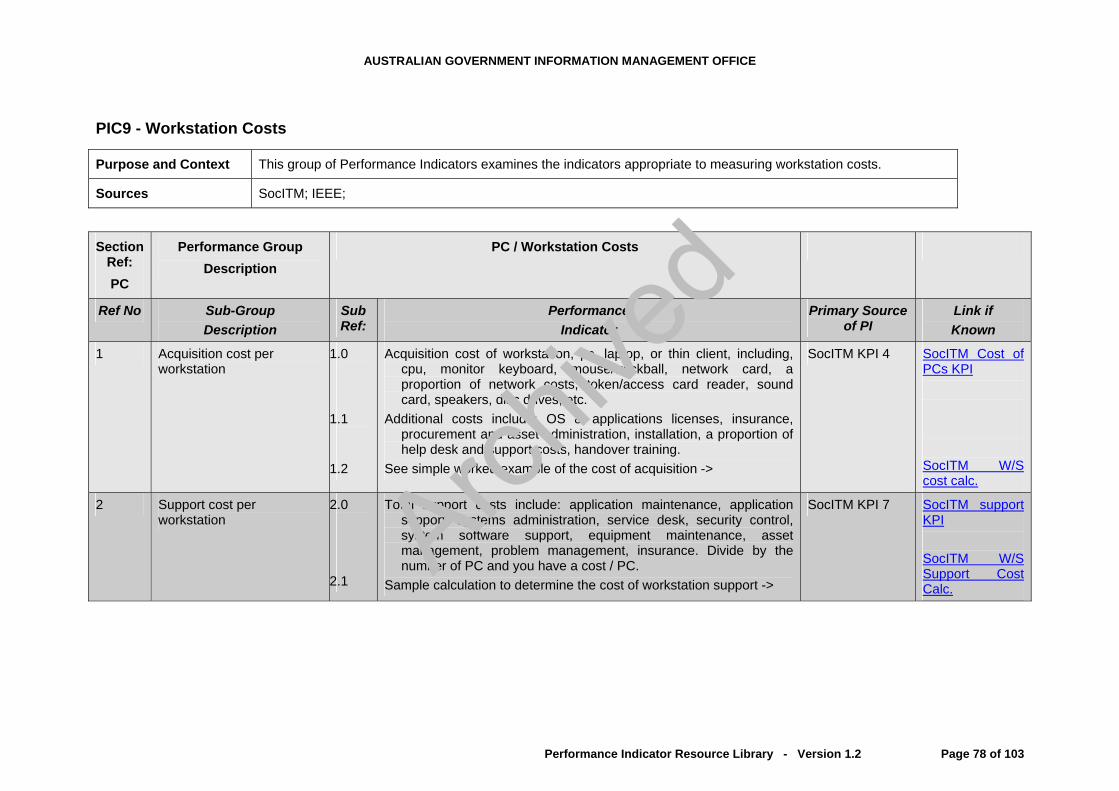
AUSTRALIAN GOVERNMENT INFORMATION MANAGEMENT OFFICE
PIC9 - Workstation Costs
Purpose and Context This group of Performance Indicators examines the indicators appropriate to measuring workstation costs.
Sources SocITM; IEEE;
Section Ref: PC
Performance Group Description
PC / Workstation Costs
Ref No Sub-Group Description
Sub Ref:
Performance Indicator
Primary Source of PI
Link if Known
1 Acquisition cost per workstation
1.0
1.1
1.2
Acquisition cost of workstation, pc, laptop, or thin client, including, cpu, monitor keyboard, mouse/trackball, network card, a proportion of network costs, token/access card reader, sound card, speakers, disc drives, etc.
Additional costs include: OS & applications licenses, insurance, procurement and asset administration, installation, a proportion of help desk and support costs, handover training.
See simple worked example of the cost of acquisition ->
SocITM KPI 4 SocITM Cost of PCs KPI SocITM W/S cost calc.
2 Support cost per workstation
2.0
2.1
Total support costs include: application maintenance, application support, systems administration, service desk, security control, system software support, equipment maintenance, asset management, problem management, insurance. Divide by the number of PC and you have a cost / PC.
Sample calculation to determine the cost of workstation support ->
SocITM KPI 7 SocITM support KPI SocITM W/S Support Cost Calc.
Performance Indicator Resource Library - Version 1.2 Page 78 of 103
Archive
d

AUSTRALIAN GOVERNMENT INFORMATION MANAGEMENT OFFICE
Section Performance Group PC / Workstation Costs Ref: Description PC
Ref No Sub-Group Sub Performance Primary Source Link if Description Ref: of PI Indicator Known
3 Workstation support per support specialist
3.0
3.1
Total support costs, including: application maintenance, support, administration, virus protection, security control, technology provision, equipment maintenance, system software support, asset management, service desk, problem management, overheads. Knowing the number of PC and the number of support staff, determine the No of PC per support person and the cost per support person.
Sample calculation to determine the cost per support person ->
SocITM KPI 8 SocITM Support/spec't KPI SocITM Cost of Supprt Spec't Calc
4 Distributed computing capability (savings/income)
4.0 % of PC used for distributed or grid computing to raise utilisation of computer processing power for background computing, research, etc.
Agency Secretary, CIO, Risk Manager and Security Manager IBM
IBM-GridGrid.OrgIEEE Distributed Computing
Performance Indicator Resource Library - Version 1.2 Page 79 of 103
Archive
d
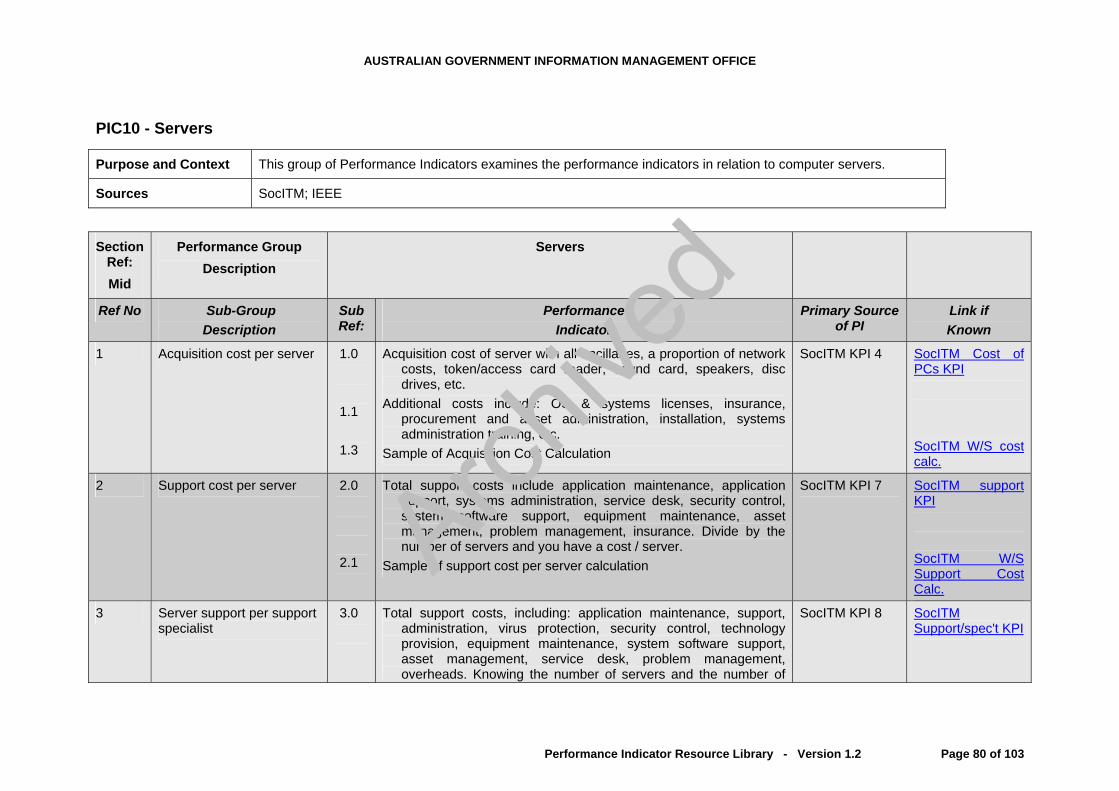
AUSTRALIAN GOVERNMENT INFORMATION MANAGEMENT OFFICE
PIC10 - Servers
Purpose and Context This group of Performance Indicators examines the performance indicators in relation to computer servers.
Sources SocITM; IEEE
Section Ref: Mid
Performance Group Description
Servers
Ref No Sub-Group Description
Sub Ref:
Performance Indicator
Primary Source of PI
Link if Known
1 Acquisition cost per server 1.0
1.1
1.3
Acquisition cost of server with all ancillaries, a proportion of network costs, token/access card reader, sound card, speakers, disc drives, etc.
Additional costs include: OS & systems licenses, insurance, procurement and asset administration, installation, systems administration training, etc.
Sample of Acquisition Cost Calculation
SocITM KPI 4 SocITM Cost of PCs KPI SocITM W/S cost calc.
2 Support cost per server 2.0
2.1
Total support costs include application maintenance, application support, systems administration, service desk, security control, system software support, equipment maintenance, asset management, problem management, insurance. Divide by the number of servers and you have a cost / server.
Sample of support cost per server calculation
SocITM KPI 7 SocITM support KPI SocITM W/S Support Cost Calc.
3 Server support per support specialist
3.0
Total support costs, including: application maintenance, support, administration, virus protection, security control, technology provision, equipment maintenance, system software support, asset management, service desk, problem management, overheads. Knowing the number of servers and the number of
SocITM KPI 8 SocITM Support/spec't KPI
Performance Indicator Resource Library - Version 1.2 Page 80 of 103
Archive
d
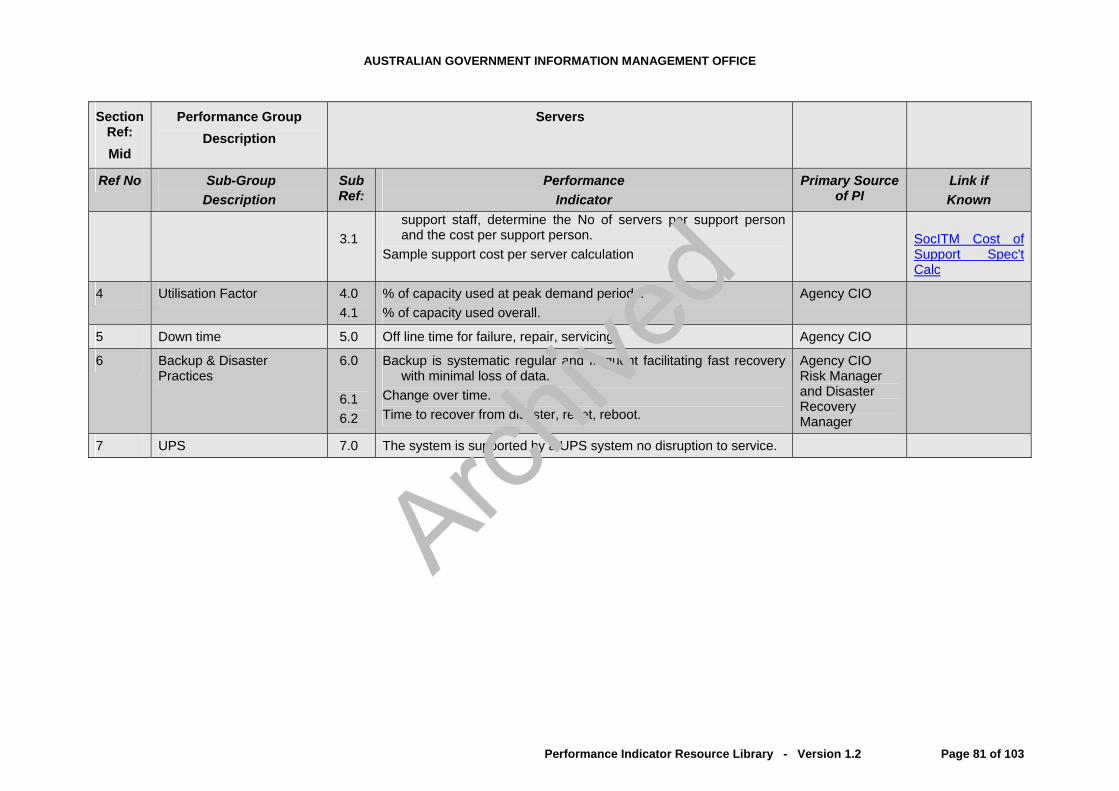
AUSTRALIAN GOVERNMENT INFORMATION MANAGEMENT OFFICE
Section Performance Group Servers Ref: Description Mid
Ref No Sub-Group Sub Performance Primary Source Link if Description Ref: of PI Indicator Known
3.1
support staff, determine the No of servers per support person and the cost per support person.
Sample support cost per server calculation
SocITM Cost of Support Spec't Calc
4 Utilisation Factor 4.0 4.1
% of capacity used at peak demand periods. % of capacity used overall.
Agency CIO
5 Down time 5.0 Off line time for failure, repair, servicing. Agency CIO
6 Backup & Disaster Practices
6.0
6.1 6.2
Backup is systematic regular and frequent facilitating fast recovery with minimal loss of data.
Change over time. Time to recover from disaster, reset, reboot.
Agency CIO Risk Manager and Disaster Recovery Manager
7 UPS 7.0 The system is supported by a UPS system no disruption to service.
Performance Indicator Resource Library - Version 1.2 Page 81 of 103
Archive
d

AUSTRALIAN GOVERNMENT INFORMATION MANAGEMENT OFFICE
PIC11 - Mainframe
Purpose and Context This group of Performance Indicators examines the performance indicators relevant to an evaluation of performance and price of mainframe computers.
Sources SocITM; IEEE
Section Ref: MFr
Performance Group Description
Mainframe
Ref No Sub-Group Description
Sub Ref:
Performance Indicator
Primary Source of PI
Link if Known
1 Performance 1.0 1.1 1.2 1.3 1.4 1.5
Capacity MIPS CPU Utilisation Factor at peak times and overall. Down time Recovery time Frequency of failure Expandability
Agency CIO
2 Architecture System Currency & support
2.0 Technology currency. How many more years will competent professional support be available for the unit?
Agency CIO, Independent Consultants
3 S/W System Currency & support
3.0
3.1
3.2
The current or proposed software architecture is and will be fully supported for the next lifecycle.
The current software performs all necessary functions without any significant disbenefits.
The current software provides all necessary integration with other stakeholder systems.
Agency CIO, Independent Consultants
4 Back up & Disaster Recovery Practices
4.0
Back up is systematic, automated, regular and frequent, allowing fast recovery with minimal loss of data.
Agency CIO and Disaster
Performance Indicator Resource Library - Version 1.2 Page 82 of 103
Archive
d

AUSTRALIAN GOVERNMENT INFORMATION MANAGEMENT OFFICE
Section Performance Group Mainframe Ref: Description MFr
Ref No Sub-Group Sub Performance Primary Source Link if Description Ref: of PI Indicator Known
4.1 Recovery is fast, systematic, well planned and rehearsed, with minimal system down time.
Recovery Manager
5 UPS 5.0 The system is supported by a UPS system no disruption to service.
Performance Indicator Resource Library - Version 1.2 Page 83 of 103
Archive
d

AUSTRALIAN GOVERNMENT INFORMATION MANAGEMENT OFFICE
PIC12 - Software Development
Purpose and Context This group of Performance Indicators examines the performance indicators relevant to software development
Sources Capability Maturity Model; ITIL; CobiT
Section Ref: SD
Performance Group Description
Software Development
Ref No Sub-Group Description
Sub Ref:
Performance Indicator
Primary Source of PI
Link if Known
1 Detailed Methodologies and Corporate Standards
1.0
1.1
Detailed methodologies and corporate standards are in place for all phases of the software development lifecycle (SDLC). Senior personnel have been trained, and ideally certified in use of methodologies.
2 Quality Assurance 2.0 2.1 2.2
QA processes have been established for all aspects of SDLC. Appropriate staff members have been trained. Reporting to immediate supervisors and senior manages occurs
regularly.
3 Performance 3.0 3.1
3.2
Performance benchmarks have been determined. Developer and maintenance staff performance levels are measured – eg in relation to lines of code per day, errors, etc Reporting to immediate supervisors and senior managers occurs regularly.
4 Testing 4.0
4.1
4.2
Applications, systems and integration testing methodologies have been established.
Independent staff and end-users actively participate in software testing.
Error logging and monitoring approaches are in place.
Performance Indicator Resource Library - Version 1.2 Page 84 of 103
Archive
d
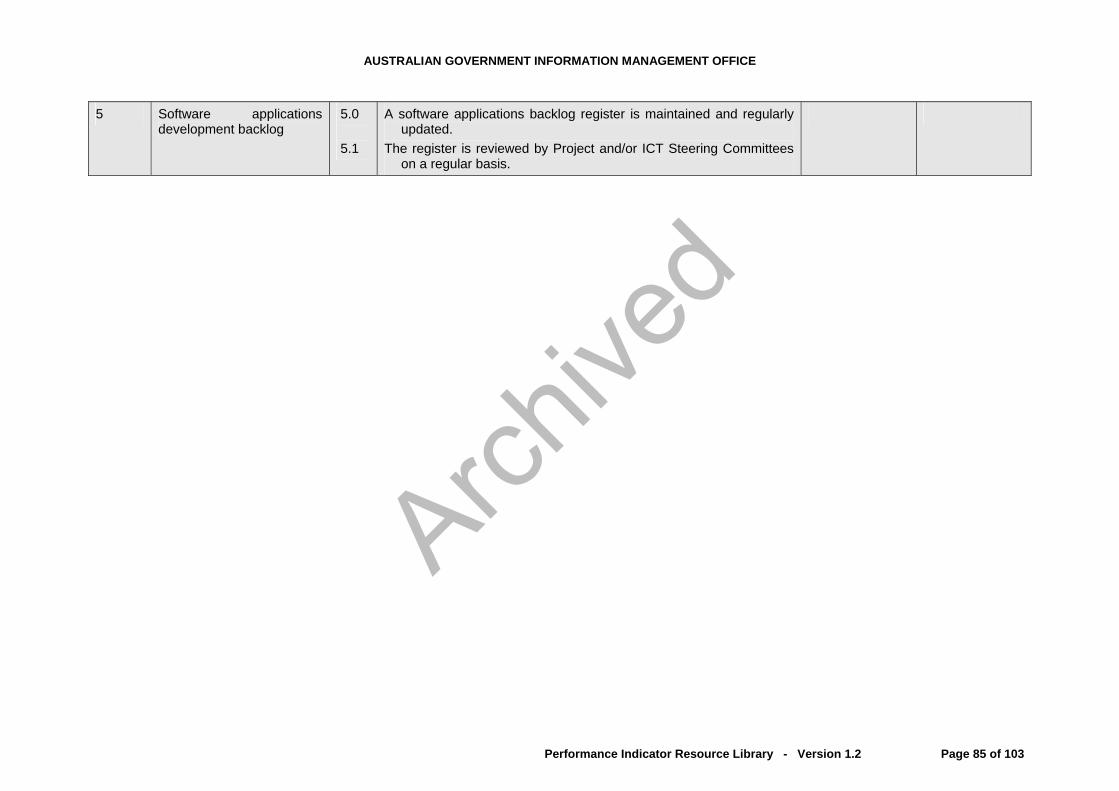
AUSTRALIAN GOVERNMENT INFORMATION MANAGEMENT OFFICE
5 Software applications development backlog
5.0
5.1
A software applications backlog register is maintained and regularly updated.
The register is reviewed by Project and/or ICT Steering Committees on a regular basis.
Performance Indicator Resource Library - Version 1.2 Page 85 of 103
Archive
d
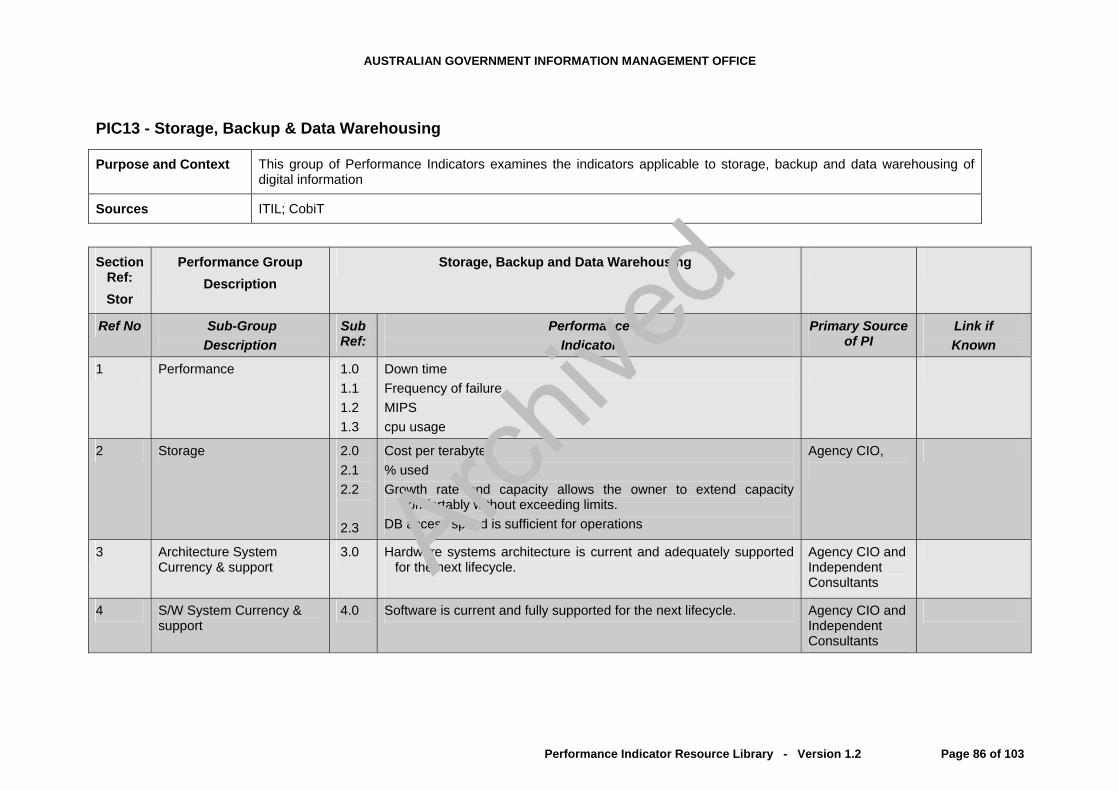
AUSTRALIAN GOVERNMENT INFORMATION MANAGEMENT OFFICE
PIC13 - Storage, Backup & Data Warehousing
Purpose and Context This group of Performance Indicators examines the indicators applicable to storage, backup and data warehousing of digital information
Sources ITIL; CobiT
Section Ref: Stor
Performance Group Description
Storage, Backup and Data Warehousing
Ref No Sub-Group Description
Sub Ref:
Performance Indicator
Primary Source of PI
Link if Known
1 Performance 1.0 1.1 1.2 1.3
Down time Frequency of failure MIPS cpu usage
2 Storage 2.0 2.1 2.2
2.3
Cost per terabyte % used Growth rate and capacity allows the owner to extend capacity
comfortably without exceeding limits. DB access speed is sufficient for operations
Agency CIO,
3 Architecture System Currency & support
3.0 Hardware systems architecture is current and adequately supported for the next lifecycle.
Agency CIO and Independent Consultants
4 S/W System Currency & support
4.0 Software is current and fully supported for the next lifecycle. Agency CIO and Independent Consultants
Performance Indicator Resource Library - Version 1.2 Page 86 of 103
Archive
d

AUSTRALIAN GOVERNMENT INFORMATION MANAGEMENT OFFICE
Section Performance Group Storage, Backup and Data Warehousing Ref: Description Stor
Ref No Sub-Group Sub Performance Primary Source Link if Description Ref: of PI Indicator Known
5 Back up & Disaster Recovery Practices
5.0
5.1
Back up is systematic, automated, regular and frequent, allowing fast recovery with minimal loss of data.
Recovery is fast, systematic, well planned and rehearsed, with minimal system down time.
Agency CIO, Risk Manager and Disaster Recovery Manager
6 UPS 6.0 The system is supported by a UPS system no disruption to service.
Performance Indicator Resource Library - Version 1.2 Page 87 of 103
Archive
d

AUSTRALIAN GOVERNMENT INFORMATION MANAGEMENT OFFICE
PIC14 - e-Government, e-Publishing and Websites
Purpose and Context This group of Performance Indicators examines indicators applicable to various forms of online publishing and transaction processing
Sources Capability Maturity Model; AGIMO Website Guidelines
Section Ref:
e-Gov
Performance Group Description
e-Government, e-Publishing and Website
Ref No Sub-Group Description
Sub Ref:
Performance Indicator
Primary Source of PI
Link if Known
1 E-Government 1.0 1.2 1.2 1.3 1.4 1.5 1.6
% of total contracts using e-Government access % of e-contacts using email % of e-contacts using website Number of website hits % of e-contacts involving information exchange Increase since previous year See E_Govt_Portal
2 E-Government Users 2.0 2.0.1 2.0.2 2.0.3 2.0.4 2.0.5 2.0.6
Indicators: Geographic Demographic Socio-economic Professional Industry Community, educational, cultural, etc.
3 Internet Use Motivators 3.0 3.0.1
Reason why users contact government Convenient time of day, e.g. outside business hours
Performance Indicator Resource Library - Version 1.2 Page 88 of 103
Archive
d

AUSTRALIAN GOVERNMENT INFORMATION MANAGEMENT OFFICE
Section Performance Group e-Government, e-Publishing and Website Ref: Description
e-Gov
Ref No Sub-Group Sub Performance Primary Source Link if Description Ref: of PI Indicator Known
3.0.2 3.0.3 3.0.4 3.0.5 3.0.6 3.0.7 3.0.8 3.0.9
3.0.10
3.0.11 3.0.12
3.1
Short length of contact time Easy process User control of activity Travel avoidance Queue avoidance Instant information download in stead of waintinf for mail Avoid travel cost Avoid telephone cost Can consult spouse or family whilst on line as opposed to taking
everyone to an office Avoid telephone queuing times Avoid telephone ACD-IVRs (Automated Call Distribution –
Interactive Voice Response units) Community Access. See: Community
4 Internet Use Demotivators 4.0 4.1 4.2 4.3 4.4 4.5 4.6 4.7 4.8
Service unavailable online Inadequate online functionality Prefers to speak to a real person Can ask question and expect answers Unaware of online services possibilities Security or confidentiality or privacy concerns Unwilling to risk use of credit card online Lack of computer skills No Internet access / computer facilities
5 Satisfaction 5.0 Use satisfaction
Performance Indicator Resource Library - Version 1.2 Page 89 of 103
Archive
d

AUSTRALIAN GOVERNMENT INFORMATION MANAGEMENT OFFICE
Section Performance Group e-Government, e-Publishing and Website Ref: Description
e-Gov
Ref No Sub-Group Sub Performance Primary Source Link if Description Ref: of PI Indicator Known
6 Web Analytics 6.0 There are many comprehensive texts on Web Analytics that can be found by searching the Internet. One example is Web Analytics Demystified, by E Peterson. The first 68 pages of the s250 book are down loadable as a sample
Peterson General
Web Analytics DemystifiedGeneral Web Analytics
Performance Indicator Resource Library - Version 1.2 Page 90 of 103
Archive
d
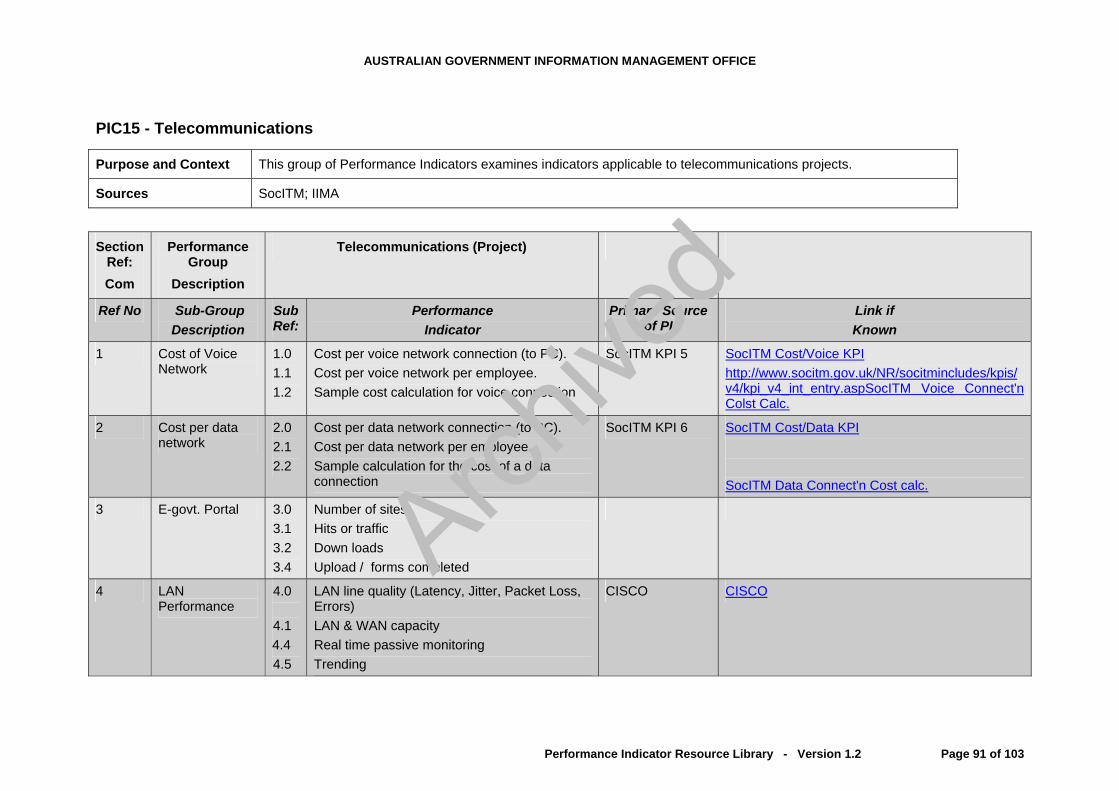
AUSTRALIAN GOVERNMENT INFORMATION MANAGEMENT OFFICE
PIC15 - Telecommunications
Purpose and Context This group of Performance Indicators examines indicators applicable to telecommunications projects.
Sources SocITM; IIMA
Section Ref: Com
Performance Group
Description
Telecommunications (Project)
Ref No Sub-Group Description
Sub Ref:
Performance Indicator
Primary Source of PI
Link if Known
1 Cost of Voice Network
1.0 1.1 1.2
Cost per voice network connection (to PC). Cost per voice network per employee. Sample cost calculation for voice connection
SocITM KPI 5 SocITM Cost/Voice KPIhttp://www.socitm.gov.uk/NR/socitmincludes/kpis/v4/kpi_v4_int_entry.aspSocITM Voice Connect'n Colst Calc.
2 Cost per data network
2.0 2.1 2.2
Cost per data network connection (to PC). Cost per data network per employee. Sample calculation for the cost of a data connection
SocITM KPI 6 SocITM Cost/Data KPI SocITM Data Connect'n Cost calc.
3 E-govt. Portal 3.0 3.1 3.2 3.4
Number of sites Hits or traffic Down loads Upload / forms completed
4 LAN Performance
4.0
4.1 4.4 4.5
LAN line quality (Latency, Jitter, Packet Loss, Errors) LAN & WAN capacity Real time passive monitoring Trending
CISCO CISCO
Performance Indicator Resource Library - Version 1.2 Page 91 of 103
Archive
d

AUSTRALIAN GOVERNMENT INFORMATION MANAGEMENT OFFICE
Section Performance Telecommunications (Project) Ref: Group Com Description
Ref No Sub-Group Sub Performance Primary Source Link if Description Ref: of PI Indicator Known
4.6 Line use against capacity at peak periods
5 Internet 5.0 5.1 5.2 5.3
Bandwidth Speed Down load and up load capacity. % of use over capacity in total and at peak periods.
IIMA IIMA
6 eMail Protected Marking
6.0 Facilitation of Protected Markings for classification status
AGIMO
7 WAN Performance
7.0
7.1 7.2 7.3 7.4 7.5 7.6 7.7 7.8 7.9
WAN line quality (Latency, Jitter, Packet Loss, Errors). Has continual traffic monitoring, analysis and management. Has compression Has bandwidth allocation Bandwidth Capacity Volume Speed % of capacity at peak times Service interruptions
CISCO CISCO
8 Capacity and Expandable Capacity
8.0 Potential to take up additional services such as VoIP.
Performance Indicator Resource Library - Version 1.2 Page 92 of 103
Archive
d

AUSTRALIAN GOVERNMENT INFORMATION MANAGEMENT OFFICE
Section Performance Telecommunications (Project) Ref: Group Com Description
Ref No Sub-Group Sub Performance Primary Source Link if Description Ref: of PI Indicator Known
9 Advanced Technologies & Methodologies
9.0 9.1 9.2 9.3 9.4 9.5 9.6 9.7
Protective e-mail classification system. VoIP 3G Blackberry FedLink Level Encryption Distributed / Grid computing Firewalls separate from routers and servers.
Performance Indicator Resource Library - Version 1.2 Page 93 of 103
Archive
d

AUSTRALIAN GOVERNMENT INFORMATION MANAGEMENT OFFICE
PIC16 - Security
Purpose and Context This group of Performance Indicators examines the indicators applicable to ICT security
Sources ITGI; ISO/IEC 17799; AS/NZS 4360; ACSI 33; PSM; ISACA
Section Ref: Sec
Performance Group Description
Security
Ref No Sub-Group Description
Sub Ref:
Performance Indicator
Primary Source of PI
Link if Known
1 Compliance 1.0 DSD Reporting mechanism. ITGI www.ITGI.orgISACA.org
2 Security Resource commitment
2.0 2.1
Management risk awareness and commitment. Adequate funding, training and staffing.
ITGI www.ITGI.orgISACA.org
3 Security Management 3.0 3.1 3.2 3.3 3.4 3.5 3.6
Management awareness of assets, value and risks. Policies Procedures Practice Guide SWOT Analysis led system development. Audit Strategies, Plans, Procedures and Practices. Regular Review, Report and Act.
ITGI www.ITGI.orgISACA.org
4 Risk Management 4.0 4.1 4.2 4.3 4.4
Risk and performance benchmarking. Probabilistic risk analysis and valuation. Business Impact Analysis (BIA) Risk tolerance determination. Review & appropriate action all auditor opportunities to improve
recommendations.
ITGI SAI - AS/NZS 4360:1999 Audit Reports
www.ITGI.orgISACA.org
Performance Indicator Resource Library - Version 1.2 Page 94 of 103
Archive
d
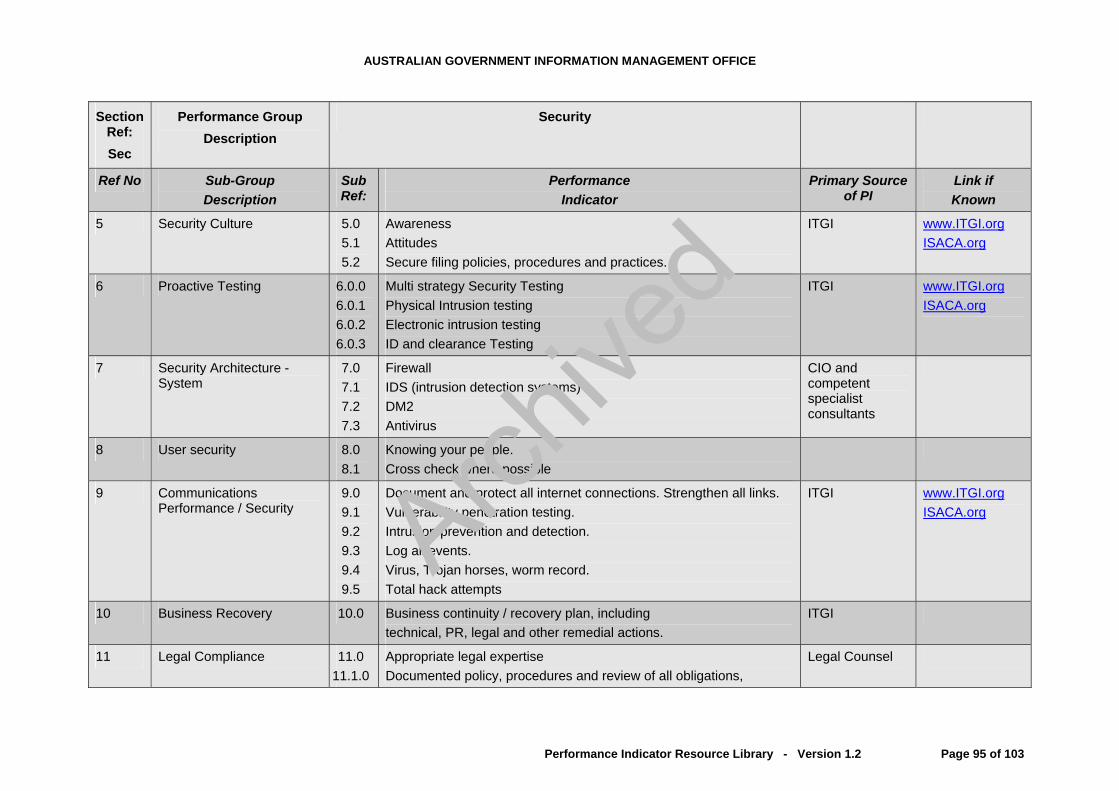
AUSTRALIAN GOVERNMENT INFORMATION MANAGEMENT OFFICE
Section Performance Group Security Ref: Description Sec
Ref No Sub-Group Sub Performance Primary Source Link if Description Ref: of PI Indicator Known
5 Security Culture 5.0 5.1 5.2
Awareness Attitudes Secure filing policies, procedures and practices.
ITGI www.ITGI.orgISACA.org
6 Proactive Testing 6.0.0 6.0.1 6.0.2 6.0.3
Multi strategy Security Testing Physical Intrusion testing Electronic intrusion testing ID and clearance Testing
ITGI www.ITGI.orgISACA.org
7 Security Architecture - System
7.0 7.1 7.2 7.3
Firewall IDS (intrusion detection systems) DM2 Antivirus
CIO and competent specialist consultants
8 User security 8.0 8.1
Knowing your people. Cross check where possible
9 Communications Performance / Security
9.0 9.1 9.2 9.3 9.4 9.5
Document and protect all internet connections. Strengthen all links. Vulnerability penetration testing. Intrusion prevention and detection. Log all events. Virus, Trojan horses, worm record. Total hack attempts
ITGI www.ITGI.orgISACA.org
10 Business Recovery 10.0 Business continuity / recovery plan, including technical, PR, legal and other remedial actions.
ITGI
11 Legal Compliance 11.0 11.1.0
Appropriate legal expertise Documented policy, procedures and review of all obligations,
Legal Counsel
Performance Indicator Resource Library - Version 1.2 Page 95 of 103
Archive
d

AUSTRALIAN GOVERNMENT INFORMATION MANAGEMENT OFFICE
Section Performance Group Security Ref: Description Sec
Ref No Sub-Group Sub Performance Primary Source Link if Description Ref: of PI Indicator Known
11.1.1 11.1.2 11.1.3 11.1.4 11.1.5 11.1.6 11.1.7 11.1.8
including: Companies legislation Contracts, insurance, Workers Compensation and Industrial, HR, superannuation, etc. Employment legislation Privacy legislation Accounting process & records Managerial process and records
12 HR Plan 12.0 See the Stakeholder section. Management & HRM
Stakeholders
13 Staff Security Plan 13.0 See the Stakeholder section Management, HRM & Security
Stakeholders
14 Staff Succession Plan 14.0 See the Stakeholder section. Management, Stakeholders
15 Information Security 15.0 Continual on site and/or off site backup CIO
16 Emergency Security Plan 16.0
Fire and emergency protection of facility, occupants, data and equipment.
Emergency and Fire Consultant
17 Security Quality Management
17.0 Regular security assessment SAI & ISO 9000
SAI GlobalISO 9000
18 eMail Protected Marking 18.0 Facilitation of Protected Markings for classification status AGIMO
Performance Indicator Resource Library - Version 1.2 Page 96 of 103
Archive
d