performance improvement of a dry mode natural gas fired
TRANSCRIPT

Applied Engineering 2018; 2(2): 39-53
http://www.sciencepublishinggroup.com/j/ae
doi: 10.11648/j.ae.20180202.13
Performance Improvement of a Dry Mode Natural Gas Fired Turbine Plant for Combined Cycle Operation
Anthony Kpegele Le-ol1, *
, Duabari Silas Aziaka2
1Department of Mechanical Engineering, Rivers State University, Port Harcourt, Nigeria 2Center for Power and Propulsion, Cranfield University, Bedfordshire, United Kingdom
Email address:
*Corresponding author
To cite this article: Anthony Kpegele Le-ol, Duabari Silas Aziaka. Performance Improvement of a Dry Mode Natural Gas Fired Turbine Plant for Combined
Cycle Operation. Applied Engineering. Vol. 2, No. 2, 2018, pp. 39-53. doi: 10.11648/j.ae.20180202.13
Received: September 17, 2018; Accepted: November 5, 2018; Published: December 3, 2018
Abstract: This research considers the design of combined cycle (CC) operation for a dry mode natural gas fired turbine
plant in southern Nigeria. It entails evaluation and utilization of the amount of waste heat energy exhausted by the Omoku gas
turbine (GT) power plant by integrating a steam Rankine cycle retrofitted with a heat recovery steam generator (HRSG) for CC
operation, with the focus to improving its performance and reducing waste heat intensity to the environment. Gathered data
from the human machine interface (HMI) and log sheets were used for the analysis. Thermodynamic sensitivity analysis was
implemented for the combined cycle system (CCS) using a developed model in the MATLAB platform. The outcome of
energy balance of the HRSG having a heat load of 38.49 MW showed that for every kg of exhaust gas, 0.1164 kg of steam is
generated at an optimum pressure of 40 bar and mass flow of 14.45 kg, with acceptable steam turbine exhaust moisture content
of 10%. These revealed a quantified amount of 45.28 MW heat energy contained in the usually wasted exhaust gas of the dry
mode GT which was thus recovered in the HRSG, producing additional 16.32 MW as the steam turbine (ST) power output
with a feed pump heat load of 0.06 MW and a condenser heat load of 28.96 MW. Further analysis in terms of power outputs,
energy efficiencies, and environmental impacts showed that the CCS achieved 41.32 MW, 49.26% and HRSG stack
temperature of 170.25oC compared to the previously 25 MW, 26.60% and exhaust gas temperature (EGT) of 487°C
respectively of the dry mode GT. These indicate that the CCS generates about 65.30% boost in the net power output, 85.20%
improvement in overall efficiency and 65.10% reduction in waste heat intensity to the environment when compared with the
dry mode GT operating in isolation. Thus, the work showed that for the design of a CCS with a single pressure level HRSG
without supplementary firing, a recommended range for the power output of the steam bottoming plant falls within 34 – 40%
of the total power output of the CCS while that of the gas topping plant falls within the range of 60 – 66% of the total power
output of the CCS. This study therefore confirms the viability as well as demonstrates the application, of the combined cycle
concept for the Omoku gas turbine and recommends for further research, the introduction of a multiple pressure level HRSG
with supplementary firing to the combined cycle system for an improved efficiency and output.
Keywords: Dry Mode Gas Turbine, Combined Cycle System, Heat Recovery Steam Generator, Waste Heat Intensity,
Heat Load, Power Output
1. Introduction
1.1. Background of the Study
Combined cycle (CC) operation is one of the most
efficient alternative ways to exploit the available heat energy
in the wasted exhaust gas of a dry mode gas turbine (GT) for
performance enhancement. The dry mode gas turbine is a
conventional device for converting thermal energy through
mechanical energy to electrical power [1]. Gas turbines are
generally, widely used for producing electricity and various
other industrial activities. They can be used in stationary
power plants as the topping cycle to generate electricity as
stand-alone units or in conjunction with steam turbine as the
bottoming power plant either as cogeneration or combined
cycle gas turbine where the exhaust gas serves as a heat
source for the steam [2]. A simple gas turbine discards most
of the added heat into the atmosphere with temperatures in

Applied Engineering 2018; 2(2): 39-53 40
the range of 430 to 590°C. These temperatures are higher
than the operating temperatures in the steam cycle and some
of the wasted energy could be recovered in a Heat Recovery
Steam Generator (HRSG) [3]. It is observed that considerable
amount of heat energy goes as a waste with the exhaust gas
of an open cycle gas turbine accompanied with disastrous
emission to the environment which has been a great concern
due to their impact on human health, nature and materials.
Thus, energy conversion and supply are a key driver of the
many negative environmental trends in the world today as the
burning of fossil fuels generates CO2 and other greenhouse
gases that are responsible for global warming which results
to climatic change and thermal pollution [4].
Lebele-Alawa and Le-ol [5] in their work; noted that a
combined cycle power plant (CCPP) is a power plant where
electricity production is done from the combination of both
gas and steam turbines. The gas turbine called topping cycle
burns fuel and operates at high average temperatures, a
second cycle called bottoming cycle utilizes the exhaust
energy from the gas turbine, which also is quite high, to
produce steam. The topping and bottoming cycles is coupled
with a waste heat recovery steam generator that transfers heat
[6]. Thus, the CCPP is a system in which a gas topping plant
operating on Brayton cycle at a higher temperature to
generate electricity is coupled through the HRSG to a steam
bottoming plant operating on Rankine cycle at a reduced
temperature generating additional electric power. By this
combination, the average temperature of the rejected heat is
reduced when compared with that of the gas turbine
operating in isolation and the average temperature of heat
addition increases above that of a single steam turbine
operating alone [7]. Thus, the overall thermal efficiency of
the combined cycle is higher compared to the individual
efficiencies of the gas or steam turbine cycles operating
separately. This higher efficiency results from the utilization
of the same fuel to provide heat and electricity, thereby
reducing fuel consumption and compensating fuel cost which
in turn reduce emission levels as less fuel is fired per unit
power produced [8]. Lars & Bolland [9] observed in their
work that the addition of a steam bottoming cycle to the gas
turbine topping cycle, making it a combined cycle is one
alternative to increasing the efficiency of the power plant,
and thereby decreasing the CO2 tax per generated MW. This
is in line with the analysis of Lebele-Alawa and Le-ol [5] as
it was observed that retrofitting a steam bottoming plant to a
25 MW gas turbine enhanced performance with about 51%
boost in the net power output and 84% improvement in the
overall efficiency.
Polyzakis et al., [10] performed the optimization of a
combined cycle power plant describing and comparing four
different gas turbine cycles: simple cycle, intercooled cycle,
reheated cycle and intercooled and reheated cycle. The
results showed that the reheated gas turbine is the most
desirable over all mainly because of its high turbine exhaust
gas temperature and resulting high thermal efficiency of the
bottoming steam cycle. The optimal gas turbine led to a more
efficient combined cycle power plant (CCPP), and results to
great savings. Tiwari et al., [11] in their work on ‘’the effect
of operating parameters on combined cycle performance’’
observed that the CCPP achieved efficient, reliable and
economic power generation. They further stated that the
major operating parameters which influence the combined
cycle are; turbine inlet temperature, compressor pressure
ratio, pinch point, ambient temperature and pressure levels.
Again, the work of Ravi et al., [12] and Murad et al., [13]
discussed the effect of various parameters like pinch point,
approach point, steam pressure, steam temperature, gas flow
rate on the performance of the (HRSG). Ahmed [14] noted
that the mass flow rate of steam and steam temperature in a
combined cycle system depends on the amount of heat
available in the gas turbine exhaust. Thamir & Rahman [15]
did a parametric thermodynamic analysis of a combined
cycle investigating the effect of operating parameters on the
overall plant performance. The simulation results showed
that the overall efficiency increases with the increase of the
peak compression ratio. The overall thermal efficiencies for
CCPP are higher compared to that of the gas-turbine plants.
This work therefore considers the evaluation and
utilization of the amount of waste heat energy exhausted by
Omoku simple cycle Gas turbine (dry mode gas turbine) for
CC operation. The focus is to improve performance and
reduce waste heat intensity to the environment. It entails
integrating a steam rankine cycle retrofitted with a heat
recovery steam generator (HRSG) to the existing dry mode
GT making it a combined thermal power plant (CTPP). The
outcome of the study will be the design of efficient and cost-
effective energy system within the specification of
environmental conditions.
1.2. Experimental Engine Description (Omoku Gas Turbine
Power Plant)
The experimental engine used for this research is the
Omoku Gas Turbine power plant, located at Onelga, the
Northern part of Rivers State, Southern coastal area of
Nigeria. The location geographic coordinates in World
Geodetic System (WGS 84) lies on Longitude: 6°39′24″ E
and Latitude: 5°20′37″ N at 18m (59 ft) elevation above sea
level, experiencing an equatorial temperature of 24°C,
relative humidity of 97% and South-West wind at 2 km/h.
The ENGINE model is a MS5001PA. It is a 25 MW
capacity dry mode MS 5001 (GE Frame 5), single shaft
generator drive industrial gas turbine with seventeen stages
of axial compressor and a two stages axial turbine with
constant mean diameter annular configuration, operating with
a combustor exit temperature of 1232 K, overall pressure
ratio of 10, mass flow of 122.9 kg/s, 5202 rpm maximum
shaft output speed, at ISO conditions with generator coupled
at the cold end drive and exhaust gas temperature of 487°C
[16].
The Omoku gas turbine power plant is an open cycle (dry
mode) gas turbine and thus, operates on the principles of
Brayton cycle. It consists of a compressor, a combustion
chamber and a gas turbine driving a generator to produce
electricity. Instead of flaring the hot exhaust gas from this

41 Anthony Kpegele Le-ol and Duabari Silas Aziaka: Performance Improvement of a Dry Mode Natural
Gas Fired Turbine Plant for Combined Cycle Operation
Brayton cycle plant, this heat was utilized by incorporating a
heat recovery steam generator (HRSG) to generate
superheated steam to drive a retrofitted steam turbine,
making it a combined cycle system (CCS) thus producing
additional power output resulting in an improved efficiency
and power output. These reasons prompted the need in this
research for the performance improvement of the Omoku gas
turbine power plant for combined cycle operation. Figure 1
shows the gas turbine package flow diagram, figure 2 shows
the HMI schematic diagram and figure 3 is a pictorial view,
all of the Omoku gas turbine.
Figure 1. Major Sections of the MS5001 Gas Turbine (Omoku Gas Turbine)
Assembly [16].
Figure 2. HMI Schematic Diagram of Omoku Gas Turbine Operation.
Source: Omoku Gas Turbine Manufacturer’s Manual Source: Omoku Gas
Turbine Plant Control Room
2. Materials and Methods
2.1. Data Collection and Modeling Software
The materials required for the research were technical data
from the Omoku Gas turbine power plant collected through
direct observation from the monitoring screen of the human
machine interface (HMI) as well as log sheets and
manufacturer’s manuals. The parameters monitored included
inlet and exit temperatures and pressures of the components,
and air and exhaust gas flow rates. Other parameters which
cannot be directly measured were calculated, using standard
thermodynamic relations. To analyze the proposed CCPP,
there was a need to know the amount of exhaust gases and
temperature required to generate certain amount of steam.
These were achieved by carrying out heat balance on the
HRSG applying pinch technology and iterating the live steam
pressure at different conditions from 100 to 3 Bar. Using
standard thermodynamic equations implemented with
MATLAB software (MathWorks, USA), the appropriate
parameters of the various components of the steam turbine
power plant were determined and thus the net power output
and overall efficiency of the combined cycle plant.
Figure 3. Pictorial View of Omoku Gas Turbine Power Plant.
2.2. System Modeling of the Proposed Combined Cycle
System
A combined gas and steam cycle system is proposed for
the effective utilization of the waste flue gas liberated by the
Omoku GT. The proposed retrofitted combined-cycle system
unit consists of the Brayton cycle (the dry mode Omoku gas
turbine) and a Rankine cycle (the retrofitted steam turbine)
incorporated by a HRSG comprising of an economizer,
evaporator, and superheated. Figure 4 shows the schematic
diagram of the retrofitted combined cycle system.

Applied Engineering 2018; 2(2): 39-53 42
Figure 4. Schematic Diagram of the Retrofitted Combined Cycle System.
Figure 5. Temperature Entropy Diagram of the Retrofitted Combined Cycle.
The temperature-entropy diagram analyzing the degree of
randomness at every stage in the combined cycle is shown in
Figure 5. The heat from the exhaust of the gas-topping cycle
is used to generate superheated steam for the steam-
bottoming cycle which thus provides additional electricity.
The different thermodynamic processes occurring in the
system are:
Processes a→ b → c → d ≡ Omoku Gas turbine Cycle
(GTC)
Processes 1 → 2 → 3 → 4 → 1 ≡ Retrofitted Steam
Turbine Cycle (RSTC)
Processes 4 → 5→ 6 → 1 ≡ Heat Recovery Steam
Generator (HRSG)
Process d → e ≡ heat transfer from exhaust gas of gas
topping cycle to the HRSG of the steam bottoming cycle
2.2.1. Gas Topping Cycle (Dry Mode Omoku Gas Turbine)
The Brayton configuration is utilized in the Omoku gas
turbine power plant. This is represented by the Cycle ≡ a→ b

43 Anthony Kpegele Le-ol and Duabari Silas Aziaka: Performance Improvement of a Dry Mode Natural
Gas Fired Turbine Plant for Combined Cycle Operation
→ c → d on T – S diagram of the proposed Retroffited
Combined Cycle System in figure 5. The schematic diagram
indicating the isentropic processes of the GTC is shown in
Figure 6.
Table 1 displays the necessary data required for the
performance analysis of the power plant which equally
served as the input data for the design/conversion to a
combined cycle.
Table 1. Omoku Gas Turbine Plant Main Characteristics (Average Input Data for CCS).
Component Parameter Symbol Unit Value
Inlet temperature �� � 30.4
Turbo compressor Outlet temperature �� � 367
Inlet pressure �� bar 1.013
Outlet pressure �� bar 10
Mass flow rate (Air) �� � /� 122.9
Combustion chamber Fuel consumption (flow rate) �� /� 1.2
Inlet temperature �� � 959
Turbine Outlet temperature �� � 487
Exhaust gas flow (flow rate of gas) �� �� /� 124.1
Other data Thermal efficiency ����� % 26.6
GT Power output ��� �� 25
Figure 6. Omoku Gas Turbine Cycle on T-S Diagram Showing Isentropic Process.
The energy balance of the brayton cycle is modeled as follows:
The air at ambient temperature enters the compressor at point a, exits the compressor at a temperature �� calculated with:
����� � � �!
"#� "$ (1)
Where �� &'(�� are the entry and exit air temperatures of the compressor;��&'(�� are the air pressures before and after
compression process while ) is the specific heat ratio.
Applying steady flow, the model energy equations yield
Heat supplied *�� � �� ��+,-�.�/ 0 ��12 (2)
Heat rejected: *�� � �� ��+,-�.�31 0 ��2 (3)
Where �� �� � 456&7�8&�9:;<, +,-� � =>?+@9@+6?&8&8+;'�8&'8�A?��7A?;9?56&7�8&�.BC�2&84D�
Compressor Power:�/ � �� �+,�.��1 0 ��2 (4)Where +,� = specific heat at constant pressure of air at compressor outlet tem
p.
Turbine Power: �� � �� ��+,-�.�/ 0 �312 (5)
Gas Turbine Power Output: �EF� ��� 0 �G (6)

Applied Engineering 2018; 2(2): 39-53 44
Gas Turbine Cycle Thermal Efficiency: ����� �E�� HI�JKL�,L�M���NL,,OP�3 � QR�S�1
(7)
Turbine Isentropic Efficiency: �PT�� ��U#�V1�U#�V
� W/�L�OXHJYZT�[�JH,P/XHJY (8)
2.2.2. Heat Recovery Steam Generator (HRSG)
The HRSG consists of three heat exchanger sections
namely the economizer, the evaporator, and the superheated
[7].
Figures 7 & 8 show typical schematics of a Single Pressure
HRSG system and the temperature-heat diagram of a single-
pressure level respectively, for a combined cycle.
Figure 7. Typical schematic of a Single Pressure HRSG system.
Figure 8. Temperature Heat diagram for a Single Pressure HRSG thermodynamic Model.
The temperature of the steam increases from point 4 to 1
where process 4 – 5 represents the economizer; process 5 – 6
represents the evaporator, and process 6 – 1 is the
superheater. The exhaust gas is cooled from point Td of the
gas turbine to a temperature of Te well above its acid dew
point temperature.
Two important design parameters of a HRSG are the
Approach temperature difference denoted as ∆�� and the

45 Anthony Kpegele Le-ol and Duabari Silas Aziaka: Performance Improvement of a Dry Mode Natural
Gas Fired Turbine Plant for Combined Cycle Operation
Pinch-point temperature difference denoted as ∆�,..
For a pinch-point temperature difference of ∆�,, the pinch-
point on the gas side is;
�] = �̂ + ∆�, (9)
Similarly, the economizer outlet temperature can be
evaluated using
�/ = �̂ +∆�� (10)
The HRSG ratings were determined employing heat
balance formulations from the GT exhaust to the HRSG, as
given by the simultaneous equations:
�� ��+,��.ℎ� − ℎ�2 = �� ��+,��.�3 − ��2 (11)
�� T.ℎ^ − ℎ�2 = �� ��+,��.�] − ��2 (12)
�� =�̀ .�1#�a2#�V.�b#�a2
�1#�b (13)
Where;
�� T = Mass flow rate of steam in kg/s
�� ��= Mass flow rate of exhaust gas in kg/s
�� = HRSG stack temperature (Exhaust gas cooling
temperature)
�] = Pinch point exhaust gas temperature
�3= Gas turbine outlet (exhaust) temperature
+,��= Specific heat of exhaust gas
2.2.3. Rankine Cycle (Retrofitted Steam Turbine)
The retrofitted Steam turbine to the dry mode Omoku gas
turbine operates on the principles of the Rankine cycle. This
is represented by the cycle, 1 → 2 → 3 → 4 → 1 on figure 5.
Neglecting changes in kinetic energy (K. E) and potential
energy (P. E), application of the steady flow energy equation
to the processes reduces to:
* −� =�� TΔℎ (14)
Hence;
Heat supplied in the boiler,*�� =�� T.ℎ� − ℎ�2 (15)
Heat rejected in the condenser *�� =�� T.ℎ� − ℎ�2 (16)
Turbine Power �N� =�� T.ℎ� − ℎ�2 (17)
Pump work �, =�� T.ℎ� − ℎ�2 (18)
Steam Turbine net power output �EF�d� =�N� − � (19)
Steam Turbine Cycle efficiency�N� = QR�d�
S�e=
.�1#�e2#.�a#�f2
.�1#�a2 (20)
Note:ℎ� = ℎ� + g .�� − ��2 (21)
2.2.4. Condenser Cooling Water System
For the purpose of this design, the inlet temperature
difference was taken as 16oC and the pinch point of 10
oC was
taken as the exit temperature difference resulting to a cooling
water temperature rise of 6°C is chosen.
The rate of heat transfer from condensing vapour to the
cooling water was determined using equation
*�� =�� T.ℎ� − ℎ�2 (22)
Where *�� = Heat rejected in the condenser known as the
Condenser Heat Load.
For energy balance between the condenser and the cooling
water system,
�� I+,I.8HL� − 8P[2 = �� T.ℎ� − ℎ�2 = *�� (23)
�� I =S�h
/ij.�klm#�no2 (24)
Where �� T= Mass flow rate of steam in kg/s
�� I =Mass flow rate of cooling water
+,I =Specific heat of water
8P[ =Temperature of cooling water into condenser
8HL� =Temperature of cooling water out of the condenser
The condenser Thermal Ratio
�N� =W/�L�O��p,.JPT�H /HHOP[�I���J
r�]PpLp��p,.JPT�H /HHOP[�I���J=
�klm#�no
�e#�no (25)
Where ��= condenser saturated temperature
Specific Steam Consumption =. =. B =�
Io-m (26)
Where <[��= net work output.
2.2.5. Combined Gas and Steam Cycle Analytical Model
To design the combined gas and steam cycle, there is need
to know the amount of exhaust gases and temperature
required to generate certain amount of steam so as to be able
to calculate the overall thermal efficiency of the combined
cycle. These were achieved by carrying out heat balance on
the HRSG (heat exchanger).
Treating the HRSG as an adiabatic heat exchanger, the
steady flow energy equation becomes:
Energy entering HRSG = Energy leaving HRSG
�� ��+,���3 +�� Tℎ� = �� ��+,���� +�� Tℎ� (27)
Hence,�� T =p� -�/i-�.�V#�-2
�1#�a (28)
Heat rejected by exhaust gas: *��� = �� ��+,��.�3 − ��2 (29)
The HRSG Thermal Ratio �MsNt =Suvdw
S-� (30)
Hence, HRSG Capacity *MsNt = �MsNt*��� (31)
The combined-cycle overall efficiency and power output
are given by:
�GG =�N� + ��� − �N���� (32)
�GG =�N� + ��� (33)
Where �GG &'(�GG are combined cycle overall efficiency
and power output respectively.

Applied Engineering 2018; 2(2): 39-53 46
�N� � Steam turbine power output, ��� = gas turbine
power output
�N� = Steam turbine thermal efficiency
��� = Gas turbine thermal efficiency
2.3. Design Considerations for the Proposed Combined
Cycle
The designing process of the HRSG and steam turbine was
initiated by using the exhaust gas temperature of the GT as
the HRSG inlet temperature and assuming values for: the
steam turbine inlet temperature (a superheated temperature
below the gas turbine EGT), the condenser pressure, and the
pinch point and approach temperature while the steam
turbine inlet pressures were iterated at different conditions.
Whereas thermal ratio of heat exchanger (HRSG) falls
within the range of 75 – 85%, and for which 85% was chosen
for this design, the typical steam turbine outlet pressure in
condensing mode (condenser pressure) ranges from 0.03 to
0.25 bar [17, 18] and an average value of 0.1 bar was used in
this work.
To effectively harness heat from the HRSG so as to have a
higher combined cycle thermal efficiency, the stack
temperature should be greatly reduced however, above the
acid dew point of the flue gas to avoid condensation. Acid
dew point of exhaust gas ranges within the values of 104°C -
160°C [19], while pinch point is usually between 8°C and
15°C and approach temperature is in the range 8°C - 12°C
[3]. Hence, the combined cycle system was designed for an
exhaust gas cooling temperature (HRSG stack temperature)
above 160°C chosen as the design point to avoid
condensation of the exhaust gas at its acid dew point while a
pinch point and approach temperatures of 10°C was used in
order to minimize heat loss between the exhaust gas and the
steam, and at the same time ensure heat transfer for
maximum power output, considering a single pressure level
HRSG without supplementary firing. The inlet temperature
difference between the condenser and the cooling water was
taken as 16°C and a pinch point of 10°C was taken as the exit
temperature difference resulting to a cooling water
temperature rise of 6°C as chosen.
3. Combined Cycle System Analysis /
Results
The results from the application of heat balance on the
HRSG utilizing pinch technology and iterating the live steam
pressure at twelve different conditions from 100 to 3 bar,
using standard thermodynamic equations implemented with
MATLAB software is tabulated in Table 2, from which the
design specifications for the proposed combined cycle
system is stipulated in Table 3.
Table 2. Results of Combined Cycle Analysis Extracted from MATLAB Model.
Moisture
Content (%) xyz{|}~ �� z℃~ �� �� z��~ ����� z��~ �� z��~ �� � z��/�~ xx z��~ x�� z��~ x����� z��~
22 100.00 211.78 39.35 33.44 5.91 12.95 0.13 15.66 15.53
20 90.00 206.53 40.10 34.08 6.02 13.13 0.12 15.79 15.67
18 80.00 201.01 40.89 34.75 6.14 13.31 0.11 15.94 15.83
16 70.00 194.71 41.79 35.52 6.27 13.53 0.10 16.05 15.96
14 60.00 187.55 42.81 36.39 6.42 13.80 0.08 16.20 16.11
12 50.00 179.43 43.97 37.38 6.59 14.10 0.07 16.29 16.21
10 40.00 170.25 45.28 38.49 6.79 14.45 0.06 16.38 16.32
8 30.00 159.12 46.88 39.84 7.04 14.89 0.05 16.36 16.31
6 20.00 145.12 48.88 41.55 7.33 15.45 0.03 16.20 16.17
4 10.00 124.94 51.76 44.00 7.76 16.29 0.02 15.57 15.56
2 5.00 108.63 54.09 45.98 8.11 16.99 0.01 14.57 14.56
0 3.00 98.58 55.53 47.20 8.33 17.41 0.01 13.71 13.70
Table 2. Continue.
Moisture
Content (%) ���z%~ ��� z��/�~ �� �z��~ �� �z��/�~ ����� z%~
x�����
z��~ ��� z%~ x�� z��~ ��� z%~
22 46.44 8.34 23.82 949.35 37.5 25 26.6 40.53 60.69
20 45.98 8.38 24.43 973.67 37.5 25 26.6 40.67 60.35
18 41.55 8.41 25.05 998.74 37.5 25 26.6 40.83 56.98
16 37.92 8.48 25.83 1029.7 37.5 25 26.6 40.96 54.37
14 35.28 8.56 26.7 1064.2 37.5 25 26.6 41.11 52.1
12 33.39 8.69 27.75 1106.3 37.5 25 26.6 41.22 50.45
10 31.4 8.85 28.96 1154.6 37.5 25 26.6 41.32 49.26
8 29.45 9.13 30.56 1218.2 37.5 25 26.6 41.31 47.91
6 28.03 9.56 32.71 1304 37.5 25 26.6 41.17 45.16
4 26.96 10 36.21 1443.2 37.5 25 26.6 40.56 43.55
2 24.66 12 39.53 1576 37.5 25 26.6 39.56 41.84
0 20.03 13 41.83 1667.4 37.5 25 26.6 38.7 36.91

47 Anthony Kpegele Le-ol and Duabari Silas Aziaka: Performance Improvement of a Dry Mode Natural
Gas Fired Turbine Plant for Combined Cycle Operation
Table 3. Specifications for the Proposed Combined Cycle.
HRSG Steam Turbine
(1) Stack temperature,�� � 170.25�
(2) Saturation temperature in Evaporator �̂ � 250.3�
(3) Pinch point temperature difference ∆�,,� 10�
(4) HRSG Heat Load *MsNt � 38.49��
(5) HRSG Thermal Ratio �MsNt � 0.85
(6) Heat rejected by exhaust gas:*��� � 45.28��
(7) Heat loss ¥¦ � 6.79��
(1) Inlet temperature �� � 450�
(2) Steam saturation pressure �� � 40¨&A
(3) Isentropic efficiency �PT � 89.06%
(4) Thermal efficiency ��� � 31.40%
(5) Power output �N� � 16.38��
(6) Mass flow rate �� T � 14.45/� (7) Specific steam consumption
=. =. B � 8.85/�6
(8) Steam outlet pressure (condenser pressure) �� � 0.1¨&A
(9) Steam outlet temperature (condenser temperature) �� �� 45.8�
(10) Condenser Heat Load *�� � 28.96��
(11) Feed pump Load � � 0.06��
Steam Turbine Generator
(1) Power output �E��d� � 16.32��
(2) Thermal efficiency ���[ � 31.40%
Condenser Cooling Water Parameters
(1) Inlet temperature 8P[ � 29.8�
(2) Outlet temperature 8HL� � 35.8�
(3) Mass flow rate �� I � 1154.6/�
(4) Condenser Thermal Ratio �/H[3 � 0.375
Combined Cycle Analysis
(1) Overall power output �GG � 41.32��
(2) Overall efficiency �GG � 49.26%
4. Discussion
The following discussions were deduced from the analysis based on result:
Figure 9. Effect of Steam Saturation Pressure on ST Power Output.
Figure 10. Effect of Live-Steam Pressure on Live-Steam Mass Flow.
the analysis based on result:
Figure 11. Effect of Live-Steam Pressure on HRSG Stack Temperature.

Applied Engineering 2018; 2(2): 39-53 48
Figure 12. HRSG Stack Temperature Vs Live-Steam Mass Flow.
Figure 13. Effect of HRSG Stack Temperature CCPP Net Power Output.
Figure 14. HRSG Stack Temperature Vs HRSG Heat Load.
Figure 9 shows that as the steam saturation pressure
decreases, the steam turbine power output increases and
converge at a maximum of 16.32 MW corresponding to a
steam saturation pressure of 40 bar after which it started
declining.
Figure 10 shows the effect of live steam pressure on the
live-steam mass flow rate, indicating that the live steam mass
flow increases with a decreasing live steam pressure. The
results show that to generate more steam, the live steam
pressure should be reduced.
Figure 11 illustrates the effect of live steam pressure on
HRSG stack temperature. It shows that at lower live steam
pressure, there is a lower HRSG stack temperature indicating
that exhaust gas is well utilized. However, the HRSG stack
temperature should not be reduced below the acid dew point
of the flue gas which is about 160°C maximum. Hence,
HSRG stack temperature of 170.25°C was chosen,
corresponding to 40 bar.
Figure 12 shows the influence of the HRSG stack
temperature on live steam mass flow. It shows an increase in
live steam mass flow for every decrease in HRSG stack
temperature. To increase steam production, the HRSG stack
temperature should be cooled as much as possible but not
below 160°C being the acid dew point of the flue gas, which
may condense and corrode the components. In this analysis,
the HRSG stack temperature of 170.25°C corresponds to a
live steam mass flow of 14.45 kg/s was chosen.
Figure 13 shows that as the HRSG stack temperature
decreases, the CCPP net power output increases. This
indicates that much heat will be extracted as HRSG stack
temperature reduces leading to increased steam production
which will result to increase in steam turbine power output.
The resultant effect of these is the increase in the CCPP net
power output.
Figure 14 shows that as the HRSG stack temperature reduce,
the HRSG heat load increases. This implies that, to effectively
harness heat from the HRSG, the stack temperature should be
greatly reduced. This in turn increases the live steam mass
flow resulting to a larger HRSG heat load.
Figure 15 shows that for every increase in the live steam
mass flow, there is a corresponding increase in the steam
turbine power output. This is because an increase in mass
flow results to an increased HRSG capacity (input) leading to
an increased output in the steam turbine. Again, since the
steam turbine output is a product of mass flow and enthalpy
change, any positive change in mass flow will bring about a
positive change in the steam turbine output.
Figure 15. Effect of Live-Steam Mass Flow on Steam Turbine.
Figure 16. Effect of Live-Steam Pressure on Overall Efficiency.
49 Anthony Kpegele Le-ol and Duabari Silas Aziaka: Performance Improvement of a Dry Mode Natural
Gas Fired Turbine Plant for Combined Cycle Operation
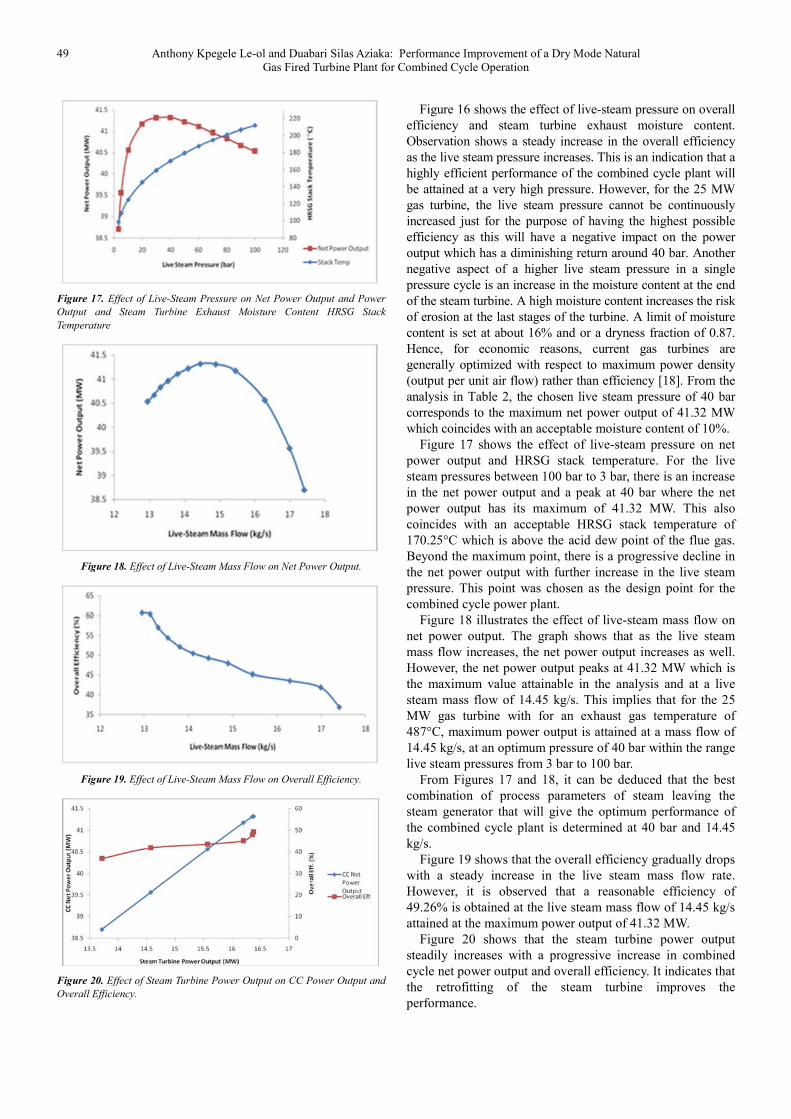
Figure 17. Effect of Live-Steam Pressure on Net Power Output and Power
Output and Steam Turbine Exhaust Moisture Content HRSG Stack
Temperature
Figure 18. Effect of Live-Steam Mass Flow on Net Power Output.
Figure 19. Effect of Live-Steam Mass Flow on Overall Efficiency.
Figure 20. Effect of Steam Turbine Power Output on CC Power Output and
Overall Efficiency.
Figure 16 shows the effect of live-steam pressure on overall
efficiency and steam turbine exhaust moisture content.
Observation shows a steady increase in the overall efficiency
as the live steam pressure increases. This is an indication that a
highly efficient performance of the combined cycle plant will
be attained at a very high pressure. However, for the 25 MW
gas turbine, the live steam pressure cannot be continuously
increased just for the purpose of having the highest possible
efficiency as this will have a negative impact on the power
output which has a diminishing return around 40 bar. Another
negative aspect of a higher live steam pressure in a single
pressure cycle is an increase in the moisture content at the end
of the steam turbine. A high moisture content increases the risk
of erosion at the last stages of the turbine. A limit of moisture
content is set at about 16% and or a dryness fraction of 0.87.
Hence, for economic reasons, current gas turbines are
generally optimized with respect to maximum power density
(output per unit air flow) rather than efficiency [18]. From the
analysis in Table 2, the chosen live steam pressure of 40 bar
corresponds to the maximum net power output of 41.32 MW
which coincides with an acceptable moisture content of 10%.
Figure 17 shows the effect of live-steam pressure on net
power output and HRSG stack temperature. For the live
steam pressures between 100 bar to 3 bar, there is an increase
in the net power output and a peak at 40 bar where the net
power output has its maximum of 41.32 MW. This also
coincides with an acceptable HRSG stack temperature of
170.25°C which is above the acid dew point of the flue gas.
Beyond the maximum point, there is a progressive decline in
the net power output with further increase in the live steam
pressure. This point was chosen as the design point for the
combined cycle power plant.
Figure 18 illustrates the effect of live-steam mass flow on
net power output. The graph shows that as the live steam
mass flow increases, the net power output increases as well.
However, the net power output peaks at 41.32 MW which is
the maximum value attainable in the analysis and at a live
steam mass flow of 14.45 kg/s. This implies that for the 25
MW gas turbine with for an exhaust gas temperature of
487°C, maximum power output is attained at a mass flow of
14.45 kg/s, at an optimum pressure of 40 bar within the range
live steam pressures from 3 bar to 100 bar.
From Figures 17 and 18, it can be deduced that the best
combination of process parameters of steam leaving the
steam generator that will give the optimum performance of
the combined cycle plant is determined at 40 bar and 14.45
kg/s.
Figure 19 shows that the overall efficiency gradually drops
with a steady increase in the live steam mass flow rate.
However, it is observed that a reasonable efficiency of
49.26% is obtained at the live steam mass flow of 14.45 kg/s
attained at the maximum power output of 41.32 MW.
Figure 20 shows that the steam turbine power output
steadily increases with a progressive increase in combined
cycle net power output and overall efficiency. It indicates that
the retrofitting of the steam turbine improves the
performance.

Applied Engineering 2018; 2(2): 39-53 50
Figure 21. Relationships between Net Power Output and Overall Efficiency.
Figure 21 shows the relationships between net power
output and overall efficiency of the combined cycle plant. It
shows that the net power output steadily increase with the
overall cycle efficiency until a maximum point of 41.32 MW
is reached where the net power output peaked, thereafter;
there is a diminishing return in the output power. However,
this optimum point of the output power coincides with a
reasonable efficiency of 49.26% for the combined cycle
plant.
5. Conclusion and Recommendation
The general results from the analysis in Table 2 and
discussion showed that the maximum points of 16.32 MW
and 41.32 MW for the steam turbine power output and CCPP
power output respectively, are the maximum values within
the required range of the proposed steam turbine as well as
CCPP. Again, this point, corresponds to an acceptable HRSG
stack temperature of 170.25°C which is above the acid dew
point of flue gas as required and a live steam mass flow and
pressure of 14.45 kg/s and 40 bar respectively, with an
acceptable steam turbine exhaust moisture content of 10%.
The 7th
iteration is therefore chosen for the combined cycle
design of the Omoku gas turbine power plant. Table 3 shows
the detailed specification of the required 16.32 MW steam
turbine output (attained from the 7th
iteration of Table 2) for
the combined cycle power plant. This 16.32 MW steam
turbine power output attained at a mass flow of 14.45kg/s
results from the 124.1 kg/s of exhaust gas at an EGT of
487°C of the Omoku gas turbine indicating that 1kg of
exhaust gas will produce 0.1164 kg of steam.
Deductions from all the analysis and discussions resulted
to a combined cycle power output of 41.32 MW with an
overall efficiency of 49.26%. This higher efficiency of the
combined cycle achieved compared with that of the dry mode
Omoku gas turbine of 26.6% indicates that the amount of
emissions discharged into the atmosphere per unit mass of
fuel burnt is less. Again, the lower stack temperature of
170.25°C from this proposed combined cycle plant compared
with the exhaust gas temperature of 487°C of the existing
Omoku gas turbine indicate a reasonable reduction in the
waste heat intensity to the environment. Thus, the CCS
generates about 65.30% boost in the net power output,
85.20% improvement in overall efficiency and 65.10%
reduction in waste heat intensity to the environment, thereby
contributing to reduction in thermal pollution hence, global
warming. Hence, the work showed that for the design of a
CTPP with a single pressure level HRSG without
supplementary firing, a recommended range for the power
output of the steam bottoming plant falls within 34 – 40% of
the total power output of the CTPP while that of the gas
topping plant falls within the range of 60 – 66% of the total
power output of the CTPP, thereby validating the analysis of
Ragland et al., [20].
Therefore, the results from retrofitting the Omoku GT with
a steam turbine demonstrate an effective utilization of waste
heat from the Omoku gas turbine plant for energy recovery as
more power is generated at a higher efficiency, as well as
reduction in the waste heat intensity to the environment. In
effect, the plant performance is enhanced.
Hence, this research confirms the viability as well as
demonstrates the application, of the combined cycle concept
for the Omoku gas turbine. It thus enhances the usefulness of
this engine as it presents to manufacturers and users, the
feasibility of converting this engine and similar engines to a
combined cycle.
It is therefore recommended that further research should be
carried out on how to introduce a multiple pressure level
HRSG with supplementary firing to the combined cycle
system for an improved efficiency and output.
Nomenclature
Symbol Description Unit
c Specific heat kJ/kgK
Cp Specific heat at constant pressure kJ/kgK
cª«¬ Specific heat of exhaust gas at constant pressure kJ/kgK
cª Specific heat of water kJ/kgK
Specific heat of steam at constant pressure kJ/kgK
h Enthalpy kJ/kg
h� Enthalpy at steam turbine inlet kJ/kg
h� Enthalpy at steam turbine outlet kJ/kg
h� Enthalpy at condenser outlet kJ/kg
h� Feed water enthalpy kJ/kg
h^ Enthalpy at economizer exit kJ/kg
h¯ Enthalpy at evaporator exit kJ/kg
H± Heat loss MW
spc

51 Anthony Kpegele Le-ol and Duabari Silas Aziaka: Performance Improvement of a Dry Mode Natural
Gas Fired Turbine Plant for Combined Cycle Operation
Symbol Description Unit
m� «¬ Mass flaw rate of exhaust gas kg/s
m� ³ Mass flow rate of cooling water kg/s
m� ´ Mass flow rate of steam kg/s
p Pressure bar
P Power MW
P� Steam saturation pressure bar
P� Condenser Inlet pressure bar
P� Condenser Outlet/Feed Pump Inlet pressure bar
P� Feed Pump Outlet pressure bar
P¶ Compressor Power MW
P· Turbine Power MW
P¶¶ Combined cycle power output MW
P̧ ¹·º» Gas turbine net power output MW
P̧ ¹·¼» Steam turbine net power output MW
P½ Pump power input MW
P¾· Steam turbine power output MW
qin Heat flow in kJ/kg
qout Heat flow out kJ/kg
Q Heat flow kW
Q� � Heat Supplied MW
Q� � Heat Rejected MW
*�� Heat rejected in Condenser (Condenser Heat Load) MW
Q� «¬ Heat rejected by exhaust gas MW
QÀÁ¾Â Heat recovered by HRSG (HRSG Heat Load) MW
s Entropy kJ/kgK
T Temperature °C / K
TÄ Compressor Inlet Temperature °C
TÅ Gas Turbine Exhaust Temperature °C
T« HRSG Stack Temperature °C
T� Steam Turbine Inlet Temperature °C
T� Condenser saturated temperature °C
Steam saturation temperature °C
TÆ Temperature of exhaust gas at pinch point °C
tÈÉ Temperature of cooling water into condenser °C
tÊËÌ Temperature of cooling water out of the condenser °C
WÉ«Ì Symbol Description Unit
c Specific heat kJ/kgK
Cp Specific heat at constant pressure kJ/kgK
cª«¬ Specific heat of exhaust gas at constant pressure kJ/kgK
cª Specific heat of water kJ/kgK
Specific heat of steam at constant pressure kJ/kgK
h Enthalpy kJ/kg
h� Enthalpy at steam turbine inlet kJ/kg
h� Enthalpy at steam turbine outlet kJ/kg
h� Enthalpy at condenser outlet kJ/kg
h� Feed water enthalpy kJ/kg
h^ Enthalpy at economizer exit kJ/kg
h¯ Enthalpy at evaporator exit kJ/kg
H± Heat loss MW
m� «¬ Mass flaw rate of exhaust gas kg/s
m� ³ Mass flow rate of cooling water kg/s
m� ´ Mass flow rate of steam kg/s
p Pressure bar
P Power MW
P� Steam saturation pressure bar
P� Condenser Inlet pressure bar
P� Condenser Outlet/Feed Pump Inlet pressure bar
P� Feed Pump Outlet pressure bar
P¶ Compressor Power MW
P· Turbine Power MW
P¶¶ Combined cycle power output MW
P̧ ¹·º» Gas turbine net power output MW
P̧ ¹·¼» Steam turbine net power output MW
P½ Pump power input MW
P¾· Steam turbine power output MW
qin Heat flow in kJ/kg
5T
spc

Applied Engineering 2018; 2(2): 39-53 52
Symbol Description Unit
qout Heat flow out kJ/kg
Q Heat flow kW
Q� � Heat Supplied MW
Q� � Heat Rejected MW
*�� Heat rejected in Condenser (Condenser Heat Load) MW
Q� «¬ Heat rejected by exhaust gas MW
QÀÁ¾Â Heat recovered by HRSG (HRSG Heat Load) MW
s Entropy kJ/kgK
T Temperature °C / K
TÄ Compressor Inlet Temperature °C
TÅ Gas Turbine Exhaust Temperature °C
T« HRSG Stack Temperature °C
T� Steam Turbine Inlet Temperature °C
T� Condenser saturated temperature °C
Steam saturation temperature °C
TÆ Temperature of exhaust gas at pinch point °C
tÈÉ Temperature of cooling water into condenser °C
tÊËÌ Temperature of cooling water out of the condenser °C
WÉ«Ì Net work output kJ/kg
WT Turbine work kJ/kg
WST Steam turbine work kJ/kg
WP Pump work kJ/kg
Wgt Gas turbine work kJ/kg
Net work output kJ/kg
WT Turbine work kJ/kg
WST Steam turbine work kJ/kg
WP Pump work kJ/kg
Wgt Gas turbine work kJ/kg
Greek Symbols ∆�, Pinch point temperature difference °C
∆�� Approach temperature difference °C
� Efficiency,, %
�/ Compressor isentropic efficiency %
�GG Combined cycle overall efficiency %
�/H[3 Condenser efficiency %
��� Gas turbine thermal efficiency %
�MsNt HRSG Thermal ratio %
�N� Steam turbine thermal efficiency %
��� Thermal efficiency %
Subscripts g Gas
is Isentropic
in Inlet
out Outlet
p At constant pressure
th Thermal
Abbreviations CC Combined Cycle
CCPP Combined Cycle Power Plant
CCS Combined Cycle System
CO2 Carbondioxide
CTPP Combined Thermal Power Plant
DP Design Point
EGT Exhaust Gas Temperature
GE General Electric
GT Gas Turbine
GTC Gas Turbine Cycle
HMI Human Machine Interface
HRSG Heat Recovery Steam Generator
Kw Kilo Watts
Kg Kilo Gram
LHV Lower Heating Value
Mpa Mega Paschal
MW Mega Watts
NOX Nitrogen Oxide
OD Off-Design Point
5T

53 Anthony Kpegele Le-ol and Duabari Silas Aziaka: Performance Improvement of a Dry Mode Natural
Gas Fired Turbine Plant for Combined Cycle Operation
RSTC Retrofitted Steam Turbine Cycle
SSC Specific Steam Consumption
ST Steam Turbine
WGS World Geodetic System
References
[1] Le-ol, A. K. (2016) Improvement of Omoku Gas Turbine Power Plant for Combined Cycle Operation. M. Tech. Dissertation, Department of Mechanical Engineering, Rivers State University, Port-Harcourt, Nigeria.
[2] Kumar, P. (2010) Optimization of Gas Turbine Cycle Using Optimization Technique. M. Eng. Thesis, Department of Mechanical Engineering, Thapar University, Patiala-147004, India.
[3] Aref, P. (2012) Development of Framework for Thermo-Economic Optimization of Simple and Combined Gas Turbine Cycles; Ph. D. Thesis, school of Engineering, Cranfield University.
[4] Rao, S. and Parulekar, B. B. (2007) Energy Technology: Non-Conventional, Renewable and Conventional. Khanna Publishers, Naisarak, Delhi.
[5] Lebele-Alawa, B. T. and Le-ol, A. K. (2015) Improved Design of a 25 MW Gas Turbine Plant using Combined Cycle Application Journal of Power and Energy Engineering, 3, 1-14 http://dx.doi.org/10.4236/jpee.2015.38001.
[6] De, S., Nag, P. K. (2000) Effect of Supplementary Firing on the Performance of an Integrated Gasification Combined Cycle Power Plant. Indian Institute of Technology, Kharagpur, India, Proc. Instn. Mech. Engrs., 214, Part A.
[7] Kehlhofer, R., Rukes, B., Hannemann, F., & Stirnimann, F. (2009) Combined-Cycle Gas & Steam Turbine Power Plants, PenWell Corporation, Third Edition, Tulsa, Oklahoma, USA.
[8] Nickhil, D., Sansher, S. S. Kachhwaha, Rajesh, A. A. (2012) Review of Combined Cycle Power Plant Thermodynamic Cycles: Proceedings of the National Conference on Trends and Advances in Mechanical Engineering, YMCA University of Science and Technology, Faridabad, Haryana, Oct. 19-20.
[9] Lars, O. N. & Bolland, O. (2012) Steam Bottoming Cycles Offshore – Challenges and Possibilities. Journal of Power Technologies, 92 (3), 201-207.
[10] Polyzakis A. L., Koroneous C., & Xydis G., (2008) Optimum Gas Turbine Cycle for Combined Cycle Power Plant. Energy Conversion and Management Publications 49, 551-563.
[11] Tiwari, A. K, Hasan, M. M, Islam, M. (2012) Effect of Operating Parameters on the Performance of Combined Cycle Power Plant.1: 351 doi: 10.4172/scientificreports.
[12] Ravi Kumar, N., Rama Krishna, K., & Sita Rama Raju, A. V. (2006) Performance Simulation of Heat Recovery Steam Generator in Combined Cycle Power Plant. Proceeding of the 18th National and 17th ISHMT-ASME Heat and Mass Transfer Conference, India.
[13] Murad, A. R., Amirabedin, E., Yilmazoglu, M. Z., & Durmaz, A. (2010) Analysis of Heat Recovery Steam Generators in Combined Cycle Power Plants. The Second International Conference on Nuclear and Renewable Energy Resources, Ankara, Turkey.
[14] Ahmed, S. Y. (2013) Performance of the Combined Gas Turbine-Steam Cycle for Power Generation. Mathematical Theory and Modeling, 3, 12.
[15] Thamir, K. I. & Rahman, M. M. (2012) Effect of Compression Ratio on Performance of Combined Cycle Gas Turbine: Scientific & Academic Publishing. International Journal of energy Engineering; 2 (1), 9-14.
[16] Service Manual (Gas Turbine MS 5001) of 25 MW Unit of Omoku Power Generation Station. GEPS Oil & Gas, Nuovo Pignone, Volume 1; G. T Description, Instruction & Operation.
[17] Armando, A. (2013) Optimization of Maputo Power Plant, Master of Science Thesis, KTH School of Industrial Engineering and Management Energy Technology, STOCKHOLM.
[18] Kehlhoffer, R. (1997) Combined Cycle Gas and Steam Turbine Power Plants. PennWell Publishing Company, Oklahoma.
[19] Jehar and Associates. Introduction to HRSG design. www.hrsgdesign.com.
[20] Ragland, A., Vogt-NEM, Stenzel, W. (2000) Combined Cycle Heat Recovery Optimization. Proceedings of 2000 International Joint Power Generation Conference, Miami Beach, July 23 (26), 1781-1787.