performance highlights for fy ended march 2013 analysts for march... · 2013) 0 0 0 0 0 0 0 0...
TRANSCRIPT

PERFORMANCE HIGHLIGHTS FOR FY ENDED
MARCH 2013
1

� Net Profit has increased from Rs.533 crore in FY 2011-12 to Rs. 1015 crore in FY 2012-13 registeringY-o-Y growth of 90.43%.
� Operating Profit has increased from Rs. 2815 crore in FY 2011-12 to Rs. 3173 crore in FY 2012-13registering Y-o-Y growth of 12.72%.
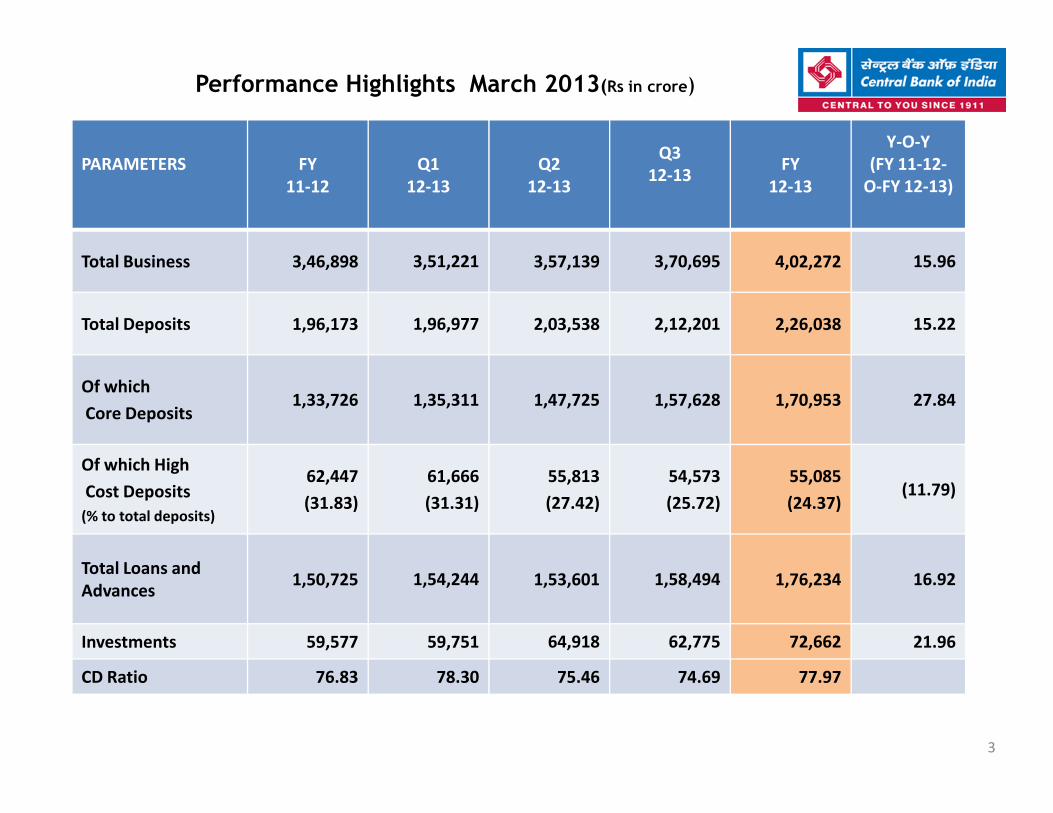
� Total Business of the Bank increased to Rs 4,02,272 crore from Rs 3,46,898 crore in FY -2011-12,recording Y-o-Y growth of 15.96%.
� Total Deposits grew by 15.22 % on Y-o-Y to Rs 2,26,038 crore from Rs1,96,173 crore in FY-2011-12whereas Core Deposits grew by 27.84% Y-o-Y. Gross advances stood at Rs 1,76,234 crore against Rs1,50,725 crore in previous FY -2011-12, registering Y-o-Y growth of 16.92%.
PERFORMANCE HIGHLIGHTS-FY2012-13
2
1,50,725 crore in previous FY -2011-12, registering Y-o-Y growth of 16.92%.
� Total Income increased by 14.52% to Rs.23528 crore in FY -2012-13 from Rs.20,545 crore in FY -2011-12.
� ROA improved to 0.44% in FY-2012-13 from 0.26% in FY-2011-12
� NIM improved to 2.68%in Q4-2012-13 from 2.59% in Q4-2011-12.
� Gross NPA % reduced to 4.80 % in FY-2012-13 from 4.83% in FY-2011-12 whereas Net NPA % reducedto 2.90 % in FY-2012-13 from 3.10% in FY-2011-12
� CRAR under BASELII is at 11.49 %.
2
Performance Highlights March 2013(Rs in crore)
PARAMETERS FY
11-12
Q1
12-13
Q2
12-13
Q3
12-13FY
12-13
Y-O-Y
(FY 11-12-
O-FY 12-13)
Total Business 3,46,898 3,51,221 3,57,139 3,70,695 4,02,272 15.96
Total Deposits 1,96,173 1,96,977 2,03,538 2,12,201 2,26,038 15.22
Of which
Core Deposits1,33,726 1,35,311 1,47,725 1,57,628 1,70,953 27.84
3
Core Deposits1,33,726 1,35,311 1,47,725 1,57,628 1,70,953 27.84
Of which High
Cost Deposits
(% to total deposits)
62,447
(31.83)
61,666
(31.31)
55,813
(27.42)
54,573
(25.72)
55,085
(24.37)(11.79)
Total Loans and
Advances1,50,725 1,54,244 1,53,601 1,58,494 1,76,234 16.92
Investments 59,577 59,751 64,918 62,775 72,662 21.96
CD Ratio 76.83 78.30 75.46 74.69 77.97

Performance Highlights March 2013(Rs in crore)
PARAMETERSQ4
11-12
FY
11-12
Q1
12-13
Q2
12-13
Q3
12-13
Q4
12-13
FY
12-13
Y-O-Y
(Q4 11-
12-O-
Q412-
13)
Y-O-Y
(FY 11-
12-O-FY
12-13)
Gross Income 5372 20,545 5,625 5,681 5,819 6403 23528 19.19 14.52
Gross
Expenses4759 17,730 4,831 4,865 5,040 5619 20355 18.07 14.81
4
Operating
Profit613 2,815 794 816 779 784 3173 27.89 12.72
Net Profit (105) 533 336 330 180 169 1015 260.95 90.43
Net Interest
Margin2.59 2.78 2.64 2.68 2.60 2.68 2.65 -- --

Total Branches * 4294
Rural 1559
Semi Urban 1169
Urban 830
Metropolitan 736
ATMs 2529
USBs 3612
BRANCH SEGMENTATION : AS ON 31ST MARCH, 2013
5
USBs 3612
New Branches Opened Rural Semi Urban Urban Metro Total
Q1 11 8 3 1 23
Q2 27 31 12 10 80
Q3 22 64 29 9 124
Q4 7 33 7 9 56
Total in the year 67 136 51 29 283
* A REAL PAN INDIA BANK WITH PRESENCE IN 568 DISTRICTS OUT OF 642 DISTRICTS OF THE COUNTRY

BUSINESS
6
BUSINESS
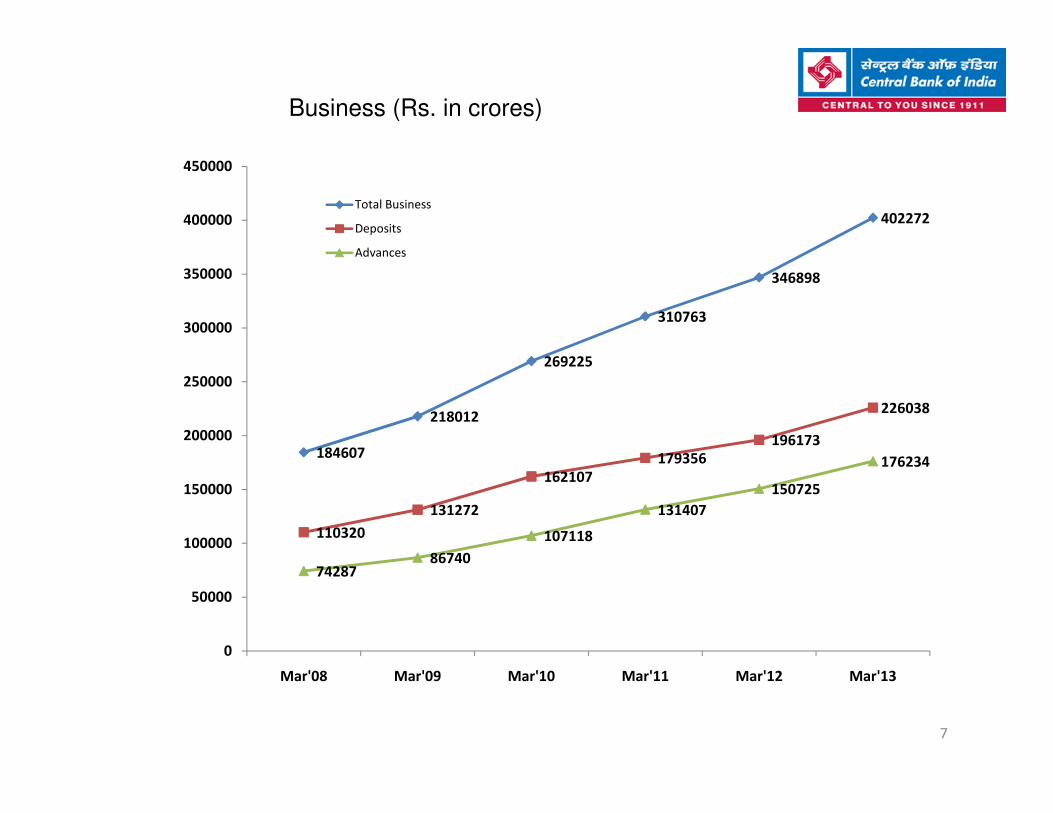
Business (Rs. in crores)
218012
269225
310763
346898
402272
226038
250000
300000
350000
400000
450000
Total Business
Deposits
Advances
7
184607
218012
110320
131272
162107
179356
196173
226038
7428786740
107118
131407
150725
176234
0
50000
100000
150000
200000
Mar'08 Mar'09 Mar'10 Mar'11 Mar'12 Mar'13

Segment-wise Deposits (Rs in crore)
DepositsFY
11-12
Q1
12-13
Q2
12-13
Q3
12-13FY
12-13
Y-O-Y
(FY 11-12-
O-FY 12-
13)
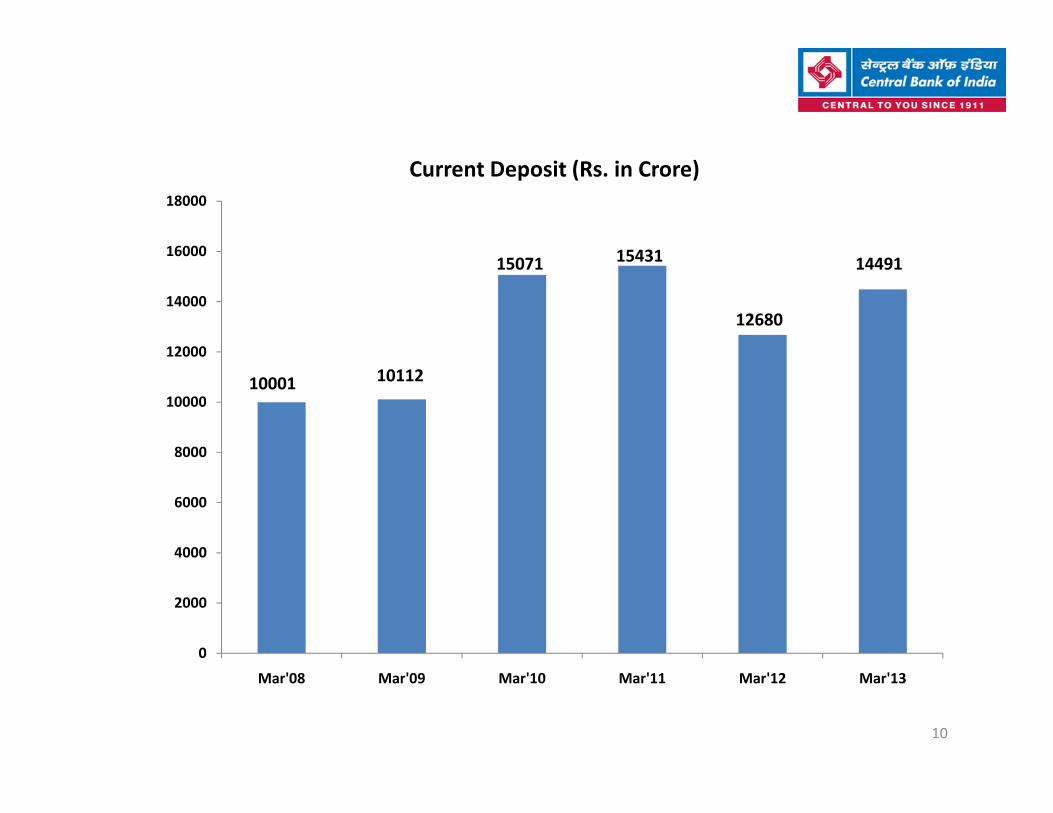
Current 12,680 10,837 11,061 10,898 14491 14.28
Savings 52,595 53,943 56,119 57,101 59090 12.35
Total CASA 65,275 64,780 67,180 67,999 73581 12.72
8
Core Term 68,451 70,531 80,545 89,629 97372 42.25
Total Core
Deposits1,33,726 1,35,311 1,47,725 1,57,628 170953 27.84
High Cost 62,447 61,666 55,813 54,573 55085 (11.79)
Total Deposits 1,96,173 1,96,977 2,03,538 2,12,201 226038 15.22
CASA % 33.27 32.89 33.00 32.04 32.55

40000
50000
60000
70000
Saving Deposit (Rs. in crore)
33681
47645
40764
52595
59090
9
0
10000
20000
30000
Mar'08 Mar'09 Mar'10 Mar'11 Mar'12 Mar'13
2986633681
10000
12000
14000
16000
18000
Current Deposit (Rs. in Crore)
10001 10112
15071 15431
12680
14491
10
0
2000
4000
6000
8000
10000
Mar'08 Mar'09 Mar'10 Mar'11 Mar'12 Mar'13

62447
61666
55813
58000
60000
62000
64000High Cost Deposits (Rs. in Crore)
11
55813
5457355085
50000
52000
54000
56000
FY 11-12 Q1 12-13 Q2 12-13 Q3 12-13 FY 12-13
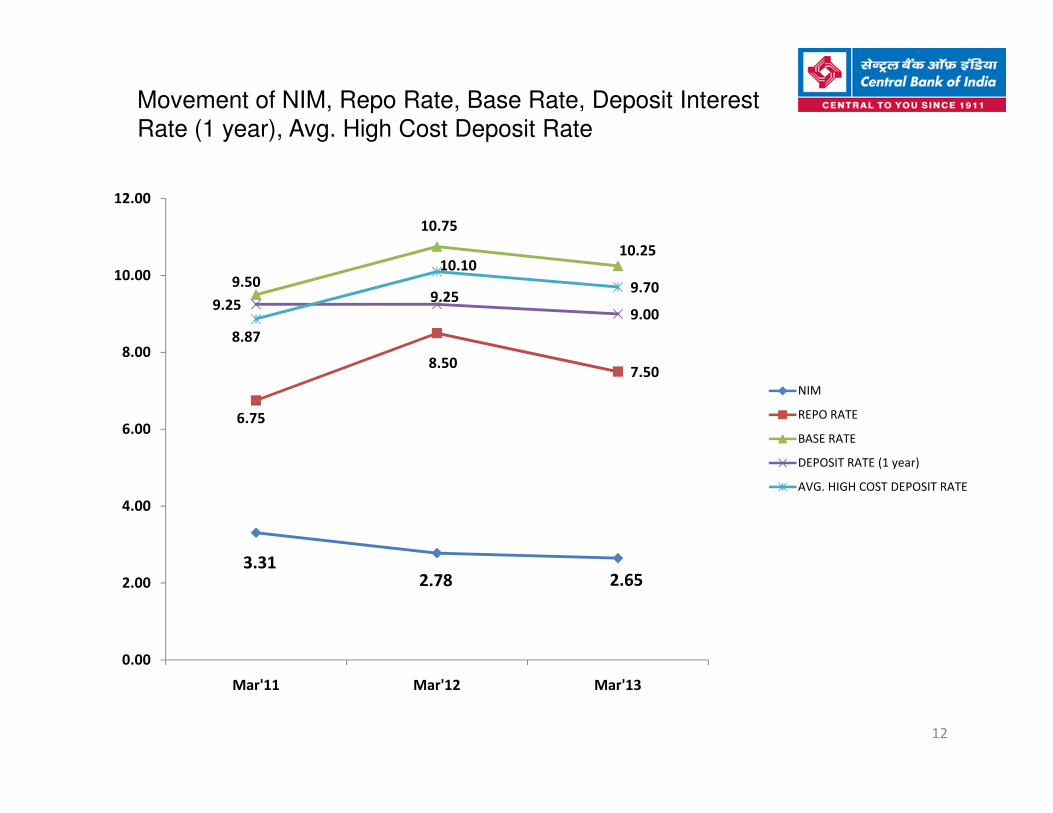
Movement of NIM, Repo Rate, Base Rate, Deposit Interest
Rate (1 year), Avg. High Cost Deposit Rate
8.507.50
9.50
10.75
10.25
9.259.25
9.00
8.87
10.10
9.70
8.00
10.00
12.00
NIM
REPO RATE
12
3.312.78 2.65
6.75
0.00
2.00
4.00
6.00
Mar'11 Mar'12 Mar'13
REPO RATE
BASE RATE
DEPOSIT RATE (1 year)
AVG. HIGH COST DEPOSIT RATE

POPULATION GROUP WISE BUSINESS (Amt Rs. Cr)
31-MAR-2012 31-MAR-2013 % GROWTH
BR_CATG DEPOSIT ADVANCE BUSINESS DEPOSIT ADVANCE BUSINESS DEPOSIT ADVANCE BUSINESS
RURAL 21546 13175 34720 25799 16339 42138 20.00 24.00 21.00
SEMI
URBAN26514 11727 38240 31151 14683 45833 17.00 25.00 20.00
13
URBAN
URBAN 36764 20889 57653 43322 26441 69763 18.00 27.00 21.00
METRO 111349 104934 216285 125766 118771 244538 12.95 13.19 13.06
TOTAL 196173 150725 346898 226038 176234 402272 15.22 16.92 15.96

Loans and Advances Segment Wise (Rs. in crore)
PARTICULARSFY
11-12
Q1
12-13
Q2
12-13
Q3
12-13
FY
12-13
Y-O-Y
(FY 11-12-
O-FY 12-
13)
Total Loans & Advances 1,50,725 1,54,244 1,53,601 1,58,494 1,76,234 16.92%
Corporate Credit 98,960 92,650 98,363 1,07,833 1,20,328 21.59%
(% to total Loans &
Advances)65.66% 60.07% 64.04% 68.04% 68.28%
Agriculture 18,848 19,782 18,677 19,378 24,660 30.84%
(% to total Loans &
14
(% to total Loans &
Advances)12.50% 12.83 12.16 12.23 13.99%
- Direct Agriculture 15,047 15,833 15,055 15,673 18,881 25.48%
- Indirect Agriculture 3,801 3,949 3,622 3,705 5,779 52.04%
MSE 13,161 13,761 14,692 15,553 17,289 31.36%
(% to total Loans &
Advances)8.73 8.92 9.57 9.81 9.81%
Retail 16,715 17,323 18,479 19,710 21,352 27.74%
(% to total Loans &
Advances)11.09 11.23 12.03 12.44 12.11
- Housing 6,282 6,167 6,695 7,042 7699 22.56%
- Education 2,157 2,273 2,473 2,568 2567 17.06%
- Others 8,276 8,883 9,311 10,100 11086 44.82%

Corporate Credit Amount wise ( Rs in Cr)
DESCRIPTIONFY
11-12
Q1
12-13
Q2
12-13
Q3
12-13
FY
12-13
Y-O-Y
(FY 11-12-
O-FY 12-
13)
5 CRORE-
15
5 CRORE-
25 CRORE10963 11649 13305 14062 15784 43.97
25 CRORE-
100 CRORE25328 26347 26141 30720 31904 25.96
ABOVE
100 CRORE62669 54654 58917 63057 72640 15.91

PRIORITY SECTOR LENDING (Rs. in crore)
Type of AdvanceFY
11-12
Q1
12-13
Q2
12-13
Q3
12-13
FY
12-13
Y-O-Y
(FY 11-12-O-
FY 12-13)
Priority Sector
Advances
(% to ANBC)
40259
(30.67)
41980
(27.78)
42077
(27.84)
43930
(29.07)
51252
(33.92)27.31
Agriculture
(% to ANBC)18848
(14.36)
19782
(13.09)
18677
(12.36)
19378
(12.82)
24660
(16.31)30.84
16
(14.36) (13.09) (12.36) (12.82) (16.31)
-Direct Agriculture
(% to ANBC)
15047
(11.46)
15833
(10.48)
15055
(9.96)
15673
(10.37)
18881
(12.49)25.48
-Indirect
Agriculture
(% to ANBC)
3801
(2.90)
3949
(2.61)
3622
(2.40)
3705
(2.45)
5779
(3.82)52.04
MSE
(% to ANBC)
13161
(10.03)
13761
(9.11)
14692
(9.72)
15553
(10.29)
17289
(11.44)31.36

Status of implementation of FIP (> 2000 population
Villages)
Sr.
No Particulars
FY 11-12 Q1(12-13) Q2(12-13) Q3(12-13) Q4(12-13) FY 12-13 YoY
Growth
1
No. of villages
covered
3725 3728 3728 3728 3728 3728
2
No. of BCs
appointed
3629 3629 3629 3629 3612 3612
3
No. of Cards
Issued
11,94,194 1274383 13,55,452 14,59,959 15,52,381 15,52,381 30.0%
4
No. of
Transactions in
(in lakhs)
3.88 2.43 6.44 11.61 17.11 17.11 340.97%
4 (in lakhs)
5
Amount of
Transactions in
(in Crores)
16.64 16.57 27.66 68.49 118.93 118.93 614.72%
6
Deposit
through BCA
(in lacs)
470 568 813 1417 2467 2467 424.90%
7
Advances
through BCA
(in lacs)
NIL 1.02 3.22 8.57 17.55 17.55 ---
17

Overall status implementation of FIP (including non-allotted & smaller villages)
Sr.
No Particulars
FY 11-12 Q1(12-13) Q2(12-13) Q3(12-13) Q4(12-13) FY 12-13 YoY
Growth
1
No. of villages
covered
8012 8012 8192 8490 8684 8684 8.39%
2
No. of BCs
appointed
4701 4701 4720 4760 4860 4860 3.38%
3
No. of Cards
Issued
30,92,794 31,46,679 37,81,728 39,07,160 40,81,932 40,81,932 31.98%
4
No. of
Transactions
(in lakhs)
6.38 2.84 8.56 14.61 22.42 22.42 251.41%
4 (in lakhs)
5
Amount of
Transactions
(in Crores)
28.95 25.38 41.94 87.95 154.39 154.39 433.29%
6
Deposit
through BCA
(in lacs)
470 568 813 1417 2467 2467 424.90%
7
Advances
through BCA
(in lacs)
NIL 1.02 3.22 8.57 17.55 17.55 ---
18
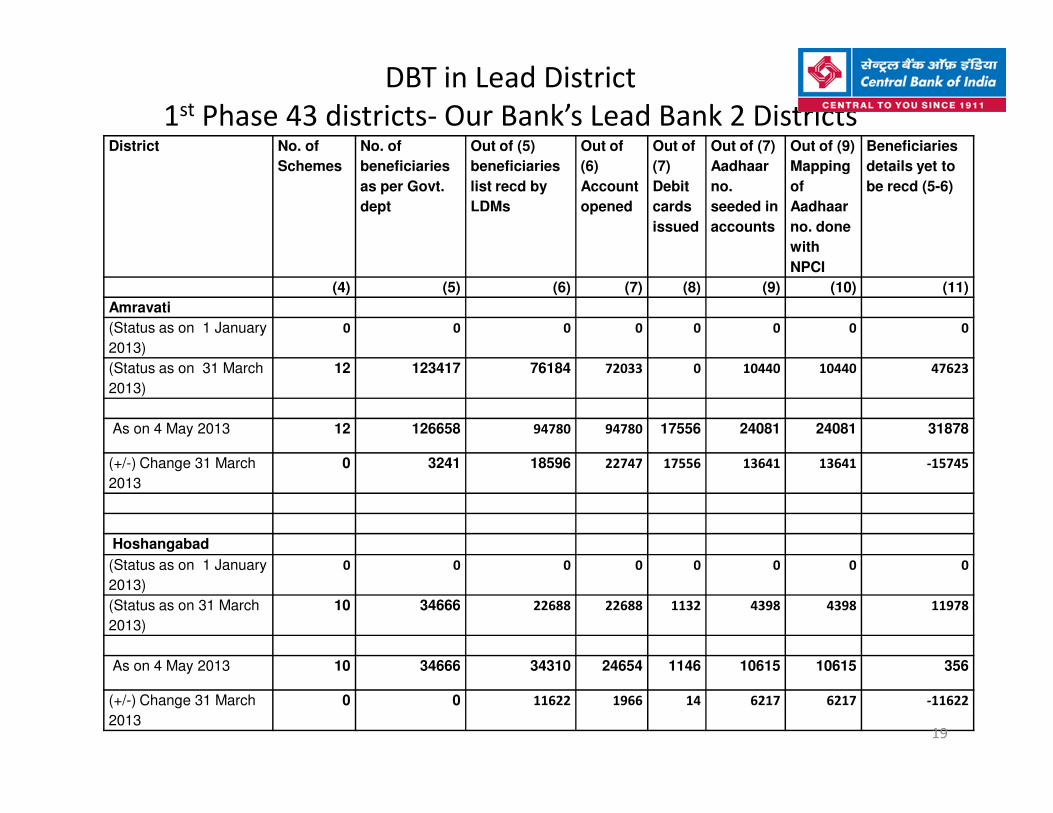
DBT in Lead District
1st Phase 43 districts- Our Bank’s Lead Bank 2 DistrictsDistrict No. of
Schemes
No. of
beneficiaries
as per Govt.
dept
Out of (5)
beneficiaries
list recd by
LDMs
Out of
(6)
Account
opened
Out of
(7)
Debit
cards
issued
Out of (7)
Aadhaar
no.
seeded in
accounts
Out of (9)
Mapping
of
Aadhaar
no. done
with
NPCI
Beneficiaries
details yet to
be recd (5-6)
(4) (5) (6) (7) (8) (9) (10) (11)
Amravati
(Status as on 1 January
2013)
0 0 0 0 0 0 0 0
(Status as on 31 March
2013)
12 123417 76184 72033 0 10440 10440 47623
As on 4 May 2013 12 126658 94780 94780 17556 24081 24081 31878
(+/-) Change 31 March
2013
0 3241 18596 22747 17556 13641 13641 -15745
Hoshangabad
(Status as on 1 January
2013)
0 0 0 0 0 0 0 0
(Status as on 31 March
2013)
10 34666 22688 22688 1132 4398 4398 11978
As on 4 May 2013 10 34666 34310 24654 1146 10615 10615 356
(+/-) Change 31 March
2013
0 0 11622 1966 14 6217 6217 -11622
19

Performance of Retail Advances (Rs. in crore)
DESCRIPTION FY
11-12
Q1
12-13
Q2
12-13
Q3
12-13
FY
12-13
Y-O-Y
(FY 11-12-O-
FY 12-13)
HOUSING LOAN 6282 6167 6695 7042 7699 22.56
EDUCATION LOAN 2157 2273 2473 2568 2567 19.01
CENT PERSONAL GOLD
LOAN319 409 468 625 761 138.56
20
LOAN
LOAN AGAINST PROPERTY 5805 6252 6638 7074 7743 33.39
i. Cent Mortgage 3372 3809 3997 4142 4457 32.18
ii. Cent Trade 2250 2263 2463 2667 3002 33.42
iii. Cent Rental 100 91 86 168 179 79.00
iv. Cent Swabhimaan 22 23 23 24 25 13.64
v. Cent Swabhimaan Plus 61 66 69 73 80 31.15
Others 2152 2222 2205 2401 2582 19.98
Grand Total 16715 17323 18479 19710 21352 27.74

FINANCIALS
21
FINANCIALS
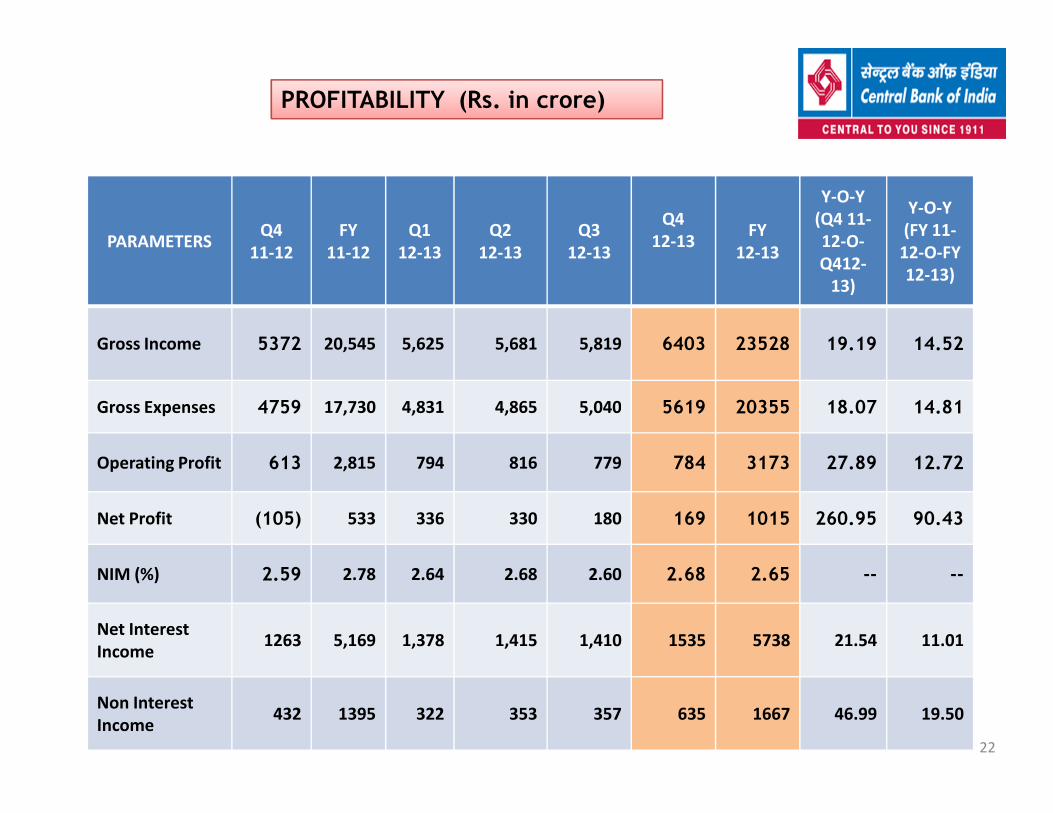
PROFITABILITY (Rs. in crore)
PARAMETERSQ4
11-12
FY
11-12
Q1
12-13
Q2
12-13
Q3
12-13
Q4
12-13FY
12-13
Y-O-Y
(Q4 11-
12-O-
Q412-
13)
Y-O-Y
(FY 11-
12-O-FY
12-13)
Gross Income 5372 20,545 5,625 5,681 5,819 6403 23528 19.19 14.52
Gross Expenses 4759 17,730 4,831 4,865 5,040 5619 20355 18.07 14.81
22
Gross Expenses 4759 17,730 4,831 4,865 5,040 5619 20355 18.07 14.81
Operating Profit 613 2,815 794 816 779 784 3173 27.89 12.72
Net Profit (105) 533 336 330 180 169 1015 260.95 90.43
NIM (%) 2.59 2.78 2.64 2.68 2.60 2.68 2.65 -- --
Net Interest
Income1263 5,169 1,378 1,415 1,410 1535 5738 21.54 11.01
Non Interest
Income 432 1395 322 353 357 635 1667 46.99 19.50
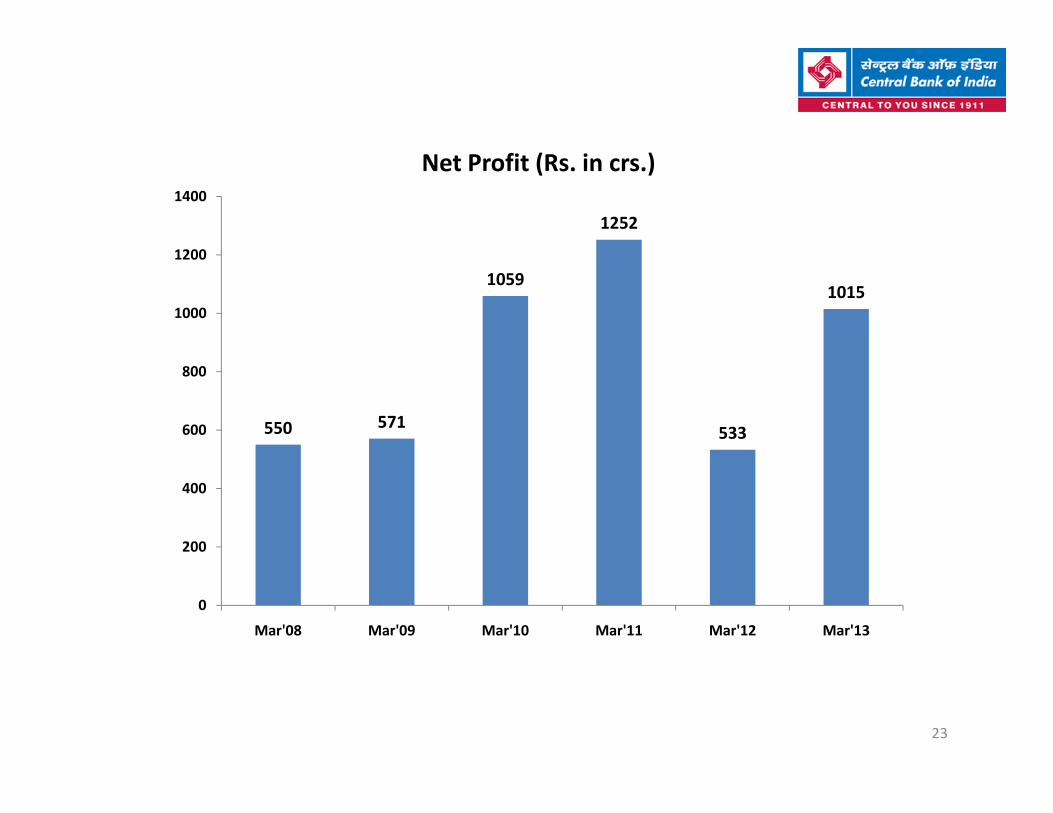
1059
1252
1015
800
1000
1200
1400
Net Profit (Rs. in crs.)
23
550 571533
0
200
400
600
Mar'08 Mar'09 Mar'10 Mar'11 Mar'12 Mar'13
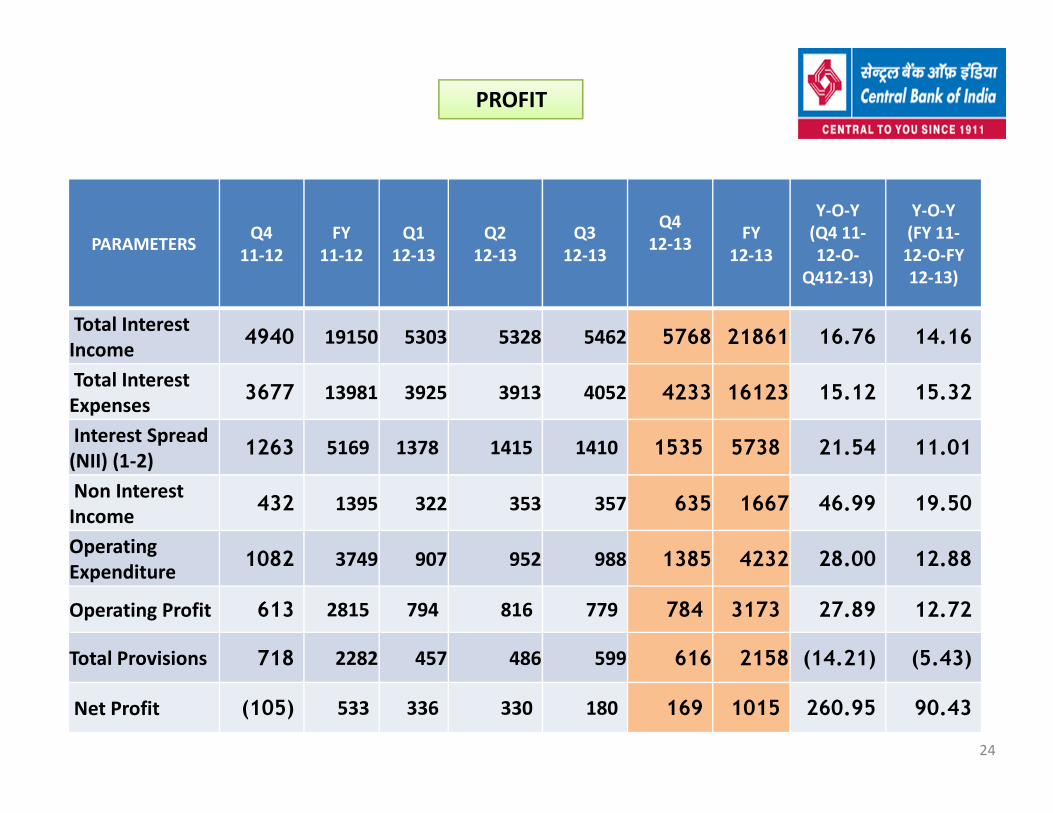
PROFIT
PARAMETERSQ4
11-12
FY
11-12
Q1
12-13
Q2
12-13
Q3
12-13
Q4
12-13FY
12-13
Y-O-Y
(Q4 11-
12-O-
Q412-13)
Y-O-Y
(FY 11-
12-O-FY
12-13)
Total Interest
Income4940 19150 5303 5328 5462 5768 21861 16.76 14.16
Total Interest
Expenses3677 13981 3925 3913 4052 4233 16123 15.12 15.32
24
Expenses
Interest Spread
(NII) (1-2)1263 5169 1378 1415 1410 1535 5738 21.54 11.01
Non Interest
Income432 1395 322 353 357 635 1667 46.99 19.50
Operating
Expenditure1082 3749 907 952 988 1385 4232 28.00 12.88
Operating Profit 613 2815 794 816 779 784 3173 27.89 12.72
Total Provisions 718 2282 457 486 599 616 2158 (14.21) (5.43)
Net Profit (105) 533 336 330 180 169 1015 260.95 90.43

PROFIT FROM CORE OPERATIONS
PARAMETERSQ4
11-12
FY
11-12
Q1
12-13
Q2
12-13
Q3
12-13
Q4
12-13
FY
12-13
Y-O-Y
(Q4 11-
12-O-
Q412-13)
Y-O-Y
(FY 11-12-
O-FY 12-
13)
Net Profit (105) 533 336 330 180 169 1015 260.95 90.43
Treasury
Trading Profit98 320 102 70 68 143 383 45.92 19.69
Depreciation/
25
Depreciation/
Provision on
Investment
(80)151 (39) (69)
(7) (48) (163) (40.00) (107.36)
Core Net Profit (87) 364 195 191 105 (22) 469 (74.71) 28.85
Operating
Profit613 2,815 794 816 779 784 3173 27.89 12.72
Treasury
Trading Profit98 320 102 70 68 143 383 45.92 19.69
Core Operating
Profit515 2495 691 746 711 642 2790 24.66 11.82

PROFITABILITY INDICATORS (%)
PARAMETERS (%)Q4
11-12
FY
11-12
Q1
12-13
Q2
12-13
Q3
12-13
Q4
12-13FY
12-13
Yield on Advances 11.12 11.36 11.16 11.09 11.16 11.09 11.14
Yield on Investments 7.87 7.53 7.56 7.50 7.64 8.07 7.60
Cost of Deposits 7.37 7.20 7.47 7.39 7.38 7.39 7.42
Cost of Funds 7.47 7.28 7.61 7.44 7.52 7.50 7.53
26
Cost of Funds 7.47 7.28 7.61 7.44 7.52 7.50 7.53
Cost to Income Ratio 63.85 57.11 53.36 53.82 55.91 63.86 57.16
Non-Interest Income/
Total Income8.04 6.79 5.72 6.11 6.14 9.93 7.09
Interest Income to AWF 6.99 9.22 9.57 9.35 9.57 9.48 9.46
Non Int. Income to AWF 0.81 0.67 0.58 0.62 0.58 1.05 0.72
Operating Profits to AWF 1.15 1.36 1.43 1.43 1.43 1.29 1.37

Average Business per Employee
712
835862
973
800
1000
1200
Business per Employee (Rs. in lacs)
27
560
0
200
400
600
Mar'09 Mar'10 Mar'11 Mar'12 Mar'13
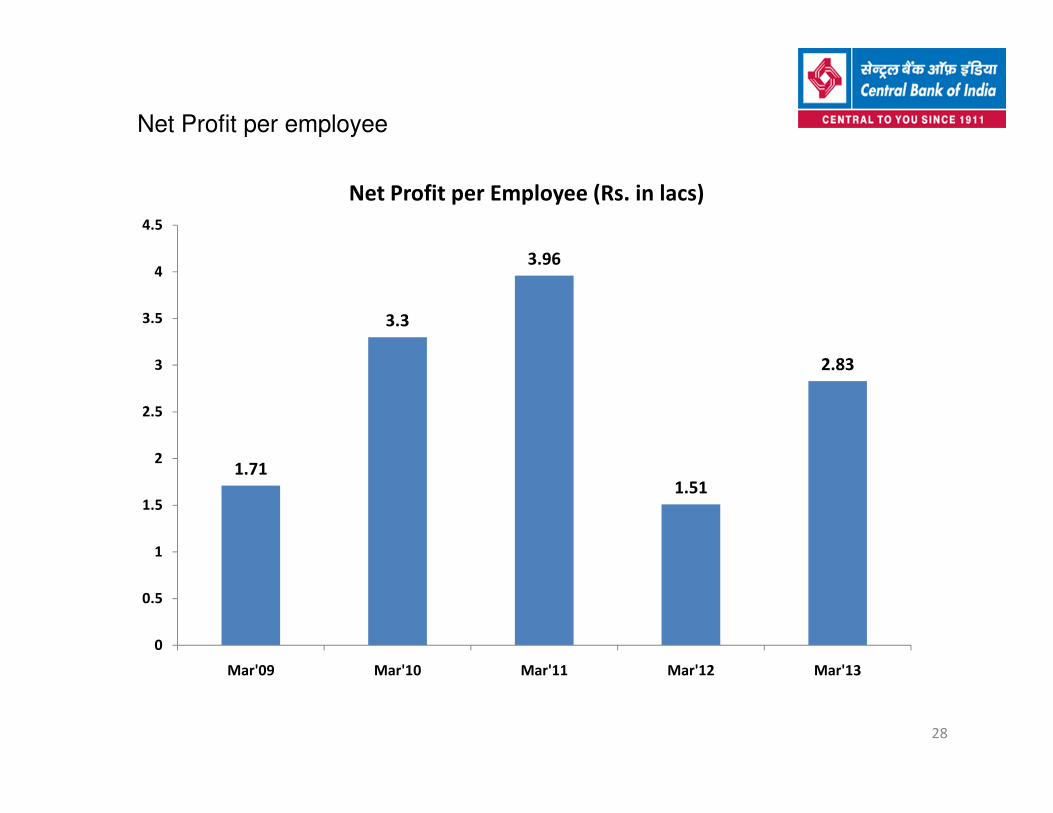
Net Profit per employee
3.3
3.96
2.83
2.5
3
3.5
4
4.5
Net Profit per Employee (Rs. in lacs)
28
1.711.51
0
0.5
1
1.5
2
2.5
Mar'09 Mar'10 Mar'11 Mar'12 Mar'13

BREAK- UP : INCOME
PARAMETERS Q4
11-12
FY
11-12
Q1
12-13
Q2
12-13
Q3
12-13
Q4
12-13FY
12-13
Y-O-Y
(Q4 11-
12-O-
Q412-13)
Y-O-Y
(FY 11-
12-O-FY
12-13)
Interest on
Advances3732 14421 4168 4156 4224 4374 16922 17.20 17.34
29
Interest on
Investments1129 4347 1123 1163 1210 1283 4779 13.64 9.94
Other Interest
Income79 382 12 10 28 110 160 39.24 (58.12)
Total Interest
Income4940 19150 5303 5329 5462 5767 21861 16.74 14.16
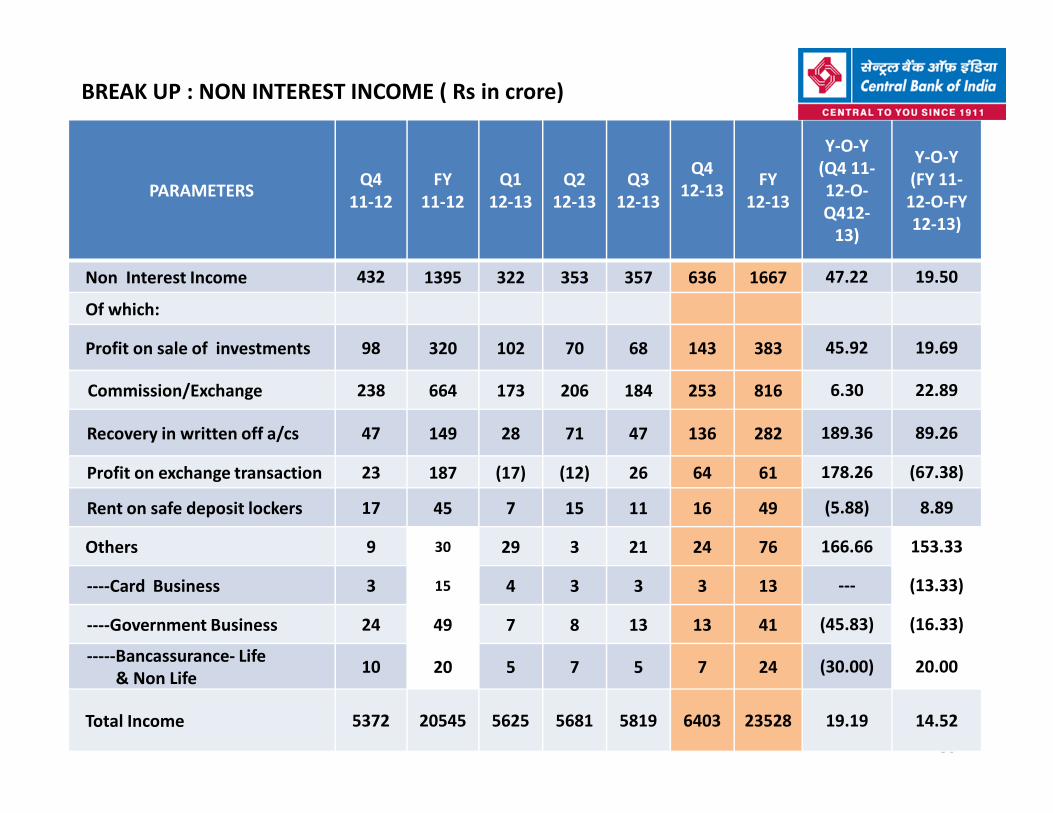
BREAK UP : NON INTEREST INCOME ( Rs in crore)
PARAMETERS Q4
11-12
FY
11-12
Q1
12-13
Q2
12-13
Q3
12-13
Q4
12-13FY
12-13
Y-O-Y
(Q4 11-
12-O-
Q412-
13)
Y-O-Y
(FY 11-
12-O-FY
12-13)
Non Interest Income 432 1395 322 353 357 636 1667 47.22 19.50
Of which:
Profit on sale of investments 98 320 102 70 68 143 383 45.92 19.69
Commission/Exchange 238 664 173 206 184 253 816 6.30 22.89
30
Recovery in written off a/cs 47 149 28 71 47 136 282 189.36 89.26
Profit on exchange transaction 23 187 (17) (12) 26 64 61 178.26 (67.38)
Rent on safe deposit lockers 17 45 7 15 11 16 49 (5.88) 8.89
Others 9 30 29 3 21 24 76 166.66 153.33
----Card Business 3 15 4 3 3 3 13 --- (13.33)
----Government Business 24 49 7 8 13 13 41 (45.83) (16.33)
-----Bancassurance- Life
& Non Life10 20 5 7 5 7 24 (30.00) 20.00
Total Income 5372 20545 5625 5681 5819 6403 23528 19.19 14.52

BREAK-UP : EXPENDITURE
PARAMETERS Q4
11-12
FY
11-12
Q1
12-13
Q2
12-13
Q3
12-13
Q4
12-13FY
12-13
Y-O-Y
(Q4 11-
12-O-
Q412-13)
Y-O-Y
(FY 11-
12-O-
FY 12-
13)
Interest on deposits 3435 12996 3615 3641 3735 3949 14940 14.96 14.96
Interest on Sub-
ordinated debts139 523 139 142 153 149 583 7.19 11.47
Interest on
borrowings/refinance103 462 171 130 164 135 600 31.07 29.87
31
borrowings/refinance103 462 171 130 164 135 600 31.07 29.87
Total interest Expenses 3677 13981 3925 3913 4052 4233 16123 15.12 15.32
Operating
Expenditure:
I.Establishment 631 2506 641 622 665 964 2892 52.77 15.40
III. Other Optg.
Expenditure451 1243 265 330 323 422 1340 (38.29) 7.80
Total optg.
Expenditure1082 3749 906 952 988 1386 4232 28.10 12.88
Gross Expenses 4759 17730 4832 4865 5040 5619 20355 18.05 14.81
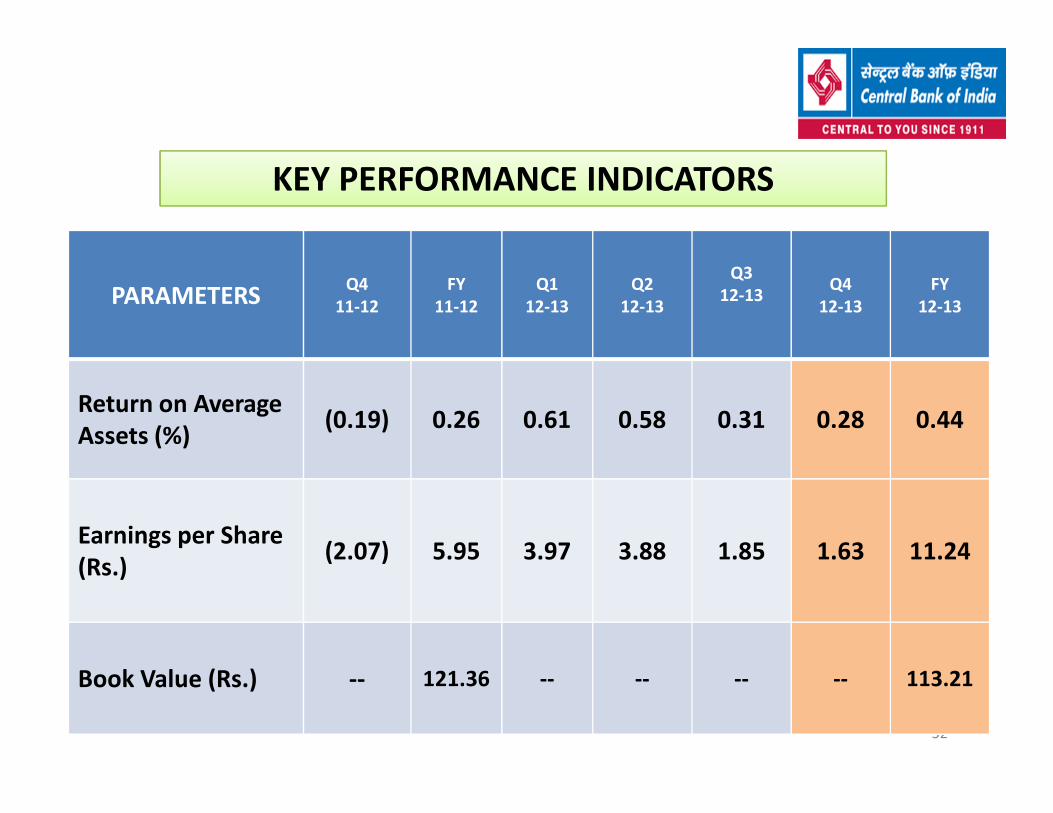
KEY PERFORMANCE INDICATORS
PARAMETERS Q4
11-12
FY
11-12
Q1
12-13
Q2
12-13
Q3
12-13Q4
12-13
FY
12-13
Return on Average (0.19) 0.26 0.61 0.58 0.31 0.28 0.44
32
Return on Average
Assets (%)(0.19) 0.26 0.61 0.58 0.31 0.28 0.44
Earnings per Share
(Rs.)(2.07) 5.95 3.97 3.88 1.85 1.63 11.24
Book Value (Rs.) -- 121.36 -- -- -- -- 113.21

INVESTMENTS : CLASSIFICATION ( Rs IN CRORE)
PARAMETERS FY
11-12
Q1
12-13
Q2
12-13
Q3
12-13
FY
12-13
Y-O-Y
(FY 11-12-
O-FY 12-13)
SLR 50978 51213 55916 52,509 60,172 18.03
Non-SLR 8599 8538 9002 10,266 12,490 45.25
Total 59577 59751 64918 62,775 72,662 21.96
33
Held For Trading 158 40 187 853 335 112
Available For Sale17534 13428 13740 14,495 20,549 17.20
Held To Maturity
41885 46283 50992 47,427 51,778 23.62
M.DURATION
4.34 4.34 4.30 4.37 4.70

ASSET
QUALITY
&
34
&
CAPITAL
STRUCTURE
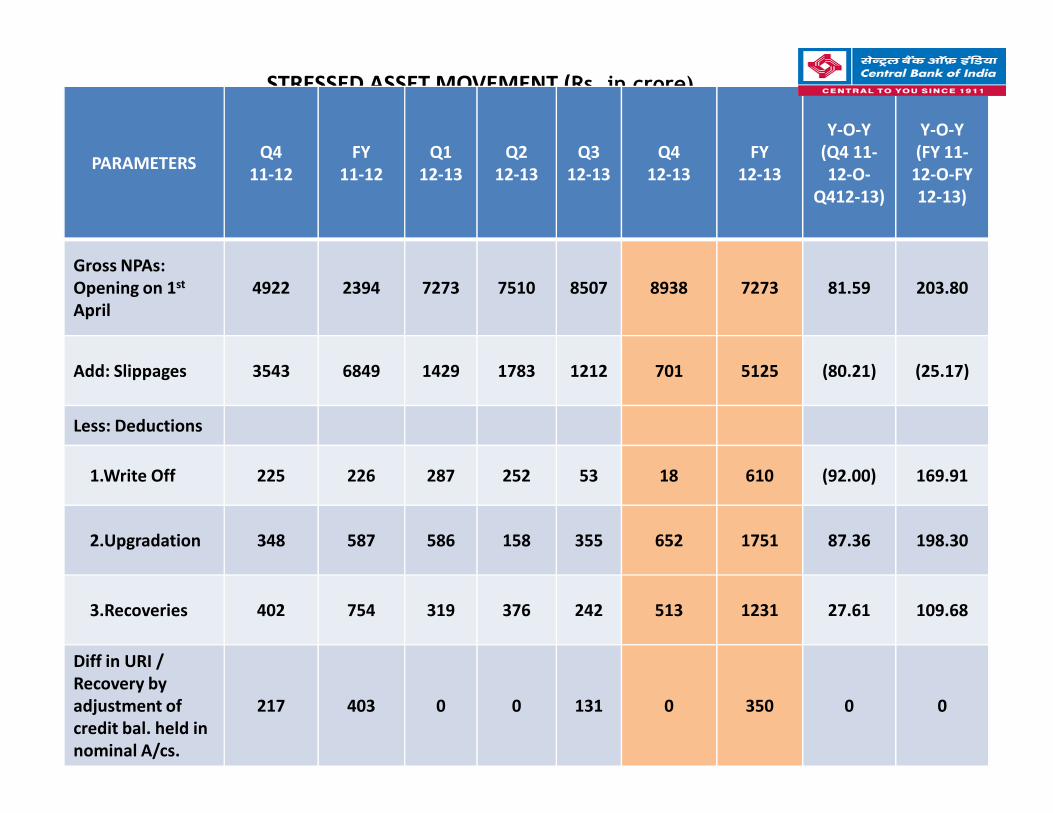
STRESSED ASSET MOVEMENT (Rs. in crore)
PARAMETERS Q4
11-12
FY
11-12
Q1
12-13
Q2
12-13
Q3
12-13
Q4
12-13
FY
12-13
Y-O-Y
(Q4 11-
12-O-
Q412-13)
Y-O-Y
(FY 11-
12-O-FY
12-13)
Gross NPAs:
Opening on 1st
April
4922 2394 7273 7510 8507 8938 7273 81.59 203.80
Add: Slippages 3543 6849 1429 1783 1212 701 5125 (80.21) (25.17)
35
Less: Deductions
1.Write Off 225 226 287 252 53 18 610 (92.00) 169.91
2.Upgradation 348 587 586 158 355 652 1751 87.36 198.30
3.Recoveries 402 754 319 376 242 513 1231 27.61 109.68
Diff in URI /
Recovery by
adjustment of
credit bal. held in
nominal A/cs.
217 403 0 0 131 0 350 0 0
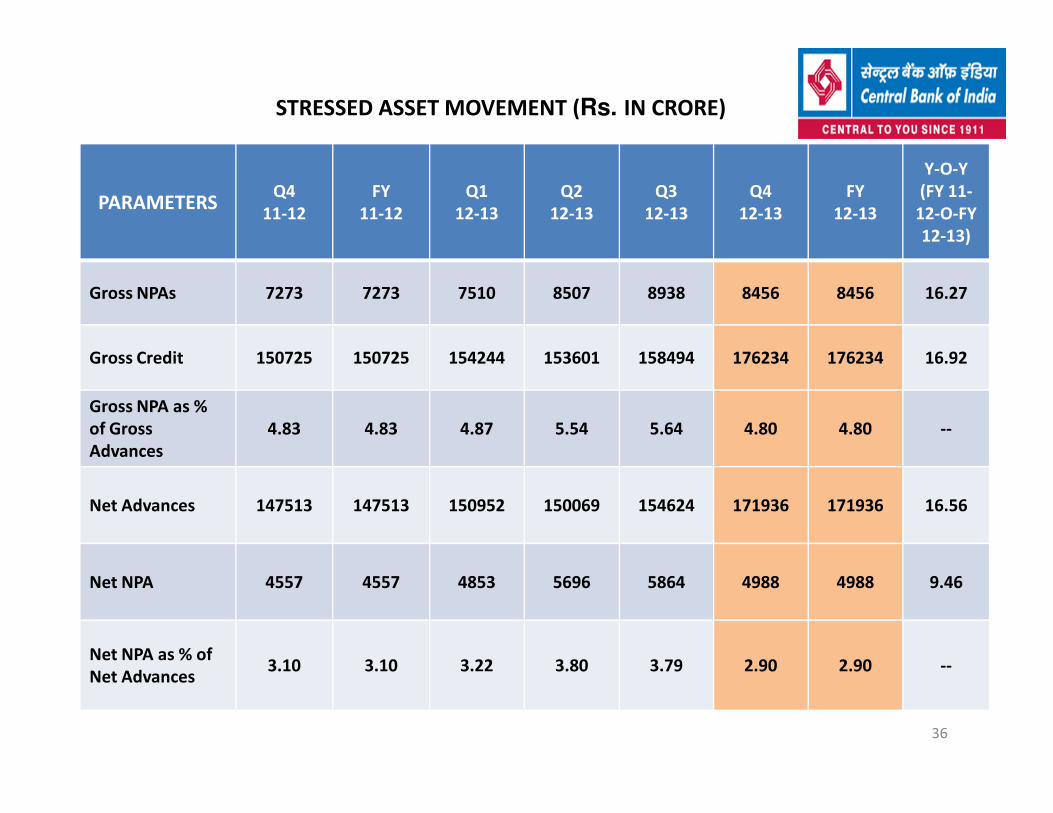
STRESSED ASSET MOVEMENT (Rs. IN CRORE)
PARAMETERS Q4
11-12
FY
11-12
Q1
12-13
Q2
12-13
Q3
12-13
Q4
12-13
FY
12-13
Y-O-Y
(FY 11-
12-O-FY
12-13)
Gross NPAs 7273 7273 7510 8507 8938 8456 8456 16.27
Gross Credit 150725 150725 154244 153601 158494 176234 176234 16.92
Gross NPA as %
36
Gross NPA as %
of Gross
Advances
4.83 4.83 4.87 5.54 5.64 4.80 4.80 --
Net Advances 147513 147513 150952 150069 154624 171936 171936 16.56
Net NPA 4557 4557 4853 5696 5864 4988 4988 9.46
Net NPA as % of
Net Advances3.10 3.10 3.22 3.80 3.79 2.90 2.90 --
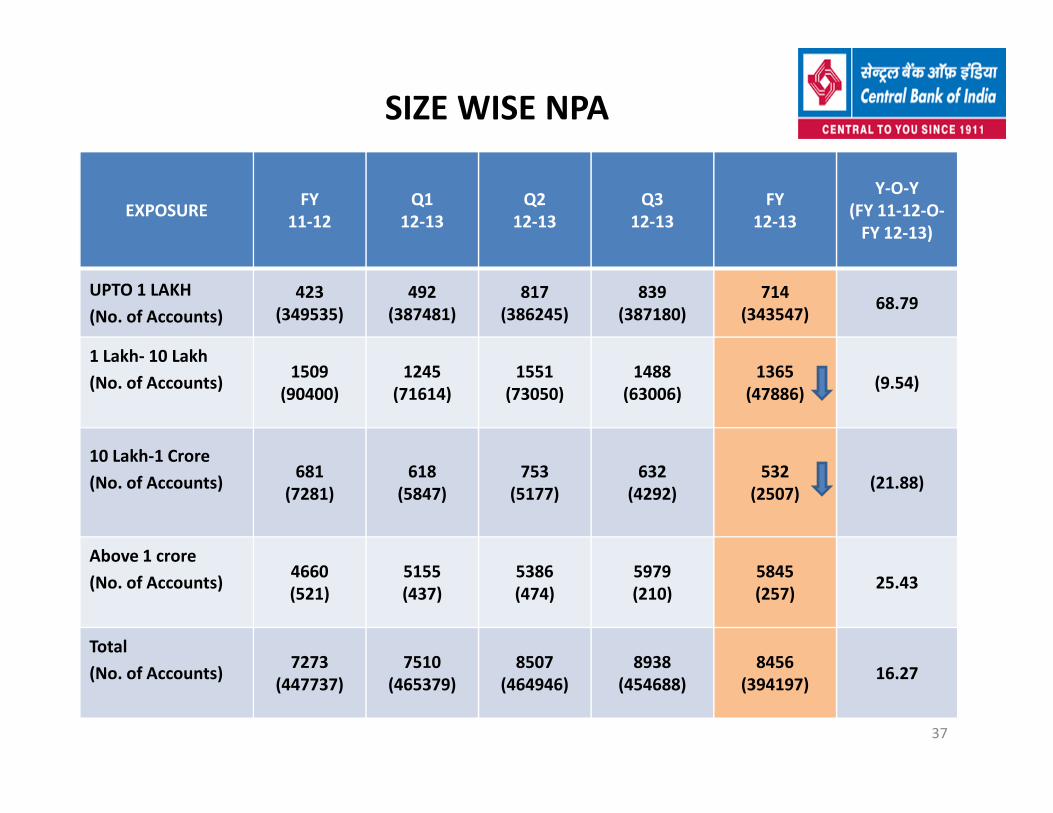
SIZE WISE NPA
EXPOSURE FY
11-12
Q1
12-13
Q2
12-13
Q3
12-13
FY
12-13
Y-O-Y
(FY 11-12-O-
FY 12-13)
UPTO 1 LAKH
(No. of Accounts)
423
(349535)
492
(387481)
817
(386245)
839
(387180)
714
(343547)68.79
1 Lakh- 10 Lakh
(No. of Accounts)1509
(90400)
1245
(71614)
1551
(73050)
1488
(63006)
1365
(47886)(9.54)
37
10 Lakh-1 Crore
(No. of Accounts)681
(7281)
618
(5847)
753
(5177)
632
(4292)
532
(2507)(21.88)
Above 1 crore
(No. of Accounts)4660
(521)
5155
(437)
5386
(474)
5979
(210)
5845
(257)25.43
Total
(No. of Accounts)7273
(447737)
7510
(465379)
8507
(464946)
8938
(454688)
8456
(394197)16.27

SECTOR- WISE NPA
SECTORFY
11-12
Q1
12-13
Q2
12-13
Q3
12-13
FY
12-13
Y-O-Y
(FY 11-12-O-FY
12-13)
POWER-GENERATION 462 276 276 305 455 (1.52)
AVIATION 391 391 455 455 375 (4.09)
INFRASTRUCTURE 592 592 592 863 789 33.28
38
INFRASTRUCTURE 592 592 592 863 789 33.28
CONSTRUCTION49 19 73 73 294 500.00
TEXTILES 433 200 131 131 404 (6.70)
TELECOM 64 70 95 95 95 48.44
OTHERS 5282 5962 6885 7016 6044 14.43
TOTAL 7273 7510 8507 8938 8456 16.27

NPA IN PRIORITY SECTOR ADVANCES (RS IN CR)
PRIORITY SECTOR
ADVANCES
FY
11-12
Q1
12-13
Q2
12-13
Q3
12-13
FY
12-13
Y-O-Y
(FY 11-12-O-FY
12-13)
AGRICULTURE 926 777 1268 1368 999 7.88
39
MSE 1595 1460 1555 1420 1317 (17.43)
OTHER PRIORITY
SECTOR 401 324 208 216 314 (21.70)
TOTAL PRIORITY
SECTOR2922 2561 3031 3004 2630 (9.99)

NPA IN RETAIL CREDIT RS. IN CRORE
TYPE
FY 11-12 Q1 12-13 Q2 12-13 Q3 12-13 FY 12-13
O/S AMT NPA AMT NPA % O/S AMT O/S AMT O/S AMT O/S AMT NPA AMT NPA %
Secured (Mortgage)
13344 693 5.19 13788 14599 15675 17082 525 3.07
Housing Loan 6282 381 6.06 6167 6695 7042 7699 266 3.45
40
Housing Loan 6282 381 6.06 6167 6695 7042 7699 266 3.45
Mortgage Loan 3372 86 2.55 3809 3997 4227 4457 99 2.22
Secured without Mortgage
980 41 4.18 1082 1268 1362 1495 34 2.27
Unsecured 2591 201 7.76 2770 3097 3325 2775 181 6.52
Grand Total 16715 935 5.59 17323 18479 19710 21352 740 3.47
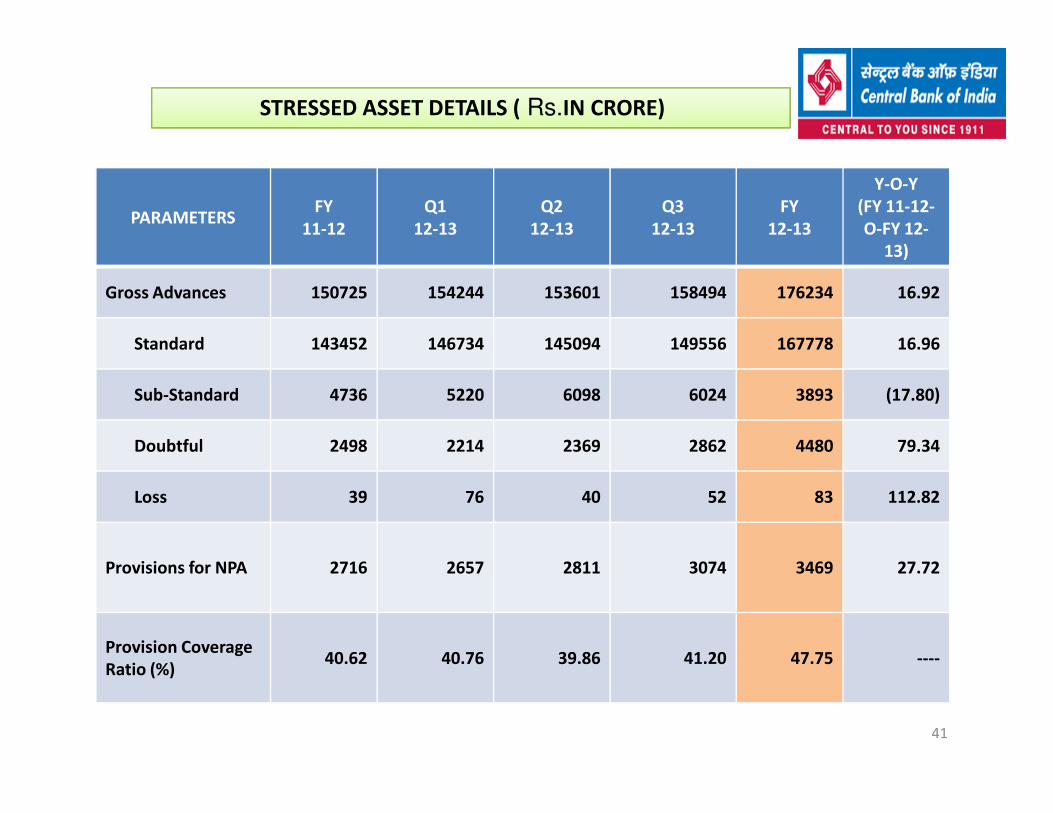
STRESSED ASSET DETAILS ( Rs.IN CRORE)
PARAMETERS FY
11-12
Q1
12-13
Q2
12-13
Q3
12-13
FY
12-13
Y-O-Y
(FY 11-12-
O-FY 12-
13)
Gross Advances 150725 154244 153601 158494 176234 16.92
Standard 143452 146734 145094 149556 167778 16.96
Sub-Standard 4736 5220 6098 6024 3893 (17.80)
41
Doubtful 2498 2214 2369 2862 4480 79.34
Loss 39 76 40 52 83 112.82
Provisions for NPA 2716 2657 2811 3074 3469 27.72
Provision Coverage
Ratio (%)40.62 40.76 39.86 41.20 47.75 ----

Exposure to Infrastructure
TYPE OF INFRASTRUCTURE FY
11-12
Q1
12-13
Q2
12-13
Q3
12-13
FY
12-13
Y-O-Y
(FY 11-12-
O-FY 12-
13)
Road 2942 3252 3362 3741 3651 24.10
% of Road to Total Infrastructure 9.43 9.90 9.86 10.63 9.68
1044 978 986 1018 1706 63.41
Continued on next slide42
Port 1044 978 986 1018 1706 63.41
% of Port to Total Infrastructure 3.35 2.98 2.89 2.89 4.52
Air-Port 879 1064 1087 1063 1223 39.14
% of Air-Port to Total
Infrastructure2.82 3.24 3.19 3.02 3.24
SUB-TOTAL
(Road/Port/Air-Port)4865 5294 5434 5822 6580 35.25
% of Road/Port/Air Port to Total
Infrastructure15.60 16.12 15.94 16.54 17.44

Exposure to Infrastructure (continued from previous slide)
TYPE OF INFRASTRUCTURE FY
11-12
Q1
12-13
Q2
12-13
Q3
12-13
FY
12-13
Y-O-Y
(FY 11-12-
O-FY 12-
13)
POWER 21432 22122 23124 23551 24956 16.44
% of Power Sector to Total
Infrastructure68.72 67.37 67.83 66.92 66.14 -
43
Telecommunication 2268 2597 2640 2751 3053 34.61
% of Telecommunication to Total
Infrastructure7.27 7.91 7.74 7.82 8.09 -
Other Infrastructure 2622 2822 2895 3067 3142 19.83
% other Infrastructure to Total
Infrastructre8.41 8.59 8.49 8.72 8.34 -
TOTAL INFRASTRUCTURE 31187 32835 34093 35191 37731 20.98
% of Total Infrastructure to Total
Loans20.69 21.29 22.20 22.20 21.41 -
Total loans 150725 154244 153601 158494 176234 16.92
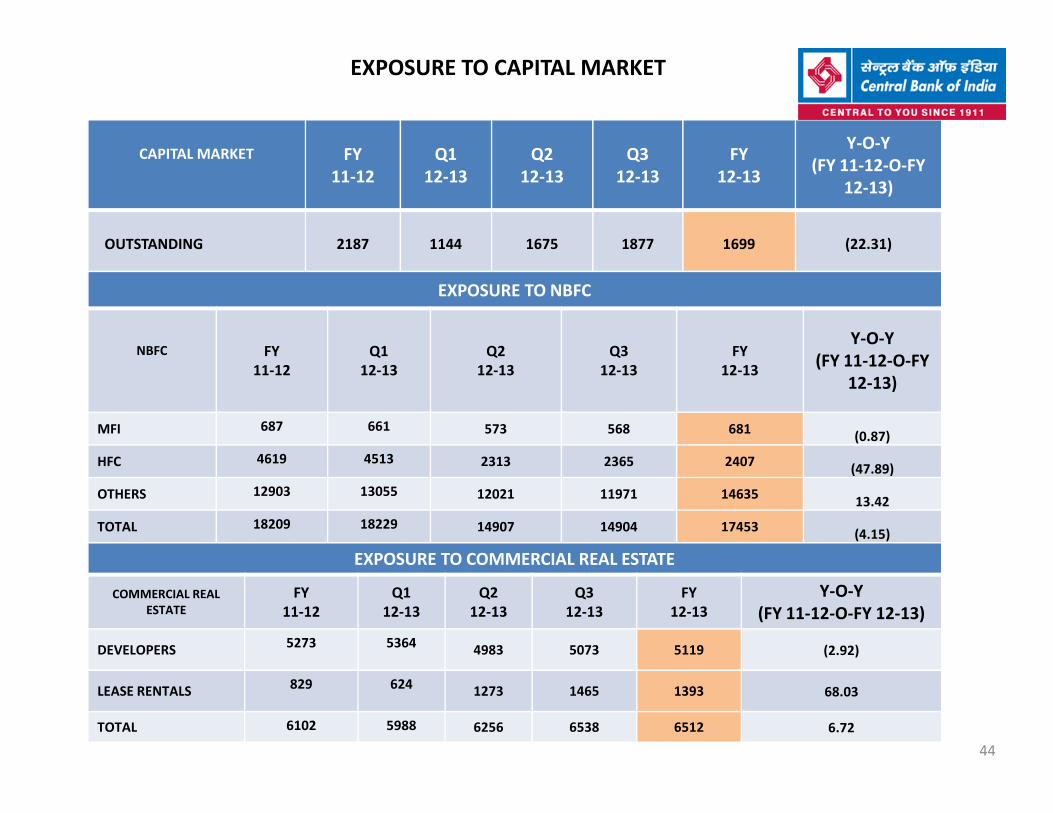
EXPOSURE TO CAPITAL MARKET
CAPITAL MARKET FY
11-12
Q1
12-13
Q2
12-13
Q3
12-13
FY
12-13
Y-O-Y
(FY 11-12-O-FY
12-13)
OUTSTANDING 2187 1144 1675 1877 1699 (22.31)
EXPOSURE TO NBFC
NBFC FY
11-12
Q1
12-13
Q2
12-13
Q3
12-13
FY
12-13
Y-O-Y
(FY 11-12-O-FY
12-13)
44
MFI 687 661 573 568 681(0.87)
HFC 4619 4513 2313 2365 2407(47.89)
OTHERS 12903 13055 12021 11971 1463513.42
TOTAL 18209 18229 14907 14904 17453(4.15)
EXPOSURE TO COMMERCIAL REAL ESTATE
COMMERCIAL REAL
ESTATE
FY
11-12
Q1
12-13
Q2
12-13
Q3
12-13
FY
12-13
Y-O-Y
(FY 11-12-O-FY 12-13)
DEVELOPERS5273 5364
4983 5073 5119 (2.92)
LEASE RENTALS829 624
1273 1465 1393 68.03
TOTAL 6102 5988 6256 6538 6512 6.72
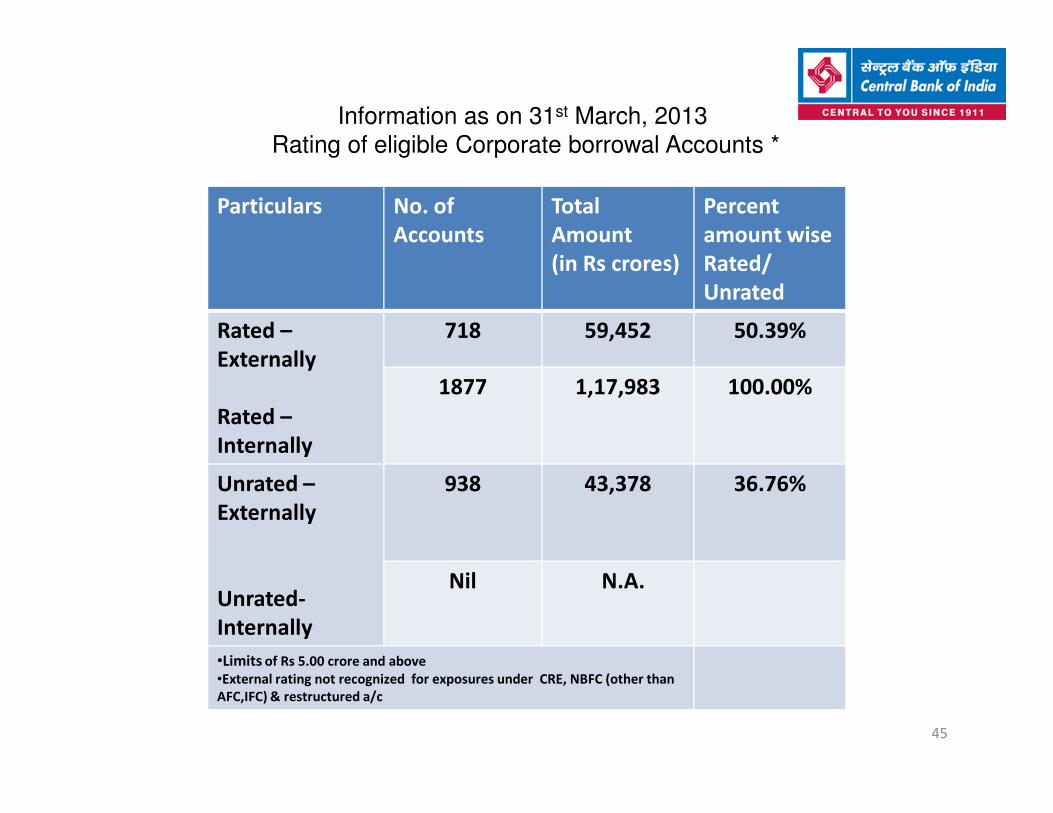
Information as on 31st March, 2013
Rating of eligible Corporate borrowal Accounts *
Particulars No. of
Accounts
Total
Amount
(in Rs crores)
Percent
amount wise
Rated/
Unrated
Rated –
Externally
Rated –
718 59,452 50.39%
1877 1,17,983 100.00%
45
Rated –
Internally
Unrated –
Externally
Unrated-
Internally
938 43,378 36.76%
Nil N.A.
•Limits of Rs 5.00 crore and above
•External rating not recognized for exposures under CRE, NBFC (other than
AFC,IFC) & restructured a/c
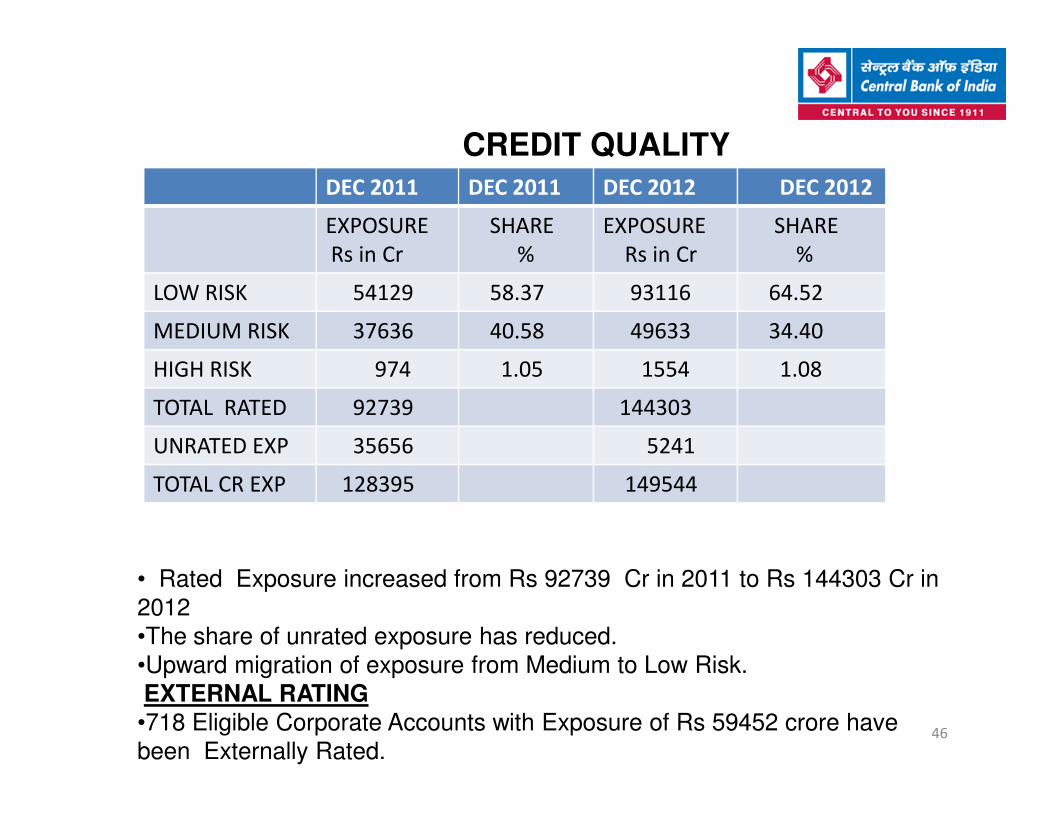
DEC 2011 DEC 2011 DEC 2012 DEC 2012
EXPOSURE
Rs in Cr
SHARE
%
EXPOSURE
Rs in Cr
SHARE
%
LOW RISK 54129 58.37 93116 64.52
MEDIUM RISK 37636 40.58 49633 34.40
HIGH RISK 974 1.05 1554 1.08
TOTAL RATED 92739 144303
CREDIT QUALITY
TOTAL RATED 92739 144303
UNRATED EXP 35656 5241
TOTAL CR EXP 128395 149544
• Rated Exposure increased from Rs 92739 Cr in 2011 to Rs 144303 Cr in
2012
•The share of unrated exposure has reduced.
•Upward migration of exposure from Medium to Low Risk.
EXTERNAL RATING
•718 Eligible Corporate Accounts with Exposure of Rs 59452 crore have
been Externally Rated.46

PARTICULARSAMOUNT
IN CRORES
TOTAL ADVANCES 176234
TOTAL RESTRUCTURED ADVANCES 22681
-OUT OF WHICH RESTRUCTURED NPA ADVANCES 2529
RESTRUCTURED ADVANCES AS ON 31.03.2013
47
STANDARD RESTRUCTURED ADVANCES 20152
% OF STANDARD RESTRUCTURED ADVANCE TO
TOTAL ADVANCES11.43
% NET STANDARD RESTRUCTURED
ADVANCE(AFTER PROVISION OFFSET)
TO TOTAL ADVANCES
10.24
47
NOTE: Restructured advances under CDR mechanism is Rs.4,919crores as on 31-03-2013.
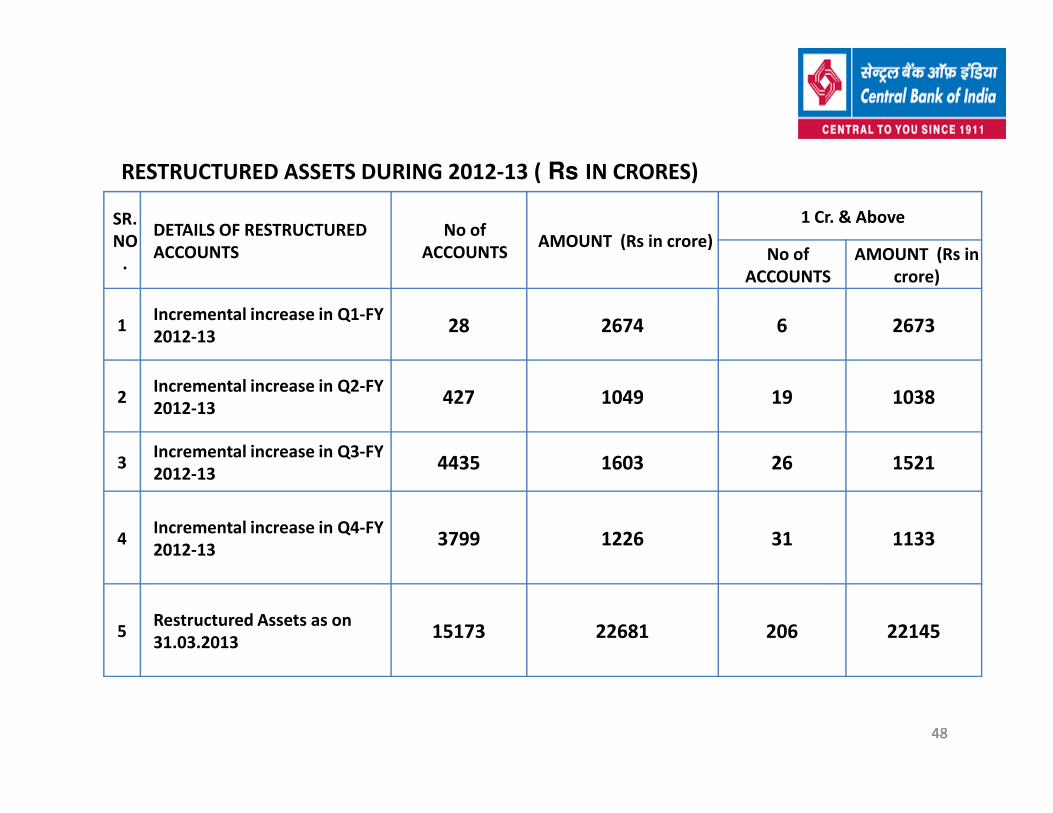
SR.
NO
.
DETAILS OF RESTRUCTURED
ACCOUNTS
No of
ACCOUNTSAMOUNT (Rs in crore)
1 Cr. & Above
No of
ACCOUNTS
AMOUNT (Rs in
crore)
1Incremental increase in Q1-FY
2012-1328 2674 6 2673
2Incremental increase in Q2-FY
2012-13427 1049 19 1038
RESTRUCTURED ASSETS DURING 2012-13 ( Rs IN CRORES)
48
2012-13427 1049 19 1038
3Incremental increase in Q3-FY
2012-134435 1603 26 1521
4Incremental increase in Q4-FY
2012-133799 1226 31 1133
5Restructured Assets as on
31.03.201315173 22681 206 22145
48

As on
Amount
outstanding
% of Restructured advance to Total advance
% of Standard Restructured Advance to Total advance
(Rs in crore) % %
31.03.2011 5254 4.02 3.64
Yearwise Restructured portfolio ( Rs IN CRORES)
49
31.03.2011 5254 4.02 3.64
31.03.2012 17347 11.51 10.15
31.03.201322681 12.87 11.43
49

PARTICULARS31.03.2011 31.03.2012 31.03.2013
Amount in crores
TOTAL ADVANCES 131407 150725 176234
TOTAL RESTRUCTURED
ADVANCES5254 17347 22681
-OUT OF WHICH
RESTRUCTURED NPA 466 2044 2529
RESTRUCTURED NPA ASSETS
50
RESTRUCTURED NPA
ADVANCES
466 2044 2529
STANDARD RESTRUCTURED
ADVANCES4788 15303 20152
%OF RESTRUCTURED NPA
ADVANCES TO TOTAL
RESTRUCTURED ADVANCES
8.8 11.8 11.1
STANDARD RESTRUCTURED
ADVANCES SLIPPED TO NPA
DURING THE YEAR
240 1496 281
% OF FRESH SLIPPAGE IN
RESTRUCTURED PORTFOLIO5 9.8 1.4
50
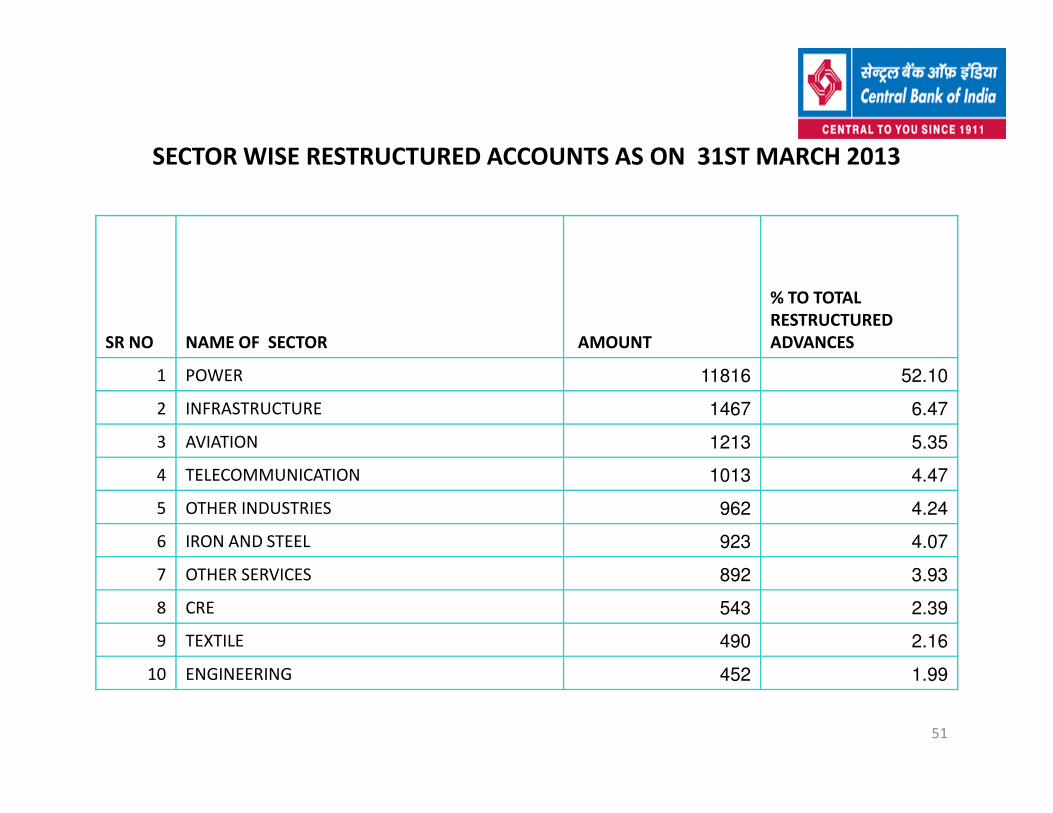
SECTOR WISE RESTRUCTURED ACCOUNTS AS ON 31ST MARCH 2013
SR NO NAME OF SECTOR AMOUNT
% TO TOTAL
RESTRUCTURED
ADVANCES
1 POWER 11816 52.10
2 INFRASTRUCTURE 1467 6.47
51
2 INFRASTRUCTURE 1467 6.47
3 AVIATION 1213 5.35
4 TELECOMMUNICATION 1013 4.47
5 OTHER INDUSTRIES 962 4.24
6 IRON AND STEEL 923 4.07
7 OTHER SERVICES 892 3.93
8 CRE 543 2.39
9 TEXTILE 490 2.16
10 ENGINEERING 452 1.99
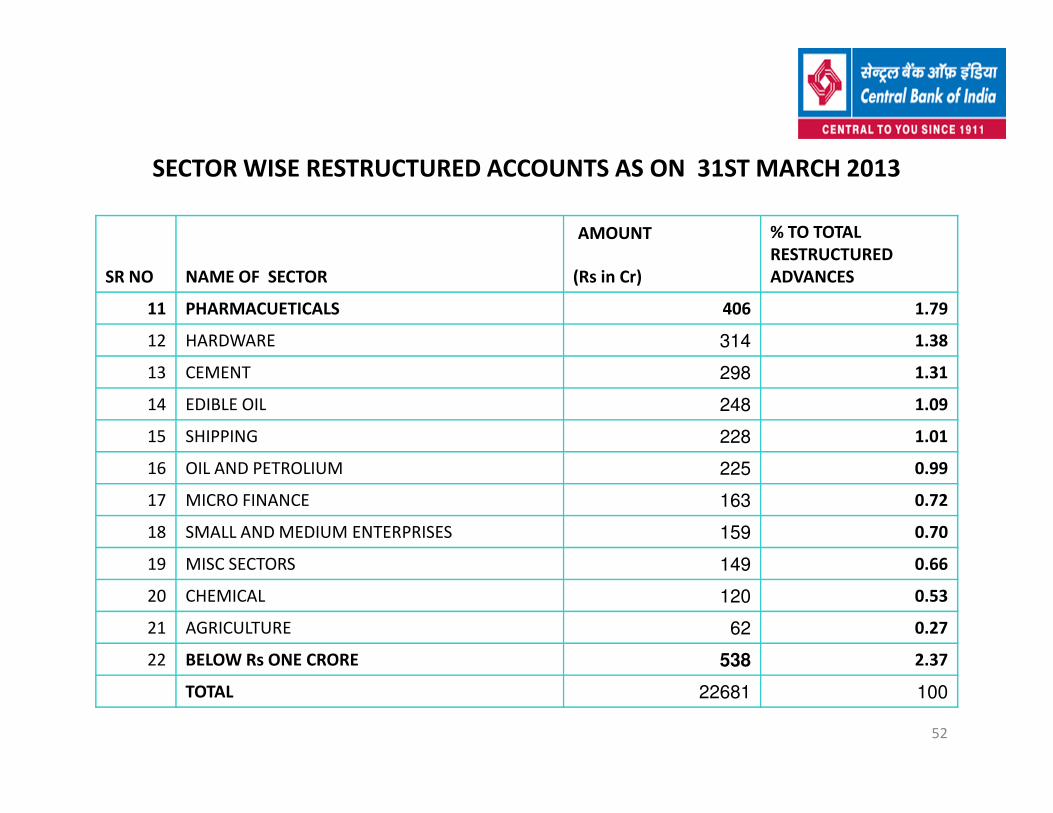
SECTOR WISE RESTRUCTURED ACCOUNTS AS ON 31ST MARCH 2013
SR NO NAME OF SECTOR
AMOUNT % TO TOTAL
RESTRUCTURED
ADVANCES(Rs in Cr)
11 PHARMACUETICALS 406 1.79
12 HARDWARE 314 1.38
13 CEMENT 298 1.31
14 EDIBLE OIL 248 1.09
52
14 EDIBLE OIL 248 1.09
15 SHIPPING 228 1.01
16 OIL AND PETROLIUM 225 0.99
17 MICRO FINANCE 163 0.72
18 SMALL AND MEDIUM ENTERPRISES 159 0.70
19 MISC SECTORS 149 0.66
20 CHEMICAL 120 0.53
21 AGRICULTURE 62 0.27
22 BELOW Rs ONE CRORE 538 2.37
TOTAL 22681 100
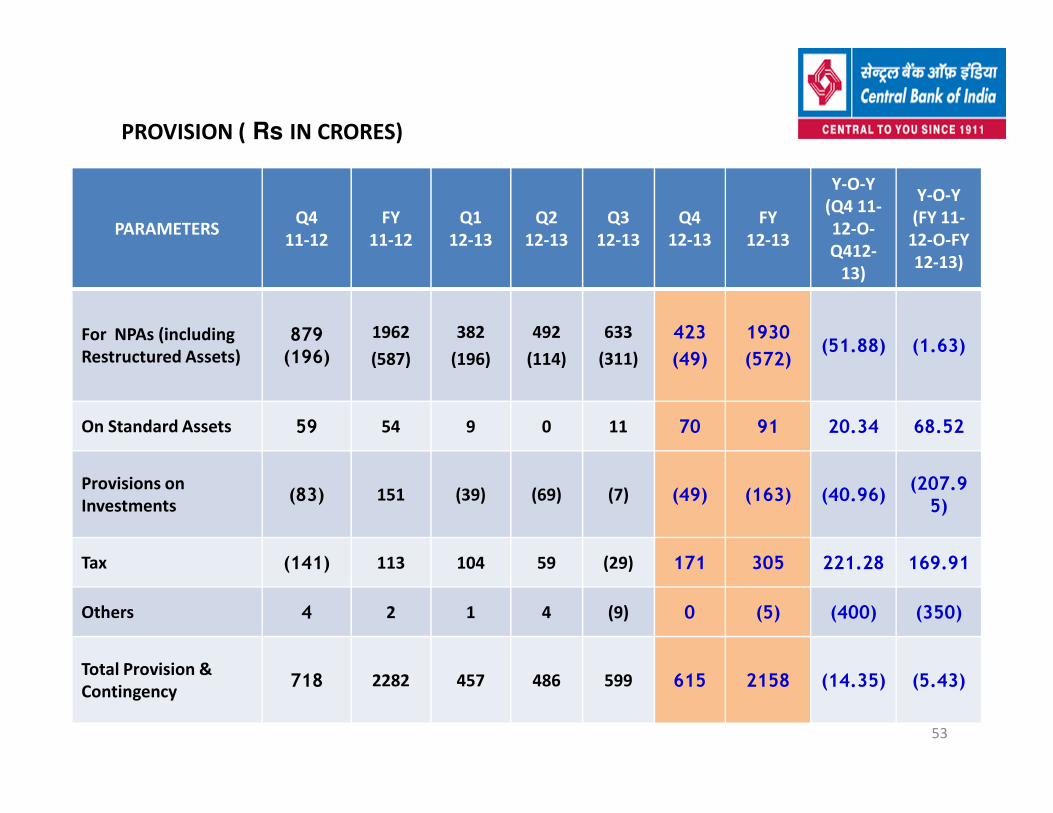
PROVISION ( Rs IN CRORES)
PARAMETERS Q4
11-12
FY
11-12
Q1
12-13
Q2
12-13
Q3
12-13
Q4
12-13
FY
12-13
Y-O-Y
(Q4 11-
12-O-
Q412-
13)
Y-O-Y
(FY 11-
12-O-FY
12-13)
For NPAs (including
Restructured Assets)
879(196)
1962
(587)
382
(196)
492
(114)
633
(311)
423
(49)
1930
(572)(51.88) (1.63)
53
On Standard Assets 59 54 9 0 11 70 91 20.34 68.52
Provisions on
Investments(83) 151 (39) (69) (7) (49) (163) (40.96)
(207.95)
Tax (141) 113 104 59 (29) 171 305 221.28 169.91
Others 4 2 1 4 (9) 0 (5) (400) (350)
Total Provision &
Contingency718 2282 457 486 599 615 2158 (14.35) (5.43)

CAPITAL ADEQUACY (%)
FY12-13
FY11-12
BASEL I
CRAR 11.33 11.96
Tier I 7.95 7.50
11.33
8.09
11.49
10
12
14
BASEL I
BASEL II
FY 2012-13
54
Tier I 7.95 7.50
Tier II 3.38 4.46
BASEL II
CRAR 11.49 12.40
Tier I 8.09 7.79
Tier II 3.40 4.61
7.95
3.38
8.09
3.4
0
2
4
6
8
TIER I TIER II CRAR
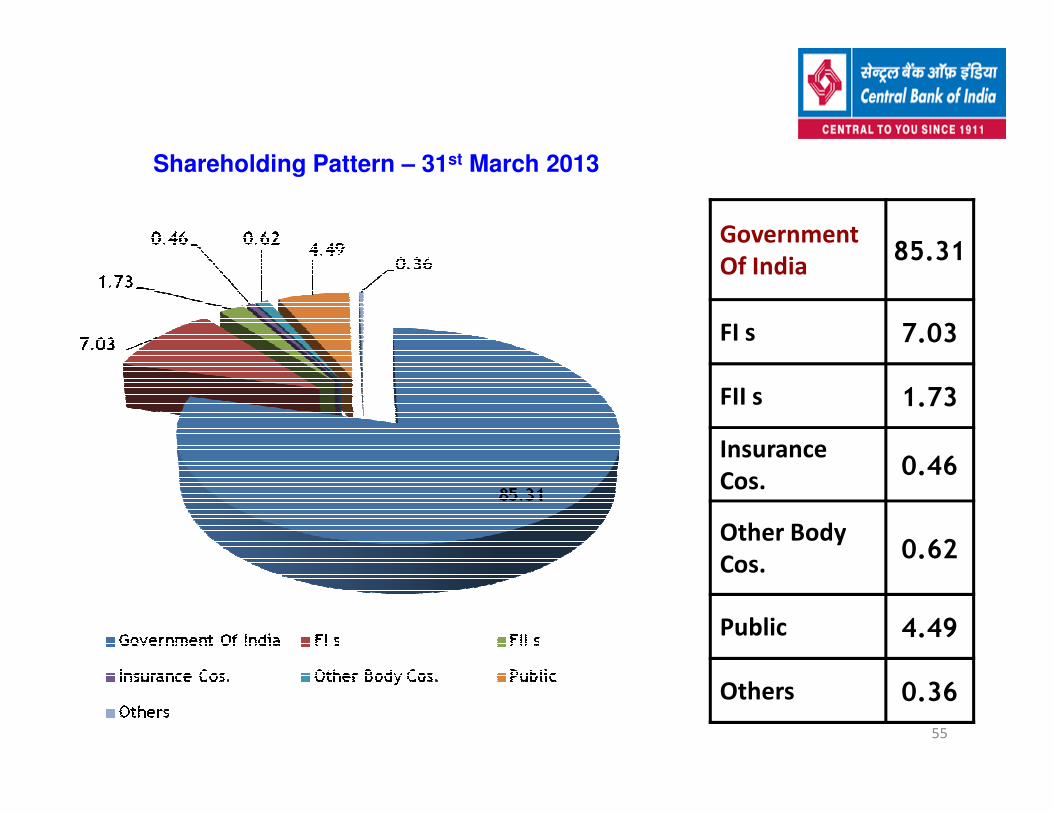
Shareholding Pattern – 31st March 2013
Government
Of India85.31
FI s 7.03
FII s 1.73
55
FII s 1.73
Insurance
Cos.0.46
Other Body
Cos.0.62
Public 4.49
Others 0.36

AWARDS AND ACCOLADES
Bank has been awarded with two prestigious Skoch Gold Awards during 2012-13
i. Innovative Urban Financial Inclusion
ii. Reaching Last Mile
“Certificate of Excellence” in establishing of “RSETI” (Rural Self Employment Training
Institute” across the country during 2011-12
“Outstanding Leadership Award” at the Institute of Public Enterprise Banking Financial
Services & Insurance, Hyderabad
“Golden Peacock HR Excellence Award-2012” for best HR practices.
“Best HR Strategies & Innovation in Employee Retention Strategies” conferred by
56
“Best HR Strategies & Innovation in Employee Retention Strategies” conferred by
Greentech Foundation.
“Outlook Money Award 2012” for Runner up in Best Housing & Education Loan
Provider.
Bank has been awarded 4th Best PSU Bank in India under “Brand Equity- Top 100 Most
Trusted Brand.
ZEE Brand Excellence Award in BFSI.
Ranking of our Bank has improved by 61 notches, moving up from 390 in 2011 to 329 in
2012 in the List of “Top 500 Banking Brands 2012’ .
Our Big Cinema credit card won best entry award in co–branded cards category at therecent Master Card Innovation awards at Kovallam, Kerala.

This year can be well considered as the year of foreign foot prints
for the bank.
Opened Rep Office in Kenya in February, 2013.
Government of India approval received to establish a joint venture
with PNB in Mozambique.
OVERSEAS EXPANSION
57
with PNB in Mozambique.
Permission obtained to open Rep Office in Hong Kong.
Exploring opening of Offices in Baharin, Doha & Dubai.

INITIATIVES
Innovative concept of Grow- Green Trees – through this, we have replaced
the mementos with Certificates having planted specific number of trees in
the wastelands of the country in association with Growtrees.com
Green Initiative measures viz.:– circulation of Board agenda papers to
directors through electronic mode, back to back printing on papers
58
Bank’s Clients greeted via SMS & E-Mails on all Festivals of National &
Regional importance.
Standardised Branding of Branches, ATMs, Kiosks, Lifts & Gates.
Branding of public transport buses & 200 Tab Cabs.
Under “Cent Sanskriti”, various CSR activities were undertaken during the
year in the field of healthcare, education, welfare of old age people &
destitutes, drought relief etc. by associating with renowned NGO’s across
the country.
INITIATIVES ( contd..)
Bouquet of Premium products in Current and Savings portfolio designed for
HNI customers launched for retention, upscaling and new HNI clients.
Customised savings product –Cent Salary Savings Scheme with inbuilt
offers, concessions and Overdraft facility launched for salaried class
Flexible RDS scheme – Cent Swashakti launched to promote savings
among customers with variable income
59
among customers with variable income
Facility of online opening of time deposit accounts to Internet Banking users
offered – being first Nationalised Bank to offer this facility.
Operationalised 21 Retail Asset Branches (RABs) all over India.
Signed MoU with renowned builders/developers for providing hassle free
home loans at special rates across the country.
Convened and participated in various property expos and other expos across
the country resulting in substantial leads in Housing loans as well as otherBank products.
INITIATIVES ( contd..)
“Cent Kalyani Scheme” for women entrepreneurs with
Concession in the interest rate between 0.25% to 0.50% .
Limit up to Rs.1.00 crore with compulsory CGTMSE coverage
Bank to bear Guarantee Fee for the First Year.
“Cent Construction Equipment Finance” for financing New -Machinery/ Equipment/ Vehicles
for construction activities with or without CGTMSE coverage.
“Cent Custom Hiring Centre” for financing of Tractors and other Agriculture Equipment to be
given on hire.
“Mukhya Mantri Yuva Swarozgar Yojna Scheme” of Madhya Pradesh State Government for
60
“Mukhya Mantri Yuva Swarozgar Yojna Scheme” of Madhya Pradesh State Government for
financing young entrepreneurs willing to set up their own enterprise.
“Central Laghu Udhyami Credit Card (CLUCC) Scheme” is modified and Rate of Interest
reduced to encourage small entrepreneurs engaged in MSE activity.
“Cent Food Processing Plus Scheme” for financing Food and Agro based Processing unit-
the scheme was modified and concessional Rate of interest is offered if the collateral security is
100% irrespective of the credit rating of the unit.
“Cent Prosperity” (For Minority Communities) for Unemployed / traditional and prospective
artisan minorities to generate continuous and sustainable employment opportunities and also to
increase income. Rate of Interest offered under the scheme is BR+0.25% upto Rs. 10 lakh.

“Financial Inclusion (FI)
As on 31 March 2013, Bank has covered 8684 unbanked villages through
4860 BCs and 116 Brick & Mortar Branches. Bank is doing FI activities in 377
districts across the country.
INITIATIVES ( contd..)
61
Number of FI accounts increased from 30.92 lacs to 40.82 lacs in 2012-13
(growth 32%)
FI Transactions through BC has increased from 6.39 lacs in 2011-12 to 22.42
lacs in 2012-13 (growth 3.51 times).
The amount of transaction through BCA has grown from Rs.16.21 crores in
2011-12 to Rs.154.40 crores in 2012-13 (growth 9.24 times)

“Direct Benefit Transfer (DBT)
Under DBT first phase, we are lead bank in two districts Hoshangabad in MP and
Amravati in Maharashtra. Out of 1.29 lacs beneficiaries list received from the
Government, accounts of 1.19 lacs (92%) beneficiaries have already been opened by the
banks.
Under DBT second phase (to be implemented from 01 July 2013) out of 78 Districts, we
INITIATIVES ( contd..)
62
Under DBT second phase (to be implemented from 01 July 2013) out of 78 Districts, we
are lead district in six districts , viz Cooch Behar (WB), Etawah (UP), Jalgaon
(Maharashtra), Jabalpur (MP), Koriya (Chattisgarh) and Kota (Rajasthan)
Bank is in the forefront to implement the coveted DBT project of the Government.
Bank is APBS live since the first day of national launch of DBT, ie on 01 January 2013.
Bank has processed 20611 DBT transfers using APBS amounting to Rs.2.08 crores.
Bank is AEPS live and AEPS payments were made in Hoshangabad and Amravati.
ACHIEVEMENTS
During the year Bank has added 847 ATMs to reach 2,529 ATMS.
E-transaction increased from 13.37% to 30% of total transactions during the year.
Debit Card base doubled from 21 lacs to 42 lacs during the year.
During the year Internet banking customer base increased from 1.81 lacs to 6.02
lacs registering an impressive growth of 233%.
63
Direct Benefits Transfer successfully implemented in 6 districts.
Bank stood 2nd in mobilizing insurance premium amongst all Bancassurance
partners of LIC with Y-o-Y growth of 32%. Bank has canvassed 1,49,668 policies with
premium of Rs. 238 crores.
Under general insurance business, Bank has mobilized 1,89,956 policies with
premium collection of Rs.83crore with Y-o-Y growth of 38%.
Bank has launched new cards viz. World Credit Card, IDA Co – Branded Credit Card
and Big Cinema Credit Card.

WAY FORWARD
CASA deposits to be raised to a level between 34% to 35%
Cent Salary Saving Scheme for employees of Corporates & Non Corporates will
be a driving force to bring in the employer’s Corporate Accounts.
Bank has robust plan to contain Gross NPA below 4.00% and Net NPA at less
than 2.50%.
50 more Retail Asset Branches will be operationalised in the FY 2013-14 directly
catering to the needs of bulk customers with tie up of reputed builders,
educational institutions and auto dealers.
64
educational institutions and auto dealers.
Planned to open additional 2,450 on site ATMs during FY 2013-14 to reach a level
of 5,000 ATM’s, out of which 100 ATMs will be disabled friendly
Debit Card base to be increased to 1 crore mark.
Poised to launch RuPay Debit Card.
Poised to launch premium Debit Card named Wonder Card with OD facility for
salaried class.
Promoting Prepaid Cards for underprivileged class, and to the beneficiaries of
Government incentives.

WAY FORWARD
Promoting online fee collection module of reputed schools, colleges and
Universities.
Thrust in Transaction Banking Activities to generate additional business.
Introducing Reward Point Programme incentivising online transactions among
the Savings account holders to promote transactions through Alternate delivery
channels in order to reduce the cost per transactions as also to save paper by
introducing incentives in the form of Reward Points to Savings Account holders.
Upgradation of existing product in line with the industry practices especially
65
Upgradation of existing product in line with the industry practices especially
Online products is the prime target- beginning with Online opening of Savings
Accounts.
Non Interest Income of our Bank to be brought at par with peer Banks.
Cross selling of mediclaim policies under general insurance to be undertaken
through our branch network.
Strengthening of Marketing Vertical at Zonal/ Regional & upto Branch level for
promoting Bank’s products & cross selling

4466