performance evaluation report - nc treasurer of trustees... · performance evaluation report second...
TRANSCRIPT

Services provided by Mercer Investment Consulting LLC
North CarolinaSupplemental Retirement Plans
Performance Evaluation ReportSecond Quarter 2017

Table of Contents
1. Capital Markets Commentary
2. Executive Summary
3. Total Plan
4. Disclaimer
Table of Contents
2

Capital Markets Commentary
3

Market Performance
Second Quarter 2017
Performance Summary
Quarter in Review
Market Performance
YTD
Source: Standard & Poor's, Russell, MSCI Barra, NAREIT, Bloomberg Source: Standard & Poor's, Russell, MSCI Barra, NAREIT, Bloomberg
DOMESTIC EQUITY
INTERNATIONAL EQUITY
FIXED INCOME
ALTERNATIVES
DOMESTIC EQUITY
INTERNATIONAL EQUITY
FIXED INCOME
ALTERNATIVES
3.0 3.1 3.1
4.7 1.3
2.7 2.1
4.1 0.3
2.5 4.4
0.7
4.3 4.1
5.8 6.1
8.1 6.3
0.2 1.4
-0.4 1.2
2.4 2.2 2.9 3.6
2.3 3.0
0.2 -3.0
-5.5
-15 -5 5 15
Russell 3000S&P 500
Russell 1000Russell 1000 Growth
Russell 1000 ValueRussell Midcap
Russell 2500Russell 2500 Growth
Russell 2500 ValueRussell 2000
Russell 2000 GrowthRussell 2000 Value
MSCI ACWIMSCI ACWI Small CapMSCI AC World ex US
MSCI EAFEMSCI EAFE Small Cap
MSCI EM
Bloomberg Barclays T-Bill 1-3 monthsBloomberg Barclays Aggregate
Bloomberg Barclays TIPS 5-10 yrsBloomberg Barclays Treasury
Bloomberg Barclays CreditBloomberg Barclays High Yield
Citi WGBIJP GBI-EM Global Div.
NAREIT Equity REITsNAREIT Global REITsHFRI FOF Composite
Bloomberg Commodity TRS&P GSCI Commodity
Returns (%)
8.9 9.3 9.3
14.0 4.7
8.0 6.0
10.6 2.0
5.0 10.0
0.5
11.5 10.4
14.1 13.8
16.7 18.4
0.3 2.3
0.9 1.9
3.7 4.9 4.5
10.4
4.9 5.4
2.6 -5.3
-10.2
-15 -5 5 15 25
Russell 3000S&P 500
Russell 1000Russell 1000 Growth
Russell 1000 ValueRussell Midcap
Russell 2500Russell 2500 Growth
Russell 2500 ValueRussell 2000
Russell 2000 GrowthRussell 2000 Value
MSCI ACWIMSCI ACWI Small CapMSCI AC World ex US
MSCI EAFEMSCI EAFE Small Cap
MSCI EM
Bloomberg Barclays T-Bill 1-3 monthsBloomberg Barclays Aggregate
Bloomberg Barclays TIPS 5-10 yrsBloomberg Barclays Treasury
Bloomberg Barclays CreditBloomberg Barclays High Yield
Citi WGBIJP GBI-EM Global Div.
NAREIT Equity REITsNAREIT Global REITsHFRI FOF Composite
Bloomberg Commodity TRS&P GSCI Commodity
Returns (%)
4

Annual GDP Growth
Macro Environment
Economic Review
World Economic Growth (Forecasts as of June 2017)
Source: Bureau of Economic Analysis
Source: Bloomberg
We expect moderate global economic growth over the intermediateterm, driven by reduced political risk in Europe and structural reformswithin emerging markets. The IMF expects global growth to increasefrom 3.1% in 2016 to 3.5% in 2017 and 3.6% in 2018.
The US economy grew at an annualized pace of 1.4% during the firstquarter. Rising household income and a recent pickup in privateinvestment spending should support growth into 2018. The USeconomy added an average of 194k jobs per month in the secondquarter, up from the 166k pace during the first quarter. Theunemployment rate reached 4.4%, down from 4.7% at the end of 2016.With the economy near full employment, it will be difficult to maintainthis pace of jobs gains. Over the past year, average hourly earningshave risen by a moderate 2.5%. Economists forecast US GDP growth of2.2% in 2017 and 2.3% in 2018.
Eurozone GDP grew by 1.7%, year-over-year, during Q1. Political risksseem to have diminished somewhat in the region, as French electionsproduced a strong mandate for a pro-Eurozone and reform mindedpresident, while the risk of a snap election in Italy declined. However, inthe UK, the Conservative Party lost its majority following the generalelection, which has added to the uncertainty surrounding Brexit.
In Japan, strong corporate earnings, coupled with modestly positiveeconomic data, supported investor sentiment. The Bank of Japan (BOJ)maintained the benchmark interest rate at -0.10% at its April meeting,while labor market data continued to remain strong.
The outlook for emerging markets remains positive, although the fall incommodity prices and political turbulence have modestly increaseddownside risks. Emerging market currencies generally appreciatedversus the dollar, providing a tailwind during a strong second quarter.
-4
-2
0
2
4
6
8
1979
1981
1983
1985
1987
1989
1991
1993
1995
1997
1999
2001
2003
2005
2007
2009
2011
2013
2015
2017
(F)
(%)
2.2 1.8
1.3
1.8
1.2
2.8
1.4
6.6 7.1
0.5
1.3
2.3
1.1 1.0 1.6
1.0
2.3
1.5
6.3
7.3
2.0 1.5
0.0
1.0
2.0
3.0
4.0
5.0
6.0
7.0
8.0
US
UK
Japa
n
Ger
man
y
Italy
Spai
n
Fran
ce
Chi
na
Indi
a
Braz
il
Rus
sia
(%)
2017 (f)
2018 (f)
5

-40
-20
0
20
40
60
1987
1989
1991
1993
1995
1997
1999
2001
2003
2005
2007
2009
2011
2013
2015
2017
(%)
Euro UK PoundYen Swiss Franc
Macro Environment
Currencies
Performance of Foreign Currencies versus the US Dollar
Source: Bloomberg
Source: Bloomberg
Currency Valuation versus US Dollar (Based on Relative PPP)
Undervalued relative to the dollar
Overvalued relative to the dollar
The dollar weakened significantly during the second quarter, with theDollar Index (DXY) falling by 4.7%. Weaker US economic data early inthe quarter relative to other regions, along with reduced prospects forfiscal stimulus, contributed to the dollar’s slide.
The euro surged against the dollar, gaining 7.3% during the quarter,benefiting from an improving growth outlook, receding political risks andthe potential for tighter ECB monetary policy. The euro’s gains duringthe first half of 2017 have reversed its losses during the second half of2016. Over the past year, the euro has gained 0.5% versus the dollar.
The Japanese yen declined 0.9% during the quarter. The Japaneseeconomy showed signs of recovery, but sentiment weakened after adownward revision to first quarter GDP. The BOJ’s dovish tone incomments regarding its ultra-accommodative monetary policy kept theyen subdued.
Most emerging market currencies gained value against the dollar duringthe quarter. Strengthening domestic conditions led to significant foreigninflows, helping to sustain the 2017 rally. The primary exception wasthe Brazilian real, which fell by 5.6% amid a new round of corruptionscandals.
The Mexican peso continued to recover from the steep declines seenlast year, gaining 3.3% during the quarter, as President Trump hasmoderated some of his statements regarding protectionist policies.
Relatively high US yields could help push the dollar higher over theshort-term. Over the longer term, rich valuations, the current accountdeficit and relatively high inflation could eventually weigh on the dollaragainst other major currencies.
7.3
-0.9
3.8
4.7
2.7
0.6
4.7
1.6
-2.2
-0.3
-5.6
3.3
8.7
4.0
5.6
6.3
3.6
6.3
5.6
2.4
4.8
6.7
-1.6
14.3 -20 0 20
Euro
Japanese Yen
GB Pound
Swiss Franc
Canadian Dollar
Australian Dollar
New Zealand Dollar
Chinese Yuan
Korean Won
Taiwan Dollar
Brazilian Real
Mexican Peso
Returns (%)
Quarter
YTD
6

Style and Capitalization Market Performance
Asset Class
US Equities – Style, Sector, Cap Performance
Sector Performance
Source: Standard & Poor's, Russell, Bloomberg
Source: Russell 1000 Sectors
Broad Market
US equities posted strong returns during the second quarter, as theeconomy continued to grow at a steady pace. However, questionsabout the sustainability of US corporate earnings and high valuationspresent downside risks for equity markets.
Market Cap
Large Caps: The S&P 500 returned 3.1% during the second quarter,lifting its year-to-date return to 9.3%.
Mid Caps: The Russell Midcap Index returned 2.7% during the secondquarter. The index has returned 8.0% year-to-date, trailing large-capsby over a percentage point.
Small Caps: Small-cap stocks returned 2.5% for the quarter and 5.0%year-to-date, lagging large-caps.
Style
Value vs. Growth: Growth continued to outperform value across themarket capitalization spectrum during the second quarter. Large-capgrowth stocks have been the best performing style in 2017, with theRussell 1000 Growth index returning 4.7% during the quarter and14.0% year-to-date.
Sector
Health care stocks were the best performing sector during the quarter,rising 7.1%. YTD, the technology sector has performed the best,returning 17.3%. A drop in oil prices contributed to a 7.0% decline inenergy stocks in Q2. Energy stocks are the worst performing sectorYTD, having shed 13.1%.
3.0
3.1
3.1
4.7
1.3
2.7
4.2
1.4
2.5
4.4
0.7
8.9
9.3
9.3
14.0
4.7
8.0
11.4
5.2
5.0
10.0
0.5
0 5 10 15 20
Russell 3000
S&P 500
Russell 1000
Russell 1000 Growth
Russell 1000 Value
Russell Midcap
Russell Mid Growth
Russell Mid Value
Russell 2000
Russell 2000 Growth
Russell 2000 Value
Returns (%) QuarterYTD
7.1
4.6
4.2
3.7
3.2
3.0
1.1
-1.7
-7.0
-7.1
16.4
9.3
7.8
17.3
9.6
11.4
7.3
0.1
-13.1
-10.3
-20 -10 0 10 20 30
Health Care
Producer Durables
Financial Services
Technology
Materials & Processing
Consumer Discretionary
Consumer Staples
Utilities
Energy
Telecomm Services
Returns (%)
QuarterYTD
7

US Equities – P/E Ratio
Asset Class
US Equities – Valuation Review
US Equities – Estimated Equity Risk Premium1 Versus Long-Term Treasuries
Source: MSCI, Bloomberg, Mercer
1 Definitions: Shiller’s P/E = Current MSCI US price/average 10-year real earnings Normalized P/E = Current S&P 500 price/(current trailing twelve month sales * 6.6% profit margin) Equity Risk Premium = Earnings yield (1/PE) minus the real yield on long-term Treasuries
Source: MSCI, Bloomberg, Mercer
The trailing P/E ratio on the MSCI US index fell slightly from 23.9 to 23.3 during the second quarter, as earnings growth outpaced the rise in stock prices. The cyclically-adjusted P/E based on 10-year average earnings (Shiller’s methodology) increased from 25.4 to 26.3, which is well above the long-term median P/E of 19.6.
The valuation case for equities relative to bonds was mostly unchanged during the second quarter. Our estimate of the prospective equity risk premium on the MSCI US index remained unchanged at 2.6%, as a modest increase in equity valuations was offset by a decline in the long-term real Treasury yield.
US equity markets advanced on the back of improving global economic data and earnings growth; however, moderate consumer spending and fading prospects for meaningful fiscal stimulus dampen the hopes for economic surprises on the upside.
The US labor market continues to show strength. The pace of job growth picked up during the second quarter, driving the unemployment rate down to 4.4%, a level that is likely near full employment. At the current pace of jobs gains, labor market conditions could become tight in the coming quarters, increasing pressures on wages. Absent a rebound in productivity growth, this could be a headwind for corporate profits.
While US equities remain rich on an absolute basis, they are reasonably priced relative to the low yields offered by high-quality bonds.
-4
-2
0
2
4
6
8
10
12
14
1953
1956
1959
1962
1964
1967
1970
1973
1975
1978
1981
1984
1986
1989
1992
1995
1997
2000
2003
2006
2008
2011
2014
2017
(%)
0
5
10
15
20
25
30
35
40
45
50
1981
1983
1985
1987
1989
1991
1993
1995
1997
1999
2001
2003
2005
2007
2009
2011
2013
2015
2017
Shiller P/E
TTM P/E
8

Mercer Investment Consulting, Inc.
6.7%
30.4%
8.5%
2.1%
20.7%
18.4%
15.0%
13.1%
19.3%
6.8%
13.4%
8.9%
18.3%
7.7%
3.0%
8.4%
17.6%
22.4%
16.4%
15.5%
7.5%
8.4%
-2.8%
20.0%
3.3%
0.1%
15.1%
11.3%
7.3%
4.8%
5.8%
3.5%
7.1%
5.0%
6.4%
7.9%
2.0%
0.2%
3.9%
7.0%
7.5%
7.6%
3.4%
2.6%
-5.0% 0.0% 5.0% 10.0% 15.0% 20.0% 25.0% 30.0% 35.0%
AUSTRALIA
AUSTRIA
BELGIUM
CANADA
DENMARK
FINLAND
FRANCE
GERMANY
HONG KONG
IRELAND
ITALY
JAPAN
NETHERLANDS
NEW ZEALAND
NORWAY
PORTUGAL
SINGAPORE
SPAIN
SWEDEN
SWITZERLAND
UNITED KINGDOM
USA
Returns
Developed Country Performance
Quarter1 Yr
Source: MSCI
9

Asset Class
International Equities – Performance Review
Global and International Equity Performance
Developed Country Performance
Emerging Market Performance
Source: MSCI, Bloomberg
Source: MSCI, Bloomberg
Source: MSCI, Bloomberg
Global equities posted positive returns during the second quarter, ledby returns from non-US stocks, particularly from European markets.The MSCI ACWI index increased 4.3% during the quarter and 11.5%year-to-date.
Global small cap equities increased 4.1%, underperforming globallarge-cap equities by 20 basis points during the second quarter. Globalsmall caps have underperformed large caps by 110 basis points year-to-date.
International developed equities posted solid gains during thesecond quarter. In $US terms, the MSCI EAFE index gained 6.1%,bringing its year-to-date return to 13.8%. In local currency terms, theMSCI EAFE index returned 2.7% during the quarter, bringing its year-to-date return to 7.6%. The MSCI Europe index and the MSCI Japanindex gained 7.4% and 5.2%, respectively, in $US terms.
International small cap equities showed strong results during thesecond quarter, returning 8.1% and outperforming international largecaps by 2.0 percentage points. Since the beginning of the year, theMSCI EAFE Small Cap index has returned 16.7%, outperforming largecaps by 2.9 percentage points.
Emerging market stocks exhibited strong performance, returning 6.3%during the second quarter. Emerging market stocks have returned 18.4%since the beginning of the year. Asia has been the best performingregion, returning 8.6% during the quarter and 23.2% year-to-date.European / Middle Eastern emerging markets also posted positiveresults, returning 1.0% during the quarter and 2.6% since the beginningof 2017. Meanwhile, Latin American emerging markets declined 1.7%during the second quarter, but remain up 10.1% year-to-date.
4.3
4.1
5.8
6.1
8.1
7.5
4.8
11.5
10.4
14.1
13.8
16.7
16.7
11.1 0 5 10 15 20
MSCI ACWI
MSCI ACWI Small Cap
MSCI AC World ex US
MSCI EAFE
MSCI EAFE Small Cap
MSCI EAFE Growth
MSCI EAFE Value
Returns (%)
QuarterYTD
2.8
2.9
0.6
7.4
4.7
6.4
9.1
8.9
7.9
5.2
-1.9
8.9
9.2
3.2
15.4
10.0
15.3
17.1
15.7
23.8
9.9
8.9 -10 0 10 20 30
North America
USA
Canada
Europe
UK
Germany
France
Italy
Spain
Japan
Australia
Returns (%)
QuarterYTD
6.3
1.0
8.6
-1.7
18.4
2.6
23.2
10.1
-15 0 15 30
MSCI EM
EM Europe & M/East
EM Asia
EM Latin America
Returns (%) Quarter YTD
10

23.3 21.4
15.8 14.9
26.3
18.0
24.8
13.1 14.2
10.3 8.3 9.2
3.1 1.8 1.4 1.7 2.0
3.3 2.0 2.4
0
5
10
15
20
25
30
MSCI US MSCI Europe MSCI Japan MSCI EM
P/E TrailingShiller P/EP/CFP/BDividend Yield
-60
-50
-40
-30
-20
-10
0
10
20
1996
1997
1998
1999
2000
2001
2002
2003
2004
2005
2006
2007
2008
2009
2010
2011
2012
2013
2014
2015
2016
2017
(%)
Global Valuations
Asset Class
International Equities – Valuation Review
Valuation of MSCI Emerging Markets to MSCI World (Based on Average of P/E, P/B and P/CF)
Source: MSCI, Bloomberg
Source: MSCI, Bloomberg
Median for the longest period available
Median since 2003
European equity valuations are expensive by historical standards,trading at 21x trailing earnings. However, valuations look morereasonable on a cyclically-adjusted basis with a P/E of 18.0. Europeanearnings remain strong, and the Eurozone economy continues to showsigns of improvement, with falling unemployment and improvedconsumer confidence. Political risks in Europe have subsided followingthe French election. However, challenges remain in the UK as TheresaMay’s Conservative party failed to retain a majority in the generalelection. This will weaken the UK’s negotiating position, and adds tothe already high level of uncertainty surrounding Brexit.
Japanese stocks appear reasonably valued, trading at 16x trailingearnings. The Bank of Japan (BoJ) maintained its highlyaccommodative monetary policy stance and kept interest ratesunchanged. It also raised its economic assessment, with an increasein the forecast for real GDP growth for the 2017-18 fiscal year.
Emerging market valuations are reasonable with a 14.9 trailing P/E.Based on a mix of valuation measures, emerging market stocks tradeat a 28% discount to developed market stocks, in-line with the mediansince 1996. This gap could narrow if macro conditions remainfavorable. Stronger global growth, accelerating exports, better domesticconditions and more supportive monetary and fiscal policies could leadto higher earnings. Risks to the outlook include a continued decline incommodity prices, a rise in protectionism, and continued politicalturbulence.
11

Treasury Yield Curve
Asset Class
Fixed Income – Interest Rates and Yield Curve
Bond Performance by Duration
Source: Federal Reserve
Source: Barclays, Bloomberg
The US Treasury yield curve flattened during the second quarter.Interest rates increased at the short end of the curve, with yields on 3-month and 1-year Treasuries rising by 27 basis points and 21 basispoints, respectively. Rates fell at the long end of the curve, with 10-yearand 30-year Treasury yields declining by 9 basis points and 18 basispoints, respectively. The changes at the short end of the curve reflectedthe 25 basis point increase in the Fed Funds rate following the Junemeeting. The decline in yields at the longer end reflects weaker inflationexpectations.
In its April and June meetings, the ECB kept rates unchanged. Asannounced in December 2016, the ECB reduced the pace of itsmonthly asset purchases in April 2017 from 80 billion to 60 billioneuros. Meanwhile, the BOJ left monetary policy unchanged in its Junemeeting, while pledging to keep asset purchases around the currenttarget of 80 trillion yen.
Monetary policy divergence across regions is likely to continue as theFed tightens, while the ECB and BOJ continue to ease, fuelingprospects of heightened currency volatility.
US Bonds generated positive returns during the second quarterdespite the Fed rate hike. The Bloomberg Barclays Aggregate BondIndex rose 1.4% for the quarter and is up 2.3% year-to-date.
Long-Duration Bonds generally outperformed shorter-duration bonds,given the decline in yields at the long end of the curve. The BloombergBarclays Long Treasury Index and the Bloomberg Barclays LongCorporate Index increased by 4.0% and 4.9%, respectively, during thequarter.
TIPS declined by 0.4% during the quarter, underperforming Treasuries,reflecting softer inflation expectations. The inflation breakeven on 10-year TIPS decreased by 24 basis points during the quarter to 1.73%.Real yields on TIPS remain positive, with the real yield on 10-year TIPSrising by 15 basis points to 0.58%.
-1.0
-0.5
0.0
0.5
1.0
1.5
2.0
2.5
3.0
3.5
4.0
3 mo 6 mo 1 yr 2 Yr 3 Yr 5 yr 7 yr 10 yr 20 yr 30 yr
(%)
Treasuries at 12/31/16Treasuries at 03/31/17Treasuries at 06/30/17TIPS at 12/31/16TIPS at 03/31/17TIPS at 06/30/17
0.2
1.2
0.7
4.0
2.4
1.4
4.7
2.5
1.5
4.9
-0.4
-0.2
0.3
1.9
1.2
5.4
3.7
2.5
6.4
3.8
2.7
6.4
0.9
1.1
-5 0 5 10
Bloomberg Barclays T-Bill 1-3 months
Bloomberg Barclays Treasury
Bloomberg Barclays Int Treasury
Bloomberg Barclays Long Treasury
Bloomberg Barclays Credit
Bloomberg Barclays Credit Intermediate
Bloomberg Barclays Credit Long
Bloomberg Barclays Corporate
Bloomberg Barclays Int Corporate
Bloomberg Barclays Long Corporate
Bloomberg Barclays US TIPS
Bloomberg Barclays TIPS 5-10 yrs
Returns (%)
QuarterYTD
12

Credit Spreads
Asset Class
Fixed Income – Credit and Non-US Bonds
Source: Barclays
Sector, Credit, and Global Bond Performance
Source: Barclays, Citigroup, JP Morgan, Bloomberg
The yield on investment-grade corporate bonds declined by 13 basispoints during the quarter to 3.2%, and the credit spread to Treasuries fellby 9 basis points to 1.1%.
The yield on high-yield bonds fell by 22 basis points to 5.8% in the secondquarter, while credit spreads declined by 18 basis points to 3.6%. Havingfallen by 370 bps since early 2015, the credit spread remains well belowthe long-term median level of 4.8%. The Bloomberg Barclays High Yieldindex has outperformed Treasuries by 306 basis points year-to-date.
US Treasuries returned 1.2% during the quarter. The Barclays Treasuryindex is now up 1.9% year-to-date.
US corporate bonds gained 2.5% during the quarter. Corporate bondsoutperformed Treasuries by 136 basis points during the quarter and by190 basis points since the beginning of the year.
US MBS, CMBS and ABS returned 0.9%, 1.3% and 0.6%, respectivelyduring the quarter. US CMBS has produced the best performance so farin 2017, returning 2.2%.
High yield bonds returned 2.2% during the quarter, as credit spreadscontinued to fall, lifting the year-to-date return to 4.9%. They haveearned an impressive 12.7% over the past year.
Global bonds posted positive results, returning 2.9% during the secondquarter. Year-to-date, the Citigroup World Global Bond index returned4.5%; however, the index remains down 4.1% over the last year.
Emerging market debt (local currency) also saw strong returns, as theindex returned 3.6% during the quarter. YTD, local EMD has returned10.4%.
0
2
4
6
8
10
12
14
16
18
20
0
1
2
3
4
5
6
7
1990
1991
1992
1993
1994
1995
1996
1997
1998
1999
2000
2001
2002
2003
2004
2005
2006
2007
2008
2009
2010
2011
2012
2013
2014
2015
2016
2017
(%)
OAS to Treasuries I/G Corporates - left scaleOAS to Treasuries MBS - left scaleHigh Yield Bond Credit Spread - right scale
Average
2.2
1.3
-0.4
2.5
2.4
1.2
0.9
1.4
0.9
0.6
2.4
2.9
4.9
2.2
0.9
3.8
3.7
1.9
1.3
2.3
1.7
1.1
6.3
4.5
-10 0 10
Bloomberg Barclays High Yield
Bloomberg Barclays CMBS
Bloomberg Barclays US TIPS
Bloomberg Barclays Corporate
Bloomberg Barclays Credit
Bloomberg Barclays Treasury
Bloomberg Barclays MBS
Bloomberg Barclays Aggregate
Bloomberg Barclays Agency
Bloomberg Barclays ABS
JP Morgan EMBI
Citi WGBI
Returns (%)
QuarterYTD
13

Asset Class
Alternatives – Performance Review
Real Asset Performance
Hedge Fund Performance
Source: HFR
Source: NAREIT, Dow-Jones, UBS, Goldman Sachs
REITs posted gains during the second quarter, although they trailedequities. US REITs returned 2.3% during the second quarter, liftingYTD returns to 4.9%. Global REITs returned 3.0% during the quarterand have gained 5.4% YTD.
Commodities generally declined during the second quarter. The priceof oil fell, as inventory levels remained high. The BloombergCommodity index fell 3.0% during the quarter and is down 5.3% YTD.The energy-heavy S&P GSCI Commodity index declined 5.5% in Q2and is down 10.2% so far in 2017. The S&P North American NaturalResources Sector index fell 7.1% during the quarter, bringing YTDlosses to 11%.
Hedge fund of funds produced muted results during the secondquarter, returning 0.2% and 2.6% year-to-date. Returns across moststrategies were positive for the quarter. Event-driven strategiescontinued to perform well, returning 1.8% during the quarter and 4.3%year-to-date. Distressed/restructuring strategies returned 0.6% for thequarter and are up 3.2% year-to-date. The HFRI Equity Hedge indexreturned 2.3% for the quarter and 6.2% year-to-date. Macro strategieslagged during the second quarter, with the HFRI Macro Index falling0.7%.
2.3
3.0
-3.0
-5.5
-6.4
-7.1
4.9
5.4
-5.3
-10.2
-2.7
-11.0
-20 -10 0 10
NAREIT Equity REITs
NAREIT Global REITs
Bloomberg Commodity TR
S&P GSCI Commodity
Alerian Energy MLP TR
S&P NA Natural Resources
Returns (%)
Quarter
YTD
0.2
0.7
-0.6
1.4
1.1
2.3
1.8
0.6
0.6
-0.7
2.6
1.9
1.3
5.3
3.7
6.2
4.3
3.2
2.9
-0.8
-5 0 5 10
HFRI FOF Composite
HFRI FOF: Conservative
HFRI FOF: Diversified
HFRI FOF: Strategic
HFRI Fund Weighted Composite
HFRI Equity Hedge (Total)
HFRI Event-Driven (Total)
HFRI ED: Distressed/Restructuring
HFRI Relative Value (Total)
HFRI Macro (Total)
Returns (%)
Quarter
YTD
14

Executive Summary
15

Executive Summary
Fund Changes/ Performance Updates
Domestic equities continued their rise in the second quarter, as a result of strong quarterly earnings and better than expected economic growth. The Russell 3000 Index gained 3.0% and has posted positive results in 17 of the last 18 quarters. Less economically sensitive growth stocks continued to lead the market in the second quarter, particularly those within the health care and information technology sectors. The energy sector continued its downslide during the quarter, as oil prices fell due to a higher inventory. The spread between growth and value oriented securities was significant across all market capitalizations but it was most pronounced in small/mid cap stocks. Year-to-date, growth stocks have outperformed their value counterparts by at least 850 basis points across all market capitalizations. Active management was again strong after a disappointing 2016, with a majority of domestic indices ranking in the bottom half of their respective peer group universes.
International equities gained 5.8% during the quarter and outpaced their domestic counterparts by 280 basis points. International equities benefited from receding political risks, an improved growth outlook and a depreciating U.S. dollar. From a regional perspective, this was the strongest quarterly result for Europe since 2010. The U.S. dollar depreciated against all major currencies during the quarter, with the exception of the Japanese yen, which created a tailwind for US dollar-based investors. Emerging markets continued their rally during the quarter and are now up 18.4% year-to-date. The Asian region was the key driver of performance during the quarter while the Latin American region was a slight detractor, largely driven by the underperformance of Brazil and oil price declines.
Within fixed income, the Treasury yield curve flattened during the second quarter. At the short end of the curve, the Fed raised the target Federal Funds rate, while intermediate and long- term yields slightly declined. Corporate bond outperformed Treasury securities, as investment grade supply slowed while demand remained healthy. Mortgage-related securities trailed corporate bonds, as the Fed announced its strategy for shrinking its $4.5 trillion balance sheet later this year. High yield spreads continued to compress during the quarter and are now well below their long-term median of 4.8%. Emerging market debt was the top performing segment within the fixed income market during the second quarter. Similar to emerging market equities, emerging market debt benefited from currency appreciation and capital inflows.
The State of North Carolina Supplemental Retirement Plan had a strong second quarter, as all active funds posted positive results and outperformed their respective indices. Active managers have performed extremely well year-to-date, as larger capitalization growth oriented equities have come back in favor. Eight of the nine active Funds have outperformed their respective indices and a majority have ranked in the top quartile of their peer group universes. The Large Cap Growth Fund benefited from the strong performance of growth oriented securities and was the top absolute and relative performer during the second quarter. The Fund was largely driven by the strong results of concentrated managers, Sands and Loomis, both of which had overweight positions to the strong performing information technology sector. After a difficult 2016, the Large Cap Growth Fund rebounded to start 2017 and outperformed the Russell 1000 Growth Index by 530 basis points. The International Equity Fund returned 6.4% during the quarter, primarily driven by the strong performance of growth oriented manager, Baillie Gifford. Value focused international equity manager, Mondrian, struggled during the quarter, as their dividend focused investment approach was out of favor during the growth rally. The Global Equity Fund outperformed the MSCI ACWI benchmark by 80 basis points despite the Fund’s overweight position to the underperforming US region. The Fixed Income Fund outperformed the Bloomberg Barclays Aggregate benchmark by 40 basis points, driven by the outperformance of Prudential. Spread sectors outperformed Treasury securities during the second quarter, which aided Prudential. Additionally, Prudential’s out of benchmark exposure to high yield debt was a contributor, as high yield spreads continued to compress.
Mercer Investment Consulting, Inc.
16

Executive Summary
Additional Manager Analysis
Baillie Gifford (Manager 2Q Return vs. Benchmark) Baillie Gifford returned 9.2% which outperformed the benchmark by 320 basis points and ranked in the top decile of its peer group universe. Baillie Gifford utilizes a bottom-up approach, based on fundamental research, with a focus on identifying quality growth stocks that have an identifiable competitive advantage. The strategy seeks stocks that can sustain above average growth in earnings and cash flow. The strategy focuses on a longer-term approach and will generally have lower turnover. Baillie Gifford has a team of regional and global sector research analysts who work with their internal portfolio construction group that takes the best ideas and places them in a holistic international context. During the quarter, international equities outperformed domestic equities, driven by stronger than expected growth and US dollar depreciation. Baillie Gifford’s strong second quarter result was somewhat expected given their bias towards growth oriented securities. Growth oriented securities have been in favor to start the year and have significantly outperformed their value counterparts. Baillie Gifford’s growth orientation is evident in the strategy’s information technology positioning, which is nearly double that of the benchmark. This overweight position to the information technology sector drove relative results during the quarter. Additionally, having no exposure to the weak performing energy sector was beneficial, as oil prices continued to decline. On a security level, Ryanair was the portfolios top contributor, as the company shares rose as a result of increasing passenger numbers and price leadership. Baillie Gifford remains focused on their fundamental bottom-up process but remain cognizant of the macro-environment. Over the trailing-year, the strategy outperformed the benchmark by 530 basis points and ranked in the top quartile of the peer group universe.
Macquarie (Formerly Delaware) Large Cap Value (Manager 2Q Return vs. Benchmark) Macquarie returned -0.2% which trailed the Russell 1000 Value Index by 150 basis points and ranked in the bottom decile of the peer group universe. The strategy’s investment philosophy focuses on human emotion and crowd psychology in stock prices. The team utilizes exhaustive, bottom-up fundamental research to capitalize on discrepancies between their estimate of intrinsic value and current stock prices. The team will typically buy at times of excessive pessimism and will sell at times of undue optimism. The strategy tends to be concentrated, typically holding between 30-35 equal weighted positions and will tend to have a bias towards higher quality companies. During the second quarter, Macquarie struggled as a result of their poor stock selection and overweight position in the energy sector. Oil prices continued their slide in the second quarter and this negatively impacted the energy sector. On a relative basis, Marathon Oil was the worst performing holding during the quarter, as the stock fell by roughly 25%. Macquarie’s focus on higher quality companies tends to protect more on the downside and this has been a key headwind in 2017. Growth oriented securities have led the market by a wide margin and we would expect Macquarie’s contrarian approach to struggle during this type of market environment. We still have confidence in the team and process and expect them to outperform over a full market cycle.
Manager Updates
Mercer met with Baillie Gifford to review their ACWI ex US Alpha strategy. We like the fact that Baillie Gifford has a consistent philosophy across the firm and the firm's research effort is devoted to this, there is no distraction of having to find ideas that meet the needs of different philosophies. The stability of the investment teams at senior level helps preserve the Baillie Gifford culture, notably the focus on the long-term and the apparent collaborative approach. The ACWI ex-US Alpha strategy relies on the generation of ideas from the regional and global sector research analysts, whom we regard highly and who are generally long-term veterans of Baillie Gifford. The Portfolio Construction Group (PCG) takes the best of the ideas from these teams and places them in a holistic international context. We maintained the “A” rating on the strategy as a result of the meeting.
Mercer Investment Consulting, Inc.
17

Executive Summary
Mercer met with EARNEST Partners at their Atlanta headquarters to review their Small Cap Value strategy. We recommend maintaining the B+ rating for EARNEST Partners’ Small Cap Value strategy. The uniqueness of the firm’s front-end quantitative screen, the depth and quality of the fundamental analysts, and the attention to risk management are key strengths of the strategy. While the firm employs a deep bench of investment professionals, we feel its team-based structure designed to serve multiple strategies, along with its risk management controls, may inhibit analysts’ best ideas from being fully embraced when constructing portfolios.
We were informed by Macquarie Investment Management (MIM) that after a lengthy search process (15 months and 360 original applicants), the Large Cap Value Focus team hired Erin Ksenak as an equity analyst, replacing Anthony Lombardi who left in February 2016. Ksenak has seven years of industry experience and joined most recently from Affinity Investment Advisors where she was a portfolio manager. This news has no immediate impact on our views or “A (T)” rating for the strategy. We are pleased to learn that the Large Cap Value Focus team has completed their search. We are also pleased to observe that Ksenak fits the basic parameters of experience (five to ten years) and perceived cultural fit the team shared with us earlier in the search process. We look forward to meeting Ksenak at our onsite visit later this year.
Jay Jacobs, President and Managing Director of PIMCO, has decided to retire from the firm at the end of September. Jacobs’ role as President was to oversee the internal facing aspects of the firm, a role he took on in the wake of the departure of former CEO Mohamed El-Erian in January 2014. He had previously been responsible for Talent Management. While this is a headline departure from the firm, we are comfortable that this will not impact the investment capabilities that we rate. At the same time it must be noted that Jacobs’ departure adds to a growing concern that staff at PIMCO may be overcompensated given the observed pattern of senior personnel retiring at a relatively young age. In CEO Manny Roman, we believe PIMCO have an individual experienced at running the business on both investment and operational fronts. The fact that two veteran PIMCO operations personnel are stepping into co-COO roles appears to us to be a sensible move, and should serve to minimize disruption further down the hierarchy. We propose no rating changes on the back of this news.
Mercer met with Sands to discuss their Large Cap Growth strategy. The Select Growth Equity strategy benefits from the skill and leadership of its portfolio managers and the experience and depth of the research analysts. Sands Capital Management (Sands) follows a well-defined process to identify leading growth companies that have staying power to grow faster than the benchmark for a sustained period of time. The thoroughness of their fundamental research is a competitive advantage, as it helps validate the firm's views on the long-term durability of businesses. It also gives Sands the confidence to manage concentrated strategies. Given the strategy's loose constraints and concentrated nature, tracking error can be high at times; thus, a Tracking Error designation (T) is assigned to this strategy’s “A” rating. Short-term deviations relative to the benchmark can be quite significant and clients invested in this strategy should be willing to embrace a long-term investment horizon.
Mercer met with TCW to review their Core Plus fixed income strategy. We continue to be impressed with the strength of the investment team and the analytical tools employed by TCW. The team employs a top-down investment process that is opportunistic, with greater emphasis on low absolute return volatility, rather than low tracking error. While recent performance of the associated strategies has been underwhelming, we have not lost our faith in the team’s philosophy and process. As a more defensive manager, TCW promises its investors superior draw down protection during economic downturn, and tends to underperform in markets where riskier issues rally. Because 2016 was marked by riskier issues rallying, we did not anticipate TCW’s strategies to thrive. As the team continues to anticipate the coming of a debt driven economic recession, it continues to maintain defensive credit positioning across all strategies. However, TCW has positioned itself for this event for some time now, which may continue to lead to underwhelming performance. If such is the case, we will reevaluate our opinions at the appropriate time. We maintained the “A” rating as a result of the meeting.
Mercer Investment Consulting, Inc.
18

Executive Summary
We were recently informed by TimesSquare Capital Management (TSCM) of their decision to part ways with domestic Energy analyst Matt D’Alto (who joined TSCM in 2011). TSCM currently has no intention of hiring a direct replacement for D’Alto. As a result, oversight for U.S. Energy stocks has been assumed by Small Cap and All Cap co-portfolio manager Ken Duca, who covered the sector for TSCM from 2000 - 2011. Note that in addition to his co-portfolio management responsibilities, Duca also covers the Business Services and Transaction Processing groups. We are not recommending rating changes to TSCM’s domestic strategies at this time. In response to this news from TSCM, we held a call with portfolio manager Tony Rosenthal. Although staff turnover often raises questions regarding a firm’s cultural health and stability, we believe TSCM’s decision to part ways with D’Alto was done for the future benefit of the strategies (stock selection across domestic strategies has been challenged in the Energy sector over the past five years
Mercer met with TimesSquare Capital Management to review their SMID Cap Growth strategy. Our favorable opinion of TSCM's SMID Cap Growth strategy is based on a tenured, cohesive and stable portfolio management team, a proven and repeatable investment process, the strength of a deep, sector/industry specialized fundamental research effort, and the backing of a well-managed and properly incentivized investment organization. The quality of the research coupled with the stability and experience of portfolio managers Grant Babyak and Tony Rosenthal executing on a tenured philosophy and process are key strengths. As a result of the meeting, Mercer maintained the “A” rating on the strategy.
Wellington informed Mercer that as of May 12, 2017, the US Securities and Exchange Commission (SEC) notified the firm that it was opening an investigation into some aspects of its private company investment activities. The investigation appears to be focused on private equity investments and associated valuation practices. Wellington believes that its procedures and practices are robust and meet regulatory obligations in all the markets in which it does business. It intends to cooperate fully with the SEC in this inquiry. We do not regard this news as directly impacting the investment capabilities of Wellington and do not propose any rating changes on Wellington’s strategies. We will keep the field abreast of any further developments related to this issue as they occur.
Wellington announced that Stephen Klar will join Brendan Swords (Chaiman & CEO) and Jean Hynes (portfolio manager and research analyst) as one of three Managing Partners (MP) of the firm. Klar will replace Phil Perelmuter, who has served in the role as Managing Partner for 11 years and will be stepping down to focus his time on other responsibilities. Klar leads the firm’s Fixed Income Portfolio Management and Research group and will continue in that capacity. This news does not impact Wellington’s investment capabilities, and we are not proposing any changes to the firm’s rated strategies. Our understanding is that MPs typically rotate every 10 years and are elected to oversee management of the firm’s partnership, functions of which include partner reviews and the distribution of partner-level profits. The MPs are not involved with the strategic direction or business management aspects of the firm.
Mercer Investment Consulting, Inc.
19

© MERCER 2017
N C C U R R E N T I N V E S T M E N T S T R U C T U R ETier I
Target Date Funds Tier II - A
Passive Core Options Tier II - B
Active Core Options Tier III
Specialty Options
Goal Maker
Stable Value Fund Galliard Stable Value
Fixed Income BlackRock Debt Index
Fixed Income Fund TCW Core Plus
Prudential Core Plus
Inflation Responsive Fund PIMCO IRMAF
Large Cap Equity BlackRock Equity Index
Large Cap Value Fund Hotchkis & Wiley Large Cap Value
Macquarie Large Cap Value Boston Partners Large Cap Value
Large Cap Growth Fund Sands Capital Large Cap Growth Wellington Opportunistic Growth
Loomis Large Cap Growth
Small/Mid Cap Equity BlackRock Russell 2500 Index
Small/Mid Cap Value Fund Hotchkis & Wiley SMID Value
Earnest Partners SMID Cap Value Wedge SMID Cap Value
Brokerage Window
Small/Mid Cap Growth Fund TimesSquare SMID Growth
Brown Advisory SMID Growth
Global Equity Fund Wellington Global Opportunities Arrowstreet Global Equity ACWI
International Equity BlackRock ACWI ex US Index
International Equity Fund Baillie Gifford ACWI ex US Growth
Mondrian ACWI ex US Value
20

Mercer Investment Consulting, Inc.
A B C D E F G H I
C+D+E B*F F-H
Funds and Sub-Advisors Assets Inv. Mgmt. FeeCustodial Expenses1 NC Budget2
Total Estimated
Expense (%)
Total Estimated Expense ($)3
Mercer Median
Expense 4Difference
North Carolina Stable Value Fund5 $2,496,799,734 0.333% 0.001% 0.025% 0.359% $8,964,781 0.42% -0.06% F-H Galliard $2,496,799,734 0.333% 0.000% $8,314,343 0.42% -0.09% C-H
North Carolina Fixed Income Passive Fund $471,776,749 0.020% 0.002% 0.025% 0.047% $221,741 0.20% -0.15% BlackRock $471,776,749 0.020% 0.000% $94,355 0.02% 0.00%
North Carolina Fixed Income Fund $694,702,567 0.158% 0.006% 0.025% 0.189% $1,316,212 0.49% -0.30% 50% TCW6 $347,077,035 0.166% 0.000% $576,866 0.25% -0.08% 50% Prudential $347,625,532 0.150% 0.000% $521,438 0.25% -0.10%
North Carolina Inflation Sensitive Fund $438,307,108 0.700% 0.002% 0.025% 0.727% $3,186,239 0.82% -0.09% PIMCO $438,307,108 0.700% 0.000% $3,068,150 0.82% -0.12%
North Carolina Large Cap Passive Fund $1,494,328,354 0.005% 0.000% 0.025% 0.030% $444,403 0.20% -0.17% BlackRock $1,494,328,354 0.005% 0.000% $74,716 0.01% -0.01%
North Carolina Large Cap Value Fund $994,138,045 0.340% 0.008% 0.025% 0.373% $3,711,353 0.70% -0.33% 33.3% Hotchkis & Wiley $333,307,264 0.400% 0.000% $1,333,229 0.43% -0.03% 33.3% Macquarie $328,212,922 0.284% 0.000% $931,426 0.43% -0.14% 33.3% Boston Partners $332,617,859 0.338% 0.000% $1,122,854 0.43% -0.09%
North Carolina Large Cap Growth Fund $1,004,944,427 0.395% 0.008% 0.025% 0.428% $4,303,739 0.75% -0.32% 33.3% Sands Capital Management $333,777,678 0.450% 0.000% $1,502,000 0.46% -0.01% 33.3% Wellington Management Company $334,717,146 0.350% 0.000% $1,171,510 0.57% -0.22% 33.3% Loomis Sayles $336,449,603 0.386% 0.000% $1,299,349 0.46% -0.07%
North Carolina SMID Cap Passive Fund $262,777,703 0.005% 0.005% 0.025% 0.035% $91,389 0.25% -0.22% BlackRock $262,777,703 0.005% 0.000% $13,139 0.02% -0.02%
North Carolina SMID Value Fund $538,459,194 0.536% 0.015% 0.025% 0.576% $3,099,550 0.93% -0.35% 33.3% Hotchkis & Wiley $179,411,704 0.500% 0.000% $897,059 0.60% -0.10% 33.3% EARNEST Partners $177,909,316 0.470% 0.000% $836,174 0.71% -0.24% 33.3% WEDGE Capital Management $181,138,174 0.638% 0.000% $1,155,691 0.71% -0.07%
North Carolina SMID Growth Fund $418,837,373 0.590% 0.013% 0.025% 0.628% $2,629,223 0.94% -0.31% 50% TimesSquare Capital Management $210,100,698 0.649% 0.000% $1,363,043 0.75% -0.10% 50% Brown Advisory $208,736,675 0.531% 0.000% $1,107,458 0.77% -0.24%
North Carolina International Passive Fund $57,037,794 0.025% 0.028% 0.025% 0.077% $44,165 0.35% -0.27% BlackRock $57,037,794 0.025% 0.000% $14,088 0.06% -0.04%
North Carolina International Equity Fund $648,267,683 0.442% 0.008% 0.025% 0.476% $3,082,749 0.91% -0.43% 50% Baillie Gifford $326,793,643 0.438% 0.000% $1,432,175 0.57% -0.13% 50% Mondrian Investment Partners $321,474,040 0.447% 0.000% $1,435,896 0.57% -0.13%
North Carolina Global Equity Fund $948,922,862 0.544% 0.004% 0.025% 0.573% $5,437,059 0.94% -0.37% 50% Wellington Management Company $477,354,192 0.500% 0.000% $2,386,771 0.55% -0.05% 50% Arrowstreet $471,568,670 0.587% 0.000% $2,768,628 0.55% 0.04%
Total $10,469,299,593 0.319% 0.005% 0.025% 0.349% $36,532,603 0.577%
6 IM Fee includes 3 Month Fee Holiday
1Quarterly custodian expenses paid to BNY Mellon - (Annualized)
3Manager fee estimates reflect investment management fee only, does not include $31 per participant record-keeping fee.
2The cost of the budget associated with the management of the Supplemental Retirement Plans, borne by each investment option in proportion to the pro-rate share of the applicable assets in that fund.
4Total Fund median expenses are compared against their respective Mercer Mutual Fund Institutional Universe, while the individual managers are compared to peers with the same vehicle and strategy assets.5 Mercer Stable Value Median for Funds with over $500M in assets
Fee Review
21

Performance Scorecard
* A Mercer rating signifies our opinion of a strategy’s prospects for outperforming a suitable benchmark over a timeframe appropriate for that particular strategy. Strategies rated A are those assessed ashaving “above average” prospects of outperformance. Those rated B+ are those assessed as having “above average” prospects of outperformance, but which are qualified by at least one of the following: (1) There are other strategies that Mercer believes are more likely to achieve outperformance; (2) Mercer requires more evidence to support its assessment. Strategies rated B are those assessed as having “average” prospects of outperformance. Those rated C are those assessed as having “below average” prospects of outperformance. The R rating is applied in three situations: (1) Where Mercer has carried out some research, but has not completed its full investment strategy research process; (2) In product categories where Mercer does not maintain formal ratings, but where there are other strategies in which we have a higher degree of confidence; (3) Mercer has in the past carried out its full investment strategy research process, but we are no longer maintaining full research coverage on the strategy. If the rating shown is N, or if no rating is shown at all, this signifies that the strategy is not currently rated by Mercer. Some strategy ratings may carry a supplemental indicator, such as P (Provisional), Watch (W), or High Tracking Error (T). A Preferred Provider status is assigned to high-conviction strategies within product categories for which the primary goal is not outperformance of a benchmark (for example, passive strategies).
Mercer Investment Consulting, Inc.
Mercer Rating
Return Risk1
3 Years to 06/30/2017
3 Years to 03/31/2017
3 Years to 12/31/2016
3 Years to 09/30/2016
5 Years to 06/30/2017
I U I U I U I U I
Large Cap Passive Fund (tracked within 20bps) NA NA NA NA NA
BlackRock Equity Index Fund A NA NA NA NA NA
Large Cap Value Fund NA
Hotchkis & Wiley Large Cap Value A (T)
Macquarie Large Cap Value2 A
Boston Partners Large Cap Value A
Large Cap Growth Fund NA
Sands Capital Large Cap Growth A (T)
Wellington Opportunistic Growth A
Loomis Large Cap Growth3 B+ (T)
1 A check mark is given if the fund’s/manager’s standard deviation is within 150% of the benchmark’s. For the International Equity Fund, the stated threshold is within 125%. 2 Represents the Macquarie Large Cap Growth Composite. 3 Represents the Loomis Large Cap Growth Composite.
22

Performance Scorecard
* A Mercer rating signifies our opinion of a strategy’s prospects for outperforming a suitable benchmark over a timeframe appropriate for that particular strategy. Strategies rated A are those assessed ashaving “above average” prospects of outperformance. Those rated B+ are those assessed as having “above average” prospects of outperformance, but which are qualified by at least one of the following: (1) There are other strategies that Mercer believes are more likely to achieve outperformance; (2) Mercer requires more evidence to support its assessment. Strategies rated B are those assessed as having “average” prospects of outperformance. Those rated C are those assessed as having “below average” prospects of outperformance. The R rating is applied in three situations: (1) Where Mercer has carried out some research, but has not completed its full investment strategy research process; (2) In product categories where Mercer does not maintain formal ratings, but where there are other strategies in which we have a higher degree of confidence; (3) Mercer has in the past carried out its full investment strategy research process, but we are no longer maintaining full research coverage on the strategy. If the rating shown is N, or if no rating is shown at all, this signifies that the strategy is not currently rated by Mercer. Some strategy ratings may carry a supplemental indicator, such as P (Provisional), Watch (W), or High Tracking Error (T). A Preferred Provider status is assigned to high-conviction strategies within product categories for which the primary goal is not outperformance of a benchmark (for example, passive strategies).
Mercer Investment Consulting, Inc.
Mercer Rating
Return Risk1
3 Years to 06/30/2017
3 Years to 03/31/2017
3 Years to 12/31/2016
3 Years to 09/30/2016
5 Years to 06/30/2017
I U I U I U I U I
Mid/Small Cap Passive Fund (tracked within 30 bps) NA NA NA NA NA
BlackRock Russell 2500 Index Fund A NA NA NA NA NA
Mid/Small Cap Value Fund NA
Hotchkis & Wiley SMID Cap Value B+ (T)
EARNEST Partners SMID Cap Value B+
WEDGE SMID Cap Value B+
Mid/Small Cap Growth Fund NA
TimesSquare SMID Cap Growth A
Brown Advisory B+
1 A check mark is given if the fund’s/manager’s standard deviation is within 150% of the benchmark’s. For the International Equity Fund, the stated threshold is within 125%.
23

Performance Scorecard
* A Mercer rating signifies our opinion of a strategy’s prospects for outperforming a suitable benchmark over a timeframe appropriate for that particular strategy. Strategies rated A are those assessed ashaving “above average” prospects of outperformance. Those rated B+ are those assessed as having “above average” prospects of outperformance, but which are qualified by at least one of the following: (1) There are other strategies that Mercer believes are more likely to achieve outperformance; (2) Mercer requires more evidence to support its assessment. Strategies rated B are those assessed as having “average” prospects of outperformance. Those rated C are those assessed as having “below average” prospects of outperformance. The R rating is applied in three situations: (1) Where Mercer has carried out some research, but has not completed its full investment strategy research process; (2) In product categories where Mercer does not maintain formal ratings, but where there are other strategies in which we have a higher degree of confidence; (3) Mercer has in the past carried out its full investment strategy research process, but we are no longer maintaining full research coverage on the strategy. If the rating shown is N, or if no rating is shown at all, this signifies that the strategy is not currently rated by Mercer. Some strategy ratings may carry a supplemental indicator, such as P (Provisional), Watch (W), or High Tracking Error (T). A Preferred Provider status is assigned to high-conviction strategies within product categories for which the primary goal is not outperformance of a benchmark (for example, passive strategies).
Mercer Investment Consulting, Inc.
Mercer Rating
Return Risk1
3 Years to 06/30/2017
3 Years to 03/31/2017
3 Years to 12/31/2016
3 Years to 09/30/2016
5 Years to 06/30/2017
I U I U I U I U I
International Passive Fund (tracked within 60 bps) NA NA NA NA NA
BlackRock ACWI ex US Fund A NA NA NA NA NA
International Equity Fund NA
Baillie Gifford ACWI ex US Growth A
Mondrian ACWI ex US Value B+
Global Equity Fund NA
Wellington Global Opportunities B+
Arrowstreet Global Equity ACWI A
1 A check mark is given if the fund’s/manager’s standard deviation is within 150% of the benchmark’s. For the International Equity Fund, the stated threshold is within 125%.
24

Performance Scorecard
* A Mercer rating signifies our opinion of a strategy’s prospects for outperforming a suitable benchmark over a timeframe appropriate for that particular strategy. Strategies rated A are those assessed ashaving “above average” prospects of outperformance. Those rated B+ are those assessed as having “above average” prospects of outperformance, but which are qualified by at least one of the following: (1) There are other strategies that Mercer believes are more likely to achieve outperformance; (2) Mercer requires more evidence to support its assessment. Strategies rated B are those assessed as having “average” prospects of outperformance. Those rated C are those assessed as having “below average” prospects of outperformance. The R rating is applied in three situations: (1) Where Mercer has carried out some research, but has not completed its full investment strategy research process; (2) In product categories where Mercer does not maintain formal ratings, but where there are other strategies in which we have a higher degree of confidence; (3) Mercer has in the past carried out its full investment strategy research process, but we are no longer maintaining full research coverage on the strategy. If the rating shown is N, or if no rating is shown at all, this signifies that the strategy is not currently rated by Mercer. Some strategy ratings may carry a supplemental indicator, such as P (Provisional), Watch (W), or High Tracking Error (T). A Preferred Provider status is assigned to high-conviction strategies within product categories for which the primary goal is not outperformance of a benchmark (for example, passive strategies).
Mercer Investment Consulting, Inc.
Mercer Rating
Return Risk1
3 Years to 06/30/2017
3 Years to 03/31/2017
3 Years to 12/31/2016
3 Years to 09/30/2016
5 Years to 06/30/2017
I U I U I U I U I
Inflation Responsive Fund NA
PIMCO Inflation Response-Multi Asset B+ NA
Fixed Income Passive Fund (tracked within 25 bps) NA NA NA NA NA
BlackRock Debt Index Fund A NA NA NA NA NA
Fixed Income Fund NA
TCW Core Plus2 A
Prudential Core Plus3 A
Stable Value Fund A NA
1 A check mark is given if the fund’s/manager’s standard deviation is within 150% of the benchmark’s. For the International Equity Fund, the stated threshold is within 125%.
2 Represents the TCW Core Plus Composite.
3 Represents the Prudential Core Plus Composite.
25

Watch List Criteria
Mercer Investment Consulting, Inc.
1) Performance: The underlying manager strategy has trailed the benchmark and peer group universe over fourconsecutive 3 year periods, as highlighted on the Performance Scorecard. A candidate can also be added to thewatch list if performance is not explained by the managers style or investment philosophy
2) Philosophy Change: Underlying manager strategy has had a material change to the investment process orphilosophy, from what was originally established
3) Organizational Instability: Organizational or team turnover that could materially affect the investment process
26

Watch List
* A Mercer rating signifies our opinion of a strategy’s prospects for outperforming a suitable benchmark over a timeframe appropriate for that particular strategy. Strategies rated A are those assessed ashaving “above average” prospects of outperformance. Those rated B+ are those assessed as having “above average” prospects of outperformance, but which are qualified by at least one of the following: (1) There are other strategies that Mercer believes are more likely to achieve outperformance; (2) Mercer requires more evidence to support its assessment. Strategies rated B are those assessed as having “average” prospects of outperformance. Those rated C are those assessed as having “below average” prospects of outperformance. The R rating is applied in three situations: (1) Where Mercer has carried out some research, but has not completed its full investment strategy research process; (2) In product categories where Mercer does not maintain formal ratings, but where there are other strategies in which we have a higher degree of confidence; (3) Mercer has in the past carried out its full investment strategy research process, but we are no longer maintaining full research coverage on the strategy. If the rating shown is N, or if no rating is shown at all, this signifies that the strategy is not currently rated by Mercer. Some strategy ratings may carry a supplemental indicator, such as P (Provisional), Watch (W), or High Tracking Error (T). A Preferred Provider status is assigned to high-conviction strategies within product categories for which the primary goal is not outperformance of a benchmark (for example, passive strategies).
Mercer Investment Consulting, Inc.
Manager Date Placed
on Watch
Mercer
Rating* Recommendation Comments
TimesSquare SMID Growth 3Q16 A Maintain Watch
Status
TSCM’s investment process utilizes a fundamental growth equity approach. They place particular emphasis on management quality and how the management teams are aligned with shareholders, along with a detailed understanding of what constitutes a superior business model. The strategy’s investable universe spans from $300M to $7 Billion. TSCM seeks companies that have experienced, properly motivated management teams with distinct sustainable competitive advantages. The team will focus on securities that have the potential to appreciate 25%-50% over the next 18-month period. The team is constantly reviewing security valuations and will re-examine securities when they near the target price set at purchase. The strategy will have close to 100 names so position sizes are relatively smaller. Mercer believes the key strength of the strategy is the quality of research and experienced portfolio managers, Grant Babyak and Tony Rosenthal.
The strategy has struggled more recently, as it underperformed over the last three calendar years. Historically, the fundamental approach has been beneficial during falling markets and that is where the strategy hadadded a significant portion of its alpha. TSCM outperformed the benchmark during the last 12 down markets, but struggled at certain points in extreme growth markets. Since 2013, there have only been three negative quarters by the Russell 2500 Growth Index, which has been a bit of a headwind for TSCM. During the second quarter, the strategy outperformed the benchmark by 130 basis points and ranked in the top half of the peer group universe. Growth oriented securities have continued to outperform in 2017, and this was beneficial for TimesSquare, who was roughly 5% overweight the information technology sector. TimesSquare also benefited from strong security selection within the industrials sector, particularly Proto Labs, which provides custom protoypes and production parts for 3D printing. Proto Labs benefited from a strong quarterly earnings report, improved guidance and renewed investor optimism in 3D printing. TimesSquare did continue to struggle with selection in the health care sector during the quarter, although a majority of the underperformance was attributed to the large underweight position (5.9%). Over the trailing-year, the stock has trailed the benchmark by 330 basis points and ranked in the bottom quartile of the peer group universe. The results over the trailing-year have negatively affected the longer-term results and we believe that TSCM’s style has been out of favor over the more recent market cycle. We still have confidence in the team and strategy but recommend maintaining the watch status given the more recent performance.
27

Watch List
* A Mercer rating signifies our opinion of a strategy’s prospects for outperforming a suitable benchmark over a timeframe appropriate for that particular strategy. Strategies rated A are those assessed ashaving “above average” prospects of outperformance. Those rated B+ are those assessed as having “above average” prospects of outperformance, but which are qualified by at least one of the following: (1) There are other strategies that Mercer believes are more likely to achieve outperformance; (2) Mercer requires more evidence to support its assessment. Strategies rated B are those assessed as having “average” prospects of outperformance. Those rated C are those assessed as having “below average” prospects of outperformance. The R rating is applied in three situations: (1) Where Mercer has carried out some research, but has not completed its full investment strategy research process; (2) In product categories where Mercer does not maintain formal ratings, but where there are other strategies in which we have a higher degree of confidence; (3) Mercer has in the past carried out its full investment strategy research process, but we are no longer maintaining full research coverage on the strategy. If the rating shown is N, or if no rating is shown at all, this signifies that the strategy is not currently rated by Mercer. Some strategy ratings may carry a supplemental indicator, such as P (Provisional), Watch (W), or High Tracking Error (T). A Preferred Provider status is assigned to high-conviction strategies within product categories for which the primary goal is not outperformance of a benchmark (for example, passive strategies).
Mercer Investment Consulting, Inc.
Manager Date Placed
on Watch
Mercer
Rating* Recommendation Comments
Sands Large Cap Growth 4Q16 A (T) Maintain Watch
Status
Sands constructs a concentrated, aggressive growth portfolio with low turnover and adheres to a strict buy and hold philosophy. Due to the funds loose constraints and concentrated nature, it can be common for the strategy to exhibit significant tracking error relative to the benchmark. The conviction-weighted, concentrated structure of this portfolio places a heavy emphasis on top holdings and these can have a significant impact on the strategy’s performance. The top five holdings represented just over 33% of the portfolio at the end of the second quarter. Sands continued its strong run in the second quarter, as the strategy outperformed the Russell 1000 Growth Index by 270 basis points and ranked in the 13th percentile of the peer group universe. Year-to date, Sands has outperformed the benchmark by 850 basis points and ranked in the 4th percentile of the peer group universe. Sands continued to benefit from the outperformance of growth oriented equities with higher earnings and sales growth. Sands large overweight (11.7%) to the information technology sector aided results, along with strong security selection, which added 230 basis points of relative outperformance. Sands out of benchmark exposure to Alibaba was the key contributor during the second quarter. Alibaba benefited from strong revenue growth, and provided revenue guidance of 45-49% growth in 2018, which was well above expectations. Alibaba returned over 30% during the quarter and was the top absolute and relative performer during the quarter.
2016 was a difficult year for Sands. The first and fourth quarters were the top two worst quarters in the strategy’s lengthy history. In 2016, the strategy trailed the benchmark by 1,390 basis points and ranked in the 99th percentile of the peer group universe. Sands active sector exposures proved unfavorable, as investors preferred higher yielding stocks in the more defensive sectors like utilities and telecommunications. The markets preference for yield subsided slightly in the second half of 2016, but the top third highest yielding stocks in the Russell 1000 Growth Index outperformed the bottom third lowest yielding stocks by over 1500 basis points. This preference for yield created an extremely difficult market environment for active managers in the large cap growth space, as 93% managers failed to outperform the benchmark. Mercer was not surprised by the underperformance given the near-term style headwinds. We were comforted to note the team’s strict adherence to process and objectivity in the midst of temporary market driven challenges. Since inception, Sands has outperformed the benchmark by a comfortable margin, although there have been periods of extreme volatility. We uphold our conviction in the skilled and experienced research teams managing the strategy.
28

Watch List
* A Mercer rating signifies our opinion of a strategy’s prospects for outperforming a suitable benchmark over a timeframe appropriate for that particular strategy. Strategies rated A are those assessed ashaving “above average” prospects of outperformance. Those rated B+ are those assessed as having “above average” prospects of outperformance, but which are qualified by at least one of the following: (1) There are other strategies that Mercer believes are more likely to achieve outperformance; (2) Mercer requires more evidence to support its assessment. Strategies rated B are those assessed as having “average” prospects of outperformance. Those rated C are those assessed as having “below average” prospects of outperformance. The R rating is applied in three situations: (1) Where Mercer has carried out some research, but has not completed its full investment strategy research process; (2) In product categories where Mercer does not maintain formal ratings, but where there are other strategies in which we have a higher degree of confidence; (3) Mercer has in the past carried out its full investment strategy research process, but we are no longer maintaining full research coverage on the strategy. If the rating shown is N, or if no rating is shown at all, this signifies that the strategy is not currently rated by Mercer. Some strategy ratings may carry a supplemental indicator, such as P (Provisional), Watch (W), or High Tracking Error (T). A Preferred Provider status is assigned to high-conviction strategies within product categories for which the primary goal is not outperformance of a benchmark (for example, passive strategies).
Mercer Investment Consulting, Inc.
Manager Date Placed on
Watch Mercer
Rating* Recommendation Comments
Wellington Opportunistic Growth 4Q16 A Maintain Watch
Status
Over the long term, Wellington believes companies that can sustain above average earnings growth will outperform the growth indices and the market overall. The investment objective of the Opportunistic Growth portfolio is to provide long-term, total returns above the growth indexes by investing in the stocks of successful, growing companies. Wellington seeks companies that either have a cost advantage, a customer advantage, or competitive advantage before conducting a further in-depth, fundamental review of the business model. The final Opportunistic Growth portfolio is composed of roughly 100 to 150 stocks and is constructed in three different sleeves: large cap, mid cap, and small cap. Allocation to each sleeve is determined by the market weights of large, mid and small cap stocks in the Russell 3000 Growth Index.
Wellington flagged the watch list for performance reason during the fourth quarter of 2016, as relative performance struggled over the prior to two and a half year period. Over 2016, Wellington trailed the benchmark by 450 basis points and ranked in the bottom half of the peer group universe. 2016 was a very difficult market environment for active large cap growth managers, as investors preferred higher yielding stocks in more defensive sectors like utilities and telecommunications. The markets preference for yield subsided slightly in the second half of 2016, but the top third highest yielding stocks in the Russell 1000 Growth Index outperformed the bottom third lowest yielding stocks by over 1500 basis points. Wellington continued its strong performance during the second quarter, as it outpaced the Russell 1000 Index by 180 basis points. Investors continued to prefer faster growing companies and this was a tailwind for Wellington’s growth oriented investment approach. A majority of the outperformance during the quarter was a result of strong security selection in the information technology sector. Wellington had an out-of-benchmark position in Alibaba which was up over 30% during the quarter, along with a position in IT company Zillow, which was up over 45%. We continue to believe in the leadership, investment acumen and collaboration of portfolio managers Drew Shilling, Timothy Manning, and Steven Angeli.
29

Watch List
* A Mercer rating signifies our opinion of a strategy’s prospects for outperforming a suitable benchmark over a timeframe appropriate for that particular strategy. Strategies rated A are those assessed as having “above average” prospects of outperformance. Those rated B+ are those assessed as having “above average” prospects of outperformance, but which are qualified by at least one of the following: (1) There are other strategies that Mercer believes are more likely to achieve outperformance; (2) Mercer requires more evidence to support its assessment. Strategies rated B are those assessed as having “average” prospects of outperformance. Those rated C are those assessed as having “below average” prospects of outperformance. The R rating is applied in three situations: (1) Where Mercer has carried out some research, but has not completed its full investment strategy research process; (2) In product categories where Mercer does not maintain formal ratings, but where there are other strategies in which we have a higher degree of confidence; (3) Mercer has in the past carried out its full investment strategy research process, but we are no longer maintaining full research coverage on the strategy. If the rating shown is N, or if no rating is shown at all, this signifies that the strategy is not currently rated by Mercer. Some strategy ratings may carry a supplemental indicator, such as P (Provisional), Watch (W), or High Tracking Error (T). A Preferred Provider status is assigned to high-conviction strategies within product categories for which the primary goal is not outperformance of a benchmark (for example, passive strategies).
Mercer Investment Consulting, Inc.
Manager Date Placed on
Watch
Mercer
Rating* Recommendation Comments
Boston Partners Large Cap Value 1Q17 A Maintain Watch
Status
Boston Partners attempt to identify securities that exhibit quality, attractive valuations and improving business momentum. The strategy is typically more conservative and generally performs best in periods of heightened volatility. The process is defined by the team's unwavering focus on stocks exhibiting quality, valuation, and improving business momentum. The strategy's front-end quantitative screen is simple yet effective in its role of providing structure and focus to the fundamental research effort. This is a well-diversified, fundamentally-driven strategy that benefits from the experience, insights, and close collaboration of portfolio managers Mark Donovan and David Pyle. The strategy is expected to exhibit a relative value approach and has a focus on principal protection.
Boston Partners flagged the watch list for underperformance during the first quarter of 2017 and this was mainly attributed to the relative underperformance in 2016. Boston Partners trailed the benchmark by 230 basis points in 2016, as higher dividend paying companies led the market. Boston Partners’s investment process results in a strong negative tilt towards dividend factors, which would explain the calendar year underperformance. Despite the style headwinds, Boston Partners ranked in the 51st percentile of the peer group universe, and fared better in the fourth quarter when cyclical securities came back in favor. Growth oriented securities have come back in favor in 2017, and this has been beneficial for Boston Partner’s relative value style. The strategy was largely overweight the information technology sector and benefited from strong security selection. Additionally, the strategy was underweight the energy sector, which continued to struggle as oil prices declined. Boston Partners avoided the oil services industry completely due to concerns over capital spending budgets. Year-to-date, the strategy has outperformed the index by 220 basis points and ranked in the top third of the peer group universe. The strategy’s positions in technology companies Alphabet, Microsoft, and TE Connectivity have contributed meaningfully to results in 2017. Despite the rough period in 2016, Mercer continues to have confidence in Boston Partner’s disciplined investment process.
30

Watch List
* A Mercer rating signifies our opinion of a strategy’s prospects for outperforming a suitable benchmark over a timeframe appropriate for that particular strategy. Strategies rated A are those assessed as having “above average” prospects of outperformance. Those rated B+ are those assessed as having “above average” prospects of outperformance, but which are qualified by at least one of the following: (1) There are other strategies that Mercer believes are more likely to achieve outperformance; (2) Mercer requires more evidence to support its assessment. Strategies rated B are those assessed as having “average” prospects of outperformance. Those rated C are those assessed as having “below average” prospects of outperformance. The R rating is applied in three situations: (1) Where Mercer has carried out some research, but has not completed its full investment strategy research process; (2) In product categories where Mercer does not maintain formal ratings, but where there are other strategies in which we have a higher degree of confidence; (3) Mercer has in the past carried out its full investment strategy research process, but we are no longer maintaining full research coverage on the strategy. If the rating shown is N, or if no rating is shown at all, this signifies that the strategy is not currently rated by Mercer. Some strategy ratings may carry a supplemental indicator, such as P (Provisional), Watch (W), or High Tracking Error (T). A Preferred Provider status is assigned to high-conviction strategies within product categories for which the primary goal is not outperformance of a benchmark (for example, passive strategies).
Mercer Investment Consulting, Inc.
Hotchkis and Wiley 1Q17 B+ (T) Maintain Watch
Status
Hotchkis & Wiley utilizes a fundamental, bottom-up approach to value investing. The firm seeks to exploit mispriced securities by investing in undiscovered or out of favor companies where the intrinsic value of the companies future cash flows exceeds the market price. The team does not consider benchmark characteristics in portfolio construction, as they view permanent loss of capital the primary source of risk. Hotchkis believes that the low valuations and lower leverage provides them a margin of safety.
Hotchkis, like other value managers, struggled in 2016 when more defensive names were in favor. Hotchkis avoided the non-cyclical securities with higher payout ratios that investors preferred during the first half of 2016, as Hotchkis believed these companies had excessive valuations resulting from the low interest rate environment. During the second half of 2016, cyclical securities rebounded and outperformed the securities with higher payout ratios. In 2016, Hotchkis underperformed the benchmark by 320 basis points but ranked in the top half of the peer group universe. Growth continued to outperform value in the mid cap space during the second quarter and the spread has been over 600 basis points year-to-date. Investors have preferred equities that have exhibited above average growth, mainly coming from the information technology and health care sectors. During the second quarter, Hotchkis and Wiley underperformed the index by 140 basis points and ranked in the bottom decile of the peer group universe. A majority of the underperformance came from Hotchkis’s large overweight to the energy sector (13.3%), which was the worst performer as oil prices continued to decline. Three of Hotchkis’s energy holdings were down over 40% during the quarter and Whiting Petroleum was the largest dectractor (2.6% of the portfolio). Security selction in the consumer discretionary sector was also a detractor and the sector allocation represented a significant portion of the portfolio (19.4%).
Manager Date Placed on
Watch
Mercer
Rating* Recommendation Comments
31

Total Plan
32

Total PlanAsset Allocation
CurrentBalance
North Carolina Stable Value Fund $2,496,799,734North Carolina Fixed Income Passive Fund $471,776,749North Carolina Fixed Income Fund $694,702,568North Carolina Inflation Responsive Fund $438,307,108North Carolina Large Cap Passive Fund $1,494,328,354North Carolina Large Cap Value Fund $994,138,045North Carolina Large Cap Growth Fund $1,004,944,427North Carolina SMID Cap Passive Fund $262,777,703North Carolina SMID Value Fund $538,459,194North Carolina SMID Growth Fund $418,837,373North Carolina International Passive Fund $57,037,794North Carolina International Equity Fund $648,267,683North Carolina Global Equity Fund $948,922,862Total $10,469,299,594
33

Total PlanFund Returns
CurrentMarket Value
CurrentAllocation 3 Mo Rank YTD Rank 1 Yr Rank 3 Yrs Rank 5 Yrs Rank Return Since
_
Large Cap Passive $1,494,328,354 14.3%S&P 500
3.1% 49 9.3% 39 17.9% 44 9.5% 17 14.5% 25 16.7% Mar-09 3.1% 48 9.3% 38 17.9% 44 9.6% 16 14.6% 21 16.9% Mar-09
Large Cap Value $994,138,045 9.5% 2.0% 53 6.0% 41 18.0% 50 7.5% 26 14.3% 19 15.4% Mar-09Russell 1000 Value 1.3% 72 4.7% 71 15.5% 77 7.4% 28 13.9% 24 16.3% Mar-09
Large Cap Growth $1,004,944,427 9.6% 7.4% 13 19.3% 13 23.2% 25 10.6% 36 15.2% 32 19.0% Mar-09Russell 1000 Growth 4.7% 73 14.0% 64 20.4% 54 11.1% 22 15.3% 27 17.7% Mar-09
Mid/Small Cap Passive $262,777,703 2.5%Russell 2500
2.1% 51 5.9% 47 19.7% 56 7.0% 38 14.0% 32 17.9% Mar-09 2.1% 50 6.0% 46 19.8% 56 6.9% 39 14.0% 32 18.0% Mar-09
Mid/Small Cap Value $538,459,194 5.1%Russell 2500 Value
0.8% 41 4.5% 19 22.1% 32 6.2% 38 14.7% 14 19.8% Mar-09 0.3% 55 2.0% 47 18.4% 65 6.2% 39 13.7% 44 17.5% Mar-09
Mid/Small Cap Growth $418,837,373 4.0% 4.8% 51 10.4% 63 17.5% 74 7.8% 36 13.6% 33 17.1% Mar-09Russell 2500 Growth 4.1% 60 10.6% 60 21.4% 49 7.7% 39 14.3% 25 18.5% Mar-09
International Passive $57,037,794 0.5%MSCI ACWI ex USA Gross
5.9% 60 14.4% 42 20.7% 30 0.9% 66 7.2% 84 10.1% Mar-09 6.0% 55 14.5% 42 21.0% 25 1.3% 44 7.7% 73 10.6% Mar-09
International Equity $648,267,683 6.2% 6.4% 57 15.6% 47 20.4% 46 2.7% 35 8.3% 56 11.1% Mar-09MSCI ACWI ex USA Gross 6.0% 69 14.5% 64 21.0% 40 1.3% 62 7.7% 69 10.6% Mar-09
Global Equity $948,922,862 9.1% 5.3% 44 13.6% 38 20.3% 41 6.4% 25 13.1% 16 14.0% Mar-09MSCI ACWI Gross 4.5% 57 11.8% 52 19.4% 52 5.4% 47 11.1% 47 13.6% Mar-09
Inflation Responsive Fund $438,307,108 4.2% 0.1% 63 2.3% 51 2.6% 76 -0.5% 35 -- -- 1.1% Sep-13PIMCO Inflation Response Index -0.4% 80 1.2% 69 -1.7% 99 -2.4% 81 -1.3% 95 -0.7% Sep-13
Fixed Income Passive Fund $471,776,749 4.5% 2.8% Sep-10BBgBarc US Aggregate TR
1.5% 45 2.3% 54 -0.3% 92 2.4% 41 2.1% 66 1.4% 46 2.3% 55 -0.3% 92 2.5% 39 2.2% 63 2.9% Sep-10
Fixed Income Fund $694,702,568 6.6% 1.8% 23 3.0% 25 1.1% 55 3.2% 15 3.0% 30 4.9% Mar-09BBgBarc US Aggregate TR 1.4% 46 2.3% 55 -0.3% 92 2.5% 39 2.2% 63 4.1% Mar-09
Stable Value Fund $2,496,799,734 23.8% 0.5% 30 1.0% 29 2.0% 16 1.9% 32 2.0% 31 2.6% Jun-093-Year Constant Maturity Yield 0.4% 97 0.7% 95 1.3% 88 1.1% 99 0.9% 99 0.9% Jun-09T-BILLS + 1.5% 0.6% 12 1.1% 13 2.0% 10 1.7% 37 1.7% 43 1.6% Jun-09
34

Total PlanPerformance Summary
Total Plan Performance
Ending June 30, 2017 InceptionCurrent
Market ValueCurrent
Allocation 3 Mo Rank YTD Rank 1 Yr Rank 3 Yrs Rank 5 Yrs Rank Return Since_
Large Cap Passive $1,494,328,354 14.3%S&P 500
3.1% 49 9.3% 39 17.9% 44 9.5% 17 14.5% 25 16.7% Mar-09 3.1% 48 9.3% 38 17.9% 44 9.6% 16 14.6% 21 16.9% Mar-09
Mercer Mutual Fund US Equity Large Cap Core Median 3.0% 8.9% 17.3% 8.0% 13.6% 15.4% Mar-09
NCSRP BlackRock Equity Index $1,494,328,354 14.3% 3.1% 45 9.3% 39 17.9% 50 9.6% 40 14.6% 64 16.9% Mar-09S&P 500 3.1% 45 9.3% 40 17.9% 55 9.6% 42 14.6% 63 16.9% Mar-09
Mercer Instl US Equity Large Cap Index Median 3.1% 9.3% 17.9% 9.5% 14.6% 16.9% Mar-09
Large Cap Value $994,138,045 9.5% 2.0% 53 6.0% 41 18.0% 50 7.5% 26 14.3% 19 15.4% Mar-09Russell 1000 Value 1.3% 72 4.7% 71 15.5% 77 7.4% 28 13.9% 24 16.3% Mar-09
Mercer Mutual Fund US Equity Large Cap Value Median 2.1% 5.8% 17.9% 6.9% 13.1% 15.1% Mar-09
NCSRP Hotchkis & Wiley Large Cap Value $333,307,264 3.2% 3.8% 9 8.7% 16 28.1% 5 8.7% 23 16.7% 4 19.5% Mar-09Russell 1000 Value 1.3% 76 4.7% 75 15.5% 80 7.4% 53 13.9% 52 16.3% Mar-09
Mercer Instl US Equity Large Cap Value Median 2.1% 6.2% 18.5% 7.4% 14.0% 16.4% Mar-09
NCSRP Macquarie Large Cap Value $328,212,922 3.1% -0.2% 96 3.1% 93 6.9% 99 -- -- -- -- 6.4% Jun-15Macquarie Large Cap Value Strategy -0.1% 96 3.2% 93 7.2% 99 7.9% 39 14.4% 40 6.7% Jun-15Russell 1000 Value 1.3% 76 4.7% 75 15.5% 80 7.4% 53 13.9% 52 7.6% Jun-15
Mercer Instl US Equity Large Cap Value Median 2.1% 6.2% 18.5% 7.4% 14.0% 7.3% Jun-15
NCSRP Boston Partners Large Cap Value $332,617,859 3.2% 2.7% 29 6.9% 32 21.3% 26 7.8% 41 14.8% 35 15.6% Nov-11Russell 1000 Value 1.3% 76 4.7% 75 15.5% 80 7.4% 53 13.9% 52 14.5% Nov-11
Mercer Instl US Equity Large Cap Value Median 2.1% 6.2% 18.5% 7.4% 14.0% 14.4% Nov-11
Large Cap Growth $1,004,944,427 9.6% 7.4% 13 19.3% 13 23.2% 25 10.6% 36 15.2% 32 19.0% Mar-09Russell 1000 Growth 4.7% 73 14.0% 64 20.4% 54 11.1% 22 15.3% 27 17.7% Mar-09
Mercer Mutual Fund US Equity Large Cap Growth Median 5.4% 15.2% 20.7% 9.8% 14.2% 16.4% Mar-09
NCSRP Sands Capital Large Cap Growth $333,777,678 3.2% 7.4% 13 22.5% 4 26.5% 10 8.3% 83 14.8% 53 21.5% Mar-09Russell 1000 Growth 4.7% 61 14.0% 57 20.4% 54 11.1% 32 15.3% 39 17.7% Mar-09
Mercer Instl US Equity Large Cap Growth Median 5.2% 14.4% 20.7% 10.2% 14.9% 16.8% Mar-09
35

Total PlanPerformance Summary
Ending June 30, 2017 InceptionCurrent
Market ValueCurrent
Allocation 3 Mo Rank YTD Rank 1 Yr Rank 3 Yrs Rank 5 Yrs Rank Return Since_
NCSRP Wellington Opportunistic Growth $334,717,146 3.2% 6.5% 25 17.8% 21 21.6% 41 10.2% 49 16.2% 23 17.5% Mar-09Russell 1000 Growth 4.7% 61 14.0% 57 20.4% 54 11.1% 32 15.3% 39 17.7% Mar-09Russell 3000 Growth 4.7% 61 13.7% 60 20.7% 50 10.8% 37 15.2% 43 17.7% Mar-09
Mercer Instl US Equity Large Cap Growth Median 5.2% 14.4% 20.7% 10.2% 14.9% 16.8% Mar-09
NCSRP Loomis Large Cap Growth $336,449,603 3.2% 8.7% 7 18.5% 16 23.2% 22 -- -- -- -- 16.0% Aug-14Loomis Large Cap Growth Strategy 8.8% 5 18.3% 17 22.8% 28 14.3% 4 18.8% 3 15.6% Aug-14Russell 1000 Growth 4.7% 61 14.0% 57 20.4% 54 11.1% 32 15.3% 39 12.0% Aug-14
Mercer Instl US Equity Large Cap Growth Median 5.2% 14.4% 20.7% 10.2% 14.9% 11.0% Aug-14
Mid/Small Cap Passive $262,777,703 2.5%Russell 2500
2.1% 51 5.9% 47 19.7% 56 7.0% 38 14.0% 32 17.9% Mar-09 2.1% 50 6.0% 46 19.8% 56 6.9% 39 14.0% 32 18.0% Mar-09
Mercer Mutual Fund US Equity Small+Mid Median 2.1% 5.4% 20.4% 6.3% 13.1% 16.8% Mar-09
NCSRP BlackRock Russell 2500 Index Fund $262,777,703 2.5%Russell 2500
2.1% 56 5.9% 52 19.7% 70 7.0% 66 14.1% 65 18.1% Mar-09 2.1% 55 6.0% 52 19.8% 69 6.9% 68 14.0% 66 18.0% Mar-09
Mercer Instl US Equity Small + Mid Cap Median 2.4% 6.2% 22.1% 8.0% 14.8% 18.6% Mar-09
Mid/Small Cap Value $538,459,194 5.1%Russell 2500 Value
0.8% 41 4.5% 19 22.1% 32 6.2% 38 14.7% 14 19.8% Mar-09 0.3% 55 2.0% 47 18.4% 65 6.2% 39 13.7% 44 17.5% Mar-09
Mercer Mutual Fund US Equity Small+Mid Value Median 0.4% 1.4% 20.4% 5.5% 13.2% 16.9% Mar-09
NCSRP Hotchkis & Wiley $179,411,704 1.7% -1.1% 92 0.0% 85 24.7% 21 3.1% 89 14.4% 46 21.4% Mar-09Hotchkis Custom SMID Value Index 0.3% 64 2.0% 76 18.4% 62 6.2% 47 13.7% 68 18.0% Mar-09
Mercer Instl US Equity SMID Value Median 1.2% 4.0% 20.7% 6.0% 14.2% 18.2% Mar-09
NCSRP EARNEST Partners $177,909,316 1.7% 2.0% 34 8.8% 9 23.3% 31 8.6% 16 16.0% 11 18.1% Mar-09EARNEST Custom SMID Value Index 0.3% 64 2.0% 76 18.4% 62 6.2% 47 13.7% 68 16.9% Mar-09
Mercer Instl US Equity SMID Value Median 1.2% 4.0% 20.7% 6.0% 14.2% 18.2% Mar-09
NCSRP WEDGE SMID Cap Value $181,138,174 1.7% 1.8% 37 5.7% 26 21.2% 44 9.3% 10 16.0% 11 16.4% Dec-11Russell 2500 Value 0.3% 64 2.0% 76 18.4% 62 6.2% 47 13.7% 68 14.0% Dec-11
Mercer Instl US Equity SMID Value Median 1.2% 4.0% 20.7% 6.0% 14.2% 14.0% Dec-11
36

Ending June 30, 2017 InceptionCurrent
Market ValueCurrent
Allocation 3 Mo Rank YTD Rank 1 Yr Rank 3 Yrs Rank 5 Yrs Rank Return Since_
Mid/Small Cap Growth $418,837,373 4.0% 4.8% 51 10.4% 63 17.5% 74 7.8% 36 13.6% 33 17.1% Mar-09Russell 2500 Growth 4.1% 60 10.6% 60 21.4% 49 7.7% 39 14.3% 25 18.5% Mar-09
Mercer Mutual Fund US Equity Small+Mid Growth Median 4.8% 11.7% 21.2% 6.8% 12.8% 16.7% Mar-09
NCSRP TimesSquare SMID Growth $210,100,698 2.0% 5.4% 37 11.5% 56 18.1% 75 5.8% 82 13.5% 64 12.1% Jun-11TimesSquare Custom SMID Growth Index 4.1% 62 10.6% 64 21.4% 57 7.7% 57 14.3% 33 11.2% Jun-11
Mercer Instl US Equity SMID Growth Median 5.0% 11.8% 22.6% 7.9% 13.8% 11.1% Jun-11
NCSRP Brown Advisory $208,736,675 2.0% 4.6% 58 10.1% 75 18.6% 72 11.5% 10 15.5% 22 19.1% Mar-09Brown Custom SMID Growth Index 4.1% 62 10.6% 64 21.4% 57 7.7% 57 14.3% 33 18.1% Mar-09
Mercer Instl US Equity SMID Growth Median 5.0% 11.8% 22.6% 7.9% 13.8% 18.2% Mar-09
International Passive $57,037,794 0.5%MSCI ACWI ex USA Gross
5.9% 60 14.4% 42 20.7% 30 0.9% 66 7.2% 84 10.1% Mar-09 6.0% 55 14.5% 42 21.0% 25 1.3% 44 7.7% 73 10.6% Mar-09
Mercer Mutual Fund World ex US/EAFE Equity Index Median 6.1% 14.2% 20.0% 1.2% 8.5% 10.3% Mar-09
NCSRP BlackRock ACWI ex US Fund $57,037,794 0.5%MSCI ACWI ex USA Gross
5.9% 83 14.5% 32 20.8% 26 1.0% 98 7.4% 98 10.3% Mar-09 6.0% 53 14.5% 32 21.0% 11 1.3% 69 7.7% 75 10.6% Mar-09
Mercer Instl World ex US/EAFE Equity Passive Median 6.1% 14.2% 20.7% 1.3% 8.7% 10.6% Mar-09
International Equity $648,267,683 6.2% 6.4% 57 15.6% 47 20.4% 46 2.7% 35 8.3% 56 11.1% Mar-09MSCI ACWI ex USA Gross 6.0% 69 14.5% 64 21.0% 40 1.3% 62 7.7% 69 10.6% Mar-09
Mercer Mutual Fund World ex US/EAFE Equity Median 6.7% 15.3% 19.9% 1.8% 8.6% 10.7% Mar-09
NCSRP Baillie Gifford ACWI ex US Growth $326,793,643 3.1% 9.2% 9 19.8% 11 27.5% 10 5.9% 7 10.6% 33 14.1% Mar-09MSCI ACWI ex USA Gross 6.0% 72 14.5% 64 21.0% 48 1.3% 80 7.7% 91 10.6% Mar-09MSCI AC Wld ex US Growth Gross 7.7% 28 17.7% 22 17.8% 73 2.9% 50 8.4% 83 10.9% Mar-09
Mercer Instl World ex US/EAFE Equity Median 6.7% 15.2% 20.8% 2.9% 9.7% 12.0% Mar-09
NCSRP Mondrian ACWI ex US Value $321,474,040 3.1% 4.0% 96 12.0% 91 14.8% 88 0.9% 88 7.6% 93 9.7% Mar-09MSCI ACWI ex USA Gross 6.0% 72 14.5% 64 21.0% 48 1.3% 80 7.7% 91 10.6% Mar-09MSCI AC Wld Ex US Value Gross 4.3% 94 11.4% 95 24.3% 23 -0.4% 97 6.9% 97 10.3% Mar-09
Mercer Instl World ex US/EAFE Equity Median 6.7% 15.2% 20.8% 2.9% 9.7% 12.0% Mar-09
Total PlanPerformance Summary
37

Total PlanPerformance Summary
Ending June 30, 2017 InceptionCurrent
Market ValueCurrent
Allocation 3 Mo Rank YTD Rank 1 Yr Rank 3 Yrs Rank 5 Yrs Rank Return Since_
Global Equity $948,922,862 9.1% 5.3% 44 13.6% 38 20.3% 41 6.4% 25 13.1% 16 14.0% Mar-09MSCI ACWI Gross 4.5% 57 11.8% 52 19.4% 52 5.4% 47 11.1% 47 13.6% Mar-09
Mercer Mutual Fund Global Equity Median 4.9% 12.1% 19.5% 5.1% 11.1% 13.3% Mar-09
NCSRP Wellington Global Opportunities $477,354,192 4.6% 6.0% 31 14.6% 27 22.1% 30 7.7% 19 14.4% 14 12.7% Jul-10MSCI ACWI Gross 4.5% 66 11.8% 55 19.4% 55 5.4% 61 11.1% 74 10.0% Jul-10
Mercer Instl Global Equity Median 5.0% 12.2% 19.9% 5.9% 12.3% 11.1% Jul-10
NCSRP Arrowstreet Global Equity ACWI $471,568,670 4.5% 4.9% 53 13.2% 40 20.2% 47 6.5% 39 13.4% 26 11.4% Mar-12MSCI ACWI Gross 4.5% 66 11.8% 55 19.4% 55 5.4% 61 11.1% 74 9.4% Mar-12
Mercer Instl Global Equity Median 5.0% 12.2% 19.9% 5.9% 12.3% 10.4% Mar-12
Inflation Responsive Fund $438,307,108 4.2% 0.1% 63 2.3% 51 2.6% 76 -0.5% 35 -- -- 1.1% Sep-13PIMCO Inflation Response Index -0.4% 80 1.2% 69 -1.7% 99 -2.4% 81 -1.3% 95 -0.7% Sep-13
Mercer Mutual Fund Diversified Inflation Hedge Median 0.7% 2.4% 3.7% -1.4% 1.1% 0.6% Sep-13
NCSRP PIMCO Inflation Response Multi-Asset $438,307,108 4.2% 0.2% 60 2.8% 42 3.3% 66 0.3% 24 -- -- 1.9% Sep-13PIMCO Inflation Response Multi-Asset Strategy 0.1% 63 2.4% 50 2.6% 75 -0.7% 38 0.2% 79 1.3% Sep-13PIMCO Inflation Response Index -0.4% 80 1.2% 69 -1.7% 99 -2.4% 81 -1.3% 95 -0.7% Sep-13Consumer Price Index 0.5% 55 1.5% 67 1.6% 85 0.9% 21 1.3% 43 1.2% Sep-13
Mercer Mutual Fund Diversified Inflation Hedge Median 0.7% 2.4% 3.7% -1.4% 1.1% 0.6% Sep-13
Fixed Income Passive Fund $471,776,749 4.5% 2.8% Sep-10BBgBarc US Aggregate TR
1.5% 45 2.3% 54 -0.3% 92 2.4% 41 2.1% 66 1.4% 46 2.3% 55 -0.3% 92 2.5% 39 2.2% 63 2.9% Sep-10
Mercer Mutual Fund US Fixed Core Median 1.4% 2.4% 1.2% 2.2% 2.5% 3.1% Sep-10
NCSRP BlackRock Debt Index Fund $471,776,749 4.5% 1.5% 45 2.3% 53 -0.3% 91 2.6% 36 2.3% 61 3.0% Sep-10BBgBarc US Aggregate TR 1.4% 46 2.3% 55 -0.3% 92 2.5% 39 2.2% 63 2.9% Sep-10
Mercer Mutual Fund US Fixed Core Median 1.4% 2.4% 1.2% 2.2% 2.5% 3.1% Sep-10
Fixed Income Fund $694,702,568 6.6% 1.8% 23 3.0% 25 1.1% 55 3.2% 15 3.0% 30 4.9% Mar-09BBgBarc US Aggregate TR 1.4% 46 2.3% 55 -0.3% 92 2.5% 39 2.2% 63 4.1% Mar-09
Mercer Mutual Fund US Fixed Core Median 1.4% 2.4% 1.2% 2.2% 2.5% 4.8% Mar-09
38
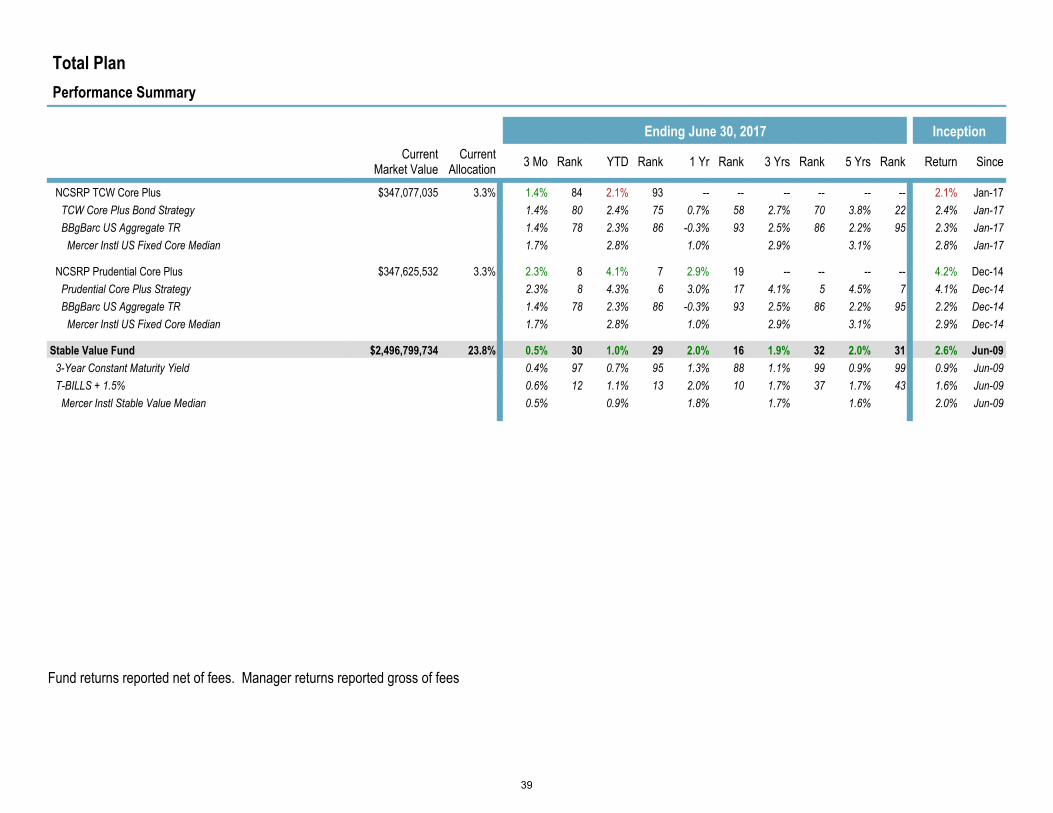
Fund returns reported net of fees. Manager returns reported gross of fees
Total PlanPerformance Summary
Ending June 30, 2017 InceptionCurrent
Market ValueCurrent
Allocation 3 Mo Rank YTD Rank 1 Yr Rank 3 Yrs Rank 5 Yrs Rank Return Since_
NCSRP TCW Core Plus $347,077,035 3.3% 1.4% 84 2.1% 93 -- -- -- -- -- -- 2.1% Jan-17TCW Core Plus Bond Strategy 1.4% 80 2.4% 75 0.7% 58 2.7% 70 3.8% 22 2.4% Jan-17BBgBarc US Aggregate TR 1.4% 78 2.3% 86 -0.3% 93 2.5% 86 2.2% 95 2.3% Jan-17
Mercer Instl US Fixed Core Median 1.7% 2.8% 1.0% 2.9% 3.1% 2.8% Jan-17
NCSRP Prudential Core Plus $347,625,532 3.3% 2.3% 8 4.1% 7 2.9% 19 -- -- -- -- 4.2% Dec-14Prudential Core Plus Strategy 2.3% 8 4.3% 6 3.0% 17 4.1% 5 4.5% 7 4.1% Dec-14BBgBarc US Aggregate TR 1.4% 78 2.3% 86 -0.3% 93 2.5% 86 2.2% 95 2.2% Dec-14
Mercer Instl US Fixed Core Median 1.7% 2.8% 1.0% 2.9% 3.1% 2.9% Dec-14
Stable Value Fund $2,496,799,734 23.8% 0.5% 30 1.0% 29 2.0% 16 1.9% 32 2.0% 31 2.6% Jun-093-Year Constant Maturity Yield 0.4% 97 0.7% 95 1.3% 88 1.1% 99 0.9% 99 0.9% Jun-09T-BILLS + 1.5% 0.6% 12 1.1% 13 2.0% 10 1.7% 37 1.7% 43 1.6% Jun-09
Mercer Instl Stable Value Median 0.5% 0.9% 1.8% 1.7% 1.6% 2.0% Jun-09
39

Total PlanPerformance Summary
Ending June 30, 2017 InceptionCurrent
Market ValueCurrent
Allocation 3 Mo Rank YTD Rank 1 Yr Rank 3 Yrs Rank 5 Yrs Rank Return Since_
GoalMaker Funds -- -- -- -- -- -- -- -- -- -- -- -- --
Conservative 0-5 Yrs $468,514,283 4.5% 1.8% 94 3.9% 99 5.5% 99 3.4% 71 4.7% 99 6.1% Jun-09C01 Benchmark 1.6% 96 3.5% 99 5.0% 99 2.9% 84 4.2% 99 5.0% Jun-09
Mercer Mutual Fund Target Date 2015 Median 2.3% 6.0% 9.1% 4.1% 7.0% 8.7% Jun-09
Conservative 6-10 Yrs $124,695,510 1.2% 2.1% 79 4.9% 83 7.4% 82 3.8% 56 5.7% 84 7.2% Jun-09C02 Benchmark 1.9% 86 4.4% 85 6.9% 86 3.3% 68 5.2% 87 6.0% Jun-09
Mercer Mutual Fund Target Date 2020 Median 2.6% 6.5% 9.4% 3.9% 7.0% 9.2% Jun-09
Conservative 11-15 Yrs $85,933,193 0.8% 2.7% 69 6.6% 79 10.4% 72 4.6% 47 7.5% 80 8.7% Jun-09C03 Benchmark 2.4% 84 5.9% 86 9.9% 78 4.2% 62 7.1% 86 8.0% Jun-09
Mercer Mutual Fund Target Date 2025 Median 2.9% 7.5% 11.4% 4.4% 8.2% 10.1% Jun-09
Conservative 16+ Yrs $200,596,279 1.9% 3.4% 42 8.4% 53 14.0% 29 5.3% 27 9.4% 36 10.4% Jun-09C04 Benchmark 3.0% 72 7.7% 73 13.6% 40 5.0% 42 9.1% 49 9.9% Jun-09
Mercer Mutual Fund Target Date 2030 Median 3.2% 8.5% 13.0% 4.7% 8.9% 10.7% Jun-09
Moderate 0-5 Yrs $573,468,014 5.5% 2.3% 53 5.4% 83 8.5% 73 4.0% 59 6.3% 77 7.6% Jun-09M01 Benchmark 2.1% 84 4.9% 90 8.0% 76 3.6% 67 5.8% 87 6.6% Jun-09
Mercer Mutual Fund Target Date 2015 Median 2.3% 6.0% 9.1% 4.1% 7.0% 8.7% Jun-09
Moderate 6-10 Yrs $413,220,534 3.9% 2.7% 34 6.6% 40 10.4% 32 4.6% 21 7.5% 47 8.6% Jun-09M02 Benchmark 2.4% 66 5.9% 73 9.9% 40 4.2% 43 7.1% 50 8.0% Jun-09
Mercer Mutual Fund Target Date 2020 Median 2.6% 6.5% 9.4% 3.9% 7.0% 9.2% Jun-09
Moderate 11-15 Yrs $385,525,346 3.7% 3.2% 22 8.0% 28 13.1% 25 5.1% 14 8.9% 25 9.9% Jun-09M03 Benchmark 2.9% 54 7.3% 63 12.6% 29 4.7% 34 8.5% 44 9.4% Jun-09
Mercer Mutual Fund Target Date 2025 Median 2.9% 7.5% 11.4% 4.4% 8.2% 10.1% Jun-09
Moderate 16+ Yrs $756,475,594 7.2% 3.9% 7 9.9% 8 17.0% 2 5.7% 10 10.8% 3 11.5% Jun-09M04 Benchmark 3.5% 28 9.1% 21 16.6% 6 5.4% 18 10.5% 4 11.3% Jun-09
Mercer Mutual Fund Target Date 2030 Median 3.2% 8.5% 13.0% 4.7% 8.9% 10.7% Jun-09
40

Ending June 30, 2017 InceptionCurrent
Market ValueCurrent
Allocation 3 Mo Rank YTD Rank 1 Yr Rank 3 Yrs Rank 5 Yrs Rank Return Since_
Aggressive 0-5 Yrs $247,138,796 2.4% 2.8% 15 6.9% 19 11.0% 20 4.7% 11 7.8% 6 9.1% Jun-09R01 Benchmark 2.5% 32 6.2% 32 10.5% 24 4.4% 36 7.4% 21 8.3% Jun-09
Mercer Mutual Fund Target Date 2015 Median 2.3% 6.0% 9.1% 4.1% 7.0% 8.7% Jun-09
Aggressive 6-10 Yrs $279,137,544 2.7% 3.2% 3 8.0% 4 13.1% 1 5.1% 5 8.9% 2 10.1% Jun-09R02 Benchmark 2.9% 22 7.3% 24 12.6% 7 4.7% 13 8.5% 4 9.4% Jun-09
Mercer Mutual Fund Target Date 2020 Median 2.6% 6.5% 9.4% 3.9% 7.0% 9.2% Jun-09
Aggressive 11-15 Yrs $295,951,484 2.8% 3.7% 2 9.4% 1 16.0% 1 5.6% 1 10.4% 1 11.1% Jun-09R03 Benchmark 3.3% 18 8.5% 18 15.6% 1 5.3% 7 10.1% 3 10.9% Jun-09
Mercer Mutual Fund Target Date 2025 Median 2.9% 7.5% 11.4% 4.4% 8.2% 10.1% Jun-09
Aggressive 16+ Yrs $783,911,450 7.5% 4.3% 1 11.3% 1 20.0% 1 6.2% 1 12.2%R04 Benchmark 3.9% 7 10.3% 1 19.7% 1 5.9% 8 12.1%
Mercer Mutual Fund Target Date 2030 Median 3.2% 8.5% 13.0% 4.7% 8.9%
1 12.7% Jun-09 1 12.7% Jun-09
10.7% Jun-09XXXXX
Total PlanPerformance Summary
41

Total PlanPerformance Summary - NET OF FFES
Total Plan Performance
Ending June 30, 2017 InceptionCurrent
Market ValueCurrent
Allocation 3 Mo YTD 1 Yr 3 Yrs 5 Yrs Return Since_
Large Cap Passive $1,494,328,354 14.3% 3.1% 9.3% 17.9% 9.5% 14.5%S&P 500 3.1% 9.3% 17.9% 9.6% 14.6%NCSRP BlackRock Equity Index $1,494,328,354 14.3% 3.1% 9.3% 17.9% 9.6% 14.6%
S&P 500 3.1% 9.3% 17.9% 9.6% 14.6%Large Cap Value $994,138,045 9.5% 2.0% 6.0% 18.0% 7.5% 14.3%
Russell 1000 Value 1.3% 4.7% 15.5% 7.4% 13.9%NCSRP Hotchkis & Wiley Large Cap Value $333,307,264 3.2% 3.7% 8.4% 27.4% 8.1% 16.1%
Russell 1000 Value 1.3% 4.7% 15.5% 7.4% 13.9%NCSRP Macquarie Large Cap Value $328,212,922 3.1% -0.3% 3.0% 6.6% -- --
Russell 1000 Value 1.3% 4.7% 15.5% 7.4% 13.9%NCSRP Boston Partners Large Cap Value $332,617,859 3.2% 2.6% 6.8% 20.9% 7.4% 14.4%
Russell 1000 Value 1.3% 4.7% 15.5% 7.4% 13.9%Large Cap Growth $1,004,944,427 9.6% 7.4% 19.3% 23.2% 10.6% 15.2%
Russell 1000 Growth 4.7% 14.0% 20.4% 11.1% 15.3%NCSRP Sands Capital Large Cap Growth $333,777,678 3.2% 7.2% 22.2% 25.8% 7.8% 14.2%
Russell 1000 Growth 4.7% 14.0% 20.4% 11.1% 15.3%NCSRP Wellington Opportunistic Growth $334,717,146 3.2% 6.4% 17.6% 21.1% 9.9% 15.8%
Russell 1000 Growth 4.7% 14.0% 20.4% 11.1% 15.3%Russell 3000 Growth 4.7% 13.7% 20.7% 10.8% 15.2%
NCSRP Loomis Large Cap Growth $336,449,603 3.2% 8.6% 18.3% 22.7% -- --Russell 1000 Growth 4.7% 14.0% 20.4% 11.1% 15.3%
16.7% Mar-09 16.9% Mar-09 16.9% Mar-09 16.9% Mar-09 15.4% Mar-09 16.3% Mar-09 18.9% Mar-09 16.3% Mar-09 6.1% Jun-15 7.6% Jun-15
15.2% Nov-11 14.5% Nov-11 19.0% Mar-09 17.7% Mar-09 20.9% Mar-09 17.7% Mar-09 17.1% Mar-09 17.7% Mar-09 17.7% Mar-09 15.5% Aug-14 12.0% Aug-14
42

Total PlanPerformance Summary - NET OF FFES
Ending June 30, 2017 InceptionCurrent
Market ValueCurrent
Allocation 3 Mo YTD 1 Yr 3 Yrs 5 Yrs Return Since_
Mid/Small Cap Passive $262,777,703 2.5% 2.1% 5.9% 19.7% 7.0% 14.0%Russell 2500 2.1% 6.0% 19.8% 6.9% 14.0%NCSRP BlackRock Russell 2500 Index Fund $262,777,703 2.5% 2.1% 5.9% 19.7% 7.0% 14.1%
Russell 2500 2.1% 6.0% 19.8% 6.9% 14.0%Mid/Small Cap Value $538,459,194 5.1% 0.8% 4.5% 22.1% 6.2% 14.7%
Russell 2500 Value 0.3% 2.0% 18.4% 6.2% 13.7%NCSRP Hotchkis & Wiley $179,411,704 1.7% -1.2% -0.3% 24.0% 2.5% 13.7%
Hotchkis Custom SMID Value Index 0.3% 2.0% 18.4% 6.2% 13.7%NCSRP EARNEST Partners $177,909,316 1.7% 1.8% 8.6% 22.7% 8.0% 15.4%
EARNEST Custom SMID Value Index 0.3% 2.0% 18.4% 6.2% 13.7%NCSRP WEDGE SMID Cap Value $181,138,174 1.7% 1.7% 5.3% 20.3% 8.5% 15.1%
Russell 2500 Value 0.3% 2.0% 18.4% 6.2% 13.7%Mid/Small Cap Growth $418,837,373 4.0% 4.8% 10.4% 17.5% 7.8% 13.6%
Russell 2500 Growth 4.1% 10.6% 21.4% 7.7% 14.3%NCSRP TimesSquare SMID Growth $210,100,698 2.0% 5.2% 11.1% 17.2% 4.9% 12.6%
TimesSquare Custom SMID Growth Index 4.1% 10.6% 21.4% 7.7% 14.3%NCSRP Brown Advisory $208,736,675 2.0% 4.5% 9.8% 17.9% 10.9% 14.8%
Brown Custom SMID Growth Index 4.1% 10.6% 21.4% 7.7% 14.3%International Passive $57,037,794 0.5% 5.9% 14.4% 20.7% 0.9% 7.2%
MSCI ACWI ex USA Gross 6.0% 14.5% 21.0% 1.3% 7.7%NCSRP BlackRock ACWI ex US Fund $57,037,794 0.5% 5.9% 14.4% 20.7% 0.9% 7.3%
MSCI ACWI ex USA Gross 6.0% 14.5% 21.0% 1.3% 7.7%
17.9% Mar-09 18.0% Mar-09 18.1% Mar-09 18.0% Mar-09 19.8% Mar-09 17.5% Mar-09 20.6% Mar-09 18.0% Mar-09 17.5% Mar-09 16.9% Mar-09 15.6% Dec-11 14.0% Dec-11 17.1% Mar-09 18.5% Mar-09 11.2% Jun-11 11.2% Jun-11 18.5% Mar-09 18.1% Mar-09 10.1% Mar-09 10.6% Mar-09 10.2% Mar-09 10.6% Mar-09
43

Total PlanPerformance Summary - NET OF FFES
Ending June 30, 2017 InceptionCurrent
Market ValueCurrent
Allocation 3 Mo YTD 1 Yr 3 Yrs 5 Yrs Return Since_
International Equity $648,267,683 6.2% 6.4% 15.6% 20.4% 2.7% 8.3% 11.1% Mar-09MSCI ACWI ex USA Gross 6.0% 14.5% 21.0% 1.3% 7.7% 10.6% Mar-09NCSRP Baillie Gifford ACWI ex US Growth $326,793,643 3.1% 9.1% 19.5% 26.9% 5.4% 10.1% 13.5% Mar-09
MSCI ACWI ex USA Gross 6.0% 14.5% 21.0% 1.3% 7.7% 10.6% Mar-09MSCI AC Wld ex US Growth Gross 7.7% 17.7% 17.8% 2.9% 8.4% 10.9% Mar-09
NCSRP Mondrian ACWI ex US Value $321,474,040 3.1% 3.9% 11.8% 14.3% 0.4% 7.1% 9.2% Mar-09MSCI ACWI ex USA Gross 6.0% 14.5% 21.0% 1.3% 7.7% 10.6% Mar-09MSCI AC Wld Ex US Value Gross 4.3% 11.4% 24.3% -0.4% 6.9% 10.3% Mar-09
Global Equity $948,922,862 9.1% 5.3% 13.6% 20.3% 6.4% 13.1% 14.0% Mar-09MSCI ACWI Gross 4.5% 11.8% 19.4% 5.4% 11.1% 13.6% Mar-09NCSRP Wellington Global Opportunities $477,354,192 4.6% 5.9% 14.3% 21.5% 7.2% 13.8% 12.2% Jul-10
MSCI ACWI Gross 4.5% 11.8% 19.4% 5.4% 11.1% 10.0% Jul-10NCSRP Arrowstreet Global Equity ACWI $471,568,670 4.5% 4.8% 12.9% 19.4% 5.8% 12.7%
MSCI ACWI Gross 4.5% 11.8% 19.4% 5.4% 11.1%Inflation Responsive Fund $438,307,108 4.2% 0.1% 2.3% 2.6% -0.5% --
PIMCO Inflation Response Index -0.4% 1.2% -1.7% -2.4% -1.3%NCSRP PIMCO Inflation Response Multi-Asset $438,307,108 4.2% 0.1% 2.4% 2.7% -0.4% --
PIMCO Inflation Response Index -0.4% 1.2% -1.7% -2.4% -1.3%Consumer Price Index 0.5% 1.5% 1.6% 0.9% 1.3%
10.7% Mar-12 9.4% Mar-12 1.1% Sep-13
-0.7% Sep-13 1.3% Sep-13
-0.7% Sep-13 1.2% Sep-13
44
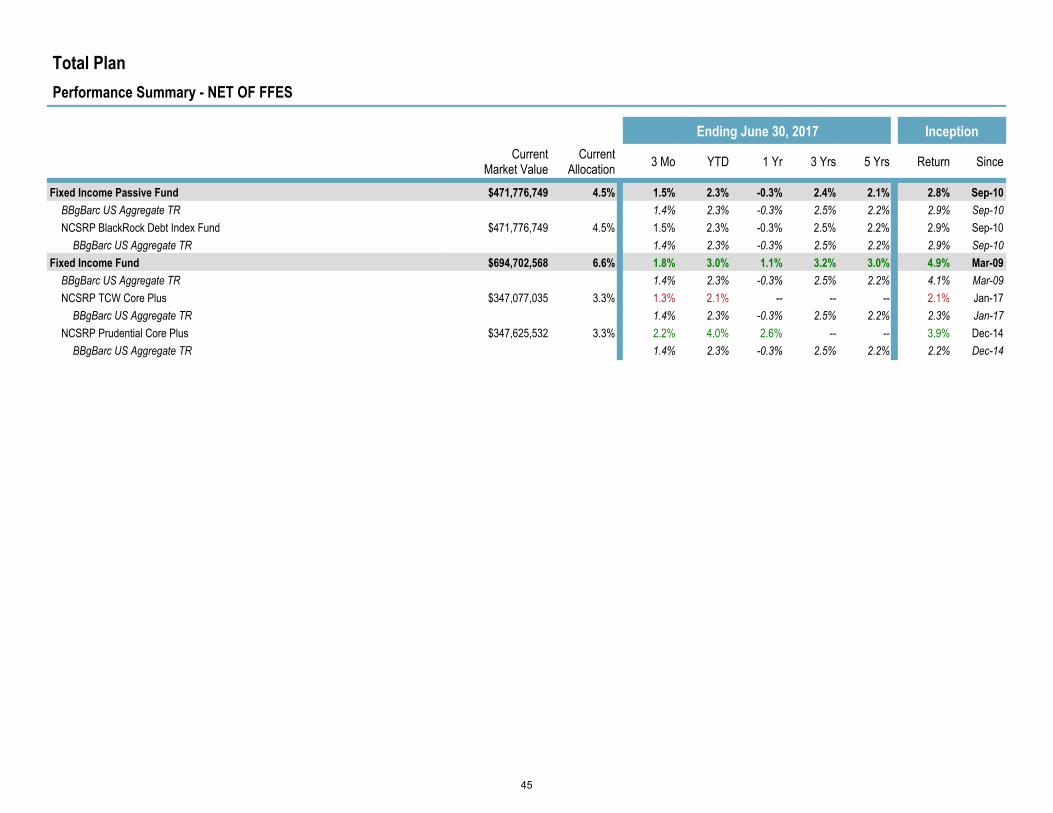
Total PlanPerformance Summary - NET OF FFES
Ending June 30, 2017 InceptionCurrent
Market ValueCurrent
Allocation 3 Mo YTD 1 Yr 3 Yrs 5 Yrs Return Since_
Fixed Income Passive Fund $471,776,749 4.5% 1.5% 2.3% -0.3% 2.4% 2.1% 2.8% Sep-10BBgBarc US Aggregate TR 1.4% 2.3% -0.3% 2.5% 2.2% 2.9% Sep-10NCSRP BlackRock Debt Index Fund $471,776,749 4.5% 1.5% 2.3% -0.3% 2.5% 2.2% 2.9% Sep-10
BBgBarc US Aggregate TR 1.4% 2.3% -0.3% 2.5% 2.2% 2.9% Sep-10Fixed Income Fund $694,702,568 6.6% 1.8% 3.0% 1.1% 3.2% 3.0% 4.9% Mar-09
BBgBarc US Aggregate TR 1.4% 2.3% -0.3% 2.5% 2.2% 4.1% Mar-09NCSRP TCW Core Plus $347,077,035 3.3% 1.3% 2.1% -- -- -- 2.1% Jan-17
BBgBarc US Aggregate TR 1.4% 2.3% -0.3% 2.5% 2.2% 2.3% Jan-17NCSRP Prudential Core Plus $347,625,532 3.3% 2.2% 4.0% 2.6% -- -- 3.9% Dec-14
BBgBarc US Aggregate TR 1.4% 2.3% -0.3% 2.5% 2.2% 2.2% Dec-14
45

Manager & Strategy
Mercer Rating Philosophy Key Strategy Observations
Arrowstreet Global Equity -
ACWI A
Arrowstreet applies a quantitative process to exploit both behavioral and informational opportunities. Behavioral opportunities are created by the mistakes made by investors, including the tendency for investors to overreact, to herd, and to avoid regret. Informational opportunities stem from investors not fully exploiting information that is relevant to prices on a timely basis. Arrowstreet views this process as a core approach. We note that Arrowstreet's process often displays value characteristics although its performance does not behave in line with the value cycle.
This benchmark-sensitive, quantitative approach typically exhibits a value tilt. It is not labeled "value" since returns do not behave in line with value indices. The strategy is expected to do well in trending markets (including growth markets) but to have greater difficulty managing through rapid inflection points. Several of the firm's strategies are available as Dublin-based pooled funds. The strategy does not follow a model portfolio, which may lead to some dispersion between similar client mandates.
Baillie Gifford A
The investment approach is bottom-up, based on fundamental research, with a focus on identifying quality, growth stocks that have an identifiable competitive advantage. Portfolios will consist of stocks that can sustain above average growth in earnings and cash flow. The time horizon is genuinely long-term with low turnover.
The strategy is expected to display persistent factor bias to profitability. The bias towards growth and quality stocks may make it more difficult for this strategy to outperform during periods when these market characteristics are out of favour.
BlackRock Indices A
Through its predecessor firm BGI, BlackRock utilizes a three-pronged philosophy across all of its index strategies. The investment philosophy of passive products at BlackRock is to replicate the index returns while minimizing transaction costs and tracking error of the product.
Boston Partners Large Cap Value
Equity A
Boston Partners blends quantitative modeling with fundamental research in constructing equity portfolios using bottom-up, value-oriented stock selection. The three primary tenets of the firm's philosophy are a value discipline, intensive internal research, and risk aversion. The research focuses on finding stocks with attractive value characteristics, strong business fundamentals, and a catalyst for change.
The strategy is expected to display a persistent bias to: value. The strategy is a relatively conservative product that is designed with an eye toward principal protection. As a result of Boston Partners' focus on valuation, quality, and improving business prospects, the strategy typically performs best in down markets and periods of higher volatility.
Brown Small-Cap Growth Equity
B+
Brown seeks to achieve superior risk-adjusted returns through a concentrated portfolio of diversified, small-capitalization equity securities. With this in mind, Brown looks to invest in companies
with durable growth, sound governance, and a scalable go-to-market strategy.
The strategy is not expected to display a persistent factor bias relative to a core benchmark. It is managed in a GARP fashion and
will consistently skew larger than its Russell 2000 Growth benchmark in terms of weighted average market cap; as such, it may
underperform when the smallest cap stocks are in favor. Similarly, it has tended to perform better in up-market environments owing to its growth orientation and focus on the strength and durability of a
business's long-term cash flow potential. An important attribute toward the strategy's long-term relative success has been its stock
selection decisions within the Technology sector.
46

Manager & Strategy
Mercer Rating Philosophy Key Strategy Observations
Delaware Large Cap Value Focus
A
The core philosophy underlying the strategy is that the market can inefficiently price securities and that these inefficiencies can be exploited. The team utilizes a concentrated, bottom-up, fundamental approach to manage the strategy, seeking companies that are trading at a discount to their estimated intrinsic values (in the form of earnings power and net assets) with the belief that mean reversion and lower volatility can lead these companies back to fair value.
The team utilizes the S&P 500 Index for portfolio construction purposes, so while the strategy is concentrated, it tends to be diversified across all sectors. The strategy should outperform its peers and the benchmark when investors focus on company fundamentals and lag in speculative markets that favor lower quality names. In addition, it is suitable for assignments requiring a best-ideas approach and a traditional to relative value orientation.
Earnest SMID Cap Value
B+
Earnest employs a disciplined investment philosophy that is rooted in the premise that stock price returns follow identifiable patterns. Its approach seeks to identify what factors drive each stock's returns by focusing on industry clusters. Given the typical characteristics of the firm's portfolios, such as lower P/E's than the market, EARNEST Partners is typically categorized as a value manager. It is important to point out that the firm does not subscribe to a deep value dogma, but rather ends up with a value based portfolio as an outgrowth of the process.
The strategy will tend to fall between value and core over time (relative value). The portfolio is likely to benefit when growth investing is in favor compared to a value oriented benchmark. Given that the process seeks companies with relatively strong profitability measures and higher quality characteristics, the strategy may lag in market environments that reward lower quality companies.
Galliard Stable Value
A
Galliard seeks income generation with the goal of actively managing risk while emphasizing downside risk protection and
low tracking error. Galliard believes the role of fixed income is to control risk and deliver a competitive total return over a longer
time horizon. Value added is primarily derived from sector emphasis and individual security selection utilizing a
fundamental valuation process. Galliard focuses on an above average yield, not positioning the portfolio based on anticipated
nterest rate movements
Hotchkis and Wiley Large Cap
Fundamental Value
A (T)
HWCM takes a fundamental, bottom-up approach to value investing. The firm seeks to exploit mispriced securities by investing in undiscovered or out of favor companies. The firm focuses on stocks where its estimate of the intrinsic value of future cash flows exceeds the market price.
The Large Cap Fundamental Value strategy has a deep value bias and should be expected to trail relative and traditional value managers when markets pull back or in "risk off" environments when investors are particularly risk averse. In addition, because of this bias, returns may not track the relevant index closely and may exhibit stretches of volatility.
47

Manager & Strategy
Mercer Rating Philosophy Key Strategy Observations
Hotchkis and Wiley Mid-Cap
Value B+ (T)
HWCM takes a fundamental, bottom-up approach to value investing. The firm seeks to exploit mispriced securities by investing in undiscovered or out of favor companies. The firm focuses on stocks where its estimate of the intrinsic value of future cash flows exceeds the market price.
HWCM's strategies have a deeper value bias and should be expected to trail more traditional value managers when markets pull back or when investors are particularly risk averse. In addition, because of this bias, returns may not track the relevant index closely and may exhibit stretches of volatility.
TCW Core Plus Fixed Income A
JPMAM employs a value-oriented approach to fixed income management. Through its bottom-up process, the fixed income team identifies inefficiently priced securities. Yield curve management, with an emphasis on evaluating relative risk/reward relationships along the yield curve, is another important element of the firm's approach.
The firm fuses macro themes, bottom-up fundamental research, and robust quantitative analysis into a single well-integrated investment process. TCW has consistently improved its proprietary risk management systems and trading analytic tools to meet the demands of the market.
Loomis Large Cap Growth
B+ (T)
The Large Cap Growth team believes successful growth investing is the result of identifying a limited number of high quality
companies capable of sustaining above average, long-term cash flow growth and purchasing them at discounted prices to their
intrinsic value. The result is a concentrated, low-turnover portfolio of the team's highest conviction ideas.
Due to the strategy's loose portfolio construction guidelines, name concentration, and long-term investment horizon, clients should
expect short-term performance fluctuations in both absolute terms and relative to the Russell 1000 Growth Index. Given the team's
focus on financially strong companies and emphasis on valuation anddownside risk, the strategy usually performs better in flat to down
markets, and may lag when investor appetite for risk is high.
Although the inception date of the strategy under Hamzaogullari'steam and process at Loomis is July 1, 2010, he was able to take withhim the composite track record which dates back to mid-2006 from
Evergreen. However, the track record for the mutual fund (theNatixis Loomis Sayles Growth Fund) includes performance of a
different team and process prior to July 1, 2010.
Mondrian Focused All
Countries World Ex-US Equity
B+
Mondrian is a long-term, value-oriented manager. Mondrian aims to add value through both top-down country allocation and bottom-up stock selection decisions. Over the long term, the manager expects stock selection to account for most of the excess return relative to the index. Mondrian favours countries, and securities within countries, offering the most attractive forecast real returns. These estimates are based on long-term forecasts of dividend payments discounted to present value (i.e. a dividend discount model approach).
The strategy is expected to display persistent factor bias to value and low volatility. A bias towards high dividend yielding stocks is expected to be a persistent feature of this strategy. The strategy will tend to outperform during periods of falling markets, although performance during rising markets is generally mixed. Absolute volatility is expected to be lower than that of the market.
PIMCO Inflation Response Multi-
Asset B+ (W)
IRMAF is designed to hedge global inflation risks while targeting enhanced return opportunities that inflation dynamics may present. The fund provides diversified exposure to a broad opportunity set of inflation factors or assets that will likely respond to different types of inflation including Treasury Inflation-Protected Securities (TIPS), commodities, emerging market (EM) currencies, real estate investment trusts (REITs), gold and tactical use of floating rate securities. Tail-risk hedging strategies are also utilized to limit the impact of periodic market stresses that may affect inflation-related assets.
While the strategy seeks a return in excess of inflation, investors should be aware that CPI is not an investable benchmark and PIMCO does not seek to track it. As such, the shorter-term performance of the strategy will likely be driven by factors other than realized inflation or changes in market inflation expectations. Still, the objective of the strategy is to formulate macroeconomic views regarding potential inflation and then seek exposure to asset classes and investments that should benefit from/protect against inflation and that perform relatively well during periods of rising inflation. While the portfolio is diversified, volatility and downside risk could be higher than expected as many of the underlying asset classes have exposure to common risk factors.
48

Manager & Strategy
Mercer Rating Philosophy Key Strategy Observations
Prudential Core Plus Fixed Income
A
Prudential's Core Plus fixed income strategy is designed to generate excess return from fairly equal increments of both sector allocation and subsector/security selection, and from duration and yield curve on a secondary basis. The active philosophy blends top down and bottom up research to drive sector allocation and issue selection. Duration and yield curve positioning is generally de-emphasized but will be considered when market opportunities dictate. The Core Plus strategy will allocate to non-benchmark sectors, including non-agency mortgage, high yield, and emerging markets.
Sands Select Growth Equity
A (T)
Sands is a bottom-up, quality growth manager. The firm builds concentrated portfolios of leading companies, which are broadly diversified across a number of business lines. Sands follows a buy and hold philosophy with low turnover. The long-term investment horizon allows the companies in the portfolio to realize long-term business opportunities that lead to shareholder wealth creation.
The strategy is expected to have a persistent factor bias to size. Given the strategy's loose constraints and concentrated nature, tracking error can be high at times. Short-term deviations relative to the benchmark can be quite significant and clients invested with Sands should be willing to take a long-term perspective. The strategy is best classified as aggressive growth.
TimesSquare SMID Cap Growth
A
TSCM believes that their detailed approach and proprietary fundamental growth equity research skills, which place a particular emphasis on the assessment of management quality (and alignment with shareholders) and a comprehensive understanding of superior business models, enable their team to build a diversified portfolio that will generate superior risk adjusted returns over the long run.
TSCM Mid Cap Growth and SMID Cap Growth each display a persistent bias to profitability relative to a core benchmark and are thus best classified as traditional growth sub-style exposures. Although the portfolios are sufficiently diversified on a holdings-count basis, relative sector exposures at times can be meaningful (however, not meaningful enough to warrant tracking error designations as there are upper relative limits for the strategies versus the larger index sector weights). Given the team's traditional growth sub-style and their valuation discipline, strategy performance may lag in more speculative, momentum driven markets.
WEDGE Small/Mid Cap
Value B+
The firm's philosophy is based on the premise that value investing produces superior investment returns over time and that quantitative analysis can increase the probability of investment success. Through fundamental and quantitative processes, the team seeks stocks that meet its value and quality criteria.
Given the strategy's focus on higher quality companies and tendency to overweight lower beta names; it may struggle in market environments that reward lower quality and higher beta stocks. Nonetheless, WEDGE has experienced few periods of significant underperformance and generally helps protect capital in difficult market environments.
49

Manager & Strategy
Mercer Rating Philosophy Key Strategy Observations
Wellington Global Opportunities
(Choumenkovitch) B+
Wellington believes mispriced returns on capital drive stock prices either because the market underestimates improvements in returns or underestimates the sustainability of returns. To that end, the team applies a bottom-up, fundamental process to find companies where opportunities to improve returns are misunderstood by the market place. The strategy does not have a consistent style bias and holdings typically include growth and value ideas; hence, the strategy is most appropriately classified a core approach.
The strategy is broadly diversified and benchmark sensitive. The strategy typically exhibits an active share of 80% or higher.
Over the long term, the portfolio should be close to neutral relative to the benchmark in terms of country allocation, industry and capitalization range. The approach performs best in broadly-trending markets, but suffers at market extremes such as a flight-to-quality or strong momentum markets. It will also underperform when mega cap stocks are leading the markets.
Wellington Opportunistic
Growth A
The investment objective of the Opportunistic Growth portfolio is to provide long-term, total returns above the growth indexes by investing in the stocks of successful, growing companies. Over the long term, Wellington believes companies that can sustain above average earnings growth will outperform the growth indices and the market overall.
The Opportunistic Growth portfolio, considered to be a traditional growth strategy, should be expected to perform well during up-trending growth markets. However, because the strategy is driven by strong fundamentals and considers valuation, the portfolio is expected to underperform when the market becomes more speculative or risk-seeking.
50

Disclaimer
51

Important notices
References to Mercer shall be construed to include Mercer LLC and/or its associated companies.
© 2017 Mercer LLC. All rights reserved.
This contains confidential and proprietary information of Mercer and is intended for the exclusive use of the parties to whom it wasprovided by Mercer. Its content may not be modified, sold or otherwise provided, in whole or in part, to any other person or entity,without Mercer’s prior written permission.
Mercer does not provide tax or legal advice. You should contact your tax advisor, accountant and/or attorney before making anydecisions with tax or legal implications.
The findings, ratings and/or opinions expressed herein are the intellectual property of Mercer and are subject to change without notice.They are not intended to convey any guarantees as to the future performance of the investment products, asset classes or capitalmarkets discussed. Past performance does not guarantee future results. Mercer’s ratings do not constitute individualized investmentadvice.
Information contained herein has been obtained from a range of third party sources. While the information is believed to be reliable,Mercer has not sought to verify it independently. As such, Mercer makes no representations or warranties as to the accuracy of theinformation presented and takes no responsibility or liability (including for indirect, consequential or incidental damages), for any error,omission or inaccuracy in the data supplied by any third party.
Mercer urges you to compare this report to any custodial statements and third party manager statements that you receive for accuracy.
This does not constitute an offer or a solicitation of an offer to buy or sell securities, commodities and/or any other financial instrumentsor products or constitute a solicitation on behalf of any of the investment managers, their affiliates, products or strategies that Mercermay evaluate or recommend.
The value of your investments can go down as well as up, and you may not get back the amount you have invested. Investmentsdenominated in a foreign currency will fluctuate with the value of the currency. Certain investments, such as securities issued by smallcapitalization, foreign and emerging market issuers, real property, and illiquid, leveraged or high-yield funds, carry additional risks thatshould be considered before choosing an investment manager or making an investment decision.
52

For the most recent approved ratings of an investment strategy, and a fuller explanation of their meanings, contact your Mercerrepresentative.
For Mercer’s conflict of interest disclosures, contact your Mercer representative or see www.mercer.com/conflictsofinterest.
Returns for periods greater than one year are annualized. Returns are calculated gross of investment management fees, unless notedas net of fees.
Style analysis graph time periods may differ reflecting the length of performance history available.
Mercer universes: Mercer’s universes are intended to provide collective samples of strategies that best allow for robust peer groupcomparisons over a chosen timeframe. Mercer does not assert that the peer groups are wholly representative of and applicable to allstrategies available to investors.
THE FOLLOWING PROVISIONS APPLY TO DATA OR OTHER SERVICES PROVIDED BY THE FOLLOWING COMPANIES: Where“End User” appears before the Vendor name, a direct end-user license with the Vendor is required to receive some indices. You areresponsible for ensuring you have in place all such licenses as are required by Vendors.
BARCLAYS: © Barclays Bank PLC 2017. This data is provided by Barclays Bank PLC. Barclays Bank PLC and its affiliated companiesaccept no liability for the accuracy, timeliness or completeness of such data which is provided “as is.” All warranties in relation to suchdata are hereby extended to the fullest extent permitted under applicable law.
BARCLAYS CAPITAL: The Barclays Indices are a proprietary product of Barclays. Barclays shall maintain exclusive ownership of andrights to the Barclays Indices and that inclusion of the Barclays Indices in this Service shall not be construed to vest in the subscriberany rights with respect to the Indices. The subscriber agrees that it will not remove any copyright notice or other notification or tradename or marks of Barclays that may appear in the Barclays Indices and that any reproduction and/or distribution of the Barclays Indices(if authorized) shall contain such notices and/or marks.
BARRA: © 2017 Barra International, Ltd. All rights reserved. This information may only be used for your internal use, may not bereproduced or re-disseminated in any form and may not be used to create any financial instruments or products or any indices. Thisinformation is provided on an “as is” basis and the user of this information assumes the entire risk of any use it may make or permit tobe made of this information. Neither MSCI, any of its affiliates or any other person involved in or related to compiling, computing orcreating this information makes any express or implied warranties or representations with respect to such information or the results tobe obtained by the use thereof, and MSCI, its affiliates and each such other person hereby expressly disclaim all warranties (including,without limitation, all warranties of originality, accuracy, completeness, timeliness, non-infringement, merchantability and fitness for aparticular purpose) with respect to this information. Without limiting any of the foregoing, in no event shall MSCI, any of its affiliates orany other person involved in or related to compiling, computing or creating this information have any liability for any direct, indirect,
53

special, incidental, punitive, consequential or any other damages (including, without limitation, lost profits) even if notified of, or if it mightotherwise have anticipated, the possibility of such damages. BARRA is a registered trademark of MSCI, Inc.
BLOOMBERG L.P.: © 2017 Bloomberg L.P. All rights reserved. BLOOMBERG, BLOOMBERG PROFESSIONAL, BLOOMBERGFINANCIAL MARKETS, BLOOMBERG NEWS, BLOOMBERG TRADEMARK, BLOOMBERG BONDTRADER, AND BLOOMBERGTELEVISION are trademarks and service marks of Bloomberg L.P. a Delaware Limited Partnership.
BURGISS: © 2017 Burgiss Group, LLC. All rights reserved. PRIVATE I, PRIVATE INFORMANT and PRIVATE IQ are trademarks andservice marks of Burgiss Group, LLC.
CENTER FOR RESEARCH IN SECURITY PRICES (CRSP): Derived based upon data from Center for Research in Security Prices(CRSP® ), The University of Chicago Booth School of Business.
CITIGROUP GLOBAL MARKETS (formerly SALOMON SMITH BARNEY): Smith Barneysm and Citigroup Global Equity Indexsm areservice marks of Citigroup Inc. "BECAUSE ACCURACY COUNTS®" is a registered service mark of Citigroup Inc. FloatWatch© is atrademark of Citigroup Inc. Citigroup Global Equity Index Systemsm , Citigroup Broad Market Indexsm, Citigroup Primary Market Indexsm,Citigroup Extended Market Indexsm, Citigroup Cap-Range Indexsm, Citigroup Internet Index (NIX)sm, Citigroup Style Indices(Growth/Value)sm, Citigroup Property Indexsm are service marks of Citigroup Inc. ©2017 Citigroup Inc. All rights reserved. Anyunauthorized use, duplication or disclosure is prohibited by law and may result in prosecution. Citigroup, including its parent,subsidiaries and/or affiliates ("the Firm"), usually makes a market in the securities discussed or recommended in its report and may sellto or buy from customers, as principal, securities discussed or recommended in its report. The Firm or employees preparing its reportmay have a position in securities or options of any company discussed or recommended in its report. An employee of the Firm may be adirector of a company discussed or recommended in its report. The Firm may perform or solicit investment banking or other servicesfrom any company discussed or recommended in its report. Securities recommended, offered, or sold by SSB: (i) are not insured by theFederal Deposit Insurance Corporation; (ii) are not deposits or other obligations of any insured depository institution (including Citibank);and (iii) are subject to investment risks, including the possible loss of the principal amount invested. Although information has beenobtained from and is based upon sources SSB believes to be reliable, we do not guarantee its accuracy and it may be incomplete orcondensed. All opinions and estimates constitute SSB’s judgment as of the date of the report and are subject to change without notice.Its report is for informational purposes only and is not intended as an offer or solicitation for the purchase or sale of a security. Its reportdoes not take into account the investment objectives or financial situation of any particular person. Investors should obtain advice basedon their own individual circumstances before making an investment decision.
CREDIT SUISSE FIRST BOSTON LLC. (CSFB): Copyright © 1996 – 2017 Credit Suisse First Boston LLC and/or its affiliatecompanies. All rights reserved.
DATASTREAM: Source: ThomsonReuters Datastream.
54

DOW JONES: The Dow Jones IndexesSM are proprietary to and distributed by Dow Jones & Company, Inc. and have been licensed foruse. All content of Dow Jones IndexesSM © 2017 is proprietary to Dow Jones & Company, Inc.
“End User” FTSE™ : is a trademark of the London Stock Exchange PLC and The Financial Times Limited and is used by FTSEInternational Limited under license. Russell Investment Group Europe Ltd is licensed by FTSE International Limited to distribute FTSEAdvanced Service and other FTSE indices. FTSE shall not be responsible for any error or omission in FTSE data. All copyright anddatabase rights in FTSE products belong to FTSE or its licensors. Redistribution of the data comprising the FTSE products is notpermitted. You agree to comply with any restrictions or conditions imposed upon the use, access, or storage of the data as may benotified to you by FTSE or Russell/Mellon Europe Ltd. You are not permitted to receive the FTSE Advanced Service unless you have aseparate agreement with FTSE. “FTSE™”, “FT-SE™” and “Footsie™” are trademarks of London Stock Exchange PLC and TheFinancial Times Limited and are used by FTSE International Limited under license.
The FTSE Private Investor Indices are owned and calculated by FTSE International and are produced in association with APCIMS(Association of Private Client Investment Managers and Stockbrokers). ã FTSE International Limited 2017.
The UK Value and Growth Indices are owned and calculated by FTSE International Limited in association with Russell InvestmentGroup. ã FTSE International Limited 2017.
HFRI: Source: Hedge Fund Research, Inc., © HFR, Inc. 2017, www.hedgefundresearch.com.
IMONEYNET: © iMoneyNet, an Informa Business.
INTERACTIVE DATA: © 2017 Interactive Data Pricing and Reference Data, Inc.
IPD: Fund information has not been independently validated by IPD. IPD did not produce this performance report.
JPMORGAN: The JPMorgan EMBI Index (i) is protected by copyright and JPMorgan claims trade secret rights, (ii) is and shall remainthe sole property of JPMorgan, and (iii) title and full ownership in the JPMorgan EMBI Index is reserved to and shall remain withJPMorgan. All proprietary and intellectual property rights of any nature, including patents, copyrights, trademarks and trade secretsregarding the JPMorgan EMBI Index, and any and all parts, copies, modifications, enhancements and derivative works are owned by,and shall remain the property of JPMorgan and its affiliates. The JPMorgan EMBI Index and related materials and software weredeveloped, compiled, prepared and arranged by JPMorgan through expenditure of substantial time, effort and money and constitutevaluable intellectual property and trade secrets of JPMorgan. The JPMorgan EMBI Index shall not be used in a manner that wouldinfringe the property rights of JPMorgan or others or violate the laws, tariffs, or regulations of any country.
LIPPER: Performance data was supplied by Lipper, A Thomson Reuters Company, subject to the following: Copyright 2017 © ThomsonReuters. All rights reserved. Any copying, republication or redistribution of Lipper Information, including by caching, framing or similar
55

means, is expressly prohibited without the prior written consent of Lipper. Lipper shall not be liable for any errors or delays in theInformation, or for any actions taken in reliance thereon. Lipper performance data is total return, and is preliminary and subject torevision. The data contained herein has been obtained from company reports, financial reporting services, periodicals, and otherresources believed to be reasonable. Although carefully verified, data on compilations is not guaranteed by Lipper Inc. – A ReutersCompany and may be incomplete. No offer or solicitations to buy or sell any of the securities herein is being made by Lipper. Portions ofthe information contained in this report were derived by Mercer using Content supplied by Lipper, A Thomson Reuters Company.
MERRILL LYNCH: The Merrill Lynch Indices are used with permission. Copyright 2016, Merrill Lynch, Pierce, Fenner & SmithIncorporated. All rights reserved. The Merrill Lynch Indices may not be copied, used, or distributed without Merrill Lynch’s prior writtenapproval.
This Product is not sponsored, endorsed, sold or promoted by Merrill Lynch. Merrill Lynch makes no guarantees, representations orwarranties of any kind, express or implied, to any person, including, without limitation, any member of the public regarding the use of theIndices in the Product, the advisability of investing in securities generally or of the ability of the Index to track any market performance.Merrill Lynch’s only relationship to Mellon Analytical Solutions or any other person or entity in respect to this Product is limited to thelicensing of the Merrill Lynch Indices, which are determined, composed, and calculated by Merrill Lynch without regard to MellonAnalytical Solutions or this Product. Merrill Lynch retains exclusive ownership of the Indices and the programs and trademarks used inconnection with the Indices. Merrill Lynch has no obligation to take the needs of Mellon Analytical Solutions or the purchasers, investorsor participants in the Product into consideration in determining, composing or calculating the Indices, nor shall Merrill Lynch have anyobligation to continue to calculate or provide the Indices in the future. Merrill Lynch may, in its absolute discretion and without priornotice, revise or terminate the Indices at any time. IN NO EVENT SHALL MERRILL LYNCH OR ANY OF ITS PARTNERS,AFFILIATES, EMPLOYEES, OFFICERS, DIRECTORS OR AGENTS HAVE ANY LIABILITY TO ANY PERSON OR ENTITY FOR ANYINDIRECT, PUNITIVE, SPECIAL, OR CONSEQUENTIAL DAMAGES, INCLUDING LOST PROFITS.
MOODY’S INVESTORS SERVICE: Moody’s © Copyright 2016, Moody’s Investors Service, Inc. (“Moody’s). Moody’s ratings (“Ratings”)are proprietary to Moody’s or its affiliates and are protected by copyright and other intellectual property laws. Ratings are licensed toDistributor by Moody’s. RATINGS MAY NOT BE COPIED OR OTHERWISE REPRODUCED, REPACKAGED, FURTHERTRANSMITTED, TRANSFERRED, DISSEMINATED, REDISTRIBUTED OR RESOLD, OR STORED FOR SUBSEQUENT USE FORANY SUCH PURPOSE, IN WHOLE OR IN PART, IN ANY FORM OR MANNER OR BY ANY MEANS WHATSOEVER, BY ANYPERSON WITHOUT MOODY’S PRIOR WRITTEN CONSENT. Moody’s® is a registered trademark of Moody’s Investors Service, Inc.
MORNINGSTAR: Copyright (c) 2017 Morningstar. Portions of this report are the property of Morningstar, Inc. or its InformationProviders and are protected by copyright and intellectual property laws. All rights reserved.
MSCI®: By receiving the information contained herein, you hereby agree to the following terms and conditions: Portions of the information contained herein are owned by MSCI Inc. This information may only be used for your internal use, may not be modified, reproduced or redisseminated in any form and may not be directly or indirectly used to create any financial instruments or products or any indexes. This information is provided on an “as is” basis and any user of this information assumes the entire risk of any use it may make or permit to be made of this information. Neither MSCI Inc., its affiliates nor any other party involved in or related to compiling, computing or creating this information (the “MSCI Parties”) makes any express or implied warranties or representations with respect to such information or the results to be obtained by the use thereof.
56

MSCI® (cont):The MSCI Parties hereby expressly disclaim all warranties (including, without limitation, all warranties of originality, accuracy, completeness, timeliness, non infringement, merchantability and fitness for a particular purpose) with respect to this information. Without limiting any of the foregoing, in no event shall any of the MSCI Parties have any liability for any direct, indirect, special, incidental, punitive, consequential or any other damages (including, without limitation, lost profits) even if notified of, or if it might otherwise have anticipated, the possibility of such damages.
NAREIT: NAREIT® is the exclusive registered mark of the National Association of Real Estate Investment Trusts.
NCREIF: All NCREIF Data – Copyright by the National Council of Real Estate Investment Fiduciaries. This information is proprietary and may not be reported in whole or in part without written permission.
PRIVATE INFORMANT: © 2017 The Burgiss Group, LLC.
RUSSELL INVESTMENT GROUP: Russell Investment Group is the source and owner of certain of the data contained or reflected in this material and all trademarks and copyrights related thereto. The material may contain confidential information and unauthorized use, disclosure, copying, dissemination or redistribution is strictly prohibited. This is a user presentation of the data. Russell Investment Group is not responsible for the formatting or configuration of this material or for any inaccuracy in presentation thereof. Russell indices are trademarks/service marks of the Russell Investment Group. Russell® is a trademark of the Russell Investment Group.
STANDARD & POOR’S: Standard & Poor’s information contained in this document is subject to change without notice. Standard & Poor’s cannot guarantee the accuracy, adequacy or completeness of the information and is not responsible for any errors or omissions or for results obtained from use of such information. Standard & Poor’s makes no warranties or merchantability or fitness for a particular purpose. In no event shall Standard & Poor’s be liable for direct, indirect or incidental, special or consequential damages from the information here regardless of whether such damages were foreseen or unforeseen.
STYLE RESEARCH: Source: Style Research Ltd.
WILSHIRE ASSOCIATES: Copyright © 2017 Wilshire Associates Incorporated.
Investment advisory services provided by Mercer Investment Consulting LLC. Mercer Investment Consulting LLC is a federallyregistered investment advisor under the Investment Advisers Act of 1940, as amended, providing nondiscretionary and discretionaryinvestment advice to its clients on an individual basis. Registration as an investment advisor does not imply a certain level of skill ortraining. The oral and written communications of an advisor provide you with information about which you determine to hire or retain anadvisor. Mercer’s Form ADV Part 2A & 2B can be obtained by written request directed to: Compliance Department, Mercer Investments,701 Market Street, Suite 1100, St. Louis, MO 63011.
57

Services Provided by Mercer Investment Consulting LLC