performance evaluation of islamic and non-islamic equity
TRANSCRIPT
Munich Personal RePEc Archive
Performance Evaluation of Islamic and
Non-Islamic Equity and Bonds Indices:
Evidence from selected Emerging and
Developed Countries
Audi, Marc and Sadiq, Azhar and Ali, Amjad
European School of Administration and Management(ESAM)-France. University Paris 1 Pantheon Sorbonne-France.,Lahore School of Accountancy and Finance, University of Lahore,Pakistan., European School of Administration and Management(ESAM)-France. Lahore School of Accountancy and Finance,University of Lahore, Pakistan.
2021
Online at https://mpra.ub.uni-muenchen.de/109866/
MPRA Paper No. 109866, posted 25 Sep 2021 14:43 UTC
i
Performance Evaluation of Islamic and Non-Islamic Equity and Bonds Indices: Evidence
from selected Emerging and Developed Countries
Marc Audi1
European School of Administration and Management (ESAM)-France. University Paris 1 Pantheon Sorbonne-France.
Azhar Sadiq2
Lahore School of Accountancy and Finance, University of Lahore, Pakistan.
Amjad Ali3
European School of Administration and Management (ESAM)-France. Lahore School of Accountancy and Finance, University of Lahore, Pakistan.
Abstract
This article has examined the differences in performance between the Islamic and conventional stocks and bond indices in the developed and emerging countries. The sample period is consisted of 2007 to 2018 in equity, whereas the period of debt is from 2014 to 2018. Different risk-adjusted return measurements have been applied to investigate that Islamic stock indices' performance is better than conventional indices. The results show that the Islamic equity indices have better performance than the traditional indices in financial crisis. The individual sample concludes that Islamic equity indices of Germany and the UK perform better than traditional indices, but in the USA conventional indices perform better. The performance of Shariah equity indices in all selected emerging countries is better than the traditional equity indices. This shows that Islamic indices are highly demanded throughout the world as an alternative to traditional indices. Keywords: Financial Crisis, Risk-Adjusted Measures, Shariah Screening Process I. Introduction
The stock exchange is considered one of the vital sectors of the modern economy (Myers, 1993; Fama and French, 1998; Antoniou et al. 2003; Boumedience and Caby, 2009). The first shares were issued by the Amsterdam Stock Exchange, during the year 1602 by the Dutch East Indian Company. Numerous studies of developed countries have highlighted the importance of bonds and stock returns (Koutoms, 1996; Baur et al., 2006; Daly, 2003). During the early sixties, few countries have established their Shariah institutes, but the actual commencing of the Islamic financial market took place during the mid-seventies. The expansion of Islamic finance in the last decade is tremendous, especially, growth in the capital value of the Muslim investors and they desire to make investments in such financial products which work according to Islamic laws. Islamic finance is different from its traditional counterpart due to its unique characteristics and risk measurement. The behavior of Islamic finance is not the same to the conventional finance during the period of financial turbulence, as the conventional system deals with risks in the same way during the normal period and financial crisis period but the Islamic system does not deal with risks in traditional manners (Hammoudeh et al., 2014). Dow Jones, FTSE, S&P, and Morgan
1 Provost/ Director of Academic Affairs at European School of Administration and Management (ESAM)-France. University Paris 1 Pantheon Sorbonne-France. 2 Research Scholar at Lahore School of Accountancy and Finance, University of Lahore, Pakistan. 3 Associate Researcher; European School of Administration and Management (ESAM)-France. Assistant Professor at Lahore School of Accountancy and Finance, University of Lahore, Pakistan. *Corresponding Author: [email protected]
2
Stanley are globally recognized indices providers, they have introduced the Shariah-compliant indices. Islamic indices are launched in 1998, the index DMI 150 commences jointly by Faisal Finance and Bank Vontebel to measure the performance of 150 publicly traded global companies. Dow Jones has launched the Dow Jones Islamic Market Index (DJIMI) in 1999 and the FTSE has launched a Global Islamic Index Series (GIIS) at the London Stock Exchange in 1999. Standard and Poor’s have launched the Islamic indices in 2006 and MSCI has created its family of Islamic indices in 2007. During the financial crisis of 1990, when Islamic banks have successfully managed this period with most investors. Islamic financial products are growing at a considerable growth rate, its assets are $1.6 trillion in 2012, $1.8 trillion in 2013, $2.1 trillion in 2014, and expectedly by 2020 Islamic asset value will be $6.5 trillion (Hammoudeh et al., 2014). The allocation of Islamic funds is 9% real assets, 11.8% mixed assets, 22.2% cash markets, and 46.9% stocks. Islamic stocks are accounted for 47%, investors in the world market (Mehmood et al., 2016). This shows the rising importance of Islamic stocks and bond indices. El Qorchi (2005) and Pok (2012) mention that the world is showing a specific shift from traditional financial products to Shariah financial products. Regarding the financial crisis of 2008- 2009, the effect on both Shariah and traditional indices is negative. But Islamic indices are comparatively more stable because they are less turbulent and they modify themselves with market changes and fluctuations. Jounie and Past’re (2009) mention that in the period of the financial crisis, Islamic products have become more attractive and comparatively safe for investors from high risky conventional products. Wahdy (2007) explains that Sukuks are more efficient as compared to traditional bonds. Tariq (2004) and Afshar (2013) mention that the risk of Islamic bond structures is very easily understandable as compared to conventional bond structures. In 1998, the first Sukuk was issued in the public market, caught concentration of prevailing journals as well as the serious press. Bloomberg data source also covered the Sukuk market (Lane, 2006). By 2014, along with conventional bonds, the modern type of bonds (Sukuk) were issued and acknowledged for dealing in the same market almost in seventeen different locations worldwide. In a traditional bond, return receives in the form of interest, but Islamic structure is part of Usuary (Tariq 2004). Afshar (2013) provides the risk and return differentiation of the conventional bonds from Sukuk. The first major discrepancy between the Sukuk and bonds is the yield. The yield (return) from a Sukuk issue is based on profit/ share, which neither can be fixed nor predetermined (Ariff et al., 2017). Sukuk is growing rapidly, having more benefits as compared to conventional bonds. Recently, a rise has been witnessed in global Sukuk issuance, according to the Bloomberg database, 1,200 billion US dollars have been invested in Islamic bonds (Safari et al., 2014). In the present era, Islamic and conventional financial systems are operating at the same time among many countries. Either, Islamic or conventional investment activities are attached with risks that lower their performance. The study has tried to provide unique differences between Shariah and conventional stocks/bonds indices performances. This study is equally important for credit controllers, managers of the mutual fund, general investors, and investment analysts. The study will motivate researchers who have an interest in Islamic finance, may complete similar studies in other countries because there are scarce studies to compare equity and debt performance together. This study may support the investors in decision making that how they can get maximum earnings through making investments in Islamic instruments or traditional instruments. Policymakers can take help from this study on the level of returns on both types of stocks and bonds. The government also needs to get ample funds for economic development, the government can get it by issuing Islamic or traditional bonds to the financial institutes. To the best of our knowledge, there is no study about similar nature, this study will be a healthy contribution towards respective literature.
3
II. Literature Review
This section of the study provides a detailed literature review, which gives the premises and grounds for the present research study. Most of the studies related to the performance of the equity market and their financial performance are based on traditional indices. Nonetheless, not much empirical literature is available on the financial performance of the Shariah equity market indices. Parallel to Islamic mutual funds and Islamic banks, due to shorter history of Islamic indices (Davidson and Duclos, 2000; Beik and Wardhana, 2011; Albaity and Mudor, 2012; Setiawan and Oktariza, 2013; El Hammoudeh et al., 2014; Al Khazali et al., 2014; Khamlchi et al., 2014; Jawadi et al., 2014; Alexakis et al., 2015; Alam et al., 2016; Hoque et al., 2016; Rejeb and Arfaoui, 2016; Narayan and Bannigidadmath, 2017; El Amri and Hamza, 2017). Some studies mention that Islamic equity indices are in forms of financial principles and regulations based on qualitative (Naughton and Naughton, 2002; Charles et al., 2012; Abbes, 2012; Sukmana and Kolid, 2012; Ashraf, 2013; Rizvi and Masih, 2013; Fu and Reddy, 2014; Ho et al., 2014; Dewandaru et al., 2014; El Khamlichi et al., 2014; Rizvi and Arshad, 2014; Rana and Akhter, 2015; Ata and Buğan, 2015; Ali, 2015; Ali and Rehman, 2015; Narayan et al., 2016; Rizkiah and Da’rain 2016; Mehmood et al., 2016; Alam and Rajjaque, 2016; El Amri and Hamza, 2017; Saâdaoui et al., 2017; Ali and Bibi, 2017; Ali, 2018). The Muslim world has started to use Islamic equity indices as a substitute investment in 1997. The comparison between Sukuk and conventional bonds is being made in various studies in terms of framework and markets' perception to accept it as a different investment. Ahmad and Radzi (2011) examine the performance of traditional bonds and Islamic bonds in the Malaysian market from 1990 to 2009. The results show that the Islamic bond supersedes the non-Islamic bond in the crisis period. The face value of the non-Islamic bond is more fluctuated as compared to the Islamic bond. The short-run Islamic bond is less affected by the bad market condition, as the decline in Islamic bond growth is thirty-eight percent, while there is a double change in the growth of non-Islamic bonds. Safari (2011) evaluates that the return on Islamic bonds and conventional bonds from August 2005 to January 2011. The results show that there is a positive relationship between the return of Sukuk and bonds. This demonstrates that the return on Sukuk is more than the conventional bonds. Ramasamy et al., (2011) examine the correlation of the Sukuk to sovereign bonds and traditional bonds in the Malaysian market regarding complexity and sensitivity. The findings show that in the case of sensitivity measures, Sukuk is better as compared to traditional bonds. The results confirm that the ratio of risk is less in Sukuk than in traditional bonds. The venture capitalist will enjoy a more rate of return as compared to sovereign bonds, but enjoy less rate of return as compared to traditional bonds. Zin et al. (2011) explore the future expectations of Sukuk in the Malaysian market and the advantages and value-added in the Islamic capital market. No doubt, Sukuk is an emerging and promising tool for investors and financiers. Fathurahman and Fitriati (2013) attempt to investigate the comparison of return between the Islamic and non-Islamic bonds in Indonesia. Ten groups of non-Islamic bonds are compared with the Islamic bonds traded in 2011. The results show that non-Islamic bonds have higher nominal value than Islamic bonds. Non-Islamic bonds have a lower maximum trading price as compare to Islamic bonds and also have a lower risk as compared to Islamic bonds. It is summarized that the mean return of non-Islamic bonds is smaller than the mean return of Islamic bonds. Ariff et al., (2013) discuss the average return of Sukuk and traditional bonds in Malaysia from 2005-2011. The results show that Islamic bonds are riskier, so they have a higher return than non-Islamic bonds. Islamic bonds are riskier may be due to the sharing of profits or rent payments to the investors. The Granger causality test shows that there is no interconnection between the returns of Sukuk and non-Islamic bonds. El Mosaid and Boutti (2014) investigate the performance evaluation of the Sukuk and conventional bonds in Malaysia from 2007-2012. Islamic bonds perform better than non-Islamic bonds and results from paired sample t-test
4
explain that yield of Islamic bonds has a maturity of less than a year, which is higher than the conventional bonds. There is no interconnection between the bonds. Ariff et al., (2017) examine the return performance of Sukuk and conventional bonds in Malaysia from 2005-2014. The return of Sukuk is impressively higher than the conventional bonds. The difference between the return is about 3–25 basis points across the listed debt market. Naifar et al., (2017) examine the distinction between the return of conventional bonds and Islamic bonds in monetary and non-monetary unpredictable situations from 2010-2014. The Findings from this method expressed that Islamic bonds and non-Islamic bonds both affect unpredictable situations, but non-Islamic bonds are more responsive towards the change in the market. It is also found that the presence of Islamic bonds in the portfolio with non-Islamic bonds may reduce the risk-return. III. The model
The capital Asset Pricing Model (CAMP) model has been used for measuring the analysis of indices’ performance. The capital Asset Pricing Model (CAMP) has been developed by Sharpe (1964), Lintner (1965), and Mossin (1966). The CAPM is based on a few assumptions. Firstly, it is believed by investors that over a single time perspective the distribution of return on assets is homogeneous. Secondary, Fama and French (2004) explain that it is also believed by investors to have limitless lending and borrowing at a risk-free rate. Thirdly, imperfections are not expected in financial markets, i.e. Components such as cost of transaction and tax are not present. Lastly, financial markets are expected to have perfect competition, which means stock prices cannot be influenced by a single investor. The CAPM can calculate the expected return of an asset with the effect of its risk.
Ei = Rf + β (Em – Rf) (1) Ei = Expected return of investment Rf = Risk free rate β = Beta of the investment Em = Expected return of market
Friend and Blume (1970) and Black et. al. (1972) mention that more (less) risky assets gain lower (higher) returns than anticipated by CAMP Model. If given the presumption by the CAMP is true, then the only important determinant of return of an asset is beta. Many evidences negate with the CAMP model (Basu, 1977; Reinganum, 1981; Banz, 1981; Bhandari, 1988). Despite the fact, it CAMP fails in numerous empirical tests, but still it is a useful method in current literature. IV. Econometric Methodology
The application of econometric tools on financial models is one of the most important aspects of quantitative economic analysis. When we employ the statistical principles on the panel and time-series data, it is required to check whether the variables are stationary or not. So, the first step is to check the stationarity of the variables. This study has used Dickey and Fuller (1981), Philips Perron (1988), and KPSS unit root tests for this purpose. For measuring the volatility of the selected series ARCH and GARCH models have been applied. Granger causality test (1969) has been used for examining the causal relationship between variables. V. Results and Discussion
This part of the study presents the findings and discussion based on findings. The basic aim of our study is to examine the difference in returns between Shariah and conventional indices of developed and emerging countries and the return performance of bonds and Sukuk. We have divided our analysis into three parts: before the crisis period, during the crisis, and after the crisis period. The first analysis includes the whole period of the study from 2007 to 2018. Secondly, the pre-crisis period ranges from June 2007 to December 2007, during the crisis period from

5
January 2008 to December 2009, and finally, the period from January 2010 to December 2018 covers the post-crisis period. This study has commenced the results with conventional equity and Islamic equity indices. The results of descriptive statistics of Islamic and traditional index returns of developed countries and emerging countries for the overall sample have been given in Table 1. The results present the mean return, standard deviation, skewness, and kurtosis values for each developed and emerging country. The mean return is positive for both Islamic indices and conventional indices of all selected countries. In emerging countries, the mean return of the Islamic index shows an increasing return as compared to the conventional index. In developed countries except for the USA, the mean return of the Islamic index shows an increasing return as compared to the conventional index. Standard deviation is the key to measure the risk of these indices. In emerging countries, the value of standard deviation is higher for Islamic indices than the conventional indices. In developed countries except for the USA, the value of standard deviation is higher in Islamic indices than the conventional indices. The positive relation between risk and return means that if there is a high risk in the investment, the investor is willing to get the highest return from that investment. In simple words; high risk, high return. Following previous studies of Mookerjee and Yu (1999) and Hussein and Omran (2005) also have the same type of findings. The skewness is negative in emerging countries and developed countries except for the USA, this means that there is left-tailed distribution. In the USA, the results of the skewness are positive which indicates that there is right-tailed distribution. The results from kurtosis in all countries are more than three, which show a leptokurtic distribution in the indices. Simply, this reveals that the tails of the distributions are thicker than the normal distribution. Table 1. Summary Statistics of Islamic and Conventional Indices Overall Period
Developed Countries Emerging Countries Germany UK USA Malaysia Pakistan UAE
Conventional Indices
Mean 0.02158 0.02414 0.03230 0.01944 0.02671 0.01149
Std. Deviation
1.37006 1.18212 1.24042 0.74883 1.36662 1.70063
Skewness -0.17587 -0.05396 0.12137 -0.76242 -0.31350 -0.12801
Kurtosis 9.76792 11.16237 14.15010 16.75839 8.47509 20.33616
Islamic Indices
Mean 0.02313 0.02977 0.02812 0.02787 0.03595 0.02017
Std. Deviation
1.37819 1.21807 1.17264 0.78323 1.41376 1.91766
Skewness -0.32111 -0.14449 0.05303 -0.56392 -0.02644 -0.15313
Kurtosis 13.70959 10.39317 15.20132 15.56814 6.23563 17.58998
Table 2 presents the descriptive statistic of the Islamic indices and conventional indices during the pre-crisis period. The results show that the mean return of developed countries is higher for Islamic indices than conventional indices. In emerging countries, the mean return of Islamic indices is higher than the conventional indices except for Pakistan. This difference may have happened because Pakistan is at the early stages of investment in Islamic stocks. The value of the standard deviation of the Islamic indices is higher in developed countries as compared to the conventional indices. The results of standard deviation are higher in emerging countries for the Islamic indices than the conventional indices except for Pakistan. The skewness is negative in both developed and emerging countries. In all countries, results from kurtosis are more than three, which means that there is a leptokurtic distribution in the indices.

6
Table 2. Summary Statistics of Islamic And Conventional Indices Pre-Crisis Period Developed Countries Emerging Countries Germany UK USA Malaysia Pakistan UAE
Conventional Indices
Mean 0.02957 0.02842 0.02176 0.06985 0.03221 0.11393
Std. Deviation 1.04707 1.25794 1.15312 1.02807 1.38323 1.26600
Skewness - 0.12957 - 0.21462 - 0.18020 -0.01107 - 0.83060 - 0.06830
Kurtosis 3.02068 3.70397 3.28832 5.88525 4.80934 4.17480
Islamic Indices
Mean 0.03127 0.03219 0.02344 0.10115 0.02508 0.18784
Std. Deviation 1.18522 1.27400 1.19065 1.15668 1.32570 1.41145
Skewness - 0.10236 - 0.22305 - 0.32009 -0.23102 - 1.02708 -0.13617
Kurtosis 3.36010 3.67419 3.07603 4.35220 5.55728 5.81076
Table 3. Summary Statistics of Islamic and Conventional Indices during Crisis Period Developed Countries Emerging Countries Germany UK USA Malaysia Pakistan UAE
Conventional Indices
Mean -0.04618 -0.02441 -0.01671 -0.00756 -0.04013 -0.14450
Std. Deviation 2.14660 1.97872 1.95162 1.26809 2.30932 2.89190
Skewness -0.52411 -0.16802 -0.07990 -0.88529 -0.25286 -0.02420
Kurtosis 8.23150 7.43098 7.77952 12.18907 5.43185 11.59807
Islamic Indices
Mean -0.02791 -0.02098 -0.00964 0.01141 -0.02846 -0.11032
Std. Deviation 2.06822 1.93467 1.91434 1.14286 2.22042 2.41582
Skewness -0.69313 -0.30397 -0.28173 -0.73878 -0.06499 -0.12005
Kurtosis 11.48054 7.84950 9.84165 10.99694 4.66220 9.35412
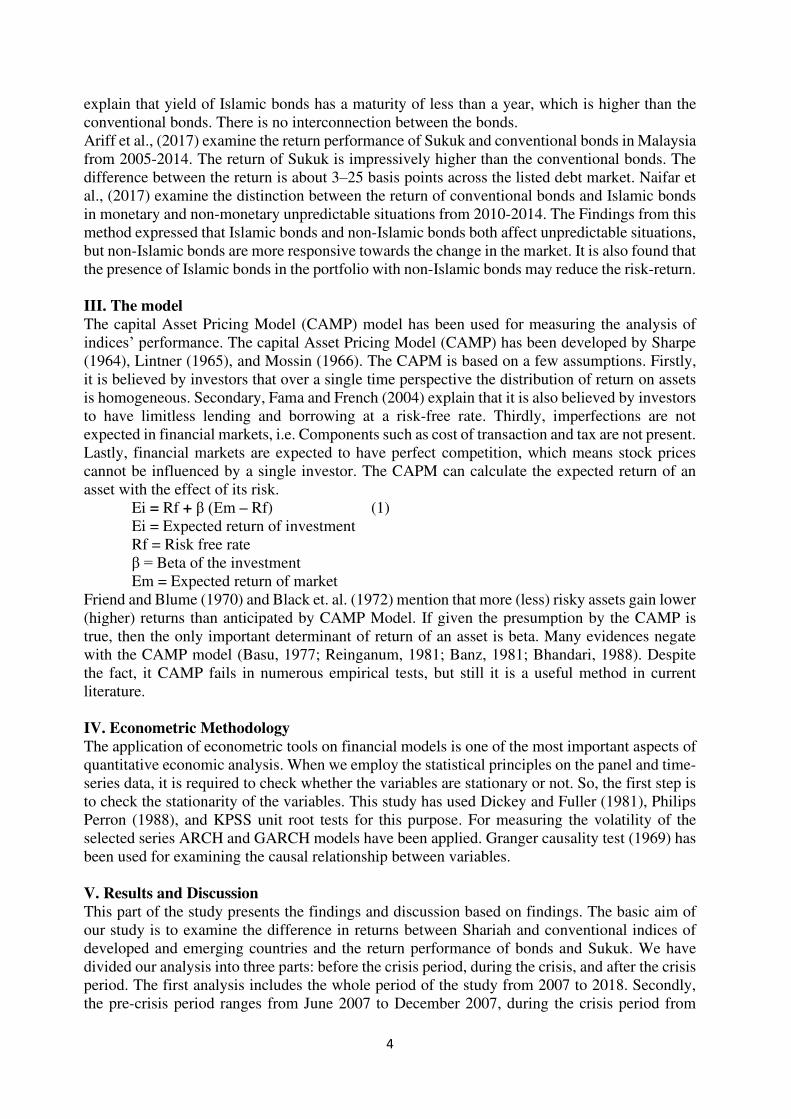
Table 3 presents the descriptive statistics during a period of crisis for both emerging and developed countries. The results show that the developed countries have negative mean returns during the financial crisis period. The emerging countries have the negative mean return of Islamic indices, except Malaysia, this shows that the Malaysian economy survives better than the other countries. The return is not high but still, it has a positive value. During the crisis period, the Shariah indices show a high return as compared to the conventional indices in both developed and emerging countries, but Islamic indices were less risky than the conventional indices. The skewness is negative in developed and emerging countries. The results from kurtosis are more than three, which means that there is a leptokurtic distribution in both indices during the crisis period. Table 4 presents the descriptive statistics post-crisis period in the case of all selected countries, the mean return is positive for both Islamic and conventional indices. Moreover, in emerging countries, the mean return is higher for Islamic indices as compared to the conventional indices. For developed countries, Islamic indices have a higher mean return as compared to conventional indices, except for the USA. During this period, the standard deviation has decreased as compared to the crisis period, because the standard deviation is higher in the crisis period. The standard deviation of Islamic indices is higher in developed countries as compared to the conventional indices except for the USA. In emerging countries, Islamic indices show a higher risk as compared to conventional indices. Skewness is negative in both developed and emerging countries suggests that the distribution has more tail on the left side. In all countries, the results
7
from kurtosis are more than three, which means that there is a leptokurtic distribution in the indices. Table 4. Summary Statistics of Islamic and Conventional Indices Post Crisis Period
Developed Countries Emerging Countries Germany UK USA Malaysia Pakistan UAE
Conventional Indices
Mean 0.03295 0.02746 0.04676 0.02283 0.03270 0.03762
Std. Deviation 1.16430 0.92794 0.93996 0.57808 1.08371 1.32423
Skewness -0.18923 -0.10978 -0.40146 -0.31317 -0.05785 -0.00903
Kurtosis 5.65418 5.63625 7.71711 6.69285 5.02013 12.30956
Islamic Indices
Mean 0.03319 0.03043 0.03855 0.02559 0.03844 0.03995
Std. Deviation 1.18160 1.01671 0.91724 0.58997 1.36299 1.52462
Skewness -0.20645 -0.11466 -0.33150 -0.22003 -0.12815 -0.36496
Kurtosis 5.16525 5.01793 6.95205 6.56988 5.16656 12.15723
VI. Debt Non-Risk Adjusted Performance
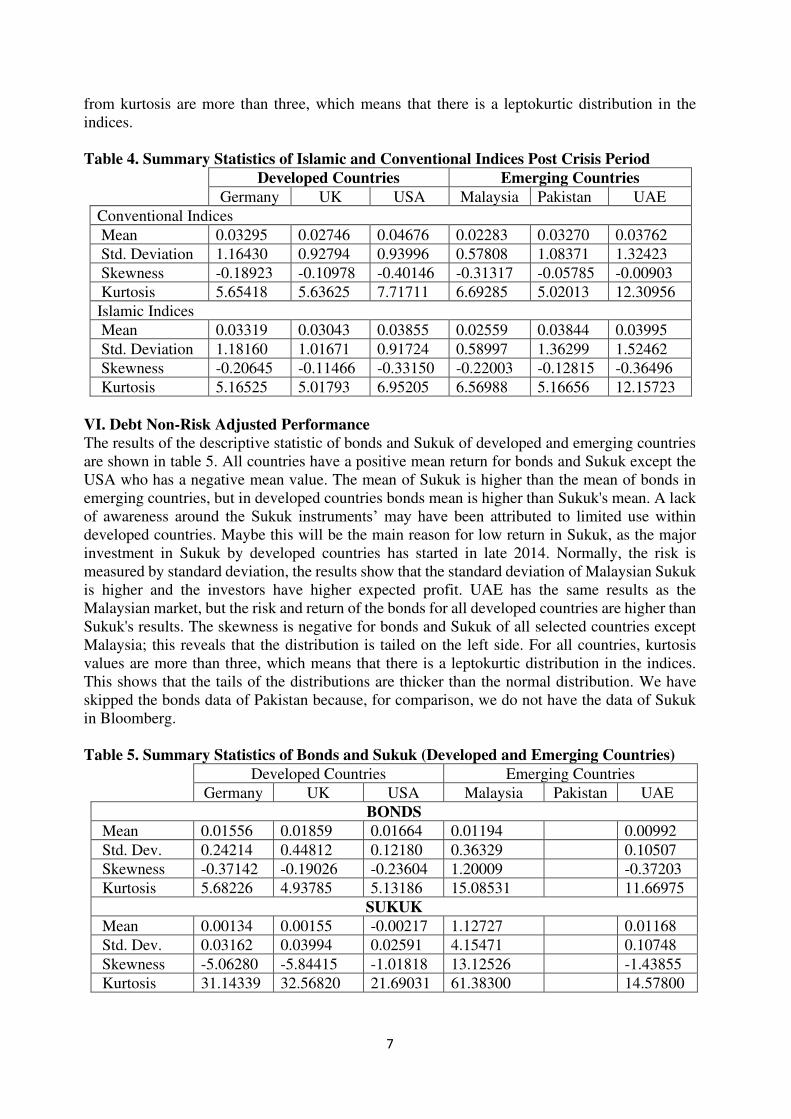
The results of the descriptive statistic of bonds and Sukuk of developed and emerging countries are shown in table 5. All countries have a positive mean return for bonds and Sukuk except the USA who has a negative mean value. The mean of Sukuk is higher than the mean of bonds in emerging countries, but in developed countries bonds mean is higher than Sukuk's mean. A lack of awareness around the Sukuk instruments’ may have been attributed to limited use within developed countries. Maybe this will be the main reason for low return in Sukuk, as the major investment in Sukuk by developed countries has started in late 2014. Normally, the risk is measured by standard deviation, the results show that the standard deviation of Malaysian Sukuk is higher and the investors have higher expected profit. UAE has the same results as the Malaysian market, but the risk and return of the bonds for all developed countries are higher than Sukuk's results. The skewness is negative for bonds and Sukuk of all selected countries except Malaysia; this reveals that the distribution is tailed on the left side. For all countries, kurtosis values are more than three, which means that there is a leptokurtic distribution in the indices. This shows that the tails of the distributions are thicker than the normal distribution. We have skipped the bonds data of Pakistan because, for comparison, we do not have the data of Sukuk in Bloomberg. Table 5. Summary Statistics of Bonds and Sukuk (Developed and Emerging Countries)
Developed Countries Emerging Countries Germany UK USA Malaysia Pakistan UAE
BONDS
Mean 0.01556 0.01859 0.01664 0.01194 0.00992
Std. Dev. 0.24214 0.44812 0.12180 0.36329 0.10507
Skewness -0.37142 -0.19026 -0.23604 1.20009 -0.37203
Kurtosis 5.68226 4.93785 5.13186 15.08531 11.66975
SUKUK
Mean 0.00134 0.00155 -0.00217 1.12727 0.01168
Std. Dev. 0.03162 0.03994 0.02591 4.15471 0.10748
Skewness -5.06280 -5.84415 -1.01818 13.12526 -1.43855
Kurtosis 31.14339 32.56820 21.69031 61.38300 14.57800
8
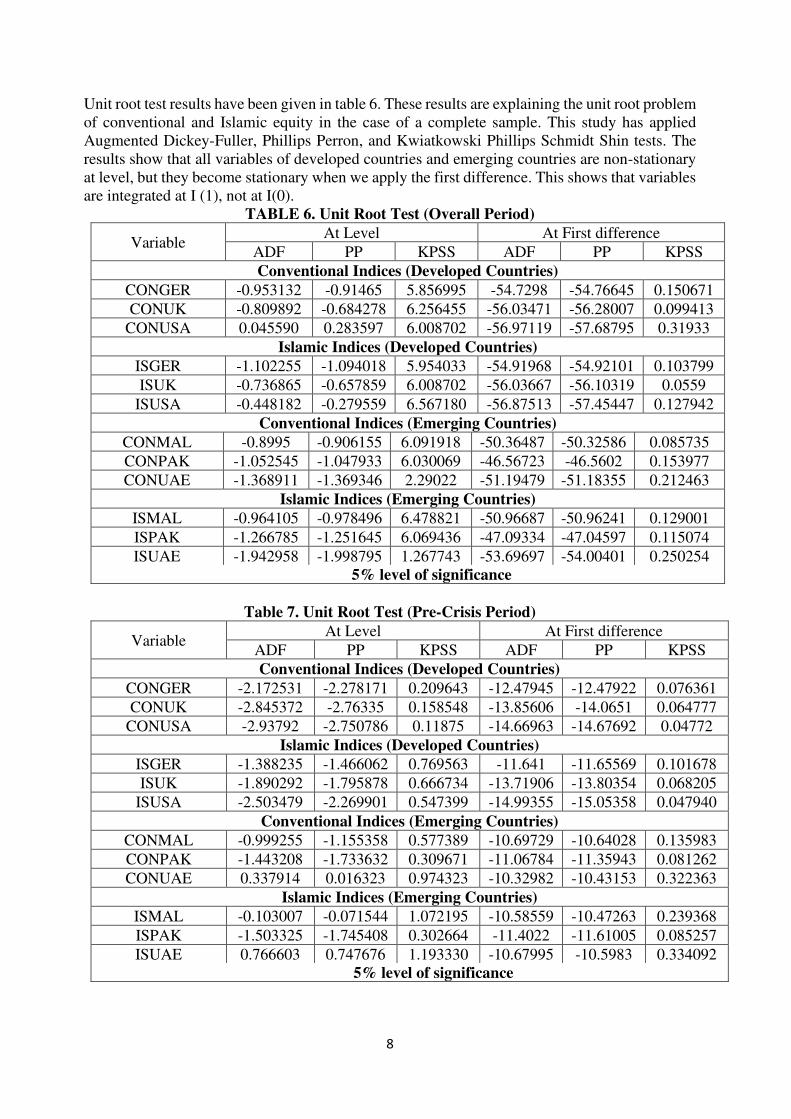
Unit root test results have been given in table 6. These results are explaining the unit root problem of conventional and Islamic equity in the case of a complete sample. This study has applied Augmented Dickey-Fuller, Phillips Perron, and Kwiatkowski Phillips Schmidt Shin tests. The results show that all variables of developed countries and emerging countries are non-stationary at level, but they become stationary when we apply the first difference. This shows that variables are integrated at I (1), not at I(0).
TABLE 6. Unit Root Test (Overall Period)
Variable At Level At First difference
ADF PP KPSS ADF PP KPSS
Conventional Indices (Developed Countries)
CONGER -0.953132 -0.91465 5.856995 -54.7298 -54.76645 0.150671
CONUK -0.809892 -0.684278 6.256455 -56.03471 -56.28007 0.099413
CONUSA 0.045590 0.283597 6.008702 -56.97119 -57.68795 0.31933
Islamic Indices (Developed Countries)
ISGER -1.102255 -1.094018 5.954033 -54.91968 -54.92101 0.103799
ISUK -0.736865 -0.657859 6.008702 -56.03667 -56.10319 0.0559
ISUSA -0.448182 -0.279559 6.567180 -56.87513 -57.45447 0.127942
Conventional Indices (Emerging Countries)
CONMAL -0.8995 -0.906155 6.091918 -50.36487 -50.32586 0.085735
CONPAK -1.052545 -1.047933 6.030069 -46.56723 -46.5602 0.153977
CONUAE -1.368911 -1.369346 2.29022 -51.19479 -51.18355 0.212463
Islamic Indices (Emerging Countries)
ISMAL -0.964105 -0.978496 6.478821 -50.96687 -50.96241 0.129001
ISPAK -1.266785 -1.251645 6.069436 -47.09334 -47.04597 0.115074
ISUAE -1.942958 -1.998795 1.267743 -53.69697 -54.00401 0.250254 5% level of significance
Table 7. Unit Root Test (Pre-Crisis Period)
Variable At Level At First difference
ADF PP KPSS ADF PP KPSS
Conventional Indices (Developed Countries)
CONGER -2.172531 -2.278171 0.209643 -12.47945 -12.47922 0.076361
CONUK -2.845372 -2.76335 0.158548 -13.85606 -14.0651 0.064777
CONUSA -2.93792 -2.750786 0.11875 -14.66963 -14.67692 0.04772
Islamic Indices (Developed Countries)
ISGER -1.388235 -1.466062 0.769563 -11.641 -11.65569 0.101678
ISUK -1.890292 -1.795878 0.666734 -13.71906 -13.80354 0.068205
ISUSA -2.503479 -2.269901 0.547399 -14.99355 -15.05358 0.047940
Conventional Indices (Emerging Countries)
CONMAL -0.999255 -1.155358 0.577389 -10.69729 -10.64028 0.135983
CONPAK -1.443208 -1.733632 0.309671 -11.06784 -11.35943 0.081262
CONUAE 0.337914 0.016323 0.974323 -10.32982 -10.43153 0.322363
Islamic Indices (Emerging Countries)
ISMAL -0.103007 -0.071544 1.072195 -10.58559 -10.47263 0.239368
ISPAK -1.503325 -1.745408 0.302664 -11.4022 -11.61005 0.085257
ISUAE 0.766603 0.747676 1.193330 -10.67995 -10.5983 0.334092 5% level of significance
9
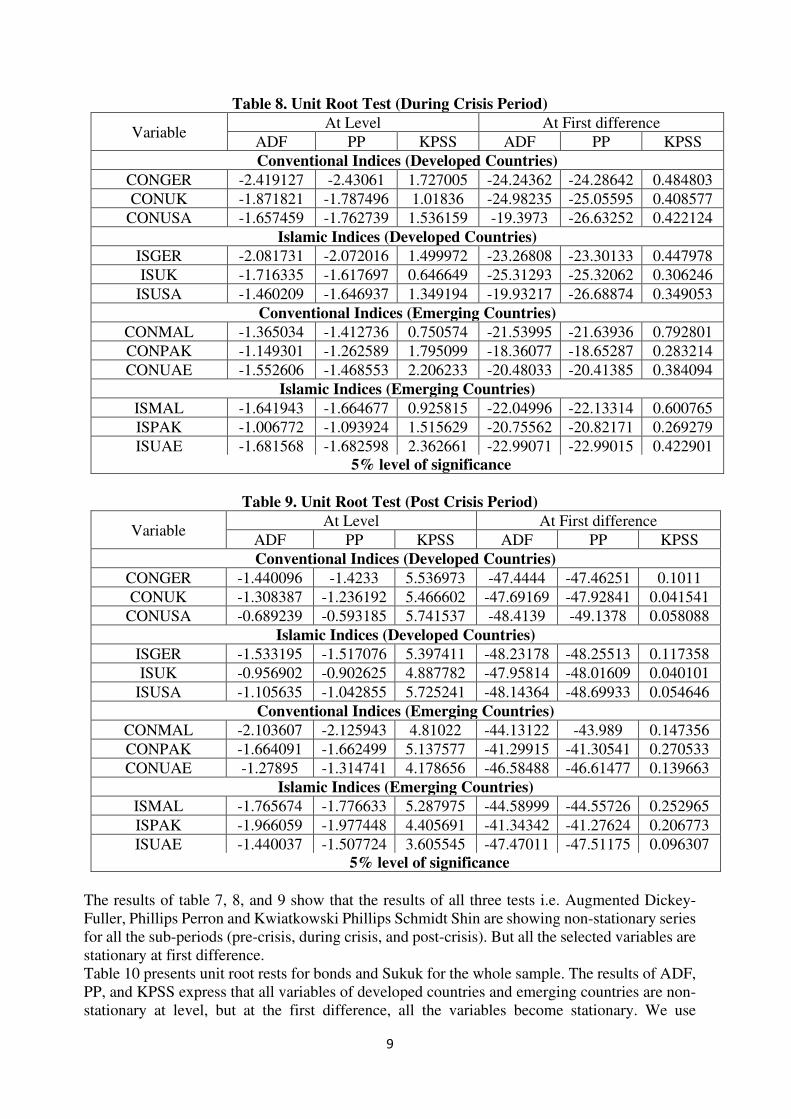
Table 8. Unit Root Test (During Crisis Period)
Variable At Level At First difference
ADF PP KPSS ADF PP KPSS
Conventional Indices (Developed Countries)
CONGER -2.419127 -2.43061 1.727005 -24.24362 -24.28642 0.484803
CONUK -1.871821 -1.787496 1.01836 -24.98235 -25.05595 0.408577
CONUSA -1.657459 -1.762739 1.536159 -19.3973 -26.63252 0.422124
Islamic Indices (Developed Countries)
ISGER -2.081731 -2.072016 1.499972 -23.26808 -23.30133 0.447978
ISUK -1.716335 -1.617697 0.646649 -25.31293 -25.32062 0.306246
ISUSA -1.460209 -1.646937 1.349194 -19.93217 -26.68874 0.349053
Conventional Indices (Emerging Countries)
CONMAL -1.365034 -1.412736 0.750574 -21.53995 -21.63936 0.792801
CONPAK -1.149301 -1.262589 1.795099 -18.36077 -18.65287 0.283214
CONUAE -1.552606 -1.468553 2.206233 -20.48033 -20.41385 0.384094
Islamic Indices (Emerging Countries)
ISMAL -1.641943 -1.664677 0.925815 -22.04996 -22.13314 0.600765
ISPAK -1.006772 -1.093924 1.515629 -20.75562 -20.82171 0.269279
ISUAE -1.681568 -1.682598 2.362661 -22.99071 -22.99015 0.422901 5% level of significance
Table 9. Unit Root Test (Post Crisis Period)
Variable At Level At First difference
ADF PP KPSS ADF PP KPSS
Conventional Indices (Developed Countries)
CONGER -1.440096 -1.4233 5.536973 -47.4444 -47.46251 0.1011
CONUK -1.308387 -1.236192 5.466602 -47.69169 -47.92841 0.041541
CONUSA -0.689239 -0.593185 5.741537 -48.4139 -49.1378 0.058088
Islamic Indices (Developed Countries)
ISGER -1.533195 -1.517076 5.397411 -48.23178 -48.25513 0.117358
ISUK -0.956902 -0.902625 4.887782 -47.95814 -48.01609 0.040101
ISUSA -1.105635 -1.042855 5.725241 -48.14364 -48.69933 0.054646
Conventional Indices (Emerging Countries)
CONMAL -2.103607 -2.125943 4.81022 -44.13122 -43.989 0.147356
CONPAK -1.664091 -1.662499 5.137577 -41.29915 -41.30541 0.270533
CONUAE -1.27895 -1.314741 4.178656 -46.58488 -46.61477 0.139663
Islamic Indices (Emerging Countries)
ISMAL -1.765674 -1.776633 5.287975 -44.58999 -44.55726 0.252965
ISPAK -1.966059 -1.977448 4.405691 -41.34342 -41.27624 0.206773
ISUAE -1.440037 -1.507724 3.605545 -47.47011 -47.51175 0.096307 5% level of significance
The results of table 7, 8, and 9 show that the results of all three tests i.e. Augmented Dickey-Fuller, Phillips Perron and Kwiatkowski Phillips Schmidt Shin are showing non-stationary series for all the sub-periods (pre-crisis, during crisis, and post-crisis). But all the selected variables are stationary at first difference. Table 10 presents unit root rests for bonds and Sukuk for the whole sample. The results of ADF, PP, and KPSS express that all variables of developed countries and emerging countries are non-stationary at level, but at the first difference, all the variables become stationary. We use
10
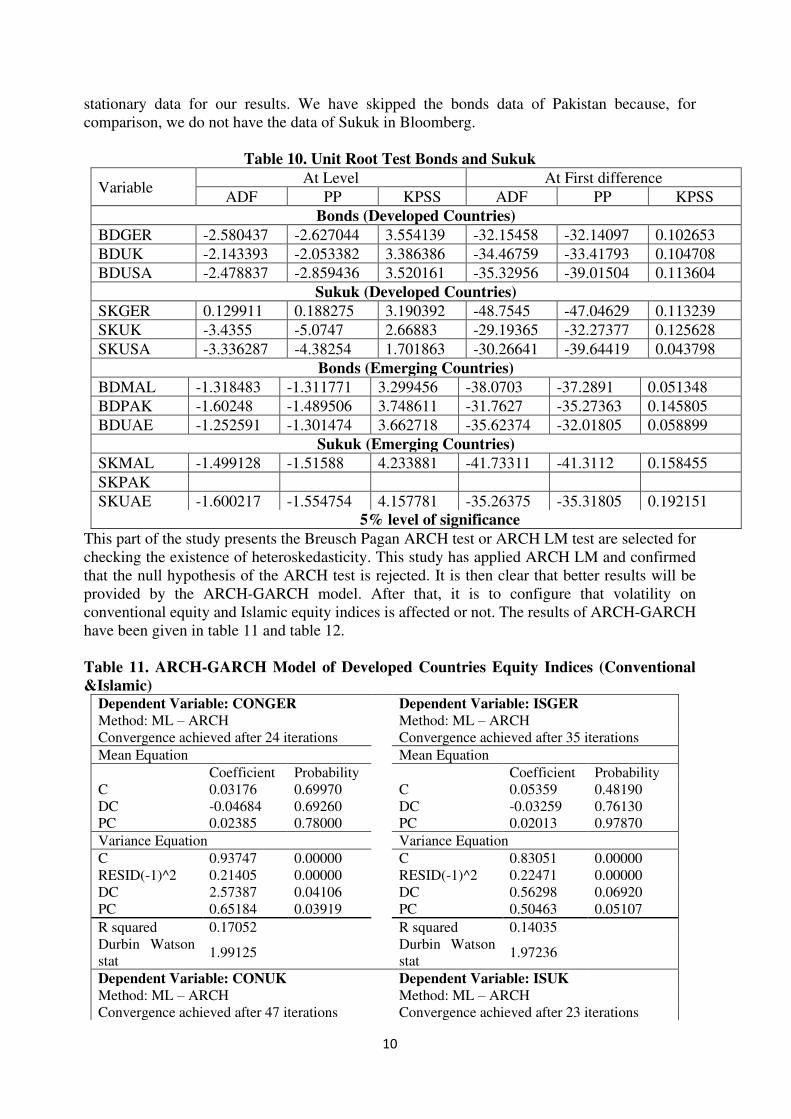
stationary data for our results. We have skipped the bonds data of Pakistan because, for comparison, we do not have the data of Sukuk in Bloomberg.
Table 10. Unit Root Test Bonds and Sukuk
Variable At Level At First difference
ADF PP KPSS ADF PP KPSS
Bonds (Developed Countries)
BDGER -2.580437 -2.627044 3.554139 -32.15458 -32.14097 0.102653
BDUK -2.143393 -2.053382 3.386386 -34.46759 -33.41793 0.104708
BDUSA -2.478837 -2.859436 3.520161 -35.32956 -39.01504 0.113604
Sukuk (Developed Countries)
SKGER 0.129911 0.188275 3.190392 -48.7545 -47.04629 0.113239
SKUK -3.4355 -5.0747 2.66883 -29.19365 -32.27377 0.125628
SKUSA -3.336287 -4.38254 1.701863 -30.26641 -39.64419 0.043798
Bonds (Emerging Countries)
BDMAL -1.318483 -1.311771 3.299456 -38.0703 -37.2891 0.051348
BDPAK -1.60248 -1.489506 3.748611 -31.7627 -35.27363 0.145805
BDUAE -1.252591 -1.301474 3.662718 -35.62374 -32.01805 0.058899
Sukuk (Emerging Countries)
SKMAL -1.499128 -1.51588 4.233881 -41.73311 -41.3112 0.158455
SKPAK
SKUAE -1.600217 -1.554754 4.157781 -35.26375 -35.31805 0.192151 5% level of significance
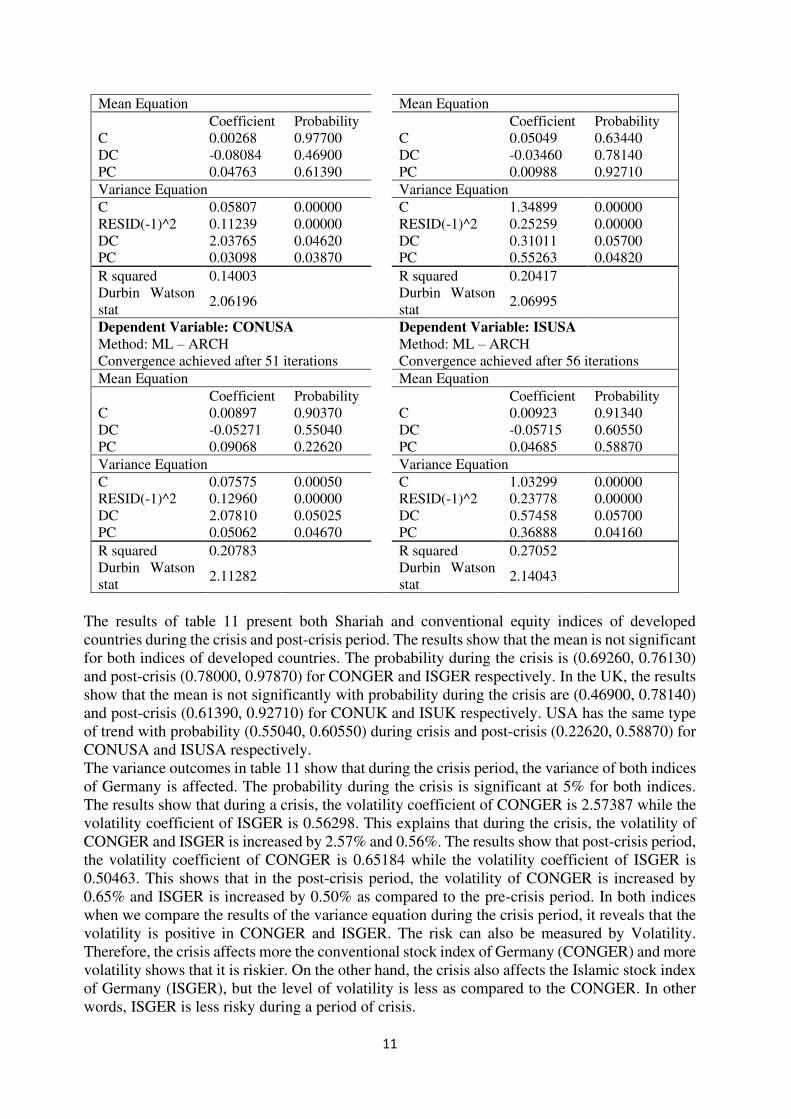
This part of the study presents the Breusch Pagan ARCH test or ARCH LM test are selected for checking the existence of heteroskedasticity. This study has applied ARCH LM and confirmed that the null hypothesis of the ARCH test is rejected. It is then clear that better results will be provided by the ARCH-GARCH model. After that, it is to configure that volatility on conventional equity and Islamic equity indices is affected or not. The results of ARCH-GARCH have been given in table 11 and table 12. Table 11. ARCH-GARCH Model of Developed Countries Equity Indices (Conventional
&Islamic) Dependent Variable: CONGER Dependent Variable: ISGER
Method: ML – ARCH Method: ML – ARCH Convergence achieved after 24 iterations Convergence achieved after 35 iterations
Mean Equation Mean Equation Coefficient Probability Coefficient Probability C 0.03176 0.69970 C 0.05359 0.48190 DC -0.04684 0.69260 DC -0.03259 0.76130 PC 0.02385 0.78000 PC 0.02013 0.97870
Variance Equation Variance Equation
C 0.93747 0.00000 C 0.83051 0.00000 RESID(-1)^2 0.21405 0.00000 RESID(-1)^2 0.22471 0.00000 DC 2.57387 0.04106 DC 0.56298 0.06920 PC 0.65184 0.03919 PC 0.50463 0.05107
R squared 0.17052 R squared 0.14035 Durbin Watson stat
1.99125 Durbin Watson stat
1.97236
Dependent Variable: CONUK Dependent Variable: ISUK
Method: ML – ARCH Method: ML – ARCH Convergence achieved after 47 iterations Convergence achieved after 23 iterations
11
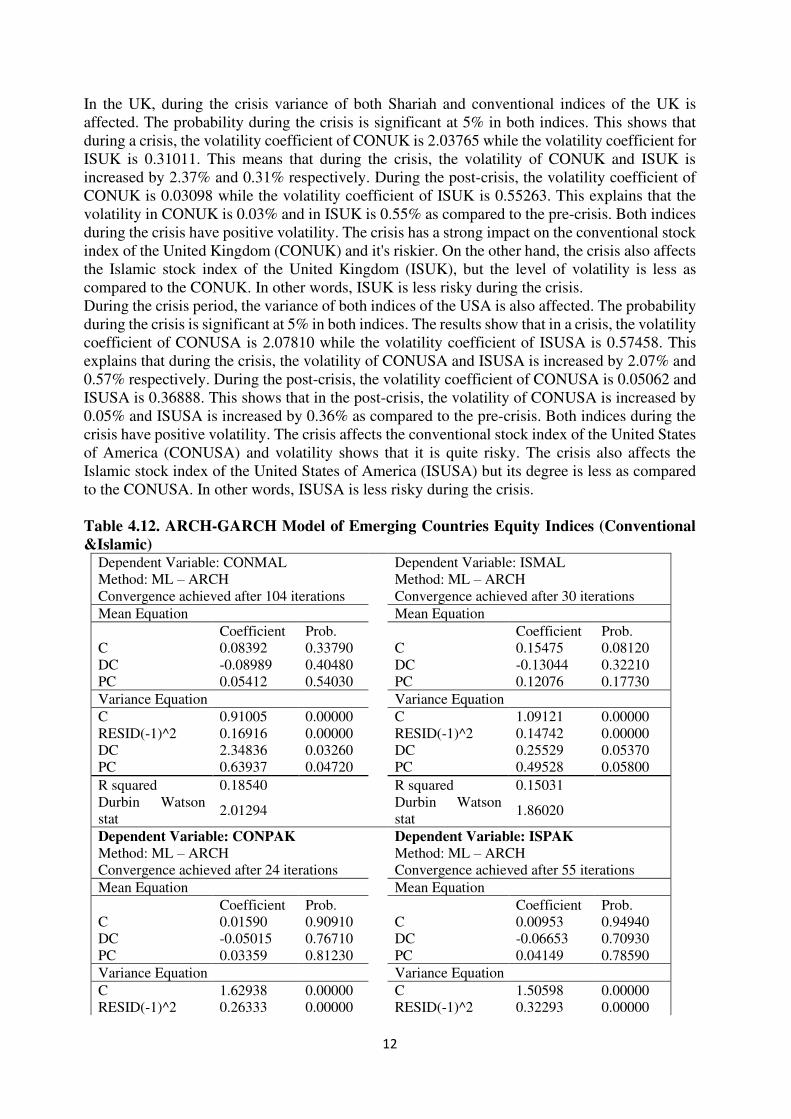
Mean Equation Mean Equation Coefficient Probability Coefficient Probability C 0.00268 0.97700 C 0.05049 0.63440 DC -0.08084 0.46900 DC -0.03460 0.78140 PC 0.04763 0.61390 PC 0.00988 0.92710
Variance Equation Variance Equation
C 0.05807 0.00000 C 1.34899 0.00000 RESID(-1)^2 0.11239 0.00000 RESID(-1)^2 0.25259 0.00000 DC 2.03765 0.04620 DC 0.31011 0.05700 PC 0.03098 0.03870 PC 0.55263 0.04820
R squared 0.14003 R squared 0.20417 Durbin Watson stat
2.06196 Durbin Watson stat
2.06995
Dependent Variable: CONUSA Dependent Variable: ISUSA
Method: ML – ARCH Method: ML – ARCH Convergence achieved after 51 iterations Convergence achieved after 56 iterations
Mean Equation Mean Equation Coefficient Probability Coefficient Probability C 0.00897 0.90370 C 0.00923 0.91340 DC -0.05271 0.55040 DC -0.05715 0.60550 PC 0.09068 0.22620 PC 0.04685 0.58870
Variance Equation Variance Equation
C 0.07575 0.00050 C 1.03299 0.00000 RESID(-1)^2 0.12960 0.00000 RESID(-1)^2 0.23778 0.00000 DC 2.07810 0.05025 DC 0.57458 0.05700 PC 0.05062 0.04670 PC 0.36888 0.04160
R squared 0.20783 R squared 0.27052 Durbin Watson stat
2.11282 Durbin Watson stat
2.14043
The results of table 11 present both Shariah and conventional equity indices of developed countries during the crisis and post-crisis period. The results show that the mean is not significant for both indices of developed countries. The probability during the crisis is (0.69260, 0.76130) and post-crisis (0.78000, 0.97870) for CONGER and ISGER respectively. In the UK, the results show that the mean is not significantly with probability during the crisis are (0.46900, 0.78140) and post-crisis (0.61390, 0.92710) for CONUK and ISUK respectively. USA has the same type of trend with probability (0.55040, 0.60550) during crisis and post-crisis (0.22620, 0.58870) for CONUSA and ISUSA respectively. The variance outcomes in table 11 show that during the crisis period, the variance of both indices of Germany is affected. The probability during the crisis is significant at 5% for both indices. The results show that during a crisis, the volatility coefficient of CONGER is 2.57387 while the volatility coefficient of ISGER is 0.56298. This explains that during the crisis, the volatility of CONGER and ISGER is increased by 2.57% and 0.56%. The results show that post-crisis period, the volatility coefficient of CONGER is 0.65184 while the volatility coefficient of ISGER is 0.50463. This shows that in the post-crisis period, the volatility of CONGER is increased by 0.65% and ISGER is increased by 0.50% as compared to the pre-crisis period. In both indices when we compare the results of the variance equation during the crisis period, it reveals that the volatility is positive in CONGER and ISGER. The risk can also be measured by Volatility. Therefore, the crisis affects more the conventional stock index of Germany (CONGER) and more volatility shows that it is riskier. On the other hand, the crisis also affects the Islamic stock index of Germany (ISGER), but the level of volatility is less as compared to the CONGER. In other words, ISGER is less risky during a period of crisis.
12
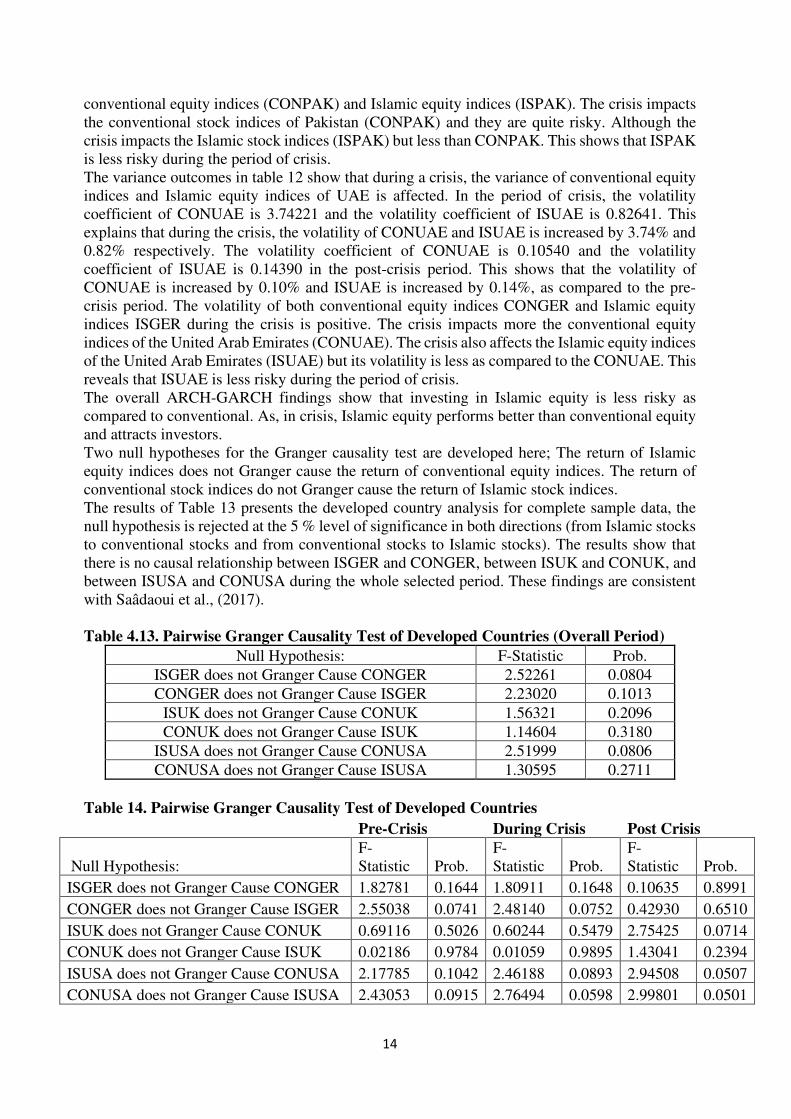
In the UK, during the crisis variance of both Shariah and conventional indices of the UK is affected. The probability during the crisis is significant at 5% in both indices. This shows that during a crisis, the volatility coefficient of CONUK is 2.03765 while the volatility coefficient for ISUK is 0.31011. This means that during the crisis, the volatility of CONUK and ISUK is increased by 2.37% and 0.31% respectively. During the post-crisis, the volatility coefficient of CONUK is 0.03098 while the volatility coefficient of ISUK is 0.55263. This explains that the volatility in CONUK is 0.03% and in ISUK is 0.55% as compared to the pre-crisis. Both indices during the crisis have positive volatility. The crisis has a strong impact on the conventional stock index of the United Kingdom (CONUK) and it's riskier. On the other hand, the crisis also affects the Islamic stock index of the United Kingdom (ISUK), but the level of volatility is less as compared to the CONUK. In other words, ISUK is less risky during the crisis. During the crisis period, the variance of both indices of the USA is also affected. The probability during the crisis is significant at 5% in both indices. The results show that in a crisis, the volatility coefficient of CONUSA is 2.07810 while the volatility coefficient of ISUSA is 0.57458. This explains that during the crisis, the volatility of CONUSA and ISUSA is increased by 2.07% and 0.57% respectively. During the post-crisis, the volatility coefficient of CONUSA is 0.05062 and ISUSA is 0.36888. This shows that in the post-crisis, the volatility of CONUSA is increased by 0.05% and ISUSA is increased by 0.36% as compared to the pre-crisis. Both indices during the crisis have positive volatility. The crisis affects the conventional stock index of the United States of America (CONUSA) and volatility shows that it is quite risky. The crisis also affects the Islamic stock index of the United States of America (ISUSA) but its degree is less as compared to the CONUSA. In other words, ISUSA is less risky during the crisis. Table 4.12. ARCH-GARCH Model of Emerging Countries Equity Indices (Conventional
&Islamic) Dependent Variable: CONMAL Dependent Variable: ISMAL Method: ML – ARCH Method: ML – ARCH Convergence achieved after 104 iterations Convergence achieved after 30 iterations
Mean Equation Mean Equation Coefficient Prob. Coefficient Prob. C 0.08392 0.33790 C 0.15475 0.08120 DC -0.08989 0.40480 DC -0.13044 0.32210 PC 0.05412 0.54030 PC 0.12076 0.17730
Variance Equation Variance Equation
C 0.91005 0.00000 C 1.09121 0.00000 RESID(-1)^2 0.16916 0.00000 RESID(-1)^2 0.14742 0.00000 DC 2.34836 0.03260 DC 0.25529 0.05370 PC 0.63937 0.04720 PC 0.49528 0.05800
R squared 0.18540 R squared 0.15031 Durbin Watson stat
2.01294 Durbin Watson stat
1.86020
Dependent Variable: CONPAK Dependent Variable: ISPAK
Method: ML – ARCH Method: ML – ARCH Convergence achieved after 24 iterations Convergence achieved after 55 iterations
Mean Equation Mean Equation Coefficient Prob. Coefficient Prob. C 0.01590 0.90910 C 0.00953 0.94940 DC -0.05015 0.76710 DC -0.06653 0.70930 PC 0.03359 0.81230 PC 0.04149 0.78590
Variance Equation Variance Equation
C 1.62938 0.00000 C 1.50598 0.00000 RESID(-1)^2 0.26333 0.00000 RESID(-1)^2 0.32293 0.00000

13
DC 2.40901 0.04870 DC 0.65387 0.05010 PC 0.53527 0.05450 PC 0.41601 0.05920
R squared 0.13072 R squared 0.11874 Durbin Watson stat
1.97802 Durbin Watson stat
1.97713
Dependent Variable: CONUAE Dependent Variable: ISUAE
Method: ML – ARCH Method: ML – ARCH Convergence achieved after 40 iterations Convergence achieved after 29 iterations
Mean Equation Mean Equation Coefficient Prob. Coefficient Prob. C 0.16047 0.16520 C 0.24462 0.02930 DC -0.20746 0.25360 DC -0.30120 0.20730 PC 0.11690 0.32670 PC 0.19562 0.29340
Variance Equation Variance Equation
C 1.37271 0.00000 C 2.03648 0.00000 RESID(-1)^2 0.14624 0.00000 RESID(-1)^2 0.06337 0.00000 DC 3.74221 0.04083 DC 0.82641 0.05120 PC 0.10540 0.04540 PC 0.14390 0.04710
R squared 0.19128 R squared 0.12095 Durbin Watson stat
2.11024 Durbin Watson stat
1.92872
Table 12 provides both Shariah and conventional equity indices of emerging countries during the crisis and post-crisis periods. The results explain that during a crisis and post-crisis, the mean is insignificantly for both Islamic and conventional indices of emerging countries. The probability values of CONMAL and ISMAL during the crisis are (0.40480, 0.32210) and post-crisis are (0.54030, 0.17730) respectively. The probability values of CONPAK and ISPAK during the crisis are (0.76710, 0.70930) and the post-crisis is (0.81230, 0.78590) respectively. The probability values of CONUAE and ISUAE during the crisis are (0.25360, 0.20730) and post-crisis are (0.32670, 0.29340) respectively. The results in table 12 show that during the crisis variance of both Shariah and conventional indices of Malaysia is affected. The conventional equity and Islamic equity indices are significant during the crisis at the 5 % level. During the crisis, the volatility coefficient of CONMAL is 2.34836, and the volatility coefficient of ISMAL is 0.25529. This explains that during the crisis, the volatility of CONMAL and ISMAL is increased by 2.35% and 0.25% respectively. The result shows that in the post-crisis, the volatility coefficient of CONMAL is 0.63937 and the volatility coefficient of ISMAL is 0.49528. This shows that in the post-crisis, CONMAL is increased by 0.64% and ISMAL is increased by 0.49%. The comparison of variance shows that during the crisis, the volatility of both conventional equity indices (CONMAL) and Islamic equity indices (ISMAL) is positive. This explains that the conventional equity indices of Malaysia (CONMAL) are much volatile and are riskier during the crisis. On the other hand, the crisis also affects the Islamic equity index of Malaysia (ISMAL) but the level of volatility is less as compared to CONMAL. This shows that ISMAL is less risky during the crisis. In Pakistan, the variance of both Shariah equity indices and conventional indices are affected during the crisis. The results of table 12 show that during the crisis, the volatility coefficient of CONPAK is 2.40901 and the volatility coefficient of ISPAK is 0.65387. This reveals that during the crisis period, the volatility of CONPAK and ISPAK is increased by 2.41% and 0.65%, respectively. During the post-crisis, the volatility coefficient of CONPAK is 0.53527 and the volatility coefficient of ISPAK is 0.41601. This shows that in the post-crisis period, the volatility of CONPAK is increased by 0.53% and ISPAK is increased by 0.42%, as compared to the pre-crisis period. The comparison shows that during the crisis, the volatility is positive in both
14
conventional equity indices (CONPAK) and Islamic equity indices (ISPAK). The crisis impacts the conventional stock indices of Pakistan (CONPAK) and they are quite risky. Although the crisis impacts the Islamic stock indices (ISPAK) but less than CONPAK. This shows that ISPAK is less risky during the period of crisis. The variance outcomes in table 12 show that during a crisis, the variance of conventional equity indices and Islamic equity indices of UAE is affected. In the period of crisis, the volatility coefficient of CONUAE is 3.74221 and the volatility coefficient of ISUAE is 0.82641. This explains that during the crisis, the volatility of CONUAE and ISUAE is increased by 3.74% and 0.82% respectively. The volatility coefficient of CONUAE is 0.10540 and the volatility coefficient of ISUAE is 0.14390 in the post-crisis period. This shows that the volatility of CONUAE is increased by 0.10% and ISUAE is increased by 0.14%, as compared to the pre-crisis period. The volatility of both conventional equity indices CONGER and Islamic equity indices ISGER during the crisis is positive. The crisis impacts more the conventional equity indices of the United Arab Emirates (CONUAE). The crisis also affects the Islamic equity indices of the United Arab Emirates (ISUAE) but its volatility is less as compared to the CONUAE. This reveals that ISUAE is less risky during the period of crisis. The overall ARCH-GARCH findings show that investing in Islamic equity is less risky as compared to conventional. As, in crisis, Islamic equity performs better than conventional equity and attracts investors. Two null hypotheses for the Granger causality test are developed here; The return of Islamic equity indices does not Granger cause the return of conventional equity indices. The return of conventional stock indices do not Granger cause the return of Islamic stock indices. The results of Table 13 presents the developed country analysis for complete sample data, the null hypothesis is rejected at the 5 % level of significance in both directions (from Islamic stocks to conventional stocks and from conventional stocks to Islamic stocks). The results show that there is no causal relationship between ISGER and CONGER, between ISUK and CONUK, and between ISUSA and CONUSA during the whole selected period. These findings are consistent with Saâdaoui et al., (2017). Table 4.13. Pairwise Granger Causality Test of Developed Countries (Overall Period)
Null Hypothesis: F-Statistic Prob.
ISGER does not Granger Cause CONGER 2.52261 0.0804
CONGER does not Granger Cause ISGER 2.23020 0.1013
ISUK does not Granger Cause CONUK 1.56321 0.2096
CONUK does not Granger Cause ISUK 1.14604 0.3180
ISUSA does not Granger Cause CONUSA 2.51999 0.0806
CONUSA does not Granger Cause ISUSA 1.30595 0.2711
Table 14. Pairwise Granger Causality Test of Developed Countries
Pre-Crisis During Crisis Post Crisis
Null Hypothesis: F-Statistic Prob.
F-Statistic Prob.
F-Statistic Prob.
ISGER does not Granger Cause CONGER 1.82781 0.1644 1.80911 0.1648 0.10635 0.8991
CONGER does not Granger Cause ISGER 2.55038 0.0741 2.48140 0.0752 0.42930 0.6510
ISUK does not Granger Cause CONUK 0.69116 0.5026 0.60244 0.5479 2.75425 0.0714
CONUK does not Granger Cause ISUK 0.02186 0.9784 0.01059 0.9895 1.43041 0.2394
ISUSA does not Granger Cause CONUSA 2.17785 0.1042 2.46188 0.0893 2.94508 0.0507
CONUSA does not Granger Cause ISUSA 2.43053 0.0915 2.76494 0.0598 2.99801 0.0501
15
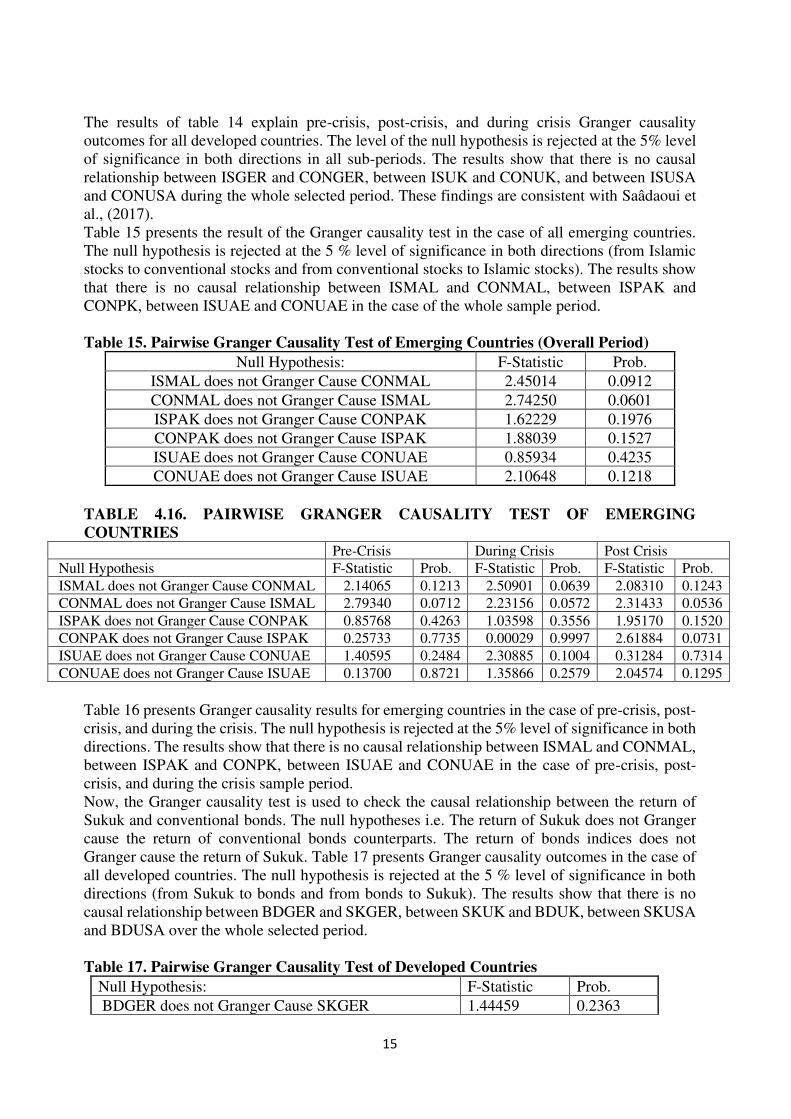
The results of table 14 explain pre-crisis, post-crisis, and during crisis Granger causality outcomes for all developed countries. The level of the null hypothesis is rejected at the 5% level of significance in both directions in all sub-periods. The results show that there is no causal relationship between ISGER and CONGER, between ISUK and CONUK, and between ISUSA and CONUSA during the whole selected period. These findings are consistent with Saâdaoui et al., (2017). Table 15 presents the result of the Granger causality test in the case of all emerging countries. The null hypothesis is rejected at the 5 % level of significance in both directions (from Islamic stocks to conventional stocks and from conventional stocks to Islamic stocks). The results show that there is no causal relationship between ISMAL and CONMAL, between ISPAK and CONPK, between ISUAE and CONUAE in the case of the whole sample period. Table 15. Pairwise Granger Causality Test of Emerging Countries (Overall Period)
Null Hypothesis: F-Statistic Prob.
ISMAL does not Granger Cause CONMAL 2.45014 0.0912
CONMAL does not Granger Cause ISMAL 2.74250 0.0601
ISPAK does not Granger Cause CONPAK 1.62229 0.1976
CONPAK does not Granger Cause ISPAK 1.88039 0.1527
ISUAE does not Granger Cause CONUAE 0.85934 0.4235
CONUAE does not Granger Cause ISUAE 2.10648 0.1218
TABLE 4.16. PAIRWISE GRANGER CAUSALITY TEST OF EMERGING
COUNTRIES Pre-Crisis During Crisis Post Crisis
Null Hypothesis F-Statistic Prob. F-Statistic Prob. F-Statistic Prob.
ISMAL does not Granger Cause CONMAL 2.14065 0.1213 2.50901 0.0639 2.08310 0.1243
CONMAL does not Granger Cause ISMAL 2.79340 0.0712 2.23156 0.0572 2.31433 0.0536
ISPAK does not Granger Cause CONPAK 0.85768 0.4263 1.03598 0.3556 1.95170 0.1520
CONPAK does not Granger Cause ISPAK 0.25733 0.7735 0.00029 0.9997 2.61884 0.0731
ISUAE does not Granger Cause CONUAE 1.40595 0.2484 2.30885 0.1004 0.31284 0.7314
CONUAE does not Granger Cause ISUAE 0.13700 0.8721 1.35866 0.2579 2.04574 0.1295
Table 16 presents Granger causality results for emerging countries in the case of pre-crisis, post-crisis, and during the crisis. The null hypothesis is rejected at the 5% level of significance in both directions. The results show that there is no causal relationship between ISMAL and CONMAL, between ISPAK and CONPK, between ISUAE and CONUAE in the case of pre-crisis, post-crisis, and during the crisis sample period. Now, the Granger causality test is used to check the causal relationship between the return of Sukuk and conventional bonds. The null hypotheses i.e. The return of Sukuk does not Granger cause the return of conventional bonds counterparts. The return of bonds indices does not Granger cause the return of Sukuk. Table 17 presents Granger causality outcomes in the case of all developed countries. The null hypothesis is rejected at the 5 % level of significance in both directions (from Sukuk to bonds and from bonds to Sukuk). The results show that there is no causal relationship between BDGER and SKGER, between SKUK and BDUK, between SKUSA and BDUSA over the whole selected period. Table 17. Pairwise Granger Causality Test of Developed Countries
Null Hypothesis: F-Statistic Prob.
BDGER does not Granger Cause SKGER 1.44459 0.2363
16
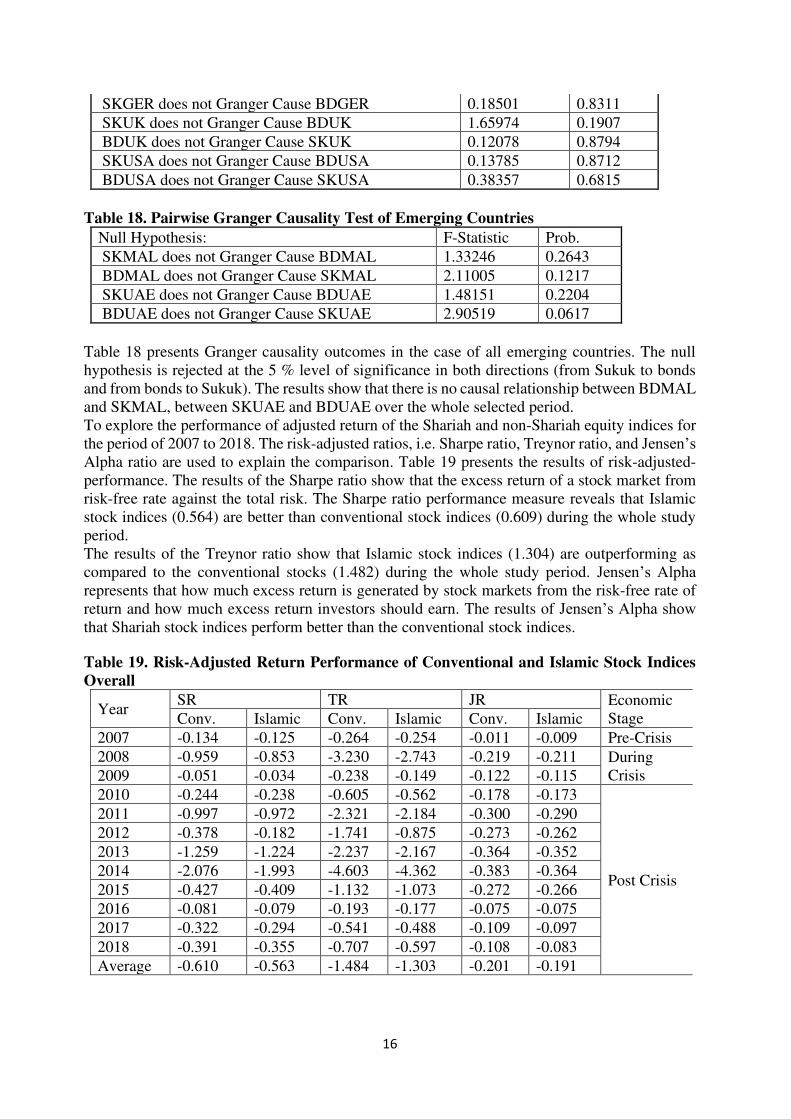
SKGER does not Granger Cause BDGER 0.18501 0.8311
SKUK does not Granger Cause BDUK 1.65974 0.1907
BDUK does not Granger Cause SKUK 0.12078 0.8794
SKUSA does not Granger Cause BDUSA 0.13785 0.8712
BDUSA does not Granger Cause SKUSA 0.38357 0.6815
Table 18. Pairwise Granger Causality Test of Emerging Countries
Null Hypothesis: F-Statistic Prob.
SKMAL does not Granger Cause BDMAL 1.33246 0.2643
BDMAL does not Granger Cause SKMAL 2.11005 0.1217
SKUAE does not Granger Cause BDUAE 1.48151 0.2204
BDUAE does not Granger Cause SKUAE 2.90519 0.0617
Table 18 presents Granger causality outcomes in the case of all emerging countries. The null hypothesis is rejected at the 5 % level of significance in both directions (from Sukuk to bonds and from bonds to Sukuk). The results show that there is no causal relationship between BDMAL and SKMAL, between SKUAE and BDUAE over the whole selected period. To explore the performance of adjusted return of the Shariah and non-Shariah equity indices for the period of 2007 to 2018. The risk-adjusted ratios, i.e. Sharpe ratio, Treynor ratio, and Jensen’s Alpha ratio are used to explain the comparison. Table 19 presents the results of risk-adjusted-performance. The results of the Sharpe ratio show that the excess return of a stock market from risk-free rate against the total risk. The Sharpe ratio performance measure reveals that Islamic stock indices (0.564) are better than conventional stock indices (0.609) during the whole study period. The results of the Treynor ratio show that Islamic stock indices (1.304) are outperforming as compared to the conventional stocks (1.482) during the whole study period. Jensen’s Alpha represents that how much excess return is generated by stock markets from the risk-free rate of return and how much excess return investors should earn. The results of Jensen’s Alpha show that Shariah stock indices perform better than the conventional stock indices.
Table 19. Risk-Adjusted Return Performance of Conventional and Islamic Stock Indices
Overall
Year SR TR JR Economic
Stage Conv. Islamic Conv. Islamic Conv. Islamic
2007 -0.134 -0.125 -0.264 -0.254 -0.011 -0.009 Pre-Crisis
2008 -0.959 -0.853 -3.230 -2.743 -0.219 -0.211 During Crisis 2009 -0.051 -0.034 -0.238 -0.149 -0.122 -0.115
2010 -0.244 -0.238 -0.605 -0.562 -0.178 -0.173
Post Crisis
2011 -0.997 -0.972 -2.321 -2.184 -0.300 -0.290
2012 -0.378 -0.182 -1.741 -0.875 -0.273 -0.262
2013 -1.259 -1.224 -2.237 -2.167 -0.364 -0.352
2014 -2.076 -1.993 -4.603 -4.362 -0.383 -0.364
2015 -0.427 -0.409 -1.132 -1.073 -0.272 -0.266
2016 -0.081 -0.079 -0.193 -0.177 -0.075 -0.075
2017 -0.322 -0.294 -0.541 -0.488 -0.109 -0.097
2018 -0.391 -0.355 -0.707 -0.597 -0.108 -0.083
Average -0.610 -0.563 -1.484 -1.303 -0.201 -0.191

17
Table 20 and Table 21 presents the results of the risk-adjusted performance of conventional and Islamic indices for emerging and developed countries, respectively. The trend of results in developed as well as in emerging countries is the same. But the proportion of the return is much better in the emerging countries as compared to the developed countries; its ratio is almost double in the developed countries. Table 20. Risk-Adjusted Return Performance of Conventional and Islamic Stock Indices
in Developed Countries
Year SR TR JR
Economic Stage Conv. Islamic Conv. Islamic Conv. Islamic
2007 -0.161 -0.148 -0.254 -0.242 -0.014 -0.012 Pre-Crisis
2008 -1.259 -1.146 -3.546 -3.178 -0.235 -0.227 During Crisis
2009 -0.049 -0.024 -0.136 -0.102 -0.061 -0.054
2010 -0.324 -0.317 -0.746 -0.715 -0.219 -0.216
Post Crisis
2011 -0.536 -0.508 -0.766 -0.544 -0.139 -0.133
2012 -0.046 -0.033 -1.444 -0.824 -0.160 -0.151
2013 -2.023 -2.002 -3.113 -3.105 -0.317 -0.309
2014 -2.961 -2.891 -3.740 -3.666 -0.444 -0.429
2015 -0.679 -0.684 -1.690 -1.700 -0.421 -0.434
2016 -0.142 -0.136 -0.255 -0.242 -0.094 -0.086
2017 -0.470 -0.434 -0.767 -0.714 -0.143 -0.132
2018 -0.598 -0.551 -0.967 -0.880 -0.124 -0.099
Average -0.771 -0.739 -1.452 -1.326 -0.198 -0.190
Table 21. Risk Adjusted Return Performance of Conventional and Islamic Stock Indices in
Emerging Countries
Year SR TR JR
Economic Stage Conv. Islamic Conv. Islamic Conv. Islamic
2007 -0.107 -0.103 -0.274 -0.266 -0.007 -0.005 Pre-Crisis
2008 -0.659 -0.561 -2.915 -2.308 -0.204 -0.194 During Crisis
2009 -0.052 -0.045 -0.340 -0.196 -0.183 -0.175
2010 -0.163 -0.159 -0.464 -0.410 -0.137 -0.131
Post Crisis
2011 -1.458 -1.436 -3.875 -3.824 -0.461 -0.446
2012 -0.711 -0.331 -2.038 -0.927 -0.387 -0.374
2013 -0.494 -0.446 -1.361 -1.229 -0.411 -0.395
2014 -1.190 -1.094 -5.467 -5.058 -0.321 -0.299
2015 -0.174 -0.134 -0.574 -0.446 -0.122 -0.098
2016 -0.020 -0.022 -0.131 -0.112 -0.056 -0.063
2017 -0.174 -0.155 -0.315 -0.261 -0.074 -0.061
2018 -0.185 -0.160 -0.446 -0.314 -0.092 -0.068
Average -0.449 -0.387 -1.517 -1.279 -0.205 -0.192
Table 22 shows the results of the performance of the Islamic stock indices and conventional stock indices in different stages of the financial crisis. Before the crisis, Islamic stock indices have a higher Sharpe ratio and Treynor ratio, and Jensen’s Alpha as compared to the conventional stock indices. These results are in line with Hussein (2007). The results may show higher values because we have only seven months before the crisis period as it is the limitation of data.

18
Table 22. Overall Risk-Adjusted Return Performance of Conventional and Islamic Stock
Indices Before, During, and After Global Financial Crisis
Economic Stage
SR TR JR
Conv. Islamic Mean Difference
Conv. Islamic Mean Difference
Conv. Islamic Mean Difference
Pre crisis -0.134 -0.125 -0.009 -0.264 -0.254 -0.011 -0.011 -0.009 -0.002
During crisis -0.505 -0.444 -0.061 -1.734 -1.446 -0.288 -0.171 -0.163 -0.008
Post crisis -0.686 -0.639 -0.047 -1.564 -1.387 -0.177 -0.229 -0.218 -0.011
During the financial crisis, the Islamic stock indices and conventional stock indices of every country are showing negative returns. Islamic stock indices are outperforming the conventional stock indices according to risk-adjusted performance measures during the financial crisis, as shown in table 22. The same results are found by (Rizvi and Arshad, 2014; Alam and Rajjaque, 2016). The outcomes of the Sharpe ratio show that Islamic stock during the period of the financial crisis is better than conventional stock. The Treynor ratio produces the same results as the Sharpe ratio during the period of crisis. Jensen’s alpha results reveal that Islamic stock markets are outperforming during the financial crisis period but this performance is insignificant. The overall results of all adjusted risk measurements show that Islamic stocks are less risky. Moreover, the results over the crisis period show that both Shariah and conventional equity indices have recovered, but Islamic stock indices continue to perform better than the conventional stock indices, the findings are consistent with Al- Khazali et al., (2014). VIII. Conclusions
The main aim of this research is to investigate the difference in return performance of Islamic and conventional equity and bond indices in developed and emerging countries. The sample period is based on daily data of equity indices from June 1, 2007, to December 31, 2018, and split into three sub-periods (before the financial crisis, during the financial crisis, and after the financial crisis). The sample period of debt indices covers daily data from October 1, 2014, to December 31, 2018, because the developed countries are now in the Islamic debt investment. This research also focuses on examining the performance of Shariah and conventional equity indices using famous risk-adjusted-performance techniques. The results show that each Islamic indices and conventional indices progress towards an identical trend. During the 2008 crisis and bankruptcy, Islamic financial products perform higher than traditional products in certain sectors. The analysis concludes that the Islamic equity indices have better performance than the traditional indices in financial crisis. The individual sample concludes that Islamic equity indices of Germany and the UK perform better than traditional indices, but in the USA conventional indices perform better. The performance of Shariah equity indices in all selected emerging countries is better than the traditional equity indices. The results of this study are supported by Dharani (2011) and Hassan and Girard (2011). The results of the risk-adjusted return show that the performance of Shariah indices is better than the traditional indices during the crisis and non-crisis periods, the same results are endorsed by Sukmana and Kholid (2010). On the whole, this study concludes that Islamic equity indices perform better in developed and emerging countries except in the USA as the same result are supported by Abbes (2012). The experimental findings of this study provide some guidance lines and policy implications for individuals, central banks, stock exchanges, and the government. The Muslim investors of developed countries (the USA, the UK, and Germany) and emerging countries (Malaysia, Pakistan, and the UAE) can spend their capital likewise with their religious beliefs without enduring monetary achievements. This study can guide the international investors e.g. Exchange-traded funds (ETF) who deal with developed as well as emerging countries to seize information as the return of Islamic equity and debt does not cause the conventional equity and debt. Through
19
this, the investor can get benefit from diversification and can improve the performance of his/her portfolios even during the turmoil period or unstable period. References
Abbes,M.B.(2012).Risk and return of Islamic and conventional indices. International Journal
of Euro-Mediterranean Studies, 5(1), 1-23. Afshar, T. A. (2013). Compare and contrast Sukuk (Islamic Bonds) with conventional bonds, are
they compatible? Journal of Global Business Management, 9(1), 44. Ahmad, W., & Radzi, R. M. (2011). Sustainability of Sukuk and conventional bond during
financial crisis: Malaysia’s capital market. Global Economy and Finance Journal, 4(2), 33-45.
Alam, N., & Rajjaque, M. S. (2016). Shariah-compliant equities: Empirical evaluation of performance in the European market during credit crunch. In Islamic Finance (pp. 122-140). Palgrave Macmillan, Cham.
Albaity, M. S., & Mudor, H. (2012). Return performance, Cointegration and short run dynamics of Islamic and non-Islamic indices: evidence from the US and Malaysia during the subprime crisis. Atlantic Review of Economics, 1.
Alexakis, C., Pappas, V., & Tsikouras, A. (2015). Long Run asymmetric relationships between Islamic and conventional equity indices.
AlKhazali,O.,Lean,H.H.,&Samet,A.(2014).DoIslamicstockindexesoutperformconventionalstockindexes?Astochasticdominanceapproach.Pacific-Basin Finance Journal, 28, 29-46.
Ali, A. (2015). The Impact of Macroeconomic Instability on Social Progress: An Empirical Analysis of Pakistan. Ph.D Dissertation. NCBA&E, Lahore, Pakistan., 1-152.
Ali, A., & Rehman, H. U. (2015). Macroeconomic instability and its impact on gross domestic product: an empirical analysis of Pakistan. Pakistan Economic and Social Review, 285-316.
Ali, A., & Bibi, C. (2017). Determinants of social progress and its scenarios under the role of macroeconomic instability. Pakistan Economic and Social Review, 55(2), 533-568.
Ali, A. (2018). Issue of income inequality under the perceptive of macroeconomic instability: an empirical analysis of Pakistan. Pakistan Economic and Social Review, 56(1), 121-155.
Antoniou, A., Pescetto, G., & Violaris, A. (2003). Modeling international price relationships and interdependencies between the stock index and stock index futures of three EU countries: a multivariate analysis. Journal of Business Finance and Accounting, 30(5/6), 645-667.
Ariff, M., Chazi, A., Safari, M., & Zarei, A. (2017). Significant Difference in the Yields of Sukuk Bonds versus Conventional Bonds. Journal of Emerging Market Finance, 16(2), 115-135.
Ariff, M., Safari, M., & Mohamad, S. (2013). Sukuk securities and conventional bonds: Evidence of significant differences. Pertanika Journal of Social Science and Humanities, 21(2), 621-638.
Ashraf, D. (2013, July). Genesis of Differential Performance between Shari'Ah Compliant Equity Indices and Conventional Indices. In 20th Annual Conference of the Multinational Finance Society June.
Ata, H. A., & Buğan, M. F. (2015). Comparison of the Performances Islamic and Conventional Market Indices and Their Causal Relationship. International Journal of Business
Management and Economic Research (IJBMER), 6(6), 455-62. Banz, R. W. (1981). The Relationship between Return and Market Value of Common Stocks.
Journal of Financial Economics, 9(1), 3-18.
20
Basu, S. (1977). Investment Performance of Common Stocks in Relation to Their Price-Earnings Ratios: A Test of the Efficient Market Hypothesis. The Journal of Finance, 32(3), 663-682.
Baur, D., & Jung, R. C. (2006). Return and volatility linkages between the US and the German stockmarket. Journal of International Money and Finance, 25(4), 598-613.
Beik, I. S. (2008). Pro Ekonomi Syariah Pro Rakyat. Republika (2008, Desember 22). Bhandari, L. C. (1988). Debt/Equity Ratio and Expected Common Stock Returns: Empirical
Evidence. Journal of Finance, 507-528. Black, F., Jensen, M. C., & Scholes, M. S. (1972). The Capital Asset Pricing Model: Some
Empirical Tests. Boumediene, A., &Caby, J. (2009). The stability of Islamic banks during the subprime
crisis. Available at SSRN 1524775. Charles, A., Darné, O., & Pop, A. (2012). Are Islamic indexes more volatile than conventional
indexes? Evidence from Dow Jones Indexes. Journal of business cycle measurement and analysis.
Daly, K. J. (2003). Southeast Asian stock market linkages evidence from pre- and post October 1997. Asean Economics Bulletin, 20(1), 73-85.
Davidson, R., & Duclos, J. Y. (2000). Statistical inference for stochastic dominance and for the measurement of poverty and inequality. Econometrica, 68(6), 1435-1464.
Dewandaru, G., Rizvi, S. A. R., Masih, R., Masih, M., & Alhabshi, S. O. (2014). Stock market co-movements: Islamic versus conventional equity indices with multi-timescales analysis. Economic Systems, 38(4), 553-571.
Dharani, M. (2011). Seasonal anomalies between S&P CNX Nifty Shariah index and S&P CNX Nifty index in India. Journal of Social and Development Sciences, 1(3), 101-108.
El Amri, H., & Hamza, T. (2017). Are There Causal Relationships between Islamic versus Conventional Equity Indices? International Evidence. Studies in Business and
Economics, 12(1), 40-60. El Khamlichi, A., Sarkar, K., Arouri, M., & Teulon, F. (2014). Are Islamic equity indices more
efficient than their conventional counterparts? Evidence from major global index families. Journal of Applied Business Research, 30(4), 1137.
ElMosaid,F.,& Boutti,R.(2014).Sukuk and bond performance in Malaysia. International Journal
of Economics and Finance, 6(2), 226-234. El Qorchi, M (2005). Islamic finance gears up. Finance & Development, 42(4), 46-49. Pok, W. C., (2012). Analysis of Syariah Quantitative Screening Norms among Malaysia Syariah-
compliant Stocks. Investment Management and Financial Innovations, 9(2), 69-80. Fama, E. F., & French, K. R. (1998). Taxes, financing decisions, and firm value. The Journal of
Finance, 53(3), 819-843. Fama, E. F., & French, K. R. (2004). The Capital Asset Pricing Model: Theory and Evidence.
Journal of Economic Perspectives, 18, 25-46. Fathurahman, H., & Fitriati, R. (2013). Comparative analysis of return on Sukuk and
conventional bonds. American Journal of Economics, 3(3), 159-163. Friend, I., & Blume, M. (1970). Measurement of Portfolio Performance under Uncertainty. The
American Economic Review, 561-575. Fu, K. R. M. (2014). Does Shariah Compliant Stocks Perform Better than the Conventional
Stocks? A Comparative Study of Stocks Listed on the Australian Stock Exchange. Asian Journal of Finance & Accounting, 6(2).
Hammoudeh, S., Kim, W. J., & Sarafrazi, S. (2016). Sources of fluctuations in Islamic, US, EU, and Asia equity markets: The roles of economic uncertainty, interest rates, and stock indexes. Emerging Markets Finance and Trade, 52(5), 1195-1209.

21
Hammoudeh, S., Mensi, W., Reboredo, J. C., & Nguyen, D. K. (2014). Dynamic dependence of the global Islamic equity index with global conventional equity market indices and risk factors. Pacific-Basin Finance Journal, 30, 189-206.
Hansen, P. R., & Lunde, A. (2005). A forecast comparison of volatility models: does anything beat a GARCH (1, 1)?. Journal of applied econometrics, 20(7), 873-889.
Hassan, M. K., & Girard, E. (2011). Faith-based ethical investing: the case of Dow Jones Islamic indexes. Networks Financial Institute Working Paper, (2011-WP), 06.
Ho, C. S. F., Rahman, N. A. A., Yusuf, N. H. M., & Zamzamin, Z. (2014). Performance of global Islamic versus conventional share indices: International evidence. Pacific-Basin
Finance Journal, 28, 110-121. Hoque, H., Kabir, S. H., Abdelbari, E. K., & Manahov, V. (2016). Islamic and conventional
equity market movements during and after the financial crisis: Evidence from the newly launched MSCI indices. Financial Markets, Institutions & Instruments, 25(4), 217-252.
Jawadi, F., Jawadi, N., & Louhichi, W. (2014). Conventional and Islamic stock price performance: An empirical investigation. International Economics, 137, 73-87.
Jouini,E.,&Pastré,O.(2009).LaFinanceIslamique-Unesolutionàlacrise? Economica, Paris. Koutmos, G. (1996). Modeling the dynamic interdependence of major European stockmarkets.
Journal of Business Finance & Accounting, 23(7), 975-988. Lane, B. K. (2006). HD Islamic-bond market becomes global by attracting non-Muslim
borrowers. Lintner, J. (1965). The Valuation of Risk Assets and the Selection of Risky Investments in Stock
Portfolios and Capital Budgets. The Review of Economics and Statistics, 13-37. Mehmood, Khalid & Akhter, Waheed & Shahbaz, Muhammad. (2016). Performance of Islamic
vs. Conventional Capital Markets during Global Financial Crisis: An Empirical Study. Mookerjee, R., & Yu, Q. (1999). An empirical analysis of the equity markets in China. Review
of Financial Economics, 8(1), 41-60. Mossin, J. (1966). Equilibrium in a Capital Asset Market. Econometrica: Journal of the
Econometric Society, 768-783. Myers, S. C. (1993). Still searching for optimal capital structure. Journal of applied corporate
finance, 6(1), 4-14. Naifar, N., Mroua, M., & Bahloul, S. (2017). Do regional and global uncertainty factors affect
differently the conventional bonds and Sukuk? New evidence. Pacific-Basin Finance
Journal, 41, 65-74. Narayan, P. K., & Bannigidadmath, D. (2017). Does financial news predict stock returns? New
evidence from Islamic and non-Islamic stocks. Pacific-Basin Finance Journal, 42, 24-45.
Narayan, P. K., Phan, D. H. B., Sharma, S. S., & Westerlund, J. (2016). Are Islamic stock returns predictable? A global perspective. Pacific-Basin Finance Journal, 40, 210-223.
Naughton, S., & Naughton, T. (2000). Religion, ethics and stock trading: The case of an Islamic equities market. Journal of Business Ethics, 23(2), 145-159.
Ramasamy, R., Munisamy, S., & Helmi, M. H. M. (2011). Relative risk of IslamicSukukover government and conventional bonds. Global Journal of Management and Business
Research, 11(6), 4–12. Rana, M. E., & Akhter, W. (2015). Performance of Islamic and conventional stock indices:
empirical evidence from an emerging economy. Financial Innovation, 1(1), 15. Reinganum, M. R. (1981). Misspecification of Capital Asset Pricing: Empirical Anomalies
Based on Earnings' Yields and Market Values. Journal of Financial Economics, 9(1), 19-46.
22
Rizkiah, S. K., & Da’rain, R. F. (2016). Comparing the Performance of Islamic and Conventional Stocks in Jakarta Stock Exchange During Bull and Bear Market Periods. 4th ASEAN International Conference on Islamic Finance.
Rizvi, S. A., & Masih, M. (2013). Do Shariah (Islamic) Indices Provide a Safer Avenue in Crisis? Empirical Evidence from Dow Jones Indices using Multivariate GARCH-DCC.
Rizvi, S. A. R., & Arshad, S. (2014). An empirical study of Islamic equity as a better alternative during crisis using multivariate GARCH DCC. Islamic Economic Studies, 130(1155), 1-27.
Saâdaoui, F., Naifar, N., & Aldohaiman, M. S. (2017). Predictability and co-movement relationships between conventional and Islamic stock market indexes: A multiscale exploration using wavelets. Physica A: Statistical Mechanics and its Applications, 482, 552-568.
Safari, M. (2011, March). Are Sukuk securities the same as conventional bonds? In Proceedings of Foundation of Islamic Finance Series, Second Conference, Kuala Lumpur, Malaysia.
Safari, M., Ariff, M., & Mohamad, S. (2014). Sukuk securities: New ways of debt contracting. John Wiley & Sons.
Setiawan, C., & Oktariza, H. (2013). Syariah and conventional stocks performance of public companies listed on Indonesia Stock Exchange. Journal of Accounting, Finance and
Economics, 3(1), 51-64. Sharpe, W. F. (1964). Capital Asset Prices: A Theory of Market Equilibrium under Conditions
of Risk. The Journal of Finance, 19(3), 425-442. Sukmana, R., & Kolid, M. (2012). Impact of global financial crisis on Islamic and conventional
stocks in emerging market: an application of ARCH and GARCH method. Asian
Academy of Management Journal of Accounting & Finance, 31(2), 357-370. Tariq, A. A. (2004). Managing financial risks of Sukuk structures. Loughborough University,
UK, September. Wahdy, A. (2007). Perbandingan resiko dimbal hasil Sukuk dan obligasi konvensional dipasar
sekunder: studi kasus di Bursa Efek Surabaya 2004-2006. Zin, M. Z. M., Sakat, A. A., Ahmad, N. A., Nor, M. R. M., Bhari, A., Ishak, S., & Jamain, M. S.
(2011). The effectiveness of Sukuk in Islamic finance market. Australian Journal of
Basic and Applied Sciences, 5(12), 472-478.