performance evaluation of brick masonry building against
TRANSCRIPT
Performance Evaluation of Brick Masonry
Building against Blast Loading
by
EID BADSHAH
A thesis presented to the University of Engineering and Technology, Peshawar in
partial fulfillment of requirement for the degree of
Doctor of Philosophy
in
Civil Engineering
Department of Civil Engineering,
University of Engineering and Technology, Peshawar,
Khyber PukhtunKhwa, Pakistan 2018.

i
AUTHOR'S DECLARATION
I hereby declare that I am the sole author of this thesis. This is a true copy of the thesis,
including any required final revisions, as accepted by my examiners.
I understand that my thesis may be made electronically available to the public.

ii
Abstract
Typical primary school buildings are fabricated from unreinforced burnt clay brick masonry in
Khyber Pakhtunkhwa Pakistan. These school buildings are being targeted with improvised
explosive devices in the terrorist activities after 9/11 continuously. Consequently, several
hundred schools were partially damaged or fully collapsed due to improvised explosive devices
detonated in close vicinity. These school buildings are reconstructed again by the government
agencies without proper scientific knowledge of blast loading phenomenon and the expected
response of masonry buildings. Consequently, this research study is carried out to evaluate
response of brick masonry against blast loading.
In this report, response of burnt clay brick masonry against blast loading is investigated
experimentally. A representative primary school full scale unreinforced brick masonry building
and three different masonry systems (unreinforced, ferrocement overlay and confined masonry)
were fabricated in the field from typical burnt clay bricks with cement-sand (1:6) mortar
commonly used in Khyber Pakhtunkhwa Pakistan. All the four test specimens were placed on an
equal spacing on the perimeter of circle with a 3.66 m radius. The shock waves were generated at
the centre of the circle by igniting cylindrical shaped explosive charges placed at 0.91m height
from the ground surface. The test specimens were subjected to similar blast scenario in the eight
successive events with increasing explosive charge weights but fixed stand-off distances.
The recorded pressure data was processed and an empirical model predicting peak over
pressure for the cylindrical shaped explosives was developed. The damage level in test
specimens was evaluated after each successive blast event. Weak zones in masonry room were
identified and safe scaled distance for masonry room before collapse was experimentally
acquired. Scaled distances for different damage levels in the masonry system of walls were
obtained. The relative response of different masonry systems subjected to similar blast loading
environment was evaluated. The confined masonry, ferrocement overlay masonry and
unreinforced masonry walls were found in an increasing order of their responses against blast
loading.

iii
Acknowledgements
The research on performance evaluation of brick masonry against blast loading was novel
enough and the first PhD topic in University of Engineering & Technology Peshawar. The
research required field testing of prototype test specimens against more than 16 kg of TNT
equivalent explosive material. But access and acquisition of explosive materials with known
properties, measuring gadgets, technical human resource for safe handling of explosive material
and data acquisition during the test was a challenging task. Furthermore, acquiring safe and
spacious test range for fabrication of test models and experimental testing was an equally
difficult assignment. All the above tasks were easily accomplished with continuous support and
guidance of my research supervisor Professor Amjad Naseer. He actively supported me in
establishing liaison with a public sector organization specializing in manufacturing and handling
of explosive materials, and necessary gadgets for measuring shock wave parameters. Similarly,
he supported me in acquiring safe test range under the control of another esteemed public sector
organization. I am extremely thankful to both public sector organizations for their time, effort
and resources extended to the undersigned for successful and timely testing in the field.
I am equally thankful to Associate Professor Muhammad Ashraf for his guidance and
encouragement throughout my PhD work. He along with my supervisor was involved with me
during field testing as well as laboratory testing continuously. I am also obliged to Dr. Fayaz A
Khan who helped me in thesis compilation despite his personal engagements.
Finally, I extend great respect and gratitude towards Professor Akhter Naeem Khan for
owning and supporting my research study despite his personal commitments and busy schedule.

iv
Dedication The thesis dedicated to my parents

v
Table of Contents
Chapter 1. INTRODUCTION .................................................................................................... 1
1.1 BACKGROUND.............................................................................................................. 1
1.2 AIMS AND OBJECTIVES OF RESEARCH WORK .................................................... 2
1.3 SCOPE OF WORK .......................................................................................................... 2
1.4 RESEARCH SIGNIFICANCE ........................................................................................ 2
1.5 RESEARCH METHODOLOGY ..................................................................................... 3
1.6 THESIS ORGANIZATION ............................................................................................. 4
Chapter 2. LITERATURE REVIEW ......................................................................................... 6
2.1 BLAST ............................................................................................................................. 6
2.2 CAUSES OF BLAST ....................................................................................................... 6
2.2.1 Natural Causes .......................................................................................................... 6
2.2.2 Nuclear ...................................................................................................................... 6
2.2.3 Mechanical and Vapor .............................................................................................. 6
2.2.4 Chemical ................................................................................................................... 6
2.3 POSITION OF CENTRE OF BLAST WITH REFERENCE TO PROTECTIVE
STRUCTURE ............................................................................................................................. 8
2.3.1 Blast Position Relative to Ground and Target Structure ........................................... 9
2.3.2 Blast on the basis of Confinement .......................................................................... 11
2.4 NATURE OF LOADINGS ............................................................................................ 12
2.5 TNT EQUIVALENT WEIGHT ..................................................................................... 12
2.6 MECHANICS OF BLAST LOADING ......................................................................... 14
2.6.1 Pressure-Time-History ............................................................................................ 14
2.6.2 Scaling Laws ........................................................................................................... 16

vi
2.6.3 Reflected and Dynamic Pressure ............................................................................ 17
2.7 BLAST LOAD PREDICTION MODELS ..................................................................... 19
2.8 FACTORS AFFECTING BLAST WAVE PARAMETERS ......................................... 21
2.8.1 Effect of Charge Shapes.......................................................................................... 22
2.8.2 Effect of Adjacent Structures on Peak overpressure Parameters ............................ 24
2.9 RESPONSE OF STRUCTURES AGAINST BLAST LOADING:............................... 27
2.9.1 Effect of Stand-off Distance ................................................................................... 27
2.9.2 Effect of Structural Element Geometries ................................................................ 28
2.9.3 Effect of Material Properties ................................................................................... 29
2.7.4 BOUNDARY CONDITIONS AND PRE-COMPRESSION RATIO ......................... 30
2.10 MITIGATION ................................................................................................................ 31
2.10.1 Blast Wall................................................................................................................ 31
2.10.2 Architectural and Geometrical aspects of Buildings .............................................. 36
2.10.3 Retrofitting Techniques .......................................................................................... 38
Chapter 3. Experimental Program: Test Setup and fabrication of test specimens ................... 42
3.1 TEST SET-UP ................................................................................................................ 42
3.1.1 Experimental Layout of Test Specimen .................................................................. 42
3.1.2 Selection of Test Specimen ..................................................................................... 43
3.2 FABRICATION OF TEST MODEL ............................................................................. 48
3.2.1 Site Selection .......................................................................................................... 48
3.2.2 Phases of Fabrication of Models ............................................................................. 48
3.3 INSTRUMENTATION PLAN ...................................................................................... 51
3.3.1 High Speed Camera ................................................................................................ 51
3.3.2 Pressure Transducers .............................................................................................. 51

vii
3.3.3 Type of Explosives Material and Location ............................................................. 53
3.3.4 Measurement of Scaled distances for different Events ........................................... 55
Chapter 4. Experimental Program: Material Properties ........................................................... 56
4.1.1 Compressive Strength of Mortar ............................................................................. 56
4.1.2 Compressive strength of Concrete .......................................................................... 57
4.1.3 Tests of Brick Unit .................................................................................................. 57
4.1.4 Tests of Masonry Assemblage ................................................................................ 60
4.1.5 Tensile Strength of Steel and Mesh ........................................................................ 64
Chapter 5. Results and discussion ............................................................................................ 65
5.1 HIGH SPEED CAMERA .............................................................................................. 65
5.2 PRESSURE DATA ........................................................................................................ 66
5.3 PRESSURE MODELS................................................................................................... 67
5.3.1 Comparison of Pressure Model with Models of Other Researchers ....................... 67
5.3.2 Comparison of Pressures for Sensors Installed on Different Locations of Test
Specimen ............................................................................................................................... 68
5.4 EVENTS VS DAMAGES IN WALLS.......................................................................... 69
5.4.1 Damages in Walls ................................................................................................... 70
5.4.2 Response of Walls................................................................................................... 76
5.5 EVENTS VS DAMAGES IN FULL SCALE ROOM ................................................... 79
5.5.1 Damages in Full Scale Room .................................................................................. 80
5.5.2 Response of Full Scale Room ................................................................................. 93
5.5.3 Response of Columns ............................................................................................. 94
5.5.4 Response of Windows & Door ............................................................................... 96
5.5.5 Response of front wall ............................................................................................ 98

viii
5.5.6 Response of Side (Return) Walls ............................................................................ 98
5.5.7 Response of Rear Wall............................................................................................ 99
5.5.8 Response of RC slab ............................................................................................. 100
Chapter 6. SUMMARY, CONCLUSIONS AND RECOMMENDATIONS......................... 101
6.1 SUMMARY ................................................................................................................. 101
6.2 CONCLUSIONS .......................................................................................................... 102
6.3 RECOMMENDATIONS ............................................................................................. 103
6.4 FUTURE WORK ......................................................................................................... 105
ix
List of Figures Figure 1.1. Flow Chart of Proposed Methodology ......................................................................... 3
Figure 2.1: Categories of Explosive Loading [UFC 3-340-02(2008), Koccaz et al (2008)] .......... 8
Figure 2.2: Typical free air burst scenario (a) Free air burst wave front when blast occurs above
structure. (b) Free air burst wave front when blast occurs not above structure ...................... 9
Figure 2.3: Air burst scenario (a) Relative position of charge with respect to ground surface and
target structure (b) Mach front and formation of path of triple point ................................... 10
Figure 2.4: Surface burst wave front [TM 5-1300(1990)]. ........................................................... 11
Figure 2.5: Pressure Time History [UFC3-340-02(2008)] ........................................................... 15
Figure 2.6: Variation of peak incident pressure with stand-off distance [Karlos and Solomos
(2013)]................................................................................................................................... 17
Figure 2.7: Influence of incidence angle on the reflected over pressure [UFC 3-340-02 (2008)] 18
Figure 2.8: Comparison of reflected, incident and dynamic time-histories [Karlos and Solomos
(2013)]................................................................................................................................... 19
Figure 2.9: Different shapes of explosives [UFC 3-340-02 (2008)] ............................................. 22
Figure 2.10: Pressure field near the charge (A) spherical, (B) Cylindrical with L/D=1.5 and (C)
Cylindrical with L/D=10 [Simoens.B and Lefebvre.M, (2015)]. ......................................... 23
Figure 2.11: Shock waves and bridge waves from cylindrical explosives [Knock and Davies
(2013)]................................................................................................................................... 23
Figure 2.12: Detail of Explosive placement, Street and Target Office Block [Badshah et al
(2017)]................................................................................................................................... 25
Figure 2.13: Comparison of Free Air Field and Street Channeled Blast Pressure Time History
[Badshah et al (2017)]. .......................................................................................................... 25
Figure 2.14 Detail of Experimental Set Up [Badshah et al (2017)].............................................. 29
Figure 2.15 Detail of boundary conditions [El-Domiaty et al (2002)] ......................................... 30
Figure 2.16 Experimental arrangement and visualization pressure waves trajectories diffracting
over the blast wall [Badshah et al (2017)] ............................................................................ 32
Figure 2.17 Detail of Explosive placement, Barrier wall and Target Building [Badshah et al
(2017)]................................................................................................................................... 33
Figure 2.18 (a) Pressure contour map without wall (b) Pressure contour map with wall [Rose et
al (1995)] ............................................................................................................................... 35

x
Figure 2.19: Peak pressure attenuation with different blast wall [Badshah et al (2017)] ............. 35
Figure 2.20: Peak pressure and Impulse variation with blast wall fabricated from different
materials [Badshah et al (2017)] ........................................................................................... 36
Figure 2.21: Layout of building for Blast Protection [Badshah et al (2017)] ............................... 37
Figure 2.22: Landscape design for attenuating blast effect [Badshah et al (2017)] ..................... 37
Figure 2.23: Resistance of CMU for different system of reinforcement [Sielicki (2013)]........... 40
Figure 3.1: Layout of test specimens ............................................................................................ 43
Figure 3.2: Details of Full Scale Unreinforced Masonry Room ................................................... 45
Figure 3.3: Details of Unreinforced Masonry Wall ...................................................................... 46
Figure 3.4: Details of Ferrocement wall ....................................................................................... 47
Figure 3.5:-Details of Confined Masonry Wall ............................................................................ 48
Figure 3.6: Different phases of fabrication of test specimen (a)Fabrication of room above ground
level(b)Fabrication of veranda lintel beam(c) Room before casting of RC slab(d) Form work
before casting of slab(e) Casting of slab (f) Completed room model (g) Fabrication of
confined masonry wall (h) Ferrocement overlay before application of plaster (i)
Ferrocement overlay wall complete (j) Fabrication of unreinforced masonry wall (k) Test
specimen ready (l) Installation of windows and door ........................................................... 50
Figure 3.7: (a) Kistler pressure transducer (b) pressure transducer mounted on structure .......... 52
Figure 3.8(a) Typical cylindrical shaped explosive with booster and safety fuse (b) preparation of
sample (c) Tripod for ensuring 0.91 m height above ground surface ................................... 54
Figure 4.1: Determination of IRA ................................................................................................. 59
Figure 4.2: Compression test of masonry prism in Universal Testing Machine .......................... 61
Figure 4.3: Experimental arrangements for of brick triplet test.................................................... 62
Figure 4.4: Brick triplet test ......................................................................................................... 63
Figure 4.5: Field investigation of in-situ shear strength of masonry ............................................ 63
Figure 5.1: Formation of shock wave during the blast ................................................................. 65
Figure 5.2: (a) Pressure profile for 0.5 kg (b) Pressure profile for 3.91 kg .................................. 66
Figure 5.3: Comparison of pressure models [Badshah et al (2017)] ............................................ 68
Figure 5.4: Comparison of peak overpressure at different locations ............................................ 69
Figure 5.5: Masonry response after No.1 (a) Confined masonry [Badshah et al 92017)] ............ 70
Figure 5.6: Masonry response after event No.2 (a) Confined masonry (b) Ferrocemented overlay

xi
masonry (c) Unreinforced masonry .................................................................................... 71
Figure 5.7: Masonry response after event No. 3 (a) Confined masonry (b) Ferrocemented overlay
masonry (c) Unreinforced masonry out-of-plane wall (d) Unreinforced masonry in-plane
wall ........................................................................................................................................ 72
Figure 5.8: Response of masonry after event No. 4 (a) Appearance of diagonal crack and
widening of beam column joint in confined masonry (b) Debonding of wire mesh in
ferrocement overlay masonry wall (c) Out-of-plane wall of unreinforced masonry wall (d)
In-plane wall of unreinforced masonry wall ......................................................................... 73
Figure 5.9: Masonry response after event No.5 (a) Confined masonry wall (b) Debonding of
ferrocement overlay from masonry wall (c) Loosening and falling of bricks from
ferrocement overlay masonry wall (d) Collapse of unreinforced masonry wall [Badshah et
al (2017)] ............................................................................................................................... 74
Figure 5.10: Response of confined masonry after event No.6 (a) Separation of walls and column
and (b) Failure of beam-column joint (c) Ferrocement overlay masonry wall ..................... 75
Figure 5.11: Response of confined masonry after event No.7 (a) Partial collapse of out-plane-
wall (b) Widening of wall-column joint and (c) Collapse of ferrocement overlay masonry 76
Figure 5.12: Response of confined masonry after event No.8 (a) Complete collapse of out-plan-
wall (b) Widening of wall-column joint ............................................................................... 76
Figure 5.13: Damages to front window, door and sill level after event no.1 ................................ 80
Figure 5.14: Damages to front window, door and sill level after event no.2 ................................ 81
Figure 5.15: Damages to rear windows and sill level after event no.2 ......................................... 81
Figure 5.16: Damages to front window sill level after event no.3 ................................................ 82
Figure 5.17: Diagonal cracks in front right pier after event no.3 ................................................. 82
Figure 5.18: Spalling of concrete from lintel beam after event no.3 ............................................ 83
Figure 5.19:Separation of in-plane and out-of-plane wall after event no.3 .................................. 83
Figure 5.20: Collapse of rear window panels after event no.3 ..................................................... 84
Figure 5.21: Sill damage, diagonal cracks above lintel beam and horizontal minor crack in
middle column after event no.4 ............................................................................................ 85
Figure 5.22: Horizontal cracks in front wall below slab after event no.4 ..................................... 85
Figure 5.23: Separation of walls after event no.4 ......................................................................... 86
Figure 5.24: Diagonal cracks in right pier after event no.4 ......................................................... 86

xii
Figure 5.25: Masonry fall from front window sill after event no.4 .............................................. 87
Figure 5.26: Diagonal cracks after event no.4 .............................................................................. 87
Figure 5.27: Diagonal cracks above lintel beam and flexural cracks in columns after event no.588
Figure 5.28: Separation of walls after event no.5 ......................................................................... 88
Figure 5.29: Loosing of bricks at mid-height after event no.6 ..................................................... 89
Figure 5.30: Loosing of bricks below slab after event no.6 .......................................................... 90
Figure 5.31: Diagonal cracks in rear pier after event no.6 ............................................................ 90
Figure 5.32: Damages in front piers and masonry above lintel beam after event no.6 ................ 91
Figure 5.33: Collapse of column and failure of slab in veranda portion after event no.7 ............ 91
Figure 5.34: Collapse of column and failure of slab in veranda portion after event no.7 ............ 92
Figure 5.35: Displacement of slab towards front side after event no.7 ........................................ 92
Figure 5.36: Room after event no.8 .............................................................................................. 93
Figure 5.37: Collapse of masonry room after event no.9 ............................................................. 93
xiii
List of Tables Table 2-1: Categories of Explosive Loading [UFC 3-340-02(2008)] ............................................ 9
Table 2-2: Detail of equivalent TNT factors for explosives ......................................................... 13
Table 2-3: Maximum limit of charge weight and means of transportation [Karlos and Solomos
(2013)]................................................................................................................................... 14
Table 3-1: Position of pressure sensors ........................................................................................ 53
Table 3.2: Weight of Composition-B with different L/D ratio ..................................................... 54
Table 3.3: Scaled distance for different events ............................................................................. 55
Table 4.1: Compressive strength of mortar................................................................................... 57
Table 4.2: Compressive strength of concrete ................................................................................ 57
Table 4-3: Compressive Strength of Brick unit (MPa) ................................................................. 58
Table 4.4: Initial rate of absorption by brick units........................................................................ 59
Table 4.5: Water absorption of brick units ................................................................................... 60
Table 4.6: Compressive strength of masonry prism ..................................................................... 61
Table 4.7: Combination of shear and normal loads in brick triplet tests ...................................... 62
Table 5.1: Measured peak overpressure for different events ........................................................ 66
Table 5.2 Levels of Damage to Tested Walls ............................................................................... 77
Table 5.3 Antiterrorism/Force Design Parameters along with scaled distance ............................ 77
Table 5.4 Blast Events and scaled distances versus damage and threat level for unreinforced
masonry wall ......................................................................................................................... 78
Table 5.5 Blast Events and scaled distances versus damage and threat level for ferrocemented
overlay unreinforced masonry wall ...................................................................................... 78
Table 5.6 Blast Events and scaled distances versus damage and threat level for confined masonry
wall ........................................................................................................................................ 79
Table 5.7 Blast Events and scaled distances versus damage and threat level for masonry columns
............................................................................................................................................... 95
Table 5.8 Safe stand-off distance of columns for different explosive charges ............................. 96
Table 5.9: Blast Events versus damage and threat level for front window.................................. 96
Table 5.10 Blast Events versus damage and threat level for front door ...................................... 97
Table 5.11 Blast events versus damage and threat level for rear windows ................................. 97
Table 5.12 Blast Events and scaled distances versus damage and threat level for front wall of

xiv
masonry room ....................................................................................................................... 98
Table 5.13 Blast Events and scaled distances versus damage and threat level for side masonry
wall ........................................................................................................................................ 99
Table 5.14 Blast Events and scaled distances versus damage for rear masonry wall ................. 100

1
Chapter 1. INTRODUCTION
1.1 BACKGROUND
Terrorists have played havoc with public infrastructure in Khyber Pakhtunkhwa and former
Federally Administrated Tribal Areas (FATA) after 9/11. They started targeting with improvised
explosive devices the public buildings particularly the vulnerable schools buildings in Khyber
Pakhtunkhwa and adjoining former Tribal Areas. The militants attacked schools to further their
agenda of intolerance and exclusion, to target symbols of the government, and particularly to
drive girls out of education. The Primary School buildings were more vulnerable to sabotage
activities due to deficient or no security systems in place during night time. This menace of
terrorism has hit almost tens of hundreds primary schools. The exact statistics of damaged school
buildings is not known. However, according to Planning Department at FATA Secretariat, in
only one decade after the year 2001 militants attacked 1195 schools of which 700 hundreds were
destroyed in former FATA (Saeed, A 2016). Similarly, Ministry for States and Frontier Regions
(SAFRON) Pakistan reported in December 2015 “360 schools were destroyed in three of the
seven regions of FATA in 2015” (Hussain R.S 2017). Similarly, Malala Yousafzai said “I was
just 10 when more than 400 schools [in Pakistan] were destroyed,” when she accepted the Nobel
Peace Prize in 2014 (Griffiths, H 2017). Consequently, hundreds of thousands of children are
out of schools.
The targeted school buildings were either completely collapsed or heavily and partially damaged.
These schools are mostly built of unreinforced burnt clay brick walls with few exceptions of
stone masonry having reinforced concrete (RC) slab with peculiar configuration of two rooms L-
shaped single storied school buildings (Primary School). The associated cost in repair,
reconstruction and rehabilitation is in billion of rupees much beyond the capacity of cash starved
Province of Khyber Pakhtunkhwa Pakistan. Many schools are under reconstruction, repair and
rehabilitation with the same conventional materials of clay bricks and cement mortar without any
technical knowledge of the effects of recurrent bomb blasts on these rebuilt/renovated school
buildings. The scourge of terrorism and ensuing targeting of school buildings as soft targets for
terrorists in this region continues unabated in the backdrop of abundant local input of human

2
resources and other vital parameters causing terrorism. Furthermore, most of the research work
on blast loading is either classified and limited to military establishments or devoted to RCC
and structures fabricated with concrete masonry units (CMU) only. Work on burnt brick masonry
is almost non-existent. Furthermore, masonry buildings are almost 70% of buildings worldwide
as it adds aesthetics, fire resistance and fine mechanical properties to the buildings at lesser cost
(Babatunde, 2017).
Therefore, situation in Pakistan especially Khyber Pakhtunkhwa and FATA is alarming due to
non-availability of quantified research on the behavior of burnt brick masonry against blast
loading. This inadequate scientific knowledge and persistent militant attacks has promted
research on the performance evaluation of burnt brick masonry against blast loading.
1.2 AIMS AND OBJECTIVES OF RESEARCH WORK
Aims and objectives of this research are outlined as below:
1. Development of empirical model for predicting peak overpressure from cylindrical
shaped explosives in the surface burst scenario.
2. Performance evaluation of unreinforced clay brick masonry building subjected to blast
loads
3. Evaluation of relative response of different masonry systems against blast loading,
4. Recommendations on blast efficient brick masonry system.
1.3 SCOPE OF WORK
The scope of work includes fabrication of unreinforced burnt clay brick masonry room along
with veranda of representative primary school building and three different masonry systems-
unreinforced, ferrocement overlay and confined masonry walls in the field. Subsequent
incremental blast load testing of these four test specimens and determination of material
properties of constituent materials in the field and laboratory is also the scope of research work.
1.4 RESEARCH SIGNIFICANCE
An empirical model predicting reflected pressure for car/suicide bomber scenario is developed.
The research is need based which quantifies the response of a representative primary school
building to varying intensity of blast loads. Weak zones are identified and corrective measures

3
are suggested. Scaled Distances for different damages level are also determined. Safe scaled
distance before collapse for the brick masonry building as whole is evaluated experimentally.
Similarly, response of unreinforced, confined and ferrocement overlay masonry against same
blast scenario is evaluated. Afterwards, the efficiency of each masonry system is evaluated and
compared with one another.
1.5 RESEARCH METHODOLOGY
In order to achieve the stated objectives the following methodology has been followed as shown
in Figure 1.1.
Figure 1.1. Flow Chart of Proposed Methodology
Public School buildings have been the easiest targets for the terrorists because of their easy

4
accessibility and poor security system. As a result, tens of hundreds schools have been attacked
with improvised explosive devices. Consequently, this militancy has disrupted the education of
hundreds of thousands of children, particularly girls, exacerbating further the pathetic literacy
rate in Khyber Pakhtunkhwa and former FATA Pakistan. These schools require huge capital for
their re-construction.
The major construction materials for these school buildings are unreinforced brick masonry
made of burnt bricks and mortar with RC slabs. The scientific study of the unreinforced brick
masonry against blast loading especially in our environment is rarely available. Therefore, the
primary aim of this research study is to evaluate the behavior/performance of school buildings
especially primary school buildings and evaluate scaled distance before collapse. Primary school
building is typically L-shaped two rooms (7.6 m x 5 m) building with front veranda of 2.75 m.
Each room has one door and three windows.
Therefore, a single room with internal dimension 4.8 m x 3 m along with veranda of 1.80 m
width was fabricated in the field. A door and window were provided in the front wall, while two
windows were constructed in the rear wall of the room. The size of room and veranda has been
partially reduced for reducing the cost. The behavior of the reduced scale is nearly representative
of the actual full scale model as pier length remains the same and total opening size is
proportionate to the actual building. The walls are typically 23 cm thick, fabricated from burnt
clay brick and cement mortar without any confinement. The roof of veranda and room was cast
monolithically. The veranda columns (34.5 cm x 23 cm) were constructed with unreinforced
masonry.
Similarly, unreinforced, ferrocement overlay and confined masonry walls each 23 cm thick were
fabricated in the field to compare their relative performance against blast loading.
Material properties of the constituent materials were determined in the field and laboratory of
Civil Engineering Department, University of Engineering and Technology, Peshawar.
1.6 THESIS ORGANIZATION
The thesis contains report of field testing of test specimens for evaluating response against blast
loading. Furthermore, laboratory testing has been carried out to quantify the mechanical and
physical properties of constituent materials. The thesis is divided into six chapters and presented

5
as follows:
Chapter 1 is the current chapter. It contains the background, aims & objectives of research,
scope of work, research significance and research methodology.
Chapter 2 provides the relevant and latest literature review in detail. Blast loading, parameters
of shock waves and its dependence on nature, shape and weight of explosive material are
presented. Variation of shock wave parameters with distance of explosive material from the
target structure as well as elevation from ground surface and effects of urban environment has
been discussed. The chapter also furnishes the blast loading response of masonry structures and
its dependence on material and geometrical properties. Various mitigation techniques against
blast loading such as blast wall, incorporating efficient architecture, and retrofitting techniques
have been enlisted.
Chapter 3 presents detail of test set-up, description and fabrication of test specimens, and
instrumentation plan.
Chapter 4 contains the physical and mechanical properties acquired in the laboratory as well as
in the field of constituent materials used in fabrication of test specimens.
Chapter 5 gives the data acquired during the test and visual observations of damages pattern and
intensity in the test specimens after each blast event. The data and observations are analyzed and
discussed in details.
Chapter 6 presents the summary, conclusions and recommendations.

6
Chapter 2. LITERATURE REVIEW
In this chapter, fundamentals of blast loading and various factors affecting blast load parameters,
explosive types, and response of structure and blast load mitigation strategies for masonry
structures are discussed.
2.1 BLAST
Blast is a destructive wave of highly compressed air spreading outwards from an explosion.
During blast there is energy and gaseous release with rapid volume and temperature increase.
2.2 CAUSES OF BLAST
Blast may be caused by various means as described below:
2.2.1 Natural Causes
Volcanic eruption is one of the major causes of natural explosion. Magma in large quantity with
dissolved gases content evolves larger volume of gases when rises and results in explosion in the
weaker layer of earth crust. Similarly, explosions in the Universe are mainly due to supernova
which is produced due to the sudden stoppage or start of fusion reaction in the stars.
2.2.2 Nuclear
Uncontrolled fusion and fission chain reaction results in devastating explosion with generation of
shock waves and release of enormous heat and radiations.
2.2.3 Mechanical and Vapor
It involves physical change during explosion rather than chemical or nuclear change. Bursting of
pressure cooker is the typical example. If the contents of container are explosive chemicals such
as propane or spirit, then chemical explosion takes place and the scenario becomes devastating.
2.2.4 Chemical
In general chemical explosives are used as commercial explosives. Chemical explosion involves
high exothermic reactions. Highly reactive substances contain potential energy and sudden

7
oxidation of those substances result in explosion accompanied by high pressure, heat, light and
sound. Gun powder or black powder (mixture of charcoal, sulphure and potassium nitrate) was
the first explosive chemical substance invented by Chinese in the ninth century. An explosive
charge is defined quantity of explosive material consisting of single material or combination of
two or more explosive materials.
Chemical explosives are further categorized on the basis of speed of expansion of chemical
reaction and sensitivity.
i. Speed of expansion of chemical reaction
The oxidation reaction in some explosives is fast enough while other oxidizes slowly.
a) High explosives: These are detonating explosives and the chemical reaction within the
explosive material moves faster than the speed of sound e.g. TNT (Trinitrotoluene), C4 and
Compound-B etc. High explosives detonate with much higher detonating velocity (3-9
km/second).
b) Low explosives: These materials deflagrate only and speed of the chemical front is slower
than the speed of sound e.g. gun powder. Low explosive are easy to control as compared to
high explosives.
c) Improvised explosives: These are made from locally available materials and not so much
reliable as industry made explosives. They have the advantage of being fabricated from
commonplace by the non technical personnel and can be adjusted to the required shape and
quantity at the spot. These are used by guerrilla warfare of regular army as well as non state
actors. The speed of chemical front is very slow in these explosives.
ii. Sensitivity
a) Primary Explosives: These are sensitive in nature. Chemical reaction can be initiated by
application of small pressure or temperature e.g. acetone peroxide, explosive antimony
ammonium permanganate etc. Primary explosives are usually used as triggers for the
secondary explosives. These explosive requires extreme care during handling.
b) Secondary Explosives: These explosives such as TNT and RDX (Research Department
Explosive) are less sensitive than primary explosives and substantially greater amount of
energy is required for initiation of chemical reaction. They can be easily handled and are
used in many applications.

8
c) Tertiary Explosives: These explosives such as ANFO (Ammonium nitrate/Fuel oil) cannot
be triggered by primary explosive but require special intermediate boosters of secondary
explosives. These explosives have found wider use in construction and mining industry as
these are safe and less costly.
2.3 POSITION OF CENTRE OF BLAST WITH REFERENCE TO
PROTECTIVE STRUCTURE
Blast effects on structure vary with relative position of centre of blast with respect to ground
surface as well as the structure. The blast may be free air burst, air burst and surface burst and
also the blast may be either confined or unconfined as shown in Figure 2.1 and Table 2-1.
Figure 2.1: Categories of Explosive Loading [UFC 3-340-02(2008), Koccaz et al (2008)]

9
Table 2-1: Categories of Explosive Loading [UFC 3-340-02(2008)]
S.NO. Charge status Detail category Pressure loads Protective structure
1 Confined
A-Fully vented Internal shock and leakage Cubicle
B-Partially confined Internal shock, leakage
and internal gas
Suppressive shield or
partial containment cell
C-Fully confined Internal shock and internal
gas Full containment cell
2 Unconfined
D-Free Air burst Un reflected
Shelter E-Air burst Reflected
F-Surface burst Reflected
2.3.1 Blast Position Relative to Ground and Target Structure
a. Free Air Burst Blast
In this scenario explosion takes place above and adjacent to structure and initial shock wave
impinges the structure directly and is not reinforced from the surrounding environment such as
ground surface before reaching the target structure (TM 5-1300 [1990]). The blast wave is
spherical in nature and energy is uniformly distributed while ground surface receives lesser
energy such as artillery shell exploding in the air as shown in Figure 2.2.
(a) [Oesterle, M. G. (2009)] (b) [Karlos and Solomos (2013)]
Figure 2.2: Typical free air burst scenario (a) Free air burst wave front when blast occurs above
structure. (b) Free air burst wave front when blast occurs not above structure

10
b. Air Burst Blast
In an air burst, the blast occurs at such distance in the air from the protective structure that the
shock waves are reflected from the ground and magnified before reaching the protective
structure as shown in Figure 2.3.
(a)[TM5-1300 (1990)] (b) [TM 5-1300 (1990)]
Figure 2.3: Air burst scenario (a) Relative position of charge with respect to ground surface and target
structure (b) Mach front and formation of path of triple point
c. Surface Burst
In a surface burst, the pressure–time curve does not match the equivalent- charge curve of a free-
air burst because of the immediate interaction of the blast wave with the underlying ground
surface (Karlos, et al 2016). In surface burst scenario the explosion takes place on the ground or
near the ground surface. The incident wave merges with reflected wave immediately.
Consequently, the shock wave travels as single hemispherical wave outside from the point of
explosion. The blast wave parameters are calculated on the formulae as used in free air burst
scenario provided an enhancement factor is applied to the explosive charge weight used (Smith
and Herington (2014). In surface blast, blast wave energy is doubled when ground surface is
considered as perfect reflecting surface. But some energy is dissipated in formation of craters
and shock waves in the underlying ground. Therefore, an enhancement factor 1.8 is applied to
the explosive charge weight for surface burst in practice. However, TM5-1300 (1990) does not
enhance the charge weight but has developed separate graphs for different parameters vs scaled
distance (Z) for surface blast shock waves. In case of suicide bomber scenario, the centre of blast
is adjacent to the ground surface and shock wave strikes the protective structure with more
intensified parameters due to immediate reflection of shock wave from the ground surface as

11
shown in Figure 2.4.
Figure 2.4: Surface burst wave front [TM 5-1300(1990)].
The structural designers give practical importance to the produced hemispherical wave as large
explosive charges from terrorist attacks are likely to be located at approximately ground level
near or inside the target structure.
2.3.2 Blast on the basis of Confinement
In confined blast scenario the shock waves are magnified due to reflection from the structure.
Confined blast may accidently occur in homes, industry or when military and terrorists target
urban centers during war and peace time, respectively. In this scenario, effects to life and
property are catastrophic. The magnitude of damage depends on the geometries and materials of
the confining structure, location of the explosive material etc. These are further subdivided as
follows.
a. Fully Vented Blast Event
In this event, confinement to the shock waves is minimum and may take place when the
explosion event occurs at close distance to the structure and barrier or when explosion occurs
inside the structure with one or more surfaces missing.
b. Partially Confined Blast Event
In this scenario, pressure is more than the fully vented blast event for the same equivalent TNT
charge weight. It will be generated when blast occurs within structure with partial openings such
as ventilators, windows door etc.

12
c. Fully Confined Explosion
It is generated when explosion occurs within a structure with no openings and is more severe
among the three scenarios.
2.4 NATURE OF LOADINGS
All loads in nature are time dependent. Response of the structure depends on the ratio of duration
of the blast and natural time period of the structure. Increasing this ratio the response of the
structure will change from Impulsive to Dynamic and Quasi-Static in nature. For slowly varying
loads, the structure responses in a static manner (Kappos.A.J., 2002).
a. Quasi-Static Loading
In this case the rate of application of load is very low as compared to the natural time period of
the structure. Consequently, inertia and damping effects are neglected. The response of the
structure is governed by
𝑭 = 𝒌𝒖 2.1
Where ‘k’ is the spring constant or stiffness of the structure and ‘u’ represents displacement.
b. Dynamic Loading
In dynamic loading the duration of load application is equal or almost equal to the natural time
period of structure. Inertial forces resulting from Newton Second Law of Motion (F = mu) and
damping are included in measuring the response of the structure as given by Equation No. 2.2.
F = ku+cu+mu 2.2
c. Impulsive Loading
The duration of load is very small as compared to the natural time period of the structure and the
structure has inadequate time to respond. Consequently, the effects of loads are much
pronounced on structure [(Louca & Friis 2002)].
2.5 TNT EQUIVALENT WEIGHT
Measured quantity of single explosive or mixture of explosive materials is called explosive
charge. It is measured in kilogram (kg). The explosive materials are available in wide variety and
13
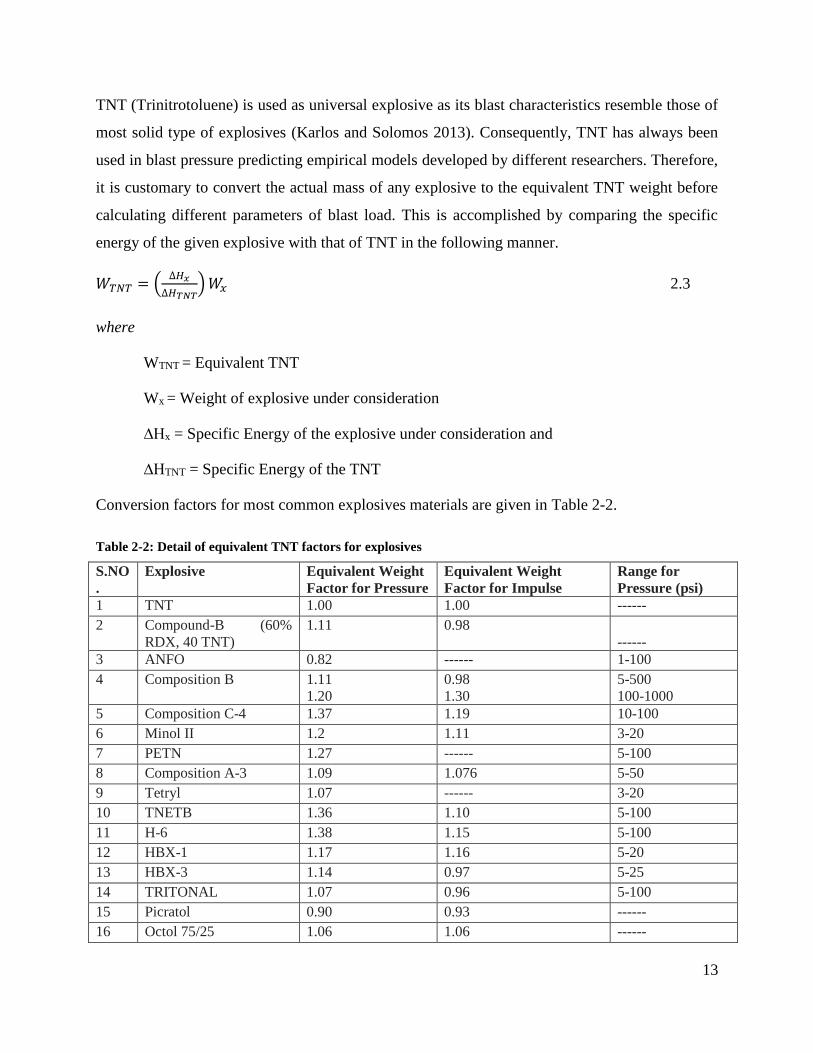
TNT (Trinitrotoluene) is used as universal explosive as its blast characteristics resemble those of
most solid type of explosives (Karlos and Solomos 2013). Consequently, TNT has always been
used in blast pressure predicting empirical models developed by different researchers. Therefore,
it is customary to convert the actual mass of any explosive to the equivalent TNT weight before
calculating different parameters of blast load. This is accomplished by comparing the specific
energy of the given explosive with that of TNT in the following manner.
𝑊𝑇𝑁𝑇 = (∆𝐻𝑥
∆𝐻𝑇𝑁𝑇) 𝑊𝑥 2.3
where
WTNT = Equivalent TNT
Wx = Weight of explosive under consideration
∆Hx = Specific Energy of the explosive under consideration and
∆HTNT = Specific Energy of the TNT
Conversion factors for most common explosives materials are given in Table 2-2.
Table 2-2: Detail of equivalent TNT factors for explosives
S.NO
.
Explosive Equivalent Weight
Factor for Pressure
Equivalent Weight
Factor for Impulse
Range for
Pressure (psi)
1 TNT 1.00 1.00 ------
2 Compound-B (60%
RDX, 40 TNT)
1.11 0.98
------
3 ANFO 0.82 ------ 1-100
4 Composition B 1.11
1.20
0.98
1.30
5-500
100-1000
5 Composition C-4 1.37 1.19 10-100
6 Minol II 1.2 1.11 3-20
7 PETN 1.27 ------ 5-100
8 Composition A-3 1.09 1.076 5-50
9 Tetryl 1.07 ------ 3-20
10 TNETB 1.36 1.10 5-100
11 H-6 1.38 1.15 5-100
12 HBX-1 1.17 1.16 5-20
13 HBX-3 1.14 0.97 5-25
14 TRITONAL 1.07 0.96 5-100
15 Picratol 0.90 0.93 ------
16 Octol 75/25 1.06 1.06 ------

14
The charge weight in terrorist activities is generally estimated by considering stipulated attack
scenario. The explosive charge varies from 10 kg (suitcase bomb) to 10,000 kg (explosives laden
on large truck) depending on resources and access to the target structure. Explosives charges
along with means of transportation are given in Table 2-3.
Table 2-3: Maximum limit of charge weight and means of transportation [Karlos and Solomos (2013)]
As nature of explosive and charge weight are uncertain, therefore, the charge weight is increased
by 20% approximately (Karlos and Solomos, 2013).
2.6 MECHANICS OF BLAST LOADING
This section deals with types of chemical blast and methods for finding parameters of blast load
as input for designing blast resistant structures. In practice blast load at given point depends on
various factors such as charge weight of the explosive, nature of explosive material, shape of the
explosive material, stand-off distance from the target point, and position of explosive material
relative to the ground.
2.6.1 Pressure-Time-History
Analyzing pressure-time history of a particular blast event is important for predicting the
response of the structure. The typical pressure-time history is shown in Figure 2.5.
S.NO. Carrier Charge weight (kg)
1 Truck with trailer 10000
2 Truck 5000
3 Van 3000
4 Truck-pick up 1400
5 Car-large sized 300
6 Car-medium sized 200
7 Suit case 10

15
Figure 2.5: Pressure Time History [UFC3-340-02(2008)]
In the figure, pressure (P) is shown on Y-axis and time (t) on X-axis. The ambient pressure Po is
shown as reference or zero pressure for the positive and negative pressure values. After
explosion, the blast wave front reaches a target point in time tA and in no time reaches peak
incident pressure Pso which is the maximum positive pressure and then promptly decays. Positive
phase starts at the arrival of shock wave and terminates at the beginning of negative phase. For
simplicity; positive region is considered triangular. The peak over pressure is exponential
decayed and attenuates to ambient pressure Po in time tA+ to. Several researchers such as Brode
(1955), Henrych (1979), kinney and Grahm (1985), and Sadovskiy (2004) have computed
pressure profile of blast wave but time record of pressure in positive phase is well described by
Friedlander equation (equation 2.4).
𝑃(𝑡) = pso ∙ (1 −t
to) exp (−
bt
to) 2.4
Where psothe peak incident pressure and P (t) is is the pressure at a point in space when the
shock wave is not impeded. ‘to’ is the positive phase duration and ‘b’ is the waveform parameter
describing the decay rate pressure-time curve. The modified Friedlander equation (equation 2.5)
also incorporates the atmospheric pressure po, and is widely used for modeling of blast wave
because of accuracy and simplicity.

16
P (t) = po + pso ∙ (1 −t
to) exp (−
bt
to) 2.5
According Keys and Clubley (2016), if the positive phase duration is greater than100 millisecond
(ms), it is called long duration blast. The pressure wave imparts its velocity to the stationary air
in its path and rare air expands and rarefies. Pressure is reduced below ambient pressure and
negative phase is started. In general, positive phase magnitude and duration is larger and lesser
respectively as compared to negative phase. The trend continues in the negative direction and
reaches peak negative pressure pˉso. Negative pressure is also called under pressure and
negative phase is modeled for relatively thin flexible sections only. Negative phase causes
secondary damages due to pulling of artifacts towards the point of detonation.
Negative pressure is again reversed in the opposite direction and reaches to the ambient pressure
in time tA+to+t0 . The pressure also pulsates further but its maximum values are not significant.
Area under the curve in the positive phase gives positive specific impulse or simply positive
impulse ‘is’ is as follows.
is =∫ 𝑝(𝑡)𝑑𝑡𝑡𝐴+𝑡𝑜
𝑡𝑜 2.6
This equation is further simplified by considering the region of positive pressure profile as
triangle with height psoand base 𝑡𝐴 −𝑡𝑜.
is=1
2pso(𝑡𝐴 −𝑡𝑜) 2.7
2.6.2 Scaling Laws
The shock wave parameters on a target point of structure depend on the type and weight (W in
kg) of explosive material as well as stand-off distance (R in meters). The peak pressure
attenuates rapidly as the stand-off distance between the centre of explosion and target point is
increased. If the nature, shape and weight is maintained constant, the dependence of magnitude
of positive peak over pressures and positive phase duration on stand-off distance is shown in
Figure 2.6.

17
Figure 2.6: Variation of peak incident pressure with stand-off distance [Karlos and Solomos (2013)]
The figure indicates decreasing trend in peak positive pressure and dilation in the positive phase
duration with the increase of stand-off distance. The effect of stand-off distance and charge
weight are coupled by introduction of scaling laws. Hocpkinson-Cranzandsachs laws are the
most familiar scaling laws. According to Karlos and Solomos (2013), the governing idea behind
these scaling laws is “during the detonation of two charges of the same explosive that have
similar geometry but different weight and are situated at the same scaled distance from the target
surface, similar blast waves are produced at the point of interest as long as they are under the
same atmospheric conditions”. One dimensional scaled distance (Z in m/kg1/3) introduced by
Hocpkinson-Cranz law is as follows:
𝑍 =𝑅
√𝑊3 2.8
Where, R is the stand-off distance in “m” from source of detonation to the target point and W is
the weight of explosive in “kg”
2.6.3 Reflected and Dynamic Pressure
When blast wave impinges against an object coming across its path, the blast wave parameters
are changed appreciably. The changed pressure is called reflected pressure and its peak value is
higher than the incident pressure. Consequently, the pressure-time history is different from the
typical incident pressure-time history shown in Figure 2.5.

18
Amplification of the reflected pressure over incident pressure (side-on pressure) occurs due to
reflection from rigid surface. When the rigid plane is placed normal to the centre of explosion,
the reflected pressure ‘Pr‘ can be calculated by the following equation (Karlos and Solomos
2013).
𝑃𝑟 = 2𝑃𝑠𝑜(4𝑃𝑠𝑜+7𝑃0
𝑃𝑠𝑜+7𝑃0) 2.9
Where ′𝑃𝑠𝑜′ and ′𝑃𝑜′ represents incident and ambient pressures respectively. If we put ′𝑃𝑜′ as
zero in the above equation, it changes into following format.
𝑃𝑟 = 8𝑃𝑠𝑜 2.10
Hence reflected pressure at sea level is 8 times of the incident pressure.
The above equation is valid for normal reflections only. The reflected pressure is quite different
if there is an angle of incidence (α) between the direction of propagation of shock wave and
target surface. Figure 2.7 indicates the influence of incident overpressure 𝑃𝑠𝑜 on the reflected
pressure 𝑃𝑟 as a function of angle of incidence (α).
Figure 2.7: Influence of incidence angle on the reflected over pressure [UFC 3-340-02 (2008)]
The graph shows same values of incident and reflected pressure at 90 degree incident angle for
all the incident pressure values. Furthermore, for the larger incident pressure, the angle of

19
incidence may be neglected and the structure is designed for normal reflected pressure which is
on safe side for most of the cases. In particular, for angle of incidence almost lesser than 40
degree, the design based on normal reflected pressure is conservative. For angle of incidence
between 40 degrees and 55 degrees and peak incident pressure range 1.5-508 psi, the reflected
pressure calculated on normal reflected criteria gives lesser values than the actual pressure
(Karlos and Solomos,2013)
The pressure developed due to impinging on rigid surface of moving wind behind the front of
shock wave is called dynamic pressure q(t). Its maximum value is represented by ‘qo’ and is
always less than incident and reflected pressure for small and medium values of overpressure.
The dynamic pressure lasts for durations 2-3 seconds and much higher than the durations of
incident and reflected pressure as shown in Figure 2.8.
Figure 2.8: Comparison of reflected, incident and dynamic time-histories [Karlos and Solomos (2013)]
2.7 BLAST LOAD PREDICTION MODELS
Several researchers have developed models for peak positive incident pressure (Pso) along with
other parameters of shock wave for free air burst and surface burst scenarios. For surface burst,
the TNT equivalent weight shall be increased by 70-80% to account for earth surface reflection
and consequent reinforcement (Karlos et al. 2016). Surface reflection is mainly dependent on the

20
nature of base materials. Ullah et al. (2016) reported reflection factors for commonly used base
materials.
Free air burst models
Brode (1955):
𝑃𝑠𝑜 =6.7
𝑍3+ 1 (𝑏𝑎𝑟) (𝑃𝑠𝑜 > 10 𝑏𝑎𝑟) 2.11
𝑃𝑠𝑜 =0.975
𝑍+
1.455
𝑍2+
5.85
𝑍3− 0.019 (𝑏𝑎𝑟) (0.1 𝑏𝑎𝑟 < 𝑃𝑠𝑜 < 10 𝑏𝑎𝑟) 2.12
Henrych model (1979):
𝑃𝑝𝑜𝑠 =14.072
𝑍+
5.540
𝑍2 −0.357
𝑍3 +0.00625
𝑍4 𝑏𝑎𝑟 (0.05 < 𝑍 < 0.3)
2.13
𝑃𝑝𝑜𝑠 =6.194
𝑍−
0.326
𝑍2 +2.132
𝑍3 bar (0.3 ≤ Z ≤ 1) 2.14
𝑃𝑝𝑜𝑠 =0.662
𝑍+
4.05
𝑍2 +3.228
𝑍3 bar (1 ≤ Z ˂ 10) 2.15
Held Model (1983):
𝑃𝑝𝑜𝑠 = 2𝑊
23
𝑅2 (𝑀𝑃𝑎) 2.16
Kinny and Grahm Model (2013):
𝑃𝑝𝑜𝑠 = 𝑃𝑜
808⌈1+(𝑍
4.5)
2⌉
√⌈1+(𝑍
0.048)
2⌉𝑋√⌈1+(
𝑍
0.32)
2⌉𝑋√⌈1+(
𝑍
1.35)
2⌉
𝑏𝑎𝑟 2.17
Mills Model (1987):
𝑃𝑝𝑜𝑠 =1.772
𝑍3 −0.114
𝑍2 +0.108
𝑍 (MPa) 2.18
Sadovskiy Model (2004):
𝑃𝑝𝑜𝑠 = 0.085𝑊1/3
𝑅+ 0.3 ⌈
𝑊1/3
𝑅⌉
2
+ 0.8 ⌈𝑊
13
𝑅⌉
3
(𝑀𝑃𝑎) 2.19
Bajić Model (2007):
21
𝑝𝑜𝑠 = 0.102𝑊1/3
𝑅+ 0.436
𝑊1/3
𝑅2 + 1.4𝑊
𝑅3 (𝑀𝑃𝑎) 2.20
TM5-855-1 model (1965):
𝑷𝒑𝒐𝒔 =𝟒𝟏𝟐𝟎
𝒁𝟑 −𝟏𝟎𝟓
𝒁𝟐 +𝟑𝟗.𝟓
𝒁 for (2 <𝑃𝑠𝑜< 160) , (3 <𝑍< 20) 2.21
Surface burst models
Newmark and Hansen (1961):
𝑃𝑠𝑜 = 0.6784𝑊
𝑅3 + 0.294𝑊1/2
𝑅3/2 (MPa) 2.22
Swisdak (1994):
𝑃𝑝𝑜𝑠 = (exp ((𝐴 + 𝐵 × ln(𝑍) + 𝐶 × (ln(𝑍))2 + 𝐷 × (ln(𝑍))3 + 𝐸 × (ln(𝑍))4 + 𝐹 × (ln(𝑍))5 +
𝐺 × (ln(𝑍))6) × 10−3 (MPa) 2.23
Wu and Hao (2005):
𝑃𝑝𝑜𝑠 = 1.059 ⌈𝑅
𝑊1/3⌉−2.56
− 0.051 (𝑀𝑃𝑎)for ( 0.1 ≤𝑅
𝑊1/3 ≤ 1) 2.24
𝑃𝑝𝑜𝑠 = 1.008 ⌈𝑅
𝑊1/3⌉−2.01
(𝑀𝑃𝑎) for ( 1 <𝑅
𝑊1/3 ≤ 10) 2.25
Siddiqui and Ahmad (2007):
𝑃𝑝𝑜𝑠 = 1.017 ⌈𝑅
𝑊1/3⌉−1.91
(𝑀𝑃𝑎) for ( 1 ≤𝑅
𝑊13
≤ 12) 2.26
Ahmad et al (2013):
𝑃𝑝𝑜𝑠 = 2.46 ⌈𝑅
𝑊1/3⌉−2.67
(𝑀𝑃𝑎) 2.27
Iqbal and Ahmad (2011):
𝑃𝑝𝑜𝑠 = 1.026 ⌈𝑅
𝑊1/3⌉−1.96
(𝑀𝑃𝑎) for (1 ≤𝑅
𝑊1/3 ≤ 12) 2.28
Where ‘W’ is TNT equivalent weight, ‘R’ standoff distance and ‘Z’ the scaled distanced.

22
2.8 FACTORS AFFECTING BLAST WAVE PARAMETERS
The blast wave parameters (peak over pressure, positive phase duration etc) are also dependent
on charge shape and the built environment.
2.8.1 Effect of Charge Shapes
Peak overpressure and impulse profiles are required for design and strengthening of existing
buildings and design of new buildings against stipulated TNT weight of explosive material and
stand-off distance. Mass and nature (energy content) are usually the only parameters of explosive
material considered in blast loading. Most of the previous research models Brode (1955),
Newmark and Hansen (1961), Henrych (1979), Held (183), Kingery and Bulmash (1984), Mills
Model (1987), Sadovskiy Model (2004), Bajić Model (2007) and Kinny and Grahm Model
(2013) etc are devoted to either spherical or hemispherical charge shapes. Commonly used
design manuals of UFC 3-340-02 (2008) and ASCE (2011), consider charge shape as either
spherical (free air burst) or hemispherical (surface burst) only for calculating profiles of pressure
as function of scaled distance ‘Z’ and angle of incidence ‘θ’.
Explosives of cylindrical shape and other shapes are used for military and commercial purposes
as shown in Figure 2.9: Different shapes of explosives [UFC 3-340-02 (2008)]
Figure 2.9: Different shapes of explosives [UFC 3-340-02 (2008)]

23
B. Simoens, et al (2011), reported that TNT-equivalency of given explosive is dependent on
nature, effect, distance, shape and point of initiation shown by Equation 2.29
𝑇𝑁𝑇 equivalent = f1(nature) × f2(effect) × f3(distance) × f4(shape) ×
f5(location of initiation) 2.29
Most of ammunitions used for military purpose are cylindrical in shape and associated blast
parameters in near field have been found enhanced as compared to equal mass of spherical
charge (K. Clare and Nigel Davies 2011a and K. Clare and Nigel Davies 2011b). For measuring
blast effects, charge shape and point of detonation are equally important as the composition and
mass of charge. Pressure field close to charge experiences significant modifications due to the
change in shape of charge (Simoens.B and Lefebvre.M, 2015) as shown in Figure 2.10.
A B C
Figure 2.10: Pressure field near the charge (A) spherical, (B) Cylindrical with L/D=1.5 and (C) Cylindrical
with L/D=10 [Simoens.B and Lefebvre.M, (2015)].
Knock.C and Davies.N (2013) reported Wisotki and Syner (1965) development of shock waves
and bridge waves from cylindrical charge as shown in Figure 2.11 and maximum peak
overpressure was found when L/D ratio was 6/1. Authors also presented (F. Pechoux et al
(2011)), finding that peak overpressure from curved surface is decreased with decreasing length-
to-diameter ratio (L/D) of cylindrical charge.

24
Figure 2.11: Shock waves and bridge waves from cylindrical explosives [Knock and Davies (2013)]
Shape effect attenuates with increasing distance from the charge (W. Chengqing et al (2010)], K.
Clare and Nigel Davies (2011), K. Clare and Nigel Davies(2011), Hryciow et al, (2014), [B.
Simoens, et al (2011), Sherkar et al, (2015)). K. Clare and Nigel Davies (2013), presented Rice
and Ginell finding that transition of cylindrical to spherical regime takes place at a stand-off
distance of approximately half the cylindrical charge length. Hammond (1995), presented Rice
and Ginell relation for calculating equivalent spherical charge radius ‘ rsph’ from cylindrical
charge with length ‘Lcyl’ and radius ‘rcyl’ by comparing volume of cylinder with volume of
equivalent weight of sphere as in Equation 2.30.
𝑟𝑠𝑝ℎ=√3𝐿𝑐𝑦𝑙
4𝑟𝑐𝑦𝑙
3×𝑟𝑐𝑦𝑙 2.30
2.8.2 Effect of Adjacent Structures on Peak overpressure Parameters
Shock wave parameters are different in free-field than urban environment for the same TNT
equivalent charge weight and stand-off distance. Smith and Rose (2006) reported “ Regions of
high and low loading do not necessarily occur where they might intuitively be expected; ‘hot
spots’ occur where a building surface might be expected to be shielded and relatively low loads
are evident where a direct line from charge to ‘target’ might be expected to produce a higher
load”. The author reported, that Feng followed by Whalen were amongst the earliest
investigators who found enhanced blast wave parameters in simple straight and model city
streets configurations respectively.
Birnbaum, et al, (1996) used three dimensional Eulerian FCT techniques to study the channeling

25
effect on the blast wave parameters on the target office block near the ground, in the scenario of
partial confinement of blast wave in city street as shown in Figure 2.12.
Figure 2.12: Detail of Explosive placement, Street and Target Office Block [Badshah et al (2017)]
Blast wave parameters at the base of office block were found reinforced by the channeling effect
due to the presence of other buildings and comparison with free field scenario is shown in Figure
2.13. Channeling effect increased peak overpressure and maximum impulse by 153% and 340%
respectively when compared with free field results using analytical model.
Figure 2.13: Comparison of Free Air Field and Street Channeled Blast Pressure Time History [Badshah et al

26
(2017)].
Johansson et al. (2007) studied the effect of urban environment on the blast wave parameters.
Semi-empirical model AUTODYNTM based on computational fluid dynamics (CFD) was used
for numerical studies. For simulating the urban environment, experimental test was carried in
simple intersection comprising four concrete blocks with reduced scale of 1:5. Complex urban
scenario changed blast wave parameters as a result of diffractions and reflections at various
points in comparison to free field. Sixty five percent (65%) pressure-time histories of
experimental and AUTODYNTM results showed good match and reached Coh ≥ 0.5.
Furthermore, author has shown that superposition theorem with adjustment for diffraction of
pressure waves where needed can be used as raw technique for estimating pressure from incident
pressures and consequent load generated in complex environment. By using this technique
results obtained were deviating only 20% from the experimental data.
Reminnikov (2004), studied the increasing or decreasing effect on blast loads on building due to
the presence of adjacent structures. Air3D program was used for numerical simulation. Blast
event targeted medium sized shopping mall at the end of T-junction in a portion of straight city
street. City street was 100 meter long passing through buildings of different heights 10 m, 20 m
and 30 m to 40 m. The blast environment was generated by use of 1000 kg TNT equivalent
explosive placed on the ground surface in middle of the street. The stand-off distance for the
nearest building was 5 m. It was observed that peak overpressure as well as positive impulse
increased along the street due to multiple reflections from the adjacent structures when compared
with free field surface burst explosion scenario. It was shown that all buildings with scaled
height (h/w1/3 greater than 1.0 m/kg1/3 provided same level confinement to the peak pressure.
Similarly, all buildings with scaled height greater than 3.0 m/kg1/3 have equal effect on positive
impulse at ground level. Enhancement Design Factors (ratio of numerical and empirical values)
as a function of distance for pressures and impulses were derived along the street. The peak
reflected pressure on the target building at the T-junction was found 300% greater than
empirically (free field) measured pressure. Enhancement Factors for reflected pressure and
reflected impulse remained constant on the front wall of the target building along vertical line
but decreased near the top of the building due to diffraction of pressure waves over the roof.
Rose and Smith (2002) studied the effect on the profile of impulse from a blast event occurring

27
in city street bordered by representative height of buildings. Numerical study using three
dimensional Air3D program was compared to the results of reduced scale (1/40) experiments.
Peak positive and negative impulses on front of buildings near the ground level, were plotted
against the scaled distance along the street. It was observed that street width scaled distance
greater 4.8 m/kg1/3 do not affect the positive impulse on the near side. Similarly, buildings with
scaled height more than 3.2 m/kg1/3 do not increase positive impulse significantly. Negative
impulse is maximum, when scaled building height reaches 12.8 m/kg1/3. Negative phase impulse
is more than positive impulse pertaining to street centre line scaled distance of 2.0 m/kg1/3 for all
widths of streets and height of buildings.
Mays and Smith (1995) discussed the funneling effect of shock waves in urban environment.
Authors reported that hemispherical flow of blast wave is restrained in city streets due to the
reflection, refraction and diffraction from the adjacent structures. Consequently, pressure drop
with distance is slower which endanger relatively far off located buildings.
Effects of terrorist activities in urban centre are neither limited to target structure nor equivalent
to free field environment. The effects may be devastating for structure due to
channeling/funneling effect of the adjacent structures. Sophisticated numerical methods or
software based on Computational Fluid Dynamics (CFD) such as AUTODYN and Air3D may be
used for accurate analysis of the structure under blast loading in complex urban environment.
2.9 RESPONSE OF STRUCTURES AGAINST BLAST LOADING:
Response of structure is dependent on blast wave parameters, natural time period, geometry,
boundary conditions and material properties of target structure, which is discussed in succeeding
sections.
2.9.1 Effect of Stand-off Distance
Response of structure varies between local failure of structural elements and global failure of the
structure depending mainly on the stand of distance. TEK 14-2A Structural (2014), reported that
close-in and far-away blasts initiate local punching and flexure failure respectively. Localized
shear failure is initiated in structural element in the shape of punching, spalling producing low
and high velocity debris when centre of blast is in close proximity or contact (Ngo et al, 2007).

28
Shi et al, (2016) experimentally studied local damage and fragments characterization discharging
from unreinforced masonry wall subjected to near field blast scenario. Two (02) unreinforced
masonry walls fabricated in RC frames were subjected separately to blast loads of 1 kg and 6 kg
TNT equivalent weight at a constant stand-off distance of 0.4 m. For 1 kg TNT weight blasts, no
wall local damage was observed while, for 6 kg TNT weight blast scenario, hole was punched in
the masonry wall. Thus close range blast scenario, resulted in local damage in the shape of
punching or spalling instead of flexural or shear failure of wall. Furthermore, smaller fragments
scattered at larger distance and larger fragments fell in the nearby area.
Failure pattern changes into global domain as the distance between centre of explosion and
structure is increased. When structure is exposed to long duration out-of-plane loading, global
response in the shape of bending or shear failure is initiated (Ngo et al, 2007). Keys and Clubley
(2017), investigated masonry debris distribution and failure patterns of masonry when subjected
to blast pressure with more than 100 ms positive phase duration. Total ten (10) masonry walls of
different geometries were subjected to blast test events with 200 ms and 150 ms positive phase
durations corresponding to peak overpressures of 55 kpa and 110 kpa respectively. All ten (10)
samples exhibited structural failure and it was observed that failure pattern, debris distribution
and initial fragmentation were affected by geometry of walls, overpressure and impulse of blast
loads.
Blast close in contact with structure, impinges the structural element such as wall or column
before encompassing the whole structure. Local failure changes to global failure due to
progressive collapse for poorly designed structural systems.
2.9.2 Effect of Structural Element Geometries
Structural element length, height, and thickness affect response of the structure to a given blast
scenario. Increasing thickness of structural elements improves the performance if other
parameters are kept constant. Pandey and Bisht (2014) and Pereira et al. (2014) reported
enhanced dynamic performance with increasing thickness of brick masonry wall against blast
loading. Wei and Stewart (2010) using LS-DYNA, reported that increasing masonry wall
thickness decreases damage level. Increasing aspect ratio (height/thickness) of masonry wall
decreases its resistance against blast loading. Parisi et al (2016) reported 116% increase in

29
resistance against blast loading of tough stone masonry (TSM) when transverse aspect ratio was
decreased from 10 to 5.
2.9.3 Effect of Material Properties
Response of structure against blast loading varies among structures fabricated from different
materials. Wei and Stewart (2010) using LS-DYNA found that increase in strength of mortar and
masonry unit results in decrease of maximum deflection in masonry and rotation at support under
small blast loading. Pereira et al. (2014) studied behavior of 1.7m×3.5m masonry infill wall on
scaled model of 1:1.5, subjected to out-of-plane loading using newly developed technique of
confined underwater blast wave generators (WBWG) with experimental set up shown in Figure
2.14. Parametric study regarding the effect of geometrical and material properties of infill
masonry on its performance was carried out. Increasing compressive and tensile strengths of
infill masonry up to certain level decreased maximum deflection in the masonry in the region of
small scaled distances. Similarly, increasing Mode I-fracture energy resulted in decreased
maximum displacement of infill masonry in the region of small scaled distance. While,
increasing Young’s Modulus E, decreased maximum deflection at all scaled distances.
Figure 2.14 Detail of Experimental Set Up [Badshah et al (2017)]
Pandey and Bisht (2014) reported that increasing co-efficient of friction and richness of mortar
used in masonry resulted in decreasing max deflection at the centre as well as at masonry and

30
frame interface against blast loading. Parisi et al (2016) reported significant influence of material
strength on resistance of tough tile masonry (TSM) against impulsive and dynamic loading.
2.7.4 BOUNDARY CONDITIONS AND PRE-COMPRESSION RATIO
Boundary condition of structural or non-structural elements play important role in structural
response and damage level against blast loading. Wei and Stewart (2010) using LS-DYNA
studied response of masonry walls with different boundary conditions as shown in Figure 2.15.
Maximum deflection and damage level decreased with inducing increased number of fixed ended
conditions. All walls predicted to collapse under larger blast loads when scaled distance is less
than or equal 4.0 m/kg1/3. El-Domiaty et al (2002) reported that changing boundary conditions
changes response of brick masonry appreciably; however, modifying boundary conditions
especially in infill masonry has its limitations.
Figure 2.15 Detail of boundary conditions [El-Domiaty et al (2002)]
Hao and Wu (2006) and Wu and Hao (2007) found different scaled distances 4.50 m/kg1/3 and
4.22 m/kg1/3 respectively for the same damage level (non excessive damage) in infill masonry
with same material (masonry) model but with different material models of RC frames. Ahmad et
al. (2014) reported no damage at scaled distance of 2.28 m/kg1/3 of solid clay brick masonry

31
cantilever wall in experimental study but Wu and Hao (2007) found collapse of infilled CMU
masonry in RC frame at a higher scaled distance of 2.37 m/kg1/3 in numerical study.
Pre-compression in load bearing masonry significantly changes response against blast loading.
Parisi et al (2016) found an enhanced performance against blast loading of tough tile masonry
(TSM) with increasing pre-compression ratio.
2.10 MITIGATION
No single remedy exists against blast loading but combination of following active and passive
techniques shall be employed for effective mitigation.
Initial layer of mitigation against terrorist bombing is the efficient use of intelligence and
security agencies for intercepting the suicide bombers and other criminals laden with
explosive devices before reaching specified public or private commercial building.
It is followed by increasing the stand-off distance between point of explosion and
targeted buildings by providing physical barriers. Physical barriers in the shape of blast
walls attenuate blast wave parameters behind the wall.
Proper landscape, building orientation and architectural design with respect to specific
blast threat play important attenuating role.
Building re-detailing, capacity design, designed for continuity and use of ductile and
energy absorbing yet high strength materials in structure fabrication and proper
retrofitting techniques strengthen the structure when all other techniques fail against blast
loading.
Goel et al. (2012) reviewed mitigation strategies for mitigation of blast load against buildings.
Different blast mitigation strategies include increasing stand-off distance by construction of
barriers, redistribution of mass of structure, shaping building in such way to avoid square-edge;
rectangular long-edge sections in the path of direct shock waves, using light weight energy
absorbing materials (metal and polymeric foams) in fabrication of buildings and provision of
properly designed sacrificial blast walls. Design of blast wall shall result in non formation of
Mach stem behind it.

32
2.10.1 Blast Wall
It is a physical barrier used to protect vulnerable buildings and structures along with people
inside from the devastating effects of a nearby explosion. Smith (2010) defined blast wall as “a
physical barrier separating a valuable asset from explosive threat that produces a blast capable of
damaging asset; the wall mitigates the level of blast loading that impinges on the asset being
protected”.
Beyer (1986) visualized the path of the incident wave diffracting over the blast wall as shown in
Figure 2.16 and reported attenuated positive peak overpressure behind the wall.
Figure 2.16 Experimental arrangement and visualization pressure waves trajectories diffracting over the
blast wall [Badshah et al (2017)]
Chapman et al. (1995) incorporated geometrical parameters in finding protection factor as a
function of scaled distance in small scale experimental study. Efficiency of blast wall was found
dependent on its height, height of explosive above ground surface, height of target and horizontal
stand-off distances from blast wall to target structure and from blast wall to the charge.
Rose et al, (1997) developed design charts, incorporating effect of distance from the wall to the
target point behind the wall, distance of wall from the charge and height of blast wall. Author
reported that in case of rigid wall, the effect of canopy or shape of the canopy as compared to the
plan wall on the pressure behind the wall was found insignificant. It was also found that the wall
should be close to the point of blast for an early interaction and consequent more attenuation
effect.
Zhou and Hao, (2008) carried out numerical study using AUTODYN3D to estimate surface blast

33
loads on a structure behind the protective barrier or blast wall. The weight of equivalent TNT
“W”, height of building “HB”, distance between the charge and building “D”, the height of the
blast wall “H1”,the ratio of distance between the blast wall and explosion to that between the
building and the explosion “L1/D” and thickness of blast wall was varied between 10 kg to 10000
kg, 3m to 40 m, 5m to 50m, 1m to 4m, 0.2 to 0.8, and 150 mm to 300 mm respectively and
shown in Figure 2.17.
Figure 2.17 Detail of Explosive placement, Barrier wall and Target Building [Badshah et al (2017)]
Numerical study showed insignificant effects on the pressure parameters behind the protective
barrier with the changing of barrier thickness in the range from 150 mm to 300 mm. Therefore,
wall thickness was fixed at 250 mm in each case. Provision of barrier between building and point
of explosion decreased positive peak reflected pressure and impulse on the building and arrival
time of shock wave was increased. Effects on negative wave parameters were found
insignificant. The efficiency of protective wall was found dependent on barrier height, separation
of point of explosion and barrier, distance between the building and barrier structure and height
of the structure. Based on the numerical results, models were derived for estimating reflected
pressure-time history parameters behind the barrier structure.
Hajek et al, (2016) experimentally studied the effect of shape of surface and type of material on
performance of barrier wall using 40% scaled down ratio for the blast wall. Deformable material
performance was compared with Ultra High Performance Fiber-Reinforced Self Compacting
Concrete (UHPFRSCC). Small rough surface wall produced results comparable with the results

34
attainable by larger smooth surface walls, thereby inducing an added advantage to the former in
congested environment. Sheeting with an uneven surface can also be used in structural walls,
ceiling etc for reducing the reflected overpressure. The deformable wall showed an increased
mitigation in comparison to the rigid wall. UHPFRSCC wall performance was found excellent
and recommended its use for internal as well as external applications.
Philip, (1942) experimentally worked out reduction factors for pressure and impulse behind the
barrier wall. These factors were based on slant ranges from top of wall to the top of building and
from top of wall to the charge. Research in this field was accelerated in the back drop of terrorist
activities in 1970.
Jones et al, (1987) used 1/10th scaled model of blast wall and suitable scaled charge of vehicle
born improvised explosive device (VBIED), exploded at varying stand-off distances from
embassy building to evaluate its potential against blast loading . Models were developed for
overpressure and reflected overpressure impulse with and without perimeter wall (blast wall)
shown in equations 2.31-2.34.
Reflected overpressure (Pw) and Reflected overpressure Impulse (Iw) with perimeter wall (Blast
wall)
Pw = 287.0Z−1.57 2.31
Iw = 30.9Z−0.822W1
3 2.32
Reflected overpressure (Pwo) and Reflected overpressure Impulse (Iwo) without perimeter wall
(Blast wall)
Pwo = 1433.0Z−2.21 2.33
Iwo = 70.9Z−0.977W1
3 2.34
Where ‘Z’ is the scaled distance.
Comparison of both scenarios indicates the mitigation capacity of blast wall against blast
loading.
Rose et al, (1995) used 1/10th scaled model of 3 m plan tall wall fabricated from steel for
affecting the blast on selected points behind the wall. The results with and without barrier wall

35
shown in contour maps indicating reduction in zone of highest pressure as shown in Figure 2.18

36
(a) (b)
Figure 2.18 (a) Pressure contour map without wall (b) Pressure contour map with wall [Rose et al (1995)]
This study showed that rigid, plane and robust wall mitigated pressure and impulse significantly
up to six times of wall height behind the wall.
Rose et al, (1998), studied effect of mass and strength of blast wall on attenuating peak pressure
behind the wall. Thick sand wall showed better performance against rigid plan wall as well as
walls made of wood, polymer sheets, and ice, as shown in Figure 2.19.
Figure 2.19: Peak pressure attenuation with different blast wall [Badshah et al (2017)]
Bogosian and Piepenburg, (2002) reported that frangible walls fabricated from light weight
concrete masonry unit (CMU), water wall or thin pre-cast concrete panels reduce the blast effects
significantly as shown Figure 2.20.

37
Figure 2.20: Peak pressure and Impulse variation with blast wall fabricated from different materials
[Badshah et al (2017)]
Graph shows that less expensive frangible material walls exhibit mitigation effects are almost at
par with rigid wall.
Mayor and Flanders, (1990) developed computer software incorporating the models developed
by Rose et al, (1995) for assessing the effects of Vehicle Borne Improvised explosive Device
(VBIED) on the structure and personnel of US embassies.
Smith PD, (2010) presented research work dealing with blast wall performance in protection
against blast loading. Furthermore, different types of blast wall in use were presented.
Properly designed blast walls attenuate blast wave parameters significantly. Consequently,
damages to built environment and life are minimized. Choice of particular type of blast is
governed by ease of fabrication, transportation, space constraints, economy and vitality and
importance of property to be protected.
2.10.2 Architectural and Geometrical aspects of Buildings
Buildings shapes, space and orientation are usually decided based on environmental
consideration, aesthetics, functionality coupled with available land space and resources. This
general practice may not be in consonance with specific requirements of blast loading. Various
researchers investigated blast efficient architectural design of buildings. Koccaz et al (2008)
studied incorporation of blast resistant design aspects in both architectural and structural design
stages of buildings. Author has reported as much stand-off distance by erection of barriers

38
between external bomb and newly planned and existing buildings as possible and minimum
stand-off distance from building shall be 30 meter as shown in Figure 2.21.
.
Figure 2.21: Layout of building for Blast Protection [Badshah et al (2017)]
Arches and domes shapes attenuate the effect of blast pressure when compared with cubicle or
rectangular shapes. Similarly, complex shape geometry of building causing multiple reflections,
experiences much loads. Single storey building and partially or fully embedded building
response is well against blast loading. Sensitive or high value assets in building shall be
separated as far as possible from the highest possible threat. Entry points to building shall be
separated and strictly controlled. Underground car parking or passage poses risk unless properly
checked and controlled. Properly designed shelter areas shall be provided in case of any incident.
Building shall be designed to tolerate reversal of loads and avoid progressive collapse. Beam-
column joint shall be properly designed against blast induced forces. Barakat and Hetherington
(1970) found the effects on blast waves and fragments due to landscape. Authors mentioned that
ground profile techniques as shown in Figure 2.22, provide shielding effect to the building.
Figure 2.22: Landscape design for attenuating blast effect [Badshah et al (2017)]

39
Barakat and Hetherington (1999) introduced blast efficient architectural forms after evaluating
efficiency of various structural shapes subjected to car bomb threat scenario at 15 m stand-off
distance by using simulations in AUTODYN. Decrease in impulse with height was found more
when the corner or apex of the plan structure was positioned towards the explosion. In wing-
form-plan structure with obtuse angle between the two wings more decrease in impulse with
height was found. Significant decrease in impulse in hemispherical structure was observed.
Similarly, stepped form architecture and introvert design manifested relief in the impulse.
Gebbeken and Dӧge (2010) discussed different strategies for protecting buildings in urban
environment against blast loadings. Properly designed non-convex shape, planting hedges in
landscape, use of soft and energy absorbing material in facades, selecting circular sections for
structural elements, and increasing stand-off distance attenuate the blast wave parameters.
Gunaratan, (2008) narrated that truck loaded explosive caused enormous devastation in Mariot
Hotel Islamabad Pakistan despite greater stand-off distance of 40.23 m against standard practice
distance of 30.50 m between the gate and main building. Kulkarni and Sambireddy (2014)
reported that maximum storey drift in regular frame was found less than the irregular frame for
the same loading scenario. Infill frame performed well in storey drift against lateral blast loading.
Consequently, regular infill frame was found most efficient in blast loading.
2.10.3 Retrofitting Techniques
Building may be strengthened against blast loading by using different retrofitting techniques.
Knox et al, (2000) and El-Domiaty et al (2002) reported different techniques for enhancing
response of un-reinforced brick masonry against blast loading such as increasing wall thickness,
changing boundary conditions, replacement of weak elements and incorporating steel
reinforcement. All these techniques are expensive, impractical and time consuming in most of
the situations. Therefore, new techniques which are easier, light weight and less expensive such
as FRP (CFRP, GFRP, and AFRP), polyurea, polyurethane, aluminum foam, engineered
cementitious composites and ferrocement are used. These techniques are used for increasing
ductility as well as arresting dangerous high velocity debris discharging from the target structure
or building during blast loading.
FRP: Fiber reinforced polymers (FRP) are unidirectional fabric composites in matrix which are
attached to masonry surface by using proper resin or epoxy. FRP strengthened masonry has been

40
extensively investigated (Lantz et al, 2016).
Urgessa and Maji (2010) studied experimentally, the Dynamic Response of Masonry Walls
reinforced with carbon fibers using two different matrices against Blast loading. Eight masonry
walls 101.5 cm x 304.8 cm x 20.4 cm were fabricated in a circular arrangement inside reinforced
concrete containment structure. These walls were retrofitted with unidirectional two layered and
four layered FRP by using inorganic matrix geopolymer and organic matrix thixotropic epoxy
resin coupled with 2:1 hardener separately to four walls each. The FRPs were fastened to the
boundaries by use of suitable angle irons. The walls were subjected to blast wave parameters
generated from explosive of 0.64 kg TNT equivalent weight suspended from the roof of test
structure in the geometrical centre of experimental arrangement of walls. The displacement
response of two layered FRPs walls had little correlation with the type of matrix used. The
carbon fibers in four layered walls were able to contain the fragmentation. Retrofit Design
procedure was proposed for analysis and design of masonry walls strengthened with FRPs
against blast loading. Numerical algorithm of non linear SDOF was run for the masonry walls
with assumed number of retrofits of FRPs with known tensile strength, modulus of elasticity,
percent elongation. If the peak deflection value taken from displacement time history of the
numerical model exceeds the displacement limit, the no of layers of FRPs is reconsidered.
El-Domiaty et al (2002) carried out experimental and numerical studies for assessing the
feasibility of Fiber Reinforced Polymers (FRP) as reinforcing technique for unreinforced brick
masonry against blast loading. The damage levels in these were coupled with charge weight and
stand-off distance. Pressure transducers and accelerometers were installed on the test specimen
for recording pressure and acceleration time histories.
The response of different walls demonstrated enhanced capacity of FRP retrofitted walls against
more threat levels.FRP strengthened walls failed in safe manner avoiding dangerous scattering of
fragments while the unreinforced masonry wall failed in abrupt flexure mode splashing debris.
Single Degree of Freedom System Analysis was successfully used for predicting the response of
FRP reinforced masonry wall. Similarly, comparing the test results with TM 5-1300 Code etc
requirements, support rotations and ductility ratio, guidelines for retrofitting of masonry with
RFP were suggested.
Sielicki (2013) in PhD thesis, elaborated on the failure of masonry subjected to impulse loading.

41
The researcher obtained highest safety threshold by application of composite fabric
reinforcement to concrete masonry wall as shown in P-I curves in Figure 2.23.
Figure 2.23: Resistance of CMU for different system of reinforcement [Sielicki (2013)]
According to Buchan and Chen, (2007), extensive experimental and numerical studies have
shown benefits of FRP & Polymer retrofitting in increasing structural strength and ductility of
structure along with reducing the danger of shrapnel. Blast loading and response problems is
complex in nature, involving so many variables, lacking vital information regarding exact charge
weight and stand-off distances and designs guidelines for practical applications cannot be
established on the basis of experiments only. Consequently, studies conducted so far, are not
quantitative in nature and explicit guidelines for application of FRP to large structures are still
wanting.
Polyurea: It is cross-linked amorphous monomer or polyamine and prepolymer, essentially
containing at least 80% polyamine (Tekalur et al, 2008). It is water, chemical and abrasion

42
resistant elastomeric material used in retrofitting of masonry structures.
Knox et al, (2000) reported successful arresting of fragments when elastomeric polymer
(polyurea) coated concrete block walls was subjected to 0.55 MPa blast pressure. Wang et al,
(2016) experimentally studied failure mechanism, modes and peak pressure for damage of clay
brick masonry and aerated concrete block walls strengthened with polyurea with different
boundary conditions subjected to blast loading. The damage in clay brick masonry wall started at
the joints and extended from top to bottom at the centre of wall and deformation is less
pronounced. In aerated concrete block walls, greater cracks were found in mortar and
deformation observed were significant. Polyurea-sprayed walls exhibited enhanced performance
against blast loading and flexural strength was improved and mortar joint damages were
localized. The performance of clay brick masonry wall exceeded the aerated concrete block
masonry wall in both unreinforced and reinforced scenario. The structural collapse of walls was
avoided and fatal fragments were arrested. After application of polyurea, the ultimate blast
resistance of clay brick masonry and aerated concrete block masonry was increased by factor
4.5-11 and 15 respectively.
Aluminum foam: An early start of plastic deformation, high strength and corrosion resistance of
aluminum foam makes it suitable for retrofitting masonry structures (Lantz et al, 2016). Su et
al,(2008) and Aghdamy et al, (2013) investigated performance of aluminum foam by conducting
FEA-analysis using LS-DYNA and found its potentiality to be used as retrofitting material.
Engineered cementitious composites or bendable concrete: It is micromechanically designed
material, molded mortar-based composite reinforced with specially selected short random fibers,
usually polymer fibers and was invented in early 90s (Li, 2003). Maalej et al, (2010) reported
increased resistance of engineered cementitious composites and recommended its use for
increasing masonry wall resistance against blast loading.
Ferrocement: It has been widely used in masonry structures for mitigation against seismic
loading.
All the above techniques incorporate ductility and strength to the masonry walls. Furthermore,
high velocity debris ejected are confined and injuries are minimized

43
Chapter 3. EXPERIMENTAL PROGRAM: TEST SETUP AND
FABRICATION OF TEST SPECIMENS
This chapter presents experimental set up of the test specimen and fabrication of the model in the
field.
3.1 TEST SET-UP
The experimental program was carried out in a spacious and compacted level field, far-off the
built and populated area in Nowshera, Khyber Pakhtunkhwa, Pakistan. In the first phase test
specimens were fabricated and then tests were conducted after proper curing for 28 days.
3.1.1 Experimental Layout of Test Specimen
One full scale model room and three isolated walls symmetrically placed on the periphery of
3.66 m radius circle were fabricated in the field as illustrated in Figure 3.1. Full Scale
unreinforced masonry is placed in the north of centre of circle with the veranda middle column
exterior face touching the perimeter of the circle. Similarly, unreinforced masonry wall is
positioned in the west, ferrocement masonry wall in the south and confined masonry wall in the
west of the centre of the circle. The explosive charge was placed at the centre of circle in each
successive event. This set up ensures application of same shock wave parameters on all the four
models in a single event. Furthermore, the cost in procuring the explosive material has been
optimized. Detailed description of each test specimen and specification of explosive and vertical
position is presented in the subsequent sections.

44
Figure 3.1: Layout of test specimens
3.1.2 Selection of Test Specimen
A representative primary school single room along with veranda and three different systems of
masonry were selected. The wall thickness was kept as 225 mm in each of the four test models.
Cement sand mortar (1:6), typical burnt clay brick with nominal dimension 225 mm x 112 mm x
75 mm and English bond were used in fabrication of test specimen.
a. Full Scale Unreinforced Clay Brick Masonry

45
A primary school full scale unreinforced masonry room with internal dimensions of 4.8 m x 3.0
m provided with two windows (1.2 m × 1.8 m) at the back side and one window (1.2 m × 1.8 m)
and a door (1.2 m × 2.4 m) at the front side and 1.8 m wide veranda fabricated in the field as
shown in Figure 3.2. Room wall thickness was 22.5 cm and veranda columns dimensions were
33.8 cm × 22.5 cm. Standard dimension (4.8 m × 7.3 m) of typical primary school room along
with veranda 2.7m wide is used in Khyber Pakhtunkhwa Pakistan. It has been reduced to avoid
congestion and consequent complicated shock wave phenomenon during the blast. A continuous
lintel beam in the room and throughout the veranda columns was provided at a height of 2.4 m.
RC slab 10 cm thick with steel reinforcement according to ACI code at a height of 3.3 m was
provided in veranda as well as room portion. Typical door panel with one layer of glass panel 38
cm deep at the top and remaining solid panel made of chip board was provided. The door panel
was fixed with three hinges and nut-bolt arrangement in the door opening. Similarly, both
windows at the back side were partially glazed. The front side window was made of glass panels
completely and fixed in the chip-board frame.

46
Figure 3.2: Details of Full Scale Unreinforced Masonry Room

47
b. Different systems of masonry walls
Unreinforced masonry, ferrocement overlay masonry and confined masonry walls were used.
The test specimen consisted of U-shaped walls which ensures simulation to the field conditions
for typical load bearing wall including corners, as individual room or low rise building (Bui et al
2010). The in-situ conditions for walls were produced in field by hiring expert mason and
required labor. All the three walls consisted of main wall 1.8 m x 1.88 m x 0.225 m, subjected to
out-of-plane reflected blast load and two return/side walls on edges 1.2 m x 1.8 m x 0.225 m
subjected to incident/side-on pressure only. The foundation was 0.225 m deep and consisted of
masonry only in both unreinforced and ferrocement masonry walls. The walls were free standing
at the top in each case.
i. Unreinforced masonry wall: In unreinforced masonry foundation was 0.225 m deep and
consisted of masonry only as shown in Figure 3.3.
Figure 3.3: Details of Unreinforced Masonry Wall
ii. Ferrocement overlay brick masonry wall: An unreinforced U-shaped was constructed
using same dimensions as unreinforced masonry wall and shown in Figure 3.4. Steel wire
(guage 18) mesh of 19 mm square was fixed to the external surface of wall by 38 mm
Screw and Rawal Plug @ 225 mm c/c (staggered). Finally, cement sand mortar (1:4) was
plastered to the surface.

48
Figure 3.4: Details of Ferrocement wall
iii. Confined brick masonry wall: Confined masonry U-shaped wall with confining RC
beams and columns arrangement fabricated in the field as shown in Figure 3.5.

49
Figure 3.5:-Details of Confined Masonry Wall
Columns of 0.225 m × 0.225 m and 0.225 m × 0.15 m size were provided at each of the two
walls junctions and free end of walls respectively. Similarly, beams with size 225 mm × 150
mm, were provided at the top and base of the wall. Reinforcement in the confining element was
provided as per Eurocode EC-6 guidelines.
3.2 FABRICATION OF TEST MODEL
3.2.1 Site Selection
For safe testing of proposed models against live blast loads, different sites were visited
throughout Khyber Pakhtunkhwa. Finally, government owned test range located at distance of 8
km south-west of Nowshera City of District Nowshera, Khyber Pakhtunkhwa was selected. The
stated site was safe enough against the estimated pressure from 16.02 kg of Composition-B
explosive vis-à-vis local built environment and human life.
3.2.2 Phases of Fabrication of Models
Fabrication work of test specimens was started at the above sited location by hiring expert mason
and other required labor. Different phases of fabrication are shown in Figure 3.6. The test

50
specimens were properly cured for 28 days.
(a) (b)
(c) (d)
(e) (f)

51
(g) ( h)
(i ) (j)
(k) (l)
Figure 3.6: Different phases of fabrication of test specimen (a)Fabrication of room above ground
level(b)Fabrication of veranda lintel beam(c) Room before casting of RC slab(d) Form work before casting of
slab(e) Casting of slab (f) Completed room model (g) Fabrication of confined masonry wall (h) Ferrocement
overlay before application of plaster (i) Ferrocement overlay wall complete (j) Fabrication of unreinforced
masonry wall (k) Test specimen ready (l) Installation of windows and door

52
3.3 INSTRUMENTATION PLAN
High speed camera was used for capturing live videos of formation of cracks, the projectiles
ejected from the test specimen and formation of shock waves during the test.
For acquiring pressure data during each blast event, pressure transducers were installed on the
test specimens as shown in Figure 3.1.
3.3.1 High Speed Camera
High speed camera with frequency of 1000 Frames per Second (FPS) at a distance of 60m in the
North-East direction from the test specimen was installed to capture live fire ball formation
during the blast. High Speed Camera was used for observation up to the event No.5 (6.75 kg)
only. Beyond this test event, it was removed from the field to avoid any damage to the camera as
well as the technical personnel due to shock wave or high speed projectiles erupting from the test
specimen or the surrounding environment.
3.3.2 Pressure Transducers
Kistler series (211B1…..B5) pressure sensors were inserted into the hollow plug which was
fixed in elbow of 2.54 cm diameter galvanized steel pipe shown in Figure 3.7. The elbow was
used for maintaining required orientation of pressure sensor with respect to point of detonation.
Data acquisition cable passing through steel pipe was connected with pressure sensor. The steel
pipe carrying pressure transducer was fixed by steel hooks on the target structure at the required
height.

53
(a) (b )
Figure 3.7: (a) Kistler pressure transducer (b) pressure transducer mounted on structure
Pressure Transducers total six (06) in numbers as shown in Figure 3.1 were installed on the test
specimens for recording pressure profiles on various points during each event. All the pressure
transducers were connected via cables to data acquisition system stationed in a cylindrical
concrete bunker 1.22 m deep located at a distance of 57 m from the centre of explosion in the
North-West direction. All the cables were buried 5 cm deep in ground up to 12 m distance from
the centre of explosion to avoid blowing of and consequent damage due to greater amplitude of
shock waves in the vicinity.
a. Pressure transducers on full scale masonry room
Total four (04) number of pressure transducers were installed on the full scale masonry room
(Fig 3.1) described as follows:
Pressure Transducer PS4 with maximum capacity 3.45 MPa facing south was installed at
0.91m height above ground level at the centre of left column.
Pressure Transducer PS7 with maximum capacity 3.45 MPa facing south and centre of
explosion was installed at 0.91m height above ground level at the centre of middle
column for measuring peak pressure at each event. After event No five (05) it was
removed as it was vulnerable to damage due to the possible collapse of column in the
next event.
Pressure Transducer PS6 with maximum capacity 3.45 MPa facing south was installed at
54
0.8m height above sill level at the centre of pier (between front window and door). It was
removed after event no six due possible collapse of pier in event no seven (07).
Pressure Transducer PS1 with maximum capacity 1.38 MPa facing east was installed at
1.37m height above ground level on the mid horizontal point of eastern solid wall.
b. Pressure transducer on confined masonry wall
Pressure Transducer PS3 with maximum capacity 3.45 MPa facing west was installed at 1.12m
height above ground level on the mid horizontal point of confined masonry wall for measuring
the change in peak pressure due to variation in stand-off distance and orientation in vertical plane
of a point with respect to centre of explosion. Its location was moved up from 1.12m to 1.52m
after the first event to check the variation of peak overpressure with change in elevation of
pressure sensor.
c. Pressure transducer on ferrocement overlay masonry wall
Pressure Transducer PS2 with max capacity 3.45 MPa facing north and centre of explosion was
installed at 0.91m height above ground level on the mid horizontal point of ferrocement wall for
verifying the peak pressures measured with PS7.
Relative position of all the pressure sensors is summarized in the Table 3-1.
Table 3-1: Position of pressure sensors
S.NO Pressure
sensor/
range
(MPa)
Stand-off
distance
along
ground
surface
(m)
Stand-off
distance
from centre
of charge to
pressure
sensor (m)
Elevation of
sensor w.r.t
centre of charge
(above/below=+/
)
(m)
Incidence
angle in
vertical
plane
(degrees)
Incidence
angle in
horizontal
plane
(degrees)
1 PS1/1.38 7.744 7.758 +0.46 3.4 106.93
2 PS2/3.45 3.580 3.580 0 0 0
3 PS3/3.45 3.577 3.583 +0.203 3.25 0
4 PS4/3.45 4.367 4.367 0 0 55.14
6 PS6/3.45 5.412 5.479 0.114 -1.21 0
7 PS7/3.45 3.588 3.588 0 0 0
3.3.3 Type of Explosives Material and Location
Composition-B was used as explosive material. It is cast able material and mixture of RDX, TNT

55
and also called as 60/40 RDX/TNT with 1% (as stabilizing agent) wax added. Equivalent TNT
weight factor for pressure is 1.11 (for pressure range of 0.034-3.45 MPa) (ASCE-2011)
respectively. Explosive charges (cylindrical shapes) ranging from 0.5 kg to 16.02 kg were
exploded successively in eight events. Explosive charges along with length-to-diameter ratios
(L/D) are shown in Table 3.2.
Table 3.2: Weight of Composition-B with different L/D ratio
S.NO Length ‘L’
(cm)
Diameter ‘D’
(cm)
L/D Weight of
Composition-B ‘W’
(kg)
TNT equivalent
weight ‘WTNT’(kg)
1 12.26 05.60 2.19 0.50 0.56
2 09.30 11.10 0.84 1.50 1.66
3 13.00 11.10 1.17 2.00 2.22
4 16.00 13.60 1.18 3.91 4.34
5 19.70 16.30 1.21 6.75 7.49
6 25.90 16.30 1.59 9.00 9.99
7 34.40 16.30 2.11 13.00 14.43
8 45.60 16.30 2.80 16.02 17.78
Samples in each event were placed in the centre of 3.66 m radius circle and at height of 0.91 m
by use of wooden tripod as shown in Figure 3.8. Primary explosive PE3 was used as booster.
Safety fuse No 11 calibrated at site with burning velocity of 27±3 seconds/30.5 cm, was used for
safe evacuation of personnel and logistics before explosion during each event. Each charge was
detonated from the top.
(a) (b) (c)
Figure 3.8(a) Typical cylindrical shaped explosive with booster and safety fuse (b) preparation of sample
(c) Tripod for ensuring 0.91 m height above ground surface

56
3.3.4 Measurement of Scaled distances for different Events
In each event stand-off distances for all sensors remained constant as shown in Table 3-1and
TNT equivalent weight was varied as given in Table 3.2.Combining these two parameters, scaled
distances ‘Z’ for each event are calculated in Table 3.3.
Table 3.3: Scaled distance for different events
Event no Scaled distance ‘Z’ (m/kg1/3)
PS1 PS2 PS3 PS4 PS6 PS7
1 9.427 4.353 4.354 5.315 6.586 4.366
2 6.536 3.020 3.018 3.685 4.566 3.027
3 5.938 2.744 2.743 3.348 4.149 2.751
4 4.749 2.195 2.194 2.678 3.318 2.200
5 3.959 1.830 1.828 2.232 2.766 1.834
6 3.596 1.662 1.661 2.028 2.513 1.666
7 3.182 1.470 1.470 1.794 2.223 1.474
8 2.968 1.371 1.370 1.673 2.074 1.374

57
Chapter 4. EXPERIMENTAL PROGRAM: MATERIAL
PROPERTIES
Response of masonry system is dependent on the material properties of constituent materials.
The material properties were determined in the laboratories of Civil Engineering Department
University of Engineering & Technology (UET) Peshawar. Samples of constituent materials of
test specimen were collected from field during fabrication of models. All these samples were
tested in Material Testing Laboratory of Civil Engineering Department, UET Peshawar.
Different tests conducted are listed below.
1. Compressive strength of mortar
2. Compressive strength of concrete
3. Tests on brick unit
Compressive strength test
Initial rate of absorption(IRA) test
Water absorption test
4. Test of masonry assemblage
Masonry prism compressive strength
In-situ shear strength
Bond shear strength/Triplet test
5. Tensile strength of steel
Tensile strength of steel used in slab, lintel beam and confining element
Tensile strength of wire mesh used in ferrocement
4.1.1 Compressive Strength of Mortar
5.08 cm cubes were prepared from the cement sand mortar (1:6) used in fabrication of masonry
in the field. The mortar specimens were prepared and tested as per standard of ASTM C 109. 7
and 28 days compressive strength is given in Table 4.1.

58
Table 4.1: Compressive strength of mortar
S.NO 7 days strength
in MPa
Mean
(MPa)
COV% 28 days strength in MPa Mean
(MPa)
COV%
1 2.3
2.55 17
4.1
5.42 29
2 3.2 4.8
3 2.2 8.3
4 3.0 5.7
5 2.3 4.1
6 2.3 5.5
Thus mean 28 days strength of mortar used in the field is 5.42 MPa.
4.1.2 Compressive strength of Concrete
This test was carried out according to ASTM C 39. Concrete cylinders (15.24cm x 30.48cm)
were prepared from the concrete used in the fabrication of confined masonry wall, lintel beam
and RC slab in room. The results are shown in Table 4.2.
Table 4.2: Compressive strength of concrete
S.NO 7 days strength
in MPa
Mean
(MPa)
COV% 28 days strength in
MPa
Mean
(MPa)
COV%
1 6.7
8.3
18.2
9.4
10.3
7.6
2 9.7 10.9
3 8.5 10.5
Thus mean 28 days strength of concrete used in the field is 10.3 MPa
4.1.3 Tests of Brick Unit
Masonry units were randomly collected from the bulk of masonry units used for test specimen
fabrication in the field. Different types of tests were carried for finding the quality of bricks used
in construction of test specimen and given as follows:
4.1.3.1 Compressive Strength of brick unit
In conventional buildings bricks are usually subjected to compressive loads and as such
compressive load at failure of brick unit was determined. This test was performed in Universal

59
Testing Machine (UTM-200) according to ASTM C-67. Brick unit was placed on bed face in
compression machine and load was gradually applied until it crushed. Brick crushing strength
was obtained by dividing load at failure by the brick bed face area (length x width). The results
are given in Table 4-3follows.
Table 4-3: Compressive Strength of Brick unit (MPa)
S.N
O
Dimension
Lxw (cmxcm)
Area
(cm2)
Load
(tons)
Compressive strength
(MPa)
Mean
(MPa)
COV%
1 22.2x10.8 239.9 30.8 12.6
13.4
27.9
2 22.5x10.8 243.4 18.9 7.6
3 22.2 X10.8 239.9 35.9 14.7
4 21.9x10.5 229.5 33.5 14.3
5 21.6x12.1 260.5 47.3 17.8
The average strength obtained (13.4 MPa) was well above the Eurocode-8 (5.0 MPA) and
seismic Building Code of Pakistan (8.25 MPa) minimum requirements.
4.1.3.2 Initial rate of absorption test (IRA)
It represents the water absorbed by brick unit through its bed face in the limited time. Bricks with
higher IRA values absorb water from the mortar in the very beginning and leave it dry and hence
the result is poor bond. Therefore, using brick with higher IRA have considerable implications
on the physical and mechanical properties of masonry assemblage. This leads to reduced
masonry ability to resist water penetration and flexural bond strength. This problem is overcome
by wetting the bricks before use. Generally, the IRA value shall be less than 30 grams/minute/30
in2 (30 grams/minute/193.55 cm2). According to section 9 of ASTM C 67, IRA is the weight of
water in grams/minute absorbed by an oven dried brick of 193.55 cm2 face when placed up to a
depth of (1/20.3 cm) in water. For other brick sizes it must be corrected for 193.55 cm2 size. If
Ab (cm2) is the area of brick face immersed in water, Wd (grams) is dry weight of brick unit and
Ww (grams) is weight of brick unit after placing in water for one minute, then IRA is calculated
as.
IRA =193.55(Ww− Wd)
Ab (grams/minute)/193.55 𝑐𝑚2) 4.1
193.55/Ab is used as correction factor for brick unit with Ab not equal to 193.55 cm2. IRA was

60
determined in laboratory for the bricks used in the field as shown in Figure 4.1.
Figure 4.1: Determination of IRA
The results obtained by the above procedure are shown in Table 4.4.
Table 4.4: Initial rate of absorption by brick units
S.No Flat-wise face
Area Ab (cm2)
Dry Weight
Wd (grams)
Wet weight
Ww(grams)
Water absorbed
(grams)
IRA
(grams/minute/193.55cm2)
1 243.87 3034 3122 88 69.84
2 230.32 2708 2788 80 67.26
3 244.12 2718 2838 120 95.14
4 243.87 2710 2824 114 90.47
5 246.90 2584 2700 116 90.93
6 252.64 2798 2896 98 75.08
7 244.13 2728 2824 96 76.11
8 233.03 2742 2816 74 61.46
9 235.74 2674 2778 104 85.39
10 246.90 2940 3032 92 72.12
Mean (IRA) 78.38
COV% 14.5
Hence the mean value is 78.38. ASTM C216 recommends brick units with IRA greater than 30
(grams/minute/193.55cm2) be thoroughly wetted 3 to 24 hours before fabrication. Consequently,

61
the bricks were thoroughly socked for five hours before installation in the field.
4.1.3.3 Water Absorption Test
This test was carried according to section 7 of ASTM C 67.This test tells about the absorption of
moisture under extreme conditions and indicates the porosity of bricks. If Wd is the dry weight of
brick unit, Ws is the saturated weight of brick unit after fully immersing in cold water for 24
hours, then % water absorption is calculated as follows:
𝑊𝑎𝑡𝑒𝑟𝐴𝑏𝑠𝑜𝑟𝑏𝑡𝑖𝑜𝑛(%) =100(𝑊𝑠−𝑊𝑑)
𝑊𝑑 4.2
Water absorption for first class bricks is almost 20%.The results based on the above stated
procedure are given in Table 4.5.
Table 4.5: Water absorption of brick units
S.No Dry Weight Wd
(grams)
Wet weight
Ws(grams)
% Water
absorption
Mean COV%
1 3034 3490 15.03
18.68 13.60
2 2718 3292 21.11
3 2708 3108 14.77
4 2718 3246 19.43
5 2642 3222 21.95
6 2710 3204 18.23
7 2584 3146 21.75
8 2742 3218 17.34
9 2674 3188 19.22
10 2940 3468 17.96
Hence the mean of % Water absorption was found as 18.68%.
4.1.4 Tests of Masonry Assemblage
These tests are carried out for finding the characteristics of in-situ masonry and verify that
materials used in masonry meet the requisite strength.
4.1.4.1 Masonry Prism Compressive Strength
Masonry prisms are made to validate the design compressive strength of masonry in-place as

62
required under ACI-530. Prisms of 400 mm x 229 mm x 480 mm sizes were fabricated in the
field from the mortar and masonry units used in the construction of test specimens. After proper
curing, these were tested in Material Testing Laboratory UET Peshawar as shown in Figure 4.2.
Figure 4.2: Compression test of masonry prism in Universal Testing Machine
The compression strength was calculated by dividing maximum axial load over the plane area of
the prism. Table 4.6 gives compressive strength of prism.
Table 4.6: Compressive strength of masonry prism
S.NO Prism loaded
area (cm2)
Failure load
(tons)
Compressive strength
(MPa)
Mean COV%
1 929 29.10 3.1
3.1 8.6
2 929 33.60 3.5
3 929 29.70 3.8
4 929 26.20 2.8
4.1.4.2 Brick triplet test
This test evaluates bond shear strength of the prototype masonry and was carried out in Material
Testing Laboratory UET Peshawar as shown in Figure 4.3.

63
Figure 4.3: Experimental arrangements for of brick triplet test
The results for brick bed face area 0.0251 m2 are given in Table 4.7.
Table 4.7: Combination of shear and normal loads in brick triplet tests
No. Area
mm2 Normal Load
kN Shear Load
kN Normal Stress
kPa Shear Stress
kPa
1 23992 0 2.26 0.0 47.0
2 24335 0 4.02 0.0 82.6
3 22964 0 5.30 0.0 115.3
4 23821 3.00 5.10 126.1 107.1
5 24171 3.42 8.93 141.6 184.7
6 24163 3.00 8.93 124.3 184.7
7 23478 5.56 11.97 236.9 254.9
8 23992 5.83 13.34 243.0 278.0
9 22964 4.94 8.24 214.9 179.4
The data of the table is plotted in the Figure 4.4.

64
Figure 4.4: Brick triplet test
From the figure cohesion and coefficient of friction are evaluated as 76.39 KPa and 0.69
respectively.
4.1.4.3 In-situ Shear Strength
Hydraulic jack with modification (indigenously developed in UET Peshawar) was used for
finding in-situ shear strength of masonry in the actual test specimen of room in the field as
shown in Figure 4.5.
Figure 4.5: Field investigation of in-situ shear strength of masonry
The machine was calibrated as 44.8 N/dial reading before its use in the field. The total dial
y = 0.6866x + 76.398R² = 0.7995
0.0
50.0
100.0
150.0
200.0
250.0
300.0
0.0 50.0 100.0 150.0 200.0 250.0 300.0
She
ar S
tre
ss, k
Pa
Normal Stress, kPa

65
readings before shear failure were found as 400. The shear strength of brick masonry in MPa was
evaluated as follows:
Brick unit bed face area=Ab=Length x Width=22.352 cmx11.176 cm=250 cm2=0.025 m2
Load (Newton) at shear failure=400 x 44.8=17942
Shear strength (Pascal) =Load/Shear area= P/2Ab=17942/(2 x 0.025)=358848 N/m2
Shear strength =0.36 MPa
4.1.5 Tensile Strength of Steel and Mesh
Grade 40 steel was used in RC slab, confining element and lintel beam in the test specimens.
Similarly, steel mesh with 248 MPa yield strength was used in ferrocement overlay masonry
wall.

66
Chapter 5. RESULTS AND DISCUSSION
In this chapter, the pressure data acquired from each sensor installed on the test specimen, snap
shots of fire ball acquired from video recordings of high speed camera during the test are
presented. Furthermore, visual observations and snap shots indicating damages pattern,
classification and intensities in the test specimen after each blast event are presented.
As a part of this study, an empirical model developed for peak overpressure has been compared
with the models of previous researchers and the mismatch is discussed. The data acquired from
different locations of test specimens are also compared with one another. The response against
the peak overpressure/scaled distance of each test specimen is determined. Finally scaled
distance for different damage levels in the test specimens are evaluated experimentally.
5.1 HIGH SPEED CAMERA
High speed camera recorded videos of the blast events. The snap shot taken from video
recordings during blast event shows the fire ball and shock wave formation as shown in Figure
5.1.
Figure 5.1: Formation of shock wave during the blast
Cylindrical shaped charges were used in each event. The shock wave formed is diamond shaped
and indicates lesser amount of energy directed towards the ground surface as compared to
spherical shaped charges. Consequently, the shock wave magnification due to reflection from the

67
ground surface was attenuated.
5.2 PRESSURE DATA
During each test, the recorded peak pressure as well pressure-time curve from all sensors was
acquired through data acquisition system. The peak overpressure for each sensor in the
successive blast events is shown in Table 5.1.
Table 5.1: Measured peak overpressure for different events
Event no Measured reflected peak overpressure ‘Pr’ (MPa)
*PS1 PS2 PS3 PS4 PS6 PS7
1 0.010 0.077 0.038 0.059 0.001 0.079
2 0.017 0.205 0.080 0.101 0.103 0.179
3 0.022 0.221 0.106 0.126 0.117 0.214
4 0.027 0.381 0.171 0.144 0.156 0.262
5 0.034 1.014 0.384 0.275 0.271 0.793
6 0.059 ____ 0.446 0.537 0.330 ____
7** ____ ____ 1.034 ____ ____ ____
8** ____ ____ ____ ____ ____ ____ *Pressure sensor PS1 measured incident/side on peak overpressure only. **Pressure sensors were removed from the test specimen to avoid possible damages to the sensors
Results of events No 7 & No 8 are not used in pressure data analysis as pressure sensors were
either removed or produced weak results
Plotting pressure vs time, pressure-time history was obtained. Pressure profiles during event
No.1 and event No.4 of pressure sensor No.2 are shown in Figure 5.2.
(a) (b)
Figure 5.2: (a) Pressure profile for 0.5 kg (b) Pressure profile for 3.91 kg
Pressure model (on the basis of data of sensors PS2) for Peak positive reflected overpressure ‘Pr’

68
in MPa for scaled distance ‘Z’ in m/kg1/3 was developed as shown in equation No 5.1. The data
of PS2 was used for the development of pressure model because of zero incident angle.
𝑃𝑟 = 4.34 ∗ 𝑍−2.80 (With R2=0.96) for 1.828≤Z≤ 4.353 5.1
5.3 PRESSURE MODELS
The experimental model developed from the peak pressure data acquired from PS2 (minimum
stand-off distance and zero angle of incidence) is compared with the models of other researchers
as well as data of sensors installed at other locations on the test specimen.
5.3.1 Comparison of Pressure Model with Models of Other Researchers
The pressure model developed from experimental data was compared with the empirical models
of other researchers as shown in Figure 5.3. The trend of experimental model is identical to
spherical and hemispherical models. For smaller scaled distance the trend becomes steeper. It
gives lower values than all the spherical and hemispherical models except the Brode (1955)
model based on point source (spherical model). The lower values are due to lesser reflection
from the ground surface as most of the blast waves generated due to cylindrical shapes (axis
perpendicular to ground surface) are parallel to ground surface as shown in Figure 5.1.
Furthermore, in cylindrical shaped charges the explosive mass is distributed at larger distance
along the vertical axis of cylinder as compared to the equivalent spherical charges.
Consequently, lesser peak pressure was observed at the points where maximum pressure was
expected. The pressure model developed almost gives values equivalent to Newmark and Hansen
(1961). For larger scaled distance, experimental model gives values almost equivalent to Kinney
and Grahm model (1985).
69
Figure 5.3: Comparison of pressure models [Badshah et al (2017)]
5.3.2 Comparison of Pressures for Sensors Installed on Different Locations of Test
Specimen
Experimental data from various pressure sensors is plotted in Figure 5.4. Pressure sensors PS2
and PS7 were similarly placed and recorded the maximum reflected pressure in each event.
Therefore, these should give identical pressure values with the same scaled distances. The
pressure PS2 registered higher pressure values as compared to PS7 due to the smaller scaled
distances for the former. The variation in scaled distances (during each event) amongst the two
sensors was due to different projection distance of sensors diaphragm from the test specimens.
Furthermore, the variation between the two may be due to different stiffness values of supporting
members (brick masonry column and ferrocement wall). Plot of pressure values recorded by PS2
is used for comparison with the remaining sensor results. Pressure sensor PS1 measures side on

70
peak overpressure. Pressure values recorded are less than PS2 and least amongst all pressure
sensors due to largest scaled distance, urban environment (column of verandah and portion of
room pier lie in the path of shock waves and consequent interference, reflection and refraction),
elevation of 0.457 m from charge centre and larger incidence angle (106.93 degrees) in
horizontal plane. Pressure values measured by sensor PS3 and PS4 are lower than PS2 due to
angle of incidence for the former. Furthermore, pressure values measured by sensor PS3 (with
incident angle of 3.25 degrees in vertical plane, Table 3-1) are lower than the pressure values of
sensor PS4 (with angle of incidence as 55.14 degrees in horizontal plane, Table 3-1) despite the
fact that scaled distances for PS3 are smaller than PS4. It indicates larger variation in peak
overpressure with orientation of measuring points in vertical plane than in horizontal plane for
the cylindrical shaped charges detonated at the top. Sensor PS6 gives higher pressure values than
all the sensors in the region of scaled distance (Z) from 3-2.5 m/kg1/3 due to urban environment
inside the veranda portion of room.
Figure 5.4: Comparison of peak overpressure at different locations
5.4 EVENTS VS DAMAGES IN WALLS
Visual observations and pictures of damage patterns were made after each event in the three wall
models.

71
5.4.1 Damages in Walls
The damage pattern, types and intensity were recorded by high resolution camera in each of the
three wall models, after the successive events.
Event No 1: After event No.1, with scaled distance of 4.353 (m/kg1/3), confined and
ferrocemented overlay masonry walls showed no cracks anywhere as shown in Figure 5.5(a,b).
Unreinforced masonry wall, suffered minor vertical cracks appearing at the centre and at the
joints of in-plane and out-of-plane walls and extended downward following mortar joints as
shown in Figure 5.5(c). The confining element in confined masonry and ferrocemented overlay
restrained the masonry against damages. In unreinforced masonry, wall joints and middle-width
are vulnerable to damages against blast loads. The centre line receives max deflection.
Furthermore, the scaled distance is minimum for the geometrical centre of each out-of-plane wall
during the blast; it receives more pressure as compared to other parts of wall. Consequently,
damages are concentrated along the geometrical vertical centre-line of wall. Similarly, the joint
crack was developed due to rotation of the out-of-plane wall.
Figure 5.5: Masonry response after No.1 (a) Confined masonry [Badshah et al 92017)]
(b) Ferrocemented overlay masonry (c) Unreinforced masonry
Event No 2: After event No.2 with scaled distance of 3.020m/kg1/3, confined masonry showed
vertical hairline cracks following mortar joints at the centre as shown in Figure 5.6(a).
Ferrocemented overlay masonry listed no damages again as shown Figure 5.6(b). The cracks in
unreinforced masonry appearing in the preceding event were found widened and extended due to

72
absence of any confining mechanism. Horizontal minor cracks appeared at the bottom of 16th
layer and extended throughout the width. Shear cracks developed in the right corner of out-of-
plane wall starting from top layer extending to 5th layer in downward direction shown in Figure
5.6(c).
Figure 5.6: Masonry response after event No.2 (a) Confined masonry (b) Ferrocemented overlay masonry
(c) Unreinforced masonry
Event No 3: In confined masonry, after blast event No.3 with scaled distance of 2.744 (m/kg1/3),
vertical crack at the centre appearing in event No.2, widened and further propagated. Horizontal
hairline cracks appeared in the top layer. Cracks in vertical direction, following mortar joints
appeared near the two columns. Separation of column and out-of-plane wall was initiated at mid-
height as shown in Figure 5.7(a). High velocity flying debris ejecting from ground surface during
explosion had impacted the ferrocemented layer and damaged it in small patches at several
locations throughout the surface of out-of-plane masonry wall as shown in Figure 5.7(b). In
unreinforced masonry, the three vertical cracks in the out-of-plane wall in the preceding event
widened and extended throughout the depth of the wall. Horizontal crack in the previous event
appeared near ground surface in the out-of-plane wall, widened. Additional horizontal and
diagonal cracks produced. Bricks in the top layer loosened and displaced out-of-plane as shown
in Figure 5.7(c). Cracks in the preceding event were widened and propagated and additional
cracks were observed in the in-plane portion of unreinforced masonry as shown in Figure 5.7(d).

73
Figure 5.7: Masonry response after event No. 3 (a) Confined masonry (b) Ferrocemented overlay masonry (c)
Unreinforced masonry out-of-plane wall (d) Unreinforced masonry in-plane wall
Event No 4: Similarly, after blast event No.4 with scaled distance of 2.195 (m/kg1/3), minor
diagonal cracks appeared in the in-plane wall of confined masonry. Vertical central crack
appeared in event No.3, widened and diagonal crack appeared in the upper region of out-of-plane
wall. Separation between column and out-of-plane wall widened and propagated as shown in
Figure 5.8 (a). In ferrocement overlay wall, wire mesh was exposed and de-bonded in patches
just above ground level as shown in Figure 5.8 (b). Unreinforced masonry out-of-plane wall

74
damaged so much so that it concaved in outside direction and walls separation increased as
shown in Figure 5.8(c) and Figure 5.8 (d). Diagonal crack produced in the in-plane wall in the
previous event widened and extended to the ground at the middle width.
Figure 5.8: Response of masonry after event No. 4 (a) Appearance of diagonal crack and widening of beam
column joint in confined masonry (b) Debonding of wire mesh in ferrocement overlay masonry wall (c) Out-
of-plane wall of unreinforced masonry wall (d) In-plane wall of unreinforced masonry wall

75
Event No 5: In confined masonry, after event No. 5 with scaled distance of 1.830 (m/kg1/3),
separation between column and out-of-plane wall was further increased. Out-of-plane wall
concaved outside near the ground level shown in Figure 5.9 (a). In ferrocement overlay masonry,
steel mesh was exposed and debonded in larger areas near the ground and in small patches near
the top. The two walls separated but remained intact due to steel mesh as shown in Figure 5.9
(b). Bricks in alternate layers near the ground were loosened and fell down as shown in Figure
5.9 (c). Unreinforced masonry out-of-plane wall and in-plane walls collapsed completely as
shown in Figure 5.9 (d). The in-plane walls collapsed outside due to peak negative (suction)
pressure following positive pressure and pushing of falling of out-of-plane wall.
Figure 5.9: Masonry response after event No.5 (a) Confined masonry wall (b) Debonding of ferrocement
overlay from masonry wall (c) Loosening and falling of bricks from ferrocement overlay masonry wall (d)
Collapse of unreinforced masonry wall [Badshah et al (2017)]
Event No 6: After event No. 6 with scaled distance of 1.662 (m/kg1/3), confined masonry

76
remained intact. Out-of-plane wall concaved outside further near ground surface and separation
b/w columns and walls increased. Number of cracks increased in the in-plane walls. Cracks in
the beam column joints appeared as shown in Figure 5.10 (a) - (b). The out-of-plane wall of
ferrocement overlay masonry was fully damaged and one in-plane wall completely separated and
inclined in outward direction as shown in Figure 5.10 (c).
(a) (b)
(c)
Figure 5.10: Response of confined masonry after event No.6 (a) Separation of walls and column and (b)
Failure of beam-column joint (c) Ferrocement overlay masonry wall
Event No 7: After event No. 7 with scaled distance of 1.470 (m/kg1/3), confined masonry out-of-
plane wall was partially collapsed. Cracks in wall-column joints widened. Diagonal cracks in the
in-plane walls extended shown in Figure 5.11 (a) - (b). Ferrocemented overlay masonry out-of-
plane wall collapsed and since the bricks were already loosened in the previous events, therefore,
these were scattered up to a distance of 6.1 m in the direction of shock waves. One of the in-
plane walls fell down outside in integral form and other remained inclined in outside direction as
shown in Figure 5.11 (c).
Separation of column-wall
Beam-column
joint failure
Disp
lacemen
t of w
all

77
(a) (b) (c) Figure 5.11: Response of confined masonry after event No.7 (a) Partial collapse of out-plane-wall (b)
Widening of wall-column joint and (c) Collapse of ferrocement overlay masonry
Event No 8: Similarly, after event No. 8 with scaled distance of 1.371 (m/kg1/3), remaining
portion of out-of-plane wall of confined masonry collapsed leaving the confining frame intact.
Masonry scattered at a distance of 3.66 m outside from the out-of-plane wall. The in-plane walls
remained intact but with more open cracks as shown in Figure 5.12.
(a) (b)
(a) (b)
Figure 5.12: Response of confined masonry after event No.8 (a) Complete collapse of out-plan-wall (b)
Widening of wall-column joint
5.4.2 Response of Walls
The response of three (03) different masonry systems was evaluated experimentally against same
blast scenario successively in eight events. The damage level in each preceding blast event was
correlated to scaled distance ‘Z’ (m/kg1/3). Consequently, risk assessment and acceptable
protection levels for masonry under blast loading was determined. In experimental program, four
damage levels were selected as hazards levels, and four design parameters at different threat
Wid
enin
g o
f wall-co
lum
n jo
int
78
levels were used as recommended by Interim Department of Defense (DoD) Anti-
terrorism/Force Protection Construction Standards used by El-Domiaty et al (2002) and with
little modifications, are shown in Table 5.2 and Table 5.3 respectively.
Table 5.2 Levels of Damage to Tested Walls
Level Damage
Level
Damage Description Performance Description
I Failure Walls fall out of test frame Wall crumbles and scattered debris.
II Heavy
Damage
Damage that definitely affects load
capacity of wall. Wall will not survive
same blast load.
Visible wide-open cracks or significant
shear cracks, and damage to FRP retrofit.
Small debris close to wall
III Light
Damage
Damage that does not affect load
capacity but additional damage will
be observed under same blast load.
Hairline to wider cracks at mortar joints or
hairline shear cracks.
IV No
Damage
No damage affecting load capacity of
wall.
Hairline cracks in mortar joints.
Table 5.3 Antiterrorism/Force Design Parameters along with scaled distance
Threat
Level
Weapon (TNT)
(kg)
Stand-off
Distance
(m)
Scaled Distance
(m/kg1/3)
Tool Blast
Pressure
(kPa)
High 453.592 24.384 3.174 2267.96 kg truck 379.212
Medium 226.796 24.384 3.998 1814.37 kg truck 213.737
Low 99.790 24.384 5.257 1814.37 kg truck 124.106
Minimum 22.680 24.384 8.614 1814.37 kg truck 55.158
5.4.2.1 Unreinforced Masonry Wall
The unreinforced wall could sustain the first four events (scaled distance 4.353-2.195 m/kg1/3)
and collapsed completely after event No.5 (scaled distance 1.830 m/kg1/3). The scaled distance,
damage levels and threat levels for unreinforced masonry wall are correlated with little
modifications in DoD Anti-terrorism/Force Protection Construction Standards (El-Domiaty et al
2002) as shown in Table 5.4.

79
Table 5.4 Blast Events and scaled distances versus damage and threat level for unreinforced masonry wall
Event
No
Charge weight
(TNT)
(kg)
Stand-off
distance
(m)
Scaled
Distance
(m/kg1/3)
Peak Pressure
(MPa)
Damage Level Threat
Level
1 0.56 3.58 4.353 0.077 No damage Minimum
2 1.66 3.58 3.020 0.205 Light damage Low
3 2.22 3.58 2.744 0.221 Light damage Medium
4 4.34 3.58 2.195 0.381 Heavy damage High
5 7.49 3.58 1.830 1.014 Failure High
5.4.2.2 Ferrocemented Overlay Masonry Wall
The ferrocemented overlay masonry wall could sustain the first six events (scaled distance 4.353-
1.662 m/kg1/3) and collapsed completely after event No.7 (scaled distance 1.470 m/kg1/3).
Ferrocemented overlay masonry falls in bulk and the danger of flying debris is minimized. The
scaled distance, damage level and threat levels for ferrocemented overlay masonry wall are
correlated as shown in Table 5.5.
Table 5.5 Blast Events and scaled distances versus damage and threat level for ferrocemented overlay
unreinforced masonry wall
Event
No
Charge weight
(TNT)
(kg)
Stand-off
distance
(m)
Scaled
Distance
(m/kg1/3)
Peak Pressure
(MPa)
Damage Level Threat
Level
1 0.56 3.58 4.353 0.077 No damage Minimum
2 1.66 3.58 3.020 0.205 No damage Low
3 2.22 3.58 2.744 0.221 Light damage Medium
4 4.34 3.58 2.195 0.381 Light damage High
5 7.49 3.58 1.830 1.014 Light damage High
6 9.99 3.58 1.662 ---- Heavy damage High
7 14.43 3.58 1.470 ---- Failure High
5.4.2.3 Confined Masonry Wall
The confined masonry wall could also sustain the first six events (scaled distance 4.353-1.662
m/kg1/3) and out-of-plane wall collapsed partially and in-plane walls remained in light damage
mode even after event No7 (scaled distance 1.470 m/kg1/3). Furthermore, damages in confined
masonry were found not only small in magnitude but also limited to lesser area. The scaled

80
distance, damage level and threat levels for confined masonry wall are correlated as shown in
Table 5.6.
Table 5.6 Blast Events and scaled distances versus damage and threat level for confined masonry wall
Event
No
Charge weight
(TNT)
(kg)
Stand-off
distance
(m)
Scaled
Distance
(m/kg1/3)
Peak
Pressure
(MPa)
Damage Level Threat
Level
1 0.56 3.58 4.353 0.077 No damage Minimum
2 1.66 3.58 3.020 0.205 No damage Low
3 2.22 3.58 2.744 0.221 No damage Medium
4 4.34 3.58 2.195 0.381 Light damage High
5 7.49 3.58 1.830 1.014 Light damage High
6 9.99 3.58 1.662 ---- Light damage High
7 14.43 3.58 1.470 ---- Heavy damage High
8 17.78 3.58 1.371 ---- Failure High
All the above indicate increasing response order against blast loading as unreinforced masonry,
ferrocemented overlay masonry and confined masonry. No damage response was showed by all
the three test models against minimum threat level (Z= 4.353 m/kg1/3). For low threat level
(Z=3.020 m/kg1/3), unreinforced suffered light damage while ferrocemented overlay masonry and
confined masonry revealed no damage again. For medium threat level (Z=2.744 m/kg1/3),
unreinforced masonry and ferrocemented overlay cement showed light damage but confined
masonry showed no damage again. For high threat level, (Z=2.195 m/kg1/3), unreinforced
masonry showed heavy damage, while, ferrocemented overlay masonry and confined masonry
displayed light damages. For second high threat level, (Z=1.830 m/kg1/3) with scaled distance
smaller than the previous event, unreinforced masonry collapsed completely, while
ferrocemented overlay masonry and confined masonry exhibited light damages again. For third
high threat level, (Z= 1.662 m/kg1/3), ferrocement overlay masonry showed heavy damages but
damages in confined masonry were again contained in the light damage mode. For forth high
threat level (Z= 1.470 m/kg1/3), ferrocement overlay masonry failed completely but confined
masonry suffered heavy damages and remained in standing position. The out-of-plane wall of
confined masonry was fallen out of the confining element and in-plane walls remained intact
even after the fifth and last high threat level (Z= 1.371 m/kg1/3).
5.5 EVENTS VS DAMAGES IN FULL SCALE ROOM
Visual observations and pictures of damages pattern were taken after each event in the full scale

81
room.
5.5.1 Damages in Full Scale Room
Full scale room was also subjected to successive eight blast events. Visual observations and snap
shots were taken of damages in structural and non structural elements of room such as columns,
front wall, rear wall, return (side walls) walls, windows and door for finding the response of
room as a whole.
Event No 1: After event No.1, front window frame was broken at the top. The location of
maximum damages does not correspond with the free field maximum peak overpressure
application area (expected) in the lower region of the window. This was due to the reflection of
shock waves from the slab in the veranda portion and subsequent interference with the direct
shock waves from the source. The resulting shock waves with enhanced parameters impinged on
the upper portion of front window. Consequently, the damages were concentrated in the upper
panel of window. All the glass panels of front window and door panels were broken and
shattered inside covering almost the whole floor area of room. Windows glass pieces were also
scattered outside up to a distance of 1.33 m due to the suction pressure which followed positive
pressure. First layer of brick masonry at sill level of front window was damaged. Rear windows
glass panels were found intact and undamaged. Bolt of door was broken and door moved inside
but remained intact at the hinges as shown in Figure 5.13.
Figure 5.13: Damages to front window, door and sill level after event no.1
Failu
re of u
pper p
annel
Scatterin
g g
lass pan
els outsid
e
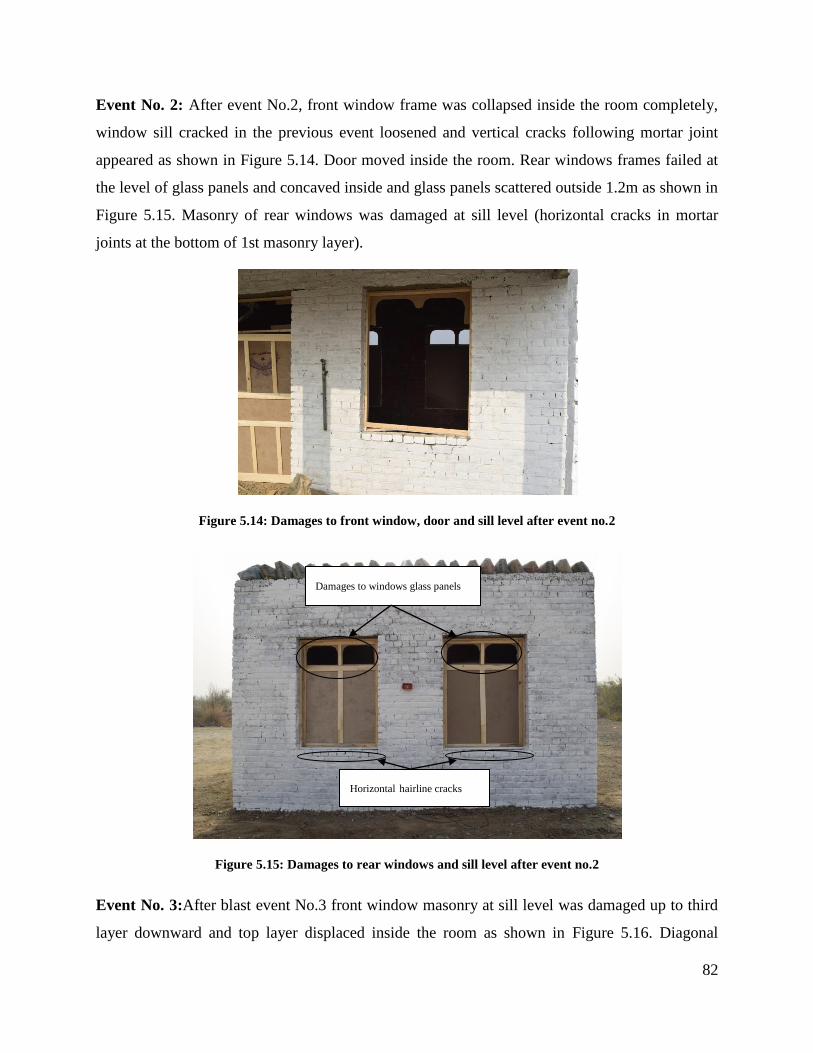
82
Event No. 2: After event No.2, front window frame was collapsed inside the room completely,
window sill cracked in the previous event loosened and vertical cracks following mortar joint
appeared as shown in Figure 5.14. Door moved inside the room. Rear windows frames failed at
the level of glass panels and concaved inside and glass panels scattered outside 1.2m as shown in
Figure 5.15. Masonry of rear windows was damaged at sill level (horizontal cracks in mortar
joints at the bottom of 1st masonry layer).
Figure 5.14: Damages to front window, door and sill level after event no.2
Figure 5.15: Damages to rear windows and sill level after event no.2
Event No. 3:After blast event No.3 front window masonry at sill level was damaged up to third
layer downward and top layer displaced inside the room as shown in Figure 5.16. Diagonal
Damages to windows glass panels
Horizontal hairline cracks

83
minor cracks were appeared at the right pier, starting at the base of lintel beam as shown in
Figure 5.17. Concrete partially spalled down from underside of western veranda beam starting
from room wall as shown in Figure 5.18. Separation of in-plane and out-of-plane walls at front
face of room was observed as shown in Figure 5.19. Minor diagonal cracks in both rear piers
appeared. Rear windows panels collapsed inside the room. The bricks in the first layer at sill
level of western rear window loosened and moved out of plane inside as shown in Figure 5.20.
Figure 5.16: Damages to front window sill level after event no.3
Figure 5.17: Diagonal cracks in front right pier after event no.3
Minor diagonal cracks in pier
Dam
ages to
win
do
w sill

84
Figure 5.18: Spalling of concrete from lintel beam after event no.3
Figure 5.19:Separation of in-plane and out-of-plane wall after event no.3
Spalling of concrete
Sep
aration
of w
alls

85
Figure 5.20: Collapse of rear window panels after event no.3
Event No. 4: Masonry in front window sill up to the second layer level was damaged
completely. Diagonal cracks produced above the lintel beam of veranda near the corners. Minor
horizontal cracks were produced in middle column at mid height shown in Figure 5.21.
Horizontal cracks produced in two layers below the slab in the front wall shown in Figure 5.22.
Wall to wall separation of room in the previous event were widened and propagated as shown in
Figure 5.23. Diagonal cracks in the right pier of front wall were produced as shown in Figure
5.24. Failure of brick masonry at the top in western in-plane solid wall was observed. Bricks in
the sill of front window loosened and fell down inside room as shown in Figure 5.25. Diagonal
micro cracks observed in eastern rear pier shown in Figure 5.26.

86
Figure 5.21: Sill damage, diagonal cracks above lintel beam and horizontal minor crack in middle column
after event no.4
Figure 5.22: Horizontal cracks in front wall below slab after event no.4
Damages in masonry b/w lintel beam and slab
Masonry damages below slab in front wall

87
Figure 5.23: Separation of walls after event no.4
Figure 5.24: Diagonal cracks in right pier after event no.4
Walls separation
Diag
on
al cracks in
pier

88
Figure 5.25: Masonry fall from front window sill after event no.4
Figure 5.26: Diagonal cracks after event no.4
Event No. 5: Flexural cracks widened in the front columns. The damages in masonry in between
slab and lintel beam increased as shown in Figure 5.27. Cracks in solid wall were extended to
larger area. Separation between walls of the room was increased to max 3.8cm shown in Figure
5.28. Brick displaced out 1.3cm from the western column at the middle. Cracks were appeared at
the interface of slab and masonry except the rear portion of room. Cracks were also appeared at
the interface of bricks and lintel beam in the veranda. Room was found fit for retrofitting to make
Fallen bricks from front window sill
Dam
ages in
left rear pier

89
it safe against gravity loads.
Figure 5.27: Diagonal cracks above lintel beam and flexural cracks in columns after event no.5
Figure 5.28: Separation of walls after event no.5
Event No. 6: Bricks were loosened from the mid heights of middle and western columns shown
in Figure 5.29. Bricks in two layers under the slab in out-of-plane front wall displaced 3.8cm
(towards veranda) shown in Figure 5.30. Wide diagonal cracks were observed in the rear western
pier shown in Figure 5.31. The diagonal cracks in the western and eastern piers in the front side
of room more opened. Cracks in bed joints above lintel beam widened and some bricks fell down
Walls sep
aration
Masonry damages
Flex
ural crack
s

90
shown in Figure 5.32. Room found fit for retrofitting to make it safe against gravity loads.
Figure 5.29: Loosing of bricks at mid-height after event no.6
Loo
senin
g
of
brick
in
colu
mn

91
Figure 5.30: Loosing of bricks below slab after event no.6
Figure 5.31: Diagonal cracks in rear pier after event no.6
Displacement of bricks outside
Dam
ages in
rear pier

92
Figure 5.32: Damages in front piers and masonry above lintel beam after event no.6
Event No. 7: All the three columns collapsed. Consequently, slab and lintel beam failed at the
interface of front wall of room and suspended in vertical position. The middle pier collapsed and
the two outside piers in the front side of room failed but in standing position due to the support
of suspended slab as shown in Figure 5.33andFigure 5.34. Cracks in the in-plane walls widened.
Slab displaced towards the front side along with one underlying layer of brick masonry as shown
in Figure 5.35.
Figure 5.33: Collapse of column and failure of slab in veranda portion after event no.7

93
Figure 5.34: Collapse of column and failure of slab in veranda portion after event no.7
Figure 5.35: Displacement of slab towards front side after event no.7
Event No. 8:Rear pier though damaged enough but in standing Position .Cracks in the broken
slab and lintel beam increased but remained intact in suspended position. Cracks throughout the
masonry widened as shown in Figure 5.36.

94
Figure 5.36: Room after event no.8
Event No. 9: Explosive charge placed on ground inside room (zero scaled distance) at a
distance of 0.61 m from the western solid wall. Room collapsed completely scattering the bricks
38m in the north, 34m in the east and 34.5m in the west directions shown in Figure 5.37.
Figure 5.37: Collapse of masonry room after event no.9
5.5.2 Response of Full Scale Room
The response of full scale masonry room was evaluated experimentally against blast loads with
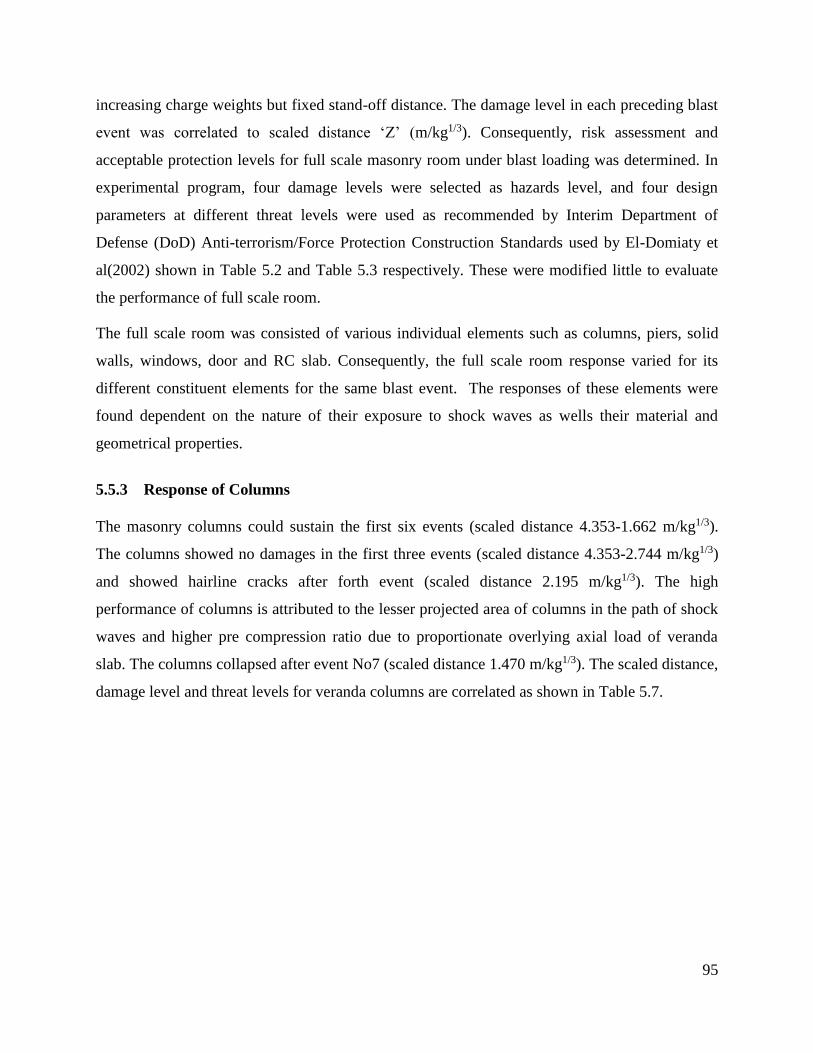
95
increasing charge weights but fixed stand-off distance. The damage level in each preceding blast
event was correlated to scaled distance ‘Z’ (m/kg1/3). Consequently, risk assessment and
acceptable protection levels for full scale masonry room under blast loading was determined. In
experimental program, four damage levels were selected as hazards level, and four design
parameters at different threat levels were used as recommended by Interim Department of
Defense (DoD) Anti-terrorism/Force Protection Construction Standards used by El-Domiaty et
al(2002) shown in Table 5.2 and Table 5.3 respectively. These were modified little to evaluate
the performance of full scale room.
The full scale room was consisted of various individual elements such as columns, piers, solid
walls, windows, door and RC slab. Consequently, the full scale room response varied for its
different constituent elements for the same blast event. The responses of these elements were
found dependent on the nature of their exposure to shock waves as wells their material and
geometrical properties.
5.5.3 Response of Columns
The masonry columns could sustain the first six events (scaled distance 4.353-1.662 m/kg1/3).
The columns showed no damages in the first three events (scaled distance 4.353-2.744 m/kg1/3)
and showed hairline cracks after forth event (scaled distance 2.195 m/kg1/3). The high
performance of columns is attributed to the lesser projected area of columns in the path of shock
waves and higher pre compression ratio due to proportionate overlying axial load of veranda
slab. The columns collapsed after event No7 (scaled distance 1.470 m/kg1/3). The scaled distance,
damage level and threat levels for veranda columns are correlated as shown in Table 5.7.

96
Table 5.7 Blast Events and scaled distances versus damage and threat level for masonry columns
Event
No
Charge weight
(TNT)
(kg)
Stand-off
distance
(m)
Scaled
Distance
(m/kg1/3)
Peak
Pressure
(MPa)
Damage Level Threat
Level
1 0.56 3.58 4.353 0.077 No damage Minimum
2 1.66 3.58 3.020 0.205 No damage Low
3 2.22 3.58 2.744 0.221 No damage Medium
4 4.34 3.58 2.195 0.381 Light damage High
5 7.49 3.58 1.830 1.014 Light damage High
6 9.99 3.58 1.662 ---- Heavy damage High
7 14.43 3.58 1.470 ---- Failure High
The failure in columns started at middle height due to removal of mortar joints. The response of
columns against blast loading can be improved by using rich mortar in fabrication the mid height
of masonry columns. Moreover, retrofitting techniques such as steel jacketing, FRP, GFRP and
ferrocement overlay can also be applied for enhancing their performance against blast loads.
Moreover, the room was failed when the columns collapsed and as such response of room is
dependent on the performance of columns. If the columns are exposed to the stated threat
circumstances, the failure of columns is caused by the minimum scaled distance (Z) 1.470
m/kg1/3. After event no 6 the columns were safe and in standing position. The corresponding
safe scaled distance before collapse found experimentally given below:
Z=1.662 m/kg1/3 (5.1)
It is pertinent to mention here, the scaled distance determined here is based on the accumulative
damages due to the six events.
Explosive charge is generally predicted by working out an attack scenario, which may engage a
personnel-borne or a vehicle-borne improvised explosive device. Clearly, the means of
transportation determine the explosive charge quantity. Furthermore, explosive nature and
quantity are uncertain. Therefore, an increase of 20% is applied to the explosive weight
invariably. The corresponding minimum safe stand-off distances R in meter for typical primary
school room before collapse for different explosive charge quantities W in ‘Kg’ are found by re-
arranging Hocpkinson-Cranz law (Z=𝑅
√𝑊3 ) as below:

97
Safe stand-off distance=R=1.662*(W)(1/3) (5.2)
The results are shown in Table 5.8. The table shows increasing trend in minimum stand-off
distances with increasing capacity of means of transportation.
Table 5.8 Safe stand-off distance of columns for different explosive charges
# Carrier Charge
weight (kg)
20% increase
(kg)
Total Charge
Weight(Kg)
Minimum Stand-
off distance (m)
1 Truck with trailer 10000 2000 12000 38.05≈39.0
2 Truck 5000 1000 6000 30.20≈31.0
3 Van 3000 600 3600 25.47≈26.0
4 Truck-pick up 1400 280 1680 19.76≈20.0
5 Car-large sized 300 60 360 11.82≈12.0
6 Car-medium sized 200 40 240 10.33≈11.0
7 Suit case 10 2 12 3.8≈4.5
5.5.4 Response of Windows & Door
Front window and door were located at larger stand-off distances as compared to the columns
from the explosive charges as shown in Figure 3.1. Consequently, these elements would
experience lesser peak overpressure in free field scenario. But as they (front window and door)
were located inside veranda, the pressure impinged on them was complicated and different from
field environment due to reflection and refraction of shock waves within the veranda structure.
However, the front window and door panels were susceptible to more peak overpressure as
compared to the rear windows in the given blast situation. The windows and door were part of
the same masonry room therefore; threat and damage levels (with little modifications) of
masonry walls are used for the windows and door panels also as shown in Table 5.9.
Table 5.9: Blast Events versus damage and threat level for front window
Event
No.
TNT
(kg)
Stand-off
distance (m)
Damage
Level
Threat
Level
Remarks
1 0.56 3.58 Failure Minimum Chip board frame failed but
remained intact. Glass panels blown
outside and inside the room
2 1.66 3.58 Failure Minimum Chip board frame blown inside
room

98
The high velocity flying scattered glazing poses dangers to the students or residents inside the
room. The shock waves thus penetrating the room through window and door openings and
impinges on window panels in other directions and fragile structures within the room and cause
further damages. Furthermore, provision of windows in the front wall, masonry piers are
introduced which are weaker than solid walls against blast loading. Therefore, windows and
doors shall be avoided in the direction of perceived threat of explosion.
The door was located at exterior left corner. It was made of chip board except the upper single
glazing panel. It sustained one additional blast event and its response is shown in Table 5.10.
Table 5.10 Blast Events versus damage and threat level for front door
Event
No.
Charge weight
(TNT)
(kg)
Stand-off
distance
(m)
Damage
Level
Threat
Level
Remarks
1 0.56 3.58 Failure Minimum Glazing blown. Door lock and
bolt blown and remained intact on
hinges
2 1.66 3.58 Failure Minimum Door lock and bolt blown and
remained intact on hinges
3 2.22 3.58 Failure Minimum Door blown inside room
The rear windows were partially glazed. They were not exposed to the direct shock waves.
Resultantly, they performed better than the front windows as shown in Table 5.11.
Table 5.11 Blast events versus damage and threat level for rear windows
Event
No.
Charge
weight (TNT)
(kg)
Stand-off
distance (m)
Damage
Level
Threat Level Remarks
1 0.56 3.58 Failure Minimum Glass panels blown outside
room. No damages to chip
board panel
2 1.66 3.58 Failure Minimum No damages to chip board
panel
3 2.22 3.58
Failure Minimum
Chip board frame blown
inside room
Both panels of rear windows were blown due to suction (negative) pressure inside the room. In
addition the hazard to the life inside room due to flying debris of glazing was minimized.

99
5.5.5 Response of front wall
The front wall contained one window and one door. The stand-off distance from the explosive
charge was also least amongst the four walls of room. Furthermore, the shock wave pressure had
been magnified due to reflection from the solid portion of wall. Hence, it was prone to more risk
and response is shown in Table 5.12 .
Table 5.12 Blast Events and scaled distances versus damage and threat level for front wall of masonry room
Event
No.
Charge weight
(TNT)
(kg)
Stand-off
distance
(m)
Scaled
Distance
(m/kg1/3)
Peak
Pressure
(MPa)
Damage Level Threat Level
1 0.56 5.412 6.586 0.001 No damage Minimum
2 1.66 5.412 4.566 0.103 No damage Minimum
3 2.22 5.412 4.149 0.117 Light damage Minimum
4 4.34 5.412 3.318 0.156 Light damage Low
5 7.49 5.412 2.766 0.271 Light damage Medium
6 9.99 5.412 2.513 0.330 Heavy damage Medium
7 14.43 5.412 2.223 ------ Failure High
8 17.78 3.58 1.371 ------ ----------- High
Masonry in the piers as well as in the sill level of window opening accrued more damage as
compared to other parts of front wall in successive events. This response is observed due to
enhanced pressure evolving in urban environment in the interior of veranda as well lesser or no
bearing pressure (pre-compression) on these portions of front wall. Furthermore, injuries and
damages can be accentuated due to flying debris ejected from masonry at the sill level. Hence,
window and piers in masonry room shall be either avoided in the perceived threat direction or
properly designed to withstand estimated threat level.
5.5.6 Response of Side (Return) Walls
Both the return walls were fabricated solid without any openings. These walls received side on
pressure (incident pressure) directly from the charge source on their exterior sides and shock
waves pressure on their interior sides entering the room through window and door openings.
Furthermore, these walls restrained the response of front walls against blast loading. The
response is given in Table 5.13.

100
Table 5.13 Blast Events and scaled distances versus damage and threat level for side masonry wall
Event
No.
Charge weight
(TNT)
(kg)
Stand-off
distance
(m)
Scaled
Distance
(m/kg1/3)
Peak
Pressure
(MPa)
Damage Level Threat
Level
1 0.56 7.744 9.427 0.010 No damage Minimum
2 1.66 7.744 6.536 0.017 No damage Minimum
3 2.22 7.744 5.938 0.022 No damage Minimum
4 4.34 7.744 4.749 0.027 No damage Minimum
5 7.49 7.744 3.959 0.034 No damage Minimum
6 9.99 7.744 3.596 0.059 No damage Minimum
7 14.43 7.744 3.182 ---- Light damage Minimum
8 17.78 7.744 2.968 ---- Light damage Minimum
The enhanced performance of the two side walls was due to their orientation as well as
geometrical properties.
The only failure of these walls was at their junction lines with the front wall. The separation of
walls initiated in the very milder blast events. With each subsequent event, the separation
increased which also contributed in the failure of front masonry wall. Therefore, proper
strengthening techniques such steel anchorage, FRP etc may be applied to the junction of two
walls for enhancing the overall performance of brick masonry buildings.
5.5.7 Response of Rear Wall
The rear wall contained two windows which were placed symmetrically. This wall contained
openings and piers like front wall but response was enhanced enough as compared to front wall
due to less exposure to peak pressure. No pressure transducer was installed on this wall and no
pressure data was acquired experimentally. The response is given below in Table 5.14.
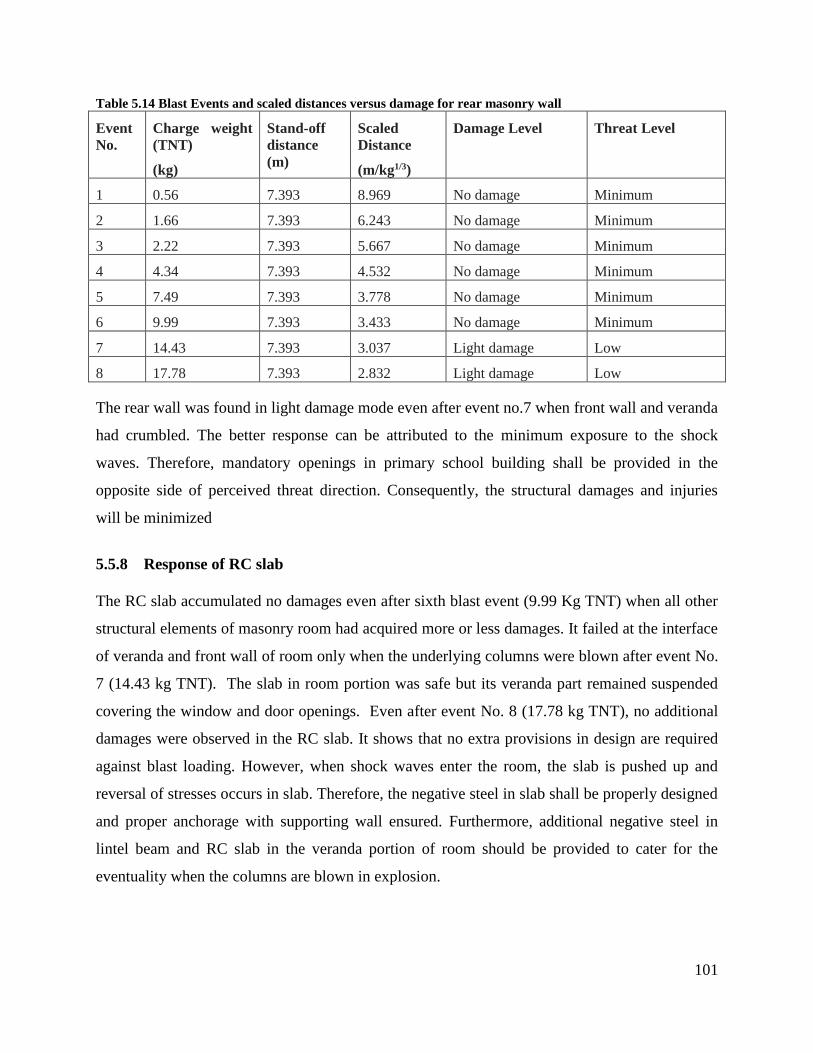
101
Table 5.14 Blast Events and scaled distances versus damage for rear masonry wall
Event
No.
Charge weight
(TNT)
(kg)
Stand-off
distance
(m)
Scaled
Distance
(m/kg1/3)
Damage Level Threat Level
1 0.56 7.393 8.969 No damage Minimum
2 1.66 7.393 6.243 No damage Minimum
3 2.22 7.393 5.667 No damage Minimum
4 4.34 7.393 4.532 No damage Minimum
5 7.49 7.393 3.778 No damage Minimum
6 9.99 7.393 3.433 No damage Minimum
7 14.43 7.393 3.037 Light damage Low
8 17.78 7.393 2.832 Light damage Low
The rear wall was found in light damage mode even after event no.7 when front wall and veranda
had crumbled. The better response can be attributed to the minimum exposure to the shock
waves. Therefore, mandatory openings in primary school building shall be provided in the
opposite side of perceived threat direction. Consequently, the structural damages and injuries
will be minimized
5.5.8 Response of RC slab
The RC slab accumulated no damages even after sixth blast event (9.99 Kg TNT) when all other
structural elements of masonry room had acquired more or less damages. It failed at the interface
of veranda and front wall of room only when the underlying columns were blown after event No.
7 (14.43 kg TNT). The slab in room portion was safe but its veranda part remained suspended
covering the window and door openings. Even after event No. 8 (17.78 kg TNT), no additional
damages were observed in the RC slab. It shows that no extra provisions in design are required
against blast loading. However, when shock waves enter the room, the slab is pushed up and
reversal of stresses occurs in slab. Therefore, the negative steel in slab shall be properly designed
and proper anchorage with supporting wall ensured. Furthermore, additional negative steel in
lintel beam and RC slab in the veranda portion of room should be provided to cater for the
eventuality when the columns are blown in explosion.
102
Chapter 6. SUMMARY, CONCLUSIONS AND
RECOMMENDATIONS
6.1 SUMMARY
The main objective of this research was to evaluate the experimental performance of typical full
scale primary school unreinforced burnt brick masonry room as well as three different masonry
wall systems- unreinforced, ferrocement overlay and confined against blast loading. The research
involved extensive laboratory testing as well as field testing.
In laboratory testing, mechanical and physical properties of constituent materials such as brick
unit, masonry prism, and mortar, concrete and steel were evaluated.
In field testing all the four test models were placed symmetrically on the perimeter of 3.66 m
radius circle. Cylindrical shaped Composition-B explosive placed at the centre of circle and at
height of 0.91 m was ignited from the top in all the eight successive events. The weight of the
explosive material was increased from 0.5kg to 16.02kg in the total eight events. The pressure
data during each test event was acquired from the six pressure sensors installed on different
points on the test specimens. The shape of shock wave was recorded by high speed camera
installed at safe distance from the centre of blast. The damage pattern and intensity in the test
models was observed after each event.
An empirical model predicting peak overpressure was developed based on the experimental data
of pressure sensor. The same was compared with empirical models of other researchers.
The response of each model during the test was correlated to predefined threat and damage
levels. Hence performance of the test specimen was evaluated experimentally. The performance
of confined masonry followed by ferrocement overlay masonry was found enhanced as
compared to unreinforced masonry against blast loading. The performance of full scale masonry
room was found governed by the performance of masonry columns in the veranda. Finally, safe
scaled distance before collapse was evaluated for typical primary school room.
103
6.2 CONCLUSIONS
Based on this research the conclusions are as follows:
1. From the experimental data of cylindrical shaped explosives when ignited from the top,
the empirical model measuring peak overpressure Pr in MPa for surface burst scenario,
was developed as below:
𝑃𝑟 = 4.34 ∗ 𝑍−2.80 for 1.83≤Z≥4.353 6.1
Where ‘Z’ the scaled distance in m/kg1/3.
2. Masonry at joints of walls, piers and at window sill level was found susceptible to
maximum hazard in blast loading. However, the overall performance of typical primary
school room was found governed by the response of veranda columns. The room was
considered failed when the columns were blown off. Minimum safe scaled distance
“Z”1.662 m/kg1/3 before collapse was obtained experimentally for veranda columns. The
same was also minimum threshold scaled distance for safety of typical primary school
room.
3. The performance of three different systems of masonry walls was evaluated
experimentally against surface blast loading. For minimum threat level (Z= 4.353
m/kg1/3), the response of all the three systems is nearly the same but the response
amongst the walls change appreciably as the severity of threat level is accentuated. The
minimum scaled distances when the responses were contained in light damage modes
were found as 2.744 m/kg1/3, 1.830 m/kg1/3 and 1.662 m/kg1/3 for unreinforced,
ferrocement overlay and confined masonry respectively. Similarly, unreinforced,
ferrocement overlay and confined masonry walls collapsed at scaled distances 1.830
m/kg1/3, 1.470 m/kg1/3 and 1.371 m/kg1/3 respectively. Consequently, unreinforced,
ferrocement overlay and confined masonry walls are placed in the order of enhanced
performance against blast loading.

104
6.3 RECOMMENDATIONS
1. Joints of walls in full scale room as well as in unreinforced masonry and ferrocemented
overlay masonry walls are found succeptitable to more damages against blast loadings.
Therefore, joints of wall shall be strengthened for mitigation against blast loads.
2. The masonry with confined boundaries as well as masonry with ferrocemented overlay
play important role in mitigation against blast loads. The confined masonry wall followed
by ferrocemented overlay masonry wall showed better performance than unreinforced
masonry against similar blast scenario in each successive event. Therefore, confined
masonry and ferrocement overlay masonry should be used in fabrication of new primary
school buildings and the existing stock of primary school buildings should be retrofitted
with ferrocement overlay in terrorist prone regions.
3. Bricks in the upper layers of free standing masonry in building (window sill) as well as in
unreinforced and ferrocemented overlay masonry wall, pose greater potential dangers to
life and property. Therefore, proper strengthening techniques such as pre-compression
and retrofitting techniques should be applied to the free standing top layers of bricks in
unreinforced building elements and unreinforced masonry boundary walls.
4. The in-plane wall in each category of wall systems and full scale room listed lesser
damages as compared to out-of-plane wall after each successive event as the input
pressure (side on/incident pressure) was always less than reflected pressure. Therefore, in
brick masonry, the strengthening techniques should be mainly focused on the out-of-
plane wall against the perceived threat level and direction.
5. The masonry columns shall be strengthened to increase the overall performance of
masonry room.
6. Windows of masonry room facing the threat direction should be relocated in rear and side
walls for reducing hazards to the structure and life inside room.
7. Ground conditions (sandy, clayey, gravel, loose, compacted and consolidated, rock,
concrete, and RC pavement) shall be incorporated in the prediction models. Similarly,
empirical models are oversimplified and do not take the complex interaction of shock
waves with the target structure and surrounding built environment. Therefore, numerical
methods based on computational fluid dynamics (CFD) should be used for finding more

105
accurate blast wave parameters and consequent response of structure in urban
environment.
8. Failure in confined masonry has been found governed by the material and geometrical
model of masonry component only. Therefore, the material models of both confining
element and masonry shall be properly adjusted for optimization against specified blast
threat level.

106
6.4 FUTURE WORK
1. Free air burst and surface burst empirical models proposed by different researchers for
peak overpressure show large variation especially in the region of small scaled distance.
Therefore, research is required for predicting accurate shock wave parameters in the
region very close to the centre of explosion.
2. Damages to structure can be confined to certain level either by attenuating blast load
parameters before reaching the target or re-detailing and retrofitting of structural
elements, proper landscaping, and incorporating blast load efficient architecture. In
important buildings where space is not expensive, proper landscaping and blast efficient
architectural design can play important role in blast mitigation. For buildings located in
urban environment where space is a costly commodity, use of efficient architecture and
retrofitting techniques shall be investigated and incorporated in masonry buildings.
3. Retrofitting techniques using FRP and polyurea etc have been proved efficient in blast
mitigation. Retrofitting techniques to masonry have been applied and investigated in the
pre-blast scenario. Efficiency of retrofitting techniques in the damaged masonry buildings
in the post blast scenario shall be investigated and evaluated.
4. Ferrocement also fails in de bonding like FRP retrofitted masonry walls. Therefore,
mitigating techniques should be investigated for utilizing the optimum potential of
ferrocemented overlay against blast loading. Ferrocemented overlay applied on both
faces of wall shall be investigated and its efficiency should be evaluated for field
applications. Furthermore ferrocemented overlay technique should be investigated in post
blast scenario.
5. Numerical studies should be carried out to evolve the response of full scale unreinforced
masonry room and three different masonry systems-unreinforced, ferrocement overlay
and confined masonry walls.

107
References:
A. M. Remennikov, “Evaluation of blast loads on buildings in urban environment,” WIT
Transactions on The Built Environment, vol. 73, 2004.
A. Pandey and R. Bisht, “Numerical modelling of infilled clay brick masonry under blast
loading,” Advances in Structural Engineering, vol. 17, no. 4, pp. 591–606, 2014.
A. Ullah, F. Ahmad, H.-W. Jang, S.-W. Kim, and J.-W. Hong, “Review of analytical and
empirical estimations for incident blast pressure,” KSCE Journal of Civil Engineering, pp. 1–15,
2016.
A. V. Kulkarni and G. Sambireddy, “Analysis of Blast Loading Effect on High Rise Buildings,”
Civil and Environmental Research, vol. 6, no. 10, 2014.
Adil Saeed. (2016, 12 5). Pakistan Forward. Retrieved 09 01, 2018, from http://pakistan.asia-
news.com/en_GB/articles/cnmi_pf/features/2016/12/05/feature-01
Army, T. M., & Force, A. (1990). TM 5-1300. Structures to Resist the Effects of Accidental
Explosions.
ASCE. (2011). “Blast protection of buildings.” 59-11, Reston, VA
Babatunde, S. A. (2017). Review of strengthening techniques for masonry using fiber reinforced
polymers. Composite Structures, 161, 246-255
Badshah, E., Naseer, A., Ashraf, M., Shah, F., & Akhtar, K. (2017). Review of Blast Loading
Models, Masonry Response, and Mitigation. Shock and Vibration, 2017.
Birnbaum, K. Naury, A. Richard, E. F. Gerg, J. H. Colin, and J.F. Nigel, “Analysis of blast loads
on buildings,” in Preprint from Structures under Extreme Loading Conditions, 1996.
Bui, T. T., Limam, A., David, B., Ferrier, E., & Brun, M. (2010, July). Masonry walls submitted
to out-of-plane loading: experimental and numerical study. In 8th International Masonry
Conference (Vol. 2, No. F-243, pp. 1153-1162).
C. A. Mills, “The design of concrete structure to resist explosions and weapon effects,” in
Proceedings of the 1st International Conference on concrete for hazard protections, pp. 61–73,
September 1987
C. Wu and H. Hao, “Modeling of simultaneous ground shock and air blast pressure on nearby
structures from surface explosions,” International Journal of Impact Engineering, vol. 31, no. 6,

108
pp. 699–717, 2005
C.Wu and H. Hao, “Safe scaled distance for masonry in filled RC frame structures subjected to
airblast loads,” Journal of Performance of Constructed Facilities, vol. 21, no. 6, pp. 422–431,
2007.
D. Bogosian and D. Piepenburg, “Effectiveness of frangible barriers for blast shielding,” in
Proceedings of the 17th International Symposium on the Military Aspects of Blast and Shock, pp.
1–11, 2002.
Design of Concrete Masonry Walls for Blast loading, TEK 14-21A. National Concrete Masonry
Association, 2014.
E. B. Philip,ThePassage of a Blast over a Wall, Ministry of Home Security, 1942.
F. Parisi, C. Balestrieri, and D. Asprone, “Blast resistance of tuff stone masonry walls,”
Engineering Structures, vol. 113, pp. 233–244, 2016.
G. C. Mays and P. D. Smith, Blast Effects on Buildings: Design of Buildings to Optimize
Resistance to Blast Loading, Thomas Telford, 1995.
G. F. Kinney and K. J. Graham, Explosive Shocks in Air, Springer Science & Business Media,
2013.
G. F. Kinney and K. J. Graham, Explosive Shocks in Air, Springer Science & Business Media,
2013
G. S. Urgessa and A. K. Maji, “Dynamic response of retrofitted masonry walls for blast
loading,” Journal of Engineering Mechanics, vol. 136, no. 7, Article ID008007QEM, pp. 858–
864, 2010.
Griffiths H. (2017). Human Rights Watch Retrieved 10 09 2018, from
https://www.hrw.org/news/2017/05/30/pakistans-poor-record-protecting-schools
H. Hao and C. Wu, “Numerical simulation of damage of low rise RC frame structures with
infilled masonry walls to explosive loads,” Australian Journal of Structural Engineering, vol. 7,
no. 1, pp. 13–22, 2006.
H. L. Brode, “Numerical solutions of spherical blast waves,” Journal of Applied Physics, vol. 26,
109
no. 6, pp. 766–775, 1955.
Hammond, L. (1995). Underwater shock wave characteristics of cylindrical charges.
Hetherington, J., & Smith, P. (2014). Blast and ballistic loading of structures. CRC Press.
Hryciów, Zdzisław, WacławBorkowski, Piotr Rybak, and Z. Wysocki. "Influence of the shape of
the explosive charge on blast profile." Journal of KONES 21 (2014).
Hussain, R.S (2017) Human Rights Watch Pacific Press. Retrieved 10, 09 2018 from
https://www.hrw.org/report/2017/03/27/dreams-turned-nightmares/attacks-students-teachers-
and-schools-pakistan
Impact Engineering, vol. 27, no. 4, pp. 359–376, 2002.
J. Henrych and R. Major, The Dynamics of Explosion and its Use, Elsevier Scientific,
Amsterdam, Netherlands, 1979.
J. I. Siddiqui and S. Ahmad, “Impulsive loading on a concrete structure,” Proceedings of the
Institution of Civil Engineers: Structures and Buildings, vol. 160, no. 4, pp. 231–241, 2007
J. Iqbal and S. Ahmad, “Improving safety provisions of structural design of containment against
external explosion,” in Proceedings of International conference on opportunities and challenges
for water cooled reactors in the 21st century, International Atomic Energy Agency (IAEA),
2011
J. M. Pereira, J. Campos, and P. B. Lourenc¸o, “Experimental study on masonry infill walls
under blast loading,” in Proceedings of the 9th International Masonry Conference, pp. 1–9,
2014.
J.Wang, H. Ren, X.Wu, andC. Cai, “Blast response of polymer retrofitted masonry unit walls,”
Composites Part B: Engineering,
K. A. El-Domiaty, J. J. Myers, and A. Belarbi, “Blast Resistance of Un Reinforced Masonry
Walls Retrofitted with Fiber Reinforced Polymers,” Center for Infrastructure Engineering
Studies Report 02-28, University of Missouri, Rolla, Missouri, 2002.
K. J.Knox,M. I. Hammons, T. T. Lewis, and J. R. Porter, Polymer Materials for Structural
Retrofit, Force Protection Branch, Air Expeditionary Forces Technology Division, Air Force
Research Laboratory, Tyndall AFB, Panama, Fla, USA, 2000.

110
Kappos, A. (2014). Dynamic loading and design of structures. CRC Press.
Karlos, V., & Solomos, G. (2013). Calculation of blast loads for application to structural
components. Luxembourg: Publications Office of the European Union.
Karlos, V., Solomos, G., & Larcher, M. (2016). Analysis of the blast wave decay coefficient
using the Kingery–Bulmash data. International Journal of Protective Structures, 7(3), 409-429.
Kingery, C. N., &Bulmash, G. (1984). Air blast parameters from TNT spherical air burst and
hemispherical surface burst, Ballistic Research Laboratories.
Knock, C., & Davies, N . (2011). Predicting the peak pressure from the curved surface of
detonating cylindrical charges. Propellants, Explosives, Pyrotechnics, 36(3), 203-209
Knock, C., & Davies, N. (2011). Predicting the impulse from the curved surface of detonating
cylindrical charges. Propellants, Explosives, Pyrotechnics, 36(2), 105-109.
Knock, C., & Davies, N. (2013). Blast waves from cylindrical charges. Shock Waves, 23(4),
337-343.
Koccaz, Z., Sutcu, F., & Torunbalci, N. (2008, October). Architectural and structural design for
blast resistant buildings. In The 14th world conference on earthquake engineering October (pp.
12-17).
L. Lantz, J. Maynez, W. Cook, and C. M. D. Wilson, “Blast protection of unreinforced masonry
walls: a state-of-the-art review,” Advances in Civil Engineering, vol. 2016, Article ID 8958429,
11 pages, 2016.
Louca, L., &Friis, J. C. (2002). SJ, Response to explosions, Report on CTR106. Imperial
College.
M. A. Barakat and J. G. Hetherington, “Architectural approach to reducing blast effects on
structures,” Proceedings of the Institution of Civil Engineers: Structures and Buildings, vol. 134,
no. 4, pp. 333–343, 1999.
M. A. Sadovskiy, “Mechanical effects of air shockwaves from explosions according to
experiments,” in Sadovskiy MA Selected Works: Geophysics and Physics of Explosion, Nauka
Press, Moscow, Russia, 2004.
M. Barakat and J. G. Hetherington, “New architectural forms to reduce the effects of blast waves

111
and fragments on structures,” in WIT Transactions on The Built Environment, vol. 35, 1970.
M. D. Goel, V. A. Matsagar, A. K. Gupta, and S. Marburg, “An abridged review of blast wave
parameters,” Defence Science Journal, vol. 62, no. 5, pp. 300–306, 2012.
M. E. Beyer, Blast Loads behind Vertical Walls, Naval civil engineering lab port hueneme, Port
Hueneme, CA, USA, 1986.
M. Held, “Blast waves in free air,” Propellants, Explosives, Pyrotechnics, vol. 8, no. 1, pp. 1–7,
1983.
M. Johansson, O. P. Larsen, L. Laine, and REINERTSEN Sverige AB, “Explosion at an
intersection in an Urban Environment–Experiments and analyses,” in Proceedings of the 78th
Shock and Vibration Symposium, Philadelphia, PA, USA, 2007.
M. M. Swisdak Jr., Simplified KingeryAirblast Calculations, Naval SurfaceWarfare Center,
Indian Head, Md, USA, 1994.
M. Maalej, V. W. J. Lin, M. P. Nguyen, and S. T. Quek, “Engineered cementitious composites
for effective strengthening of unreinforced masonry walls,” Engineering Structures, vol. 32, no.
Mespoulet, J., F. Plassard, P. Hereil, and A. Lefrançois. "Influence of HE shape on blast profile."
8th European LS-DYNA Users Conference, Strasbourg, 2011
N. Gebbeken and T. D¨oge, “Explosion protection – Architectural design, urban planning and
landscape planning,” International Journal of Protective Structures, vol. 1, no. 1, pp. 1–22,
2010.
N. M. Newmark and R. J. Hansen, “Design of blast resistant structures,” in Shock and vibration
handbook 3, 1961.
Oesterle, M. G. (2009). Blast simulator wall tests: experimental methods and mitigation
strategies for reinforced concrete and concrete masonry (Doctoral dissertation, UC San Diego)
P. A. Buchan and J. F. Chen, “Blast resistance of FRP composites and polymer strengthened
concrete and masonry structures—a state-of-the-art review,” Composites Part B: Engineering,
vol. 38, no. 5-6, pp. 509–522, 2007
P. D. Smith and T. A. Rose, “Blast wave propagation in city streets—an overview,” Progress in
Structural Engineering and Materials, vol. 8, no. 1, pp. 16–28, 2006.

112
P. S. Jones, K. P. Vitaya-Udom, and J. M. Watt Jr., “Design of Structures to resist terrorist
attack;1/10th scale model perimeter wall tests,” Tech. Rep. SL-87-13, US Army Waterways
Experiment Station, Structures Laboratory, Vicksburg, MS, USA, 1987.
P.W. Sielicki, “Masonry failure under unusual impulse loading,” Wydawnictwo Politechniki
Pozna´L ,skiej, 2013.
Pechoux F, Simeons B, Lefebrve M.H,(2011) “TNT-equivalent and explosive charge
characteristics”, 10eme Congres International de Pyrotechnic du Groupe de Travail de
Pyrotechnie, Reims, pp.592-597.
R. A. Keys and S. K. Clubley, “Experimental analysis of debris distribution of masonry panels
subjected to long duration blast loading,” Engineering Structures, vol. 130, pp. 229–241, 2017.
R. Gunaratan, Case Study: The Islamabad Marriott in Flames: Attack on the World’s Most
Protected Hotel, International Centre for Political Violence and Terrorism Research (ICPVTR),
2008.
R. Hajek, M. Foglar, and J. Fladr, “Influence of barrier material and barrier shape on blast wave
mitigation,” Construction and Building Materials, vol. 120, pp. 54–64, 2016.
R. P. Mayor and R. Flanders, Technical Manual-Simplified computer model of air blast effects
on building walls, Dept of Transportation, Research and Special Programs Administration,
Transportation System Center, Vehicle Crashworthiness Division, Safety and Security System
Division, Kendall Square, Cambridge, MA, USA, 1990.
S. A. Tekalur, A. Shukla, and K. Shivakumar, “Blast resistance of polyurea based layered
composite materials,” Composite Structures, vol. 84, no. 3, pp. 271–281, 2008
S. Aghdamy, C. Wu, and M. Griffith, “Simulation of retrofitted unreinforced concrete masonry
unit walls under blast loading,” International Journal of Protective Structures, vol. 4, no. 1, pp.
S. Ahmad, A. Elahi, H. Pervaiz, A. G. A. Rahman, and S. Barbhuiya, “Experimental study of
masonry wall exposed to blast loading,” Materiales de Construccion, vol. 64, no. 313, 2014.
S. Ahmad, A. Elahi, J. Iqbal, M. A.Keyani, and A. G. A. Rahman, “Impulsive loading on
reinforced concrete wall,” Proceedings of the Institution of Civil Engineers: Structures and
Buildings, vol. 166, no. 3, pp. 153–162, 2013

113
Sherkar, Pushkaraj, Jinwon Shin, Andrew Whittaker, and Amjad Aref. "Influence of charge
shape and point of detonation on blast-resistant design." Journal of Structural Engineering 142,
no. 2 (2015): 04015109
Simoens, Bart, Michel H. Lefebvre, and Fumiyoshi Minami. "Influence of Different Parameters
on the TNT-Equivalent of an Explosion." Central European Journal of Energetic Materials 8, no.
1 (2011): 53-67.
Smith, P. D. (2010). Blast walls for structural protection against high explosive threats: A
review. International Journal of Protective Structures, 1(1), 67-84.)
T. A. Rose and P. D. Smith, “Influence of the principal geometrical parameters of straight city
streets on positive and negative phase blast wave impulses,” International Journal of
T. A. Rose, P. D. Smith, and G. C. Mays, “Design charts relating to protection of structures
against air blast from high explosives,” Proceedings of the Institution of Civil Engineers -
Structures and Buildings, vol. 122, no. 2, pp. 186–192, 1997
T. A. Rose, P. D. Smith, and G. C. Mays, “Effectiveness of walls designed for the protection of
structures against air blast from high explosives,” Proceedings of the Institution of Civil
Engineers: Structures and Buildings, vol. 110, no. 1, pp. 78–85, 1995.
T. A. Rose, P. D. Smith, and G. C. Mays, “Protection of structures against air blast using barriers
of limited robustness,” Proceedings of the Institution of Civil Engineers. Structures and
buildings, vol. 128, no. 2, pp. 167–176, 1998.
T. C. Chapman, T. A. Rose, and P. D. Smith, “Reflected blast wave resultants behind cantilever
walls: a new prediction technique,” International Journal of Impact Engineering, vol. 16, no. 3,
pp. 397–403, 1995
T. Ngo, P. Mendis, A. Gupta, and J. Ramsay, “Blast loading and blast effects on structures – an
overview,” Electronic Journal of Structural Engineering, vol. 3, article 5, 2007.
Unified Facilities Criteria (UFC) 3-340-02, Structures to Resist the Effects of Accidental
Explosions, Department of Defense, Washington, DC, USA, 2008.
US Army, Fundamentals of Protective Design (Non-Nuclear), Department of Army Technical
Manual, TM5-855-1, US Army, Washington, DC, USA, 1965.

114
V. C. Li, “On engineered cementitious composites (ECC),” Journal of Advanced Concrete
Technology, vol. 1, no. 3, pp. 215–230, 2003.
V. Karlos, G. Solomos, and M. Larcher, “Analysis of the blast wave decay coefficient using the
Kingery–Bulmash data,” International Journal of Protective Structures, vol. 7, no. 3, pp. 409–
429, 2016
Wisotski, J., &Snyer, W. H. (1965). Characteristics of blast waves obtained from cylindrical high
explosive charges. Univ of Denver, Denver Res Inst, US Naval Ordnance Lab, Air Ground
Explosions Div, Nov.
Wu, Chengqing, Gianni Fattori, Andrew Whittaker, and Deric John Oehlers. "Investigation of
air-blast effects from spherical-and cylindrical-shaped charges." International Journal of
Protective Structures 1, no. 3 (2010): 345-362
X. Q. Zhou and H. Hao, “Prediction of air blast loads on structures behind a protective barrier,”
International Journal of Impact Engineering, vol. 35, no. 5, pp. 363–375, 2008.
X. Wei and M. G. Stewart, “Model validation and parametric study on the blast response of
unreinforced brick masonry walls,” International Journal of Impact Engineering, vol. 37, no. 11,
pp. 1150–1159, 2010.
Y. Shi, W. Xiong, Z.-X. Li, and Q. Xu, “Experimental studies on the local damage and
fragments of unreinforced masonry walls under close-in explosions,” International Journal of
Impact Engineering, vol. 90, pp. 122–131, 2016.
Y. Su, C. Wu, and M. Griffith, “Mitigation of blast effects on aluminum foam protected masonry
walls,” Transactions of Tianjin University, vol. 14, no. 1, pp. 558–562, 2008.
Z. Baji´c, Determination of TNT equivalent for various explosives [M.S. thesis], University of
Belgrade, Belgrade, Serbia, 2007