performance based monitoring analysis system (pbmas… update 092017.pdf · sd (year 1) for 7...
TRANSCRIPT

PERFORMANCE BASED MONITORING ANALYSIS SYSTEM
(PBMAS)2017 OVERVIEW
KELLY JOSEPH
SPECIAL EDUCATION
ACCOUNTABILITY SPECIALIST
210-370-5664
[email protected] SEPTEMBER 20, 2017

Page 5 of the 2017 PBMAS Manual

DESCRIPTION OF NEW INDICATORS
• These regulations require 98 separate indicators to evaluate districts’ data regarding (a) special education representation [49 indicators]; (b) disciplinary removals [35 indicators]; and © educational placements [14 indicators].

SIGNIFICANT DISPROPORTIONALITY PENALTIES
, any district that exceeds the established thresholds is required to: (a) provide for the review and, if appropriate, revision of the district’s policies procedures and practices; (b) allocate 15% of its PART B funds to be used for comprehensive coordinated early intervening services to serve children in the district, particularly, but not exclusively, children in those groups that were significantly over-identified; and (c) publicly report on the revision to its policies, procedures and practices.

DISCIPLINE INDICATORS IN DATA VALIDATION THIS YEAR
• However, the three discipline indicators from the 2016 PBMAS will need to be replaced with the five integrated
discipline indicators required to implement the new federal regulations. There is insufficient time for those
indicators to be developed and included with the 2017 PBMAS. Instead, the discipline indicators will be
previewed in the 2017 Discipline Data Validation system and then fully integrated into the 2018 PBMAS. The
following table summarizes the impact of the new federal regulations on the SPED PBMAS indicators.

Page 6 of the 2017 PBMAS Manual

2017 PBMAS INDICATOR PREVIEW: SPED
Program Area and Indicator Number
Indicator Name 2016 PBMAS 2017 PBMAS
SPED #1(i-v)
Additional provisions pertaining to this indicator will be covered in the 2017 PBMAS Other System Components preview.
SPED STAAR 3-8 Passing Rate(M, R, S, SS, W)
PLs were assigned based satisfactory student performance and above.
RI but no SA Two years of data
available for analysis
Add SA. Three years of
data available for analysis
Copyright © Texas Education Agency 2017. All rights reserved.
7

2017 PBMAS INDICATOR PREVIEW: SPED
Program Area and Indicator Number
Indicator Name 2016 PBMAS 2017 PBMAS
SPED #2(i-v)
Additional provisions pertaining to this indicator will be covered in the 2017 PBMAS Other System Components preview.
SPED YAE STAAR 3-8 Passing Rate(M, R, S, SS, W)
PLs were assigned based on satisfactory student performance and above.
No RI or SA Three years of
data available for analysis (two years for math)
Add SA. Three years of
data available for analysis
Copyright © Texas Education Agency 2017. All rights reserved.
8

2017 PBMAS INDICATOR PREVIEW: SPEDProgram Area and Indicator Number
Indicator Name 2016 PBMAS 2017 PBMAS
SPED #3(i-iv)
Additional provisions pertaining to this indicator will be covered in the 2017 PBMAS Other System Components preview.
SPED STAAR EOC Passing Rate(M, S, SS, ELA)
PLs were assigned (including ELA) based on satisfactory student performance and above.
Changes to the cut points were implemented.
RI (except ELA) but no SA
Two years of data available for analysis (one year for ELA)
Add RI for ELA. Add SA (except
ELA) Three years of data
available for analysis (two years for ELA)
Copyright © Texas Education Agency 2017. All rights reserved.
9

2017 PBMAS INDICATOR PREVIEW: SPED
Program Area and Indicator Number
Indicator Name 2016 PBMAS 2017 PBMAS
SPED #4 SPED STAAR Alternate 2 Participation Rate
PLs were assigned with RI and SA.
Three years of data available for analysis
No changes
Copyright © Texas Education Agency 2017. All rights reserved.
10

2017 PBMAS INDICATOR PREVIEW: SPED
Program Area and Indicator Number
Indicator Name 2016 PBMAS 2017 PBMAS
SPED #6
Additional provisions pertaining to this indicator will be covered in the 2017 PBMAS Other System Components preview.
SPED Regular Class ≥80% Rate (Ages 6-21)
PLs were assigned based on ages 6-21.
No RI or SA One year of data
available for analysis
SD RO by race/ethnicity was added.
Add RI. Discontinue SD
RO by race/ethnicity.
Two years of data available for analysis
Copyright © Texas Education Agency 2017. All rights reserved.
11

2017 PBMAS INDICATOR PREVIEW: SPED
Program Area and Indicator Number
Indicator Name 2016 PBMAS 2017 PBMAS
SPED #5
Additional provisions pertaining to this indicator will be covered in the 2017 PBMAS Other System Components preview.
SPED Regular Early Childhood Program Rate (Ages 3-5)
PLs were assigned with RI but no SA.
Two years of data available for analysis
Three years of data available for analysis
Copyright © Texas Education Agency 2017. All rights reserved.
12

2017 PBMAS INDICATOR PREVIEW: SPEDProgram Area and Indicator Number
Indicator Name 2016 PBMAS 2017 PBMAS
SPED #7
Additional provisions pertaining to this indicator will be covered in the 2017 PBMAS Other System Components preview.
SPED Regular Class <40% Rate (Ages 6-21)
PLs were assigned based on ages 6-21.
No RI or SA One year of data
available for analysis
SD RO by race/ethnicity was added.
Revise the indicator based on final federal regulations under 34 CFR Part 300, issued by USDE on December 19, 2016.
Assign SD Year 1 PLs based on race/ethnicity.
Add RI to overall component, where two years of data are available.
Copyright © Texas Education Agency 2017. All rights reserved.
13

2017 PBMAS INDICATOR PREVIEW: SPEDProgram Area and Indicator Number
Indicator Name 2016 PBMAS 2017 PBMAS
SPED #8
Additional provisions pertaining to this indicator will be covered in the 2017 PBMAS Other System Components preview.
SPED Separate Settings Rate (Ages 6-21)
N/A New indicator required by final federal regulations under 34 CFR Part 300, issued by USDE on December 19, 2016.
Assign SD Year 1 PLs based on race/ethnicity.
Overall component is Report Only.
Copyright © Texas Education Agency 2017. All rights reserved.
14

2017 PBMAS INDICATOR PREVIEW: SPED
Program Area and Indicator Number
Indicator Name 2016 PBMAS 2017 PBMAS
SPED #9 SPED Annual Dropout Rate (Grades 7-12)
PLs were assigned with RI and SA.
Changes to the cut points were implemented.
No changes
SPED #10 SPED Graduation Rate
PLs were assigned with RI but no SA.
Changes to the cut points were implemented.
No changes
Copyright © Texas Education Agency 2017. All rights reserved.
15

2017 PBMAS INDICATOR PREVIEW: SPED
Program Area and Indicator Number
Indicator Name 2016 PBMAS 2017 PBMAS
SPED #11
Additional provisions pertaining to this indicator will be covered in the 2017 PBMAS Other System Components preview.
SPED Representation
PLs were assigned with RI but no SA.
One integrated indicator based on final federal regulations under 34 CFR Part 300, issued by USDE on December 19, 2016.
Assign SD Year 1 PLs based on race/ethnicity and disability category.
Copyright © Texas Education Agency 2017. All rights reserved.
16

2017 PBMAS INDICATOR PREVIEW: SPED
Program Area and Indicator Number
Indicator Name 2016 PBMAS 2017 PBMAS
SPED #15 SPED Discretionary DAEP Placements
PLs were assigned with RI but no SA.
Second year of Report Only disproportionality rates
MSR was changed to NUM1 ≥30.
Discontinue the indicator.
New SPED discipline indicators based on final federal regulations under 34 CFR Part 300, issued by USDE on December 19, 2016, will be previewed in the 2017 PBM Discipline Data Validation System.
Copyright © Texas Education Agency 2017. All rights reserved.
17

2017 PBMAS INDICATOR PREVIEW: SPED
Program Area and Indicator Number
Indicator Name 2016 PBMAS 2017 PBMAS
SPED #16 SPED Discretionary ISS Placements
PLs were assigned with RI but no SA.
Second year of Report Only disproportionality rates
MSR was changed to NUM1 ≥30.
Discontinue the indicator.
New SPED discipline indicators based on final federal regulations under 34 CFR Part 300, issued by USDE on December 19, 2016, will be previewed in the 2017 PBM Discipline Data Validation System.
Copyright © Texas Education Agency 2017. All rights reserved.
18

2017 PBMAS INDICATOR PREVIEW: SPED
Program Area and Indicator Number
Indicator Name 2016 PBMAS 2017 PBMAS
SPED #17 SPED Discretionary OSS Placements
PLs were assigned with RI but no SA.
Second year of Report Only disproportionality rates
MSR was changed to NUM1 ≥30.
Discontinue the indicator.
New SPED discipline indicators based on final federal regulations under 34 CFR Part 300, issued by USDE on December 19, 2016, will be previewed in the 2017 PBM Discipline Data Validation System.
Copyright © Texas Education Agency 2017. All rights reserved.
19

PBMAS Before Final Regulations USDE Final Regulations10 Indicators Evaluating Placement, Discipline, and Representation
98 Indicators Evaluating Placement,Discipline, and Representation
Range of Performance Levels Pass/Fail SD Thresholds
Copyright © Texas Education Agency 2017. All rights reserved.
20 PBMAS VS. USDE FINAL REGULATIONS: SUMMARY OF MAJOR DIFFERENCES

PBMAS Before Final Regulations USDE Final RegulationsContinuous Improvement Planning (if PL 3)
Financial penalty if any one of the 98 indicators’ threshold missed; must review, and if appropriate, revise policies, procedures, and practices; must publicly report on the revision of policies, procedures, and practices
Copyright © Texas Education Agency 2017. All rights reserved.
21 PBMAS VS. USDE FINAL REGULATIONS: SUMMARY OF MAJOR DIFFERENCES
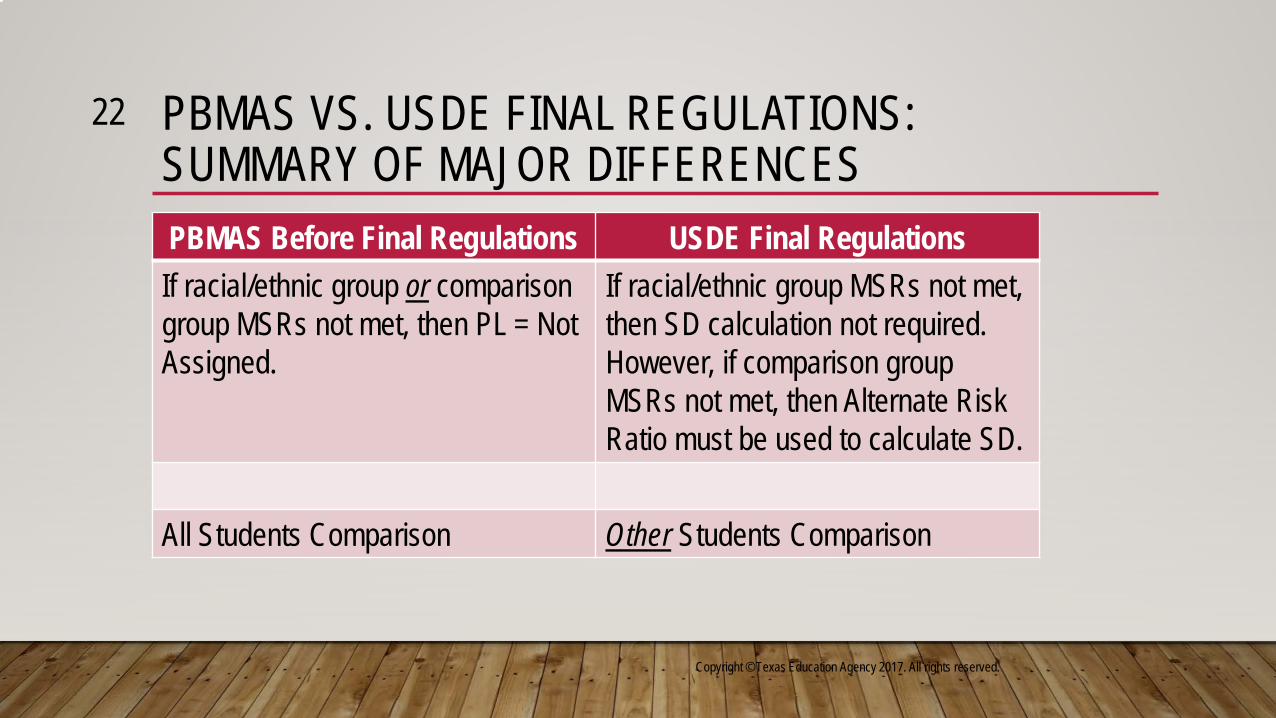
PBMAS Before Final Regulations USDE Final RegulationsIf racial/ethnic group or comparison group MSRs not met, then PL = Not Assigned.
If racial/ethnic group MSRs not met, then SD calculation not required. However, if comparison group MSRs not met, then Alternate Risk Ratio must be used to calculate SD.
All Students Comparison Other Students Comparison
Copyright © Texas Education Agency 2017. All rights reserved.
22 PBMAS VS. USDE FINAL REGULATIONS: SUMMARY OF MAJOR DIFFERENCES

PBMAS Before Final Regulations USDE Final Regulations
Disproportionality Rate Risk Ratio/Alternate Risk Ratio
Required Improvement if Improvement from Prior Year to Current Year Sufficient in Relation to a Subsequent Year
Reasonable Progress Only if Improvement in EACH of TwoConsecutive Prior Years in Relation to Current Year
Copyright © Texas Education Agency 2017. All rights reserved.
23
PBMAS VS. USDE FINAL REGULATIONS: SUMMARY OF MAJOR DIFFERENCES

Copyright © Texas Education Agency 2017. All rights reserved.
24 PBMAS VS. USDE FINAL REGULATIONS: SUMMARY OF MAJOR DIFFERENCES
PBMAS Before Final Regulations USDE Final Regulations
In representation indicators, exclusions were applied for Hospital Class, State Supported Living Centers, Residential Care and Treatment Facilities, and Regional School for the Deaf.
Only court-ordered students placed in Residential Facilities or Group Homes can be excluded from representation indicators.

By July 1, 2018,states must identify districts that
are subject to the federal sanctions (based on any one of the 98
indicators).Copyright © Texas Education Agency 2017. All rights reserved.
25 TIMELINE

Two Options: A district that has SD for any of the 98 indicators in 2018 is
subject to the federal sanctions.
or
A district that has SD for the same indicator in both* 2017 and 2018 and does not meet Reasonable Progress is subject to the federal sanctions.
Copyright © Texas Education Agency 2017. All rights reserved.
26 TIMELINE
*After 2018, this option can include three years.

2017 PBMAS 2018 PBMAS
SD (Year 1) for 7 <40% indicators
SD (Year 1) for 7 Separate Settings indicators
SD (Year 1) for 49 Representation indicators
SD (Year 1) for 35 Discipline indicatorso 2015-2016 Data
SD (Year 2)o 2016-2017 Data
SD (Year 1)o 2016-2017 Data
SD (Year 2) for each of 98 indicators
RP (Year 2) for each of 98 indicators
SD (Year 1) for each of 98 indicators
Copyright © Texas Education Agency 2017. All rights reserved.
27DRAFT TIMELINE
2017 PBM Discipline Data Validation
Red font indicates districts are under federal sanctions.
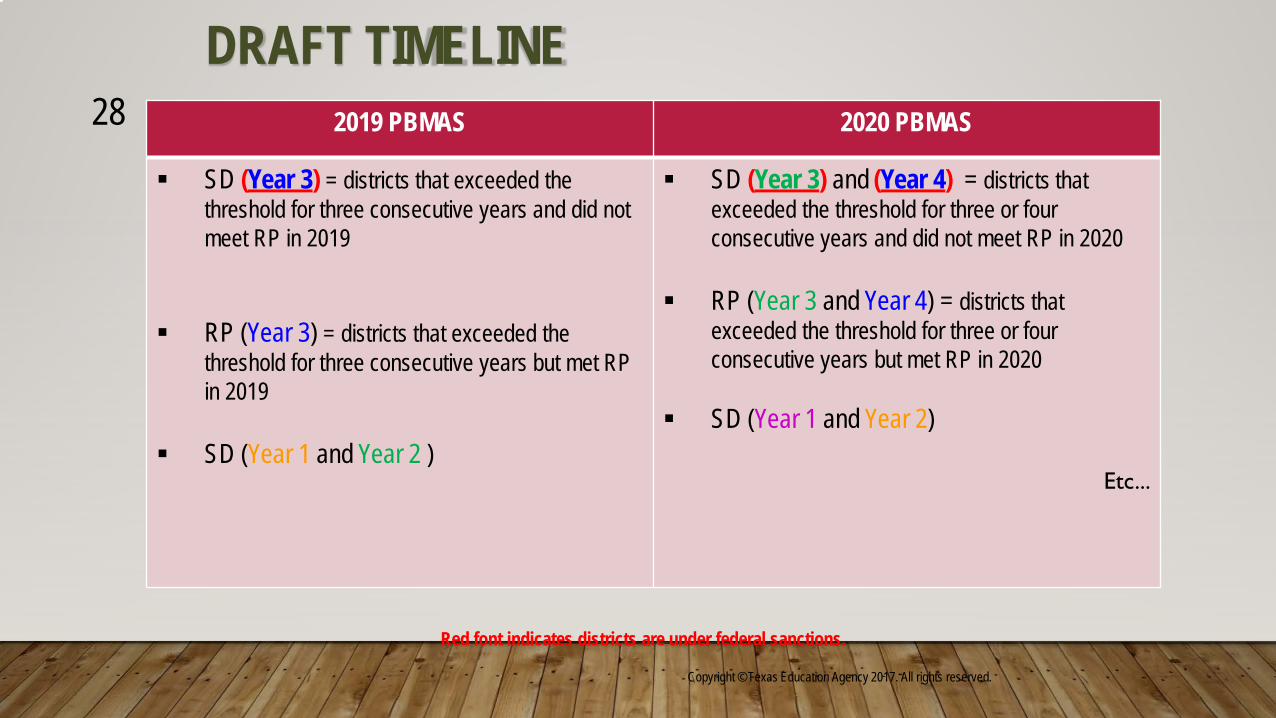
2019 PBMAS 2020 PBMAS
SD (Year 3) = districts that exceeded the threshold for three consecutive years and did not meet RP in 2019
RP (Year 3) = districts that exceeded the threshold for three consecutive years but met RP in 2019
SD (Year 1 and Year 2 )
SD (Year 3) and (Year 4) = districts that exceeded the threshold for three or four consecutive years and did not meet RP in 2020
RP (Year 3 and Year 4) = districts that exceeded the threshold for three or four consecutive years but met RP in 2020
SD (Year 1 and Year 2)
Etc...
Copyright © Texas Education Agency 2017. All rights reserved.
28
Red font indicates districts are under federal sanctions.
DRAFT TIMELINE

• Promote equity in IDEA.
• Help states meaningfully identify districts with significant disproportionality.
• Ensure children with disabilities are properly identified for services.
• Address the well-documented and detrimental over-identification of certain students for special education services.
• Source: Federal Register/Vol. 81, No. 243/December 19, 2016, p. 92376.
Copyright © Texas Education Agency 2017. All rights reserved.
29 STATED PURPOSE OF USDE’S REGULATORY ACTION

• PBMAS has historically included three discipline indicators that evaluate the placement of students with disabilities compared to the placement of all students in:
• Disciplinary Alternative Education Programs (DAEP)• In-School Suspension (ISS)• Out of School Suspension (OSS)
• They will be discontinued beginning with the 2017 PBMAS, and 35 new discipline indicators will be developed as a result of the final regulations.
Copyright © Texas Education Agency 2017. All rights reserved.
30 DISCIPLINE INDICATORS

Indicator Numbers Indicator Name1 – 7 Out-of-School Suspensions and Expulsions ≤10 Days
(for Seven Race/Ethnic Groups)8 – 14 Out-of-School Suspensions and Expulsions >10 Days
(for Seven Race/Ethnic Groups)15 – 21 In-School Suspensions ≤10 Days
(for Seven Race/Ethnic Groups)22 – 28 In-School Suspensions >10 Days
(for Seven Race/Ethnic Groups)29 – 35 Total Disciplinary Removals, Including ISS, OSS, expulsions, removals by
school personnel to an interim alternative education setting, and removals by a hearing officer(for Seven Race/Ethnic Groups)
Copyright © Texas Education Agency 2017. All rights reserved.
31 DISCIPLINE INDICATORS

We are unable to develop the 35 indicators for inclusion in the 2017 PBMAS.
Instead, we plan to develop them for inclusion in 2017 PBM Discipline Data Validation.
As part of that release, we will identify SD Year 1 districts (based on 2015-2016 data), SD Year 2 districts (based on 2016-2017 data), and SD Year 1 districts (based on 2016-2017 data).
All of those results will subsequently be incorporated into, and reported a second time, in the 2018 PBMAS.
Copyright © Texas Education Agency 2017. All rights reserved.
32 DISCIPLINE INDICATORS

After that, all the SD indicators will continue to be incorporated into, and reported through, each year’s PBMAS.
Additional information about the progress of the new discipline indicators will be shared at a future time.
See also DRAFT TIMELINE slides.
Copyright © Texas Education Agency 2017. All rights reserved.
33 DISCIPLINE INDICATORS

The federal regulations are very prescriptive. There are only four components where states have some degree of flexibility:
1. Consecutive Years2. Minimum Size Requirements3. Thresholds4. Reasonable Progress
Copyright © Texas Education Agency 2017. All rights reserved.
34 LIMITED OPTIONS AVAILABLE UNDER THE FEDERAL REGULATIONS
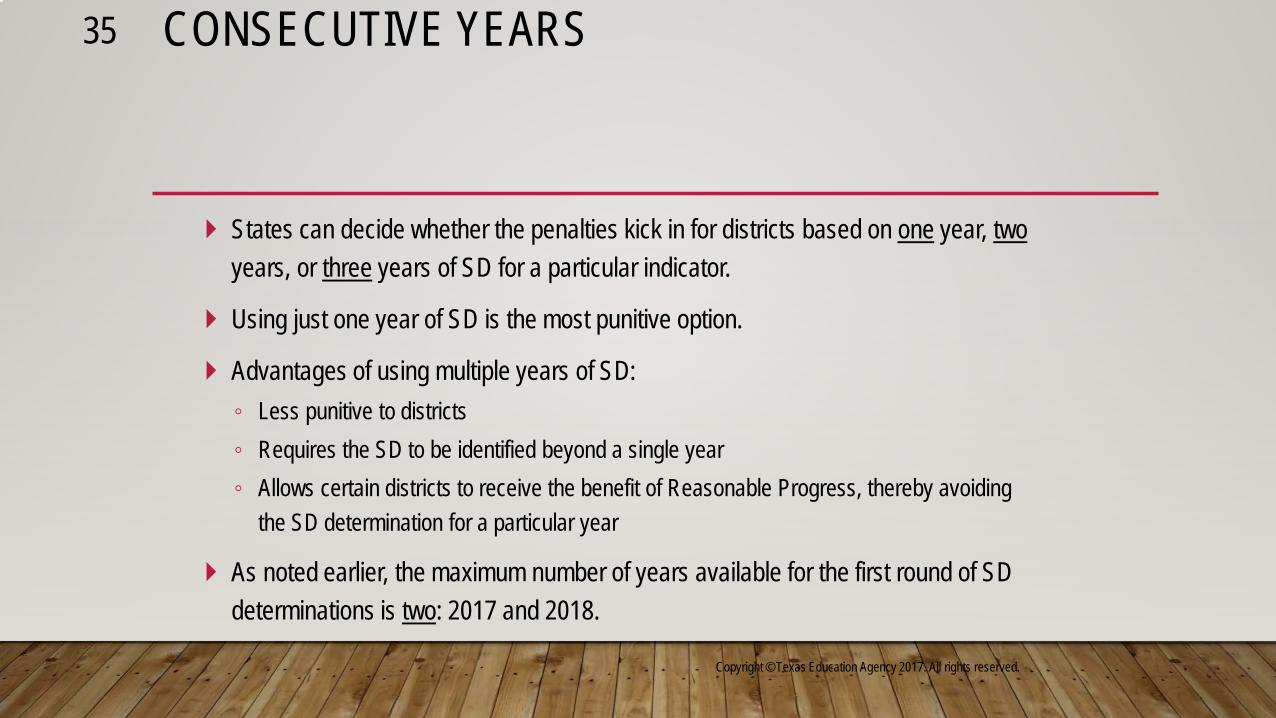
States can decide whether the penalties kick in for districts based on one year, twoyears, or three years of SD for a particular indicator.
Using just one year of SD is the most punitive option.
Advantages of using multiple years of SD:◦ Less punitive to districts◦ Requires the SD to be identified beyond a single year◦ Allows certain districts to receive the benefit of Reasonable Progress, thereby avoiding
the SD determination for a particular year
As noted earlier, the maximum number of years available for the first round of SD determinations is two: 2017 and 2018.
Copyright © Texas Education Agency 2017. All rights reserved.
35 CONSECUTIVE YEARS

States have the option to apply MSRs on the calculations’:◦ Two numerators (N1 and N2) and ◦ Two denominators (D1 and D2)
Please refer to Slide 72.
Copyright © Texas Education Agency 2017. All rights reserved.
36 MINIMUM SIZE REQUIREMENTS

For the first calculation shown (Risk Ratio = 6.3)◦ N1 is 240 and D1 is 950 (i.e. the race/ethnic group)◦ N2 is 100 and D2 is 2,506 (i.e., the other students group)
Per the federal regulations, if the race/ethnic group MSR (N1 or D1) not met, then the district is not evaluated for SD.
However, if N1/D1 MSR are met but N2 or D2 MSR not met, then the STATE N2 and D2 must be used to evaluate the district for SD. This is called the Alternate Risk Ratio.
Copyright © Texas Education Agency 2017. All rights reserved.
37 MINIMUM SIZE REQUIREMENTS

The federal regulations state that N1/N2 MSR of 10 and D1/D2 MSR of 30 are “presumptively reasonable.”
The federal regulations require states that chose MSRs that are not presumptively reasonable to include a detailed explanation of why the alternative MSRs chosen are reasonable and how they help ensure an appropriate analysis for SD.
Copyright © Texas Education Agency 2017. All rights reserved.
38 MINIMUM SIZE REQUIREMENTS

The threshold refers to the risk ratio number that states will use to assign SD.
Any district that exceeds that threshold will be identified as SD (either Year 1, Year 2, Year 3, etc.)
If the state decides to implement Reasonable Progress (RP), a district may avoid the federal sanctions that would otherwise kick in (or continue) for a particular year - as long as it meets RP for all indicators where it exceeded the established thresholds.
Copyright © Texas Education Agency 2017. All rights reserved.
39 THRESHOLDS
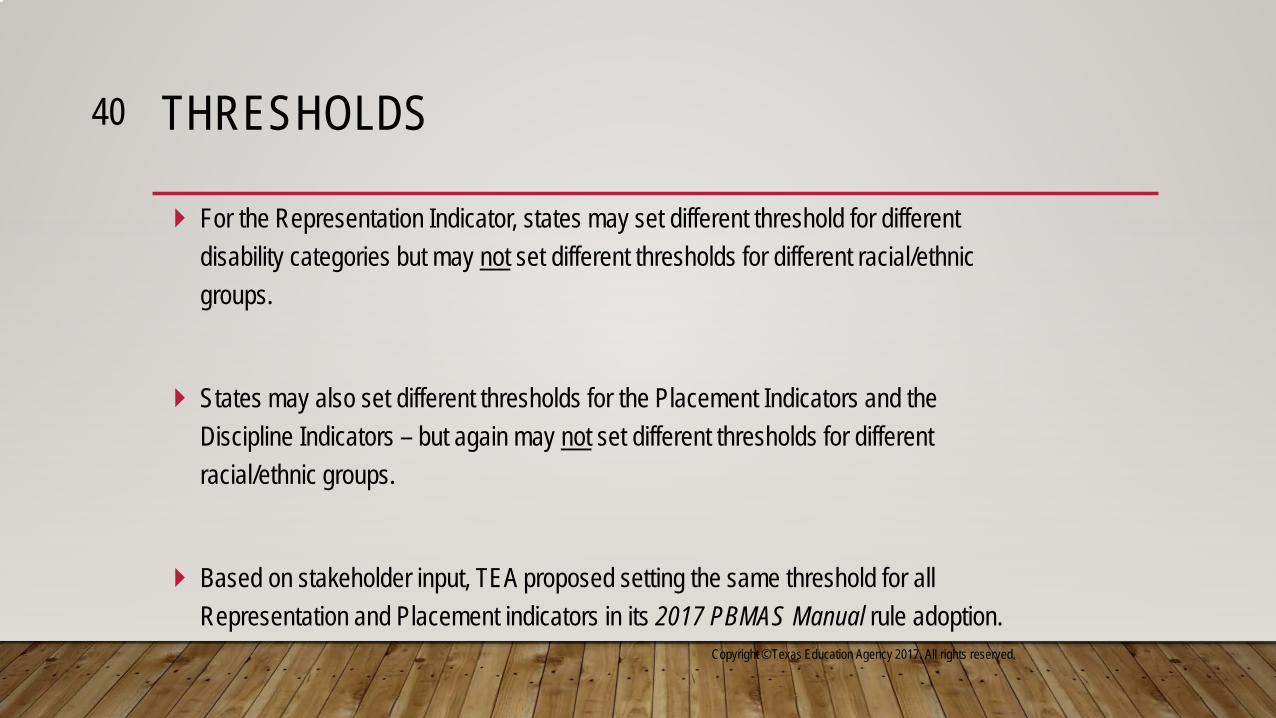
For the Representation Indicator, states may set different threshold for different disability categories but may not set different thresholds for different racial/ethnic groups.
States may also set different thresholds for the Placement Indicators and the Discipline Indicators – but again may not set different thresholds for different racial/ethnic groups.
Based on stakeholder input, TEA proposed setting the same threshold for all Representation and Placement indicators in its 2017 PBMAS Manual rule adoption.
Copyright © Texas Education Agency 2017. All rights reserved.
40 THRESHOLDS
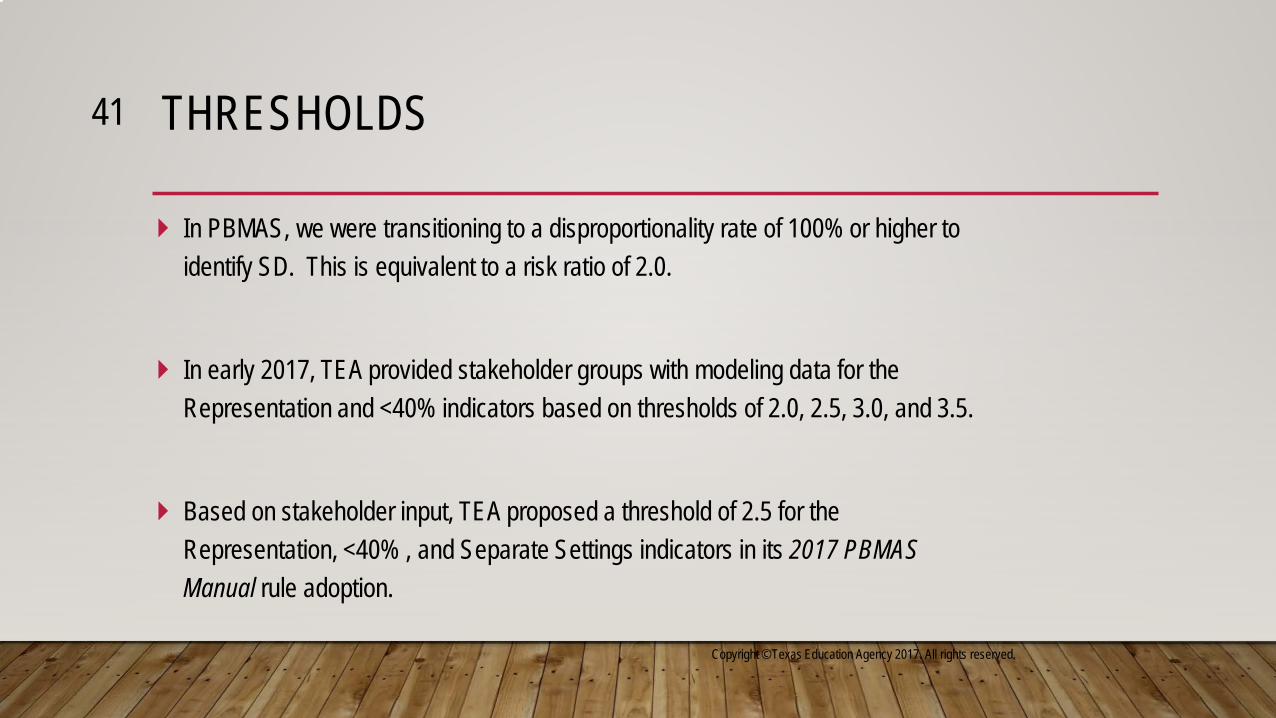
In PBMAS, we were transitioning to a disproportionality rate of 100% or higher to identify SD. This is equivalent to a risk ratio of 2.0.
In early 2017, TEA provided stakeholder groups with modeling data for the Representation and <40% indicators based on thresholds of 2.0, 2.5, 3.0, and 3.5.
Based on stakeholder input, TEA proposed a threshold of 2.5 for the Representation, <40% , and Separate Settings indicators in its 2017 PBMAS Manual rule adoption.
Copyright © Texas Education Agency 2017. All rights reserved.
41 THRESHOLDS

TEA has not yet proposed any thresholds for the 35 new discipline indicators required by the federal regulations.
Development on those indicators will occur in the fall.
See Slides 76 and 77.
Copyright © Texas Education Agency 2017. All rights reserved.
42 THRESHOLDS

Copyright © Texas Education Agency 2017. All rights reserved.
43
THRESHOLDSIndicator Category Allowable Thresholds
Representation• (7 indicators – one for each race/ethnic group)
1 threshold
Representation • (42 indicators – 6 disability categories x 7
race/ethnic groups)
Up to 6 (1 for each disability category)
Placement• (7 <40% indicators – one for each race/ethnic
group)
1 threshold
Placement• (7 separate settings indicators – one for each
race/ethnic group)
1 threshold
Discipline• (35 indicators – 5 disciplinary removals x 7
race/ethnic groups)
Up to 5(1 for each type of disciplinary removal)

§300.647(d)(2): A State is not required to identify a district for significant disproportionality until…the district has exceeded the risk ratio threshold and has failed to demonstrate reasonable progress.
Reasonable Progress is lowering the risk ratio in each of two consecutive prior years.
The State does not have the option to postpone a finding of SD if the district has only achieved a decrease over a multiple year period.
Copyright © Texas Education Agency 2017. All rights reserved.
44 REASONABLE PROGRESS
Copyright © Texas Education Agency 2017. All rights reserved.
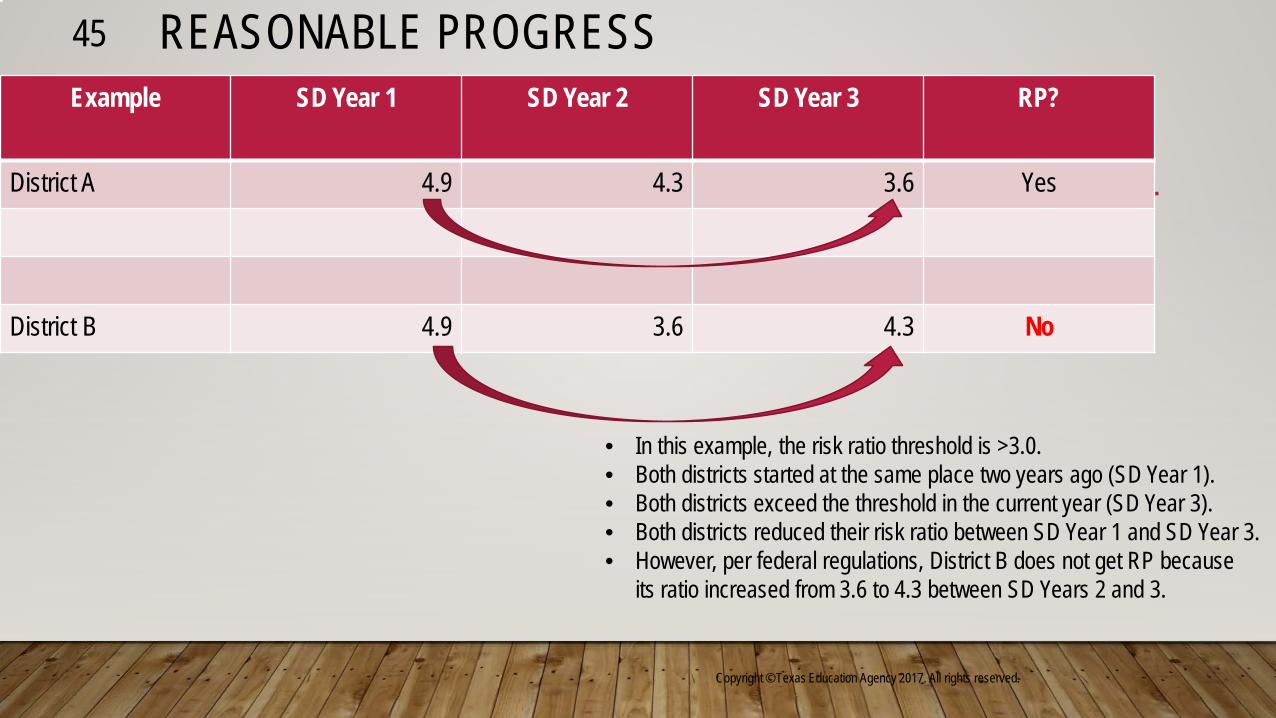
45 REASONABLE PROGRESSExample SD Year 1 SD Year 2 SD Year 3 RP?
District A 4.9 4.3 3.6 Yes
District B 4.9 3.6 4.3 No
• In this example, the risk ratio threshold is >3.0.• Both districts started at the same place two years ago (SD Year 1).• Both districts exceed the threshold in the current year (SD Year 3).• Both districts reduced their risk ratio between SD Year 1 and SD Year 3.• However, per federal regulations, District B does not get RP because
its ratio increased from 3.6 to 4.3 between SD Years 2 and 3.

More information, including a proposal for calculating Reasonable Progress, will be shared at a future time.
We believe our PBMAS Required Improvement calculation is a valid and meaningful calculation, and we will continue to explore how/if we can incorporate it into a Reasonable Progress calculation.
Based on the parameters of federal requirements, however, it is unlikely that as many districts will receive RP as typically receive RI in PBMAS.
Copyright © Texas Education Agency 2017. All rights reserved.
46 REASONABLE PROGRESS

Separate Handouts:
Sample District Report Guide to Examples
SD Excerpt #1 SD Excerpt #2
Copyright © Texas Education Agency 2017. All rights reserved.
4
2017 PBMAS SAMPLE DISTRICT REPORTS

2107 PBM TRAINING SESSIONS (ESC20)
• Performance-Based Monitoring Analysis System (PBMAS)
October 26, 2018 Session being rescheduled
(session # 42810)
• Performance-Based Monitoring Analysis System (PBMAS)
November 9, 2017 8:30am-3:30pm
(session # 43081)

ACCOUNTABILITY MONITORING INTERVENTION GUIDANCE AND RESOURCES
District IR and PBMAS Pacing Guide found on the page linked below
http://tea.texas.gov/Student_Testing_and_Accountability/Monitoring_and_Interventions/Program_Monitoring_and_Interventions/Accountability_Monitoring_Intervention_Guidance_and_Resources/
2017 PBMAS Manual found on the page linked below
http://tea.texas.gov/pbm/PBMASManuals.aspx