performance based management systempdf.usaid.gov/pdf_docs/pnadc718.pdfperformance based management...
TRANSCRIPT

KOSOVO
CLUSTER AND BUSINESS SUPPORT PROJECT
Performance Based Management System
Contract # AFP-I-00-03-00030-00, TO# 800
Submitted to: USAID/Kosovo
Cognizant Technical Officer: Timothy Hammann
Prepared by: Michelle Adams-Matson
Submitted by: Chemonics International Inc.
Submitted: March 31, 2005

SECTION I
Introduction
A. Program Description The Kosovo Cluster and Business Support (KCBS) program seeks to expand the competitiveness of targeted clusters by promoting private sector-driven market initiatives, increasing institutional capacity for competitiveness, structuring a results-oriented, sustainable public-private competitiveness dialogue and supporting development of an enabling environment for broad-based economic growth through expanded trade.
Initially, KCBS will look at formation of business-driven economic clusters in the livestock (dairy-beef-poultry-feed), fruits and vegetables, and construction materials industries. The KCBS program builds on previous USAID-sponsored work performed under the Kosovo Business Support activity and supports USAID-funded activities implemented by Bearing Point, RTI International and others.
The overarching goal of KCBS program is accelerated private sector growth. To achieve this goal, KCBS works through two intermediate results:
• Increased Competitiveness of Targeted Clusters • Improved Business Operating Environment
The KCBS program is focused on the creation of new sustainable jobs. This is achieved by promoting increased growth and competitiveness among enterprises in the targeted clusters, and growth and expansion of the clusters. Within each target cluster, KCBS business development advisors will initially work wherever there are opportunities to expand sales and jobs.
KCBS also seeks to increase the capacity of enterprises to conduct business and help make the policy environment more conducive to business growth. By applying proven market-driven approaches that will strengthen the competitiveness of enterprises and target clusters, KCBS will accelerate the creation of sustainable jobs, the growth of enterprise sales, financing and investments, and hasten the formation and emergence of strong industry clusters. This results-oriented, market-driven focus also will stimulate public sector reforms and investments to enhance the enabling environment for business. Rapidly growing sales lead to accelerated job creation and increased access to short- and long-term financing and investment resources. Increasing numbers of rapidly growing enterprises in a target industry stimulates, from the bottom-up, formation and emergence of industry clusters. Competitive industry clusters offer tremendous advantages to firms, industries, and Kosovo business in general, in terms of expanding international market linkages, increasing productivity, and accelerating export sales. Rapidly growing enterprises and industry clusters also spur real demand for effective, quality business development services, thus enhancing the viability of the services sector. KCBS will assist industry cluster organizational partners, such as associations, think tanks, universities, workforce organizations, and government agencies, to support the emergence of competitive industry clusters. They will assist emerging cluster working groups, as well as specific organizational partners, in developing and implementing strategic plans, action plans, increasing operating revenues, forging effective linkages among enterprises and other industry cluster partners, and fostering increased government commitment to each industry cluster. The cluster strategy is implemented through an action plan, which defines the roles of various actors and sets forth targets, activities and timelines.
The stages KCBS will pass through in developing Kosovo Competitiveness are elaborated in the table of Annex A.
PERFORMANCE BASED MANAGEMENT SYSTEM PAGE 1 OF 41

B. Performance Management Monitoring progress and evaluating results are key management functions in any performance-based management system. Performance monitoring is an on-going process that allows managers to determine whether or not a program or activity is making progress towards its intended results. Performance information plays a critical role in planning and managing decisions. The strength of a performance-based management system (PBMS) lies in its ability to provide performance information that is used to manage for results and to improve project performance.
Evaluation is the periodic assessment of a project’s relevance, performance, efficiency, and impact—both expected and unexpected—in relation to stated objectives. Evaluation helps to identify effects that are attributable to the program.
This document presents the KCBS PBMS that will provide the foundation for tracking the project’s delivery of expected results and quantitative impacts to measure progress. It supports USAID/Kosovo’s performance management needs by providing input to the mission’s strategic objective (SO) 1.3 and associated intermediate result (IR) indicators.
The overall goal of this system is to establish a means of providing critical information for decision-makers to assist them in guiding implementation of project activities towards attainment of project objectives. This goal recognizes that specific elements of the implementation program may require adjustment to respond to evolving conditions either within or external to the project. Hence, the system is a management tool for systematically reviewing project progress, troubleshooting problems and issues during project implementation, and assessing areas where project activities may need to be refocused to ensure plans, schedules, and assignments remain current. Also, where there are real successes or new opportunities beyond what was contemplated, management decisions can be made to channel more resources into these growth areas.
The implementation of the PBMS will involve the entire KCBS technical and management team. This is necessary for several reasons:
• Efficiency. KCBS technical specialists and advisors have first-hand knowledge of activities and immediate results in their areas of intervention, and are best suited to collect, supervise the collection of, and verify basic data in their technical areas.
• Ownership. The PBMS belongs to the entire team. This will ensure that the set of information generated is relevant and consistent with the interests of the entire team and KCBS partners.
• Feedback. Having collected and analyzed performance information, KCBS technical team members will have first-hand information on project progress and will be able to use that information to guide program implementation.
The KCBS Organizational Structure is shown here on Exhibit 1.
PERFORMANCE BASED MANAGEMENT SYSTEM PAGE 2 OF 41

Exhibit A. Staffing Plan for Kosovo CBS
PERFORMANCE BAS
Administrative Support Team
Operations Manager Klara Bokshi
IT Specialist Ilir Doci
Finance Manager Sadete Kastrati
Administrative Assistant
Tuba Breca Translators
Linda Muqolli Ajazi Fitore Muçolli
Receptionist Sadete Pllana
Maintenance Assistant
Vehbi Shkodra
Cleaning Assistant Fatmire Sadiku
Drivers Sami Grajçevci Ekrem Zeqiri
Gani Zabergja Adnan Colakovic
Cluster & Enterp
Dairy-Beef-Poultry-Animal Feed Cluster
Fruit nstructions erial Cluster
Senior Cluster Advisor
Peter Dickrell
Senior Cluster
M
Senior Cluster
Dairy-Beef Specialist Zijadin Gojnovci Fru
Muh
Poultry-Animal Feed Specialist Ilir Zenelaj
VegetaRes
Animal Feed Specialist
Techical Support Unit
Communications Specialist
Xheraldina Rexhepi
Grants (SAF) Manager Skender Rama
Performance Management Special t
Nazmi Pllana
Sale evelopment
Senior es & Marketing ecialist
Ro n Herchak
Chemon
DiEric
MaChelsea
MaLaura H
General Business Support Team
Senior Competitivness and Association Advisor
Richard O’Sullivan
Policy, Advocacy & Association Specialist
Mentor Thaci Safo Musta
Business Support Service Specialist
Naim Avdiu
is
ics Home Office Project Management Unit
rector Howell
Communications Advisor Karen Byrne
nager Heffernan
Grants Advisor Douglas Petrie
nager arrington
Associate Lisa Fackler
ED MANAGEMENT SYSTEM PAGE 3 OF
Milazim Makolli
Meat Specialist Arben Musliu
II. Short Term Tech
Crimson Capital Other
Vesna Golubovic Qazim Pirana
41
Advisor att Tokar
Advisor TBD
it Specialist amed Disha
Construction Specialist
Valdet Osmani
ble Specialist hat Ajvazaj
Wood Processing Specialist
Burim Meqa
nical Assistance, training, Local Grants and Subcontracts
IFDC The Services Group
Marketing & Sales Specialist
Musli Berisha
s D
SalSpma
rise Development Team
and Vegetable Cluster
CoMat
USAID/KOSOVO
Chief of Party
Martin Wood


SECTION II
Performance Based Management System
A. Developing the System The users of the PBMS include project staff, partners, collaborators, clients, USAID, as well as the host government. Therefore, establishing an effective performance measurement system requires developing an understanding and agreement among all stakeholders of the project as to what is to be achieved and how performance management will be reviewed. Hence, where appropriate, KCBS will involve stakeholders in the implementation and use of the system and subsequent performance reviews.
PBMS implementation began with the teambuilding workshop in Pristina on November 4-5, 2004, when the KCBS team reached consensus on the project’s technical approach. The consensus strategies to achieve each intermediate result were described in detail in the 2005 Work Plan. KCBS team refined its PBMS design throughout November 2004 and took into account USAID/Kosovo’s strategic plan. This led to the final draft of the indicators presented in the first draft of the PBMS report dated November 29, 2004.
During January 2005, KCBS continued to search for the most effective approach to enhance enterprise-level competitiveness in Kosovo. This led to the proposed adoption of proven approaches applied on USAID projects in Peru, Paraguay, and most recently Armenia, to facilitate market linkages and accelerate enterprise sales. On these projects, rapidly growing sales led to accelerated job creation and increased access to short- and long-term financing and investment resources. Rapidly growing enterprises and industry clusters also spurred real demand for effective, quality business development services, thus enhancing the viability of the services sector.
The 2005 Work Plan identifies many activities which serve to strengthen the supply side of the clusters e.g. implementation of standards, improved productive capacities, assistance with access to credit. Such strengthening is a prerequisite for competent supply, and all these activities will move in parallel with a focused assault on the demand side. But KCBS is convinced that the achievement of USAID’s overarching objective will only come through accelerating and increased sales. This will be our focus. Within each target industry, KCBS advisors will initially work wherever there are opportunities to expand sales and jobs. These advisors, in effect, will function as sales agents by communicating buyers’ product specifications and delivery schedules, and assisting in negotiating price and contracts to help shape supply to meet demand. KCBS will draw upon local and international experts to provide specialized technical assistance.
By applying proven market-driven approaches that will strengthen the competitiveness of enterprises and target industries, KCBS will accelerate the creation of sustainable jobs, the growth of enterprise sales, financing and investments, and hasten the formation and emergence of strong industry clusters. This results-oriented, market-driven focus also will stimulate public sector reforms and investments to enhance the enabling environment for business.
PBMS monitors progress against program targets, facilitates reporting of results attributable to KCBS efforts, and provides data for reporting to USAID. Most important, it identifies successful enterprise and industry clients, interventions, and consultants, and allows the team to compare projected results to actual results on a monthly, quarterly, and annual basis.
PERFORMANCE BASED MANAGEMENT SYSTEM PAGE 5 OF 41

B. Results Framework The KCBS Results Framework, presented in Exhibit 2, forms the basis for the KCBS approach to implementation of PBMS. The framework provides the guide for organization structure, work planning, and results monitoring.
USAID/Kosovo’s strategic objective SO 1.3 — Accelerated Private Sector Growth — is the Program goal for KCBS. To achieve this goal, KCBS works towards two intermediate results:
• IR 1.3.1 Increased Competitiveness of Targeted Clusters • IR 1.3.2 Improved Business Operating Environment
The US Government has obligated USAID to report annually to Congress on its progress towards achieving these results. The Government has specified three indicators against which KCBS must report as a measure of progress. These are:
• Exports as a percentage of imports • Jobs created within targeted clusters • Number of companies registered
To help manage activities and results, KCBS has further defined sub-IRs, as shown in the results framework and described in the Work Plan. [It is noted that the 2005 Work Plan was submitted before this PBMS Report was reissued; a changed emphasis in the program approach has led to a reconsideration of the sub-IRs to be monitored]. To capture the impact of KCBS interventions on Kosovo’s competitiveness, we have identified a list of life-of-project impact indicators for each project intermediate result. The indicators are designed to:
• Capture major project impacts, • Supply information concerning major activities undertaken through KCBS
technical assistance, • Provide a picture of implementation progress, and • Contribute to USAID’s own performance management needs.
The KCBS PBMS will collect data and measure the impact of activities directly implemented by KCBS and its partners. This principle of manageable interest ensures that the results reported by the KCBS PBMS can be plausibly associated with project interventions.
KCBS will also monitor certain national production and export statistics for correlation of trends between measurable project impacts and national-level performance.
In this section, we present our approach to performance management, including a discussion of how indicators are selected, collected, stored, analyzed, and results reported.
In Section III, we discuss performance indicators, including definitions, units of measure, collection methods, report frequency, and responsible parties.
C. KCBS Results Indicators Rather than measuring program effectiveness by quantifying inputs or intermediate outputs, such as training, workshops and participants, KCBS will emphasize measuring the program’s impacts. Indicators were selected because they represent accurate, measurable, verifiable results, which can be attributed to KCBS’ efforts and serve to enhance program management. Exhibit B summarizes the indicators that are proposed and have been vetted with USAID.
PERFORMANCE BASED MANAGEMENT SYSTEM PAGE 6 OF 41

KCBS will also track developments and achievements, though not necessarily in quantified terms, of other results. The narrative portion of various reports will provide analysis of the trends and highlights of successes or constraints. In addition, KCBS will provide specific examples of successes, where applicable.
Annex B of this report includes detailed descriptions of each indicator, including definition, unit of measure, desegregation, justification, collection method, data sources, frequency of reporting, responsible parties, and life-of-project [LOP] targets. In some cases, a note regarding the type of information that should be included in the accompanying narrative is included.
D. KCBS Results Targets As shown in Annex B, we have established LOP targets for the indicators based on best available information at the start of KCBS. The reasonableness of the targets will be verified and ground-truthed after baseline data has been collected. It may become necessary to revise these LOP targets after this process is complete. Some targets are currently expressed as a range that will be refined when baselines are completed. Any modifications to LOP targets will be reported with the first annual report submission in October 2005, after which no significant changes in targets are anticipated.
It is important to note that the proposed enterprise-level targets refer to client enterprise results, and will therefore be solid, and their attribution to KCBS activities will be verifiable. Results reported will also be conservative in that they do not take into account the dynamic multiplier effects that most certainly reach beyond client enterprises and their suppliers. Industry-level results also refer to efforts accomplished by partner organizations in target clusters, so KCBS will verify these impacts directly as well.
Additionally, the indicators as well as the associated life-of-project (LOP) targets are selected based on the following basic assumptions:
• No major agro-climatic shocks to commodity systems where KCBS intervenes; nor are there economic dislocations such as major pest outbreaks, plant diseases, or other epidemics in the commodity groups.
• Absence of socio-political instabilities, including political and civil instabilities. • General macro-economic stability.
• Ability to gather data in the northern region of Kosovo.
• Ability of business associations to maintain data on their member enterprises.
If these assumptions do not hold true, then KCBS will have to reexamine the PBMS to make appropriate revisions and adjustments.
PERFORMANCE BASED MANAGEMENT SYSTEM PAGE 7 OF 41

Exhibit B
USAID/KCBS Performance Management Plan
IR.1.3.1 Increased Competitiveness of Targeted Clusters (1) Total sales among targeted enterprises
(2) Jobs created among targeted enterprises - AR (2)
(3) Labor Productivity among targeted enterprises
IR 1.3.2 Improved Business Operating Environment (1) Number of companies registered - AR (3)
(2) The Business Environment Index
Sub-IR 1.3.2.1 Strengthened Business Consulting Services (1) Number of businesses using business consulting services
Sub-IR 1.3.2.2 Improved Capacity for Policy Dialogue (1) Statistical strategy established by associations
(2) Number of cluster specific indices produced
Sub-IR 1.3.1.1 Improved Productive Capacity of Private Enterprises
(1) Value of Capital Investment among targeted enterprises
Sub-IR 1.3.1.2 Improved Quality Control (1) Number and type of standards approved by target associations
Sub-IR 1.3.1.3 Strengthened Capacity to Access Credit
(1) Value of financing among targeted enterprises
Sub-IR 1.3.2.3 Business Associations Responsive to Client Needs (1) Number of associations with approved strategic plans
(2) Value of non-donor revenues generated by the associations
(3) Number of associations employing non-volunteer staff
SO 1.3 Accelerated Private Sector Growth (1) Value of company profit taxes collected
(2) Exports as a Percentage of Imports - AR (1)
PERFORMANCE BASED MANAGEMENT SYSTEM PAGE 8 OF 41

SECTION III
Monitoring and Evaluation Process
A. Key M&E staff. The KCBS team is organized into four main units—Cluster and Enterprise Development, General Business Support, Technical Support, and Administrative Support (see Exhibit 1). While these units are grouped by functional categories, members from all four units will be involved in all components of the project. This is an integrated approach where team members with different skills come together to work in teams formed around different clusters and different sub-objectives. Consequently all units share responsibilities for maintaining and updating the performance management database.
The three senior cluster advisors will have overall responsibility for results within their respective clusters; the senior competitiveness and association advisor will likewise have responsibility for results within the general business support unit. These senior advisors will oversee PBMS system operations for their respective units and will ensure that data is collected in a timely, consistent and accurate manner. The PBMS Specialist is responsible for assembling input from the various members, synthesizing the indicators from various data elements, and providing overall quality control.
The PBMS Specialist is responsible for Monitoring and Evaluation; he manages the PBMS database, inputs and updates data, and produces reports on project results. This specialist works with the three cluster teams and the business services support team to:
• identify and assist client firms; • record, store, and verify results data; and • determine whether results are attributable to project activities.
B. Client Enterprise Business Planning. When cluster advisors identify a new client enterprise, they develop a business plan with that firm. For enterprises, the business plan is developed on a simple template that identifies the name of the client, type of business, and the product – see Annex C. It further identifies the principle bottlenecks or obstacles to expanding sales and entering new markets, as well as a proposed strategy for overcoming those bottlenecks. In addition, it lays out the commitments of the firm and the KCBS advisor.
The business plan is the central document on which the relationship between the project, the enterprise, and project intervention is based. It diagnoses the client firm’s key problems and identifies a strategy for KCBS intervention. The business plan also has implications for the attribution of results in that causality analysis is based largely on the bottlenecks and intervention strategies identified in the business plan. The KCBS advisor submits the business plan to the PBMS Specialist, to ensure that:
• The bottlenecks identified are the real obstacles hindering the firm’s activities; • The proposed strategy will actually address and remedy those bottlenecks;
and • The proposed activities follow the strategy prescribed in the business plan.
PERFORMANCE BASED MANAGEMENT SYSTEM PAGE 9 OF 41

C. Organizational Partner Business Planning. When KCBS identifies a new organizational partner, specifically a business association, KCBS will jointly work to develop a simpler, but comprehensive, business plan. Using an organizational business plan as the basis for KCBS assistance emphasizes a professional, businesslike approach to improving the performance of organizational partners in each industry cluster and their need to use professional management tools to enhance their productivity and competitiveness. A business plan for each organizational partner ensures that it has clear programmatic and financial objectives and that KCBS assistance is targeted to help each partner achieve specific, measurable goals. KCBS assistance will be spelled out in the business plan and results measured against target improvements.
D. Other indicators for industry competitiveness. The indicators for cluster strategic development and public sector commitments (reforms and investments) are straightforward. Each depends on results achieved in the key activity areas by cluster working groups and public sector entities, with KCBS assistance - see Annex B for detailed descriptions. They will be monitored directly by industry competitiveness team specialists responsible for each activity area. The component team leader will monitor the overall development of each industry cluster, including implementation of strategic and work plans.
E. Establishing baselines. Once an enterprise or organizational business plan is approved, the KCBS advisor works with the client or organization to establish baseline data. For enterprises, baseline data is relative to jobs, sales, production, financing, and investments, and each quarter the business advisor will collect data for monitoring purposes. For partner organizations, this is relative to revenues generated, including those from dues and from services and goods delivered. The KCBS advisor is responsible for entering the baseline data into the KCBS database. The PBMS Specialist reviews this information, assures its quality, and uses it for inclusion in quarterly and annual reports to USAID. Initial baseline data is recorded for the period just prior to implementation of activities that contribute to achievement of results, enabling comparison when measuring progress toward a specific result or objective. The baseline provides a snapshot of a performance indicator as a point of reference. Baseline data is specific to each product supported. The KCBS advisor, aided by a business services support team member, collects baseline data for jobs, sales, financing, investment, and production. KCBS will utilize a two-page form for recording enterprise baseline data, Annex D, which records general information about the client, product or service, unit of measure, stage in the value chain (production, processing, “commercialization,” or other services), and the date the baseline data was recorded. In addition, it captures the value of sales, the volume of production, and the unit price of sales for the specific product or service for each of the preceding 12 months.
F. Reporting Quantitative and Qualitative Enterprise Results. Monthly reports focus on the activity level and include: an executive summary of current activities, a presentation of major problems, recommendations for solving problem and responsible party, a summary of progress against workplan benchmarks, and anticipated activities for the coming month.
PERFORMANCE BASED MANAGEMENT SYSTEM PAGE 10 OF 41

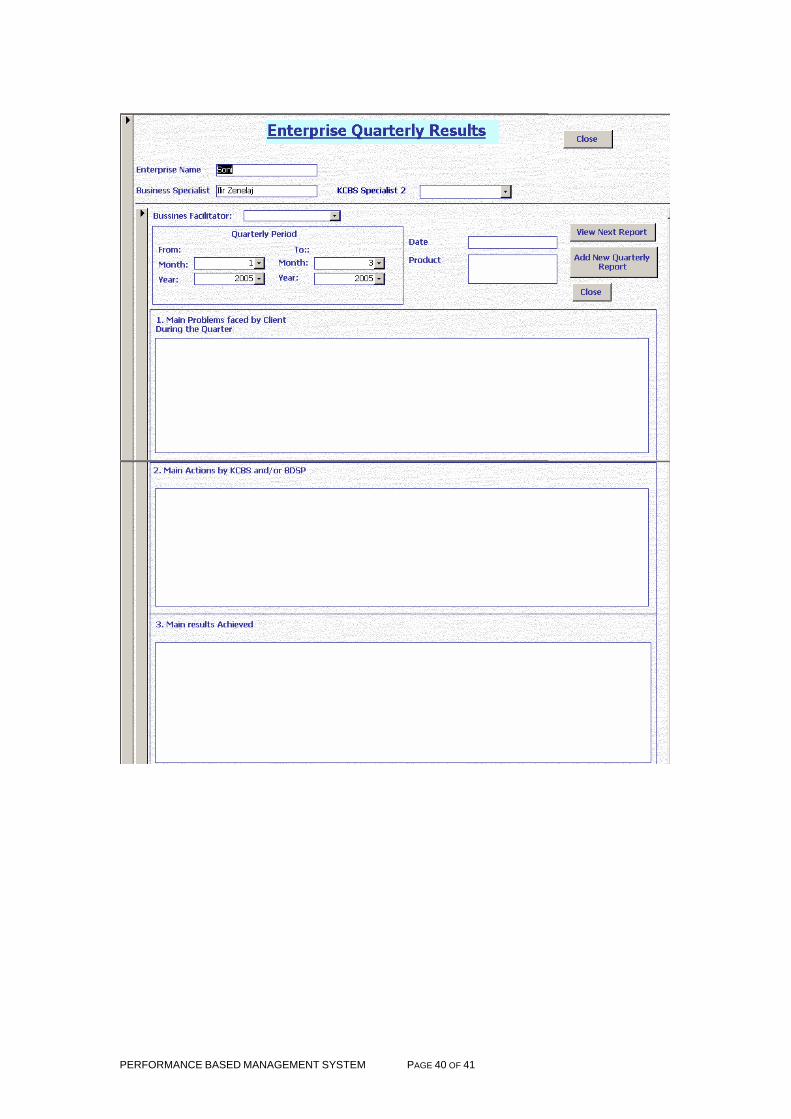
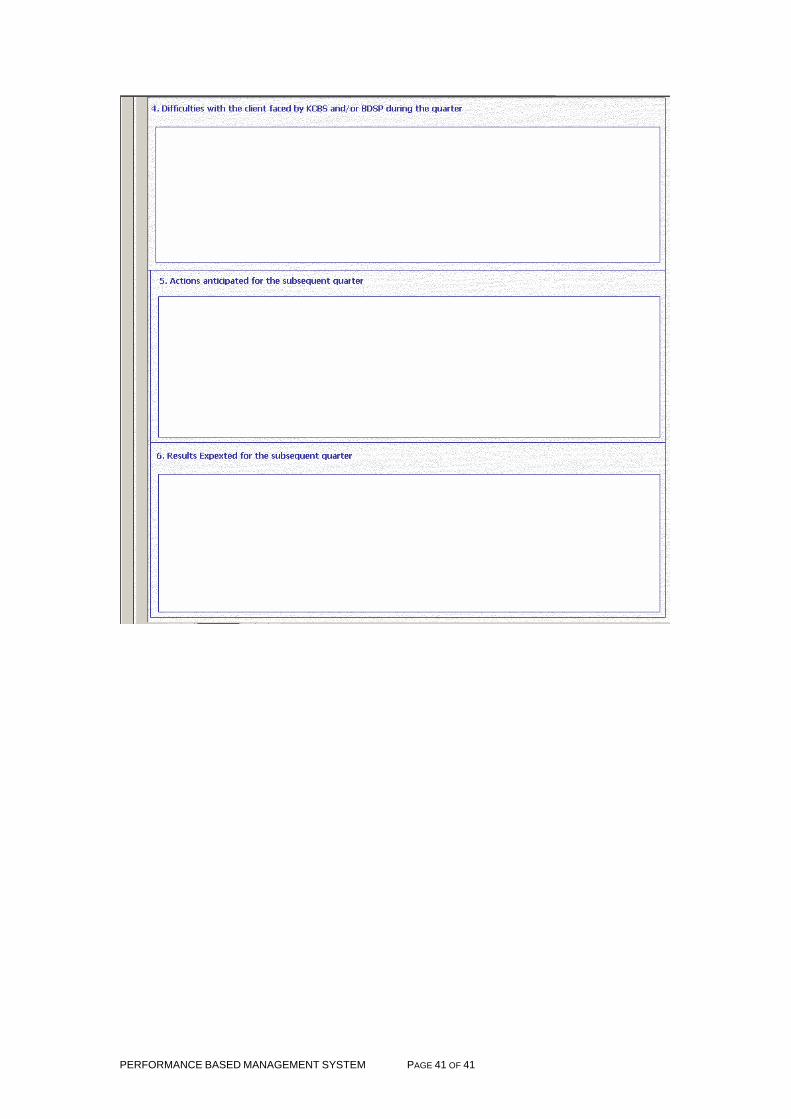
Once the first attributable enterprise results are achieved, KCBS advisors submit quarterly reports to PBMS Specialist for entry into the database. The quarterly report is a prepared on a form, Annex E, which records the value of sales for the month, the unit price of sales, the production volume, and the amount of financing and investment by clients and upstream processors during the month. A separate quarterly report is submitted for each client, and for each product supported by the project. This information is preliminary, and results are not reported externally until they are verified. Annex E also lists the key problems faced by the enterprise client during the quarter, key actions taken by KCBS, and key results achieved. It also contains the amount spent on technical assistance (e.g., external consultants) for the client during the quarter, any difficulties KCBS had with the client, and planned activities and expected results for the next quarter.
The monthly and quarterly client reports from the business advisors, and semi-annual reports from partner organizations, feed into KCBS reports to USAID. It should be noted that there must be a balance between data collection and technical work. KCBS has designed the system such that it will not become a data collection burden for project staff and partners. Care was taken to eliminate indicators that are not indicative of project impact or performance. KCBS will employ appropriate information technology in implementation to ease the burden of data entry and management. Where applicable, KCBS support staff will participate in data collection and entry to relieve technical staff of these tasks. Alternatively, KCBS may subcontract the tasks to a local consultant reporting directly to the PBMS Specialist – see paragraph K. below.
G. Quality Control The senior cluster advisors are best placed to provide first-order quality control for the various data elements. Upon completion of the data entry spreadsheets, each team will examine the quantitative data to identify common errors including logical inconsistencies, out-of-range values, significant departures from trends, or other errors. Should any problem be identified, the senior cluster advisors are responsible for verifying data against original sources and other forms of verification that may be required, such as cross-verification from alternate data sources. These quality checks shall be performed before data is forwarded to the PBMS Specialist.
H. Database Design. KCBS will develop a specialized database to track and report results. The database will be a back-end, data entry system used for inputting information and generating reports. It records information about the client enterprises, products or services, the name of the KCBS lead advisor, baseline data, and the monthly figures for jobs, sales, production, financing, and investment. The database will be adapted to meet the specific needs of KCBS, recording and sorting information by client, product, industry, and jobs (gender disaggregated).
I. Data Verification. The PBMS Specialist conducts site visits and interviews representatives from the client enterprises and organizational partners to verify the results that have been reported. This includes verifying the accuracy and consistency of the data reported by the business advisors or industry-level specialists, the intervention strategy of KCBS, and the causal relationship between the results and KCBS interventions. Based on these visits, the PBMS Specialist may request clarifications from the business advisor, enterprise client or organizational partner, and may find it necessary to modify information in the database. Any modifications are done with the
PERFORMANCE BASED MANAGEMENT SYSTEM PAGE 11 OF 41

review and approval of the component team leaders. The PBMS Specialist then incorporates any updated information into the global version of the database and generates final, verified reports.
Since in most cases, KCBS advisors are not expected to have access to the client’s financial records, traditional auditing is not anticipated. Rather, the PBMS Specialist verifies results by interviewing the owner or manager or organizational director, and asking a series of questions, such as:
• What kind of support have you received from KCBS? • What are the problems or obstacles hindering the growth of your business or
organization? • Which problems have you tried to resolve with the help of KCBS? • How could the support you are receiving be improved? • What was the value of your enterprise sales or organizational revenues
before KCBS intervention and what is their value with KCBS assistance?
The client enterprise or organization provides and confirms sales or revenue figures in writing. The information should be crosschecked. If necessary, data can be confirmed with the buyer, or if products are exported, data can be crosschecked against customs records. After each client or partner visit, the PBMS Specialist reports to the KCBS lead advisor on the individuals and clients and partners visited.
J. Causality and Attribution. In addition to verifying the accuracy and consistency of the results reported by the KCBS advisor, the PBMS Specialist also must determine whether the results were caused by KCBS’s interventions and whether they are attributable to the project. During interviews with clients, the PMBS Specialist documents KCBS’s intervention strategy, specific activities undertaken to assist the client or partner, and effects on enterprise sales or organizational revenues, in order to determine causality.
As mentioned above, the determination of causality is based almost entirely on the business plan. The business plan is the key document on which KCBS interventions are based. It is a diagnosis of the client enterprise or organizational partner, identifying the principal bottlenecks hindering a firm’s expansion or organization’s viability, as well as the KCBS strategy for resolving those bottlenecks. It also lists the commitments and proposed activities of both the client and KCBS. The business plan essentially establishes the parameters and conditions for the attribution of results. First, the bottlenecks it identifies must actually be the principal obstacles to the firm’s or organization’s expansion. Next, the proposed intervention strategy must actually address and remedy those bottlenecks. Finally, the activities undertaken by KCBS must follow the strategy prescribed in the business plan and contribute to overcoming the bottlenecks. If KCBS’s intervention meets the above criteria — that is, if it follows the strategy laid out in the business plan and contributes to overcoming bottlenecks — the results are attributable.
It should be noted that the PBMS goal is not to obtain absolute proof of causality, nor to reject the results reported by business advisors or industry specialists. The PBMS Specialist seeks to verify arguments that allow KCBS to attribute results to their interventions. These arguments are objective, and more often than not the PBMS Specialist accepts them, provided the necessary conditions are met. The PBMS Specialist has the final say when there is uncertainty as to the attribution of results; but such decisions are made by consensus with the cluster team leaders and COP.
K. Subcontract with Local Business Consultant KCBS has considered entering into a subcontract with a local business consultant, who will work under the direction of the PBMS Specialist, to:
PERFORMANCE BASED MANAGEMENT SYSTEM PAGE 12 OF 41

1. collect baseline data at enterprises and partner organizations as they are identified;
2. build capacity at partner organizations to improve the quality and validity of performance data they provide to KCBS;
3. verify periodically performance results; and
4. conduct competitiveness surveys.
However, the issue of client confidentiality may preclude such an arrangement. Whereas KCBS enjoys the confidence of our clients [indeed, openness in sharing data is a precondition for KCBS’s intervention], such openness may be withheld from an independent consultant. Initially, data collection will remain the responsibility of the KCBS team, but the situation will be reviewed as the Program progresses.
L. Reporting and Review KCBS will provide four performance-based management reports annually, corresponding to the fiscal year for USAID:
• a quarterly report, which will be due within 10 business days of the end of the quarter; and
• an annual report due within 10 business days of the end of the preceding year
The Quarterly Reports to USAID consist primarily of a compilation of verified results data from KCBS’s client enterprise reports. The Annual Report not only expresses the year’s jobs, sales, financing, investment, and productivity results in quantitative terms, it also compiles information from the quarterly client reports to describe the difficulties or problems encountered throughout the year and actions undertaken to overcome them.
The Annual Report will contain in-depth analysis of annual progress, updated benchmarks and targets achieved, discussions of progress and hurdles, and presentation of success stories, lessons learned, and best practices. The report will provide quantitative data, such as the year’s jobs, sales, financing, investment, and productivity results. There will be written narratives covering major achievements during the reporting period and/or major obstacles that hamper project implementation. A certain amount of anecdotal information will also be provided where applicable. Managers will provide quantitative spreadsheets and narrative text to the performance management specialist for compiling the project-wide performance report.
In addition to quarterly and annual reports, KCBS will generate periodic internal performance updates between reporting periods. The Chief of Party will review these updates with team members regularly. If the interim results indicate the need to refocus implementation activities or update program strategies, the Chief of Party will work with USAID/Kosovo to effect those changes.
PERFORMANCE BASED MANAGEMENT SYSTEM PAGE 13 OF 41

Annex A
The Stages to Kosovo Competitiveness
PERFORMANCE BASED MANAGEMENT SYSTEM PAGE 14 OF 41

The Stages to Kosovo Competitiveness
Subsector Transformation Competitiveness Framework Subsector Positions Defined
• Market requirements defined • SWOT analysis carried out • Comparative advantages determined • Target markets and products identified • Private and public sector actors profiled • Value chain and linkages profiled • Pre-cluster activity defined • Preliminary opportunities identified • Economic baselines established
Stage 1
Framework Assessed
• Subsector policy/legal/regulatory frameworks mapped
• Review of programs completed • Assessment of position carried out • Update of programs carried out • Assessment of capacities carried out • Assessment of subsector associations carried out • Subsector association profiles prepared
Enterprise Action Plans Developed
• Private sector caucuses held • Private sector champions identified • Business expansion targets set • SWOT analysis carried out • Business expansion plan defined • Cluster requirements identified • Cluster formation meetings held
Stage 2
Framework Strategy Developed
• Subsector association roles defined • Cluster strategy reviewed and upgraded • Plan for upgrading competitiveness framework
prepared • Communications requirements assessed • Communications program developed • Association support programs defined • Legal/regulatory issues identified
Cluster Action Plans Developed
• Cluster members recruited • Roles in cluster defined • Cluster management and leadership appointed • Cluster strategy developed and negotiated • Implementation/action plan in place • MOU signed by cluster members • Cluster monitoring and reporting system
developed and operational
Stage 3
Capacities Expanded
• Baselines incorporated into PBMS monitoring framework
• Communications program installed in initial participating organizations
• Capacity to analyze and report on competitiveness increased
• Competitiveness capacities of key public sector agencies expanded
• National awareness program developed
Cluster Plans Implemented
• Technical support provided • Market linkages expanded • Regular meetings supported • Resources leveraged • Business partnerships developed and
supported
Stage 4
Framework Strengthened
• Standards, certification, quality, branding programs developed and supported
• Trade, regulatory issues constraining subsector growth addressed
• National awareness program implemented • Focal point for competitiveness established • Partnerships expanded
Clusters Sustained
• Cluster sustainability plans developed and implemented
• New clusters emerging based on KCBS model • Regular media coverage provided for all cluster-
initiated activities
Stage 5
Framework Sustained
• Clusters operational within firm focal point for competitiveness initiatives
• Subsector associations provide support services as part of sustainability strategies
• Private sector platform developed fully by members
PERFORMANCE BASED MANAGEMENT SYSTEM PAGE 15 OF 41

Annex B
Provisional KCBS Results Indicators
Annex B provides descriptions of the performance indicators for KCBS. Some indicators may be refined during the work plan review and after the stakeholders’ workshops to be held during the first six months. Some targets may be reviewed and changed once all the baselines have been established.
PERFORMANCE BASED MANAGEMENT SYSTEM PAGE 16 OF 41

SO 1.3 Accelerated Private Sector Growth Indicator (1): Value Company Profit Taxes Collected – Kosovo wide Definition: Profit taxes from all businesses in Kosovo will be included in this
indicator. Company Profit Taxes as defined by Regulation No. 2002/03 of the Ministry of Finance and Economy. The profit tax is currently 20% of taxable profit; profit tax is not imposed on businesses with turnover of less than €50,000.
Unit of Measure: Euros. Disaggregated by: Cluster Justification: Increased growth of the private sector will result in increased
production, sales, and profit resulting in increased business taxes paid by cluster firms. Taxes collected are a measure of the application by enterprises of transparent reporting using International Accounting Standards, and the Government’s commitment to collection. This indicator provides an overview of whether businesses are becoming a part of the more formal economy—one of the objectives of the program. Taken together with the other indicators in the PMP, such as sales and jobs created, it provides a good sense of whether there is accelerated private sector growth. This indicator also assumes that tax collection will become more effective.
Collection Method: Data is obtained from the Ministry of Finance and Economy by the
PBMS specialist. Data Sources: Ministry of Economy and Finance, Tax Administration Dept. Data collected from year to year using a consistent collection process
maintained by the Ministry. Timing/Frequency: Annual data collection and reporting. Responsible Parties: KCBS PBMS specialist. LOP Targets: € 43,800,000;
The targets were agreed in discussions with USAID in preparing its PMP during September 2004. The figure for year 2003 was €28,412,404; USAID set a baseline target for 2004 of €34,100,000. Subsequent years’ targets were set as follows:
2004 (B): €34,100,000
2005: €38,200,200
2006: €40,500,000
2007: €42,100,000
2008: €43,800,000
PERFORMANCE BASED MANAGEMENT SYSTEM PAGE 17 OF 41
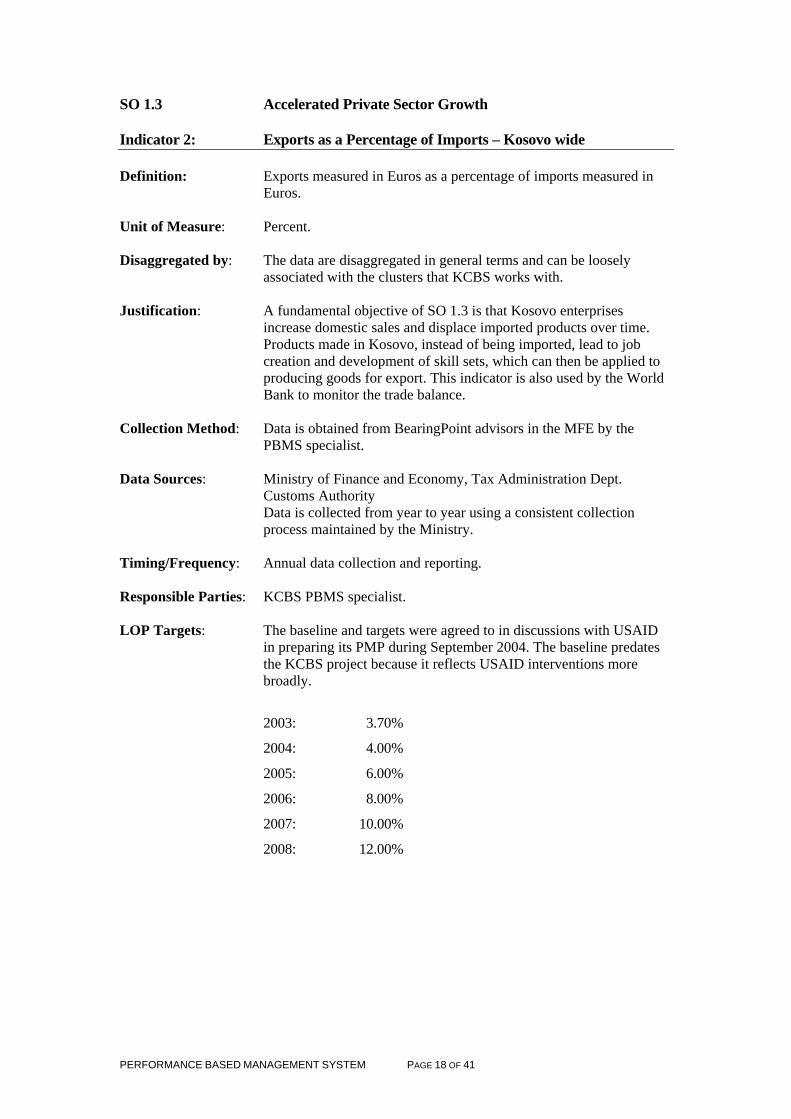
SO 1.3 Accelerated Private Sector Growth Indicator 2: Exports as a Percentage of Imports – Kosovo wide Definition: Exports measured in Euros as a percentage of imports measured in
Euros. Unit of Measure: Percent. Disaggregated by: The data are disaggregated in general terms and can be loosely
associated with the clusters that KCBS works with. Justification: A fundamental objective of SO 1.3 is that Kosovo enterprises
increase domestic sales and displace imported products over time. Products made in Kosovo, instead of being imported, lead to job creation and development of skill sets, which can then be applied to producing goods for export. This indicator is also used by the World Bank to monitor the trade balance.
Collection Method: Data is obtained from BearingPoint advisors in the MFE by the
PBMS specialist. Data Sources: Ministry of Finance and Economy, Tax Administration Dept. Customs Authority Data is collected from year to year using a consistent collection
process maintained by the Ministry. Timing/Frequency: Annual data collection and reporting. Responsible Parties: KCBS PBMS specialist. LOP Targets: The baseline and targets were agreed to in discussions with USAID
in preparing its PMP during September 2004. The baseline predates the KCBS project because it reflects USAID interventions more broadly.
2003: 3.70%
2004: 4.00%
2005: 6.00%
2006: 8.00%
2007: 10.00%
2008: 12.00%
PERFORMANCE BASED MANAGEMENT SYSTEM PAGE 18 OF 41

IR.1.3.1 Increased Competitiveness of Targeted Clusters Indicator 1: Total Sales among targeted enterprises Definition: Value of goods and services sold during the year is measured as gross
business sales. It is an aggregate of all participating business sales related to the cluster over a given period. This is measured for enterprises that receive KCBS assistance directly or through the SAF.
Unit of Measure: Euros Disaggregated by: Cluster Domestic and export markets Justification: Sales are the key measure of enterprise growth. Rapid increase in
sales growth is the primary factor leading to rapid increases in job creation. Sales growth is a key indicator of the economic health and competitiveness within targeted industry clusters.
Increases in income and investment within targeted industry clusters,
as well as increases in the market share of Kosovar products locally and abroad, are reflected in increases in sales.
Collection Method: Data collected by KCBS cluster specialists and reviewed and
randomly verified by PBMS specialist. Data Sources: Action plans, regularly updated, from individual client enterprises
assisted by KCBS directly or through the SAF. Timing/Frequency: Data is collected and reported on a quarterly basis. Responsible Parties: KCBS cluster specialists and advisors, Business Services Support team members, KCBS PBMS specialist. LOP Targets: Increase over Baseline of 25%. Baseline will be confirmed the first
time the data are collected.
2005 (B): TBD (2nd Quarter FY05)
2005: 5.0% (by end of FY05)
2006: 10.0%
2007: 17.5%
2008: 25.0%
Note: Baseline is currently being collected by KCBS and will be available at the end of the 2nd quarter (in April). Without knowing the finite value of baseline sales at the time of preparing this PMBS, and recognizing that as new enterprises are added to the portfolio throughout the program, new baselines will be registered, it is not possible to quantify this percentage increase in sales. However, using another benchmark of €10,000 in sales per FTE job created, a LOP Target for increased sales has been set of €50,000,000
PERFORMANCE BASED MANAGEMENT SYSTEM PAGE 19 OF 41

IR.1.3.1 Increased Competitiveness of Targeted Clusters Indicator 2: Jobs Created among targeted enterprises Definition: Full-time equivalent jobs in micro, small, medium and large
enterprises resulting from direct KCBS assistance or through the Strategic Activities Fund (SAF).
Person-days of employment, converted to annual full-time equivalent
- FTE jobs using 225 days of labor/year. Full-time employment includes people who have employment
(whether hired or self-employed) that is long-term and work 40 or more hours per week.
Part-time employment includes people who are hired for a longer
period of time to work less than 40 hours per week. Seasonal employment includes people who are hired for short periods of time e.g., through the summer, working a different number of hours each day/week.
Unit of Measure: Number of jobs. Disaggregated by: Cluster Full time and Part time Gender Justification: This is a key measure of success for the KCBS Program.
Employment growth is a key indicator of the economic health and competitiveness of an industry.
Collection Method: Data collected by KCBS cluster advisors, and reviewed and
randomly verified by PBMS specialist. Data Sources: Action plans, regularly updated, from individual client enterprises
assisted by KCBS directly or through the SAF. Timing/Frequency: Data collection and reporting on a quarterly basis. Responsible Parties: KCBS cluster specialists and advisors, KCBS PBMS specialist. LOP Target: The target of 5,000 additional FTE jobs in enterprises where KCBS
has intervened has been set on the basis of €4,000 of program costs per FTE job. Baseline is 0 just prior to project start up, because the universe is “KCBS-assisted” enterprises.
2004(B): 0
2005: 400
2006: 1,000
2007: 3,000
2008: 5,000
PERFORMANCE BASED MANAGEMENT SYSTEM PAGE 20 OF 41

IR.1.3.1 Increased Competitiveness of Targeted Clusters Indicator 3: Labor productivity in targeted enterprises Definition: Decreasing labor involvement in producing same value of sales in
micro, small, medium and large enterprises, resulting from direct KCBS assistance or through the SAF.
Unit of Measure: FTE days per €100,000 of sales. Disaggregated by: Cluster Justification: Measurable productivity gains demonstrate the growing
competitiveness of target clusters as well as the improved productive capacity and direct investment in enterprises. Increased productivity measures the overall capacity and ability of firms to become more competitive by adopting modern practices and innovating in order to increase sales value and reduce costs.
Collection Method: Data collected by KCBS advisors, and independently reviewed
and randomly verified by PBMS specialist. Data Sources: Action plans, regularly updated, from individual enterprises
assisted by KCBS directly or through the SAF. Timing/Frequency: Data is collected and reported on an annual basis. Responsible Parties: KCBS cluster specialists and advisors, KCBS PBMS specialist. LOP Targets: 20% overall improvement in productivity at enterprises where
KCBS has intervened. Baseline is currently being collected for “KCBS-assisted” enterprises (i.e. the first reporting period establishes the baseline).
2005 (B): TBD (2nd Quarter FY05)
2005: 5% (by end of FY05)
2006: 10%
2007: 15%
2008: 20%
Note: In addition, where the enterprise produces a single product, or few products, whose quality is maintained over time, and whose units of measure remain consistent, KCBS will monitor improved productivity by measuring reductions in costs of production
PERFORMANCE BASED MANAGEMENT SYSTEM PAGE 21 OF 41

IR.1.3.1. 1 Improved Productive Capacity of Private Enterprise Indicator 1: Value of Capital Investment within Targeted Enterprises Definition: Increased capital investment by, and in micro, small, medium and
large enterprises resulting from direct KCBS assistance or through the SAF.
Unit of Measure: Euros. Disaggregated by: Cluster industries Loan pay back periods Justification: Capital investment is a key measure of enterprise growth.
Growing amounts of investment by, and in, enterprises reflect increasing enterprise activity and a growing confidence in future business opportunities. Additionally, investment growth is a good indicator of the economic health and competitiveness of an industry.
Collection Method: Data collected by KCBS advisors, and independently reviewed
and randomly verified by PBMS specialist. Data Sources: Business plans, regularly updated, from individual enterprises
assisted by KCBS directly or through the SAF. Timing/Frequency: Quarterly data collection and reporting. Responsible Parties: KCBS cluster specialists and advisors, KCBS PBMS specialist. LOP Target: The target of €5,000,000 in capital investments at enterprises
where KCBS has intervened has been set on the basis of investment being 1/10 of additional sales – for which LOP target is €50,000,000. Baseline is set at 0 because the “universe” is defined as “KCBS-assisted” enterprises.
2005 (B): TBD (2nd quarter FY05)
2005: €1,500,000 (by end of FY05)
2006: €3,000,000
2007: €4,000,000
2008: €5,000,000
PERFORMANCE BASED MANAGEMENT SYSTEM PAGE 22 OF 41
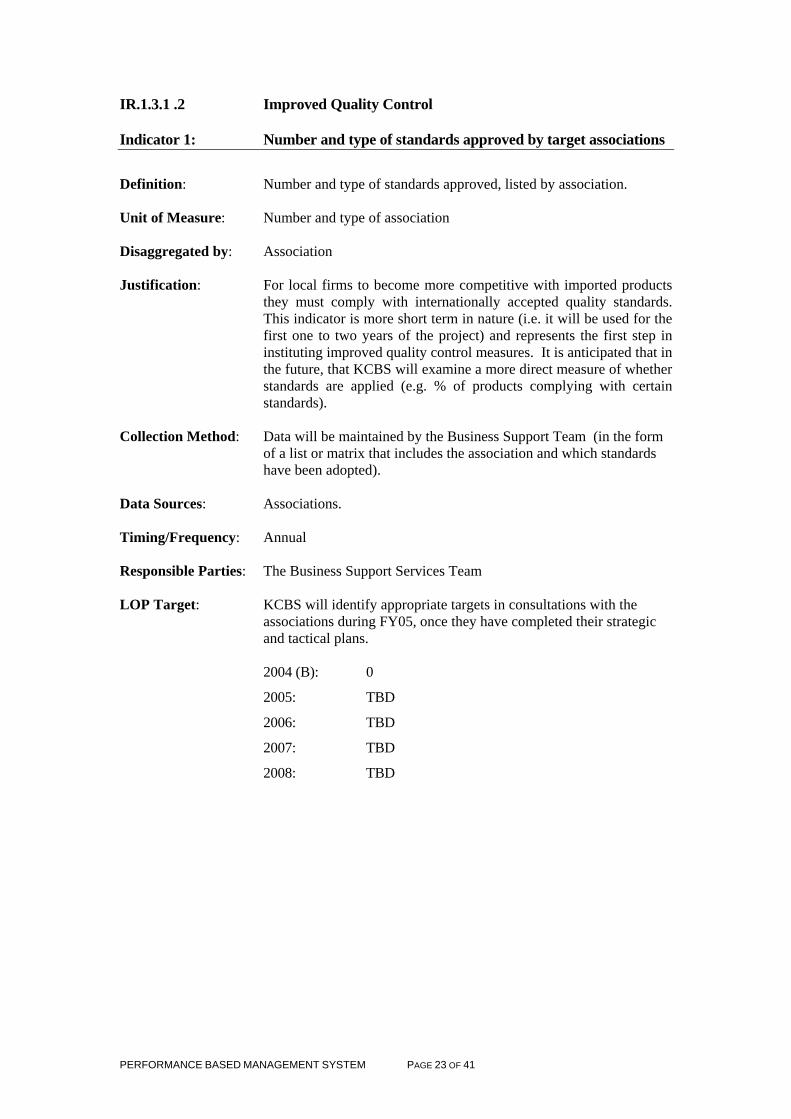
IR.1.3.1 .2 Improved Quality Control Indicator 1: Number and type of standards approved by target associations Definition: Number and type of standards approved, listed by association. Unit of Measure: Number and type of association Disaggregated by: Association Justification: For local firms to become more competitive with imported products
they must comply with internationally accepted quality standards. This indicator is more short term in nature (i.e. it will be used for the first one to two years of the project) and represents the first step in instituting improved quality control measures. It is anticipated that in the future, that KCBS will examine a more direct measure of whether standards are applied (e.g. % of products complying with certain standards).
Collection Method: Data will be maintained by the Business Support Team (in the form
of a list or matrix that includes the association and which standards have been adopted).
Data Sources: Associations. Timing/Frequency: Annual Responsible Parties: The Business Support Services Team LOP Target: KCBS will identify appropriate targets in consultations with the
associations during FY05, once they have completed their strategic and tactical plans.
2004 (B): 0
2005: TBD
2006: TBD
2007: TBD
2008: TBD
PERFORMANCE BASED MANAGEMENT SYSTEM PAGE 23 OF 41

IR.1.3.1 .3 Strengthened Capacity to Access Credit Indicator 1: Value of Financing within targeted enterprises Definition: Financing includes commercial bank, non-bank and micro financing
of micro, small, medium and large enterprises, resulting from direct KCBS assistance or through financial institutions.
Unit of Measure: Euros. Disaggregated by: Cluster
Type and duration of financing [capital investments, working capital, long-term, letter of credit, leasing]
Justification: Financing is a key measure of enterprise growth and viability.
Expansion of both commercial bank and non-bank financing reflects expected increases in enterprise sales and a growing ability of enterprises and financial institutions to measure and manage business and financial risks. Increased financing is a key indicator of the economic health and competitiveness of an industry. Note: this indicator includes the amounts for investment measured by Indicator
Collection Method: Data collected by KCBS advisors, and independently reviewed and
randomly verified by PBMS specialist. Data Sources: Action plans, regularly updated, developed with individual
enterprises assisted by KCBS directly or through the SAF. Timing/Frequency: Data collected and reported quarterly. Responsible Parties: KCBS cluster specialists and advisors, KCBS PBMS specialist. LOP Target: According to a USAID review of the records from the Ministry of
Finance and Economy, the baseline value for this indicator is €15,680,000 in the year 2003. The target of €16,000,000 in additional financing at enterprises where KCBS has intervened has been set on the basis of investment being 1/3 of additional sales – for which LOP target is €50,000,000. Baseline is set at 0 because the “universe” is KCBS assisted enterprises.
2005 (B): TBD (2nd quarter FY05)
2005 €3,000,000 (end of FY05)
2006: €6,000,000
2007: €10,000,000
2008: €16,000,000
PERFORMANCE BASED MANAGEMENT SYSTEM PAGE 24 OF 41

IR.1.3.2 Improved Business Operating Environment Indicator 1: Number of Companies Registered (Annual Report) Definition: The number of companies registered with Agency for Business
Registry (MTI) in Kosovo.
Unit of Measure: Number of Companies. Disaggregated by: Cluster Companies owned by Foreign Investors Justification: Number of Companies registered is an indication of the developing
business community in Kosovo. Companies being formed with foreign investment is an indication of growing confidence in the business operating environment in Kosovo. It will be important to ensure that the numbers are not increasing due to other factors (e.g. a large company splitting into smaller companies, for example).
Collection Method: Data collected by PBMS specialist. Data Sources: Ministry of Economy and Finance, Tax Administration Dept. Ministry of Trade and Industry, Dept. for Registration Timing/Frequency: Annual Responsible Parties: KCBS PBMS specialist.
LOP Target: The targets were agreed in discussions with USAID in preparing its PMP during September. The actual number of companies registered in the baseline year of 2004 was 40,703. USAID set targets for subsequent years as follows:
2004 (B): 40,703
2005: 44,000
2006: 47,000
2007: 51,000
2008: 54,000
PERFORMANCE BASED MANAGEMENT SYSTEM PAGE 25 OF 41

IR.1.3.2 Improved Business Operating Environment Indicator 2: The Business Environment Index Definition: The Business Environment Index examines 7 major areas as follows: 1. Starting a Business
2. Hiring and firing workers 3. Registering property 4. Getting Credit 5. Protecting Investor 6. Enforcing Contracts 7. Closing Businesses
Each of these categories includes a specific set of indicators that reflect progress in that area.
Unit of Measure: Reported by indicators under each major area (not as an overall
score). Disaggregated by: Major categories as listed above. Justification: The business environment index provides a snapshot of whether the
overall business environment is improving. Collection Method: KCBS has a contract with Integra to collect these data; the contract
will be managed by the PBMS specialist.
This indicator is a qualitative indicator that will be based on a survey of leading policy makers, business consultants, lawyers, researchers and practitioners, who will be asked to assess the ease, cost, and transparency of a series of factors that impact the overall business environment. The index will be based on the World Bank’s Doing Business 2005 report.1 The World Bank’s methodology is quite thorough: for each country listed, a team of professional researchers analyzed relevant laws and regulations, conducted several rounds of interviews, administered a survey of local business leaders, lawyers and judges, reviewed findings with academics and practitioners, tested data for robustness, and made adjustments to the dozens of performance indicators that comprise the index.
KCBS cannot replicate the World Bank’s effort, but we can build a rudimentary index based on the 7 components2 of the Doing Business report, which is rapidly becoming a universal measure of the policy environment for business development and growth. KCBS and USAID must acknowledge at the outset that any Kosovo-specific index will be necessarily incomplete and imperfect in its early stages. It will be a work in progress that will improve with time, as additional skills and resources are brought to bear.
Data Sources: The World Bank and Integra Timing/Frequency: Annual
1 The report may be previewed at http://rru.worldbank.org/doingbusiness/. 2 The Doing Business index measures the ease and cost of (1) starting a business, (2) hiring and firing workers, (3) registering property, (4) getting credit, (5) protecting investors, (6) enforcing contracts, and (7) closing a business.
PERFORMANCE BASED MANAGEMENT SYSTEM PAGE 26 OF 41

Responsible Parties: KCBS PBMS specialist. LOP Target: The PBMS specialist will examine comparability between the last
World Bank report and the survey to be done by Integra. If the World Bank methodology is used and the process is comparable, then the last survey completed by the World Bank can be used as the baseline. Targets will be developed in consultation with Integra. It will be important to disaggregate the data by cluster to the extent feasible.
Note: KCBS will complete the following tasks in order to make this indicator operational:
1. Select indicators for the Kosovo business environment index 2. Identify local professionals to survey (incorporation and litigation lawyers, business
consultants, judges, land registry officials, real estate professionals, business association leaders)
3. Review relevant laws and regulations 4. Design standardized business case 5. Assist World Bank with design and administration of survey 6. Facilitate focus groups with academics, business leaders, policy makers to validate
survey results 7. Review first draft of business environment index
PERFORMANCE BASED MANAGEMENT SYSTEM PAGE 27 OF 41
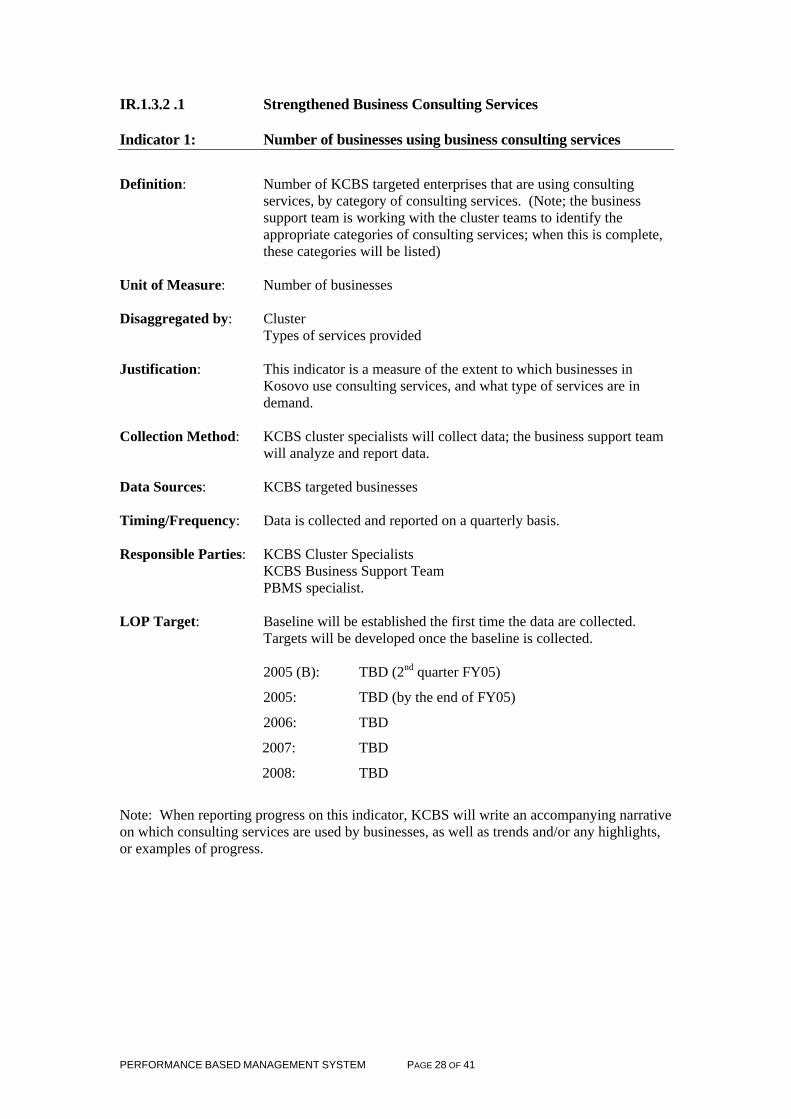
IR.1.3.2 .1 Strengthened Business Consulting Services Indicator 1: Number of businesses using business consulting services Definition: Number of KCBS targeted enterprises that are using consulting
services, by category of consulting services. (Note; the business support team is working with the cluster teams to identify the appropriate categories of consulting services; when this is complete, these categories will be listed)
Unit of Measure: Number of businesses Disaggregated by: Cluster Types of services provided Justification: This indicator is a measure of the extent to which businesses in
Kosovo use consulting services, and what type of services are in demand.
Collection Method: KCBS cluster specialists will collect data; the business support team
will analyze and report data. Data Sources: KCBS targeted businesses Timing/Frequency: Data is collected and reported on a quarterly basis. Responsible Parties: KCBS Cluster Specialists KCBS Business Support Team PBMS specialist. LOP Target: Baseline will be established the first time the data are collected.
Targets will be developed once the baseline is collected. 2005 (B): TBD (2nd quarter FY05)
2005: TBD (by the end of FY05)
2006: TBD
2007: TBD
2008: TBD
Note: When reporting progress on this indicator, KCBS will write an accompanying narrative on which consulting services are used by businesses, as well as trends and/or any highlights, or examples of progress.
PERFORMANCE BASED MANAGEMENT SYSTEM PAGE 28 OF 41

IR.1.3.2.2 Improved Capacity for Policy Dialog Indicator 1: Statistical strategy established Definition: A statistical strategy is developed by associations to define what data
are required for improved decision-making and who should collect those data (whether the association, government or the private sector).
Unit of Measure: Yes/no. Disaggregated by: Association Justification: The lack of economic data is one of the key constraints for improved
policy making. This indicator reflects a first and important step in addressing this issue during this phase of the project.
Collection Method: The Business Support Team will track this information. Data Sources: Associations. Timing/Frequency: As it occurs it will be reported in the quarterly and/or the annual
report. Responsible Parties: The Business Support Team LOP Target: The baseline is 0. Targets will be set by the third quarter of FY05,
and should be tied into the work that will be done by the statistician. 2005 (B): TBD (3rd quarter FY05)
2005: TBD (by the end of FY05)
2006: TBD
2007: TBD
2008: TBD
Note: The accompanying narrative will note any highlights of progress.
PERFORMANCE BASED MANAGEMENT SYSTEM PAGE 29 OF 41

IR.1.3.2 .2 Improved Capacity for Policy Dialog Indicator 2: Number of cluster-specific indices produced Definition: Cluster specific indices refer to data about the market, industry or
supplier. Data collected by the government and the private sector are included because the association’s statistical strategy will be important in laying out who does what and reflects the association’s role in implementing that strategy.
Unit of Measure: Number Disaggregated by: Type of index The entity that collected the data (government, private sector or
association). Justification: An increase in the number of indices indicates increasing capacity for
improved policy dialog because a lack of economic information is a key constraint in good economic decision making.
Collection Method: The Business Support Team will work with the associations to track
this information. Data Sources: Associations. Timing/Frequency: Annual Responsible Parties: The Business Support Team. LOP Target: Baseline is 0 for FY05. Targets will be developed once the statistical
strategy is completed.
2005 (B): 0
2006: TBD
2007: TBD
2008: TBD Note: The accompanying narrative will highlight the affects of these indices; whether improved capacity to advocate on key economic issues or examples of improved policies as a result of the use of these economic data.
PERFORMANCE BASED MANAGEMENT SYSTEM PAGE 30 OF 41

IR.1.3.2.3 Business Associations Responsive to Client Needs Indicator 1: Number of associations with approved strategic plans
Definition: Total number of USAID supported associations with approved strategic plans.
Unit of Measure: Number of Associations. Disaggregated by: Cluster Justification: Number of associations with strategic plans is an indication of the
developing business community in Kosovo. Associations that have the clear vision of the future with appropriate allocation of resources will be of great benefit to their member companies.
Collection Method: Information is tracked by the Business Support Team. Data Sources: Associations Timing/Frequency: Data is collected on an on-going basis as it occurs. It will be
reported on an annual basis. Responsible Parties: KCBS business support team. LOP Target: 20 Associations
2004 (B): 0 Associations
2005: 6 Associations
2006: 10 Associations
2007: 14 Associations
2008: 20 Associations
PERFORMANCE BASED MANAGEMENT SYSTEM PAGE 31 OF 41
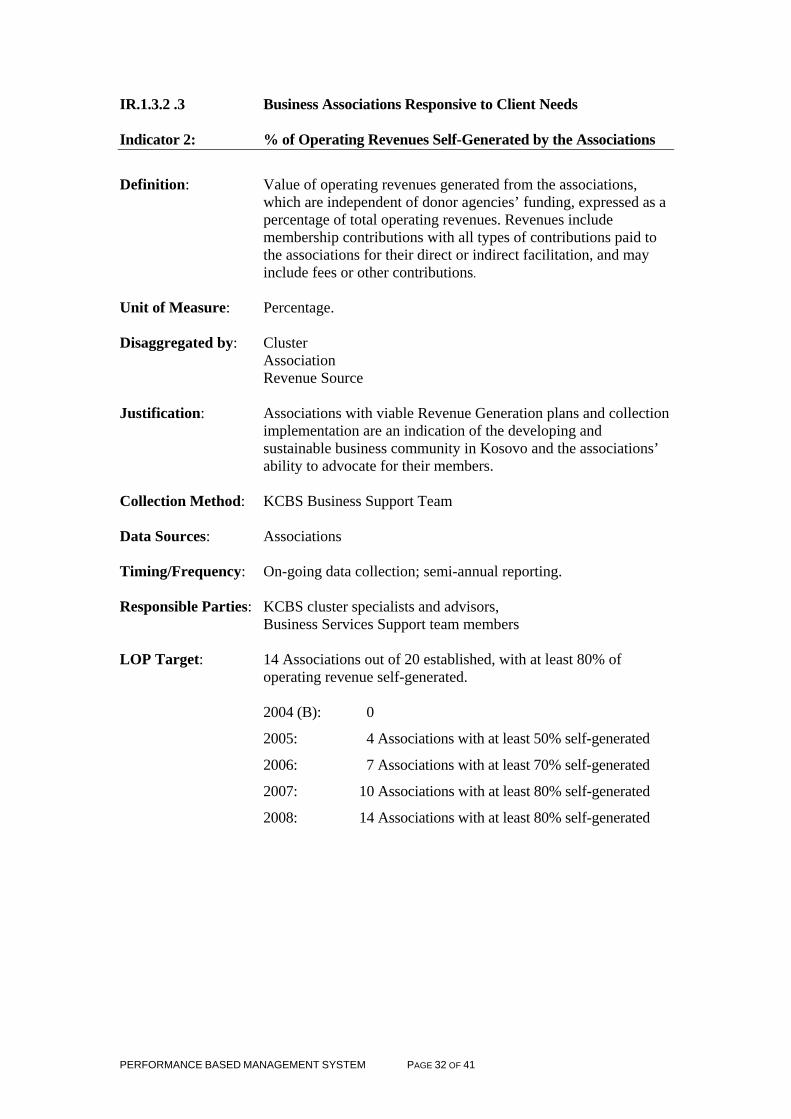
IR.1.3.2 .3 Business Associations Responsive to Client Needs Indicator 2: % of Operating Revenues Self-Generated by the Associations
Definition: Value of operating revenues generated from the associations, which are independent of donor agencies’ funding, expressed as a percentage of total operating revenues. Revenues include membership contributions with all types of contributions paid to the associations for their direct or indirect facilitation, and may include fees or other contributions.
Unit of Measure: Percentage. Disaggregated by: Cluster Association Revenue Source Justification: Associations with viable Revenue Generation plans and collection
implementation are an indication of the developing and sustainable business community in Kosovo and the associations’ ability to advocate for their members.
Collection Method: KCBS Business Support Team Data Sources: Associations Timing/Frequency: On-going data collection; semi-annual reporting. Responsible Parties: KCBS cluster specialists and advisors, Business Services Support team members LOP Target: 14 Associations out of 20 established, with at least 80% of
operating revenue self-generated.
2004 (B): 0
2005: 4 Associations with at least 50% self-generated
2006: 7 Associations with at least 70% self-generated
2007: 10 Associations with at least 80% self-generated
2008: 14 Associations with at least 80% self-generated
PERFORMANCE BASED MANAGEMENT SYSTEM PAGE 32 OF 41

IR.1.3.2 (4) Business Associations Responsive to Client Needs Indicator: Number of associations employing non-volunteer staff
Definition: Total number of USAID supported associations employing non-volunteer staff.
Unit of Measure: Number of associations. Disaggregated by: Cluster Justification: The addition of non-volunteer staff means that associations are
increasing internal capacity to support (and provide services to) member companies on ongoing basis. The existence of core administrative expertise will lead to sustainable associations.
Collection Method: Data collected by KCBS advisors. Data Sources: Associations Timing/Frequency: Annual. Responsible Parties: Business Services Support team members LOP Target: 14 Associations
2004 (B): 0 Associations
2005: 3 Associations
2006: 5 Associations
2007: 8 Associations
2006: 14 Associations
PERFORMANCE BASED MANAGEMENT SYSTEM PAGE 33 OF 41

Additional Notes:
1. Value of transactions resulting from improved market chain linkages. KCBS cannot track—systematically--- the value of all trade contracts that occur as a result of B2B linkages, trade shows, and marketing trips. As a result, this indicator has been dropped. However, KCBS will track what it can on an ad hoc basis and will provide specific examples in the narrative.
2. Percent of products that meet EU standards. This indicator could potentially replace “number and type of standards approved by target associations” as the project moves from supporting the adoption of standards to promoting the implementation of standards. If this indicator is adopted, KCBS will examine whether this can be done as a part of the survey planned for FY06.
3. Sales of local business consulting services. This indicator would be useful (to measure “strengthened business consulting services”) in the future if there is a practical way to collect the data. This indicator will also be examined to determine whether it can be collected in the KCBS survey in FY06.
This indicator measures the development of a business consulting service sector. Business consulting service providers are consulting or research firms, associations and networks that offer business development services to the private sector. The indicator assumes that the services are being used to improve business operations, efficiency, and sales. 4. Demand for domestic commodities and services in targeted clusters and related sectors. This indicator will also be reconsidered in the future when KCBS designs the survey. In addition, it needs to be examined in light of the statistical strategy developed by the associations; this could be the type of data that they would most appropriately collect. It could be measured by a survey of wholesale and retail sales outlets as well as municipal and other public markets. As local firms become more competitive demand should increase for domestically produced goods.
PERFORMANCE BASED MANAGEMENT SYSTEM PAGE 34 OF 41

Annex C
Model Template for
Enterprise Business Plan
PERFORMANCE BASED MANAGEMENT SYSTEM PAGE 35 OF 41

PERFORMANCE BASED MANAGEMENT SYSTEM PAGE 36 OF 41

Annex D
Template for Recording Enterprise Baseline data
PERFORMANCE BASED MANAGEMENT SYSTEM PAGE 37 OF 41

PERFORMANCE BASED MANAGEMENT SYSTEM PAGE 38 OF 41

Annex E
Template For Recording Quarterly Enterprise Data
PERFORMANCE BASED MANAGEMENT SYSTEM PAGE 39 OF 41
PERFORMANCE BASED MANAGEMENT SYSTEM PAGE 40 OF 41
PERFORMANCE BASED MANAGEMENT SYSTEM PAGE 41 OF 41

3/18/05 Report on Monitoring and Evaluation Assignment
Key Issues and Recommendations
A. Summary of Accomplishments:
• A workshop for KCBS staff to review key M&E concepts, data quality, and USAID systems and requirements.
• Further operationalization of the PBMS system. This included the development of detailed indicator definitions with KCBS teams, approaches for addressing key data problems, and the identification of next steps to complete the collection of remaining baselines and targets.
• Clarification of how the PBMS fits together with other project components such as the workplan.
• A draft policy on data confidentiality, including a component that can be used in memoranda of understanding (MOU’s) with targeted enterprises.
• The identification of an approach for building data collection and analysis capacity into associations
• The identification of a reporting process (including what is reported in terms of the narrative and the data as well as a specific schedule).
The following two tasks have also been added to the assignment and will be completed in the next week:
• Revise the PBMS to reflect the changes discussed in the last • Draft a memo for USAID’s team leader to summarize proposed changes to
the results framework.
Attachment A summarizes all actions and next steps that emerged from this assignment.
B. Key Issues:
1. Confidentiality: Confidentiality was identified by KCBS managers as a key issue for data collection. Attachment B outlines a draft policy for how KCBS can address this issue in a systematic way. The second paragraph on data use is designed to be incorporated into memoranda of understanding between KCBS and client enterprises. It is important to acknowledge that development projects must share information with numerous stakeholders; this policy is intended to apply only to sensitive data. Sensitive data is defined as any data shared by individual enterprises (e.g. sales, financing, etc). Recommendation: Circulate the draft policy to KCBS staff for comment and finalize.
Page 1 of 28

2. Data Collection and Reporting: The process for data collection and reporting was clarified, including the specific type of narrative and data that is required in each report. In addition, a schedule was developed for each step in the process (from the date the data must be entered, the narrative prepared, and the document submitted to USAID). Attachment C provides an overview of how various components of the project fit together (the workplan, the PBMS system, and the results framework). Attachment D includes an overview for the COP and the PBMS specialist, of the reporting system. Attachment E includes a guide for each team on the indicators they will report with due dates for data entry and any narrative (if required). Recommendation: Circulate the final version of the indicator guide to the cluster and association teams. 3. Data Quality: Good data quality is essential for credibility and is one of the key issues that would be examined in an audit. This is particularly true for any data used for reporting purposes. Obtaining “perfect data” is rarely possible so that the trade off issues between what is optimal vs. what is most practical must be examined. In general, the higher the data quality, the higher the cost of data collection. It is also important to understand that data used for management purposes do not necessarily need to meet the same rigorous standards as data used for scientific purposes. In some cases, data that provide an overall sense of the trends in a particular area may be adequate. However, the project manager and the PBMS specialist must be confident that the approach used is rooted in an overall strategy to address data quality in appropriate ways as well as transparency about any limitations. The following summarizes the approach for addressing data quality for KCBS assisted enterprises1 in a systematic way:
(a) Data Collection: Data for KCBS assisted enterprises are collected by
technical project managers. These enterprises receive assistance from KCBS so that managers work with them on an on-going basis. The KCBS manager inputs this data directly into the project database on a regular basis. Data is sometimes provided orally to the project manager, but because the manager has been working with the enterprise over time, he/she can generally cross check the data for more serious irregularities (see paragraph below). In addition, KCBS plans on developing a Memorandum of Understanding (MOU) between the project and the target enterprise. This MOU will identify the specific data collection needs from the client.
(b) Cross Checking: The KCBS manager is able to periodically spot check the
data, using his/her knowledge of production and the client enterprises. For example, there are known ratios between the size of a farm and yields (milk, fruit, grain, etc) or the volume of product processed. Using this information, the manager can cross check the data to see if there are any irregularities. If the data appear to be incorrect, the manager will go back and work with the client enterprise to explore the issue more fully. Dates and the results of these spot checks should be recorded in the PMP or in a complementary record.
1 For a discussion of the “universe” refer to paragraph 3.
Page 2 of 28

(c) Provision of Technical Assistance: In some cases, where enterprise level
data collection is a key constraint, KCBS or an association may provide assistance in improved record keeping. These types of interventions help enterprises set up appropriate monitoring systems.
(d) Confidentiality: Confidentiality is a key issue in terms of KCBS’s ability to
get “real” or accurate data. Businesses are concerned about providing sensitive data to outsiders because of potential tax implications. To address this, KCBS has developed an approach for confidentiality (see B1 above) that will be applied within the project to ensure that any sensitive data is handled appropriately.
(e) Workshop: A half day workshop was held for KCBS managers. This
workshop covered key data quality issues and USAID guidance on data quality. In addition, it is recommended that the PBMS specialist hold a subsequent meeting to review:
• Data quality responsibilities (emphasizing that if any issues with data
quality, including definitions or approaches, emerge, the project manager should contact the PBMS specialist to find a solution)
• KCBS’s policy on confidentiality • Any specific issues that have emerged. In particular, there is an issue
when a larger company has many sub-organizations. In those cases, KCBS only wants to report sales, financing, etc in the cluster related areas. However, this is more complex when dealing with jobs, where one sales person may sell both cluster related and non-cluster products.
(f) The PBMS Specialist: The PMBS specialist is a second level of ensuring
quality. He is responsible for:
• Ensuring overall data quality in the system • Working with technical managers to identify and understand any
irregularities • Consider data quality in developing the system and identifying appropriate
indicators for the program, using data quality criteria. • Understanding the process for data collection, identify and address any
potential weaknesses in data quality. • Periodically verify or spot check the data. • Work with the IT manager to ensure appropriate measures are included in
the database
Recommendations: (1) The PBMS specialist should reexamine data quality issues in the first quarter of FY06 to review the system once data have been collected to consider where adjustments might need to be made. The status of associations in terms of their ability to collect data should also be considered; if
Page 3 of 28

some data can be collected by associations at that time, then the data source may change and data quality issues for new processes will have to be examined (see paragraph 6). Attachment F provides the checklist for assessing data quality that was developed and used within USAID. (2) The project should set high standards for data quality early on, particularly during the first reporting period. Project managers should carefully review data with enterprises and associations to understand how the data were derived.
. 3. Defining The Universe: In the preliminary phases of designing the M&E system, data collection was based on the assumption that targeted associations would be in a position to collect data that are relevant to the cluster. KCBS believes it can be held accountable for cluster level changes for the following reasons:
(1) The project works with clusters in strategic ways. Client enterprises are
chosen based on their ability to have broader impacts within the cluster. (2) The project works through targeted associations to have broader impacts.
As a result, the members of KCBS assisted associations will benefit from project interventions. Second, associations will have an important role in data collection and analysis so that economic policy will support competitiveness, an improved business operating environment and ultimately, accelerated private sector growth.
While this concept is still valid, it became clear that the associations would not be in a position to collect this data until the beginning of FY06. In the meantime, KCBS has to identify a workable solution during the interim period for its internal purposes as well as USAID reporting. To address this issue, the project will collect data from a more narrowly defined group this year (FY05). This is defined as targeted enterprises, meaning those that receive technical assistance, funding, or training from KCBS.
Page 4 of 28

Figure 1
Targeted Enterprises: A Subset within the Cluster Key Associations Key Processors Key Producers Farmers (only to the extent that there is potential for broader impact)
The Total Cluster: Associations Processors Producers/ Farmers
The problem is that this approach does not necessarily capture the broader, cluster-wide impacts of the project. For example, KCBS will work with associations to provide services to members that, in turn, are likely increase sales of association members. To address this problem, the suggestion is that KCBS also collect “second tier” data. Second tier data are defined as data derived from members of KCBS assisted association (but not necessarily those that receive direct assistance). This effectively broadens the net of data collection and allows project managers to begin to track some of the broader benefits of the project, albeit in a more ad hoc way. Since we are not sure of the data quality issues at this time, the project will use this approach for the first year. If it is determined that data quality does not differ from KCBS assisted enterprises, then this distinction will no longer be needed. The current approach for collecting “second tier” data is outlined as follows:
(a) Disaggregation: These data will be disaggregated from first tier data during year one to ensure that these data can meet appropriate data quality standards. The quality of data used for reporting must meet USAID’s data quality standards and KCBS may not have the same ability to influence the quality of data collection for this group. Second, it may be difficult to put in place a standard system for this type of data collection (so that quarterly data can be obtained).
Page 5 of 28

(b) Building and Expanding the Database: Project managers will be asked to identify key enterprises that may be important to add to the database. This might include a member of an association who is successfully using a technique learned in an association sponsored workshop, or there may be an attempt to gather data for the largest members of the market.
(c) Data Use: These data will be used for analyzing progress in the cluster. While these data will not be reported in terms of baselines and targets to USAID in the official data tables, they can be referenced in the narrative portion of the report to convey some of the “demonstration effects” of the project.
(d) Why Collect Second Tier Data At All? The project needs a way to provide tangible examples of broader demonstration effects resulting from its interventions, particularly as it shifts focus from the individual enterprise to associations.
(e) The Longer Term Plan to Address this Problem: In FY06, KCBS expects at least some associations to have data collection and analysis capacity. KCBS will assess the situation at that time (e.g. which associations have data collection capacity and what data re collected) and plans to conduct a survey to address any gaps.
Recommendation: While this approach was discussed briefly with each cluster team leader, it will be important to review this one more time with all staff (particularly the approach summarized in paragraph b above).
5. Performance Review Session: One of the best practices identified from other Chemonics projects is to set up a performance review session on a semi-annual or annual basis. Some projects invite USAID and key stakeholders to participate in such a session to discuss the following issues:
(a) Is progress on track? (b) What broader trends affect the direction of the project? (c) What circumstances led to exceeding or falling short of targets? Falling short
of targets may not mean the project has failed. The key lies in understanding what has occurred and why it has occurred.
(d) Do critical assumptions remain valid? If critical assumptions no longer hold true, are any readjustments in the project necessary?
(e) What are the implications of performance for project planning? (f) Any factors that could influence data should be identified. For example, the
number of citizens participating in an election may decrease. This could be due to citizen disenchantment with the political process and belief that voting will have no meaningful impact, fears of election-day violence, or lack of knowledge and awareness of candidates and/or issues. In addition, general knowledge about election trends should be factored into the analysis (e.g.,
Page 6 of 28

transition elections elicit higher degrees of participation and then decline over time). The analytic process should explain and interpret the data and determine the implications for the project.
There are two key benefits of conducting such a session. First, it provides an opportunity for project managers to step back and examine performance in the context of the broader economic environment. Second, it allows managers to identify areas where synergistic approaches are needed to ensure that all project components are working together (particularly important for KCBS, given the crosscutting importance of the work with associations). Third, it provides a forum to analyze program performance in a substantive way going into the preparation of the annual report. This shifts the focus from simply completing a reporting requirement to substantive analysis of performance. Recommendation: Plan to hold a performance review session. Identify who will be included in such a session, the schedule, where it will be held and whether a facilitator could be used (maybe a local facilitator is a possibility).
6. An Approach for Building Capacity to Collect and Analyze Data in Associations: Building capacity for data collection among associations is an important development objective in its own right. Lack of economic information is often sited as a key impediment to making markets work better in developing countries. This information includes “the data relevant to economic decisions and the ability (both societal and individual) to generate, distribute, guarantee, analyze, and process it. It is the effective use of information in economic decisions that matters.” 2 Second, it is important to be aware of who has access to such information because this can often become a leverage point between the “haves” and the “have nots”. The KCBS model is premised on the concept that associations will play a key role in improving access to economic information through the development of statistical strategies. The statistical strategy will define the data that should be collected by associations, government, and the private sector. Associations will then advocate with relevant players to implement that policy. In the meantime, KCBS is faced with meeting more immediate data collection and reporting needs for internal management and reporting. As a result, a two pronged approach was identified as follows (see figure 2):
2 Klitgaard, Robert, “Adjusting to Reality, Beyond “State versus Market” in Economic Development”, International Center for Economic Growth, (1992): pages 15, 24-25.
Page 7 of 28
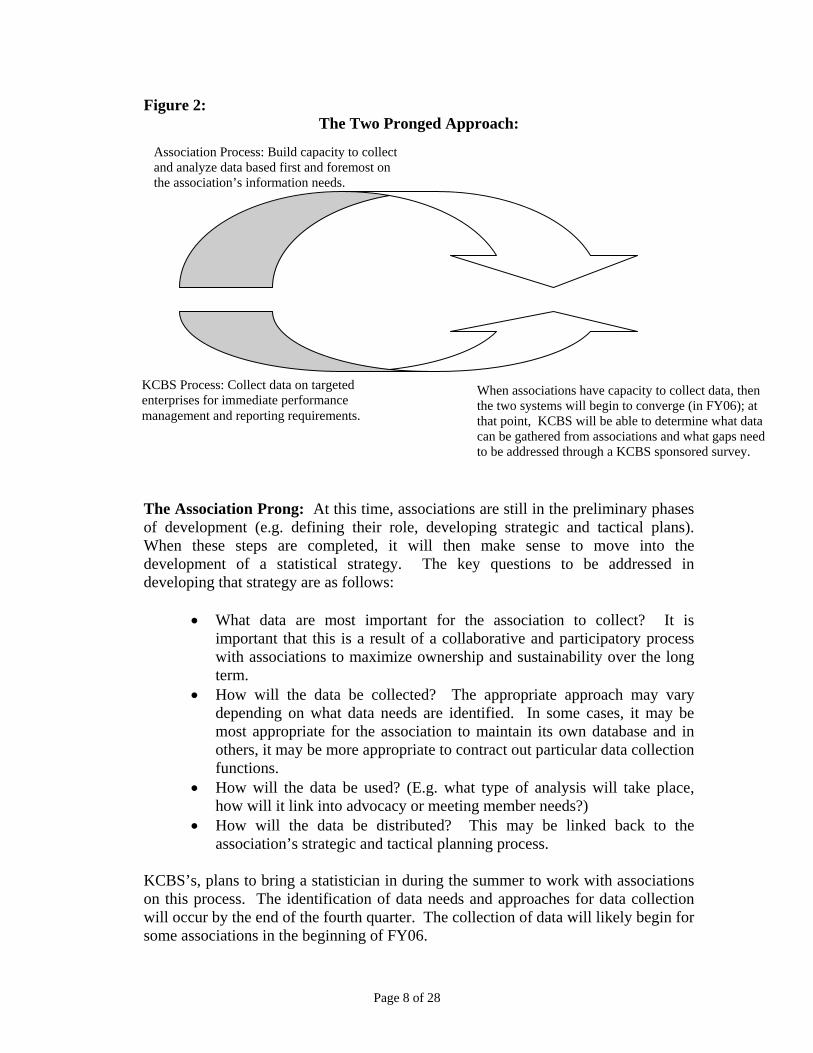
Figure 2: The Two Pronged Approach:
Kem
ToWdd
Kows
Association Process: Build capacity to collect and analyze data based first and foremost on the association’s information needs.
CBS Process: Collect data on targeted nterprises for immediate performance anagement and reporting requirements.
he Association Prong: At this time, associationf development (e.g. defining their role, develohen these steps are completed, it will then
evelopment of a statistical strategy. The keeveloping that strategy are as follows:
• What data are most important for timportant that this is a result of a collawith associations to maximize ownershterm.
• How will the data be collected? Thdepending on what data needs are idemost appropriate for the association toothers, it may be more appropriate to cofunctions.
• How will the data be used? (E.g. whahow will it link into advocacy or meetin
• How will the data be distributed? association’s strategic and tactical plann
CBS’s, plans to bring a statistician in during the n this process. The identification of data needs ill occur by the end of the fourth quarter. The col
ome associations in the beginning of FY06.
Page 8 of 28
When associations have capacity to collect data, then the two systems will begin to converge (in FY06); at that point, KCBS will be able to determine what data can be gathered from associations and what gaps need to be addressed through a KCBS sponsored survey.
s are still in the preliminary phases ping strategic and tactical plans). make sense to move into the y questions to be addressed in
he association to collect? It is borative and participatory process ip and sustainability over the long
e appropriate approach may vary ntified. In some cases, it may be maintain its own database and in ntract out particular data collection
t type of analysis will take place, g member needs?) This may be linked back to the ing process.
summer to work with associations and approaches for data collection lection of data will likely begin for

The KCBS Prong: The second prong focuses on developing internal KCBS performance monitoring systems to allow the project to meet more immediate USAID reporting needs. During the first year, KCBS will collect data for KCBS assisted enterprises and as many other key enterprises as is possible (at a minimum, identifying priority enterprises to include in the database). During FY06, KCBS will identify the data that are collected by associations. The survey will then be designed to collect data on the cluster as a whole and to complement the data collected by associations. Recommendation: (1) KCBS may want to consider asking the statistician to review how KCBS and association data needs will overlap and where there may be gaps. (2) In FY06, KCBS needs to identify the data being collected by associations and the gaps that remain. From this, KCBS data needs should be identified and the survey designed. The survey is intended to gather cluster-wide data. (3) Once this is done, the implications for baselines and targets needs to be determined. List of Attachments: Attachment A: Summary of Actions and Next Steps (Proposed) Attachment B: Draft Policy on Confidentiality Attachment C: How the Pieces Fit Together (including the workplan, the PBMS
system and USAID’s strategy) Attachment D: Overview of Reporting for the COP and the PBMS Specialist Attachment E: Indicator Guide for Each Team Attachment F: Data Quality Checklist
Drafted by Michelle Adams-Matson, 3/13/05 Assignment 3/7 through 3/15
Page 9 of 28

Attachment A
Summary of Actions and Next Steps (PROPOSED) ACTION DUE DATE RESPONSIBLE
PERSON COMMENTS
1. Confidentiality: Circulate the draft policy to KCBS staff for comment and finalize.
NPllana could send the memo to staff for comment. MW should approve the final policy.
2. Data Collection & Reporting: Circulate the final version of the indicator guide to the cluster and association teams.
. NPllana
3. Data Quality: (1) Reexamine data quality issues in the first quarter of FY06 to review the system once data have been collected to consider where adjustments might need to be made. (2) The status of associations in terms of their ability to collect data should also be considered; if some data can be collected by associations at that time, then the data source may change and data quality issues for new processes will have to be examined. (3) The project should set high standards for data quality early on, particularly during the first reporting periods.
NPllana and MW
Page 10 of 28

ACTION DUE DATE RESPONSIBLE
PERSON COMMENTS
4. KCBS Staff Session: Hold a brief session with KCBS staff to review: - roles and responsibilities vis a vis data quality (these are outlined in the memo) - policy on confidentiality (draft is attached) - reporting process (reemphasizing that due dates are the LAST possible date for data entry, per Martin) - defining the universe- our approach to tier one and tier 2 data and that project managers should try to gather data for important enterprises (per Martin’s guidance). - what types of information should be put in the narrative vs. what is put in the “official data tables”.
NPllana M.Adams-Matson talked briefly with cluster team leads about this approach, but I think that it would be a good idea for Nazmi to review this with all the team members in a brief session that summarizes all key points and allows staff to ask questions for clarification.
5. Performance Review Session: Plan to hold a performance review session. Identify who will be included in such a session, the schedule, where it will be held and whether a facilitator could be used (maybe a local facilitator is a possibility.
NPllana could organize it in consultation with MW.
KCBS may want to see if there are any local consultants that could do this. The role of the consultant would be to set up and facilitate the sessions and summarize key outcomes.
7. Specific Indicator Issues: (a) Further define the types of consulting services under “number of target businesses using business”. (b) Determine specifically consulting services and determine specifically how the data will be gathered by cluster teams.
3/18 R.O’Sullivan Coordinate with Nazmi.
8. Set baselines and targets for two indicators noted above.
R.O’Sullivan Coordinate with Nazmi.
Page 11 of 28

ACTION DUE DATE RESPONSIBLE
PERSON COMMENTS
9.For larger companies, make sure that the approach is clear for gathering data on jobs and sales when the company is larger and may have several businesses.
NPllana On sales—we are interested only in cluster related sales. For jobs, this becomes more complex. One approach is to have the cluster team member work with the enterprise to estimate. Where this is done, the cluster team member should note the process by which the numbers were obtained in their files and in the database system.
10. Rewrite PBMS document based on meeting with USAID
M.Adams-Matson
11. Write up memo for Tim summarizing proposed changes to the RF and indicators
M.Adams-Matson
Page 12 of 28

ATTACHMENT B
Draft March 12, 2005 KCBS Policy on
Confidentiality for Sensitive Data
1. Sensitive Data: Sensitive data are defined as any data shared by individual
enterprises, including (but not limited to): • Total sales • Jobs created • Labor productivity • Financing
2. Data Use: Data are primarily used only for internal purposes by the KCBS project and/or USAID to assess progress against stated objectives. Enterprise level data will not be shared with any third party. Any reports shared with outside parties will contain no individual-subject data. In those cases, only aggregate results are reported in a summary format. KCBS maintains security policies and procedures to protect access to all enterprise level data.
3. Database Access: Access to the database system is controlled by the database
administrator. All files will be stored with password protection. Only authorized staff will have access to the system.
4. User Responsibilities: KCBS staff will be held responsible for maintaining
security for sensitive data as follows:
a. Users will maintain security for sensitive data in their possession or to which they have access by protecting software files or any documentation that contains sensitive data.
b. Any portable computers, electronic data storage devices (e.g. diskettes,
CD’s, etc), forms, printouts will be protected from unauthorized access. Passwords will be used to access computers and sensitive files. Workstations will be not being left on when the user is not present.
c. Enterprise level data will not be shared with third parties under any
circumstances.
d. Users will change or delete data only as authorized within their job responsibilities.
e. Unauthorized copies of software, data or related documentation related to
sensitive data as defined in this policy are expressly prohibited.
Page 13 of 28

f. Disposal of sensitive data will follow applicable Chemonics and USAID policies.
g. Failure to fulfill these requirements may subject the user to penalties such
as employment termination, suspension of access privileges, a letter of reprimand, an unsatisfactory performance evaluation, and/or accountability in a court of law.
Page 14 of 28

ATTACHMENT C
KCBS: How the Pieces Fit Together
Strategic Objective
The PBMS System(Indicators)
Intermediate Results Outputs The Workplan
(Activity Level) Inputs
* USAID’s strategy and KCBS strategy are congruent in this case.
Page 15 of 28

ATTACHMENT D Draft 3/13/05
A Summary of Overall Reporting Requirements for the COP and PBMS Specialist
REPORT
DUE DATE FOR SUBMISSION TO USAID
TIME PERIOD COVERED BY THE DATA
COMPONENTS COMMENT
Monthly 10th of every month
Previous Month
NARRATIVE (concise): (1) Executive summary of current activities (2) Presentation of major problems, recommendations for solving problem and
responsible party. (3) Summary of progress against workplan benchmarks (4) Anticipated activities for the coming month
These reports are based on activities outlined in the workplan.
1st Quarterly
January 14 (10 workdays after the end of the month)
Oct 1 - Dec 30
NARRATIVE (1) Progress made over the quarter (2) Comparison of progress to planned achievements under the performance
based management system.
DATA (Quarterly)
(1) Total sales (2) Jobs created (3) Value of capital investment (4) Value of financing (5) Number of targeted enterprises using business consulting services within
targeted clusters (6) Statistical strategy established (only if it occurs) (7) Value of non-donor revenues generated by target associations (when the
system is set up—will be reported in FY06) FINANCIAL EXPENDITURE
(1) Summary Page, reflecting spending by line item for the quarter and LOP followed by a detailed breakdown of all spending under each line item category.
(2) By line item, cumulative totals for the previous report and the total for the quarter being reported, new cumulative total, and the amount remaining to be expended.
The contract agreement states that KCBS will include a comparison of progress to planned achievement s under PBMS (see reporting section, p.27). Per Martin, this will consist of two parts. The first part is a summary of the monthly reports. The second will be the performance based report as outlined. .
Page 16 of 28

REPORT
DUE DATE FOR SUBMISSION TO USAID
TIME PERIOD COVERED BY THE DATA
COMPONENTS COMMENT
2nd Quarterly
April 14 Jan 1 – March 31
NARRATIVE (1) Progress made over the quarter (2) Comparison of progress to planned achievements in the WP
DATA (Quarterly)
(1) Total sales (2) Jobs created (3) Value of capital investment (4) Value of financing (5) Number of targeted enterprises using business consulting services within
targeted clusters (6) Statistical strategy established (only if it occurs) (7) Value of non-donor revenues generated by target associations (when the
system is set up—will be reported in FY06) (Semi-annual)
(1) Number of target associations with approved strategic plans (2) The number of cluster specific indices produced
FINANCIAL EXPENDITURE (1) Summary Page, reflecting spending by line item for the quarter and LOP
followed by a detailed breakdown of all spending under each line item category.
(2) By line item, cumulative totals for the previous report and the total for the quarter being reported, new cumulative total, and the amount remaining to be expended.
3rd Quarterly
July 14 April 1 – June 30
NARRATIVE (1) Progress made over the quarter (2) Comparison of progress to planned achievements in the WP
DATA (Quarterly)
(1) Total sales (2) Jobs created (3) Value of capital investment (4) Value of financing (5) Number of targeted enterprises using business consulting services within
Page 17 of 28

REPORT
DUE DATE FOR SUBMISSION TO USAID
TIME PERIOD COVERED BY THE DATA
COMPONENTS COMMENT
targeted clusters (6) Statistical strategy established (only if it occurs) (7) Value of non-donor revenues generated by target associations (when the
system is set up- will be reported in FY06) FINANCIAL EXPENDITURE
(1) Summary Page, reflecting spending by line item for the quarter and LOP followed by a detailed breakdown of all spending under each line item category.
(2) By line item, cumulative totals for the previous report and the total for the quarter being reported, new cumulative total, and the amount remaining to be expended.
Progress Review Session
O/A end of July A half day session for KCBS staff and relevant partners to examine the data against the project’s strategy, including the following issues:
(a)Is progress on track? (b)What broader trends affect the direction of the project? (c)What circumstances led to exceeding or falling short of targets? Falling
short of targets may not mean the project has failed. The key lies in understanding what has occurred and why it has occurred.
(d)Do critical assumptions remain valid? If critical assumptions no longer hold true, are any readjustments in the project necessary?
(e)What are the implications of performance for project planning? (f)What factors affected the data. For example, if the number of companies
registered increased much beyond the targets, was that because these were companies that spun off of existing companies? The analytic process should explain and interpret the data and determine the implications for the project
This is suggested. If this is done then annual data should be provided to staff so that they can analyze progress in the larger context.
Page 18 of 28

REPORT
DUE DATE FOR SUBMISSION TO USAID
TIME PERIOD COVERED BY THE DATA
COMPONENTS COMMENT
Annual Report
Oct 30 End of wk 1 (Oct 7)- all data is entered End of wk 2 (Oct 14) - project managers to submit their narratives End of wk 3 (Oct 21) - COP finalizes the document & sends it to Chemonics HO End of week 4 (Oct 31)- Final document is submitted to USAID.
Oct 1 – Sept 30
NARRATIVE
(1) Progress over the past year (see comments) (2) Comparison of progress to planned achievements in the WP
DATA: (Quarterly)
(3) Total sales (4) Jobs created (5) Value of capital investment (6) Value of financing (7) Number of targeted enterprises using business consulting services within
targeted clusters (8) Statistical strategy established (only if it occurs) (9) Value of non-donor revenues generated by target associations (when the
system is set up—will be reported in FY06) (Semi-annual)
(10) Number of target associations with approved strategic plans (11) The number of cluster specific indices produced
(Annual Report Data)
(12) Productivity (13) Value of Company Profit Taxes Collected (14) Exports a s a percent of imports (15) Number of companies registered (16) The Business Environment Index (17) Number of target associations employing non-volunteer workers (18) The number and type of standards approved by target associations.
FINANCIAL EXPENDITURE (1) Summary Page, reflecting spending by line item for the quarter and LOP
followed by a detailed breakdown of all spending under each line item category.
(2) By line item, cumulative totals for the previous report and the total for the quarter being reported, new cumulative total, and the amount remaining to be expended.
The annual report generally focuses on performance over the previous year. It will include progress toward development results, targets, status of critical assumptions, operating problems, and outstanding issues Provides 4 weeks for compilation Does it require a quarterly component?
Page 19 of 28
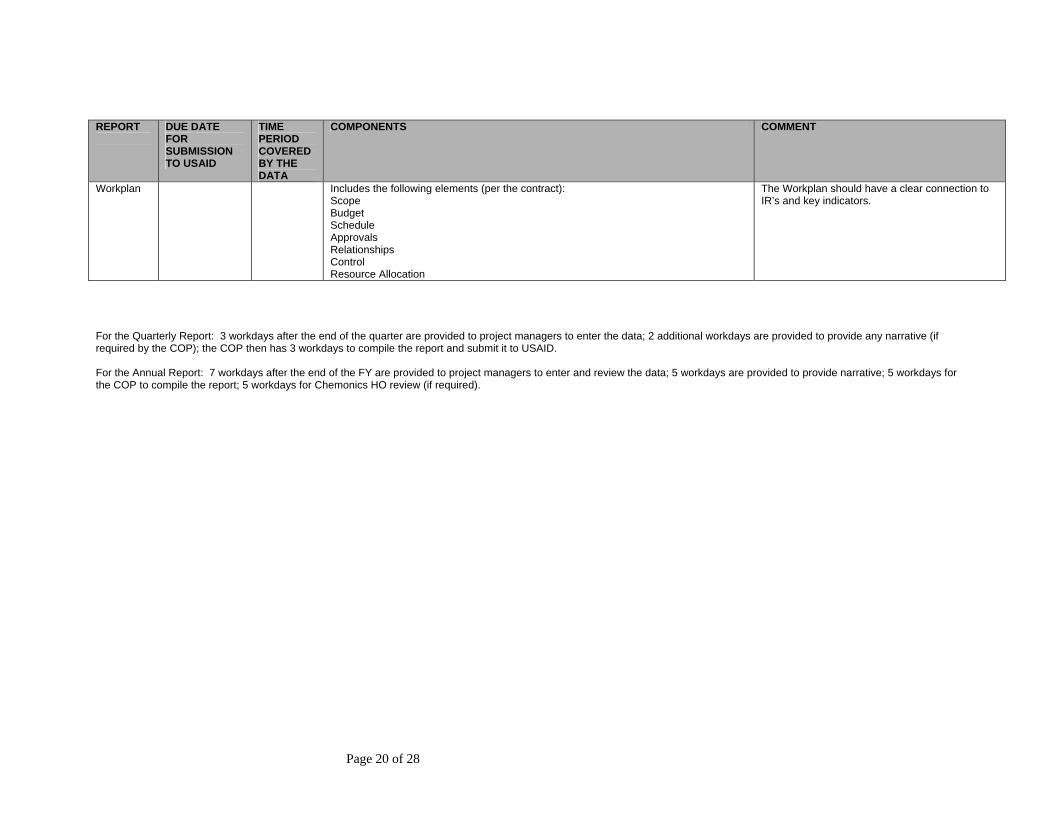
REPORT
DUE DATE FOR SUBMISSION TO USAID
TIME PERIOD COVERED BY THE DATA
COMPONENTS COMMENT
Workplan Includes the following elements (per the contract): Scope Budget Schedule Approvals Relationships Control Resource Allocation
The Workplan should have a clear connection to IR’s and key indicators.
For the Quarterly Report: 3 workdays after the end of the quarter are provided to project managers to enter the data; 2 additional workdays are provided to provide any narrative (if required by the COP); the COP then has 3 workdays to compile the report and submit it to USAID. For the Annual Report: 7 workdays after the end of the FY are provided to project managers to enter and review the data; 5 workdays are provided to provide narrative; 5 workdays for the COP to compile the report; 5 workdays for Chemonics HO review (if required).
Page 20 of 28

ATTACHMENT E: Draft 3/14/05
The Indicator and Reporting Guide for the Cluster Teams A Summary
INDICATOR FREQUENCY
OF DATA COLLECTION
DUE DATE FOR DATA ENTRY *
DUE DATE FOR NARRATIVE*
REPORT COMMENTS
1. Total sales among target enterprises, disaggregated by:
- % of sales that are exports (to the extent possible- this is for internal use)
Quarterly Q1- Jan. 6Q2- April 5 Q3- July 5 Annual- Oct 7
Q1- Jan 11 Q2- April 7 Q3- July 7 Annual – Oct 14
Quarterly Reports Annual Report
Livestock Cluster: Baselines and targets are established for dairy and poultry. Need baseline and targets for KODAA by 3/18. Construction Cluster: Need baseline and target data for roads sub group by 3/31. Fruit and Vegetable: Baselines and targets will be finished by 3/18.
2. Jobs created among target enterprises, disaggregated by:
- full time/part time - male/female
Quarterly Q1- Jan. 6Q2- April 5 Q3- July 5 Annual - Oct 7
Q1- Jan 11 Q2- April 7 Q3- July 7 Annual – Oct 14
Quarterly Reports Annual Report
Same B/T status as noted above.
3. Productivity among target enterprises, defined as FTE days per 100,000 Euros of production.
Annual Annual- Oct 7 Annual – Oct 14 Annual report. FTE (full time equivalent) days of work per 100,000 euros of production. Same B/T status as noted above.
4. Value of capital investment among target enterprises measured in euros
Quarterly Q1- Jan. 6Q2- April 5 Q3- July 5 Annual - Oct 7
Q1- Jan 11 Q2- April 7 Q3- July 7 Annual – Oct 14
Quarterly Reports Annual Report
Same B/T status as noted above.
Page 21 of 28

INDICATOR FREQUENCY OF DATA COLLECTION
DUE DATE FOR DATA ENTRY *
DUE DATE FOR NARRATIVE*
REPORT COMMENTS
5. Value of financing among target enterprises, disaggregated by: - Type and duration of financing (capital investments, working capital, long-term, letter of credit, leasing)
Quarterly Q1- Jan. 6Q2- April 5 Q3- July 5 Annual - Oct 7
Q1- Jan 11 Q2- April 7 Q3- July 7 Annual – Oct 14
Quarterly Reports Annual Report
This figure includes financing from other sources. Also, this can be occasionally spot checked with Bank data. Same B/T status as noted above.
6. Number of targeted enterprises using business consulting services within targeted clusters. (Categories TBD)
Quarterly Q1- Jan. 6Q2- April 5 Q3- July 5 Annual - Oct 7
Narrative will be prepared by the business consulting group with input from the cluster technical group, based on the following schedule: Q1- Jan 11 Q2- April 7 Q3- July 7 Annual – Oct 14
Quarterly Report The Annual Report
Coordination with the business consulting group is required. This will be disaggregated by type of services such as advertising, marketing, etc. The exact categories need to be defined between the association team and the cluster teams. The number by itself is not particularly important; key issues and trends should be highlighted in the narrative. B/T Status to be determined once indicator is developed. Indicator will be finalized by 3/18.
7. B2B Connections: Where B2B connections are facilitated, the team should report in the narrative what contracts and resulting sales occurred to the extent possible and feasible (coordinate also with association team, if necessary). Definition of “target enterprise” is that these are client enterprises that receive assistance from KCBS or, the extent possible, the members of associations that receive assistance from KCBS. Guidelines Used: For the Quarterly Report: 3 workdays after the end of the quarter are provided to project managers to enter the data; 2 additional workdays are provided to provide any narrative (if required by the COP); the COP then has 3 workdays to compile the report and submit it to USAID. For the Annual Report: 7 workdays after the end of the FY are provided to project managers to enter and review the data; 5 workdays are provided to provide narrative; 5 workdays for the COP to compile the report; 5 workdays for Chemonics HO review (if required).
Page 22 of 28

Draft 3/14/05
The Indicator and Reporting Guide for the Association and Business Consulting Teams A Summary
INDICATOR FREQUENCY
OF DATA COLLECTION
DUE DATE FOR DATA ENTRY *
DUE DATE FOR NARRATIVE*
REPORT COMMENTS
The Business Association Team 1. The number and type of standards approved by target associations.
Annual Annual- Oct 7 Annual- Oct 14 Annual Report
This will likely have to be maintained in a matrix. This indicator is more short term in nature and represents the preliminary phase (1 to 2 years) of improving quality control. It is anticipated that in the future, that KCBS will have to examine a more direct measure of whether standards are applied (e.g. % of products complying with certain standards—this will be examined in the context of developing the KCBS sponsored survey in FY06).
2. Statistical strategy established by target associations, disaggregated by association (yes/no).
As it occurs (i.e. when the milestone is achieved it will be noted).
Data will be included in the next report in the cycle. See due dates below
See due dates below. Will be included in quarterly reporting, as it occurs.
Linked to the workplan. This is tracked by the team in narrative form. Baseline is 0 for 05.
3. Number of cluster specific indices produced by or as the result of targeted association strategies, disaggregated by
- Association - Government - Private Sector
Semi-annual Q2- April 5 Annual - Oct 7
Q2- April 7 Annual – Oct 14
The second quarterly due in April and the annual due in October.
Indices refer to specific data about the market, industry or supplier. Government and private sector data are included because the association’s statistical strategy will be important in laying out who does what and reflects the association’s role in implementing that strategy. Baseline is 0 for O5.
Page 23 of 28

INDICATOR FREQUENCY OF DATA COLLECTION
DUE DATE FOR DATA ENTRY *
DUE DATE FOR NARRATIVE*
REPORT COMMENTS
Per USAID, the accompanying narrative should highlight whether policy dialog has improved and whether, ultimately, there are improved policies as a result (e.g. examples).
4. Number of target associations with approved strategic plans, disaggregated by association.
Semi-annual Q2- April 5 Annual - Oct 7
Q2- April 7 Annual – Oct 14
The second quarterly due in April and the annual due in October.
This indicator will plateau by the middle of next year and may have to be replaced with another indicator at that time. Baseline is 0 for 05, targets are established in the workplan.
5. Value of non-donor revenues generated by target associations.
Quarterly Q1- Jan. 6Q2- April 5 Q3- July 5 Annual- Oct 7
Q1- Jan 11 Q2- April 7 Q3- July 7 Annual – Oct 14
Quarterly Reports Annual Report
The baseline for 05 is 0. Change will not occur until the 3rd Q of 06. Intermediate steps in the process will be reflected in the workplan.
6. Number of target associations employing non-volunteer workers.
Annual Annual- Oct 7 Annual- Oct 14 Annual Report
Baseline is 0 for 05.
7. B2B Connections: Where B2B connections are facilitated, the team should report in the narrative what contracts and resulting sales occurred to the extent possible and feasible (this is in the cluster team guidance as well—coordinate where necessary).
Page 24 of 28
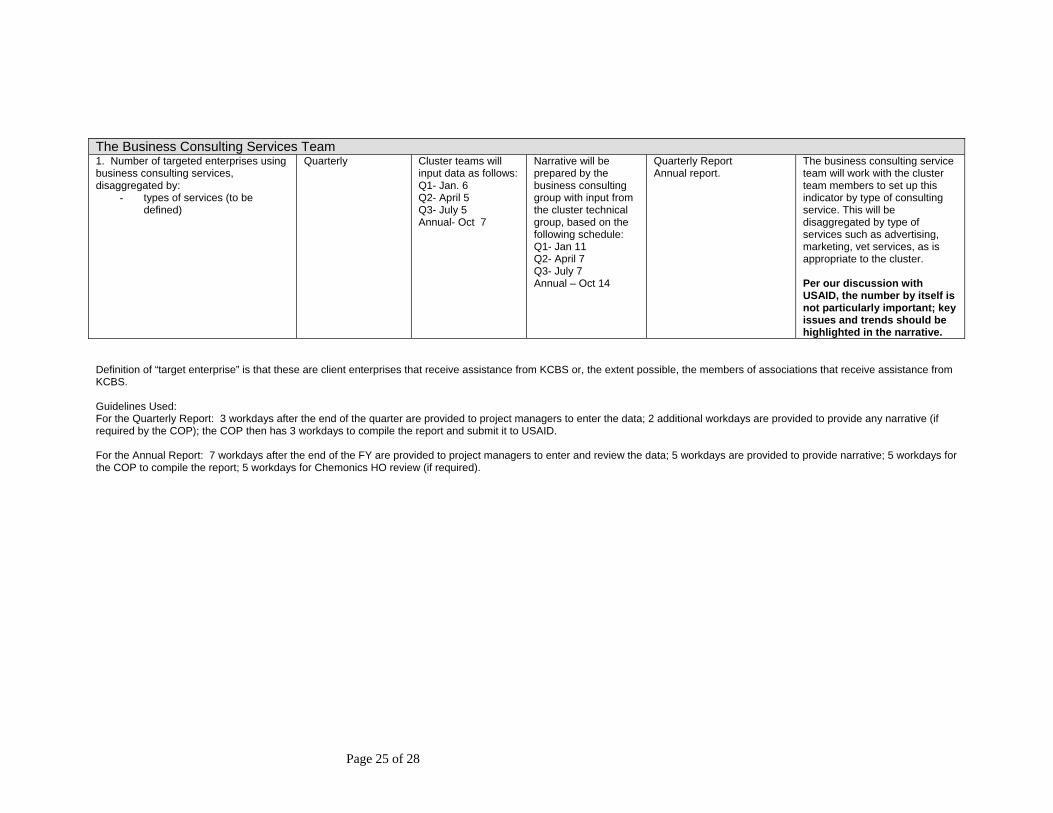
The Business Consulting Services Team 1. Number of targeted enterprises using business consulting services, disaggregated by:
- types of services (to be defined)
Quarterly Cluster teams willinput data as follows:
Narrative will be prepared by the business consulting group with input from the cluster technical group, based on the following schedule:
Q1- Jan. 6 Q2- April 5 Q3- July 5 Annual- Oct 7
Q1- Jan 11 Q2- April 7 Q3- July 7 Annual – Oct 14
Quarterly Report Annual report.
The business consulting service team will work with the cluster team members to set up this indicator by type of consulting service. This will be disaggregated by type of services such as advertising, marketing, vet services, as is appropriate to the cluster. Per our discussion with USAID, the number by itself is not particularly important; key issues and trends should be highlighted in the narrative.
Definition of “target enterprise” is that these are client enterprises that receive assistance from KCBS or, the extent possible, the members of associations that receive assistance from KCBS. Guidelines Used: For the Quarterly Report: 3 workdays after the end of the quarter are provided to project managers to enter the data; 2 additional workdays are provided to provide any narrative (if required by the COP); the COP then has 3 workdays to compile the report and submit it to USAID. For the Annual Report: 7 workdays after the end of the FY are provided to project managers to enter and review the data; 5 workdays are provided to provide narrative; 5 workdays for the COP to compile the report; 5 workdays for Chemonics HO review (if required).
Page 25 of 28

Draft 3/13/05 The Indicator and Reporting Guide for the PBMS Specialist
A Summary INDICATOR FREQUENCY
OF DATA COLLECTION
DUE DATE FOR DATA ENTRY *
DUE DATE FOR NARRATIVE*
REPORT COMMENTS
1. Value of company profit taxes collected, disaggregated.
Annual Q4- Oct 7 Oct 14 Annual report. How is it disaggregated? If a performance review session is held, then this data should be obtained for that purpose as well—need to discuss. This needs to be shared with the COP and the other teams so that they can analyze their programs in the context of these broader data.
2. Exports as a percentage of imports. Annual Q4- Oct 7 Oct 14 Annual report. Look at how it is disaggregated. 3. Number of companies registered Annual Q4- Oct 7 Oct 14 Annual report. If numbers exceed targets, may
need to examine whether 4. The Business Environment Index Annual Q4- Oct 7 Oct 14 Annual report Need to look at contract. Definition of “target enterprise” is that these are client enterprises that receive assistance from KCBS or, the extent possible, the members of associations that receive assistance from KCBS. Guidelines Used: For the Quarterly Report: 3 workdays after the end of the quarter are provided to project managers to enter the data; 2 additional workdays are provided to provide any narrative (if required by the COP); the COP then has 3 workdays to compile the report and submit it to USAID. For the Annual Report: 7 workdays after the end of the FY are provided to project managers to enter and review the data; 5 workdays are provided to provide narrative; 5 workdays for the COP to compile the report; 5 workdays for Chemonics HO review (if required).
Page 26 of 28
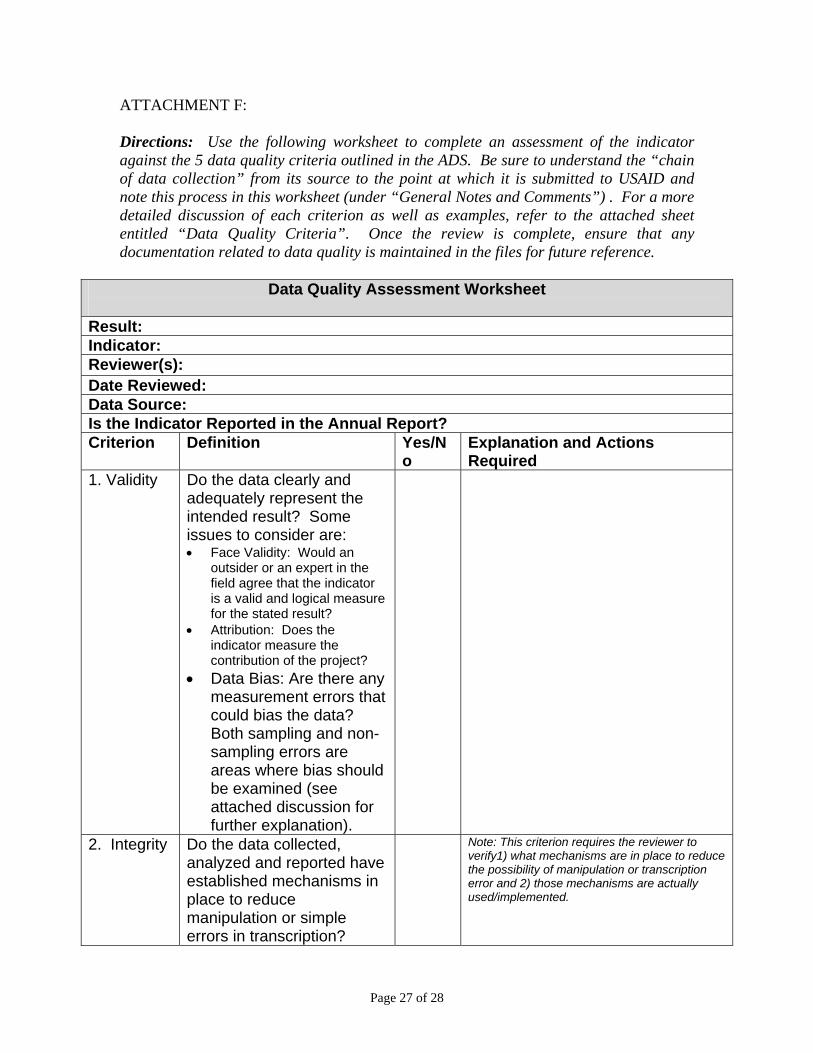
ATTACHMENT F: Directions: Use the following worksheet to complete an assessment of the indicator against the 5 data quality criteria outlined in the ADS. Be sure to understand the “chain of data collection” from its source to the point at which it is submitted to USAID and note this process in this worksheet (under “General Notes and Comments”) . For a more detailed discussion of each criterion as well as examples, refer to the attached sheet entitled “Data Quality Criteria”. Once the review is complete, ensure that any documentation related to data quality is maintained in the files for future reference.
Data Quality Assessment Worksheet Result: Indicator: Reviewer(s): Date Reviewed: Data Source: Is the Indicator Reported in the Annual Report? Criterion Definition Yes/N
o Explanation and Actions Required
1. Validity Do the data clearly and adequately represent the intended result? Some issues to consider are: • Face Validity: Would an
outsider or an expert in the field agree that the indicator is a valid and logical measure for the stated result?
• Attribution: Does the indicator measure the contribution of the project?
• Data Bias: Are there any measurement errors that could bias the data? Both sampling and non-sampling errors are areas where bias should be examined (see attached discussion for further explanation).
2. Integrity Do the data collected, analyzed and reported have established mechanisms in place to reduce manipulation or simple errors in transcription?
Note: This criterion requires the reviewer to verify1) what mechanisms are in place to reduce the possibility of manipulation or transcription error and 2) those mechanisms are actually used/implemented.
Page 27 of 28

3. Precision
Are data sufficiently precise to present a fair picture of performance and enable management decision-making at the appropriate levels?
4. Reliability
Do data reflect stable and consistent data collection processes and analysis methods over time?
Note: This criterion requires the reviewer to ensure that the indicator definition is operationally precise (i.e. it clearly defines the exact data to be collected) and to verify that the data is, in fact, collected according to that standard definition consistently over time.
5. Timeliness
Are data timely enough to influence management decision-making (i.e. in terms of frequency and currency)?
General Notes or Comments:
Page 28 of 28

March 24, 2005 MEMORANDUM (DRAFT) TO: Urim Ahmeti, The Program Office FROM: Tim Hammann, SO 1.3 Team Leader SUBJ: Proposed Changes to the Results Framework and Associated Indicators
This memo summarizes proposed changes to the results framework for SO 1.3 (at the sub-IR level) and associated indicators. These changes do not reflect substantive changes to the framework, but are rather refinements that have emerged from operationalizing the performance monitoring system. Attachment A outlines proposed revisions to the results framework and indicators. Attachment B outlines the original results framework (based on the PMP of November 9, 2004).
1. IR 1.3.1 Increased Competitiveness of Targeted Clusters: The PMP had
included an indicator “demand for domestic commodities and services in targeted clusters”, pending further discussions with KCBS. At this time, KCBS has proposed the indicator “labor productivity among targeted enterprises” (defined as full time equivalent labor per €100,000 of production) as an alternative. Increases in productivity demonstrate the growing competitiveness of target clusters as well as the improved productive capacity and direct investment in enterprises. It also reflects the ability of firms to become more competitive by adopting modern practices and innovations in order to increase value and reduce costs.
KCBS will reexamine whether “demand for domestic commodities and services” should be included in a survey during FY06. This issue also needs to be examined in light of the type of data that is collected by the associations at that point (i.e. this could be the type of data that they would most appropriately collect).
2. Sub-IR 1.3.1.1 Improved Productive Capacity of Private Enterprises: The
indicator “number of enterprises adopting improved technology” has been replaced with “value of capital investment among targeted enterprises”. The latter is a more direct measure of the result.
3. Sub-IR 1.3.1.1 Improved Market Chain Linkages: The SO team proposes that
this sub-IR be taken out as a discrete result for several reasons. First, the improvement of market chain linkages is a cross-cutting theme for the entire strategy. If linkages are improved, then sales, jobs and productivity will be improved. The work with the associations (on the right side of the RF) will also contribute to these linkages. Second, KCBS found it difficult to measure this as a discrete result from a practical point of view. The original idea was to measure the dollar value of trade contracts that occur as a result of B2B linkages, trade
1

shows, and marketing trips. It became apparent that it would be difficult to track this systematically after a linkage is facilitated. Nonetheless, KCBS will report any known sales resulting from these linkages in the reporting narrative on an ad hoc basis.
4. Sub-IR 1.3.1.2 Improved Quality Control: The indicator will be changed from
“number of enterprises complying with accepted quality standards to “number and type of standards approved by target associations”. This measure represents an appropriate indicator for progress in the early stages of the project (year 1). The first step in instituting improved quality control will be to work with associations to adopt key standards. During year 2, KCBS will examine whether an indicator can be used to reflect the application of those standards (e.g. percent of products that meet European standards) or whether this can be tied to export sales (under the assumption that if enterprises are selling to European markets, they must meet European standards). This is an issue that will be explored in the beginning of FY06, and may be incorporated into a KCBS survey.
5. Sub-IR 1.3.2.1 Strengthened Business Consulting Services: The indicator,
“sales of local consulting services” will be dropped. This indicator was premised on the idea that KCBS would be working with targeted consulting firms on a one on one basis. Instead, KCBS plans to work more broadly through the associations to facilitating linkages. As a result, this indicator becomes less practical to track. However, this issue will be revisited to determine whether it can be collected in the KCBS survey in FY06.
6. Sub-IR 1.3.2.2 Increased Use of Improved Business Practices: This sub-IR
will be deleted as a separate result because this concept is already reflected in sub-IR 1.3.2.1 Strengthened Business Consulting Services. In particular, the indicator “number of business using business consulting services” reflects the assumption that increase use will occur if the services are strengthened and targeted at the specific types of needs identified by businesses within targeted clusters. KCBS will provide accompanying narrative on which consulting services are used by businesses, trends, and examples of progress.
7. Sub-IR 1.3.2.2 Improved Policy Dialog: This result will be changed to
“Improved Capacity for Policy Dialog” to better reflect the program objective and to create a more “measurable” result.
The indicator “the number of improved advocacy campaigns” has been replaced by two new indicators. The associations will be engaged in policy dialog in a variety of ways that are not necessarily limited to advocacy campaigns. Second, KCBS is more directly focused on improving the capacity of the associations to collect and use economic data to inform decision-making. The two new indicators are:
2
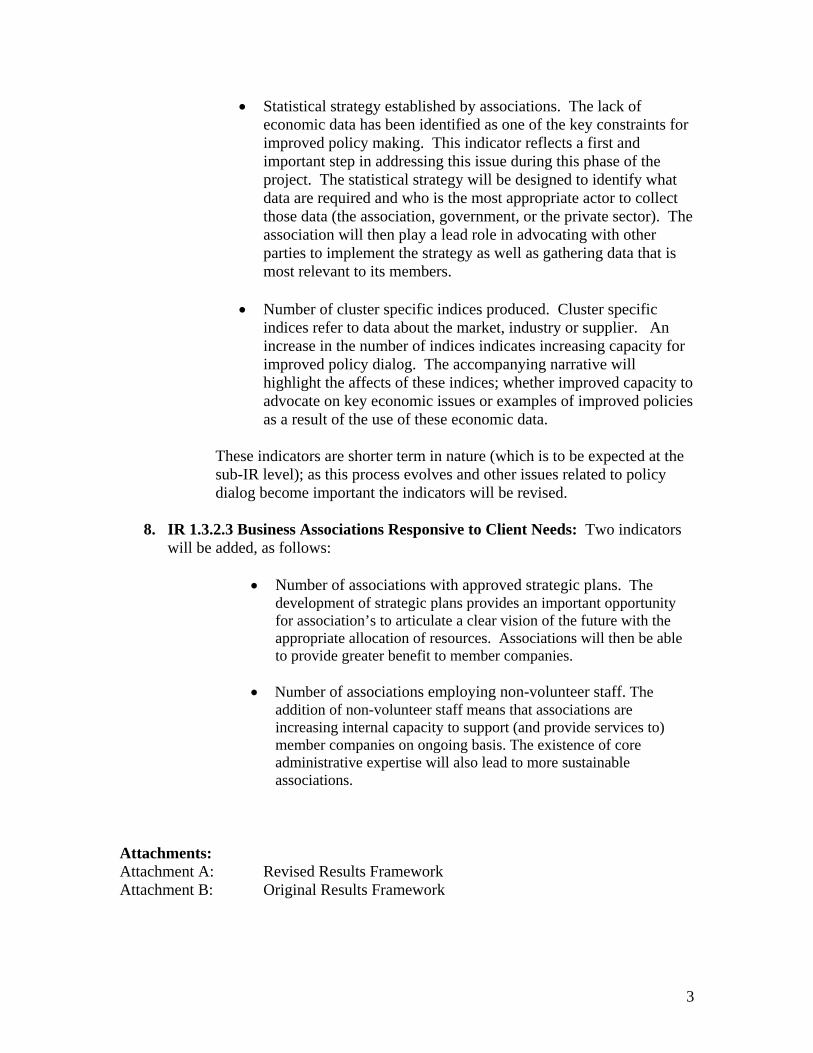
• Statistical strategy established by associations. The lack of economic data has been identified as one of the key constraints for improved policy making. This indicator reflects a first and important step in addressing this issue during this phase of the project. The statistical strategy will be designed to identify what data are required and who is the most appropriate actor to collect those data (the association, government, or the private sector). The association will then play a lead role in advocating with other parties to implement the strategy as well as gathering data that is most relevant to its members.
• Number of cluster specific indices produced. Cluster specific
indices refer to data about the market, industry or supplier. An increase in the number of indices indicates increasing capacity for improved policy dialog. The accompanying narrative will highlight the affects of these indices; whether improved capacity to advocate on key economic issues or examples of improved policies as a result of the use of these economic data.
These indicators are shorter term in nature (which is to be expected at the sub-IR level); as this process evolves and other issues related to policy dialog become important the indicators will be revised.
8. IR 1.3.2.3 Business Associations Responsive to Client Needs: Two indicators
will be added, as follows:
• Number of associations with approved strategic plans. The development of strategic plans provides an important opportunity for association’s to articulate a clear vision of the future with the appropriate allocation of resources. Associations will then be able to provide greater benefit to member companies.
• Number of associations employing non-volunteer staff. The
addition of non-volunteer staff means that associations are increasing internal capacity to support (and provide services to) member companies on ongoing basis. The existence of core administrative expertise will also lead to more sustainable associations.
Attachments: Attachment A: Revised Results Framework Attachment B: Original Results Framework
3

Attachment A USAID/KCBS
Performance Management Plan PROPOSED 3/12/05
IR.1.3.1 Increased Competitiveness of Targeted Clusters (1) Total sales among targeted enterprises
(2) Jobs created among targeted enterprises - AR (2)
(3) Labor Productivity among targeted enterprises
IR 1.3.2 Improved Business Operating Environment (1) Number of companies registered - AR (3)
(2) The Business Environment Index
IR 1.3.2.1 Strengthened Business Consulting Services (1) Number of businesses using business consulting services
IR 1.3.2.2 Improved Capacity for Policy Dialog (1) Statistical strategy established by associations (2) Number of cluster specific indices produced
IR 1.3.1.1 Improved Productive Capacity of Private Enterprises
(1) Value of Capital Investment among targeted enterprises
IR 1.3.1.2 Improved Quality Control (1) Number and type of standards approved by target associations
IR 1.3.1.3 Strengthened Capacity to Access Credit (1) Value of financing among targeted enterprises
IR 1.3.2.3 Business Associations Responsive to Client Needs (1) Number of associations with approved strategic plans
(2) Percent of non-donor revenues generated by the associations
(3) Number of associations employing non-volunteer staff
SO 1.3 Accelerated Private Sector Growth (1) Value of company profit taxes collected
(2) Exports as a Percentage of Imports - AR (1)
Note: Improved Market Chain Linkages underpins this entire strategy. If linkages are improved, then sales, jobs and productivity will be improved. In addition, the work with associations (on the right side of the framework) will contribute to improving those linkages.
4

Attachment B USAID/KCBS
Performance Management Plan ORIGINAL VERSION * SO 1.3 Accelerated Private Sector Growth Indicators: (1) Value of profit taxes collected (2) Exports as a percentage of imports (AR #1)
IR.1.3.1 Increased Competitiveness of Targeted Clusters Indicators: (1) Total sales within targeted clusters (2) Jobs created within targeted clusters (AR #2) (3) Demand for domestic commodities and services in targeted clusters. (TBD)
IR 1.3.2 Improved Business Operating Environment Indicators: (1) Number of companies registered (AR #3) (2) Business Environment Index
Sub-IR 1.3.1.2 Improved Quality Control (1) Number of enterprises complying with accepted quality standards
Sub-IR 1.3.1.1 Improved Productive Capacity of Private Enterprises(1) Number of enterprises adopting improved technology
Sub-IR 1.3.2.1 Strengthened Business Consulting Capacity (1) Number of businesses using local business consulting services (2) Sales of local business consulting services
Sub-IR 1.3.2.2 Increased Use of Improved Business Practices (1) Number of firms in compliance with accepted accounting practices
Sub-IR 1.3.1.3 Improved Market Chain Linkages (1) Value of transactions within the market chain
Sub-IR 1.3.2.3 Improved Policy Dialogue (1) Number of improved advocacy campaigns.
Sub-IR 1.3.1.4 Strengthened Capacity to Access Credit . (1) Value of loans to enterprises within targeted clusters
Sub-IR 1.3.2.4 Business Associations Responsive to Client Needs (1) Total value of membership contributions
5* Based on SO 1.3 PMP dated November 9, 2004