performance based design bangunan beton...
TRANSCRIPT

1
PERFORMANCE BASED DESIGN BANGUNAN BETON BERTULANG TIDAK BERATURAN TIGA DIMENSI MENGGUNAKAN ANALISIS INELASTIK
PERFORMANCE BASED DESIGN OF THREE DIMENSIONAL REINFORCED CONCRETE IRREGULAR BUILDINGS USING INELASTIC ANALYSIS
Sri Susanty Satya A.Dukalang1, Herman Parung2, Jonie Tanijaya3
1Mahasiswa Program Pasca Sarjana Jurusan Tekni Sipil Universitas Hasanuddin 2Dosen Tetap Jurusan Teknik Sipil Universitas Hasanuddin 3Dosen Jurusan Teknik Sipil Universitas Kristen Indonesia
Alamat Korespondensi: Sri Susanty Satya A Dukalang Fakultas Teknik Jurusan Sipil Universitas Hasanuddin Makassar, 90245 HP: 085242672732 Email: [email protected]
2
Abstrak Performance Based Design dapat digunakan sebagai pendekatan untuk mengatasi kerugian bangunan yang ditimbulkan oleh gempa bumi. Secara konsep, bangunan diberikan beban gempa berupa beban lateral yang mengakibatkan bangunan mengalami respon non linier. espons struktur bangunan berupa batas peralihan atap dan nilai dari performance level yang terdiri dari Operational (O), Immediate Occupancy (IO), Life Safety (LS) and Collapse Prevention (CP). Tujuan dari penelitian ini adalah untuk mencapai performance objektif pada Level Operational dan menentukan performance point. Bangunan yang di disain adalah bangunan beton bertulang tidak beraturan 5 tingkat dengan menggunakan sistem rangka pemikul momen, di atas tanah keras yang terletak di wilayah 6 dari peta gempa Indonesia. Hasil penelitian menunjukkan Base Shear bangunan berada pada 2321,5KN, Periode 1,038detik dan Performance Point berada pada 0,120m. Dapat disimpulkan bahwa bangunan berada pada ditinjau berada pada level Operasional dimana bangunan pada saat gempa tetap beroperasi dengan tingkat kerusakan yang kecil. Kata kunci: Performance Based Design, Performance Objective, Capacity Spectrum, Performance Point.
Abstract Performance Based Design can be useful approach for mitigating the potential losses due to hazards of earthquake. Conceptualized the problem is a building is loaded by earthquake-induced lateral forces that produce nonlinear response (damage) in structural components. Relations were established between structural response indices (drift limitations, inelastis member deformations), and performance level such as Operational (O), Immediate Occupancy (IO), Life Safety (LS) and Collapse Prevention (CP).The aim of this study are to find the performance objective of the building and to determine the performance point by doing inelastic analysis with pushover of 5 stories of irregular reinforced concrete building and determine the capacity of building structure. The target of Performance Objective is in Operational Level. Building was designed use moment resisting frame,located in hard soil and zone 6 of Indonesian seismic zone. Research shows that the base shear of the building model at 2321,5KN come on in the event of period at 1,038seconds and the Performanve Point is 0,120m. This can be concluded that the building model in this research at the Operational Level which means that the damage tobuilding during earthquake is small and continous in operation. Keywords: Performance Based Design, Performance Objective, Capacity Spectrum, Performance Point.

INTRODUCTION
Every structural system is designed to have a seismic capacity that exceeds the anticipated
seismic demand. Capacity is a complex function of strength, stiffness and deformability
conjectured by the system configuration and material properties of the structure.(Naem, 2007).
The development and use of performance-based design of buildings has been in progress for
several years, primarily within the seismic and blast communities. Within the engineering
community as a whole, the use of Performance based Design is being considered for applications to
specific design issues such as progressive collapse, as well as full-scale infrastructure projects such
as bridge designs (Tang, 2008).
Seismic Performance based Design was introduced in FEMA 273/274, published in October
1997, which was then issued in November 2000 as FEMA 356 –Prestandard and Commentary for
the Seismic Rehabilitation of Buildings. It is generally accepted that these efforts constituted the
first generation of seismic Performance based Design. ASCE 41-06 – Seismic Rehabilitation of
Existing Buildings has since superseded both versions of the FEMA standard.(FEMA 440, 2005)
Following the Northridge earthquake, the Applied Technology Council conducted a survey
of 530 buildings in which were located within 300 meters of strong motion recording sites. From
the total of 530 buildings which were located in the areas of strong shaking (San Fernando Valley,
Santa Monica, and West Los Angeles) with peak ground acceleration in their vicinity ranging from
0.15g to 1.78g, only 10 (less than two percent) showed heavy damage, a total of 78 buildings
(about 15-percent) showed moderate damage and 340 (64-percent) were marked by insignificant
damage. If response of these buildings were predicted by standard design analysis techniques, a far
worse picture would have been predicted (ATC,1996).
One of the main advances that the seismic Performance based Design paradigm offers is
that it acknowledges the uncertainty present in seismic design of buildings, or any other
infrastructure. The uncertainties in defining the seismic hazard, performing the design process, and
estimating consequences are all included within the paradigm. This is in sharp contrast with
prescriptive designs. Yet Performance based Design allows for far more freedom in prescribing
desired degrees of exceedance levels and probabilistic levels for the building. The ability to
determine an appropriate uncertainty level can be one of the major advantages of Performance
based Design. (Tang, 2008).
The aim of the study are to determine performance objective and performance point of the
building structure model. Performance objective is Performance Level that describes a limiting

damage condition. Performance point represents the point of the global behavior of the structure
that can able to handle the seismic ground motion.
METHODOLOGY
The type of this research is quantitative and the tool is computer softwere. The methodology
emphasizes the use of nonlinear analysis procedures in general and focuses on the capacity
spectrum method through pushover analysis. It provides a particularly rigorous treatment of the
reduction of seismic demand for increasing displacement.
The first step in Performance Based Design is to establish performance objectives described
as the combination of an expected performance level is an expression of the maximum desired
extent of damage to a building. The target of performance level of this research is in the level of
operational with the frequent of ground motion is 43 years, probability of axceedance 50% in 30
years on the basic Objective (Figure 1). It’s means that limit damage control not less 0,0001(Table
1).
Simplified nonlinear analysis procedures using pushover methods, such as the of capacity
spectrum method and displacement coefficient method, require determination of three primary
elements: capacity, demand (displacement) and performance. Each of these elements is briefly
discussed below.
Capacity : The overall capacity of a structure depends on the strength and deformation
capacities of the individual components of the structure. A lateral force distribution is again applied
until additional components yield. This process is continued until the structure becomes unstable or
until a predetermined limit is reached.
Demand (displacement) : Ground motions during an earthquake produce complex
horizontal displacement patterns in structures that may vary with time. Tracking this motion at
every time-step to determine structural design requirements is judged impractical. For nonlinear
methods it is more direct to use a set of lateral displecement as a design condition. For a given
structure and ground motion, the displacement demand is an estimate of the maximum expected
response of the building during the ground motion.
Performance : Once a capacity curve and demand displacement are defined, a performance
check can be done. A performance check verifies that structural and nonstructural components are
not damaged beyond the acceptable limit of the performance objective for the forces and
displacements implied by the displacement demand.
To find the point where demand and capacity are equal, the engineer selects a point on the
capacity spectrum as an initial estimate. Using the spectral acceleration and displacement defined
by this point, the engineer then can calculate reduction factors to apply to the 5% effective damping,

associated with the specific point. If the reduced demand spectrum intersects the capacity spectrum
at or near the initial assumed point, then it is the solution for the unique point where capacity equals
demand. In the other words, the building structure have the capacity to resist the demands of the
earthquake ground motion such that the perfomance of the structure is compatible with the
objectives of design.
To convert a spectrum from the standard 푆푎(Spectral Acceleration) vs T (Period) format
found in the building codes to ADRS format, it is necessary to determine the value of 푆푑 (Spectral
Displacement) for each point on the curve, 푆푎 ,Ti . This can be done with the equation:
푆푑 = 푆푎 푔 ... ... ... ... ... ... ... ... ... ... ... ... ... ... ... ... ... ... ... ... ... ... ... ... ... ... ... ... ... (1)
The capacity spectrum can be developed from the pushover curve by a point by point
conversion to the first mode spectral coordinates. Any point Vi (Base Shear), δi(Roof Displacement)
on the capacity (pushover) curve is converted to the corresponding point Sai, Sdi on the capacity
spectrum using the equations:
푆푎 = ... ... ... ... ... ... ... ... ... ... ... ... ... ... ... ... ... ... ... ... ... ... ... ... ... ... ... ... ... ... ... (2)
푆푑 = ,
... ... ... ... ... ... ... ... ... ... ... ... ... ... ... ... ... ... ... ... ... ... ... ... ... ... ... ... (3)
Where 훼1 and PF1 are the modal mass coefficient and participation factors for the first
natural mode of the structure respectively. ϕ1,roof is the roof level amplitude of the first mode. The
modal participation factors and modal coefficient are calculated as:
PF1=∑ ( )/∑ ( )/
... ... ... ... ... ... ... ... ... ... ... ... ... ... ... ... ... ... ... ... ... ... ... ... ... ... ... (4)
훼 = [∑ ( )/ ][∑ ( )/ ][∑ ( )/ ]
... ... ... ... ... ... ... ... ... ... ... ... ... ... ... ... ... ... ... (5)
Where wi is the weight at any level i.
Design of Building Model
The building frame system is moment resisting frames. Building location in seismic zone 6
on the map of earthquake seismic zone in Indonesia (SNI 1726). The model of building structure is
irregular building with five stories (Figure 2). The beam and column size show in Table 2. The
height at each story is 3,5m. The modulus of elasticity, E = 23677,926N, poisson ratio, U=0,2, fc’ =
25Mpa. Fy=390Mpa. The building structure will be analysis through pushover analysis and
evaluate the plastic hinge mechanism.

The Equivalent Static Lateral Force Analysis
The UBC-97 is very specific about when the static method can be used. In general, any
structure may be designed using the dynamic method at the option of the structural engineer, and
some structures must use the inelastic analysis method. The static method may be used for
buildings with the following characteristics are (1) Regular structures under 240ft (73 m) in heigtht
using one of the lateral force-resisting systems except regular structures located on soil profile SF
which hto fiveave natural periods greater than 0.7 sec, (2) Irregular structures less than or equalto
five stories or 65 ft (19.80m) in height, (3) Structures with flexible upper portions (e.g., towers)
supported on a rigid tower portion if three conditions are met: (1) both portions, when considered
individually, are regular, (2) the average story stiffness of the lower portion is at least ten times the
average story stiffness of the upper portion, and (3) the period of the entire structure is no more
than 1.1 times the period of the upper portion considered as a separate structure fixed at the base.
All structures not meeting these requirements, including irregular building, must be designed using
the inelastic analysis method.
Step by Step Input Data in Computer Softwere
Structure capacity is represented by a pushover curve. The most convenient way to plot the
force-displacement curve is by tracking the base shear and the roof displacement. When a softwere
computer program is used, the following procedure can be used to construct pushover curve are
(1)Create a computer model of the structure following the modeling rules in ACECOMS, AIT,
(2)Apply lateral story forces to the structure, should also include gravity loads,(3)Calculate member
forces for the required combinations of vertical and lateral load,(4)Adjust the lateral force level so
that some element is stressed,(5)Record the base shear and the roof displacement,(6)Revise the
model,(7)Apply a new increment of lateral load to the revised structure such that another element
yield,(8)Add the increment of lateral load and the corresponding increment of roof displacement to
the previous totals to give the accumulated values of base shear and roof displacement,(9)Repeat
steps 6,7,and 8 until the structure reaches an ultimate limit,(10)If the incremental loading was
stopped in step 9 as a result of reaching a lateral deformation level at which all or a significant
portion of an element’s load can no longer be resisted, that is, its strength has significantly
degraded, then the stiffness of the elements is reduced. A new capacity curve is then created,
starting with step 6. Create as many additional pushover curves as necessary to adequately define
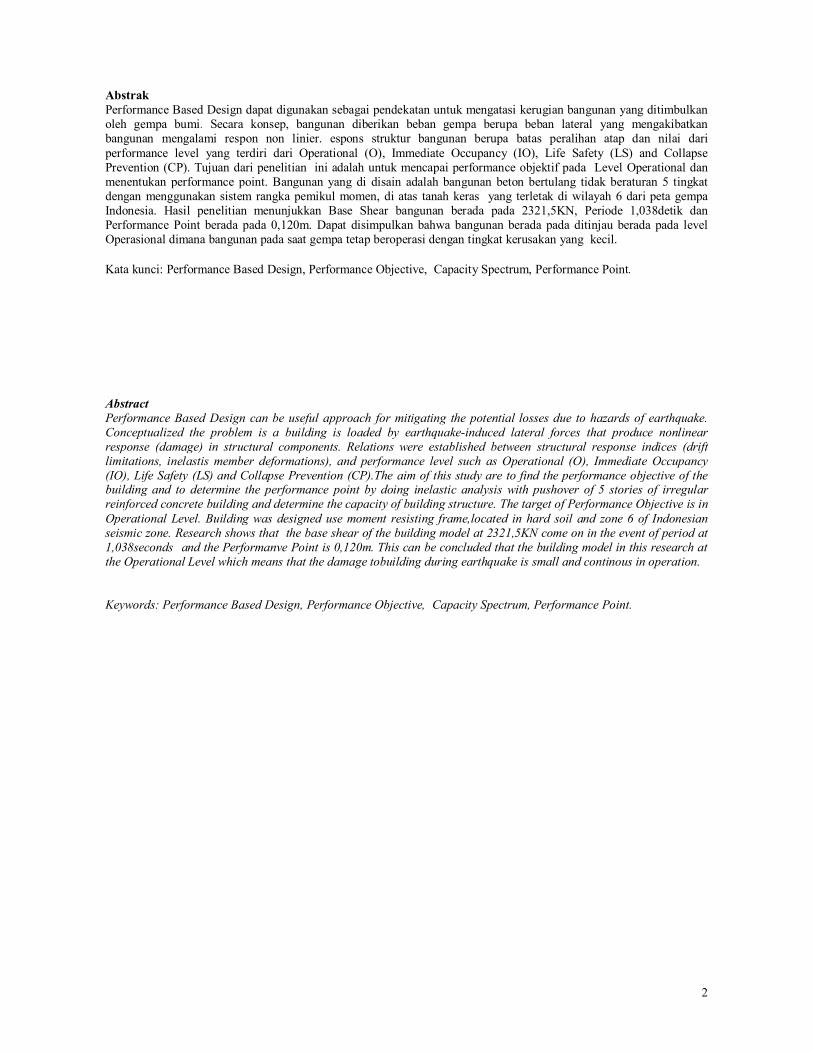
the overall loss of strength. Figure 3 illustrates the process, for an example where three different
capacity curves are required.(11)The Perfomance Point is intersection of capacity curve and
demand spectrum.

RESULTS
From the table of Pushover Curve (Table 3) shows that the Ultimate Force of the building is
2446.644 KN in step 11, there are 13 frames in Immediate Occupancy, 22 frames in Life Safety, 13
frames in Collapse. Yield Force is 2325.118 KN in step 6, there are 171 frames in Immediate
Occupancy.
From computer softwere, the capacity spectrum (Figure 5) shows that performance point is
in 0.12m. The Performance Point for is defined by the intersection of the pushover curve versus
displacement (green) and the single demand curve (grey).
The building’s roof displacement is 0,12m. Height building is 21m. The roof drit ratio is
0,005m. Hence, the performance objective of this building reach the target in Operational level
which maximum total drift limit not less 0,0001m.
DISCUSSION
This research found that the building level at in Operational Level in Performance Based
Design which means that building continous operation during earthquake ground motion with
frequent 43 years with the probably in 50% in 30 years and the damage is negligible.
Structure capacity is represented by a pushover curve (Figure 4). Pushover curve can estimate
of the maximum expected response of the building during the seismic ground motion. After create a
computer model of the structure following the modeling rules in ACECOMS, AIT (step by step
procedure), the pushover curve can be result. From Pushover Curve table can be found the number
of frame in each Performance Level such as Operational Level (that means no damage in beams),
Immediate Occupancy (that means minor damage to building), Life Safety (that means damage to
building is moderate), Collapse Prevention(that means damage to the building is severe).
Structure Performance can achieve if structure have a good capacity. On the other words,
structure must have a ductile pushover curve. Performance objective can found through capacity
spectrum. To check if building can reach Operational Level like the target of this research before,
the pushover curve must intersection with demand spectrum. The intersection of pushover curve
and demand spectrum is called Performance Point.

CONCLUSIONS
The conclusions from the analysis are the performance objective of this building is in
Operational level which means the building continues in operation with negligible damage after
frequent event of seismic ground motion and the performance point of this building occur at
0,120m and the base shear at 2321,5KN come on in the event of period at 1,038seconds.
REFERENCES ATC-40. (1996). Applied Technology Council. Volume 1 and 2, Report No. SSC 96-01, Seismic
Safety Commission, Redwood City, CA. ACECOMS, AIT. (2007). SAP 2000 Practical Example. FEMA 440. (2005). Improvement of nonlinear static seismic analysis procedures, Washington, D.C Naeim, F. (2007). The Seismic Design Handbook, Second Edition. Paz, Mario and Leigh, William. (2004). Structural Dynamics, by Kluwer Academic Publishers. Powell, Graham. (2009). Performance Based Design Using Nonlinear Analysis. Seminar Notes. SNI. (2002). SNI-1726-2002, Standar Perencanaan Ketahanan Gempa Untuk Struktur Bangunan
Gedung, Standar Nasional Indonesia . Tang, Margaret. (2008). Performance Based Design with Application to Seismic Hazard. Structure
Magazine UBC.(1997). Earthquake Design Volume 2 Division IV, , ICBO.

Appendix
Figure 1. Performance Objective
(a) The 3D perspective of Building (b) The Plan of Building
Figure 2, The 3D perspective and Plan of Building
Seism
ic
Haz
ard
Earthquake Performance Level
Life Safety Operational Collapse Prevention
Immediate Occupancy
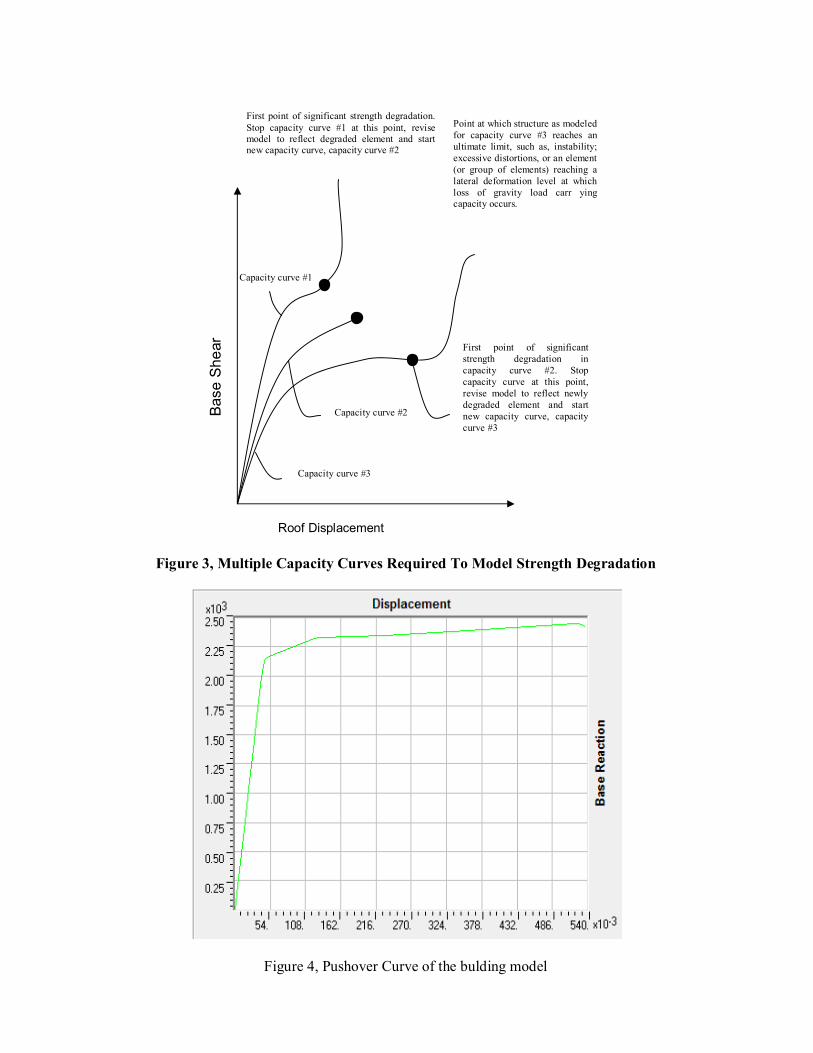
Figure 3, Multiple Capacity Curves Required To Model Strength Degradation
Figure 4, Pushover Curve of the bulding model
Capacity curve #3
Base
She
ar
Roof Displacement
First point of significant strength degradation in capacity curve #2. Stop capacity curve at this point, revise model to reflect newly degraded element and start new capacity curve, capacity curve #3
First point of significant strength degradation. Stop capacity curve #1 at this point, revise model to reflect degraded element and start new capacity curve, capacity curve #2
Point at which structure as modeled for capacity curve #3 reaches an ultimate limit, such as, instability; excessive distortions, or an element (or group of elements) reaching a lateral deformation level at which loss of gravity load carr ying capacity occurs.
Capacity curve #1
Capacity curve #2

Figure 5, Performance Point of the bulding model
Tabel 1, Deformation Limit.
Perfomance Limit Interstrory Drift Limits
Immediate Occupancy
Damage Control
Life Safety
Maximum Total Drift 0.01 0.01- 0.02 0.02 Maximum Inelastic Drift
0.005 0.005- 0.015 No Limit
Table 2, Size of beam and column _________________________________ Element 5 stories ------------------------------------------------------------- Beam (mm) 300 x 500 Column (mm) 600 x 600 ------------------------------------------------------------- f’c = 25 MPa;
fy = 390 MPa;
Total Heigth = 21 m
Performance Point

Table 3, Pushover Curve Table
Step Displacement BaseForce
A to
B
B to
IO
IO
to
LS
LS
to
CP
CP
to
C
C
to
D
D
to
E
Beyond
E
m KN
0 5.38E-06 0 516 0 0 0 0 0 0 0
1 0.039676 1933.897 510 6 0 0 0 0 0 0
2 0.043263 2085.619 450 66 0 0 0 0 0 0
3 0.045237 2126.896 411 105 0 0 0 0 0 0
4 0.046469 2142.347 391 125 0 0 0 0 0 0
5 0.05131 2169.997 365 151 0 0 0 0 0 0
6 0.122007 2325.118 345 171 0 0 0 0 0 0
7 0.129239 2333.51 342 174 0 0 0 0 0 0
8 0.229239 2345.647 342 114 60 0 0 0 0 0
9 0.33185 2383.496 339 3 174 0 0 0 0 0
10 0.473487 2428.729 334 8 45 129 0 0 0 0
11 0.521074 2446.644 329 13 22 139 0 13 0 0
12 0.525724 2445.962 329 13 18 121 0 35 0 0
13 0.530463 2440.878 329 13 14 105 0 55 0 0
14 0.537525 2424.231 329 13 13 73 0 88 0 0