performance appraisal in bsnl
TRANSCRIPT

1
ABSTRACT
The Bharat Sanchar Nigam Limited located in GM Office Bibikulam,
Madurai. BSNL is India’s oldest and largest communication Service Provider. Currently
BSNL has a customer base of 64.8million (basic and mobile telephony). It has footprints
throughout India except for the metropolitan cities of Mumbai and New Delhi which are
managed by MTNL.
Objectives of the study are to find out the satisfaction level of the performance
appraisal system, to analyze the level of achievement, to estimate the benefit of the
performance appraisal system to the organization and to the individual.
The study is conducted by survey method using structured questionnaire with five
point rating scale. Total population study was adopted. Data was analyzed using simple
percentage and chi-square test.
The study had been conducted to analyze the effectiveness of performance
appraisal system on the managerial employees of the Bharat Sanchar Nigam Limited.
Effective performance appraisal method encourages employees in work and it also
helps in improving their individual responsibility which in turn improves profitability of the
organization.
2
1. INTRODUCTION
1.1 RESEARCH BACKGROUND
A “performance appraisal” is a process of evaluating an employee’s performance
of a job in terms of its requirements. It is a “process of estimating or judging the value,
excellence, qualities or status of some object, person or thing”. Performance appraisal has
been considered as a most significant and essential tool for an organization, for the
information it provides is highly useful in making decisions regarding various personal
aspects such as promotions and merit increases.
McGregor says: “Formal performance appraisal plans are designed to meet three needs, one
of the organization and the other two of the individual, namely:
(i) They provide systematic judgments to back up salary increases, transfers,
demotions or terminations.
(ii) They are means of telling a subordinate how he is performing, and
suggesting needed changes in his attitudes, skills or job knowledge. They
let him know “where he stands” with the boss.
(iii) They are used as a base for coaching and counseling the individual by the
superior.
On the basis of merit rating or appraisal procedures of various companies in India, the main
objectives of employee performance appraisal are:
(i) To enable an organization to maintain an inventory of the number and
quality of all managers and to identify and meet their training needs and
aspirations;
(ii) To determine increments rewards and provide a reliable index for
promotions and transfers to positions of greater responsibility;
(iii) To maintain individual and group development by informing the employee
of his performance standard;
(iv) To suggest ways of improving the employee’s performance when he is not
found to be up to the mark during the review period.
(v) To identify training and development needs and to evaluate effectiveness
of training and development programs.
3
(vi) To plan career development, human resources planning based on
potentialities.
1.2 COMPANY PROFILE
Overview of BSNL
BSNL is India’s oldest and largest communication Service Provider. Currently BSNL
has a customer base of 64.8 million (basic and mobile telephony). It has footprints
throughout India except for the metropolitan cities of Mumbai and New Delhi which are
managed by MTNL. As on March 31, 2007 BSNL commanded a customer base of 33.7
million wire line, 3.6 million CDMA-WILL and 27.5 million GSM mobile subscribers.
BSNL’s earnings for the Financial Year ending March 31, 2006 stood at INR 401.8b
(US$9.09 billion) with net profit of INR 89.4b (US$ 2.02 billion).
Profile of organization:
History:
The foundation of Telecom Network in India was laid by the British sometime in 19 th
century. The history of BSNL is linked with the beginning of Telecom in India. In 19 th
century and for almost entire 20th century, the Telecom in India was operated as a
Government of India wing. Earlier it was part of erstwhile post and Telegraph
Department (P&T). In 1975 the Department of Telecom (DoT) was separated from
P&T. DoT was responsible for running of Telecom services in entire country until 1985
when Mahanagar Telephone Nigam Limited(MTNL) was carved out of DoT to run the
telecom services of Delhi and Mumbai. It is a well known fact that BSNL was carved
out of Department of Telecom to provide level playing field to private telecoms.
Subsequently in 1990s the telecom sector was opened up by the Government for Private
Investment, therefore it became necessary to separate the Government’s policy wing
from Operations wing. The Government of India corporatized the operations wing of
DoT on October 01, 2000 and named it as Bharat Sanchar Nigam Limited (BSNL).
BSNL operates as a public sector.
Main services being provided by BSNL:
BSNL provides almost every telecom service, however following are the main
Telecom services being provided by BSNL in India:-

4
UNIVERSAL TELECOM SERVICES: Fixed wire line services and
wireless in Local Loop (WLL) using CDMA Technology called bfone and
Tarang respectively BSNL is dominant operator in fixed line. As on March 31,
2007(end of financial year) BSNL had 76% share of fixed and WLL phones.
BSNL MOBILE- CELL ONE, PRE-PAID-EXCEL
CELLULAR MOBILE TELEPHONE SERVICES: BSNL is major
provider of Cellular Mobile Telephone Services using GSM platform under
brand name Cellone. Pre-paid Cellular Services of BSNL are know as Excel.
As on March 31, 2007 BSNL had 17% share of mobile telephony in the
country. DATA ONE BROAD BAND
INTERNET: BSNL is providing internet as dial-up connection (sancharnet)
and ADSL- Broad band Data one. BSNL has around 50% market share in
broadband in India. BSNL has planned aggressive rollout in broadband for
current financial year.
INTELLIGENT NETWORK: BSNL is providing IN services like Tele-
voting, toll free calling, premium calling etc.
BSNL present and future:
Since its corporation in October 2000, BSNL has been actively providing Connections
in both urban and rural areas and the efficiency of the company has drastically
improved from the days when one had to wait for years to get a phone connection to
now when one can get a connection in even hours. Pre-activated mobile connections
are available at many places across India. BSNL has also unveiled very cost effective
Broadband internet access plans (Data One) targeted at homes and small businesses.
At present BSNL enjoys 47% of market share of ISP services.

5
Year of broadband 2007- BSNL
Former Indian Communications Minister Thiru Dayanidhi Maran had declared year
2007 as “Year of Broadband” in India and BSNL is gearing up to provide 5 million
Broadband connectivity by the end of 2007. BSNL has upgraded existing Dataone
(Broadband) connections for a speed of up to 2 Mbit/s without any extra cost. This
2Mbit/s broadband service is being provided by BSNL at a cost of just US$ 5.5 per
month. Further, BSNL is planning to upgrade its broadband services to Triple play
(Telecommunications) in 2007.
BSNL has been asked to add 108 million customers by 2010 by Former Indian
Communications Sector in India, the target appears achievable, however due to
intense competition in Indian Telecom sector in recent past BSNL’s growth has
slowed down.
BSNL is pioneer of Rural Telephony in India. BSNL has recently bagged 80% of US$
580m (INR 2,500 crores) Rural Telephony project of Government of India.

6
Challenges:
During Financial year 2007-2008(From April 01,2006 to March 31, 2007) BSNL has
added 9.6 Million new customers in various telephone services taking its customer
base to 64.8 Million. BSNL’s nearest competitor Bharti Airtel is standing at a
customer base of 39 Million. However, despite impressive growth shown by BSNL in
recent times, the fixed line customer base of BSNL is declining. In order to woo back
its fixed-line customers BSNL has brought down long distance calling rate under One
India plan, however, the success of the scheme is not known. However, BSNL faces
bleak fiscal 2006-2007 as users flee, which has been accepted by the CMD BSNL.
Presently there is an intense competition in Indian Telecom Sector and various
Telco’s are rolling out attractive schemes and are providing good customer services.
However, BSNL being legacy operator and its conversion from a Government
Department earns lot of criticism for its poor customer service. Although in recent
past there have been tremendous improvement in working of BSNL but still it is much
below the Industry’s Expectations. A large aging (average age 49 years (appx)
workforce (300,000 strong)), which is mostly semiliterate or illiterate is the main
reason for the poor customer service. Further, the Top management of BSNL is still
working in BSNL on deputation basis holding Government employee status thus
having little commitment to the organization. Although in coming years the retirement
profile of the workforce is very fast and around 25% of existing workforce will retire
by 2010, however, still the workforce will also remain an issue.
Access Deficit Charges (ADC, a levy being paid by the private operators to BSNL for
provide service in non-lucrative areas especially rural areas) has been slashed by 37%
by TRAI, w.e.f. April 01, 2007. The reduction in ADC may hit the bottom-line of
BSNL.

7
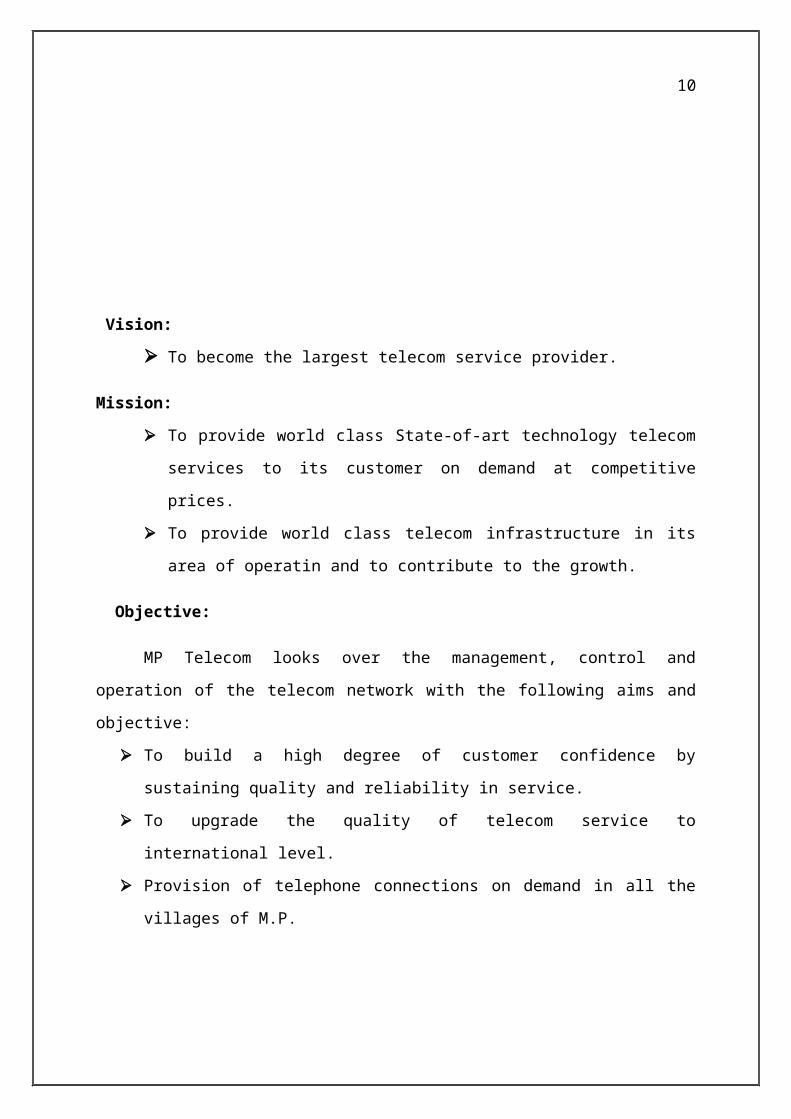
Vision:
To become the largest telecom service provider.
Mission:
To provide world class State-of-art technology telecom services to its customer on
demand at competitive prices.
To provide world class telecom infrastructure in its area of operatin and to
contribute to the growth.
Objective:
MP Telecom looks over the management, control and operation of the telecom
network with the following aims and objective:
To build a high degree of customer confidence by sustaining quality and reliability in
service.
To upgrade the quality of telecom service to international level.
Provision of telephone connections on demand in all the villages of M.P.
Expansion of new services like Internet, Intelligent Network, ISDN, Internet,
Telephony, Video Conferencing, Broadband etc.
Popularize Broadband services and to be on-demand in the whole state.
Expansion of Cellular Mobile Telephone to all towns.
To open Internet Kiosks(café’s) at all Block Head Quarters.
To improve the quality of present services being given to the subscribers.
To open more Customer Service Centres and upgrade the existing customer service
centres for better and friendly customer care.
Modernize PSTN network by making RSUs & AN-RAX.
Plantation of Trees to make environment Clean & Green.
To raise necessary financial resources for its developmental needs.
To increase accessibility of services, by providing a large number of Local and
NSD/ISD Public Call Offices (PCOs) so as to reach out to the masses.
8
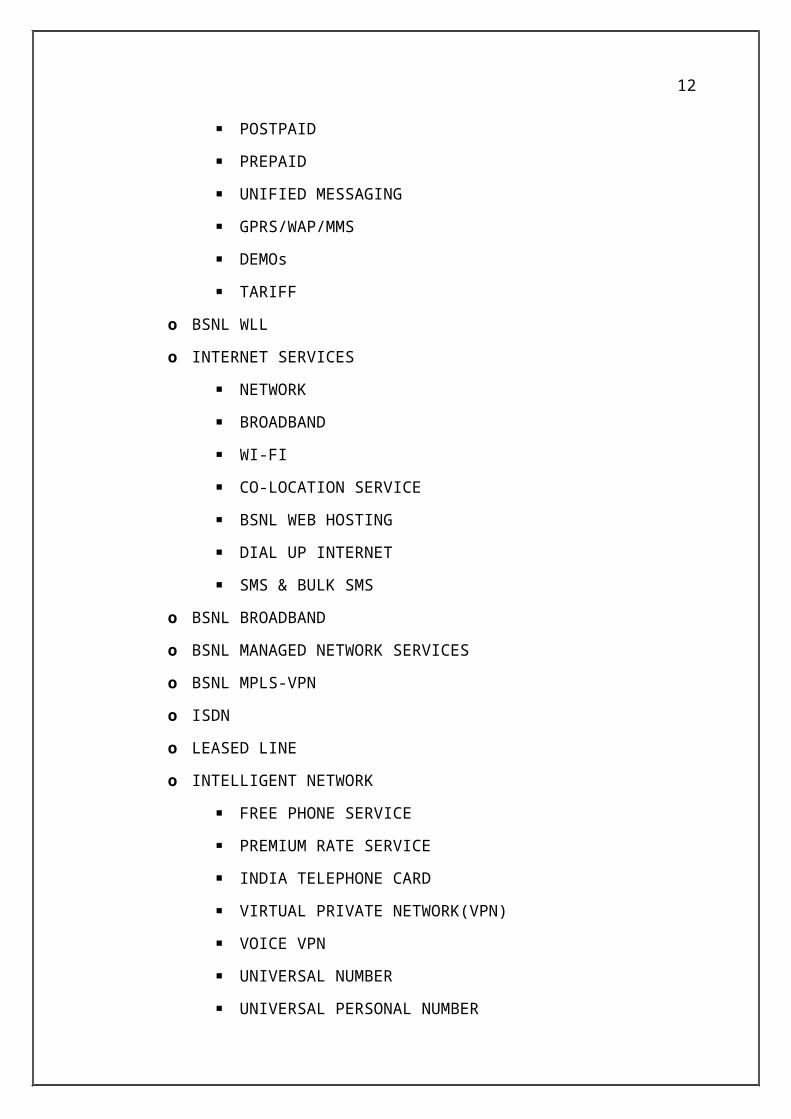
Products:
BSNL LANDLINE
o BSNL MOBILE
POSTPAID
PREPAID
UNIFIED MESSAGING
GPRS/WAP/MMS
DEMOs
TARIFF
o BSNL WLL
o INTERNET SERVICES
NETWORK
BROADBAND
WI-FI
CO-LOCATION SERVICE
BSNL WEB HOSTING
DIAL UP INTERNET
SMS & BULK SMS
o BSNL BROADBAND
o BSNL MANAGED NETWORK SERVICES
o BSNL MPLS-VPN
o ISDN
o LEASED LINE
o INTELLIGENT NETWORK
FREE PHONE SERVICE
PREMIUM RATE SERVICE
INDIA TELEPHONE CARD
VIRTUAL PRIVATE NETWORK(VPN)
VOICE VPN
UNIVERSAL NUMBER
UNIVERSAL PERSONAL NUMBER
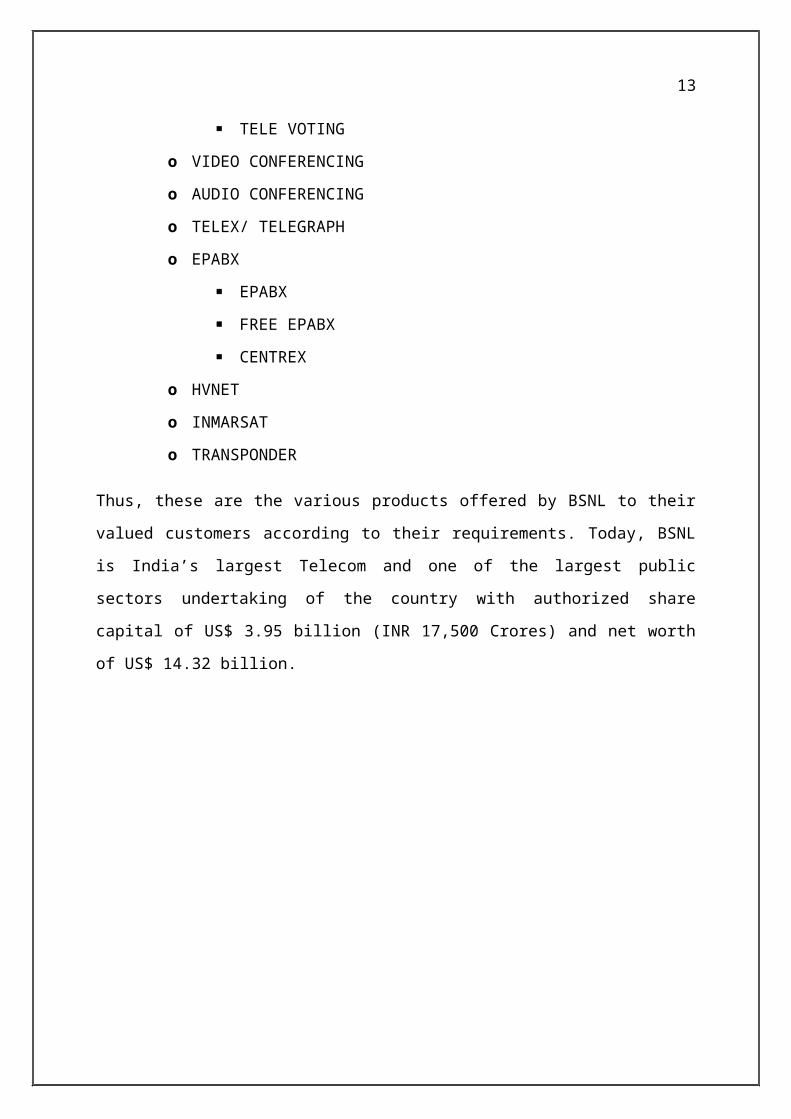
TELE VOTING
9
o VIDEO CONFERENCING
o AUDIO CONFERENCING
o TELEX/ TELEGRAPH
o EPABX
EPABX
FREE EPABX
CENTREX
o HVNET
o INMARSAT
o TRANSPONDER
Thus, these are the various products offered by BSNL to their valued customers according to
their requirements. Today, BSNL is India’s largest Telecom and one of the largest public
sectors undertaking of the country with authorized share capital of US$ 3.95 billion (INR
17,500 Crores) and net worth of US$ 14.32 billion.
10
2.1 OBJECTIVES OF THE STUDY
To find out the satisfaction level for the Performance Appraisal system in the BSNL
(Bharat Sanchar Nigam Limited).
To get suggestions from the employees for further improvement in existing
performance appraisal system.
To contribute to the growth of the organization
To measure the subjectivity and objectivity, which influence the existing
Performance appraisal system and remove the subjectivity and to increase the
objective.

11
2.2 REVIEW OF LITERATURE
In this chapter a detailed review of literature is dealt upon the topic of Performance
Appraisal.
2.2.1 First Literature
Project Name: “Due process in Performance Appraisal: a quasi-experiment in procedural
justice.”
Author: M.Susan Taylor
Abstract:
Appraisal systems seem to offer much potential for enhancing the effectiveness of
human resource decisions and for satisfying employees’ need for performance feedback.
There is evidence that appraisal systems are a practical challenge to the academics who often
design them and to the managers and employees who must use them.
Conclusion:
Many organizational appraisal systems have failed to realize their full potential
contribution to organization effectiveness.
12
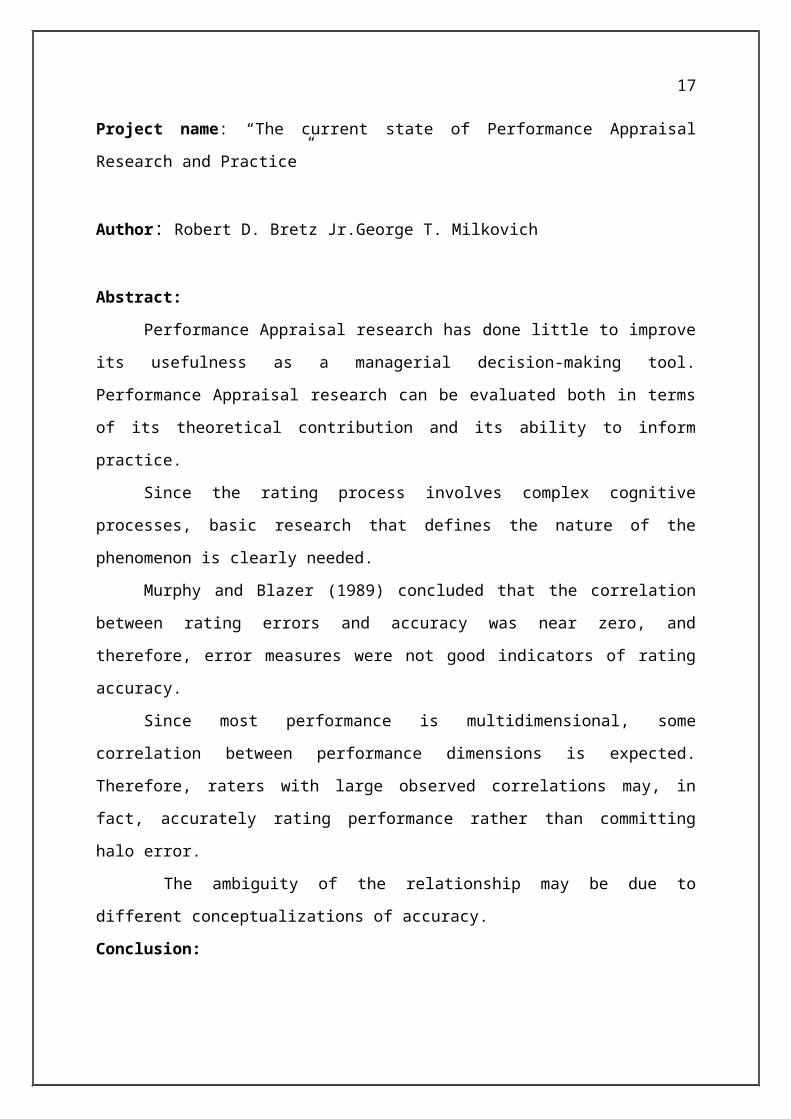
2.2.2 Second Literature
Project name: “The current state of Performance Appraisal Research and Practice”
Author: Robert D. Bretz Jr.George T. Milkovich
Abstract:
Performance Appraisal research has done little to improve its usefulness as a
managerial decision-making tool. Performance Appraisal research can be evaluated both in
terms of its theoretical contribution and its ability to inform practice.
Since the rating process involves complex cognitive processes, basic research that
defines the nature of the phenomenon is clearly needed.
Murphy and Blazer (1989) concluded that the correlation between rating errors and
accuracy was near zero, and therefore, error measures were not good indicators of rating
accuracy.
Since most performance is multidimensional, some correlation between performance
dimensions is expected. Therefore, raters with large observed correlations may, in fact,
accurately rating performance rather than committing halo error.
The ambiguity of the relationship may be due to different conceptualizations of
accuracy.
Conclusion:
Performance Appraisal research and practice seem to converge on many issues and
diverge on others. Divergence on some issues is not necessarily a problem since relevancy for
decision makers is not the purpose for all research efforts. Yet Performance evaluation is an
applied subject, and as such research should eventually lead to improvements in practice.
13
2.2.3 Third Literature
Project name: Self-monitoring and performance appraisal
Author: Janice S. Miller, Robert L. Cardy
Abstract:
Two studies examined the relationship between rate self monitoring and performance
appraisal in project teams using three appraisal sources: Self, Peer and Supervisor.
Study1, a laboratory study, found that high self-monitoring (HSM) subjects produced
self- rating significantly higher than their low self-monitoring (LSM) counterparts. Further,
higher agreement among sources occurred for LSM than for HSM subjects. HSM’s tendency
to portray themselves differently to various audiences resulted in less rating convergence
across sources.
Study 2 employing project teams in five corporations, replicated the convergence
findings. Implications for use of various sources of appraisal and for understanding the role
of self-monitoring in performance appraisal are discussed.

14
2.2.4 Fourth Literature
Project name: HR Competency Project
Author: Brain Foster, Human Resource Administrator
Abstract:
In accordance with Governor Freudenthal’s goal to implement a fair and equitable
compensation plan, which includes a bonus for exceptional performance, it was determined
that the current performance appraisal system does not provide the necessary tools to
accurately measure job performance.
The decision was made to develop a performance appraisal system that will more
effectively assist supervisors in evaluating and working with employees to achieve their
greatest potential. The system under development encompasses the concept of total
performance management, which involves all aspects of employee supervision.
In order to develop a performance appraisal that incorporates the concept of total
performance management, it is necessary to identify the competencies on which performance
and employee growth will be measured.
Total performance management must achieve three distinct goals. Implementing a
system that ties the performance of the employee’s towards the goals of the agency. This will
demonstrate to employees the impact they have on the outcomes of the organization.
Conclusion:
Training supervisors to obtain the competencies to accurately manage the
performance of employees from start (hiring) to finish (separation from employment).
Setting up the foundation for recruiting individuals who possess the competencies that the
state has been identified as necessary which is to be a successful and productive state
employee.

15
2.3 RESEARCH METHODOLOGY
2.3.1 DATA PROCESSING
Type of Data
There are 2 types of data available to a researcher. They are primary data and secondary data
Primary Data
Primary data was collected from employees through the interview schedule.
Secondary Data
Secondary data is the organization profile and was collected from the website.
2.3.2 SAMPLING METHODS
Sampling Framework
Type of Survey : Sample Survey
Sample Unit : Employees from Bharat Sanchar Nigam Limited
Sample Size : The sample size was limited to 100.
Sampling Plan : Stratified Sampling Technique
Descriptive Research Design
This study is a descriptive research design based on survey method; First hand data
were collected from the employees through questionnaire method. Descriptive research
describes the characteristics of a particular individual, or of a group, the researcher has
come to know the need of performance appraisal required in BSNL so survey will be
made to know the level of performance appraisal level from the employees in Bharat
Sanchar Nigam Limited (GM office) Madurai.

16
2.3.3 DATA COLLECTION PROCESS
The employees were met at their organization and interview schedule was distributed to them
for which their responses were collected.
2.3.4 TOOLS FOR ANALYSIS
Percentage Analysis
Percentage method is adopted to derive the exact representation of each of the attribute
from a group of responses. For each of the responses group total is first ascertained.
Each individual responds in the group of the divided by the total of the group can
multiple by hundred and the percentage is derived. Highest percentage is given first
rank followed by other descending rankings.
No. of response Percentage of respondents = ---------------------------------- * 100 Total number of respondent
17
Chi-Square Analysis
A chi square test, developed by Prof.Fisher is considered as an important test amongst
the several tests used in statistics for judging the significance of the sampling data. It is
statistical measure with the help of which it is possible to assess the significance of the
difference between the observed frequencies and the expected frequencies obtained
from some hypothetical universe. Chi-square test enables us to test whether more than
two population proportion can be considered equal. In order to that a chi-square test
may be grouped in some way and the theoretical distribution must be adjusted to give
the same total frequency which is equal to that of observed frequencies. The observed
and expected frequencies completely coincide when the chi-square is zero.
Chi-square is calculated with the help of following formula
X2 = (O-E) 2 E
Where O = Observed frequency E = Expected frequency
E = Row total x Column total
Grand total
2.3.5 Limitations of the Study
Geographical
The study is limited to Bharat Sanchar Nigam Limited GM office B.B.Kulam
Madurai.
Temporal
The period of research is limited for a short span. Hence, all data & their temporal
context may pertain to change in future.

18
3. ANALYSIS AND INTERPRETATION
3.1 DATA ANALYSIS
In the collection of data, there are two important things - the sources of information and
the method of collecting the data. Sources of data can be primary or secondary. Primary
sources include the original documents i.e. the first reporting of facts while secondary
sources are facts from primary sources.
According to PROF JOHN GATTING –“Analysis of data refers to seeking the data in
the light of hypothesis of research questions and the prevailing theories and drawing
conclusions that are as amenable to theory formation as possible ”Interpretation is the
task of drawing conclusions and inferences from a careful analysis of data.
Analysis and Interpretation means mass data need to be reduced to meaningful number
by using various statistical devices like averages, mean, percentage, correlation, rank
correlation, regression, pie diagrams, simple bar diagram, horizontal bar diagram,
cylindrical bar diagram, graph, percentage bar diagram etc. For materials evaluation,
relevance, suitability for age, needs of learners and sequencing are also to be seen.
3.2 DISCUSSION
The data’s collected are discussed by applying statistical tools namely Percentage
Analysis & Chi-Squrae Analysis and they are represented in diagrammatic form and
inference are given for each factors in this chapter.

19
3.3 DIAGRAMMATIC REPRESENTATAION
TABLE 3.3.1
GENDER OF THE EMPLOYEES:
S. No Gender No. of Respondents Percentage (%)
1 Female 37 37.0
2 Male 63 63.0
TOTAL 100 100.0
FIGURE 3.3.1
37%
63%
FemaleMale
INFERENCE
From the above table it is inferred that 37.0% of the respondents are
Female and 63.0% of the respondents are male respondents.
20
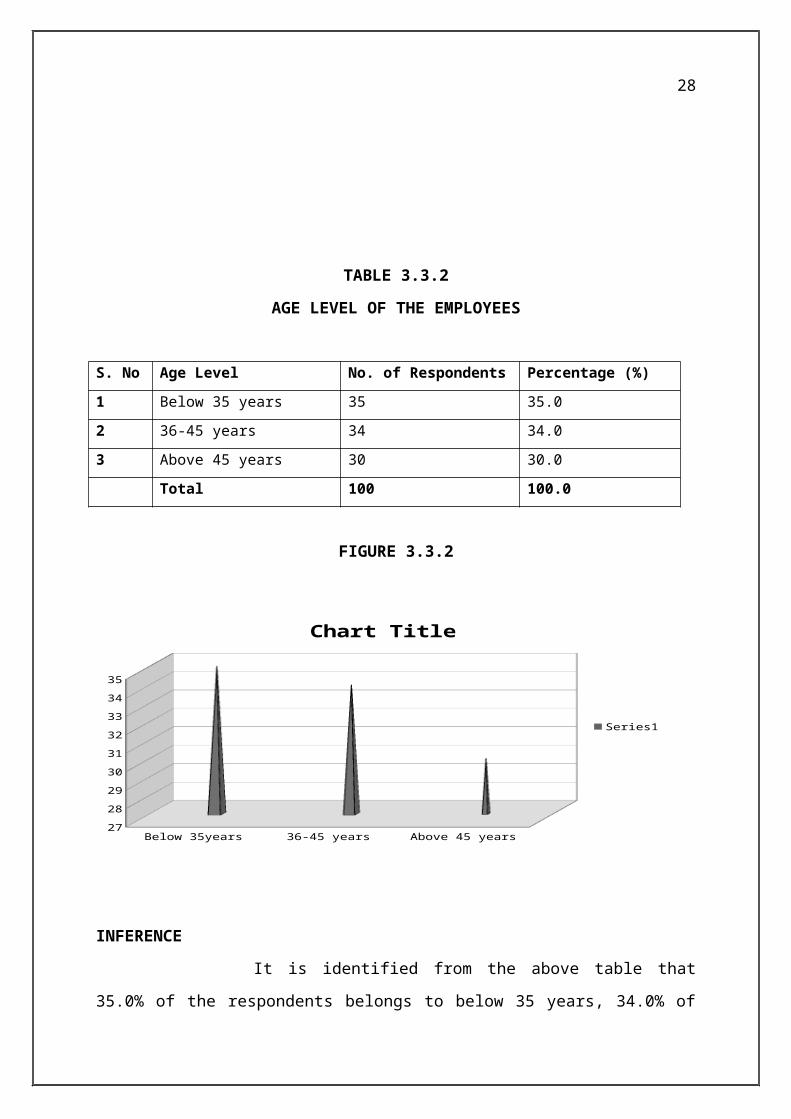
TABLE 3.3.2
AGE LEVEL OF THE EMPLOYEES
S. No Age Level No. of Respondents Percentage (%)
1 Below 35 years 35 35.0
2 36-45 years 34 34.0
3 Above 45 years 30 30.0
Total 100 100.0
FIGURE 3.3.2
Below 35years 36-45 years Above 45 years27
28
29
30
31
32
33
34
35
Chart Title
Series1
INFERENCE
It is identified from the above table that 35.0% of the respondents
belongs to below 35 years, 34.0% of the respondents belongs to 36-45 years of age level and
30.0% of the respondents belongs to above 45 years of age level.

21
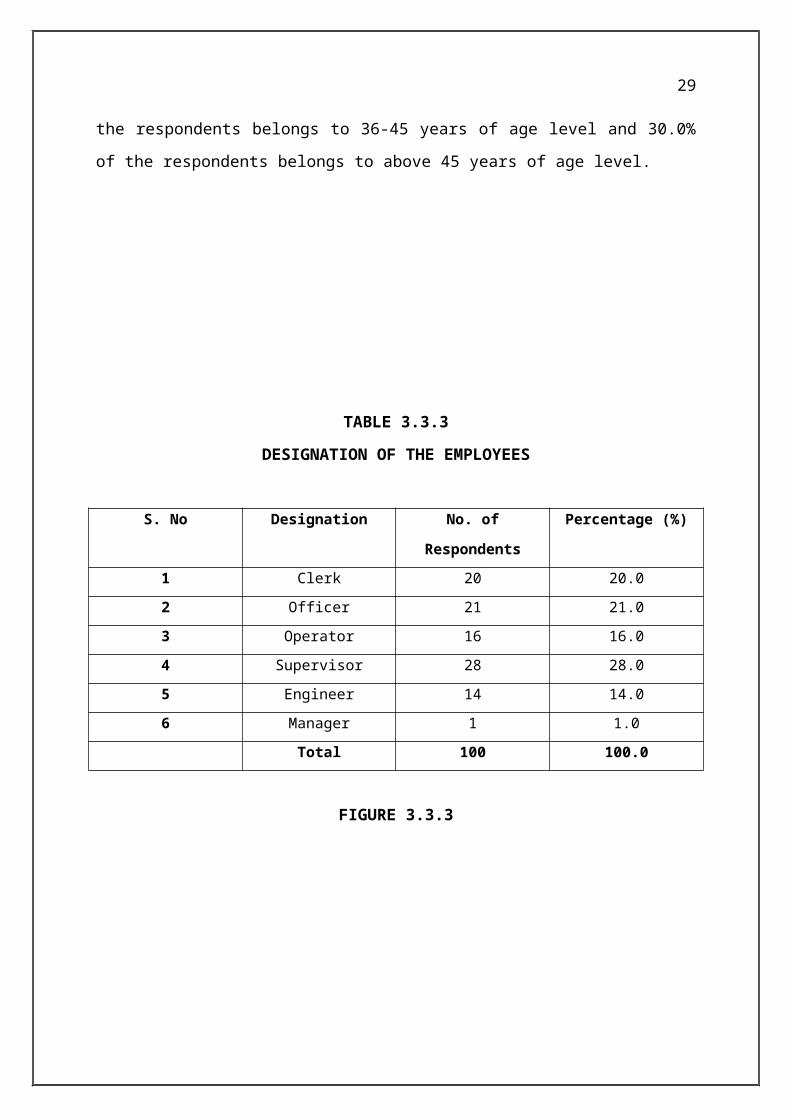
TABLE 3.3.3
DESIGNATION OF THE EMPLOYEES
S. No Designation No. of Respondents Percentage (%)
1 Clerk 20 20.0
2 Officer 21 21.0
3 Operator 16 16.0
4 Supervisor 28 28.0
5 Engineer 14 14.0
6 Manager 1 1.0
Total 100 100.0
FIGURE 3.3.3
clerk officer operator supervisor engineer manager0
5
10
15
20
25
30
INFERENCE:
It is found from the above table that 20.0% of the respondents were
clerk grade, 21.0% of the respondents were officer grade, 16.0% of the respondents were
operator grade, 28.0% of the respondents were supervisor grade, 14.0% of the respondents
were engineer grade and 1.0% of the respondents were Manager grade.

22
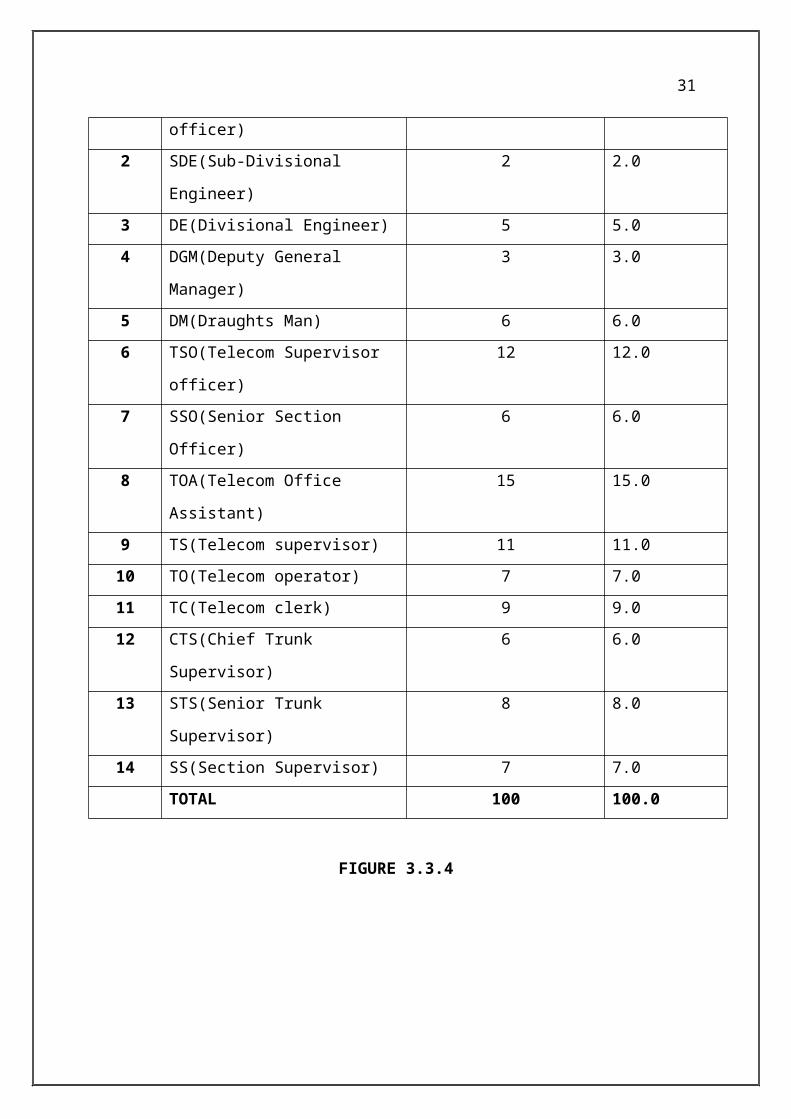
TABLE 3.3.4
DEPARTMENT OF THE EMPLOYEES
S. No. Department No. of Respondents Percentage (%)
1 JTO(Junior Telecom officer) 3 3.0
2 SDE(Sub-Divisional Engineer) 2 2.0
3 DE(Divisional Engineer) 5 5.0
4 DGM(Deputy General Manager) 3 3.0
5 DM(Draughts Man) 6 6.0
6 TSO(Telecom Supervisor officer) 12 12.0
7 SSO(Senior Section Officer) 6 6.0
8 TOA(Telecom Office Assistant) 15 15.0
9 TS(Telecom supervisor) 11 11.0
10 TO(Telecom operator) 7 7.0
11 TC(Telecom clerk) 9 9.0
12 CTS(Chief Trunk Supervisor) 6 6.0
13 STS(Senior Trunk Supervisor) 8 8.0
14 SS(Section Supervisor) 7 7.0
TOTAL 100 100.0
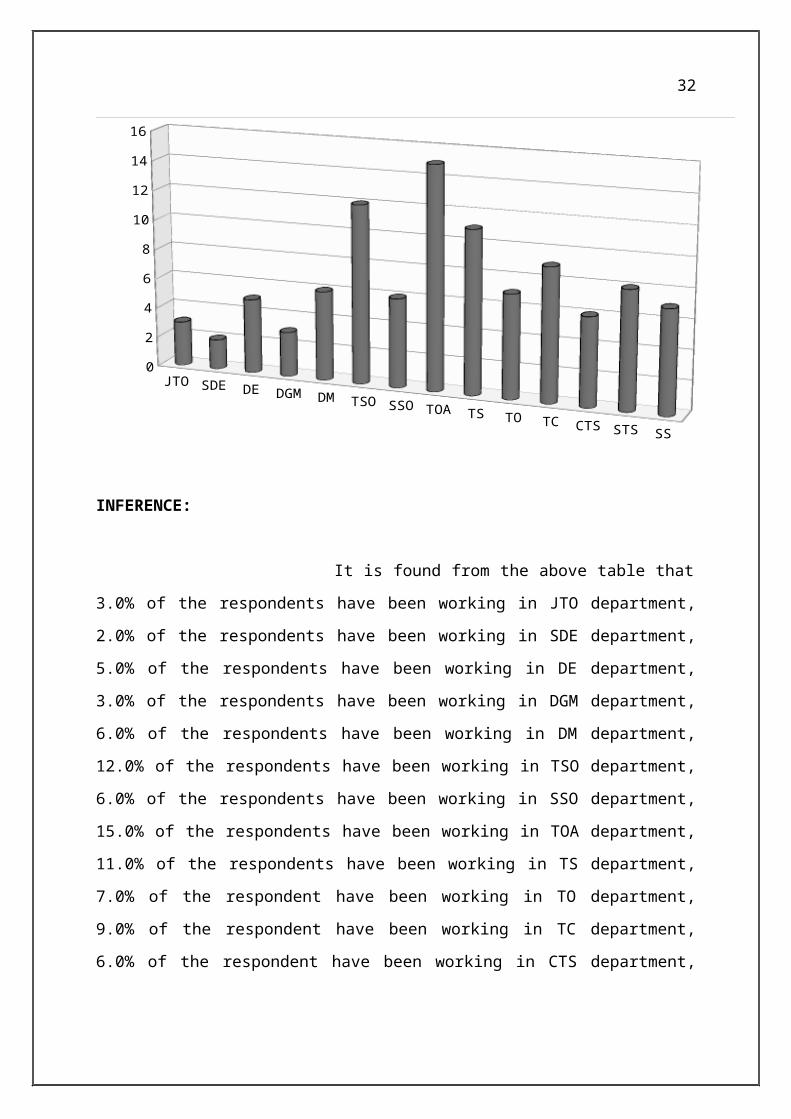
FIGURE 3.3.4

23
JTO SDE DE DGM DM TSO SSO TOA TS TO TC CTS STS SS
0
2
4
6
8
10
12
14
16
INFERENCE:
It is found from the above table that 3.0% of the respondents have been
working in JTO department, 2.0% of the respondents have been working in SDE department,
5.0% of the respondents have been working in DE department, 3.0% of the respondents have
been working in DGM department, 6.0% of the respondents have been working in DM
department, 12.0% of the respondents have been working in TSO department, 6.0% of the
respondents have been working in SSO department, 15.0% of the respondents have been
working in TOA department, 11.0% of the respondents have been working in TS department,
7.0% of the respondent have been working in TO department, 9.0% of the respondent have
been working in TC department, 6.0% of the respondent have been working in CTS
department, 8.0% of the respondent have been working in STS department, 7.0% of the
respondent have been working in SS department.

24
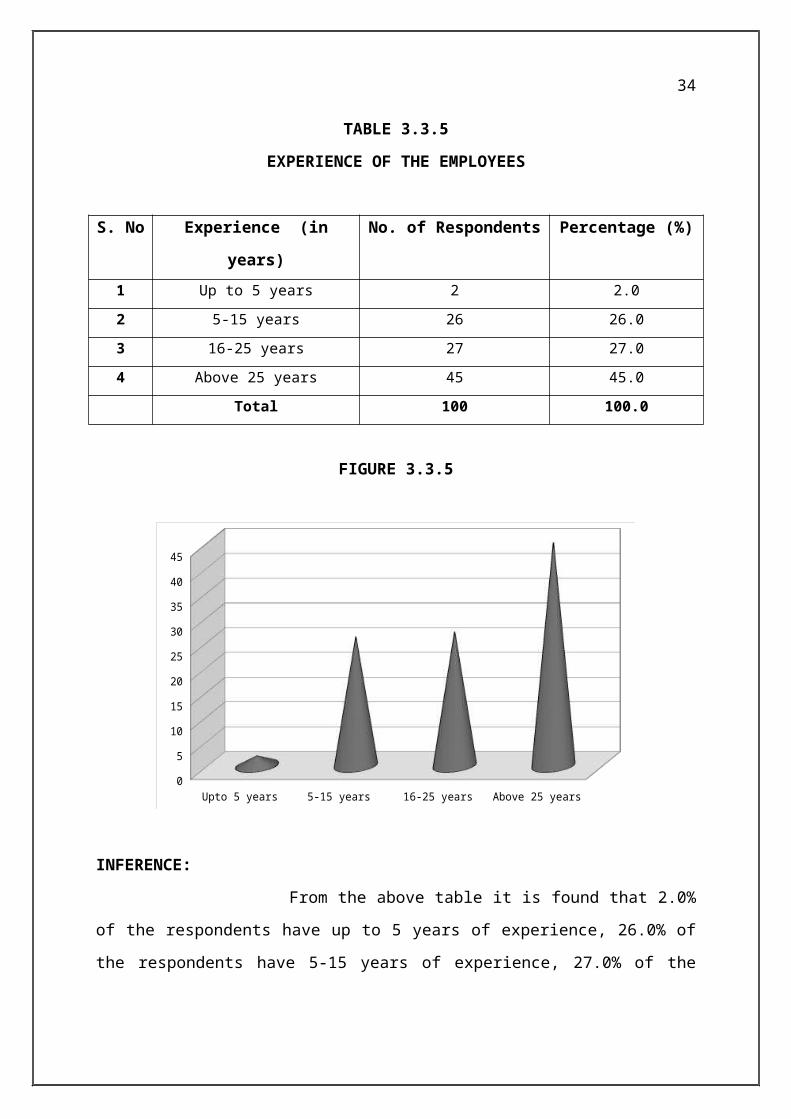
TABLE 3.3.5
EXPERIENCE OF THE EMPLOYEES
S. No Experience (in years) No. of Respondents Percentage (%)
1 Up to 5 years 2 2.0
2 5-15 years 26 26.0
3 16-25 years 27 27.0
4 Above 25 years 45 45.0
Total 100 100.0
FIGURE 3.3.5
Upto 5 years 5-15 years 16-25 years Above 25 years0
5
10
15
20
25
30
35
40
45
INFERENCE:
From the above table it is found that 2.0% of the respondents have up to 5 years
of experience, 26.0% of the respondents have 5-15 years of experience, 27.0% of the
respondents have 16-25 years of experience and 45.0% of the respondents have above 25
years of experience
25
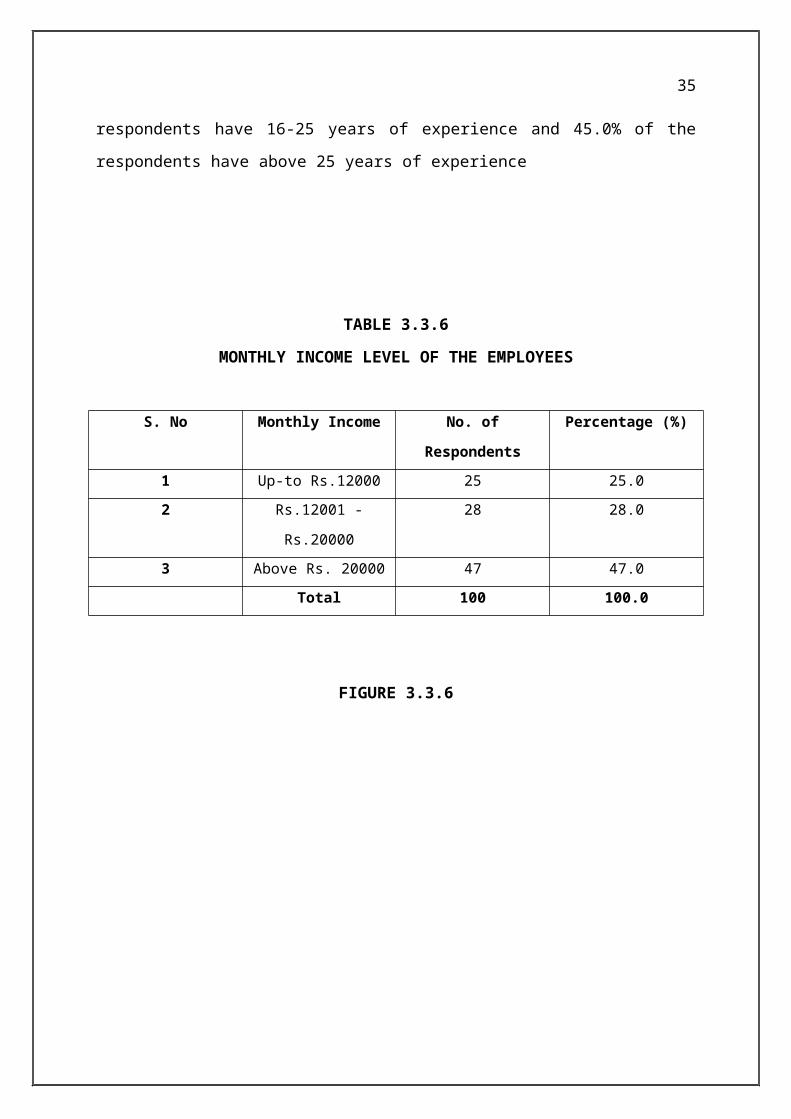
TABLE 3.3.6
MONTHLY INCOME LEVEL OF THE EMPLOYEES
S. No Monthly Income No. of Respondents Percentage (%)
1 Up-to Rs.12000 25 25.0
2 Rs.12001 - Rs.20000 28 28.0
3 Above Rs. 20000 47 47.0
Total 100 100.0
FIGURE 3.3.6
upto Rs. 12000 Rs.12001 - Rs. 20000 Above Rs.20000
25 28
47
INFERENCE:
It is found that the above table that 25.0% of the respondents have their monthly
income up-to 12000, 28.0% of the respondents have their monthly income in the range of
Rs.12001-Rs.20000, 47.0% of the respondents have their monthly income of above
Rs.20000.

26
TABLE 3.3.7
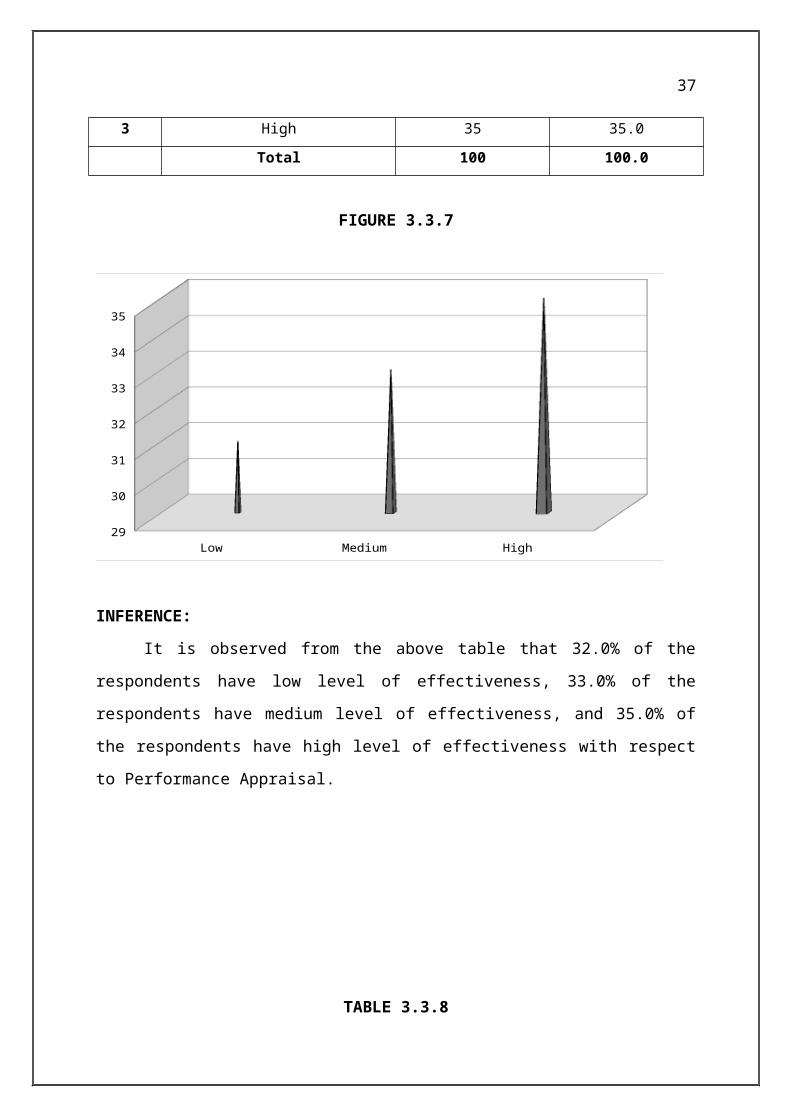
LEVEL OF EFFECTIVENESS OF PERFORMANCE APPRAISAL
S. No Level of Effectiveness No. of Respondents Percentage (%)
1 Low 32 32.0
2 Medium 33 33.0
3 High 35 35.0
Total 100 100.0
FIGURE 3.3.7
Low Medium High29
30
31
32
33
34
35
INFERENCE:
It is observed from the above table that 32.0% of the respondents have low level of
effectiveness, 33.0% of the respondents have medium level of effectiveness, and 35.0% of
the respondents have high level of effectiveness with respect to Performance Appraisal.

27
TABLE 3.3.8
AWARENESS OF PERFORMANCE APPRAISAL
S. NO AWARENESS NO OF RESPONDENTS PERCENTAGE (%)
1 Yes 72 72.0
2 No 28 28.0
Total 100 100.0
FIGURE 3.3.8
Yes
No
0
10
20
30
40
50
60
70
80
72
28
INFERENCE:
It is observed from the above table that 72.0% of the respondents have aware of
performance appraisal, 28.0% of the respondents has not know about performance appraisal.
28
TABLE 3.3.9
NUMBER OF EMPLOYEES APPRAISED DURING SERVICE PERIOD
S. No Appraised No. of Respondents Percentage (%)
1 Yes 68 68.0
2 No 32 32.0
Total 100 100.0
FIGURE 3.3.9
yes68%
no32%
INFERENCE:
It is observed from the above table that 32.0% of the respondents have not appraised
in service period, 68.0% of the respondents have appraised in service period.
29
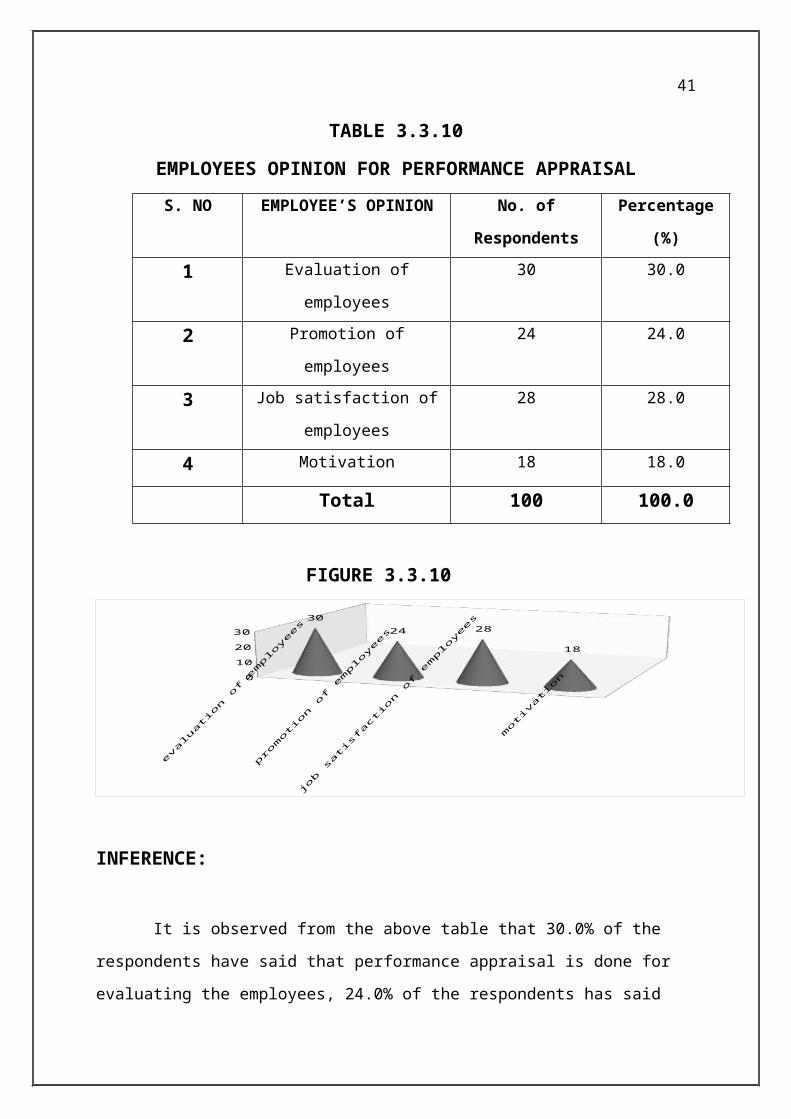
TABLE 3.3.10
EMPLOYEES OPINION FOR PERFORMANCE APPRAISAL
S. NO EMPLOYEE’S OPINION No. of Respondents Percentage (%)
1 Evaluation of employees 30 30.0
2 Promotion of employees 24 24.0
3 Job satisfaction of employees 28 28.0
4 Motivation 18 18.0
Total 100 100.0
FIGURE 3.3.10
evaluation of employees promotion of
employees job satisfaction of employees motivation
0
5
10
15
20
25
30
30
2428
18
INFERENCE:
It is observed from the above table that 30.0% of the respondents have said that
performance appraisal is done for evaluating the employees, 24.0% of the respondents has
said that performance appraisal is done for promotion of employees, 28.0% of the
respondents has said that performance appraisal is done for job satisfaction of employees and
18.0% of the respondents have said that performance appraisal is done for motivation.

30
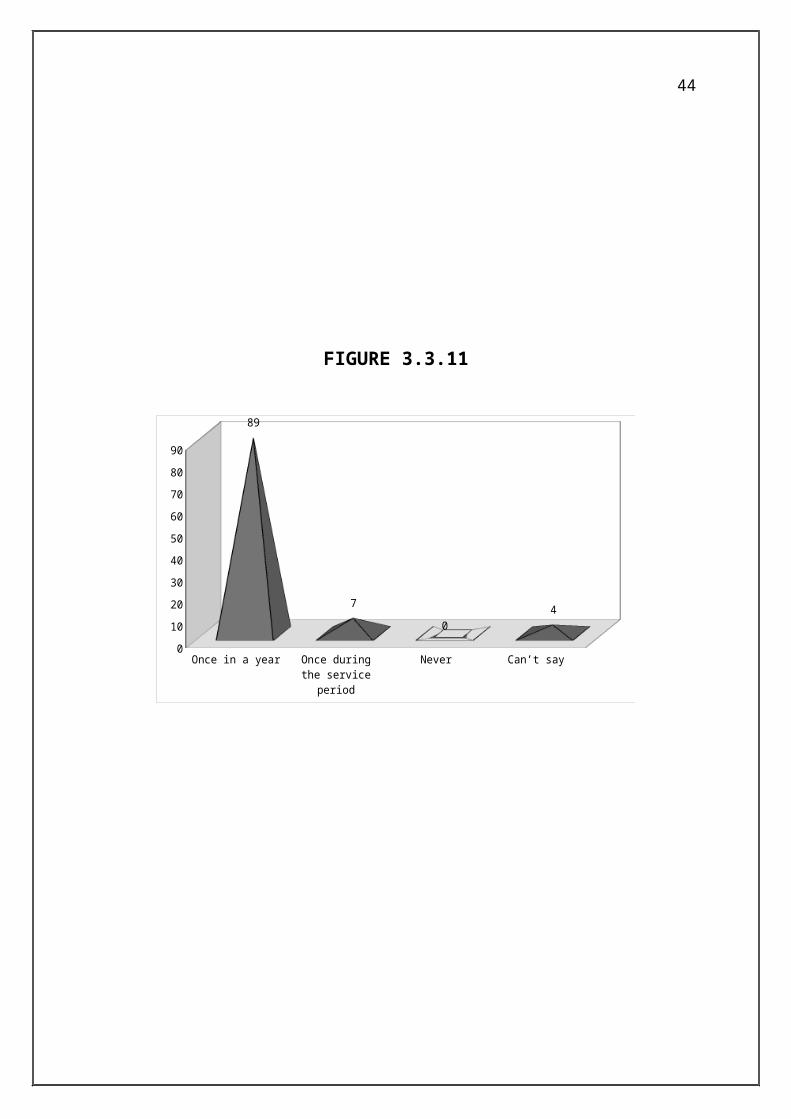
TABLE 3.3.11
FREQUENCY OF PERFORMANCE APPRAISAL
S. NO FREQUENCY OF
PERFORAMANCE
APPRAISAL
No. of Respondents Percentage (%)
1 Once in a year 89 89.0
2 Once during the service
period
7 7.0
3 Never 0 0.0
4 Can’t say 4 4.0
Total 100 100.0
INFERENCE:
It is observed from the above table that 4.0% of the respondents have said that
frequency of performance appraisal is done in any time they can’t say, and 7.0% of the
respondents said that they will be evaluate once in during service period and 89.0% of the
respondents said that performance appraisal is done in once in a year.
31
FIGURE 3.3.11
Once in a year Once during the service period
Never Can’t say0
10
20
30
40
50
60
70
80
90
89
7
04
32
TABLE 3.3.12
GAP BETWEEN PERFORMANCE APPRAISALS
S. NO FREQUENCY OF
PERFORAMANCE
APPRAISAL
No. of
Respondents
Percentage
(%)
1 Quarterly 20 20.0
2 Half-yearly 44 44.0
3 Yearly 36 36.0
Total 100 100.0
FIGURE 3.3.12
Quaterly Half Yearly Yearly0
5
10
15
20
25
30
35
40
45
50
20
44
36
INFERENCE:
It is observed from the above table that 20.0% of the respondents have said that there
is quarterly gap between two appraisal periods, 44.0% of the respondents have said half-
yearly and 36.0% of the respondents have said that there is yearly gap between the two
appraisal periods.
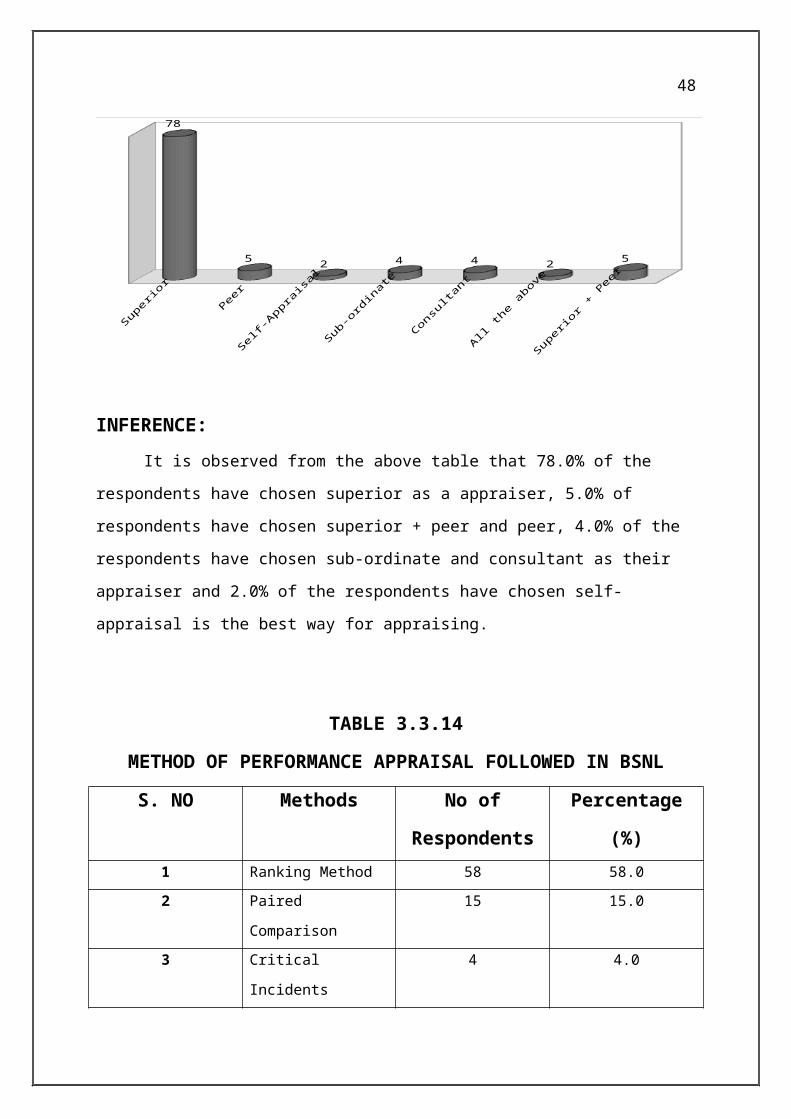
TABLE 3.3.13

33
Who should do the Appraisal?
S. No Appraisers No. of Respondents Percentage (%)
1 Superior 78 78.0
2 Peer 5 5.0
3 Self-Appraisal 2 2.0
4 Sub-ordinate 4 4.0
5 Consultant 4 4.0
6 All the above 2 2.0
7 Superior + Peer 5 5.0
Total 100 100.0
FIGURE 3.3.13
Superior Peer Self-Appraisal Sub-ordinate Consultant All the aboveSuperior + Peer
78
52 4 4 2
5
INFERENCE:
It is observed from the above table that 78.0% of the respondents have chosen
superior as a appraiser, 5.0% of respondents have chosen superior + peer and peer, 4.0% of
the respondents have chosen sub-ordinate and consultant as their appraiser and 2.0% of the
respondents have chosen self-appraisal is the best way for appraising.
TABLE 3.3.14
34
METHOD OF PERFORMANCE APPRAISAL FOLLOWED IN BSNL
S. NO Methods No of
Respondents
Percentage (%)
1 Ranking Method 58 58.0
2 Paired Comparison 15 15.0
3 Critical Incidents 4 4.0
4 MBO 12 12.0
5 360 degree 5 5.0
6 Assessment Centre 6 6.0
Total 100 100.0
FIGURE 3.3.14
Ranking Method
Paired Comparison
Critical Incidents
MBO 360 degree Assessment Centre
0
10
20
30
40
50
60
INFERENCE:
It is observed from the above table that 58.0% of the respondents have chosen ranking
method, 15.0% of the respondents have chosen paired comparison, 4.0% of the respondents
have chosen critical incidents, 12.0% of the respondents have MBO, 5.0% of the respondents
have chosen 360 degree, 6.0% of the respondents have chosen Assessment centre for
Performance Appraisal.
35
TABLE 3.3.15
DOES PERFORMANCE APPRAISAL HELPS IN POLISHING SKILLS
AND PERFORMANCE AREA
S. NO Options No. of
Respondents
Percentage (%)
1 Yes 74 74.0
2 No 10 10.0
3 Somewhat 16 16.0
Total 100 100.0
FIGURE 3.3.15
Yes No Somewhat0
10
20
30
40
50
60
70
80
INFERENCE:
It is observed from the above table that 74.0% of the respondents have accepted that
performance appraisal helps employees to polish the skills, 10.0% of the respondents said
that performance appraisal does not serve this purpose and 16.0% were not able to respond as
to whether it serve any such purposes or not.
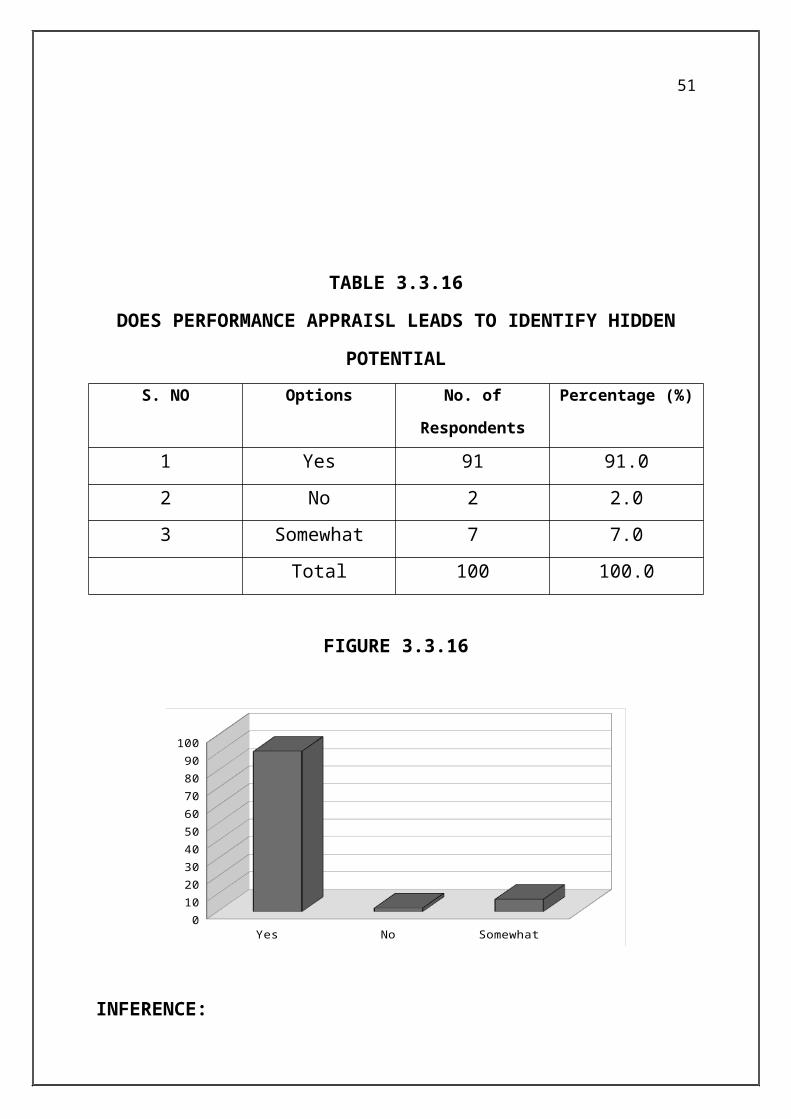
TABLE 3.3.16

36
DOES PERFORMANCE APPRAISL LEADS TO IDENTIFY HIDDEN
POTENTIAL
S. NO Options No. of Respondents Percentage (%)
1 Yes 91 91.0
2 No 2 2.0
3 Somewhat 7 7.0
Total 100 100.0
FIGURE 3.3.16
Yes No Somewhat0
10
20
30
40
50
60
70
80
90
100
INFERENCE:
It is observed from the above table that 91.0% of the respondents said that
Performance Appraisal helps them to identify potential, 2.0% of the respondents said that
performance appraisal does not helps to identify the potential and 7.0% of the respondents
have said that performance appraisal somewhat helps to identify the potential.
TABLE 3.3.17
37
IF GIVEN A CHANCE, WOULD EMPLOYEES LIKE CURRENT
APPRAISAL TECHNIQUE TO REVIEW
S. NO Options No. of Respondents Percentage (%)
1 Yes 87 87.0
2 No 4 4.0
3 Can’t say 9 9.0
Total 100 100.0
FIGURE 3.3.17
Yes No Can’t say0
10
20
30
40
50
60
70
80
90
INFERENCE:
It is observed from the above table that 87.0% of the respondents have suggested the
performance appraisal should be reviewed, 4.0% of the respondents have said that the current
performance appraisal is good no need to review and 9.0% of the respondents have said that
they can’t say that the performance appraisal should be reviewed.
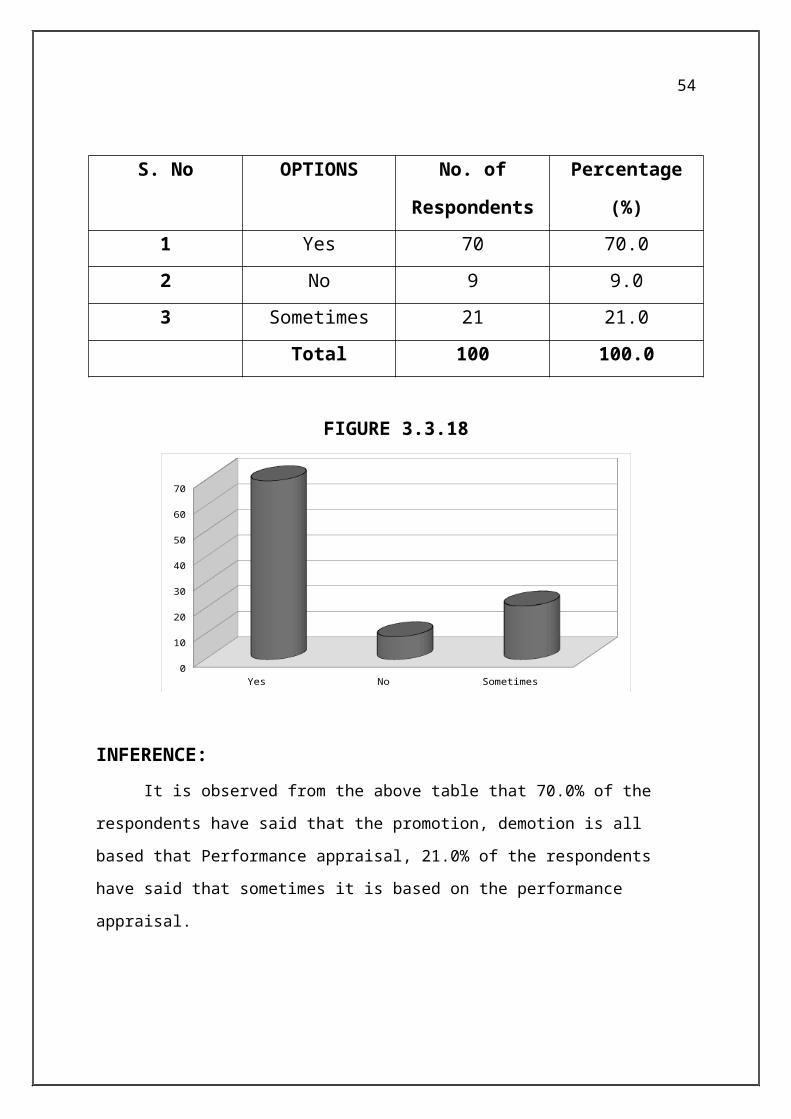
TABLE 3.3.18

38
PROMOTION, TRANSFER, DEMOTION, SUSPENSION AND
DISMISSAL IS PURELY BASED ON THE PERFORMANCE
APPRAISAL
S. No OPTIONS No. of
Respondents
Percentage (%)
1 Yes 70 70.0
2 No 9 9.0
3 Sometimes 21 21.0
Total 100 100.0
FIGURE 3.3.18
Yes No Sometimes0
10
20
30
40
50
60
70
INFERENCE:
It is observed from the above table that 70.0% of the respondents have said that the
promotion, demotion is all based that Performance appraisal, 21.0% of the respondents have
said that sometimes it is based on the performance appraisal.
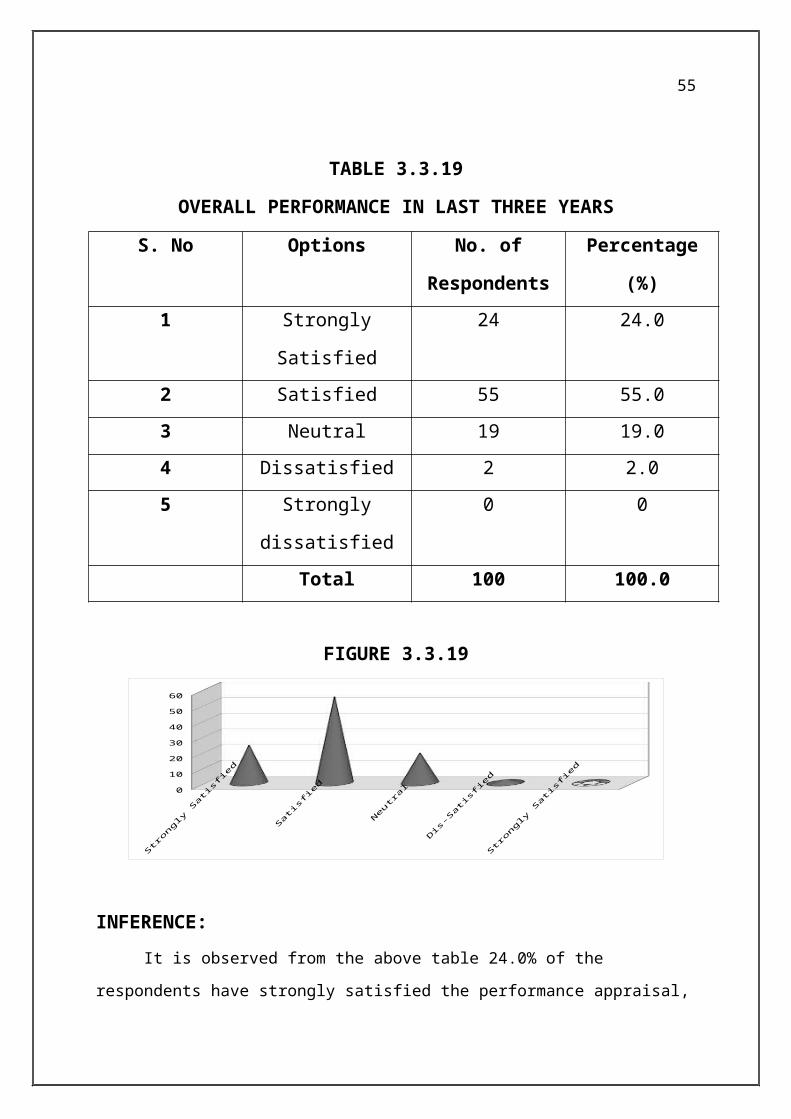
TABLE 3.3.19

39
OVERALL PERFORMANCE IN LAST THREE YEARS
S. No Options No. of
Respondents
Percentage (%)
1 Strongly Satisfied 24 24.0
2 Satisfied 55 55.0
3 Neutral 19 19.0
4 Dissatisfied 2 2.0
5 Strongly dissatisfied 0 0
Total 100 100.0
FIGURE 3.3.19
Strongly Satisfied Satisfied Neutral Dis-Satisfied Strongly Satisfied0
10
20
30
40
50
60
INFERENCE:
It is observed from the above table 24.0% of the respondents have strongly satisfied
the performance appraisal, 55.0% of the respondents have satisfied the performance
appraisal,19.0% of the respondents have neutral with the performance appraisal and 2.0% of
the respondents have not satisfied with the performance appraisal.
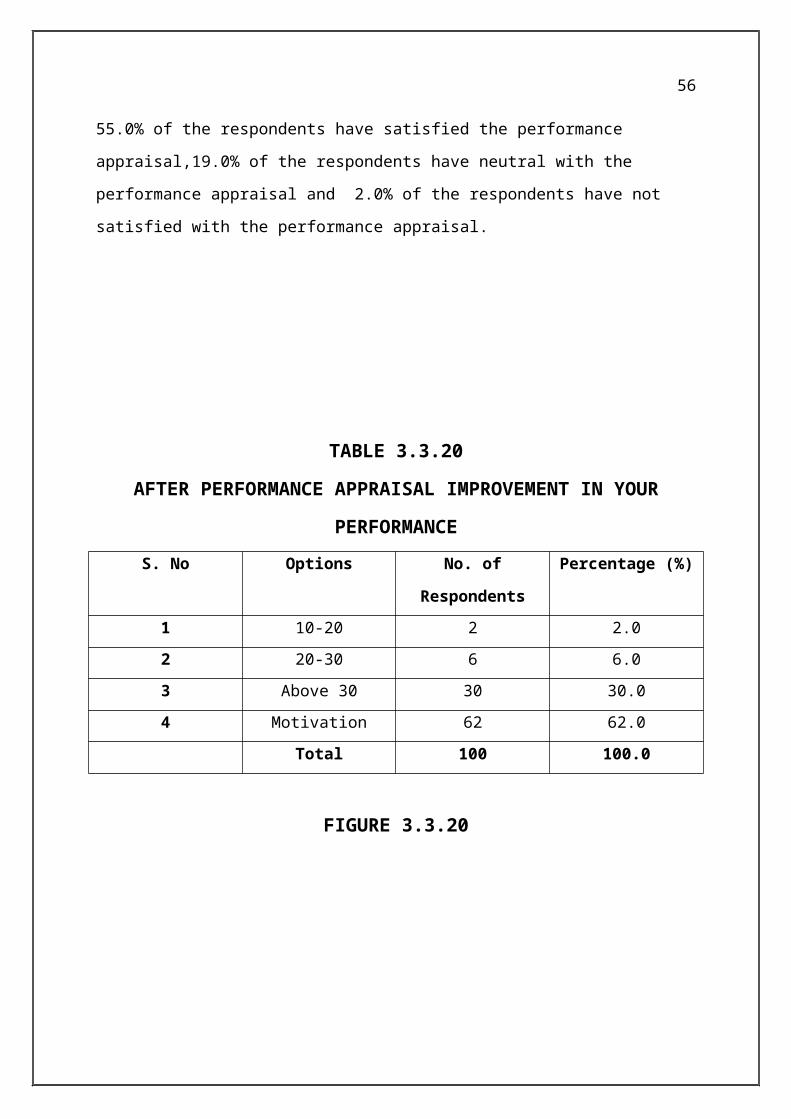
TABLE 3.3.20

40
AFTER PERFORMANCE APPRAISAL IMPROVEMENT IN YOUR
PERFORMANCE
S. No Options No. of Respondents Percentage (%)
1 10-20 2 2.0
2 20-30 6 6.0
3 Above 30 30 30.0
4 Motivation 62 62.0
Total 100 100.0
FIGURE 3.3.20
Oct-20 20-30 Above 30 Motivation0
10
20
30
40
50
60
70
INFERENCE:
It is observed from the above table that 2.0% of the respondents have said that after
performance appraisal they have improvement of 10-20, 6.0% of the respondents said 20-30
and 30.0% of the respondents have said after performance appraisal they have improvement
of Above 30 and 62.0% of the respondents have said that after performance appraisal they
motivate themselves.
41
TABLE 3.3.21
DOES BSNL FOLLOW 360 DEGREE PERFORMANCE APPRAISAL
PROCESS
S. NO OPTIONS NO OF
RESPONDENTS
PERCENTAGE
(%)
1 Yes 5 5.0
2 No 95 95.0
Total 100 100.0
FIGURE 3.3.21
Yes5%
No95%
Chart Title
INFERENCE:
It is observed from the above table that 5.0% of the respondents have agreed that they
are following the 360 performance appraisal method and 95.0% of the respondents have not
said that they are not following 360 degree Performance appraisal method.
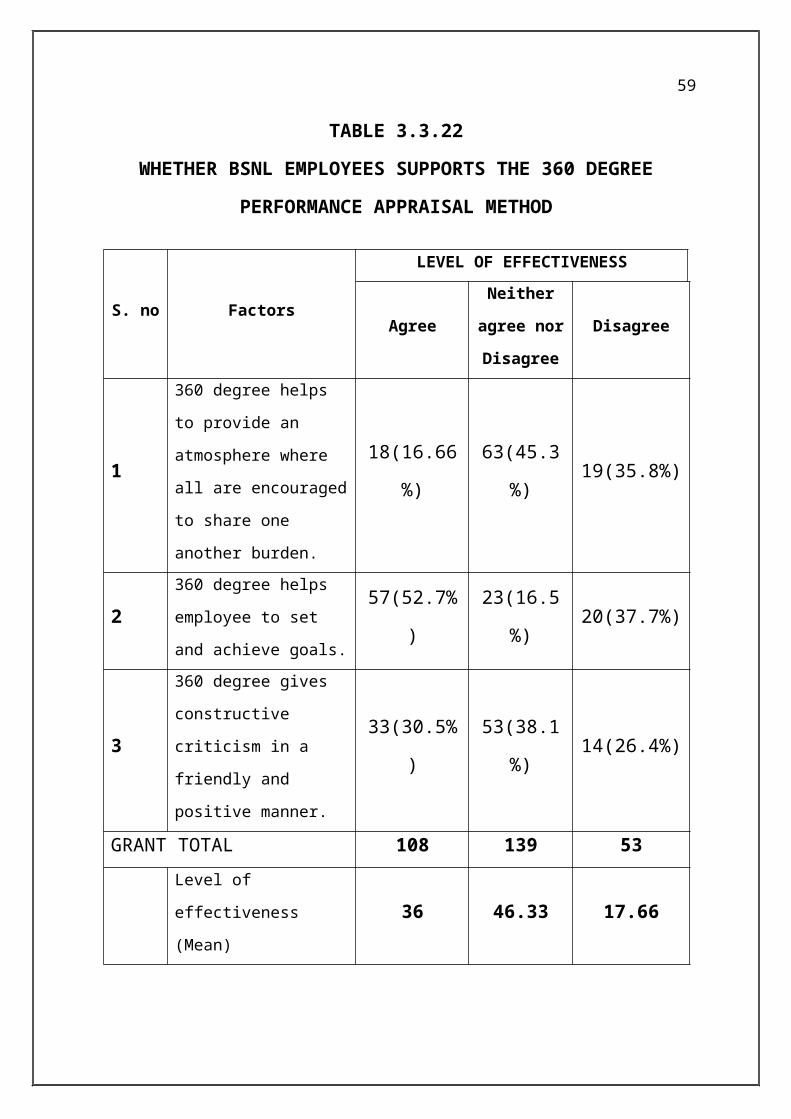
TABLE 3.3.22

42
WHETHER BSNL EMPLOYEES SUPPORTS THE 360 DEGREE
PERFORMANCE APPRAISAL METHOD
INFERENCE:
S. no Factors
LEVEL OF EFFECTIVENESS
Agree
Neither
agree nor
Disagree
Disagree
1
360 degree helps to
provide an atmosphere
where all are encouraged
to share one another
burden.
18(16.66%) 63(45.3%) 19(35.8%)
2360 degree helps employee
to set and achieve goals.57(52.7%) 23(16.5%) 20(37.7%)
3
360 degree gives
constructive criticism in a
friendly and positive
manner.
33(30.5%) 53(38.1%) 14(26.4%)
GRANT TOTAL 108 139 53
Level of effectiveness
(Mean)36 46.33 17.66

43
63.0% of the respondents neither agree nor disagree that 360 degree performance
appraisal helps them to provide an atmosphere where all are encouraged to share one
another burden.
53.0% of the respondents have agreed that 360 degree performance appraisal helps
employee to set and achieve the goals.
53.0% of the respondents have neither agreed nor disagree that 360 degree gives
constructive criticism in a friendly and positive manner.
CHI-SQUARE - HYPOTHESIS TESTING:
44
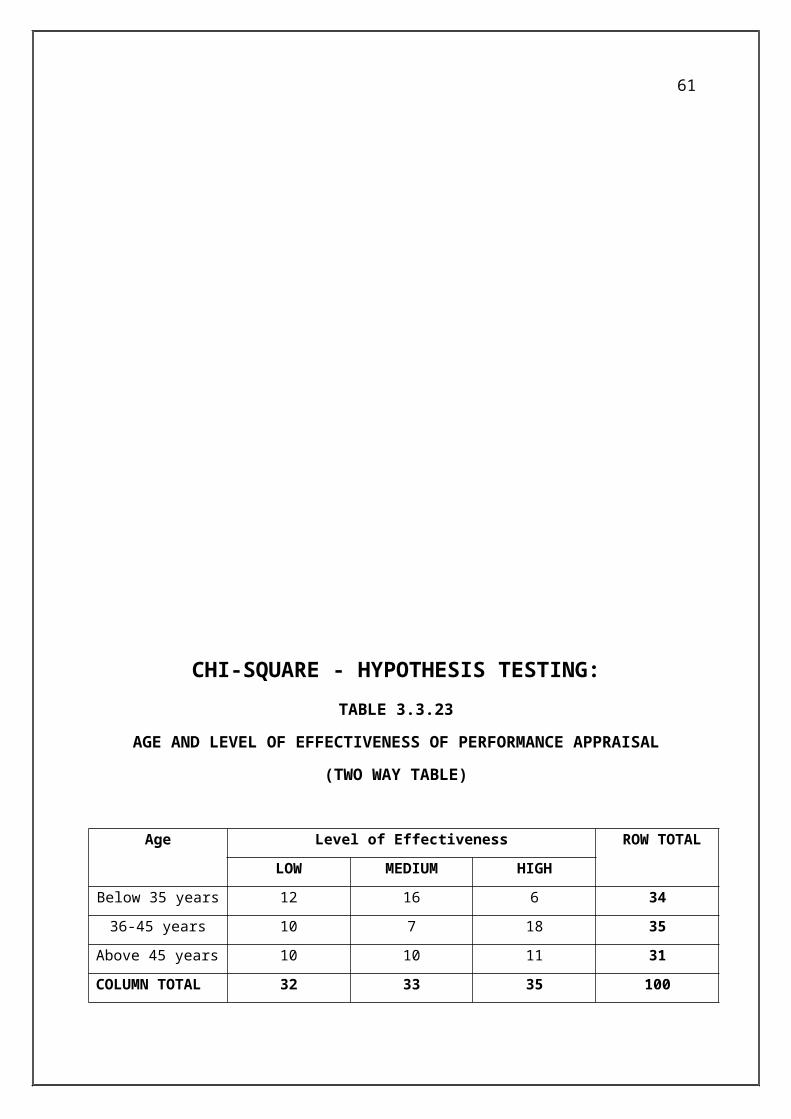
TABLE 3.3.23
AGE AND LEVEL OF EFFECTIVENESS OF PERFORMANCE APPRAISAL
(TWO WAY TABLE)
Age Level of Effectiveness ROW TOTAL
LOW MEDIUM HIGH
Below 35 years 12 16 6 34
36-45 years 10 7 18 35
Above 45 years 10 10 11 31
COLUMN TOTAL 32 33 35 100
Null Hypothesis (H0) : There is no significant relationship between age and level of
effectiveness of performance appraisal.
Alternative Hypothesis (H1): There is close significant relationship between age and
level of effectiveness of performance appraisal.
Chi-square formula 2 = (O-E) ^2/ E
AGE LEVEL OF EFFECTIVENESS ROW TOTAL
Low Medium High
Below 35 years O
E
12 16 6 34
10.88 11.22 11.9
36-45 years O
E
10 7 18 35
11.2 11.55 12.25
Above 45 years O
E
10 10 11 31
9.92 10.23 10.85
COLUMN TOTAL 32 33 35 100
OBSERVED VALUE (O) EXPECTED VALUE(E) 2 = (O-E)^2/E
12 10.88 0.115

45
10 11.2 0.128
10 9.92 6.45*10^-4
16 11.22 2.036
7 11.55 1.792
10 10.23 5.171*10^-3
6 11.9 2.925
18 12.25 2.69
11 10.85 1.911*10^-4
CHI-SQUARE 2 TOTAL 9.692
CHI – SQUARE TEST:
Calculated 2 value = 9.692
Degree of freedom = 4
Table value = 9.488
Result = Significant at 5% level
INFERENCE:
It is found from the above table that calculated value is greater than the table value
at 4 degree of freedom. So, Null hypothesis (H0) rejected. Hence it is concluded that there is
close significant relationship between age and level of effectiveness of performance
appraisal.
TABLE 3.3.24

46
MONTHLY INCOME AND LEVEL OF EFFECTIVENESS OF PERFORMANCE
APPRAISAL (TWO-WAY TABLE)
MONTHLY INCOME LEVEL OF EFFECTIVENESS ROW TOTAL
LOW MEDIUM HIGH
UPTO 12,000 8 11 6 25
12,000 – 20,000 14 7 7 28
Above 20,000 10 15 22 47
COLUMN TOTAL 32 33 35 100
Null Hypothesis: There is no significant relationship between monthly income and level
of effectiveness of Performance Appraisal.
Alternative Hypothesis: There is close significant relationship between monthly Income
and level of effectiveness of Performance Appraisal.
Chi-square formula 2 = (O-E) ^2/ E
MONTHLY INCOME LEVEL OF EFFECTIVENESS ROW TOTAL
LOW MEDIUM HIGH
UPTO 12,000 O
E
8 11 6 25
8 8.25 8.75
12,000 – 20,000 O
E
14 7 7 28
8.96 9.24 9.80
Above 20,000 O
E
10 15 22 47
15.04 15.51 16.45
COLUMN TOTAL 32 33 35 100

47
OBSERVED VALUE (O) EXPECTED VALUE (E) 2 = (O-E)^2/E
8 8 0
14 8.96 2.835
10 15.04 1.688
11 8.25 0.916
7 9.24 0.543
15 15.51 0..016
6 8.75 0.864
7 9.80 0.8
22 16.45 1.872
CHI-SQUARE 2 TOTAL 9.534
CHI-SQUARE TEST:
Calculated chi-square value= 9.534
Degree of Freedom = 4
Table value = 9.534
Result = significant at 5 % level.
INFERENCE
It is found from the above table that calculated value is greater than the table value
at 4 degree of freedom. So, Null hypothesis (H0) rejected. Hence it is concluded that there is
close significant relationship between monthly income and level of effectiveness of
performance appraisal.
TABLE 3.3.25
48
EXPERIENCE AND LEVEL OF EFFECTIVENESS OF
PERFORMANCE APPRAISAL
EXPERIENCE LEVEL OF EFFECTIVENESS ROW TOTAL
LOW MEDIUM HIGH
UPTO 15 YEARS 13 6 9 28
16-25 YEARS 11 11 5 27
ABOVE 25 YEARS 8 16 21 45
COLUMN TOTAL 32 33 35 100
Null Hypothesis: There is no significant relationship between experience and level of
effectiveness of Performance Appraisal.
Alternative Hypothesis: There is close significant relationship between experience and
level of effectiveness of Performance Appraisal.
Chi-square formula 2 = (O-E) ^2/ E
Experience Level of effectiveness Row total
Low Medium High
Up-to 5 years O
E
13 6 9 28
8.96 9.24 9.80
16-25 Years O
E
11 11 5 27
8.64 8.91 9.45
Above 25 years O
E
8 16 21 45
14.40 14.85 15.75
COLUMN TOTAL 32 33 35 100
OBSERVED VALUE (O) EXPECTED VALUE (E) 2 = (O-E)^2/E

49
13 8.96 1.821
11 8.64 0.644
8 14.40 2.844
6 9.24 1.136
11 8.91 0.490
16 14.85 0.089
9 9.80 0.065
5 9.45 2.095
21 15.75 1.75
CHI-SQUARE 2 TOTAL 10.934
CHI - SQUARE TEST
Calculated 2 value = 10.934
Degree of Freedom = 4
Table value = 9.488
Result = Significant at 5% level
INFERENCE
It is found from the above table that calculated value is greater than the table value
at 4 degree of freedom. So, Null hypothesis (H0) rejected. Hence it is concluded that there is
close significant relationship between experience and level of effectiveness of performance
appraisal.
TABLE 3.3.26

50
DESIGNATION AND LEVEL OF EFFECTIVENESS OF
PERFORMANCE APPRAISAL
DESIGNATION LEVEL OF EFFECTIVENESS ROW TOTAL
LOW MEDIUM HIGH
Clerk 10 5 7 22
Officer 10 5 5 20
Supervisor 6 15 7 28
Engineer and operator 6 8 16 30
COLUMN TOTAL 32 33 35 100
Null Hypothesis: There is no significant relationship between designation and level of
effectiveness of Performance Appraisal.
Alternative Hypothesis: There is close significant relationship between designation and
level of effectiveness of Performance Appraisal.
Chi-square formula 2 = (O-E) ^2/ E
51
DESIGNATION LEVEL OF EFFECTIVENESS ROW TOTAL
LOW MEDIUM HIGH
Clerk O
E
10 5 7 22
6.40 6.60 7
Office O
E
10 5 5 20
6.72 6.93 7.35
Supervisor O
E
6 15 7 28
8.96 9.24 9.80
Engineer and O
operator E
6 8 16 30
9.92 10.23 10.85
COLUMN TOTAL 32 33 35 100
OBSERVED VALUE (O) EXPECTED VALUE (E) 2 = (O-E)^2/E
10 6.40 2.025
10 6.72 1.600952
6 8.96 0.977857
6 9.92 1.549032
5 6.60 0.387879
5 6.93 0.537504
15 9.24 3.590649
8 10.23 0.486109
7 7 0
5 7.35 0.751361
7 9.80 0.8
16 10.85 2.44447
CHI-SQUARE 2 TOTAL 15.15081
CHI - SQUARE TEST

52
Calculated 2 value = 15.15081
Degree of Freedom = 4
Table value = 12.592
Result = Significant at 5% level
INFERENCE
It is found from the above table that calculated value is greater than the table value
at 4 degree of freedom. So, Null hypothesis (H0) rejected. Hence it is concluded that there is
close significant relationship between designation and level of effectiveness of performance
appraisal.
4.1 SUMMARY OF FINDINGS

53
From the analysis it is found that 63% of the respondents are male.
Maximum (35.0%) of the respondents age were below 35 years.
Most (28.0%) of the respondents belongs to Supervisor designation.
Majority (15.0%) of the respondents were in Telecom Office Assistant Department.
Maximum (45.0%) of the respondents have above 25 years of experience.
Most (47.0%) of the respondents have their monthly income of above Rs. 20000.
Maximum (35.0%) of the respondents have high level effectiveness of performance
appraisal.
Most (72.0%) of the respondents were aware of performance appraisal.
Most (30.0%) of the respondent’s opinion that performance appraisal is done for
Evaluating the employees.
Most (89.0%) of the respondents said that performance appraisal is done once in a
year.
Most (78.0%) of the respondents chose supervisor as their appraiser.
Most (58.0%) of the respondents chose ranking method for performance appraisal.
Most (74.0%) of the respondents agreed that performance appraisal helps in polishing
skills and performance area.
Maximum (91.0%) of the respondents agreed that performance appraisal leads to
identify the hidden potential.
54
Most (87.0%) of the respondents suggest that current performance appraisal should
reviewed.
Most (70.0%) of the respondents were agreed that promotion, transfer, demotion,
suspension and dismissal is based on performance appraisal.
Most (55.0%) of the respondents were agreed that they get improved with
performance appraisal in last three years.
Most (62.0%) of the respondents were not aware of 360 degree performance appraisal
method.
Most (95.0%) of the respondents neither agreed nor disagreed with 360 performance
appraisal method.
Chi-Square Method:
It is concluded that there is close association between Age and Level of effectiveness.
It is concluded that there is close relationship between monthly income and level of
effectiveness.
It is concluded that there is close relationship between experience and level of
effectiveness.
It is concluded that there is close relationship between designation and level of
effectiveness.
4.2. SUGGESTIONS AND RECOMMENDATIONS
55
Maximum of respondents are not satisfied with their performance appraisal system.
It is suggested to consider the current appraisal system and there is a need for
improvement.
Consistent and equitable system of rewards can be formulated.
Opportunities for promotions and advancement must be adequately provided for
further up-liftmen of employees.
4.3. CONCLUSION
56
In every organization, job satisfaction plays a vital role. Employees tend to satisfy
if they meet their needs, wants, requirements and most of all job recognition and
encouragement from the top management is expected so their work has to be appreciated by a
method of performance appraisal. So by enhancing these appraisal techniques, it helps in
level of job satisfaction and healthy work atmosphere.
Thereby effective performance appraisal method encourages employees in work
and it also helps in improving their individual responsibility which in turn affects profitability
of the organization.
BIBLIOGRAPHY

57
1. Tripathi P.C (2002), Personnel Management and Industrial Relations published
by Sultan chand & Sons
2. Mamoria C.B (2002), Personnel Management published by Himalaya
publishing house
3. Malhotara R.K. Sharama S.D.& Nachhathar Singh (1999) Personnel
management (New Delhi) Arnold Publications (p) Ltd.,
4. C.R. Kothari (1999), Research Methodology, Methods and Techniques, Wishwa
Prakasan publication
Websites
www.bsnl.co.in
www.managementstudyguide.com
APPENDIX

58
COPY OF INTERVIEW SCHEDULE
Interview Schedule for Identifying the Performance Appraisal
Dear Respondent,
I am G.S.Vaishnavi pursuing MBA in KLN college of Engineering. As a part of my
curriculum I am undergoing a project titled,” A Study on Annual Performance Appraisal in
BSNL, Madurai”. I kindly request you to spare your valuable time to fill the following data
which is strictly for academic purpose and high confidentially will be maintained. Individual
will be identified during analysis. Fair response is highly solicited.
1. Name of the respondent (optional) _________________________________
2. Gender Male Female
3. Age: Below 25 25-35 36-45 Above 45
4. Department: ___________________________________________________
5. Designation: ____________________________________________________
6. Years of Experience: less than 5 years 5-15 years
16-25 years above 25 years
7. Monthly Income:
Up-to Rs. 12,000 Rs. 12001 – Rs. 20,000
Above Rs. 20,000.
8. Are you Aware of technique of performance appraisal being followed at BSNL?
Yes No
8. Were you informed about the performance appraisal model, used in the BSNL, during your
Induction?
Yes No
9. In your opinion performance appraisal is ____________
a. Evaluation of Employees
b. Promotion of Employees
c. Job satisfaction of Employees
d. Motivation
10. The performance standards are communicated to the employees in
advance______________________________________________
59
Yes No Never
11. Employee’s perception to the frequency of appraisal
a. Once in a year
b. Once during the service period
c. Continuous
d. Never
e. Can’t say
12. If continuous appraisal- what is the gap between two appraisal period
a. Quarterly
b. Half Yearly
c. Yearly
13. Appropriate method of conducting the performance appraisal.
a. Ranking Method
b. Paired Comparison
c. Critical Incidents
d. MBO
e. 360 degree
f. Assessment centre
14. Who is authority to do the appraisal?
a. Superior
b. Peer
c. Self-Appraisal
d. Sub-ordinate
e. Consultant
f. All the above
g. Superior + peer
15. In your opinion performance Appraisal system of your organization is related to which of
the following?

60
a. Retention of Employees
b. Promotion
c. Monetary Benefit/ Incentives
16. Is the Top level Management partial in Performance Appraisal
Yes No
17. Do you think Performance Appraisal helps to change behaviour of Employees
Yes No
18. If given a chance or an opportunity would you like that the current Appraisal procedure
should be reviewed?
Yes No
SA- STRONGLY AGREE A– AGREE NN-NEITHER AGREE NOR
DISAGREE DA-DISAGREE SDA- STRONGLY DISAGREE
S.NO FACTORS SA A NN DA SDA
19 Satisfied with the existing performance appraisal
system
20 The performance appraisal helps to win co-operation
and team work
21 The performance appraisal is helpful in reducing
grievance among the employees
22 The performance appraisal is helpful for improving
personnel skill
23 The performance appraisal system helps to identify
the strength and weakness of the employee
24 Promotion is purely based on performance appraisal
25 Management fixes salary through the performance
rating
26 Transfer, demotion, suspension and dismissal is
based on performance appraisal
27 Performance appraisal improving the productivity of
the employee
61
28 Overall performance in last three years
29 360 degree helps to provide an atmosphere where all
are encouraged to share one another burden
30 360 Degree performance appraisal helps people set
and achieve meaningful goals
31 360 Degree performance appraisal gives constructive
criticism in a friendly and positive manner
32 360 degree appraisal process create a participative
environment in the organization
33. Level of performance appraisal effectiveness
Low Medium High
34. Does the BSNL Follow 360degree Performance Appraisal Process?
Yes No
35. After performance appraisal, Rate the level of improvement in your performance.
a.10-20
b. 20-30
c. 30- above
d. Motivation
36. Suggestions and views
___________________________________________________________________________
___________________________________________________________________________
____________________________________________________________.