performance and perception: an experimental investigation
TRANSCRIPT

University of South FloridaScholar Commons
Graduate Theses and Dissertations Graduate School
7-17-2008
Performance and Perception: An ExperimentalInvestigation of the Impact of ContinuousReporting and Continuous Assurance onIndividual InvestorsAnita ReedUniversity of South Florida
Follow this and additional works at: https://scholarcommons.usf.edu/etd
Part of the American Studies Commons
This Dissertation is brought to you for free and open access by the Graduate School at Scholar Commons. It has been accepted for inclusion inGraduate Theses and Dissertations by an authorized administrator of Scholar Commons. For more information, please [email protected].
Scholar Commons CitationReed, Anita, "Performance and Perception: An Experimental Investigation of the Impact of Continuous Reporting and ContinuousAssurance on Individual Investors" (2008). Graduate Theses and Dissertations.https://scholarcommons.usf.edu/etd/469

Performance and Perception: An Experimental Investigation of the Impact of Continuous
Reporting and Continuous Assurance on Individual Investors
By
Anita Reed
A dissertation submitted in partial fulfillment of the requirements for the degree of
Doctor of Philosophy School of Accountancy
College of Business Administration University of South Florida
Major Professor: Uday Murthy, Ph.D. Stephanie Bryant, Ph.D. Rosann Collins, Ph.D. Gary Holstrum, Ph.D.
Date of Approval: July 17, 2008
Keywords: auditing, decision making, reporting frequency, source credibility, investor perception
© Copyright 2008, Anita Reed

DEDICATION
I would like to dedicate this dissertation to my children and grandchildren:
Elizabeth Amanda Burch, James Andrew Burch, Melissa Ann Burch, Jamie Ann Burch
and Hailey McKennah Burch; to my mother, JoAnn Rankin Titsworth and my sister,
Jacki Reed Joyce. Your continuous love and support and your enduring belief in me
sustained me through this long journey and inspired me to realize my dream.
This dissertation is dedicated in loving memory of Rosalyn Mansour and with
deep gratitude to her husband, Nicolas Mansour for his assistance and friendship.
This dissertation is dedicated to my dear friend and colleague, Dr. Robert Slater,
whose amazing generosity, friendship, moral support and technical support made the
experience much more enjoyable.
This work is also dedicated to the faculty members at USF who supported me and
never gave up on me: Dr. Jacqueline Reck, Dr. Rosann Webb Collins, Dr.Stephanie
Bryant, Dr. Uday Murthy, Dr. Gary Holstrum and Dr. James Hunton.

ACKNOWLEDGMENTS
I would like to express my gratitude to my committee chairman, Dr. Uday
Murthy, for his positive, encouraging mentorship during the dissertation process and to
the members of my committee, Dr. Stephanie Bryant, Dr. Rosann Webb Collins and Dr.
Gary Holstrum for their support and comments.
To Dr. Jacqueline Reck, thank you for being a role model and mentor and for
providing the support and guidance I needed to complete my work.
To Dr. Bill Stephens, thank you for always being available to talk, whether about
the dissertation, faith, research, teaching or the frailty of the human spirit. You continue
to be an inspiration to me and I am grateful for our friendship.
To Ann Dzuranin, John Chan and Norma Montague, thank you for the
collegiality, the friendship and the inspiration to always do better. I have great
expectations of each of you.
To Nicolas Mansour, thank you for your technical support and your friendship.
I would like acknowledge the Dr. L. Rene "Bud" Gaiennie Fund and the Dr.
Henry Efebera Scholarship Fund for the financial support I received for the dissertation.

i
TABLE OF CONTENTS
LIST OF TABLES iv
LIST OF FIGURES vi
ABSTRACT vii
1.0 INTRODUCTION 1 1.1 Introduction and Relevance of the Study 1
1.2 Research Questions 6
1.3 Motivation for the Study 7
1.4 Contributions 8
2.0 LITERATURE REVIEW AND HYPOTHESES DEVELOPMENT 11
2.1 Introduction 11
2.2 Feasibility of Continuous Reporting and Continuous Assurance 11
2.3 Reporting Model 12
2.4 Assurance Model 14
2.5 Value of Information 17
3.0 RESEARCH METHOD 28
3.1 Research Design 28
3.2 Research Model 28
3.3 Participants 31
3.4 Experimental Procedure 31
3.5 Task 36
3.6 Variables 38
4.0 ANALYSIS AND RESULTS 44
4.1 Introduction 44
ii
4.2 Participants 44
4.3 Manipulation Checks 46
4.4 Data Analysis 50 4.5 Post Hoc Analysis 110
5.0 SUMMARY AND CONCLUSION 125
5.1 Summary 125
5.2 Implications of Findings 130
5.3 Contributions 132
5.4 Limitations 133
5.5 Future Research 134
5.6 Concluding Remarks 134 REFERENCES 136 APPENDICES 142 Appendix A: Audit and Assurance Reports 143 Appendix B: Experimental Materials 144 Appendix C: Selected Screen Shots from Experiment 150 ABOUT THE AUTHOR End Page

iii
LIST OF TABLES Table 1 Participant Demographic Data for Initial Data Set 45
Table 2 Time on Task 48
Table 3 Participant Demographic Data for Reduced Data Set 49
Table 4 Demographic Covariates 52
Table 5 Theoretical Covariates 58
Table 6 Task-Related Covariates 64
Table 7 Summary of Significantly Correlated Covariates 67
Table 8 Preliminary ANCOVA Results for REPORTING and
ASSURANCE on PREDICTION 68
Table 9 Preliminary ANCOVA Results for REPORTING and
ASSURANCE on TRACKING 69
Table 10 Preliminary ANCOVA Results for REPORTING and
ASSURANCE on CONFIDENCE 70
Table 11 Preliminary ANCOVA Results for REPORTING and
ASSURANCE on SOURCE CREDIBILITY 71
Table 12 Preliminary ANCOVA Results for REPORTING and
ASSURANCE on INFORMATION RELIABILITY 72
Table 13 Perception Dependent Variables Item Analysis 76
Table 14 Dependent Variable Correlations 79

iv
Table 15 MANCOVA Results for REPORTING and
ASSURANCE on PREDICTION, TRACKING,
CONFIDENCE, SOURCE CREDIBILITY AND
INFORMATION RELIABILITY 81
Table 16 PREDICTION Descriptive Statistics 91
Table 17 ANCOVA Results for REPORTING and
ASSURANCE on PREDICTION 91
Table 18 TRACKING Descriptive Statistics 93
Table 19 ANCOVA Results for REPORTING and
ASSURANCE on TRACKING 97
Table 20 CONFIDENCE Descriptive Statistics 99
Table 21 SOURCE CREDIBILITY Descriptive Statistics 103
Table 22 INFORMATION RELIABILITY Descriptive Statistics 105
Table 23 ANCOVA Results for REPORTING and
ASSURANCE on INFORMATION RELIABILITY 106
Table 24 INFORMATION VALUE Descriptive Statistics 108
Table 25 INFORMATION VALUE Regression Analysis Testing H3a 109
Table 26 Differences in Base and Treatment for TRACKING 113
Table 27 Information Items Ranking 115
Table 28 Information Items Reliance 116
Table 29 Post Hoc MANCOVA: Results for REPORTING and
ASSURANCE on Components of SOURCE
CREDIBILITY – EXPERTISE and TRUSTWORTHY 117

v
Table 30 EXPERTISE Descriptive Statistics 120
Table 31 TRUSTWORTHY Descriptive Statistics 120
Table 32 Post Hoc INFORMATION VALUE Component PAYREC Regression Analysis Testing H3a 122 Table 33 Post Hoc INFORMATION VALUE Component HIGHERSTOCKPRICE Regression Analysis Testing H3a 123 Table 34 Post Hoc INFORMATION VALUE Component PAYREC Regression Analysis Testing H3b 124
Table 35 Post Hoc INFORMATION VALUE Component HIGHERSTOCKPRICE Regression Analysis Testing H3b 125
Table 36 Summary of Findings – F Statistic and p-Value 127

vi
LIST OF FIGURES
Figure 1 Dimensions of Reporting and Assurance 4
Figure 2 Independent Variable Manipulation 28
Figure 3 Model of Information Economics Value of Information 29
Figure 4 Research Model 30
Figure 5 Items of Financial Information Used in Research Instrument 33
Figure 6 Main Effect of ASSURANCE on PREDICTION 93
Figure 7 Interaction of REPORTING and ASSURANCE
on TRACKING 97
vii
PERFORMANCE AND PERCEPTION: AN EXPERIMENTAL INVESTIGATION OF THE IMPACT OF CONTINUOUS REPORTING AND CONTINUOUS ASSURANCE
ON INDIVIDUAL INVESTORS
Anita Reed
ABSTRACT This study was designed to examine the impact of different levels of reporting
frequency (periodic versus continuous) of financial information, both with and without
assurance, on individual investors in a stock price prediction task. Reporting was
manipulated at two levels: periodic and continuous. Assurance was manipulated at two
levels: no assurance and with assurance. In addition, a base level condition was included.
The experiment was designed to collect data regarding both the investors’ performance
and their perceptions. Period one of the experiment consisted of the base level condition
for all participants. Independent variable manipulation was implemented in period two,
using a 2 X 2 design.
The results indicated that the main effect of Assurance was significant with regard
to the number of times participants correctly predicted the change in stock price direction
(PREDICTION). The results of the analysis also indicated that the interaction of
Reporting and Assurance was significant with regard to the number of times participants
made stock price change predictions in accordance with an expectation of mean-reverting
stock prices (TRACKING). Post hoc analysis on TRACKING indicated that increased
levels of reporting frequency and assurance could adversely affect the quality of
individual investors’ investment decisions.

viii
The results indicated that increased levels of reporting and assurance were not
significant with regard to individual investors’ perception of source credibility,
information relevance or information value. Post hoc analysis provided some evidence
that increased levels of reporting frequency may lead to an increase in the perceived
trustworthiness of the source of the information and investors may be willing to pay more
for the stock of a company that provided increased levels of reporting of fundamental
financial data.
1
1.0 INTRODUCTION “The ultimate destination in a quest for timeliness, whether or not it is deliberately sought, is continuous reporting and auditing (Elliott, 2001, p. 2).”
1.1 Introduction and Relevance of the Study
The credibility of information presented in the US capital markets has been
damaged by the corporate accounting scandals of the past several years. These scandals
have reduced public confidence in the financial information available from companies
and investment analysts (Daigle and Lampe, 2003; Hodge, 2003). Restoring public
confidence in audited financial information is crucial to the continued success of the US
capital markets. Investors and regulators are calling for business to adopt more
transparent reporting mechanisms to bolster the credibility of the information. “The most
often mentioned means of restoring public confidence is a combination of new, improved
and timelier financial reporting coupled with assurance of the information when
disseminated (Daigle and Lampe, 2003, p. 7).”
The purpose of this study is to examine the extent to which continuously reported
information is of value to the investor, and the extent to which continuous assurance on
the information adds incremental value, by examining its impact on investment decision
quality. The effect of continuous reporting and continuous assurance on investors’
perceptions of the value of information will also be investigated.
2
Increasing numbers of investors have taken advantage of access to Internet trading
Websites and have become more active in buying and selling stocks as they manage their
own portfolios (NYSE, 2000; Hunton, Reck, Pinsker, 2002). The NYSE study indicates
that more than one million daily trades were made through on-line brokerage accounts in
the first quarter of 2000 (NYSE, 2000). Investors consequently need timely information
that can be accessed and used without significant cost. The demand by investors, and
potentially by regulators, for businesses to adopt continuous reporting is increasing
(Libbon, 2001; Hunton, Wright, Wright, 2003; Jones and Xiao, 2004). Researchers
recognize that continuous reporting will result in richer disclosure by reporting entities,
resulting in potential benefits including reduced market volatility, reduced cost of capital
for reporting entities and more relevant and timely information for investors and analysts
(Elliott, 2002). In addition, Congress, the Securities and Exchange Commission (SEC)
and the American Institute of Certified Public Accountants (AICPA) have recognized the
potential contribution of continuous assurance to investors and other stakeholders
(CICA/AICPA, 1999; Vasarhelyi, Alles, Kogan, 2003). It is uncertain what direction the
Public Company Accounting Oversight Board (PCAOB) will take in its
recommendations, but continuous auditing techniques potentially will be included in their
agenda.
Parallel with the development of continuous reporting and assurance technology is
the standardization of extensible business reporting language (XBRL), a software tagging
language based on extensible markup language (XML). The standardization of XBRL
will allow corporations to make financial and non-financial data available to investors (as

3
well as auditors, regulators and other stakeholders), without disclosing proprietary
information to competitors. It is proposed that companies make databases of XML/XBRL
tagged information available to investors and regulators for use in data analysis (Elliott,
2002). The SEC has recently issued a proposed regulation to require use of XBRL filing
for all publicly traded corporations, a further indication of the SEC’s intent to foster more
transparent financial reporting (SEC, 2008). Previously, the SEC had implemented a
voluntary XBRL filing program for SEC registrants, with over seventy-five companies
posting their reports using XBRL tags (SEC, 2005). If adopted, the new proposed
regulation will phase in beginning with filings for accounting periods ending on or after
December 31, 2008 and will initially apply to large domestic and foreign filers, with a
full phase-in for all filers by 2010. As investors become more aware of the power of
XBRL enabled reporting, they are expected to demand that more richly detailed data be
made available on a continuous or more frequent basis.
Figure 1 offers an illustration of the dimensions of Assurance and Reporting. Box I
indicates the current status of financial reporting and assurance. Box II indicates the
status if increased levels of assurance are implemented. Box III indicates the status if
increased levels of reporting frequency are implemented. Box IV indicates the status if
both increased levels of assurance and increased levels of reporting frequency are
implemented.

4
FIGURE 1 DIMENSIONS OF REPORTING AND ASSURANCE
II Periodic Reporting of Financial Statement and Non-financial Information Continuous Assurance on all Information
IV Continuous Reporting of Financial Statement, Data Level and Non-financial Information Continuous Assurance on all Information
ASSURANCE
I Periodic Reporting of Financial Statement and Non-financial Information Periodic Attestation on Financial Statement Information and No Assurance on the Non-financial Information
III Continuous Reporting of Financial Statement, Data Level and Non-financial Information Periodic Attestation on Financial Statement Information and No Assurance on the Data Level or Non-Financial Information
REPORTING
While there is an expectation that continuous reporting of financial information,
with or without continuous assurance, is the coming paradigm, there are differing views
on how this increased level of information will impact the decision making of individual
investors. These differing views stem from the information economics literature and the
judgment and decision-making literature.
The view taken by the information economics literature is that increased
availability of information to investors should increase the ability of individual investors
to make more fully informed decisions regarding investments. Information economics
tells us that information is of value to investors to the extent it reduces the uncertainty
they face in making investment decisions and to the extent it improves their decision-
making (Cohen, Lamberton, Roohani, 2003). However, the value of information hinges
not only on availability, but also on the usefulness of information to the user. The value
of information is a function of characteristics of the decision, the decision maker and the

5
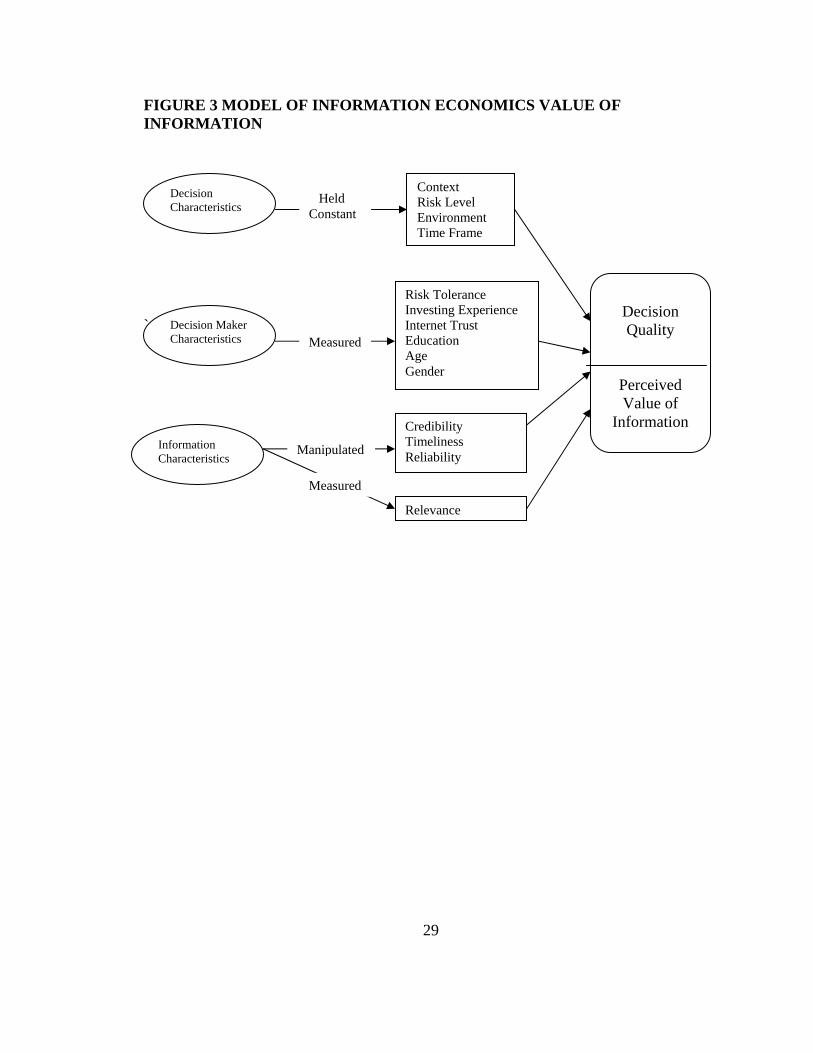
information (Cohen, et al., 2003). Characteristics of the decision include the decision
context, level of risk, the decision environment and the decision time frame. These
characteristics will be controlled and held constant in the present study. Characteristics of
the decision maker include risk propensity, investing experience, Internet trust, education,
gender, and age. These characteristics are intrinsic to the decision maker and will be
measured in the present study. Characteristics of the information include the credibility of
the source of the information, the timeliness of the information, the reliability of the
information, and the relevance of the information for the investment decision. The effect
of continuous reporting and continuous assurance on the investors’ decision quality
resulting from increased availability of information will be examined in the present study,
with an ex ante presumption that the decision quality will improve if the information is
more useful. Relevance will be assumed and measured in this study.
An alternate view of the value of continuous reporting stems from the literature
on judgment and decision-making, which finds that more information does not always
result in better decisions. Information that is continuously reported may increase the
cognitive load of the investment decision to the extent that information overload occurs
and investors are unable to process the information properly within the investment time-
frame, resulting in reliance upon heuristic decision processes, fixation on a limited subset
of available information and inability to separate relevant from irrelevant information
(Chewning and Harrell, 1990; DiFonza and Bordia, 1997; Lipe, 1998). Consequently,
they may make investment decisions of lower quality when receiving continuously
reported information.
6
In addition to examining the impact on decision quality, which is a normative
measure of information value, it is also of interest to examine investors’ perception of the
value of continuously reported information. Investors may perceive that they are
receiving more valuable information when in fact they are not able to use the information
to make better decisions and may even make poorer decisions (DiFonza and Bordia,
1997). However, their perceptions may drive demand for continuous reporting. The
effect of continuous reporting and continuous assurance on the investors’ perception of
the value of information resulting from increased source credibility, timeliness and
reliability will be investigated in the present study
1.2 Research Questions
As discussed above, the primary purpose of this study is to examine the impact of
continuous reporting and continuous assurance on individual investors. Two perspectives
will be examined: 1) the impact of continuously reported information, with and without
assurance, on individual investors’ decision-making and 2) investor’s perception of the
value of continuously reported information, with and without continuous assurance. The
following research questions are posed:
1. Does the frequency of reporting (periodic versus continuous) have a positive or
negative impact on the investment decision quality of individual investors?
2. Does providing assurance have a positive impact on the investment decision
quality of individual investors?
3. Does the frequency of reporting (periodic versus continuous) increase
individual investors' perception of source credibility?

7
4. Does increased perception of source credibility increase individual investors’
perception of the value of information?
5. Does the frequency of reporting (periodic versus continuous) increase
individual investors' perception of information reliability?
6. Does increased perception of information reliability increase individual
investors’ perception of the value of information?
7. Does providing assurance increase individual investors’ perception of the value
of information?
Frequency of reporting will be modeled as bi-weekly reporting (periodic) or daily
reporting (continuous). Assurance will be modeled as either no assurance or assurance.
1.3 Motivation for the Study
A number of theoretical studies have been published regarding the potential
impact of continuous auditing on investors (Hunton, Reck, Pinsker, 2002; Hunton,
Wright, Wright, 2002). To date, little experimental research has been conducted to
determine if continuous reporting and assurance has an impact on investors’ decision
quality or investors’ perception of the value of information (O'Donnell and David, 2000).
Previous studies have examined the impact of continuous reporting in the form of “on-
going release of information about the firm,” but not the “continual updating of the same
piece of information” in the context of investor stock price decisions (Hunton, Reck,
Pinsker, 2002, p.5). Other studies have examined the demand for continuous assurance,
with mixed results regarding information users’ willingness to pay for the service (Pany
and Smith, 1982; Daigle and Lampe, 2000; Arnold, Lampe, Masselli, Sutton, 2000;

8
Boritz and Hunton, 2002; Alles, Kogan, Vasarhelyi, 2002; Daigle and Lampe, 2003;
Hunton, Wright, Wright, 2003; Nicolaou, Lord, Liu, 2003; Daigle and Lampe, 2004).
Much research needs to be done to provide insight into the impact of various
forms of continuous reporting and assurance techniques and reporting models on
investors. This research is needed due to the high cost of designing and implementing
continuous reporting and assurance technology. In addition, there is little current
regulation of financial reporting on the Web, which is a necessary element in promoting
the growth of such reporting (Lymer and Debreceny, 2002).
1.4 Contributions
In anticipation of the changing paradigm of information reporting and assurance,
the goals of this study are to provide ex ante evidence regarding the impact of continuous
reporting and continuous auditing on investors’ investment decision quality and on
investors’ perception of the value of information.
The research design was implemented via a simulation wherein participants were
provided with either periodic or continuous financial information on which to base stock
price predictions. Assurance on the information was also manipulated. The research
design allows for data regarding the investors’ reactions to continuously updated
financial information to be collected. In addition, the research design allows for
differentiation between investors’ reaction to information from continuous reporting
without assurance compared to continuous reporting with assurance. The research
design provides guidance to reporting entities, regulatory agencies and software
developers regarding the usefulness of continuous reporting and the need for assurance.

9
The design and use of a simulation in the present study is a novel approach to
elicit and analyze investor behavior in the continuous reporting and continuous assurance
environment.
The results of the study indicate that the main effect of Assurance was significant
with regard to the performance dependent variable PREDICTION, a measure of the
number of times participants correctly predicted the change in stock price direction. The
results of the analysis also indicated that the interaction of Reporting and Assurance was
significant with regard to the dependent variable TRACKING, a measure of the number
of times participants made stock price change predictions in accordance with an
expectation of mean-reverting stock prices. Post hoc analysis on the performance
dependent variable TRACKING indicated that increased levels of reporting frequency
and assurance could adversely affect the quality of individual investors’ investment
decisions. However, the results indicated that increased levels of reporting and assurance
were not significant with regard to individual investors’ perception of source credibility,
information relevance or information value. Post hoc analysis provides some evidence
that increased levels of reporting frequency may lead to an increase in the perceived
trustworthiness of the source of the information and that the increase in perceived
trustworthiness may lead to an increased willingness to pay more for the stock of a
company that provided increased levels of reporting of fundamental financial data.
The remainder of the dissertation is organized as follows: Section 2 provides the
literature review and hypothesis development, Section 3 details the research methodology

10
and design, Section 4 contains the analysis and Section 5 discusses the conclusions,
limitations and future research considerations.

11
2.0 LITERATURE REVIEW AND HYPOTHESES DEVELOPMENT
2.1 Introduction
In order to provide a background for examining the impact of continuous
reporting and continuous assurance on individual investors, an overview of the literature
regarding the feasibility of continuous reporting and continuous assurance will be
provided. Thereafter, the reporting model and the added value of continuous assurance
will be discussed, leading to the development of the relevant theoretical constructs. Then,
the information economics model of the value of information will be discussed and
contrasted with the judgment and decision-making literature to develop the hypotheses
regarding investors’ decision quality. Finally, the information economics model will be
used to develop hypotheses regarding investors’ perception of the value of information.
2.2 Feasibility of Continuous Reporting and Continuous Assurance
Continuous reporting (CR) and continuous assurance (CA) have been discussed in
the literature for more than two decades. Alles, et al. (2002) describe the elements of
technology that must exist for the implementation of CR and CA. The AICPA and the
CICA commissioned a report on the feasibility and implementation of CA (CICA/AICPA
1999), including reports and a variety of other information. Despite the broad based
nature of the research involving CR and CA, there is a lack of agreement regarding a
precise definition of each. For purposes of this study the following definitions will be
used:

12
Continuous Reporting: The ongoing, real-time reporting of both financial and non-financial information to external parties. (Cohen, et al., 2003). Continuous Assurance: The ongoing, real-time, independent third-party assurance of both financial and non-financial information. (Adapted from (CICA/AICPA, 1999). The technology to support these concepts is converging rapidly. One of the
technological advances that is leading the way to CR and CA is the development of
extensible mark-up language (XML) and extensible business reporting language (XBRL)
as the basis for providing information in digital formats that transcend software platforms
and enable information to be shared in a usable format (Cohen, 2000; Bovee, Ettredge,
Srivastava, 2001; Cohen, 2001; Rezaee, Hoffman, Marks, 2001; Cohen, 2002; Murthy
and Groomer, 2004). Extending the value of XBRL is the development of XBRL GL,
which provides a common structure for the financial statements of disparate corporate
entities and allows for ease of downloading financial information for comparison.
2.3 Reporting Model
The focus of the current study is on individual investors, who have been shown to
represent a growing segment of U.S. investors (NYSE, 2000; Hunton, Reck, Pinsker,
2002). Individual investors are accustomed to receiving information regarding the
companies in which they invest via the Internet, either directly from company Web sites
or from investment brokerage Web sites (Asthana, 2003). The current state of company
reporting via the Web typically involves an investor relations Website used to
electronically publish the company’s annual report and the annual and quarterly (10K and
10Q) reports required by the SEC (Ettredge, Richardson, Sholz, 2001; FASB 2001;
13
Lymer and Debreceny, 2002; Asthana, 2003). In addition, many companies use the same
Web site for various information releases. These information releases take the form of
earnings disclosures, personnel changes, product releases, etc. The annual report and the
10K reports include an audit opinion on the financial information presented. The 10Q
reports are accompanied by review reports from the external auditor. The audit opinion
and review reports accompany the Web reported information to varying degrees
(Ettredge, et al., 2001; FASB, 2001; Hodge, 2001; Lymer and Debreceny, 2002). Interim
information releases and non-financial information have no form of assurance. Investors
can sign up to receive e-mail alerts from the company when new information is made
available on the investor relation site. The company determines when to update the Web
site with new information.
Under a continuous reporting paradigm, the investor would have access to
financial and non-financial data that are continuously updated by the company (Elliott,
2002). To date, no company actually makes this information available to external users,
but the technology is rapidly becoming available to allow this form of reporting. The
continued development and increased use of XBRL and other Web service technologies
facilitate the ability of companies to make a Website available that allows investors to
access the continuously updated data on demand and feed it directly into spreadsheet
applications or other financial analysis tools. For example, a financial analysis tool is
now available from Edgar Online that functions as an Excel add-in and retrieves data
directly for Edgar Online via a web service (EDGAR online, 2008). The continuously
reported data would include the information that is currently available on investor

14
Websites, as well as current updates to the information. Quarterly and annual
information would include a review or audit report, as required by SEC regulations for
publicly held companies. Interim information releases would be included with the
continuously reported information as they become available. Additional forms of
financial and non-financial data would be included as the company determines what
information is appropriate based on the needs of investors. The company would control
whether the continuously reported information has any form of assurance. There is the
potential under this reporting model to require the investor to pay for assurance (Elliott,
2002).
2.4 Assurance Model
The move to implement continuous reporting has momentum as companies make
progress towards a more transparent reporting environment. Companies who have
implemented enterprise resource planning systems (such as MySAP ERP or SAP ERP,
PeopleSoft, Oracle and Cognos) and extensive investor relations Web sites can make
available increasingly greater amounts of financial and non-financial content available on
an almost continuous basis with very little additional effort or cost through the
implementation of web-enabled reporting mechanisms. However, the move to
implement continuous assurance is more problematic. The initial issue that must be
addressed is to determine which information can or should be assured and then to
determine the level of assurance that can be provided (Rezaee, Ford, Elam, 2000; Alles,
et al., 2002; Cohen, et al., 2003; Vasarhelyi, Alles, Kogan, 2003) The ability to provide
continuous assurance on this information is not easy to implement and, therefore, not as
15
cost-free as continuous reporting. As a result, either the providing companies or the
information users must perceive a value in continuous assurance and be willing to pay for
the added cost. Studies that have examined the demand for continuous assurance and the
willingness of investors and other information users to pay for continuous assurance have
found mixed results (Pany and Smith, 1982; Daigle and Lampe, 2000; Arnold, et al.,
2000; Boritz and Hunton, 2001; Alles, et al., 2002; Daigle and Lampe, 2003; Hunton, et
al., 2003; Nicolaou, et al., 2003; Daigle and Lampe, 2004, Lampe and Daigle, 2006). In
addition, accountants and researchers have proposed a variety of methodologies for
implementing continuous assurance, indicating a lack of agreement on many of the basic
issues regarding continuous assurance (Groomer and Murthy, 1989; Vasarhelyi and
Halper, 1991; Rezaee, et al., 2000; Alles, et al.,2002; Rezaee, Sharbaroghlie,Elam,
McMickle, 2002; Murthy and Groomer, 2004; Hunton, Mauldin, Wheeler, 2008).
In determining what should be assured and the level of assurance provided,
companies need to consider what level of assurance provides value to the information
user. The AICPA has defined assurance as a “broad range of services above and beyond
the traditional attest function performed in rendering an opinion on financial statements.
According to the committee, auditing is a subset of the attest function and the attest
function is a subset of assurance services” (Cohen, et al., 2003). It is informative,
therefore, to envision CA as a continuum ranging from the attest function at the basic end
and continuous assurance at the expanded end. The level of assurance will be determined
by user demand, and range over the entire spectrum depending on the decision being

16
made and the type of information being assured (Daigle and Lampe, 2000; Alles, et al.,
2002; Daigle and Lampe, 2003; Daigle and Lampe, 2004).
The potential exists for investors and other users to find no additional value from
adding assurance to continuously reported information. In addition, individual investors
appear to have a limited understanding of the nature of auditing services, which may
impact their ability to distinguish between unaudited information, audited information
and assured information (Pany and Smith, 1982; Hunton, Reck, Pinsker, 2002). Pany and
Smith (1982) examined the value of auditor association with financial information by
comparing the traditional audit and review opinions on paper based financial reporting.
They found that investors were unable to distinguish between the two reports and
attached no additional value to the audit. Hunton, Reck, Pinsker (2002) compared
management assurance to external auditor assurance on news releases about the firm.
They found that investors perceived greater credibility for auditor assured information,
but may have done so without fully understanding the nature of assurance services.
Several studies have indicated that internal information users are more likely to demand
and be willing to pay for continuous assurance than external information users (Daigle
and Lampe, 2000; Daigle and Lampe, 2003; Daigle and Lampe, 2004). These studies
suggest that the value associated with assurance will vary according to the decision being
made, the type of information required and the level of assurance provided.
The process for implementing continuous assurance will also vary according to
the type of information and the level of assurance. A variety of methodologies and
approaches have been proposed and defined, ranging from embedded audit modules to

17
automated data warehouses and Web-based continuous auditing services (Groomer and
Murthy, 1989; Vasarhelyi and Halper, 1991; Kogan, Sudit, Vasarhelyi, 1999; Rezaee, et
al., 2000; Alles, et al., 2002; Rezaee, et al., 2002).
One thing that all proponents of continuous reporting and continuous assurance
agree on is the requirement for the information to be provided using on-line, or Internet
based, technologies. In the paradigm of Internet based reporting, greater opportunity
exists for information to be altered in the process of transmission from provider to user.
This indicates that two separate issues must be addressed in the continuous
reporting/continuous assurance environment: assurance on the information itself and
assurance on the systems that transmit the information from its source to the user. The
value placed on assurance of electronically disseminated information must be
differentiated between the two issues (Boritz and No, 2003; Nicolaou, et al., 2003). The
purpose of the current study is to examine the additive value of assurance on the
information itself; therefore, the participants will be provided with information
explaining that the electronic systems that convey the information to them are monitored
to assure that no alteration occurs during transmission.
2.5 Value of Information
When examining the value of information, it is essential to first determine if the
value being measured is normative or perceived and if the value is being measured ex-
post or ex-ante (Nadiminti, Mukhopakhyay, Kriebel, 1996). Research questions 1 and 2
address a normative approach to the value of CR/CA by examining the impact on
decision quality, measured by changes in decision quality. Research questions 3 and 4

18
address a perception approach to the value of CR/CA by examining the impact on
investors’ perceptions, measured by investors’ self-assessed perception. Both sets of
questions reflect an ex-post measurement of the value of the information. To address
research questions 1 and 2, the information economics view of information value will be
compared to the judgment and decision-making view of the impact of information
overload to develop the hypotheses related to decision quality. To address research
questions 3 and 4, the information economics literature will be utilized to develop
hypotheses related to investors’ perception of the value of information.
2.5.1 Investor Decision Quality
Information economics provides a perspective that the value of increased
availability of information hinges on the investor’s ability to use the information to
reduce the uncertainty of a decision and consequently improve the ability to make high
quality decisions, provided the information is relevant and possesses the requisite level of
credibility, timeliness and reliability (Cohen, et al., 2003). The value of information to
an investor can, therefore, be measured by the increased return from investment
decisions. In the current study, decision quality is defined as the number of times the
participant investors make ‘correct’ prediction decisions when exposed to different levels
of information availability. Other factors that impact the value of increased levels of
information include characteristics of the decision and the decision maker (Cohen, et al.,
2003). Characteristics of the decision include the decision context, level of risk, the
decision environment and the decision time frame. These characteristics will be
controlled and held constant in the present study. Characteristics of the decision maker

19
include risk propensity, investing experience, Internet trust, education, gender, and age.
These characteristics are intrinsic to the decision maker and will be measured in the
present study.
Provided that the information possesses the necessary qualities, information
economics yields an ex ante presumption that decision quality will improve if the
investor receives and makes use of increased levels of information.
However, evidence from the judgment and decision-making literature leads to
concerns regarding individual investors’ ability to adequately make use of continuously
reported information (Chewning and Harrell, 1990; Hunton, Wright, Wright, 2002;
Hunton, et al., 2003; Hunton, Wright, Wright, 2004). The potential exists for
continuously reported information to result in an overabundance of information that
exceeds the investor’s cognitive ability to process and effectively utilize the information
within the investment decision timeframe. As a result, they are not able to use the
information to make better decisions and may even make poorer decisions (DiFonza and
Bordia, 1997). This could lead to reliance upon heuristic decision processes, fixation on
a limited subset of available information and/or inability to separate relevant from
irrelevant information (Chewning and Harrell, 1990; DiFonza and Bordia, 1997; Lipe,
1998). Prior research indicates that decision-makers’ ability to integrate data elements
into their decision process “follows a bell-shaped curve, also referred to as an inverted-U
curve” (Chewning and Harrell, 1990, p. 527). That is, they are initially able to integrate
additional data elements into their decision making process, but will eventually reach a
point of information overload at which time they will not only be unable to integrate new

20
data elements but will actually integrate fewer data elements into the decision process
(Schroder, Driver, Struefert, 1967; Chewning and Harrell,1990).
Information load has been characterized both in terms of quantity of different
dimensions of information and quantity of repeated measurements of each dimension.
Prior research has found that it is the quantity of different dimensions of information that
leads to information overload within a given time frame, leading to recommendations that
the number of data elements provided for a given decision be limited to a “relatively
small set” of the elements with the “greatest predictive ability” or to provide the decision-
maker with a “decision model suited for the particular decision” (Chewning and Harrell,
1990, p.539). When this recommendation is considered in the context of continuous
reporting, an individual investor might initially be overwhelmed by the quantity of data
elements available but may eventually develop an adequate decision model to allow for
the identification and integration of the most appropriate set of decision elements. Once
an appropriate set of data elements is selected, the repeated measurements of the data
elements should not lead to information overload. Several studies have examined
individual investors’ ability to identify appropriate data elements for the investment
decision, with mixed results (Chewning and Harrell, 1990; DiFonza and Bordia, 1997).
In an experimental market study, Chewning, Collier, Tuttle, (2004) compared a
group of individual investors trading in a market that included a sophisticated investor to
a group of individual investors trading in a market without a sophisticated investor and
found evidence that individual investors may learn to copy the decision-making strategy
of sophisticated investors after observing how sophisticated investors trade in reaction to

21
changes in data elements (Chewning, et al., 2004). However, Difonza and Bordia
conducted a study to examine the psychological effect of rumor versus fact on individual
investors (Difonza and Bordia, 1997). In a control group, participants were provided with
the daily stock price and the percentage of change from the previous day's stock price. In
the treatment group, participants were provided with information items periodically
throughout the trading session. Some of the information items were rumors, some were
fact. They found that individual investors provided with information items in addition to
daily stock prices were unable to identify relevant information and actually made less
profitable trading decisions than those investors provided only with daily stock prices,
even though the more informed investors believed they had appropriately incorporated
the additional information into their decisions (DiFonza and Bordia, 1997). The
participants traded in response to the rumors as if they were facts, but did not believe they
had done so. The evidence from the DiFonza and Bordia study indicates that, when no
other information is available, individual investors tend to “track” the stock price and
make investment decisions in inverse relation to the direction of stock prices (buy low,
sell high). The tracking behavior exhibited by individual investors appears to result from
their belief that changes in the stock price are transitory and the stock price will be mean
reverting in subsequent periods (DiFonza and Bordia, 1997). However, when provided
with additional information, individual investors exhibited trading behaviors that deviated
from tracking, which resulted in less profitable trading than their less informed
counterparts. DiFonza and Bordia theorize it is because investors’ believe that the
change in stock price is attributable to the additional information and no longer rely on

22
their previous ‘mean-reverting’ trading strategy (1997). The changes in trading behavior
indicate the individual investors responded to the information but were unable to take
advantage of it to improve their trading performance. It is not known if this was due to
lack of experience with the trading task or lack of time to properly incorporate the
information into the trading decision. However, it is evidence that individual investors
may be better off relying on the stock price, which incorporates the trading expertise of
the market, than in seeking out additional data.
Higher quality investment decisions would result from the investor being able to
incorporate the information into the decision making process within the allowed time
frame and more accurately determine whether to buy shares of stock, sell shares of stock
or make no trade than investors in conditions of lower information availability.
The theoretical implications of the tension between information economics and
information overload and the results of prior research lead to the first hypothesis, stated
in the alternative, as follows:
H1a: Investment decisions will be of different quality in conditions of continuous reporting than in conditions of periodic reporting.
If assurance adds to the ability of investors to make use of information to reduce
uncertainty and improve the quality of their investment decision, this should be reflected
in improved decision quality. There is currently little regulation of information reported
via a company Web site (Lymer and Debreceny, 2002). Daigle and Lampe (2003) discuss
the risk of using information provided via the Internet, indicating there are numerous
reports of “erroneous self-released information by entities” (Daigle and Lampe, 2003,
p.4), which could result in losses to investors if relied upon. Assurance by an

23
independent auditor is an impartial assessment of the information reported, as opposed to
management’s own internally generated assessment. Assurance on the information
reduces the risk of relying on erroneous reported information for an investment decision;
therefore, continuous assurance on either periodically or continuously reported
information would result in reduced risk of using the information and improve the quality
of the investor’s decisions.
The second hypothesis, stated in the alternative, is as follows:
H1b: Investment decisions will be of higher quality in conditions where information has been assured than for information that has not been assured.
In addition, there is potential for an interaction between continuous reporting and
continuous assurance of information in its impact on the quality of individual investors’
investment decisions. Investors may make higher quality decisions due to the higher level
of informativeness from continuous reporting combined with greater reliability from
continuous assurance, leading to the third hypothesis, stated in the alternative, as follows:
H1c: Investment decisions will be of higher quality in conditions where information has been both continuously reported and continuously assured.
To operationalize investment decision quality, participants will make predictions
regarding whether the stock price will increase or decrease in the subsequent period and
participants’ predictions will be compared to the actual change in stock price to
determine the number of times a correct prediction is made.
2.5.2 Investors’ Perception of Information Value
Investor demand will conceivably drive the move to continuous reporting and
continuous assurance. Potentially, individual investors may perceive that continuously
24
reported (or assured) information will enable them to make better investment decisions,
even if they do not possess the ability to process and use the information (DiFonza and
Bordia, 1997). Perceived value of information is a function of its perceived source
credibility, timeliness and reliability. Each of these components will be discussed and
appropriate hypotheses formulated.
2.5.2.1 Source Credibility
Implementing continuous reporting and/or continuous assurance systems are
signals from a company that it wants to provide high quality information that is relevant,
timely and reliable. Reporting information on a continuous basis would provide richer,
more transparent disclosure. Higher levels of disclosure have been shown to increase
investors’ perception of the credibility of the company’s management, resulting in an
increase in the perceived credibility of the information (Hirst, Koonce, Miller, 1999;
Hunton, Wright, Wright, 2002; Mercer, 2002). Hirst et al. (1999) find that investors give
consideration to the credibility of the source of information in determining the quality of
information and they tend to give “greater weight” to information that is communicated
by more credible sources. Mercer (2002) finds that investors’ perception of the
credibility of a company may be adversely affected if the company does not provide
disclosure at the level expected by investors. As investors come to expect continuous
reporting, companies who do not utilize it may be perceived as less credible. In addition,
more continuously reported information provides fewer opportunities for management to
‘manage’ earnings to suit their own needs, which may lead investors to believe that firms
who voluntarily report on a continuous basis are more credible.

25
Adding assurance to disclosure is a way for companies to show their own
confidence in the information. Signals of management’s confidence should increase
management’s credibility in the eyes of investors and therefore increase investors’
perception of the value of the information.
Continuous reporting and continuous assurance each have the potential to provide
signals of management’s credibility to investors. In addition, there is potential for an
interaction between the two variables. Increased credibility should result in an increased
perception of value of information. This leads to the next set of hypotheses, stated in
alternate form, as follows:
H2a: Source credibility will be perceived to be higher for information that is continuously reported than it is for information that is periodically reported. H2b: Source credibility will be perceived to be higher for information that has been assured than for information that has not been assured. H2c: Source credibility will be perceived to be higher for information that is both continuously reported and continuously assured.
2.5.2.2 Value of Information
Implementation of a continuous reporting model will provide information to
investors in a timelier manner than the periodic reporting model. Information that is not
timely has no value, even though it could have been relevant to the decision if received
sooner. “Timeliness is critical since information that arrives too late to make a difference
is virtually worthless" (Cohen, et al., 2003, p. 56). On the other hand, there is some
evidence that continuously reported information may result in an overabundance of
information that exceeds the investor’s cognitive ability to process and effectively utilize

26
the information. Such an overload may lead investors to perceive the information as
being less valuable. By proposing that investors find continuously reported information
more valuable, the competing theoretical views can be more effectively tested.
The above discussion leads to the development of the next set of hypotheses,
stated in alternate form, as follows:
H3a: Information that is continuously reported will be associated with a higher perceived value of information than information that is periodically reported. H3b: Higher perceived source credibility will be associated with higher perceived value of information. H3c: Higher perceived reliability will be associated with higher perceived value of information.
If assurance leads to delay in presentation of information, this potentially
decreases the value of information. As a result, no hypothesis is formulated regarding the
impact of continuous assurance on timeliness. In addition, no hypothesis is formulated
regarding the perception of timeliness, as continuously reported information is obviously
timelier than information that is periodically reported.
2.5.2.3 Information Reliability
Implementation of continuous reporting models may lead investors to have
concerns regarding the reliability of the information. As previously discussed, lack of
regulation of company Web sites increases the risk of relying on company provided
information that may be erroneous (Lymer and Debreceny, 2002). Assurance by an
independent auditor is an impartial assessment of the information reported, thereby
reducing the risk of relying on erroneous reported information; therefore, continuous

27
assurance on either periodically or continuously reported information would result in
reduced risk of using the information and increase the value of the information.
There is also potential for continuous reporting to increase the reliability of
information. Investors may find it to be a signal that the company has implemented
higher quality reporting systems. In addition, there is potential for the two variables to
interact. This discussion leads to the next set of hypotheses, stated in alternate form, as
follows:
H4a: Reliability will be perceived to be higher for information that is continuously reported than for information that is periodically reported. H4b: Reliability will be perceived to be higher for information that has been assured than for information that has not been assured. H4c: Reliability will be perceived to be higher for information that is both continuously reported and continuously assured. The next section of the dissertation details the research methodology and design,
followed by Section 4, which contains the analysis and Section 5, which discusses the
conclusions, limitations and future research considerations.

28
3.0 RESEARCH METHOD
3.1 Research Design
The present study utilizes a 2 X 2, experimental design with a base-level period
for all groups. Reporting periodicity is manipulated at two levels, Periodic (modeled as
reporting every tenth decision period) and Continuous (modeled as reporting every
decision period). Assurance source is manipulated at two levels, No Assurance and
Assurance. The Base Level (modeled as no reporting, no assurance), represents the
current reporting and assurance paradigm. The study was implemented in a laboratory
experiment with participants randomly assigned to the treatment conditions.
Figure 2 illustrates the manipulation of the independent variables.
FIGURE 2 INDEPENDENT VARIABLE MANIPULATIONS
Periodic Reporting With Assurance
Continuous Reporting With Assurance
Periodic Reporting No Assurance
Continuous Reporting No Assurance
3.2 Research Model
The model of information economics value of information is shown in Figure 3
and the research model for the current study is shown in Figure 4.
29
FIGURE 3 MODEL OF INFORMATION ECONOMICS VALUE OF INFORMATION `
Decision Maker Characteristics
Decision Characteristics
Information Characteristics
Context Risk Level Environment Time Frame
Decision Quality
Perceived Value of
Information
Risk Tolerance Investing Experience Internet Trust Education Age Gender
Credibility Timeliness Reliability
Held Constant
Measured
Relevance
Manipulated
Measured

30
FIGURE 4 RESEARCH MODEL
Reporting: Periodic Continuous
Credibility Perceived Value of Information
Decision Quality
Reliability
Assurance: No Assurance Assurance
H3(c)
H3(b)
H1(b) & (c)
H2(b) & (c)
H4(b) & (c)
H3a
H4(a) & (c)
H2(a) & (c)
H1(a) & (c)

31
3.3 Participants
Students enrolled in a large Southeastern university were used as participants in
the study. Students have been shown to be appropriate surrogates for relatively
unsophisticated individual investors (Hunton, Reck, Pinsker, 2002; Libby, Bloomfield,
Nelson, 2002). In addition, a study conducted in 1989 by Gomez Advisors found “more
than 11 percent of all online traders were age 25 or under, with 5 percent of their trades
being made from colleges and universities” (Libbon 2001, p. 55). Participants were
awarded course credit for their participation. In addition, students earned cash for each
correct prediction.
3.4 Experimental Procedure
The experiment was conducted entirely via an Internet-based research instrument.
Details of how the research instrument operates are provided in the next section.
Multiple pilot tests were conducted and the instrument constructed so that the experiment
was completed entirely on-line. Details regarding the development of the research
instrument and pilot studies follow.
3.4.1 Financial data for research instrument
The set of financial data for the research instrument was developed as follows.
Initially, data were collected from a focus group of students (the experimental participant
population) regarding the specific items of financial information they would find useful
in making a stock purchase/sell decision. The resulting set of student selected items were
compared to financial information items found to be predictive of stock price returns in
the accounting literature (Ou and Penman, 1989a; Ou and Penman, 1989b; Ou, 1990;

32
Holthausen and Larcker, 1992; Lev and Thiagarajan, 1993). Ten items of financial
information were then selected to be used in the research instrument; listed in Figure 5.
The initial value of these items is based on the financial statements of the task company
(see Appendix B for the task company financial statements). The next step in the
development of the financial data used in the research instrument was to collect stock
price data for a 65 day period for a publicly traded company. The financial information
items were sorted into primary predictors, secondary predictors and tertiary predictors, as
indicated in Figure 5. In the research instrument, changes in the stock price lag changes
in the primary predictors by two days, secondary predictors by three days and tertiary
predictors by five days. This was accomplished by reverse calculating the financial data
based on changes in the stock price. Figure 5 provides the formulae used to calculate each
of the three types of predictors.

33
FIGURE 5 ITEMS OF FINANCIAL INFORMATION USED IN RESEARCH INSTRUMENT
Primary Predictors: Earnings per Share Sales Gross Profit Ratio Operating Income Secondary Predictors: Inventory Current Ratio Accounts Receivable Tertiary Predictors: Return on Equity Debt to Equity Ratio Return on Total Assets Predictor Values Were Reverse Calculated Based On Daily Stock Prices: Primary Predictor Calculations The change in stock price lagged the Primary predictors by 2 days: Formula: (1 + (Stock price percentage change from day 2 to day 3)) times Day -1 Primary Predictor Value = Day 1 Primary Predictor Value Secondary Predictor Calculations The change in stock price lagged the Secondary predictors by 3 days: Formula: (1 + (Stock price percentage change from day 3 to day 4)) times Day -1 Secondary Predictor Value) = Day 1 Secondary Predictor Value Tertiary Predictor Calculations The change in stock price lagged the Tertiary predictors by 5 days: Formula: (1 + (Stock price percentage change from day 5 to day 6)) times Day -1 Tertiary Predictor Value) = Day 1 Tertiary Predictor Value Day -1 is the initial financial data for the fictional company used in the experiment. Descriptions of the individual items are provided in Appendix 2.
3.4.2 Pilot Study I
The first pilot study was conducted to test the adequacy of the 45 second time
window for each decision period and to test the difficulty of the decision task. The
continuous reporting with assurance condition was tested by 27 participants, who made
stock price predictions for 30 decision periods. Twenty four of the participants
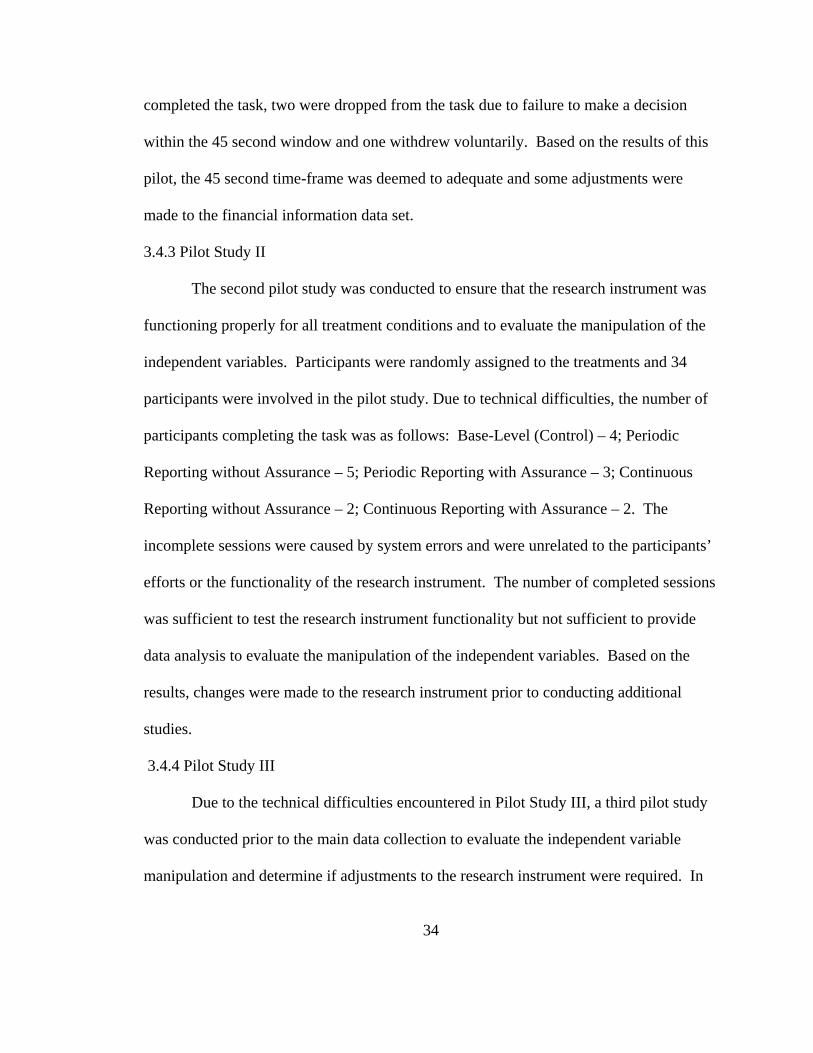
34
completed the task, two were dropped from the task due to failure to make a decision
within the 45 second window and one withdrew voluntarily. Based on the results of this
pilot, the 45 second time-frame was deemed to adequate and some adjustments were
made to the financial information data set.
3.4.3 Pilot Study II
The second pilot study was conducted to ensure that the research instrument was
functioning properly for all treatment conditions and to evaluate the manipulation of the
independent variables. Participants were randomly assigned to the treatments and 34
participants were involved in the pilot study. Due to technical difficulties, the number of
participants completing the task was as follows: Base-Level (Control) – 4; Periodic
Reporting without Assurance – 5; Periodic Reporting with Assurance – 3; Continuous
Reporting without Assurance – 2; Continuous Reporting with Assurance – 2. The
incomplete sessions were caused by system errors and were unrelated to the participants’
efforts or the functionality of the research instrument. The number of completed sessions
was sufficient to test the research instrument functionality but not sufficient to provide
data analysis to evaluate the manipulation of the independent variables. Based on the
results, changes were made to the research instrument prior to conducting additional
studies.
3.4.4 Pilot Study III
Due to the technical difficulties encountered in Pilot Study III, a third pilot study
was conducted prior to the main data collection to evaluate the independent variable
manipulation and determine if adjustments to the research instrument were required. In
35
addition, the research design was altered to discontinue the control group as a separate
treatment group and to incorporate a control segment (base level) into each treatment
condition as a within-subject treatment. This resulted in each treatment condition being
composed of 65 total decisions, the first 30 in the base level condition and the subsequent
35 in the assigned treatment condition. However, the technical difficulties encountered in
the second pilot study were not resolved and resulted in a limited number of completed
sessions. There were 27 participants in the third pilot study with thirteen completed
sessions as follows: Periodic Reporting without Assurance – 3; Periodic Reporting with
Assurance – 3; Continuous Reporting without Assurance – 3; Continuous Reporting with
Assurance – 4. As a result of the limited number of completed sessions, and given that
the main study mirrored the third pilot study, data from the third pilot study were
combined with the main data collection for the purpose of data analysis.
3.4.5 Main Data Study
Multiple experimental sessions were conducted using volunteer student
participants for data collection. Each participant completed the experiment in a classroom
lab. Each participant was randomly assigned to one of the four treatment groups. Initially,
each participant completed the informed consent form. The participant then received
information explaining the task and company data. The participant was allowed to read
through the explanatory screens at his/her own pace. When the participant completed
reading the explanatory screens, the stock price prediction task began. The stock price
prediction task was composed of 65 decision periods and lasted about 45 minutes. After
the stock price prediction task was completed, the participant was asked a series of

36
questions to collect demographic data including investing experience, education, major,
age and gender. Then the participant was then asked a series of questions to collect
dependent variable information. Finally, the participant responded to a series of
manipulation check questions and other questions to capture covariate data. The total
time for the experiment was less than one hour.
3.5 Task
The experiment is a stock price prediction task. Participants made stock price
prediction decisions for 65 prediction periods. The participants were required to make a
prediction regarding whether the stock price will go up or down in the next period. The
participants were given a maximum of 45 seconds to make each prediction. They were
able to move to each subsequent prediction period at their own pace, subject to the 45
second time limit. The financial information and stock price data were developed using
the actual 65 day stock price for a widely traded stock. This allowed for determination in
advance of the correct prediction. In addition to predicting the stock price direction (i.e.,
whether the stock price would go up or down), each participant was asked to indicate
their confidence in their prediction using a 0 to 100% scale.
The stock price prediction task was determined to be a valid proxy for the 'buy or
sell' investment decision and was deemed to be a task more appropriate for the student
participant pool than other similar tasks, such as predicting the stock price.
During the stock price prediction task, each participant’s screen displayed
information regarding the prediction period number, the number of seconds left in the
prediction period (this counted down from 45 for each period), current stock price,

37
previous period stock price, percentage of change in the stock price (either increase or
decrease) from the previous period, and the menu buttons for the two predictions: ‘the
stock price will go up’ or ‘the stock price will go down.’ Participants were informed that
they must make a prediction in each period and would not be allowed to proceed to the
next prediction period until they had done so. Each screen also included the question
“How confident are you in your stock price prediction?” and the participants were
required to indicate their confidence by clicking the button on an 11 item scale that
ranged from 0% to 100% with intervals of 10%. A response to this question was required
before the participant could move to the next decision period.
In addition to the information detailed above, the participants’ screens displayed
financial information, auditor reports and assurance reports pursuant to the specific
treatment condition. Participants in the Periodic Reporting condition received additional
financial information every tenth decision period and participants in the Continuous
Reporting condition received additional financial information in each decision period.
Participants in the Assurance conditions were able to access the independent auditor’s
report as shown in Appendix A in each decision period by clicking on a button ‘Audit
Report’. The auditor’s report refers to the assurance probability assessment that is
updated each time new financial data are presented. This is operationalized by providing
participants in the Assurance conditions an assurance probability report each time
financial information in addition to the stock price data are displayed. For participants in
the Periodic Reporting with Assurance condition, both reports were available in every
tenth decision period. For participants in the Continuous Reporting with Assurance

38
condition, both reports were available in each decision period. The assurance probability
report is shown in Appendix A. The percentage displayed in each assurance probability
report was generated using a random number generator with values between 87-97% and
is displayed in red. A common set of assurance probability reports was used for both
assurance conditions. The use of assurance probabilities and displaying the probabilities
in red was intended to encourage participants to attend to the reports.
Selected screen shots from each version of the experiment are presented in
Appendix C.
3.6 Variables
3.6.1 Independent Variables
3.6.1.1 Reporting Model
The independent variable of Reporting Model was manipulated at two levels:
Periodic Reporting: participants in this condition received financial information every
tenth decision period. They received stock price information in each decision period.
Continuous Reporting: participants in this condition received financial information in
each decision period. They received stock price information in each decision period.
When determining how to operationalize ‘periodic’, every tenth decision period
was selected in order to balance the difference between periodic and continuous, but still
have enough reporting periods to have an effect. If ‘continuous’ is viewed as daily
reporting, every tenth period approximates to reporting every two weeks.
Investors are faced with a barrage of qualitative data regarding company status on
a continual basis. As a result, they are essentially in a state of ‘continuous reporting’ with

39
regard to this type of information. The new reporting paradigm, consequently, will be
modeled as the continuous reporting of quantitative data including fundamental financial
statement data and business performance metrics. When determining what form of data
to present in the experimental setting, fundamental financial statement data were selected
due to the ability to use historical stock price data from an existing company to develop
the data set for the stock price prediction task. In addition, fundamental financial data has
been found to be predictive of stock prices (Ou and Penman, 1989a; Ou and Penman,
1989b; Ou 1990; Holthausen and Larcker, 1992; Lipe, 1998). The information reported to
the participants has previously been described in the experimental procedures section.
3.6.1.2 Assurance Model
The independent variable of Assurance Model was manipulated at two levels:
No Assurance: no audit or assurance probability reports were available.
Assurance: the independent auditor’s report was available in each decision period and
assurance probability reports were available in each decision period where new financial
information was displayed.
These reports were developed similar to the reports recommended by
CICA/AICPA’s monograph and are similar to reports used in prior research
(CICA/AICPA, 1999; Hunton, Reck, Pinsker, 2002). These reports are shown in
Appendix A.
For the periodic reporting with assurance condition, the audit report was available
for each prediction period and the assurance probability report was available for only
those periods when the financial information items were presented. For the continuous

40
reporting with assurance condition, both the audit report and the assurance probability
report were available in each prediction period. No auditor reports or assurance
probability reports were available for the control period, the periodic reporting without
assurance condition or the continuous reporting without assurance condition. As
discussed previously, the participants accessed available reports by clicking on the
appropriate buttons.
Manipulation check questions were utilized to determine how often the
participants read the available reports.
3.6.2 Dependent Variables
Separate dependent variables were developed to measure the investors’ decision
quality and investors’ perception of the credibility, reliability and value of the
information received. The subsequent discussion describes the development of each
dependent variable.
3.6.2.1 Decision Quality
Decision quality can be measured using objective data. Several types of data
were collected and used to develop this set of dependent variables. The data collected
include: prediction behavior, tracking behavior, and confidence. The dependent variables
calculated with this data are now described.
3.6.2.1.1 Prediction (Decision) Behavior
For each prediction period, the ‘correct’ prediction was predetermined. A
measure of how many times each participant made a ‘correct’ prediction was calculated.
Between subjects comparisons were performed using the number of ‘correct’ predictions.

41
For analysis purposes, the measure calculated for the first 30 predictions in the treatment
level decision series is called PREDICTION. A separate measure was also calculated
using the Base Level (PREDICTBASE) decision series. Discussion of the statistical
assumption testing for these variables is included in the analysis section.
3.6.2.1.2 Tracking (Decision) Behavior
An alternative way to view Performance is to compare the participants'
predictions to a pattern similar to that described in DeFonza and Bordia (1997) as
'tracking' behavior: buying and selling stock according to the expectation of mean
reverting stock prices. In the current study, Tracking is defined as making predictions
regarding the stock price direction in accordance with an expectation that if the stock
price went up today it will go down tomorrow and if the stock price went down today it
will go up tomorrow. This pattern of predictions would track with a 'random-walk'
market. A measure of how many times each participant made a 'tracking' prediction was
calculated. Between subjects comparisons were performed using the number of ‘tracking’
predictions. For analysis purposes, the measure calculated for the first 30 predictions in
the treatment level decision series is called TRACKING. A separate measure was also
calculated using the Base Level (TRACKBASE) decision series. The Base Level measure
allowed for assessment of the participants adoption of the TRACKING behavior pattern.
Discussion of the statistical assumption testing for these variables is included in the
analysis section.

42
3.6.2.1.3 Confidence
Each participant provided their self-assessed confidence in each prediction. This
information was used to perform between subject comparisons, using an average of the
subjects' confidence for the first 30 predictions in the treatment level decision series. For
analysis purposes, this measure is called CONFIDENCE. A separate measure of the
average confidence was also calculated for the Base Level, called CONFIDENTBASE, to
be used for potential within subject analysis. Discussion of the statistical assumption
testing for these variables is included in the analysis section.
3.6.2.2 Perceived Value
Perception of value is a subjective assessment by the participant. As such, it was
measured by asking the participants to respond to a set of questions regarding their
perception of the source credibility, information reliability, and value of the information
they received for making stock price predictions. The participants’ responses were
captured via 7 point Likert scales. Timeliness was measured by the frequency of
information being provided (Periodic Reporting or Continuous Reporting).
3.6.2.2.1 Perceived Source Credibility
The six questions used to measure source credibility were taken from the McCroskey &
Teven (1999) credibility scale. The McCroskey & Teven (1999) model includes three
variables (expertise, trustworthiness, intention), each measured with six questions. In this
study, three of the questions for measuring expertise and three of the questions for
measuring trustworthiness were selected to produce a measure of source credibility.
Reporting frequency may impact expertise, assurance may impact trustworthiness.

43
Intention is an exogenous factor and was, therefore, not included in the analysis. These
questions are shown in Appendix B. The analysis of this set of questions is presented in
the analysis section.
3.6.2.2.2 Perceived Information Reliability:
Five questions were developed to measure the participants' perception of the
reliability of the financial information provided in the experimental task. These questions
are shown in Appendix B. The analysis of this set of questions is presented in the
analysis section.
3.6.2.2.3 Perceived Value of Information
Three questions were developed and used to measure the participants' perception
of the value of the financial information provided in the experimental task. These
questions are shown in Appendix B. The analysis of this set of questions is presented in
the analysis section.
3.6.3 Covariates
Covariates are variables that are not manipulated in the experimental design or
randomly distributed among the treatment groups. Covariates may be innate
characteristics of the individual participants or they may be a product of the experimental
design. Data were collected for several potential covariates, including: gender, age,
college major, education, investing experience, risk tolerance, cognitive load, and system
trust. A complete discussion of the potential covariates and selection of covariates to
include in the model is in the analysis and results section.

44
4.0 ANALYSIS AND RESULTS
4.1 Introduction
The analysis of the main study is reported in this section. Initially, the
participants are discussed. Manipulation checks are then discussed, followed by a
discussion of the potential covariates. Subsequently, the testing of the hypotheses is
discussed, followed by a detailed discussion of the results of the data analysis.
4.2 Participants
Participants for the experiment consist of ninety-seven undergraduate students
from a large Southeastern university. See Table 1 for participant demographic descriptive
statistics. Most of the students were upper-level accounting students enrolled in
intermediate accounting (80) and all students were required to participate in a research
experiment as part of their course requirements. They received course credit and were
paid a minimum of five dollars for their participation. They could earn additional cash
payments up to $16.25 based on their performance in the experiment, for maximum
earnings of $21.25. On average, the students earned $8.25 for performance.
The use of students as surrogates for individual investors was discussed
previously in the research design section. In previous studies, students have been shown
to be appropriate surrogates for relatively unsophisticated individual investors (Hunton,
Reck, Pinsker, 2002; Libby, et al., 2002), In addition, a study conducted in 1989 by
Gomez Advisors found “more than 11 percent of all online traders were age 25 or under,

45
with 5 percent of their trades being made from colleges and universities” (Libbon 2001,
p.55).
TABLE 1 PARTICIPANT DEMOGRAPHIC DATA FOR INITIAL DATA SET (n = 97)
Demographic Information Items Gender: Male 42 Female 55 Age: 18 - 22 57 23 - 27 23 28 - 32 10 33 - 37 4 38 - 42 0 43 - 47 1 48 - 52 1 53 -57 1 Major: Accounting 80 Business 8 Finance 2 Marketing 3 Other Majors/Postgraduates 4 Finance Courses Taken/Taking: 0-2 88 3-5 7 6-11 2 Accounting Courses Taken/Taking: 0-2 78 3-5 19 Previous Experience Buying/Selling Common Stock No 75 Yes 22 Previous Experience Buying/Selling Mutual Funds: No 76 Yes 21 Plan to Invest in Common Stocks or Mutual Funds in Future: No 10 Yes 87
The participant pool contained 55 (57%) female participants and 42 (43%) male
participants. The participants ranged in age from eighteen years to fifty-four years, with
ninety-three percent between 18-32 years of age. A majority of the participants were
accounting majors (80%) and ninety percent had taken three or fewer finance courses.

46
None of the students had taken an auditing class. In addition, most had no previous
experience with buying/selling common stock (77%) or mutual funds (78%). However,
eighty-seven percent indicated they planned to invest in common stock or mutual funds
in the future.
4.3 Manipulation Checks
Questions were included in the post-task questionnaire to determine if the
participants were aware of the manipulations that were present in the study. Each of these
questions is discussed below.
4.3.1 Number of forms of Reporting System
During the experiment, each participant was asked to 'test' two different forms of
an information reporting system. The first form of the system was the base treatment and
the second form included a manipulation for reporting frequency and assurance. Two
questions were used to test the participant's recall. The first question asked the participant
how many forms of the information system they tested. The second question asked the
participant, if they tested more than one system, to identify the differences between the
first system tested and the second system. A list of possible differences was provided
with check boxes for each. See Appendix B for the details of these two questions. Most
of the participants indicated correctly having tested two forms of the information system.
However, fifteen of the participants were unable to properly indicate the differences
between the two information systems, particularly with regard to the presentation of
additional items of financial information. These fifteen participants were not eliminated,
but were examined further to determine if they should be removed.

47
4.3.2 Financial Information and Reporting Manipulation Check
A series of five questions was used to determine if the participant was aware of
the manipulation of number of times financial information was provided (reporting
frequency), availability of audit report and number of times read (Audit report
frequency), and availability of assurance report and number of times read (Assurance
report frequency). See Appendix B for the details of these five questions. Analysis of the
reporting frequency questions revealed that fifteen of the participants could not correctly
recall how often financial data were provided. Analysis of the Audit report frequency
questions revealed that twenty-seven of the participants could not correctly recall how
often a button was available to access the audit report. Analysis of the Assurance report
frequency questions revealed that twenty-four of the participants could not correctly
recall how often a button was available to access the assurance report. These participants
were not eliminated, but were examined further to determine if they should be removed.
4.3.3 Time on Task
In addition to the manipulation check questions previously discussed, the time
each participant spent completing the experiment will be analyzed to identify participants
who may not have attended to the task fully. See Table 2 for information regarding this
item. Analysis of the time on task revealed that 4 participants spent less than twenty-one
minutes completing the task. These four participants were not eliminated, but were
examined further to determine if they should be removed.

48
TABLE 2 TIME ON TASK
Time spent on the entire experiment measured in minutes: N 97 Mean 32.18 Std Deviation 7.59 Variance 57.62 Minimum 16.83 Maximum 48.92
4.3.4 Further analysis of Manipulation Check Items
Due to the system problems encountered in the pilot studies, there was concern
that the manipulation check questions could be faulty or poorly worded, thus contributing
to the high number of failures by the participants. To reduce the risk of unnecessarily
removing participants from the study for failure of manipulation check items, the
information for the manipulation check questions was combined to determine if any
participants missed multiple manipulation check items. The results of the multiple item
analysis identified sixteen participants who failed time on task, presentation of additional
information and reporting frequency. Further analysis was performed to determine if
they should be removed from the study. Data analysis was performed (see section 4)
both with these sixteen participants and without them. There was a significant difference
in the results without the participants when compared to the results with the participants.
As a result, all sixteen of the participants were removed the study. Three participants
were found to have failed presentation of additional information, frequency of audit
report and frequency of assurance report. Data analysis was performed (see section 4)
both with these three participants and without them. There was no significant difference
in the results without the participants when compared to the results with the participants.

49
As a result, these three participants were not removed the study. Table 3 shows the
demographic data for the 81 participants retained for the main analysis.
TABLE 3 PARTICIPANT DEMOGRAPHIC DATA FOR REDUCED DATA SET (n = 81)
Demographic Information Items Gender: Male 36 (44%) Female 45 (56%) Age (Range 19 min 54 max): 18 - 22 46 (57%) 23 - 27 21 (26%) 28 - 32 8 (10%) 33 - 37 4 ( 5%) 38 - 42 0 43 - 47 1 ( 1%) 48 - 52 0 53 - 57 1 ( 1%) Major: Accounting 72 (90%) Business 4 ( 5%) Finance 1 ( 1%) Marketing 2 ( 2%) Other Majors/Postgraduates 2 ( 2%) Finance Courses Taken/Taking: 0-2 74 (92%) 3-5 5 ( 6%) 6-11 2 ( 2%) Number of Accounting Courses Taken/Taking: 0-2 63 (78%) 3-5 18 (22%) Previous Experience Buying/Selling Common Stock No 61 (75%) Yes 20 (25%) Previous Experience Buying/Selling Mutual Funds: No 62 (77%) Yes 19 (23%) Plan to Invest in Common Stocks or Mutual Funds in Future: No 7 ( 9%) Yes 74 (91%)
50
4.4 Data Analysis
4.4.1 Introduction
This section includes a discussion of the analysis and selection of the covariates
that are included in the main analysis, followed by a discussion of the analysis and
statistical testing of each of the hypotheses.
4.4.2 Covariates
In the present study, reporting frequency and assurance were manipulated and the
impact of each of these variables on the participants' decision quality and perception of
value was measured. However, a number of factors that are intrinsic to the decision
maker may also impact decision quality and perception of value. These factors were not
manipulated and cannot be held constant or randomly distributed among the treatments,
but must be measured and analyzed to determine if they contribute to the explanation of
the differences in decision quality and perception of value. Factors which were
determined to have an impact on decision quality and perception of value were called
covariates and included in the analysis models.
In determining which of the factors should be included as covariates, the potential
covariates were tested for correlation with the independent variables and dependent
variables. Covariates that were significantly correlated with the dependent variables
improve the model's explanatory power and should be included in the model. Covariates
that are significantly correlated with the independent variables detract from the model's
explanatory power and should not be included in the model, even if found to be
significantly correlated with the dependent variables. Covariates with a Pearson's

51
correlation coefficient greater than or equal to .20 and p-value less than or equal to .10
were deemed to be significantly correlated.
The potential covariates were divided into several groupings for discussion:
demographic covariates, theoretical covariates and task related covariates. Potential
covariates that were identified in previous sections of the present study include the
demographic covariates of age, education, gender and investing experience and the
theoretical covariates of risk tolerance, cognitive load, system trust and relevance. In
addition, the task-related covariates of time on task, base period performance, base period
tracking and base period confidence were discussed and tested for inclusion in the model.
4.4.2.1 Demographic Covariates
The factors that were identified as potential demographic covariates include age,
gender, education and investment experience. Details about each demographic variable
are shown in Table 4. The analysis of each of these is discussed below.
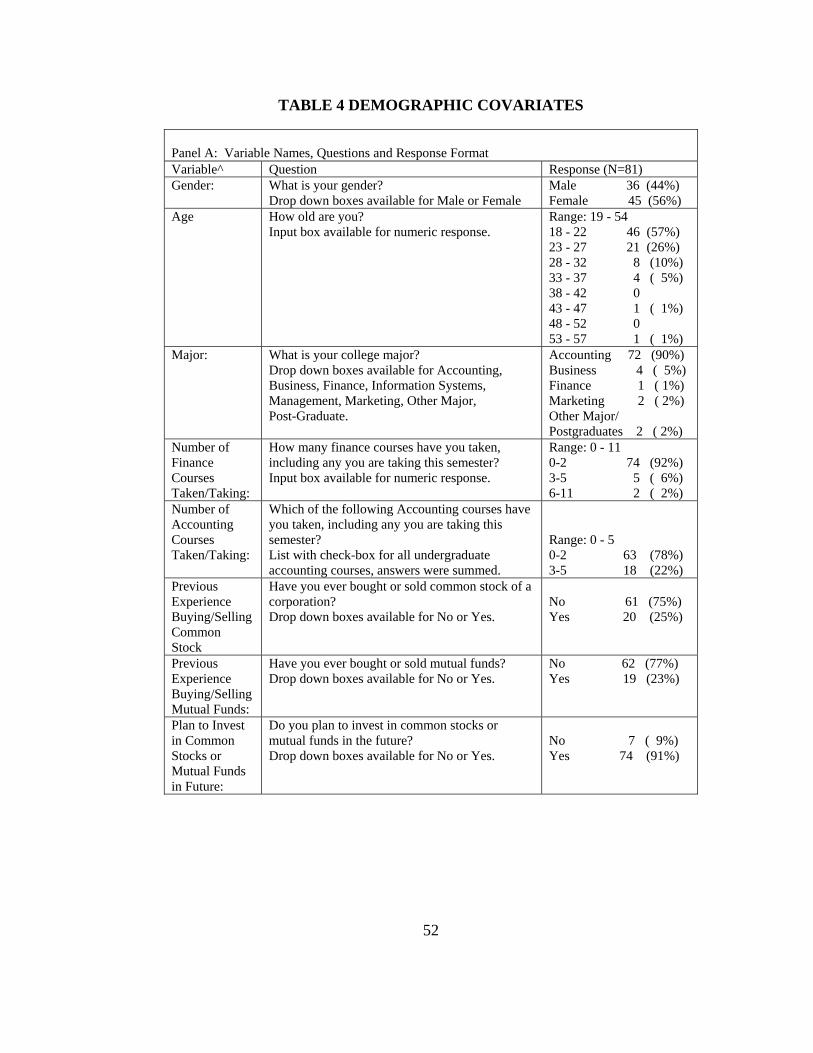
52
TABLE 4 DEMOGRAPHIC COVARIATES
Panel A: Variable Names, Questions and Response Format Variable^ Question Response (N=81) Gender:
What is your gender? Drop down boxes available for Male or Female
Male 36 (44%) Female 45 (56%)
Age
How old are you? Input box available for numeric response.
Range: 19 - 54 18 - 22 46 (57%) 23 - 27 21 (26%) 28 - 32 8 (10%) 33 - 37 4 ( 5%) 38 - 42 0 43 - 47 1 ( 1%) 48 - 52 0 53 - 57 1 ( 1%)
Major:
What is your college major? Drop down boxes available for Accounting, Business, Finance, Information Systems, Management, Marketing, Other Major, Post-Graduate.
Accounting 72 (90%) Business 4 ( 5%) Finance 1 ( 1%) Marketing 2 ( 2%) Other Major/ Postgraduates 2 ( 2%)
Number of Finance Courses Taken/Taking:
How many finance courses have you taken, including any you are taking this semester? Input box available for numeric response.
Range: 0 - 11 0-2 74 (92%) 3-5 5 ( 6%) 6-11 2 ( 2%)
Number of Accounting Courses Taken/Taking:
Which of the following Accounting courses have you taken, including any you are taking this semester? List with check-box for all undergraduate accounting courses, answers were summed.
Range: 0 - 5 0-2 63 (78%) 3-5 18 (22%)
Previous Experience Buying/Selling Common Stock
Have you ever bought or sold common stock of a corporation? Drop down boxes available for No or Yes.
No 61 (75%) Yes 20 (25%)
Previous Experience Buying/Selling Mutual Funds:
Have you ever bought or sold mutual funds? Drop down boxes available for No or Yes.
No 62 (77%) Yes 19 (23%)
Plan to Invest in Common Stocks or Mutual Funds in Future:
Do you plan to invest in common stocks or mutual funds in the future? Drop down boxes available for No or Yes.
No 7 ( 9%) Yes 74 (91%)

53
TABLE 4 DEMOGRAPHIC COVARIATES CONTINUED
Panel B: Demographic Covariates Descriptive Data Variable^ N Mean Standard
Deviation Age (Numeric response) 81 23.8 5.69 Gender (Male=1; Female=2) 81 1.55 0.50 Major (ACCT=1, BUS=2, FIN=3, MKTG=4, Other/Grad=5)
81 1.25 0.81
Number of Finance Courses (Numeric response) 81 0.96 1.57 Number of Accounting Courses 81 1.75 1.04 Plan Future Investments (No=1, Yes=2) 81 1.91 0.28 Previous Investment in Common Stock (No=1, Yes=2)
81 1.25 0.43
Previous Investment in Mutual Funds (No=1, Yes=2) 81 1.23 0.43 Panel C: Demographic Covariates Correlations with Dependent Variables Pearson Correlation Coefficients (p-values)# Variable^
Confidence
Prediction
Tracking
Source Credibility
Information Reliability
Information Value
Age
0.18 (0.109)
0.04 (0.750)
0.00 (0.980)
0.00 (0.958)
-0.01 (0.900)
-0.25 (0.025)
Gender
-0.26 (0.021)
0.10 (0.366)
-0.25 (0.026)
0.14 (0.219)
0.22 (0.054)
0.09 (0.439)
Major
0.04 (0.730)
-0.05 (0.630)
0.03 (0.767)
0.21 (0.060)
0.01 (0.903)
0.05 (0.681)
Number of Finance Courses
0.09 (0.442)
-0.02 (0.840)
0.06 (0.579)
0.06 (0.575)
0.10 (0.365)
-0.18 (0.108)
Number of Accounting Courses
0.06 (0.592)
0.09 (0.433)
-0.06 (0.578)
0.05 (0.632)
0.29 (0.008)
-0.09 (0.404)
Plan Future Investments
0.10 (0.354)
0.14 (0.200)
0.25 (0.025)
0.04 (0.725)
0.11 (0.348)
-0.02 (0.840)
Previous Investment in Common Stock
0.11 (0.317)
-0.20 (0.887)
-0.00 (0.966)
0.06 (0.559)
0.12 (0.302)
-0.34 (0.002)
Previous Investment in Mutual Funds
0.09 (0.417)
0.08 (0.474)
-0.01 (0.923)
0.05 (0.683)
0.05 (0.637)
-0.15 (0.178)
Potential covariates were selected for further analysis based on coefficient >/=.20, p-value </= .10. ^See Panel A for a description of the variables. #P-Values are two-tailed tests.

54
4.4.2.1.1 Age
Age has been shown in prior studies to have an impact on investors' decision-
making and investment strategies (Lewellen, Lease, Schlarbaum, 1977). Age was
measured by asking the participants to give their age. Age was tested as a potential
covariate using correlation analysis and was found to be correlated with INFORMATION
VALUE. See Table 4, Panel C.
4.4.2.1.2 Gender
Gender has been shown in prior studies to have an impact on investor's decision-
making and investment strategies (Barber and Odean, 2001). Gender was measured by
asking the participants to identify their gender. Gender was tested as a potential covariate
using correlation analysis and found to be correlated with the dependent variables
CONFIDENT, TRACKING, and INFORMATION RELIABILITY. See Table 4, Panel
C.
4.4.2.1.3 College Major
College major may have an impact on the data collected in the present study.
Students self select into various major fields based on innate characteristics and other
factors that vary among participants. Data were collected by asking each participant to
identify their currently declared college major. College major was tested as a potential
covariate using correlation analysis and was found to be correlated with the dependent
variable SOURCE CREDIBILITY. See Table 4, Panel C.

55
4.4.2.1.4 Education
The level of education of the participants may impact their ability to understand
and complete the experimental task. It may also impact their perceptions. As a result,
data were collected regarding the level and nature of each participant's education.
Education was defined as accounting and finance courses taken/taking and college major
and will be measured by asking participants information regarding specific accounting
courses taken/taking and number of finance courses taken/taking. The details of the items
are presented in Table 4, Panel A. Each of these items was tested separately as a potential
covariate using correlation analysis. The correlation analysis revealed that one education
covariate, having taken or being currently enrolled in Accounting Information Systems
(AIS), was significantly correlated with the dependent variable INFORMATION
RELIABILITY. The analysis was simplified by combining the accounting courses taken
detailed information into a single variable, 'number of accounting courses taken'. The
new variable was then tested as a potential covariate using correlation analysis and found
to be significantly correlated with the dependent variable INFORMATION
RELIABILITY. See Table 4, Panel C. 'Number of Finance Courses' was not found to be
significantly correlated with any of the dependent variables. See Table 4, Panel C.
4.4.2.1.5 Investing Experience
The participants' previous experience in investing in common stocks or mutual
funds may have an impact on their ability to perform the experimental task. In order to
measure any differences in task performance or perception related to prior experience,
data were collected by asking each participant if they had previously invested in common

56
stocks (yes or no) and if they had previously invested in mutual funds (yes or no). Each
participant was also asked if they intend to invest in common stocks or mutual funds in
the future (yes or no). See Table 4, Panel A for the questions. Each of these three
questions was analyzed separately as a potential covariate using correlation analysis. The
investing experience question 'plan future investments' was found to be significantly
correlated with the performance dependent variable TRACKING. See Table 4, Panel C.
The investing experience question 'previous investment in common stock' was found to
be significantly (and negatively) correlated with the dependent variable INFORMATION
VALUE. See Table 4, Panel C. The investing experience question 'previous investment
in mutual funds' was not significantly correlated with any dependent variable. See Table
4, Panel C.
The results of the correlation analysis of the demographic covariates are
summarized as follows: gender was correlated with CONFIDENCE, TRACKING, and
INFORMATION RELIABILITY, college major was correlated with SOURCE
CREDIBILITY, 'number of accounting courses taken' was correlated with
INFORMATION RELIABILITY, 'plan future investments' was correlated with
TRACKING and 'previous investment in common stock' was correlated with
INFORMATION VALUE.

57
4.4.2.2 Theoretical Covariates
Prior research has identified risk tolerance, system trust, cognitive load and
information relevance as factors that may potentially affect either performance or
perception in the present study. Details about each theoretical variable are shown in Table
5. The analysis of each of these potential covariates is discussed below.
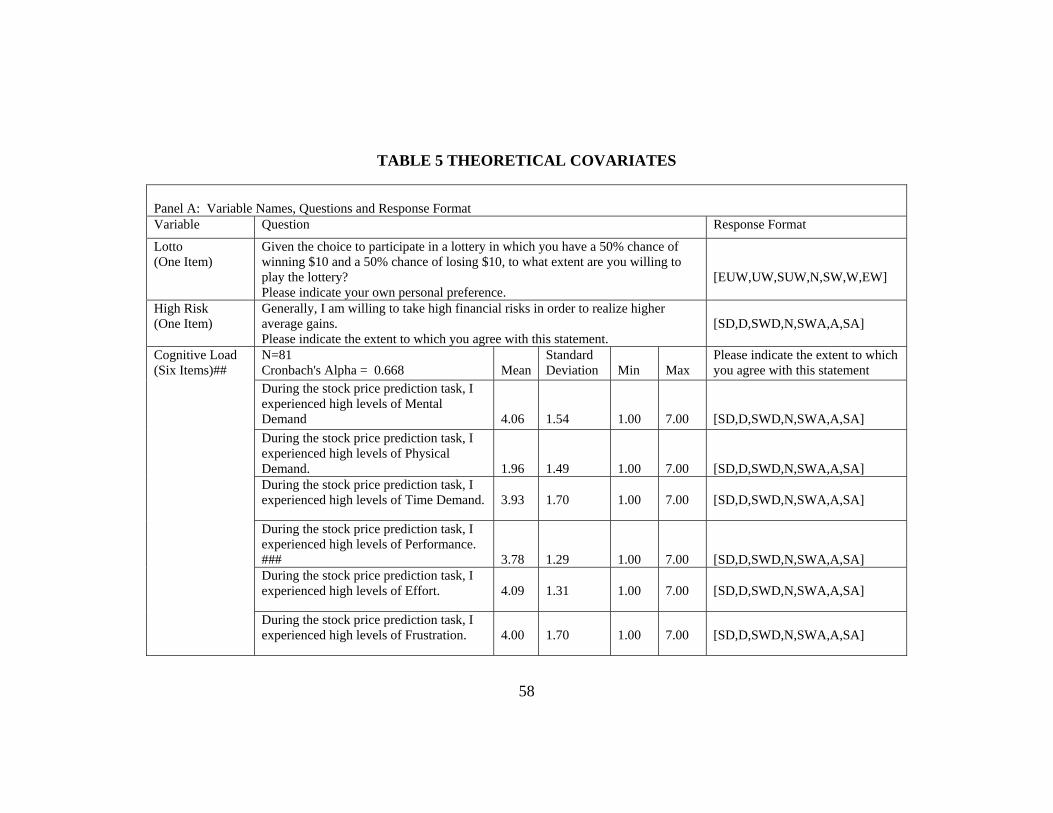
58
TABLE 5 THEORETICAL COVARIATES
Panel A: Variable Names, Questions and Response Format Variable Question Response Format
Lotto (One Item)
Given the choice to participate in a lottery in which you have a 50% chance of winning $10 and a 50% chance of losing $10, to what extent are you willing to play the lottery? Please indicate your own personal preference.
[EUW,UW,SUW,N,SW,W,EW]
High Risk (One Item)
Generally, I am willing to take high financial risks in order to realize higher average gains. Please indicate the extent to which you agree with this statement.
[SD,D,SWD,N,SWA,A,SA]
N=81 Cronbach's Alpha = 0.668
Mean
Standard Deviation
Min
Max
Please indicate the extent to which you agree with this statement
During the stock price prediction task, I experienced high levels of Mental Demand
4.06
1.54
1.00
7.00
[SD,D,SWD,N,SWA,A,SA]
During the stock price prediction task, I experienced high levels of Physical Demand.
1.96
1.49
1.00
7.00
[SD,D,SWD,N,SWA,A,SA]
During the stock price prediction task, I experienced high levels of Time Demand.
3.93
1.70
1.00
7.00
[SD,D,SWD,N,SWA,A,SA]
During the stock price prediction task, I experienced high levels of Performance. ###
3.78
1.29
1.00
7.00
[SD,D,SWD,N,SWA,A,SA]
During the stock price prediction task, I experienced high levels of Effort.
4.09
1.31
1.00
7.00
[SD,D,SWD,N,SWA,A,SA]
Cognitive Load (Six Items)##
During the stock price prediction task, I experienced high levels of Frustration.
4.00
1.70
1.00
7.00
[SD,D,SWD,N,SWA,A,SA]

59
TABLE 5 THEORETICAL COVARIATES CONTINUED
N=81 Cronbach's Alpha = 0.772
Mean
Standard Deviation
Min
Max
Please indicate the extent to which you agree with this statement.
The system that provided the information ensured the secure transmission of the financial information.
4.84
1.20
1.00
7.00
[SD,D,SWD,N,SWA,A,SA]
Other people who use the system that provided the financial information would consider it to be trustworthy.
4.86
1.20
2.00
7.00
[SD,D,SWD,N,SWA,A,SA]
System Trust (Three Items)##
The system that provided the financial information protects the data from unauthorized tampering during transmission.
4.88
1.08
2.00
7.00
[SD,D,SWD,N,SWA,A,SA]
N=81 Cronbach's Alpha = 0.752
Mean
Standard Deviation
Min
Max
Please indicate the extent to which you agree with this statement.
I used the financial information to make my stock price predictions.
5.20
1.11
2.00
7.00
[SD,D,SWD,N,SWA,A,SA]
The financial information was appropriate for the stock price prediction task.
4.49
1.36
1.00
7.00
[SD,D,SWD,N,SWA,A,SA]
Information Relevance (Three Items)##
The financial information had an influence on my stock price decisions.
5.16
1.25
1.00
7.00
[SD,D,SWD,N,SWA, A,SA]
## The items for each construct were analyzed for correlation and Cronbach's coefficient alpha. The responses were averaged to derive the variable used in the main analysis. The descriptive statistics in Panel B and the correlations in Panel C are for the averaged variable. For Cognitive Load, the items were defined for the participants. Response Format Key: [EUW,UW,SUW,N,SW,W,EW] = Extremely Unwilling (1), Unwilling (2), Somewhat Unwilling (3), Neutral (4), Somewhat Willing (5), Willing (6), Extremely Willing (7) [SD,D,SWD,N,SWA,A,SA ] = Strongly Disagree, Disagree, Somewhat Disagree, Neutral, Somewhat Agree, Agree, Strongly Agree. ###This item was removed from the averaged measure for Cognitive Load.

60
TABLE 5 THEORETICAL COVARIATES CONTINUED
Panel B: Theoretical Covariates Descriptive Data Variable^ N Mean Standard Deviation Minimum Maximum Lotto 81 4.10 1.83 1.00 7.00 High Risk 81 3.93 1.45 1.00 7.00 Cognitive Load (Average) 81 3.64 0.93 1.83 6.67 System Trust (Average) 81 4.86 0.96 2.00 7.00 Information Relevance (Average) 81 4.95 1.02 2.33 7.00 Panel C: Theoretical Covariates Correlations with Dependent Variables Pearson Correlation Coefficients (p-values)# Variable^
Confidence
Prediction
Tracking
Source Credibility
Information Reliability
Information Value
Lotto
0.18 (0.105)
-0.15 (0.677)
0.00 (0.967)
0.13 (0.251)
0.07 (0.522)
-0.21 (0.056)
High Risk
0.02 (0.886)
-0.14 (0.220)
0.08 (0.451)
0.06 (0.598)
0.00 (0.992)
-0.27 (0.016)
Cognitive Load
0.11 (0.345)
-0.09 (0.408)
0.11 (0.341)
0.01 (0.953)
-0.10 (0.389) 0.02 (0.875)
System Trust 0.21 (0.061)
0.10 (0.367)
-0.30 (0.007)
0.41 (<0.001)
0.49 (<0.001)
0.21 (0.054)
Information Relevance
0.24 (0.029)
0.16 (0.147)
-0.15 (0.189)
0.16 (0.146)
0.23 (0.043)
0.18 (0.102)
Potential covariates were selected for further analysis based on coefficient >/=.20, p-value </= .10. ^See Panel A for a description of the variables. #P-Values are two-tailed tests.

61
4.4.2.2.1 Risk Tolerance
Risk tolerance is defined as an individual’s willingness to take financial risk and
was measured using participant response to two questions regarding their preference for
risk (Pinello, 2004). These two questions are shown in Table 5, Panel A. Question 1
addressed the participants' willingness to participate in a lottery and is hereinafter referred
to as Lotto. Question 2 addressed the participants' risk tolerance compared to referent
others and is hereinafter referred to as High Risk. The descriptive statistics for each of the
two variables is shown in Table 5, Panel B. Risk tolerance has been shown in prior
research (Pinello, 2004) to impact the decision making of individual investors and may
potentially affect the stock price prediction task in the current study. Each of the two
questions measures a separate aspect of risk tolerance and was analyzed as a separate
covariate. Lotto was found to be significantly correlated with the dependent variable
INFORMATION VALUE. See Table 5, Panel C. High Risk was found to be
significantly correlated with the dependent INFORMATION VALUE. See Table 5, Panel
C.
4.4.2.2.2 Cognitive Load
Data were collected regarding the participants’ perception of the cognitive load of
the task. Cognitive load is an assessment by the participant of the level of difficulty of
the task, given the time constraints imposed. Participants were asked six questions that
measured their perception of the cognitive load of the experimental task. These six
questions are shown in Table 5, Panel A and were taken from the NASA Task Load
Index (Hart and Shreveland, 1987; Benford, 2000). To develop a single measure of

62
cognitive load for covariate testing and model analysis, the individual questions were
initially tested and found to be highly correlated with each other. Subsequently, they
were tested for internal reliability using Cronbach's alpha and found to measure the same
construct (C. alpha = 0.668). A Cronbach’s alpha of .70 or higher was considered an
adequate level of internal reliability for the measurement tool (Nunnally, 1978). Further
examination of the internal reliability test indicated that the item for performance demand
correlation with the total measure was 0.06. As a result, the item for performance demand
was removed, which increased the Cronbach’s alpha to 0.72. See Table 5, Panel A for the
descriptive statistics for the individual items. As a result, the participants' responses to the
remaining five items were averaged to develop the variable for correlation testing,
Cognitive Load. See Table 5, Panel B for the descriptive statistics for Cognitive Load.
Correlation analysis revealed that Cognitive Load was not significantly correlated with
any of the dependent variables. See Table 5, Panel C.
4.4.2.2.3 System Trust
System trust was measured using three of the questions developed by Nicolaou, et
al (2003) to measure participants’ trust in an information exchange system. These
questions are shown in Table 5, Panel A. To develop a single measure of system trust for
covariate testing and model analysis, the individual questions were initially tested and
found to be highly correlated with each other. Subsequently, they were tested for internal
reliability using Cronbach's alpha (C. alpha = 0.7718) and found to measure the same
construct (Nunnally, 1978). See Table 5, Panel A for the descriptive statistics for the
individual items. As a result, the participants' responses were averaged to develop the

63
variable for correlation testing, System Trust. See Table 5, Panel B for the descriptive
statistics for System Trust. Correlation analysis revealed that system trust was
significantly correlated with the variables CONFIDENT, TRACKING, SOURCE
CREDIBILITY, INFORMATION RELIABILITY and INFORMATION VALUE. See
Table 5, Panel C.
4.4.2.2.4 Information Relevance
Information relevance is assumed in the research model, but was also measured
using three questions to assess the participants' perception of the relevance of the
financial information provided in the experimental task. These questions are shown in
Table 5, Panel A. To develop a single measure of information relevance for covariate
testing and model analysis, the individual questions were initially tested and found to be
highly correlated with each other. Subsequently, they were tested for internal reliability
using Cronbach's alpha (C. alpha 0.752) and found to measure the same construct
(Nunnally, 1978). See Table 5, Panel A for the descriptive statistics of the individual
items. The participants' responses were averaged to develop the variable for correlation
testing, Information Relevance. See Table 5, Panel B for the descriptive statistics for
Information Relevance. Information Relevance was found to be significantly correlated
with CONFIDENCE and INFORMATION RELIABILITY. See Table 5, Panel C.
The results of the correlation analysis of the theoretical covariates are summarized
as follows: Lotto was correlated with INFORMATION VALUE, High Risk was
correlated with INFORMATION VALUE, System Trust was correlated with
CONFIDENCE, TRACKING, SOURCE CREDIBILITY, INFORMATION
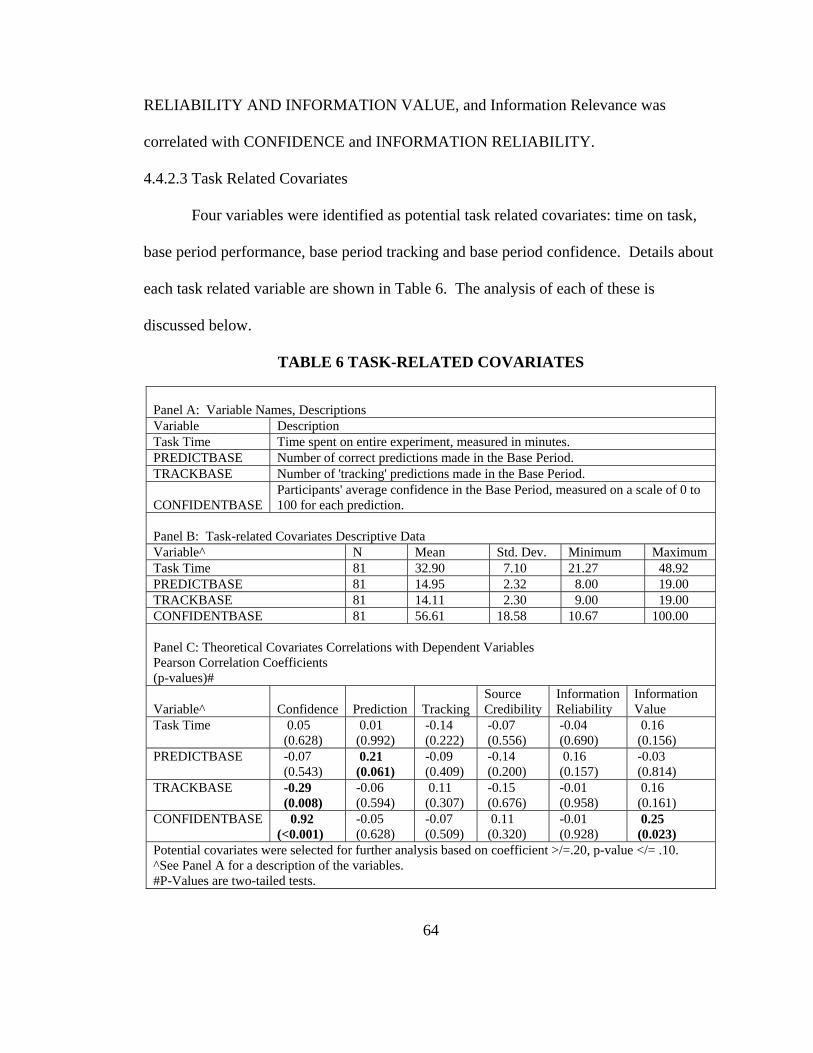
64
RELIABILITY AND INFORMATION VALUE, and Information Relevance was
correlated with CONFIDENCE and INFORMATION RELIABILITY.
4.4.2.3 Task Related Covariates
Four variables were identified as potential task related covariates: time on task,
base period performance, base period tracking and base period confidence. Details about
each task related variable are shown in Table 6. The analysis of each of these is
discussed below.
TABLE 6 TASK-RELATED COVARIATES
Panel A: Variable Names, Descriptions Variable Description Task Time Time spent on entire experiment, measured in minutes. PREDICTBASE Number of correct predictions made in the Base Period. TRACKBASE Number of 'tracking' predictions made in the Base Period. CONFIDENTBASE
Participants' average confidence in the Base Period, measured on a scale of 0 to 100 for each prediction.
Panel B: Task-related Covariates Descriptive Data Variable^ N Mean Std. Dev. Minimum Maximum Task Time 81 32.90 7.10 21.27 48.92 PREDICTBASE 81 14.95 2.32 8.00 19.00 TRACKBASE 81 14.11 2.30 9.00 19.00 CONFIDENTBASE 81 56.61 18.58 10.67 100.00 Panel C: Theoretical Covariates Correlations with Dependent Variables Pearson Correlation Coefficients (p-values)# Variable^
Confidence
Prediction
Tracking
Source Credibility
Information Reliability
Information Value
Task Time
0.05 (0.628)
0.01 (0.992)
-0.14 (0.222)
-0.07 (0.556)
-0.04 (0.690)
0.16 (0.156)
PREDICTBASE
-0.07 (0.543)
0.21 (0.061)
-0.09 (0.409)
-0.14 (0.200)
0.16 (0.157)
-0.03 (0.814)
TRACKBASE -0.29 (0.008)
-0.06 (0.594)
0.11 (0.307)
-0.15 (0.676)
-0.01 (0.958)
0.16 (0.161)
CONFIDENTBASE 0.92 (<0.001)
-0.05 (0.628)
-0.07 (0.509)
0.11 (0.320)
-0.01 (0.928)
0.25 (0.023)
Potential covariates were selected for further analysis based on coefficient >/=.20, p-value </= .10. ^See Panel A for a description of the variables. #P-Values are two-tailed tests.

65
4.4.2.3.1 Time on Task
Time on task (Task Time) is measured as the total number of minutes a
participant spent completing the entire experiment. The details of this variable are
presented in Table 6, Panel A and the descriptive statistics provided in Table 6, Panel B.
Task time was not found to be correlated with any of the dependent variables. See Table
6, Panel C.
4.4.2.3.2 Base Period Performance
Base period performance is the number of correct predictions each participant
made in the base period of the prediction task. The design of the experiment indicated
that a participant's performance in the base period of 30 decisions might have an impact
on their performance in the subsequent treatment period. As a result, the performance in
the base period, PREDICTBASE, was analyzed for correlation to the decision quality
dependent variables. The details of PREDICTBASE are presented in Table 6, Panel A.
The descriptive statistics are presented in Table 6, Panel B. PREDICTBASE was found
to be correlated with the decision quality dependent variable PREDICTION. See Table 6,
Panel C.
4.4.2.3.3 Base Period Tracking
Base period tracking is the number of 'tracking' predictions each participant made
in the base period of the prediction task. The design of the experiment indicated that a
participant's tracking behavior in the base period of 30 decisions might have an impact on
their tracking behavior in the subsequent treatment period. As a result, the tracking

66
behavior in the base period, TRACKBASE, was analyzed for correlation to the decision
quality dependent variable TRACKING. The details of TRACKBASE are presented in
Table 6, Panel A. The descriptive statistics are presented in Table 6, Panel B.
TRACKBASE was not found to be correlated with TRACKING. See Table 6, Panel C.
4.4.2.3.4 Base Period Confidence
Base period confidence is the average confidence percentage the participants
reported for the base period of 30 decisions. The design of the experiment indicated that
the participants' confidence in the base period might have an impact on their performance
and their average confidence in the treatment period. It could also have an impact on the
participants' perception of the value of the information. As a result, the confidence in the
base period, CONFIDENTBASE, was analyzed for correlation to the dependent
variables. The details of CONFBASE are presented in Table 6, Panel A. The descriptive
statistics are presented in Table 6, Panel B. CONFIDENTBASE was found to be
correlated with the dependent variables CONFIDENCE and INFORMATION VALUE.
See Table 6, Panel C.
The results of the correlation analysis of the task related covariates are
summarized as follows: PREDICTBASE was correlated with PREDICTION and
CONFIDENTBASE was correlated with CONFIDENCE and INFORMATION VALUE.
Time on Task was not found to be correlated with any of the dependent variables.
4.4.2.4 Further Testing of Covariates
The covariates deemed to be significantly correlated with dependent variables
were subjected to further evaluation for usefulness. The covariates identified as

67
significantly correlated with the dependent variables PREDICTION, TRACKING,
CONFIDENCE, SOURCE CREDIBILITY AND INFORMATION RELIABILITY were
included in a preliminary ANCOVA for each dependent variable using the independent
variables Reporting and Assurance. The covariates included in the preliminary
ANCOVAs are summarized in Table 7. The evaluation of these covariates is discussed
below.
TABLE 7 SUMMARY OF SIGNIFICANTLY CORRELATED COVARIATES Pearson Correlation Coefficients
(p-values)# Variable
Confidence
Prediction
Tracking
Source Credibility
Information Reliability
Information Value
Age
-0.25## (0.025)
Gender
-0.26 (0.021)
-0.25## (0.026)
0.22 (0.054)
Major
0.21 (0.060)
Number of Accounting Courses
0.29 (0.008)
Plan Future Investments
0.25 (0.025)
Previous Investment in Common Stock
-0.34## (0.002)
Lotto
-0.21## (0.056)
High Risk
-0.27## (0.016)
System Trust
0.21 (0.061)
-0.30## (0.007)
0.41 (<0.001)
0.49 (<0.001)
0.21 (0.054)
Information Relevance
0.24 (0.029)
0.23 (0.043)
PREDICTBASE
0.21 (0.061)
TRACKBASE
-0.29## (0.008)
CONFIDENTBASE
0.92 (<0.001)
0.25 (0.023)
#P-values are two-tailed. ##Negative correlation.
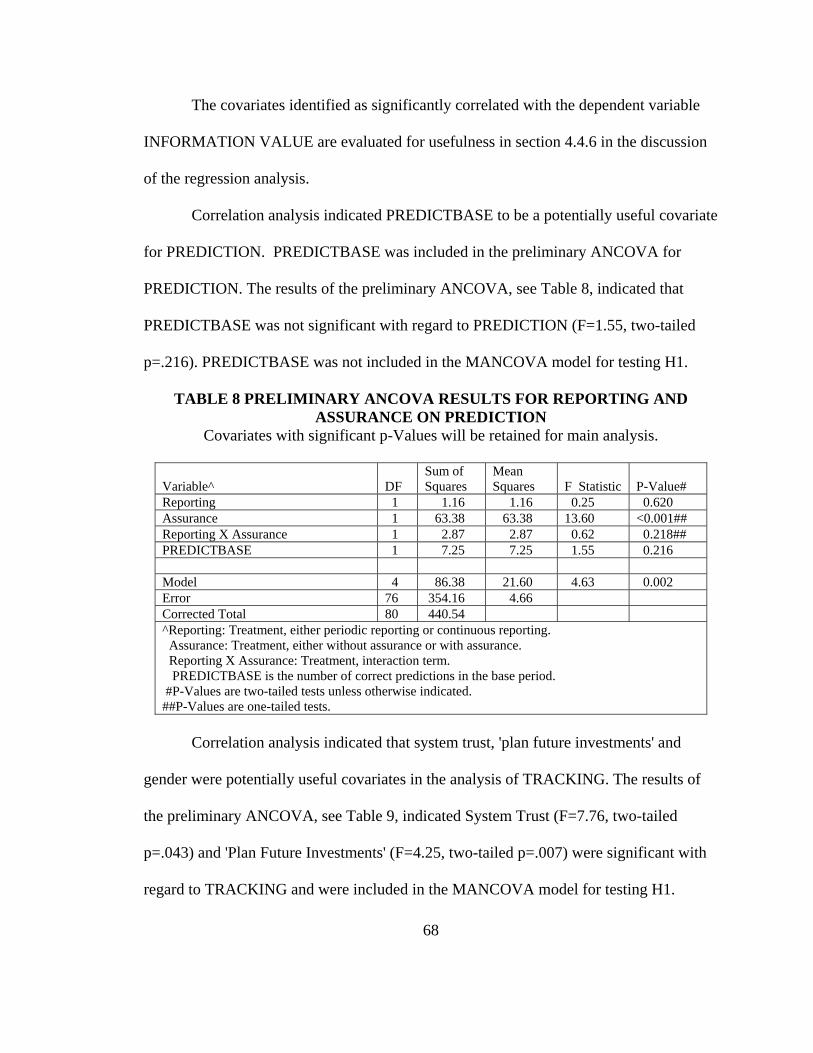
68
The covariates identified as significantly correlated with the dependent variable
INFORMATION VALUE are evaluated for usefulness in section 4.4.6 in the discussion
of the regression analysis.
Correlation analysis indicated PREDICTBASE to be a potentially useful covariate
for PREDICTION. PREDICTBASE was included in the preliminary ANCOVA for
PREDICTION. The results of the preliminary ANCOVA, see Table 8, indicated that
PREDICTBASE was not significant with regard to PREDICTION (F=1.55, two-tailed
p=.216). PREDICTBASE was not included in the MANCOVA model for testing H1.
TABLE 8 PRELIMINARY ANCOVA RESULTS FOR REPORTING AND ASSURANCE ON PREDICTION
Covariates with significant p-Values will be retained for main analysis.
Variable^
DF
Sum of Squares
Mean Squares
F Statistic
P-Value#
Reporting 1 1.16 1.16 0.25 0.620 Assurance 1 63.38 63.38 13.60 <0.001## Reporting X Assurance 1 2.87 2.87 0.62 0.218## PREDICTBASE 1 7.25 7.25 1.55 0.216 Model 4 86.38 21.60 4.63 0.002 Error 76 354.16 4.66 Corrected Total 80 440.54 ^Reporting: Treatment, either periodic reporting or continuous reporting. Assurance: Treatment, either without assurance or with assurance. Reporting X Assurance: Treatment, interaction term. PREDICTBASE is the number of correct predictions in the base period. #P-Values are two-tailed tests unless otherwise indicated. ##P-Values are one-tailed tests.
Correlation analysis indicated that system trust, 'plan future investments' and
gender were potentially useful covariates in the analysis of TRACKING. The results of
the preliminary ANCOVA, see Table 9, indicated System Trust (F=7.76, two-tailed
p=.043) and 'Plan Future Investments' (F=4.25, two-tailed p=.007) were significant with
regard to TRACKING and were included in the MANCOVA model for testing H1.

69
Gender was not significant with regard to TRACKING but was included in the
MANCOVA since it is a significant covariate of CONFIDENCE. The correlation
between TRACKING and System Trust was negative, indicating that participants with a
higher level of System Trust tended to make fewer predictions in the 'tracking' pattern.
The correlation between TRACKING and 'plan future investments' was positive,
indicating that participants who intend to make future investments tended to make more
predictions in the 'tracking' pattern.
TABLE 9 PRELIMINARY ANCOVA RESULTS FOR REPORTING AND ASSURANCE ON TRACKING
Covariates with significant p-Values will be retained for main analysis.
Variable^
DF
Sum of Squares
Mean Squares
F Statistic
P-Value#
Reporting 1 6.69 6.69 0.44 0.507 Assurance 1 15.09 15.09 1.00 0.160## Reporting X Assurance 1 49.07 49.07 3.26 0.038## Gender 1 21.23 21.23 1.41 0.239 Plan Future Investments 1 63.90 63.90 4.25 0.043 System Trust 1 116.71 116.71 7.76 0.007 Model 6 334.45 55.74 3.71 0.003 Error 74 1113.06 15.04 Corrected Total 80 1447.51 ^Reporting: Treatment, either periodic reporting or continuous reporting. Assurance: Treatment, either without assurance or with assurance. Reporting X Assurance: Treatment, interaction term. Gender: Male or Female Plan Future Investments: System Trust: Trust in the information delivery mechanism. #P-Values are two-tailed tests unless otherwise indicated. ##P-Values are one-tailed tests.
Correlation analysis indicated that CONFIDENTBASE, TRACKBASE, gender,
Information Relevance and System Trust were potentially useful covariates for the
analysis of CONFIDENCE. See Table 7. A preliminary ANCOVA was performed to test
these covariates for usefulness. The results of the preliminary ANCOVA are presented in

70
Table 10 and reveal CONFIDENTBASE (F=312.83, two-tailed p= <.0001) and gender
(F=6.98, two-tailed p= .010) to be significant in the model. CONFIDENTBASE and
gender were included in the MANCOVA model for testing of hypothesis H1. The
correlation between CONFIDENCE and gender was negative, indicating that male
participants displayed a higher level of confidence in their predictions than female
participants. The correlation between CONFIDENT and CONFIDENTBASE was
positive, indicating that participants who had a higher level of confidence in their
predictions in the Base Level period continued to have a higher level of confidence in
their predictions in the Treatment Level period.
TABLE 10 PRELIMINARY ANCOVA RESULTS FOR REPORTING AND ASSURANCE ON CONFIDENCE
Covariates with significant p-Values will be retained for main analysis. Variable^
DF
Sum of Squares
Mean Squares
F Statistic P-Value#
Reporting 1 17.23 17.23 0.30 0.586 Assurance 1 21.05 21.05 0.36 0.548 Reporting X Assurance 1 16.03 16.03 0.28 0.600 CONFIDENTBASE 1 18054.64 18054.64 312.83 <0.001 TRACKBASE 1 8.19 8.19 0.14 0.708 Gender 1 402.61 402.61 6.98 0.010 System Trust 1 14.20 14.20 0.25 0.621 Information Relevance 1 11.22 11.22 0.19 0.661 Model 8 24700.22 3087.53 53.50 <0.001 Error 72 4155.43 57.71 Corrected Total 80 28855.65 ^Reporting: Treatment, either periodic reporting or continuous reporting. Assurance: Treatment, either without assurance or with assurance. Reporting X Assurance: Treatment, interaction term. CONFIDENTBASE: Average self reported confidence in predictions during base period. TRACKBASE: Number of 'tracking' predictions made in the base period. Gender: Male or Female System Trust: Trust in the information delivery mechanism. Information Relevance: Perceived relevance of information to prediction decision. #P-Values are two-tailed tests unless otherwise indicated.

71
Correlation analysis indicated that System Trust and major were potentially useful
covariates in the analysis of SOURCE CREDIBILITY. The results of the preliminary
ANCOVA, see Table 11, indicated that system trust (F=15.07, two-tailed p=<.001) was
significant with regard to SOURCE CREDIBILITY and was included in the MANCOVA
model for testing of H2a, b and c. Major was not retained in the MANCOVA model. The
correlation between SOURCE CREDIBILITY and System Trust was positive, indicating
that participants with higher levels of System Trust perceived the level of Source
Credibility to be higher.
TABLE 11 PRELIMINARY ANCOVA RESULTS FOR REPORTING AND ASSURANCE ON SOURCE CREDIBILITY
Covariates with significant p-Values will be retained for main analysis.
Variable^
DF
Sum of Squares
Mean Squares
F Statistic
P-Value#
Reporting 1 0.60 0.60 1.22 0.136## Assurance 1 0.02 0.02 0.03 0.430## Reporting X Assurance 1 0.07 0.07 0.13 0.358## Major 1 1.23 1.23 2.53 0.116 System Trust 1 7.35 7.35 15.07 <0.001 Model 5 9.71 1.94 3.98 0.003 Error 75 36.57 0.49 Corrected Total 80 46.28 ^ Reporting: Treatment, either periodic reporting or continuous reporting. Assurance: Treatment, either without assurance or with assurance. Reporting X Assurance: Treatment, interaction term. Major: Participants college major. System Trust: Trust in the information delivery mechanism. #P-Values are two-tailed tests unless otherwise indicated. ##P-Values are one-tailed tests.
Correlation analysis indicated that information relevance, system trust, 'number of
accounting courses taken' and gender were potentially useful covariates in the analysis of
INFORMATION RELIABILITY. The results of the preliminary ANCOVA, see Table
12, indicated that system trust (F=21.83, two-tailed p=<.001) and 'number of accounting

72
courses taken' (F=12.96, two-tailed p=<.001) were significant with regard to
INFORMATION RELIABILITY. These two covariates were included in the
MANCOVA model for the testing of H4a, b and c. Information relevance was not
significant with regard to INFORMATION RELIABILITY or any of the other correlated
dependent variables and was not included in the MANCOVA. The correlation between
INFORMATION RELIABILITY and system trust was positive, indicating that
participants with higher levels of system trust perceived the level of information
reliability to be higher. The correlation between INFORMATION RELIABILITY and
'number of accounting courses taken' was also positive, indicating that participants who
had taken more accounting courses perceived the level of information reliability to be
higher.
TABLE 12 PRELIMINARY ANCOVA RESULTS FOR REPORTING AND ASSURANCE ON INFORMATION RELIABILITY
Covariates with significant p-Values will be retained for main analysis.
Variable^
DF
Sum of Squares
Mean Squares
F Statistic
P-Value#
Reporting 1 0.18 0.18 0.33 0.284## Assurance 1 0.09 0.09 0.17 0.342## Reporting X Assurance 1 0.75 0.75 1.39 0.121## Gender 1 0.28 0.28 0.52 0.474 Number of Accounting Courses Taken 1 6.97 6.97 12.96 <0.001 System Trust 1 11.74 11.74 21.83 <0.001 Information Relevance 1 0.00 0.00 0.00 0.982 Model 10 24.88 3.55 6.61 <0.001 Error 70 39.25 0.54 Corrected Total 80 64.13 ^Reporting: Treatment, either periodic reporting or continuous reporting. Assurance: Treatment, either without assurance or with assurance. Reporting X Assurance: Treatment, interaction term. Gender: Male or Female. Number of Accounting Courses: Number of accounting course participant had taken. System Trust: Trust in the information delivery mechanism. Information Relevance: Perceived relevance of information to prediction decision. #P-Values are two-tailed tests unless otherwise indicated. ##P-Values are one-tailed tests.
73
Gender, 'Plan future investments' , 'Number of accounting courses taken' , System
Trust and CONFIDENTBASE were found to be useful covariates and were included in
the MANCOVA for hypothesis testing.
4.4.3 Dependent Variables
This section discusses the development of the dependent variables, the testing of
statistical assumptions for each dependent variable and the subsequent hypothesis testing.
4.4.3.1 Decision Quality
The dependent variables developed to test decision quality for H1 include
PREDICTION, TRACKING and CONFIDENCE. The dependent variables allow for
both between-subject analysis and within-subject analysis. The within-subject analysis
also incorporated the Base Level control variables PREDICTBASE and TRACKBASE.
PREDICTION is calculated as the number of correct predictions made for the first 30
decisions in the treatment group series. TRACKING is calculated as the number of times
each participant made a 'tracking' prediction during the first 30 decisions in the treatment
period. CONFIDENCE is calculated as the average confidence participants reported for
their decisions in the treatment group. Confidence is not necessarily a measure of the
quality of the decision, but serves to examine the impact of the treatments on the
participant's confidence in their ability to make the predictions. PREDICTBASE is the
number of correct decisions in the base period. TRACKBASE is the number of times
each participant made a 'tracking' decision in the base period.
74
4.4.3.2 Perceived Value of Information
The research model predicts that the perception of value of information is a
function of the participant's perception of source credibility (H3b) and information
reliability (H3c). In addition, the level of timeliness (Reporting frequency) is predicted to
be associated with perceived value (H3a). As a result, the analysis of perceived value
began with the analysis of the participant’s perception of the credibility of the source of
the information (H2a, b & c) and the analysis of the participant’s perception of the
reliability of the information (H4a, b & c) utilizing MANOVA. Subsequently, OLS
regression was used to test H3b and H3c. The regression analysis included Reporting to
test H3a.
4.4.3.2.1 Perceived Source Credibility
The six questions used to measure source credibility were taken from the
McCroskey & Teven (1999) credibility scale. The McCroskey & Teven (1999) model
includes three variables (expertise, trustworthiness, intention), each measured with six
questions. In the present study, three of the questions for measuring expertise and three
of the questions for measuring trustworthiness were selected to produce a measure of
source credibility. These questions are shown in Table 13. The individual items in this
set of questions were initially analyzed and found to be highly correlated. Subsequently,
the items were analyzed for internal reliability using Cronbach's coefficient alpha and
found to measure the same construct (C. alpha = 0.823). See Table 13. The participants'
responses to the six questions were averaged to develop the dependent variable,
SOURCE CREDIBILITY, used to test H2a, b and c.

75
4.4.3.2.2 Perceived Information Reliability
Five questions were developed to measure the participants' perception of the
reliability of the financial information provided in the experimental task. These questions
are shown in Table 13. The individual items in this set of questions were initially
analyzed and found to be highly correlated. Subsequently, the items were analyzed for
internal reliability using Cronbach's alpha (C. alpha = 0.798) and found to measure the
same construct (Nunnally, 1978). See Table 13.As a result, the participants' responses to
the five questions were averaged to develop the dependent variable, INFORMATION
RELIABILITY, used to test H4a, b and c.
4.4.3.2.3 Perceived Value of Information
Three questions were used to measure the participant’s perception of the value of
the financial information provided in the experimental task. These questions are shown in
Table 13. The individual items in this set of questions were initially analyzed and found
to be highly correlated. Subsequently, the items were analyzed for internal reliability
using Cronbach's alpha (C. alpha = 0.857) and found to measure the same construct
(Nunnally, 1978). See Table 13. The participant’s responses to the three questions were
averaged to develop the dependent variable, INFORMATION VALUE, used to test H3a,
H3b and H3c.

76
Table 13 PERCEPTION DEPENDENT VARIABLES ITEM ANALYSIS
Variable Names, Questions and Response Format Variable Question Response Format
N=81 Cronbach's Alpha = 0.823
Mean
Std. Dev
Min
Max
I believe that management of ACME, Inc. is informed.
4.76 1.15 1.00 7.00 [SD,D,SWD,N,SWA,A,SA]
I believe that management of ACME, Inc. is expert. 4.15 1.04 2.00 6.00 [SD,D,SWD,N,SWA,A,SA]
I believe that management of ACME, Inc. is competent.
4.99 1.10 2.00 7.00 [SD,D,SWD,N,SWA,A,SA]
I believe that management of ACME, Inc. is honest. 4.64 1.04 2.00 7.00 [SD,D,SWD,N,SWA,A,SA]
I believe that management of ACME, Inc. is trustworthy.
4.57 0.99 2.00 7.00 [SD,D,SWD,N,SWA,A,SA]
SOURCE CREDIBILITY (Six Items)# McCrosky & Teven (1999)
I believe that management of ACME, Inc. is ethical. 4.62 0.93 2.00 7.00 [SD,D,SWD,N,SWA,A,SA]
N=81 Cronbach's Alpha = 0.798
Mean
Std Dev
Min
Max
The financial information I received was accurately presented.
5.06 1.08 2.00 7.00 [SD,D,SWD,N,SWA,A,SA]
The financial information I received was valid.
4.80 1.11 1.00 7.00 [SD,D,SWD,N,SWA,A,SA]
The financial information I received was verifiable.
4.56 1.37 2.00 7.00 [SD,D,SWD,N,SWA,A,SA]
The financial information I received was consistent.
4.85 1.35 2.00 7.00 [SD,D,SWD,N,SWA,A,SA]
INFORMATION RELIABILITY (Five Items)#
The financial information I received was credible.
4.83 1.07 1.00 7.00 [SD,D,SWD,N,SWA,A,SA]

77
Table 13 PERCEPTION DEPENDENT VARIABLES ITEM ANALYSIS CONTINUED
N=81 Cronbach's Alpha = 0.857
Mean
Std Dev
Min
Max
I would pay to have this type of information provided to me.
3.94 1.57 1.00 6.00 [SD,D,SWD,N,SWA, A,SA]
I would recommend to friends and family that they pay to have similar information provided to them.
3.79 1.51 1.00 6.00 [SD,D,SWD,N,SWA, A,SA]
INFORMATION VALUE (Three Items)#
I would pay a higher price for stock in a company that offered this form of information reporting compared to a company that did not.
4.40 1.62 1.00 7.00 [SD,D,SWD,N,SWA, A,SA]
# The items for each construct were analyzed for correlation and Cronbach's coefficient alpha. The responses were averaged to derive the variable used in the main analysis. Response Question: Please indicate the extent to which you agree with this statement. Response Format Key: [SD,D,SWD,N,SWA,A,SA ] = Strongly Disagree, Disagree, Somewhat Disagree, Neutral, Somewhat Agree, Agree, Strongly Agree.

78
4.4.4 Mancova Testing
The design of the experiment resulted in multiple dependent variables. It is
appropriate when performing separate analyses of multiple dependent variables to
perform a multivariate analysis of covariance (MANCOVA) analysis to determine the
overall main and interaction effects of the independent variables on the combined
dependent variables. Use of MANCOVA controls the experiment-wide error rate. If a
difference between groups is found using the overall MANCOVA, the separate
ANCOVA models are then utilized to explore the group differences for each individual
dependent variable. The statistical assumptions of MANCOVA are discussed in section
4.4.5.5.
The dependent variables were also examined for correlation. The correlation
analysis of the performance dependent variables is presented in Table 14. The results
indicated that most of the dependent variables were correlated: PREDICTION,
TRACKING, SOURCE CREDIBILITY and INFORMATION RELIABILITY.
CONFIDENCE was not correlated with the other dependent variables. INFORMATION
VALUE was not tested for correlation with the other dependent variables as it will be
analyzed using regression analysis.
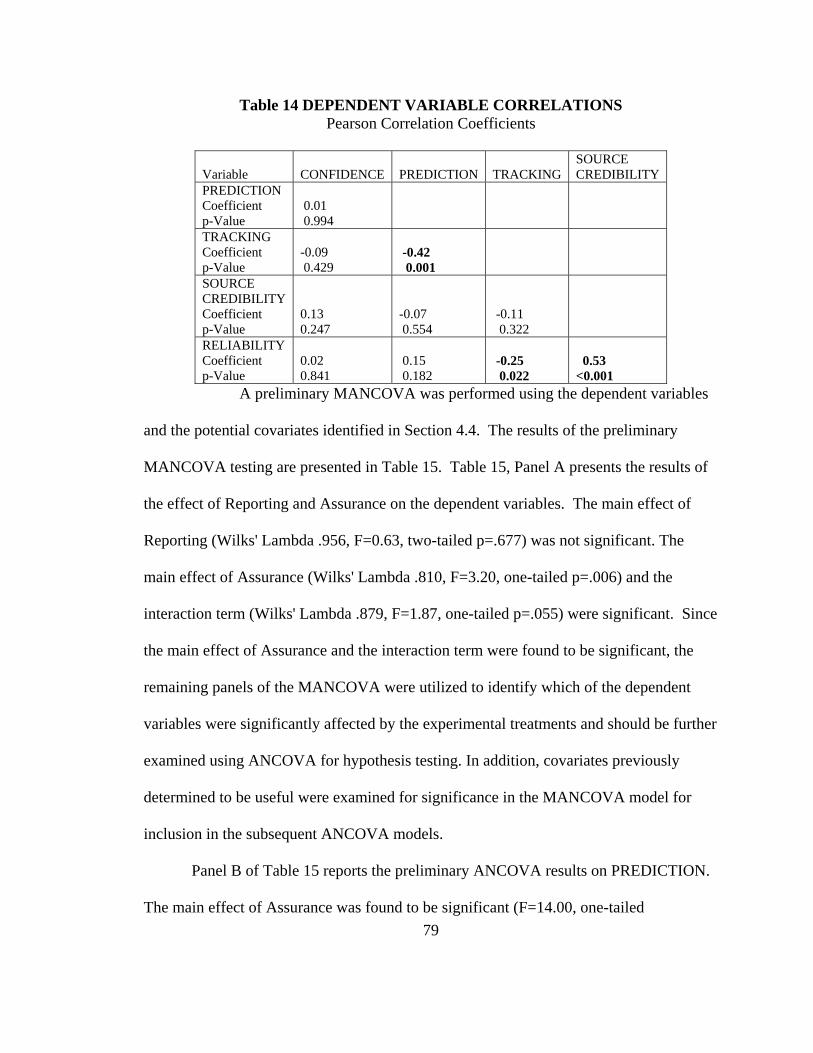
79
Table 14 DEPENDENT VARIABLE CORRELATIONS Pearson Correlation Coefficients
Variable
CONFIDENCE
PREDICTION
TRACKING
SOURCE CREDIBILITY
PREDICTION Coefficient p-Value
0.01 0.994
TRACKING Coefficient p-Value
-0.09 0.429
-0.42 0.001
SOURCE CREDIBILITY Coefficient p-Value
0.13 0.247
-0.07 0.554
-0.11 0.322
RELIABILITY Coefficient p-Value
0.02 0.841
0.15 0.182
-0.25 0.022
0.53 <0.001
A preliminary MANCOVA was performed using the dependent variables
and the potential covariates identified in Section 4.4. The results of the preliminary
MANCOVA testing are presented in Table 15. Table 15, Panel A presents the results of
the effect of Reporting and Assurance on the dependent variables. The main effect of
Reporting (Wilks' Lambda .956, F=0.63, two-tailed p=.677) was not significant. The
main effect of Assurance (Wilks' Lambda .810, F=3.20, one-tailed p=.006) and the
interaction term (Wilks' Lambda .879, F=1.87, one-tailed p=.055) were significant. Since
the main effect of Assurance and the interaction term were found to be significant, the
remaining panels of the MANCOVA were utilized to identify which of the dependent
variables were significantly affected by the experimental treatments and should be further
examined using ANCOVA for hypothesis testing. In addition, covariates previously
determined to be useful were examined for significance in the MANCOVA model for
inclusion in the subsequent ANCOVA models.
Panel B of Table 15 reports the preliminary ANCOVA results on PREDICTION.
The main effect of Assurance was found to be significant (F=14.00, one-tailed

80
p=<0.001). The interaction term (F=1.45, one-tailed p=.116) was not significant. The
main effect of Reporting was not evaluated based on the overall MANCOVA assessment
that it was not significant. PREDICTION was subsequently subjected to separate
ANCOVA for hypothesis testing. No covariates were found to be useful for
PREDICTION.
The preliminary ANCOVA results for TRACKING are reported in Table 15,
Panel C. The main effect of Assurance (F=0.59, one-tailed p=.223) was not significant.
The interaction term (F=3.83, one-tailed p=.027) was significant. The main effect of
Reporting was not evaluated based on the overall MANCOVA assessment that it was not
significant. TRACKING was subsequently subjected to separate ANCOVA for
hypothesis testing. Two covariates, 'Plan Future Investments' and System Trust were
found to be useful for TRACKING and were included in the subsequent univariate
analysis.
The preliminary ANCOVA results for CONFIDENCE are reported in Table 15,
Panel D. The main effect of Assurance (F=0.64, one-tailed p=.214) was not significant.
The interaction term (F=.10, one-tailed p=.375) was also not significant. The main effect
of Reporting was not evaluated based on the overall MANCOVA assessment that it was
not significant. CONFIDENCE was not significantly affected by the independent
variables and was not examined further for hypothesis testing.
Table 15, Panel E presents the results of the preliminary ANCOVA for SOURCE
CREDIBILITY. The main effect of Assurance (F=.11, one-tailed p=.370) and the
interaction term (F=.03, one-tailed p=.431) were not significant. The main effect of

81
Reporting was not evaluated based on the overall MANCOVA assessment that it was not
significant. Source Credibility was not significantly affected by the independent variables
and was not examined further for hypothesis testing.
The preliminary ANCOVA results for INFORMATION RELIABILITY are
presented in Table 15, Panel F. The main effect of Assurance (F=.33, one-tailed p=.285)
were not significant. The interaction term (F=1.81, one-tailed p=.092) was significant.
The main effect of Reporting was not evaluated based on the overall MANCOVA
assessment that it was not significant. INFORMATION RELIABILITY was
subsequently subjected to separate ANCOVA for hypothesis testing. Two covariates,
'Number of Accounting Courses Taken' and System Trust were found to be useful for
INFORMATION RELIABILITY and were included in the subsequent univariate
analysis.
TABLE 15 MANCOVA RESULTS FOR REPORTING AND ASSURANCE ON PREDICTION, TRACKING, CONFIDENCE, SOURCE CREDIBILITY AND
INFORMATION RELIABILITY
Covariates with significant p-Values will be retained for main analysis.
Panel A. MANCOVA Results for Reporting and Assurance on PREDICTION, TRACKING, CONFIDENCE, SOURCE CREDIBILITY and INFORMATION
RELIABILITY
Variable Wilks' Lambda F Statistic P Value Reporting 0.956 0.63 0.677# Assurance 0.810 3.20 0.006## Reporting X Assurance 0.879 1.87 0.055## #P-Values are two-tailed tests. ##P-Values are one-tailed tests.

82
Panel B. ANCOVA Results for Reporting and Assurance on PREDICTION
Variable^
DF
Sum of Squares
Mean Squares
F Statistic
P-Value#
Reporting 1 0.12 0.12 0.03 0.873 Assurance 1 66.87 66.87 14.00 <0.001##* Reporting X Assurance 1 6.94 6.94 1.45 0.116## Gender 1 0.71 0.71 0.15 0.702 Plan Future Investments 1 6.82 6.82 1.43 0.234 Number of Accounting Courses Taken
1 2.58
2.58
0.54
0.465
System Trust 1 2.51 2.51 0.53 0.471 CONFIDENTBASE 1 2.66 2.66 0.56 0.458 Model 8 96.61 12.08 2.53 0.018 Error 72 343.93 4.78 Corrected Total 80 440.54 ^See Panel F for variable descriptions. #P-Values are two-tailed tests unless otherwise indicated. ##P-Values are one-tailed tests. *Significant at .01.
Panel C. ANCOVA Results for Reporting and Assurance on TRACKING
Variable^
DF
Sum of Squares
Mean Squares
F Statistic
P-Value#
Reporting 1 6.64 6.64 0.43 0.513 Assurance 1 13.61 13.61 0.89 0.175## Reporting X Assurance 1 47.63 47.63 3.10 0.041##* Gender 1 23.30 23.30 1.52 0.222 Plan Future Investments 1 65.48 65.48 4.27 0.043 Number of Accounting Courses Taken
1 1.52
1.52
0.10
0.754
System Trust 1 99.12 99.12 6.46 0.013 CONFIDENTBASE 1 5.88 5.88 0.38 0.538 Model 8 342.25 42.78 2.79 0.010 Error 72 1105.26 15.35 Corrected Total 80 1447.51 ^ See Panel F for variable descriptions. #P-Values are two-tailed tests unless otherwise indicated. ##P-Values are one-tailed tests. *Significant at .05.

83
Panel D. ANCOVA Results for Reporting and Assurance on CONFIDENCE
Variable^
DF
Sum of Squares
Mean Squares
F Statistic
P-Value#
Reporting 1 0.28 0.28 0.01 0.943 Assurance 1 34.63 34.63 0.64 0.214## Reporting X Assurance 1 5.58 5.58 0.10 0.375## Gender 1 536.48 536.48 9.86 0.002 Plan Future Investments 1 17.97 17.97 0.33 0.567 Number of Accounting Courses Taken 1 234.24 234.24 4.31 0.042 System Trust 1 74.66 74.66 1.37 0.245 CONFIDENTBASE 1 20151.25 20151.25 370.50 <0.001 Model 8 24939.66 3117.46 57.32 <0.001 Error 72 3915.99 54.39 Corrected Total 80 28855.65 ^ See Panel F for variable descriptions. #P-Values are two-tailed tests unless otherwise indicated. ##P-Values are one-tailed tests.
Panel E. ANCOVA Results for Reporting and Assurance on SOURCE CREDIBILITY
Variable^
DF
Sum of Squares
Mean Squares
F Statistic
P-Value#
Reporting 1 0.53 0.53 1.02 0.159## Assurance 1 0.06 0.06 0.11 0.370## Reporting X Assurance 1 0.02 0.02 0.03 0.431## Gender 1 0.09 0.09 0.18 0.673 Plan Future Investments 1 0.01 0.01 0.03 0.870 Number of Accounting Courses Taken 1 0.24 0.24 0.46 0.500 System Trust 1 6.58 6.58 12.68 <0.001 CONFIDENTBASE 1 0.09 0.09 0.17 0.686 Model 8 8.92 1.12 2.15 0.042 Error 72 37.36 0.52 Corrected Total 80 46.28 ^See Panel F for variable descriptions. #P-Values are two-tailed tests unless otherwise indicated. ##P-Values are one-tailed tests.

84
Panel F. ANCOVA Results for Reporting and Assurance on INFORMATION RELIABILITY
Variable^
DF
Sum of Squares
Mean Squares
F Statistic
P-Value#
Reporting 1 0.29 0.29 0.56 0.227## Assurance 1 0.17 0.17 0.33 0.285## Reporting X Assurance 1 0.94 0.94 1.81 0.092##* Gender 1 0.25 0.25 0.49 0.488 Plan Future Investments 1 0.96 0.96 0.85 0.178 Number of Accounting Courses Taken
1 7.49
7.49
14.47
<0.001
System Trust 1 15.58 15.58 30.09 <0.001 CONFIDENTBASE 1 1.13 1.13 2.18 0.144 Model 8 26.85 3.36 6.48 <0.001 Error 72 37.28 0.52 Corrected Total 80 64.13 ^Reporting: Treatment, either periodic reporting or continuous reporting. Assurance: Treatment, either without assurance or with assurance. Reporting X Assurance: Treatment, interaction term. Gender: Male or Female Plan Future Investments: Asked participants their intent to invest in the stock market in the future Number of Accounting Courses Taken: Number of accounting course participant had taken. System Trust: Trust in the information delivery mechanism. CONFIDENTBASE: Average self reported confidence in predictions during base period. #P-Values are two-tailed tests unless otherwise indicated. ##P-Values are one-tailed tests. *Significant at .10.
The individual panels of the MANCOVA analysis identified PERFORMANCE,
TRACKING and INFORMATION RELIABILITY as dependent variables that were
significantly affected by either the main effect of Assurance or the interaction term.
These dependent variables were subjected to subsequent individual univariate analysis.
4.4.5 Testing of Statistical Assumptions
Prior to performing further analysis, the dependent variables must be analyzed to
determine if they satisfy the statistical assumptions required for the statistical method to
be valid. Several different analysis methods were used. PREDICTION, TRACKING,

85
CONFIDENCE, SOURCE CREDIBILITY and INFORMATION RELIABILITY were
initially analyzed using MANCOVA to determine the overall significance of the model.
Subsequently, PREDICTION, TRACKING and INFORMATION RELIABLITY were
analyzed using ANCOVA. In addition, a within-subjects analysis was performed on
PREDICTION and TRACKING using Repeated Measures ANCOVA. INFORMATION
VALUE was analyzed using OLS regression. The statistical assumptions that were
initially applied to the dependent variables were the univariate assumptions of ANOVA.
These assumptions satisfy the first step of multivariate assumption analysis and are also
applicable to OLS regression analysis (Hair, Anderson, Tatham, 1998). In addition, the
multivariate assumption requirements of MANOVA were examined.
The statistical assumptions of ANOVA are 1) independence of observations of the
dependent variable, 2) normal distribution of the dependent variable and 3) equal
variance among treatment groups of the dependent variable (Hair, et al., 1998). In
addition to satisfying the statistical assumptions, the dependent variable data must also be
analyzed to determine the existence of extreme observations (outliers) which may distort
the analysis (Hair, et al., 1998).
4.4.5.1 Independent Observations
The first assumption tested is the independence of observations of the dependent
variable. Independence of observations is achieved through a between-subjects design
and random assignment of participants to each of the treatment groups. In addition, each
participant worked individually and performed the experimental task one time. As a

86
result, each of the observations is independent of all other observations for the dependent
variables.
4.4.5.2 Normal Distribution
The second assumption tested is normal distribution of the dependent variable.
Normal distribution is tested through use of both graphical and statistical tests. For
graphical analysis, box and whisker plots and normal probability plots for each dependent
variable were examined. Box and whisker plots show groupings of data around specific
values. The normal probability plots show the actual values compared to a theoretically
normal distribution curve. In addition, the skewness and kurtosis of the data were
examined. Skewness is an indication of how many of the observations fall
disproportionately to the right (negative skewness) or left (positive skewness) of the
distribution. Kurtosis is a measure of the peak (concentration) of the distribution. To
further evaluate the normal distribution, a statistical test was also evaluated: the
Kolmogorov-Smirnov (K-S) statistic.
PREDICTION exhibits skewness (-0.2518) and kurtosis (-0.5242) indicating
moderate departure from a normal distribution. This is supported by the K-S statistic
(p=<.010). TRACKING exhibits a similar degree of departure from normality
(skewness=.3151, kurtosis=-.5242), however, this is not supported by the K-S statistic
(p=.130). CONFIDENCE exhibits minimal departure from normality (skewness=-.0566,
kurtosis=-.0612), which is consistent with the K-S statistic (p=.047). SOURCE
CREDIBILITY exhibits skewness of -.0737 and kurtosis of .5162, indicating a departure
from normally distributed data, which is supported by the K-S statistic (p=.02).

87
INFORMATION RELIABILITY appears to be somewhat skewed to the right (skewness
= -.2510) but with a fairly normal peak (kurtosis = -.0102). The K-S statistic (p=.092)
indicates the data are not normally distributed. Examination of the skewness (-.5151) and
kurtosis (-.5787) for INFORMATION VALUE indicated significant departure from
normality, which is supported by the K-S statistic (p=<.010).
While the tests indicate that for most of dependent variables the assumption of
normality is violated, the ANCOVA is robust to violations of this assumption,
particularly in the case where an equal number of observations per treatment group is
compared. As a result, no adjustments were made to the dependent variable data related
to departures from normality.
4.4.5.3 Constant Variance
The third assumption to be tested for the dependent variables is constant variance
of the dependent variable at all levels of the independent variables. The data are
described as homoscedastic if the variance of the dependent variable is constant at all
levels of the independent variables. If there is not constant variance, the data are
described as heteroscedastic. To test the data for constant variance among the different
levels of the independent variables, a Levene's test for constant variance was performed
for each dependent variable for Reporting and Assurance. In addition, a second test was
performed for each dependent variable examining the linear relationship between the
squared residuals and the predicted values. The results of the two tests for constant
variance for each dependent variable are now discussed.

88
The Levene's tests for CONFIDENCE (Reporting: F=.18, p=.669, Assurance:
F=.18, p=.674), PREDICTION (Reporting: F=1.46, p=.230, Assurance: F=.04, p=.844),
TRACKING (Reporting: F=1.46, p=.230, Assurance: F=1.46, p=.230), SOURCE
CREDIBILITY (Reporting: F=0.71, p=.401, Assurance: F=.41. p=.524),
INFORMATION RELIABILITY (Reporting: F=0.24, p=.628, Assurance: F=.16, p=.689)
and INFORMATION VALUE (Reporting: F=2.16, p=.145, Assurance: F=.17, p=.679)
indicates the dependent variables exhibited constant variance across the different levels
of the independent variables. The secondary tests of the linear relationship between the
squared residuals and the predicted values of each dependent variable supported these
findings, with variation in the squared residuals associated with variation in the predicted
values ranging from less than 1% to 2.57%, indicating very little statistical evidence that
the dependent variables did not exhibit constant variance.
4.4.5.4 Outliers
Outliers are extreme data points that may not be representative of the data
population and may result in spurious results if retained in the data set. While ANCOVA
is robust, it is appropriate to test the data for outliers and to examine any outliers for
significant influence on the ANCOVA results. To test for influential observations, each
dependent variable was examined to determine if any of the observations qualified as an
outlier by exceeding a studentized residual value of +/-3.5727 with an overall
significance level less than .05 (SAS, 2007).
The tests for outlier observations identified one observation for Source Credibility
that fell outside of the acceptable parameters (studentized residual -3.64801, p=.0390).

89
Analysis was performed both with and without the observation and it was determined to
have no significant influence on the results and was retained in the analysis. No outliers
were identified for the other dependent variables.
The testing of assumptions revealed departures from normality and minimal
issues with unequal variance or outliers. ANCOVA is robust to violations of the
assumptions when the cell sizes are equal and no adjustments to the data were deemed
necessary.
4.4.5.5 Multivariate Assumptions Tests
The multivariate assumptions of MANOVA are similar to the univariate
assumptions of ANCOVA: independence of observations, equality of variance-
covariance matrices, multivariate normal distribution and elimination of outliers.
The assumption of independence of observations is met through the design of the
experiment, as discussed previously for the univariate assumptions.
The assumption for equality of variance-covariance matrices across the dependent
variable groups is similar to the univariate test for equal covariance. MANOVA is robust
to departures from this assumption when cell sizes are approximately equal in size.
There is no direct test for multivariate normality. Typically, when all of the
dependent variables meet the requirements for univariate normality, departures from
multivariate normality have little impact on the analysis.
No outliers were found to be influential in the univariate analysis and this satisfies
the multivariate analysis requirements.

90
4.4.6 Hypothesis Testing
This section presents the testing of the hypotheses, including the descriptive
statistics for the dependent variables and conclusions drawn from the results of the
hypothesis tests.
4.4.6.1 Performance (H1)
The effect of Reporting and Assurance was tested on the decision quality
dependent variables, PREDICTION, TRACKING and CONFIDENCE using between
subjects analysis. H1a tests the main effect of Reporting, H1b tests the main effect of
Assurance and H1c tests the interaction term. MANCOVA was initially employed to
determine if there was an overall difference between the groups and to determine if the
dependent variables were significantly affected by the independent variables. Covariates
that were identified as significant in the MANCOVA model were included in the
individual ANCOVA models for hypothesis testing.
The results of the overall reduced MANCOVA are reported in Table 15, Panel A.
After controlling for 'Plan Future Investments', Number of Accounting Courses Taken,
System Trust and Information Relevance, the main effect of Reporting was not
significant (Wilks' Lambda=.985 p-value=.779), the main effect of Assurance was
significant (Wilks' Lambda=0.812, p-value=0.002) and the interaction term was
significant (Wilks' Lambda=.883, p-value=0.031). This is an indication of lack of support
for H1a, which predicted that performance would be different for Periodic Reporting than
for Continuous Reporting. PREDICTION and TRACKING were found to be
significantly affected by the independent variables and subsequently examined using

91
ANCOVA to test H1b and H1c. CONFIDENCE was not found to be significantly
affected by the independent variables and was not subjected to further analysis.
4.4.6.1.1 Prediction
The performance dependent variable, PREDICTION, is a measure of the number
of times the participants made correct predictions regarding the direction of the stock
price in the first 30 decision of the treatment period. A greater number of correct
decisions indicated a higher level of performance. The descriptive statistics for
PREDICTION are presented in Table 16, showing the cell size, mean, standard deviation,
variance and range by grouping for the main effect of Reporting, the main effect of
Assurance and for the interaction of the two treatments.
TABLE 16 PREDICTION DESCRIPTIVE STATISTICS
Assurance No Assurance With Assurance Total Reporting
Reporting Periodic Reporting
N=20 Mean=15.15 Std Dev=2.25 Var=5.08 Range: 11- 19
N=19 Mean=16.58 Std Dev=2.06 Var=4.26 Range: 11- 20
N=39 Mean=15.85 Std Dev=2.25 Var=5.08 Range: 11 - 20
Continuous Reporting
N=20 Mean=14.45 Std Dev=2.11 Var=4.47 Range: 11 - 18
N=22 Mean=16.82 Std Dev=2.22 Var=4.92 Range: 12 - 20
N=42 Mean=15.69 Std Dev=2.45 Var=6.02 Range: 11 - 20
Total Assurance
N=40 Mean=14.80 Std Dev=2.19 Var=4.78 Range: 11 - 19
N=41 Mean=16.71 Std Dev=2.12 Var=4.51 Range: 11 - 20
H1a predicted that performance would be different for Periodic Reporting than for
Continuous Reporting, a non-directional hypothesis. The mean for Periodic Reporting
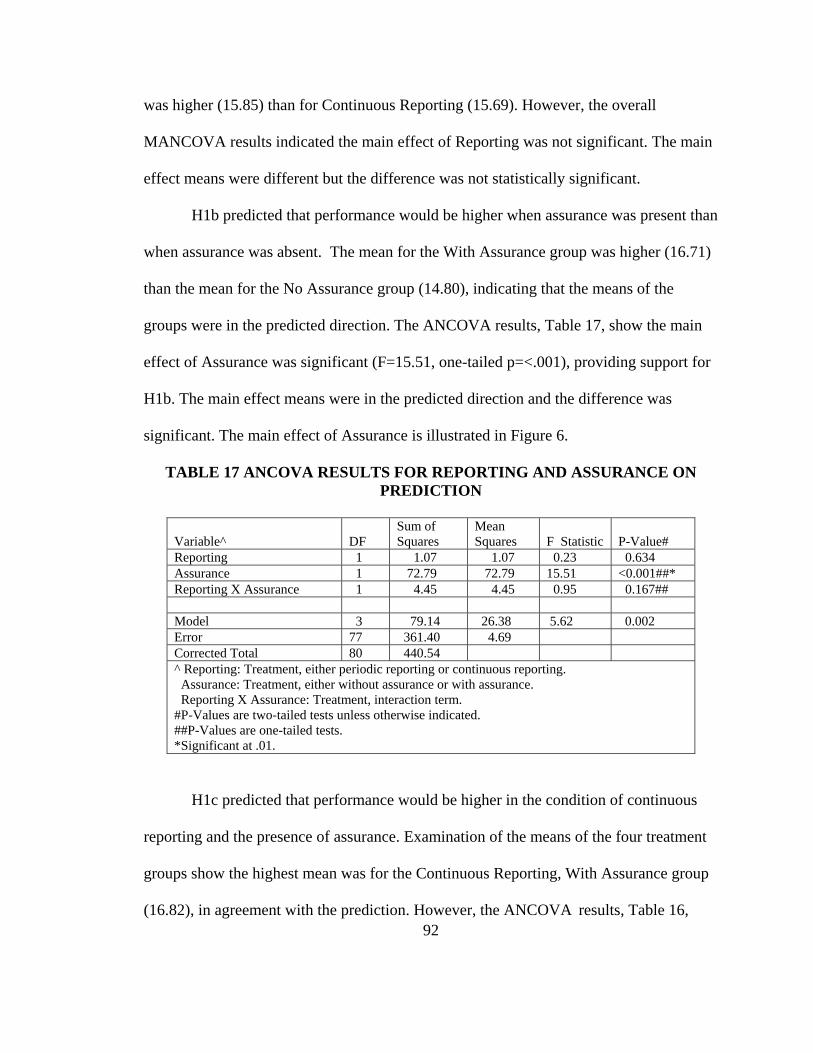
92
was higher (15.85) than for Continuous Reporting (15.69). However, the overall
MANCOVA results indicated the main effect of Reporting was not significant. The main
effect means were different but the difference was not statistically significant.
H1b predicted that performance would be higher when assurance was present than
when assurance was absent. The mean for the With Assurance group was higher (16.71)
than the mean for the No Assurance group (14.80), indicating that the means of the
groups were in the predicted direction. The ANCOVA results, Table 17, show the main
effect of Assurance was significant (F=15.51, one-tailed p=<.001), providing support for
H1b. The main effect means were in the predicted direction and the difference was
significant. The main effect of Assurance is illustrated in Figure 6.
TABLE 17 ANCOVA RESULTS FOR REPORTING AND ASSURANCE ON PREDICTION
Variable^
DF
Sum of Squares
Mean Squares
F Statistic
P-Value#
Reporting 1 1.07 1.07 0.23 0.634 Assurance 1 72.79 72.79 15.51 <0.001##* Reporting X Assurance 1 4.45 4.45 0.95 0.167## Model 3 79.14 26.38 5.62 0.002 Error 77 361.40 4.69 Corrected Total 80 440.54 ^ Reporting: Treatment, either periodic reporting or continuous reporting. Assurance: Treatment, either without assurance or with assurance. Reporting X Assurance: Treatment, interaction term. #P-Values are two-tailed tests unless otherwise indicated. ##P-Values are one-tailed tests. *Significant at .01.
H1c predicted that performance would be higher in the condition of continuous
reporting and the presence of assurance. Examination of the means of the four treatment
groups show the highest mean was for the Continuous Reporting, With Assurance group
(16.82), in agreement with the prediction. However, the ANCOVA results, Table 16,

93
show the interaction term was not significant (F=.95 one-tailed p=.167), providing no
support for H1c. The means were in the predicted direction, but the differences were not
statistically significant.
FIGURE 6 MAIN EFFECT OF ASSURANCE ON PREDICTION
10
11
12
13
14
15
16
17
18
19
20
No Assurance With Assurance
PRED
ICTI
ON
The results of the analysis of PREDICTION indicated that the level of reporting
frequency had no significant effect on the decision quality of the participants and that the
participants in the With Assurance treatment groups had higher quality decisions than
participants in the No Assurance treatment groups.
4.4.6.1.2 Tracking
The performance dependent variable TRACKING is a measure of the number of
times the participants made 'tracking' predictions regarding the direction of the stock
price in the first 30 decision of the treatment period. A higher number of 'tracking'
decisions indicated a prediction pattern in agreement with the mean reverting pattern
described by Difonza and Bordia (1997). In the analysis, mean reverting predictions were

94
a proxy for profitable decisions and considered to be the higher quality decisions. A
greater number of 'tracking' predictions indicated a higher level of performance. The
descriptive statistics for TRACKING, presented in Table 18, show the cell size, mean,
standard deviation, variance and range by grouping for the main effect of Reporting, the
main effect of Assurance and for the interaction of the two treatments.
TABLE 18 TRACKING DESCRIPTIVE STATISTICS
Assurance No Assurance With Assurance Total Reporting
Reporting Periodic Reporting
N=20 Mean=11.35 Std Dev=3.72 Var=13.82 Range: 6 - 19
N=19 Mean=8.32 Std Dev=3.46 Var=12.00 Range: 4 - 16
N=39 Mean=9.87 Std Dev=3.87 Var=14.96 Range: 4 - 19
Continuous Reporting
N=20 Mean=10.10 Std Dev=3.97 Var=15.78 Range: 3 - 18
N=22 Mean=10.64 Std Dev=5.21 Var=27.19 Range: 1 - 20
N=42 Mean=10.38 Std Dev=4.62 Var=21.31 Range: 1 - 20
Total Assurance
N=40 Mean=10.73 Std Dev=3.85 Var=14.82 Range: 3 - 19
N=41 Mean=9.56 Std Dev=4.59 Var=21.05 Range: 1 - 20
H1a predicted that performance would be different for Periodic Reporting than for
Continuous Reporting, a non-directional hypothesis. The mean for the Continuous
Reporting (10.38) was higher than the mean for Periodic Reporting (9.87). However, the
overall MANCOVA results indicated the main effect of Reporting was not significant,
providing no support for H1a. The difference in the main effect means was not
statistically significant.
H1b predicted that decisions would be of higher quality when Assurance was
present that when it was absent. The mean for With Assurance (9.56) was lower than the

95
mean for No Assurance (10.73), indicating means in the opposite direction than the
hypothesis predicted. The ANCOVA results for TRACKING, presented in Table 18,
indicated that the main effect of Assurance was not significant (F=.95, one-tailed
p=.166), providing no support for H1b. The main effect means were in an opposite
direction from the prediction and the difference was not statistically significant.
H1c predicted that performance would be higher in the condition of continuous
reporting and the presence of assurance. The highest mean in the treatment cells was for
the Periodic Reporting, No Assurance group (11.35), opposite of the prediction. The
lowest mean was the Periodic Reporting, With Assurance group (8.32). The results of the
ANCOVA for TRACKING, Table 19, indicated the interaction term was significant
(F=3.48, one-tailed p=.034), providing support for H1c. The significance of the
interaction term was difficult to interpret. The graph of the interaction of Reporting and
Assurance on TRACKING, Figure 7, indicated a disordinal interaction, wherein the
effects of the treatment were not the same for each order of the dependent variables
(Pedhazur and Schmelkin, 1991, p.548). The number of TRACKING predictions in the
Periodic Reporting condition decreased as the level of Assurance condition increased
from No Assurance to With Assurance, but the opposite is the case for the Continuous
Reporting condition. The number of TRACKING predictions in the Continuous
Reporting condition increased as the level of Assurance increased from No Assurance to
With Assurance, which was in the predicted direction. The interaction of Reporting and
Assurance was supported, but the highest mean was not found for the predicted group,
providing mixed support for H1c.

96
TABLE 19 ANCOVA RESULTS FOR REPORTING AND ASSURANCE ON TRACKING
Variable^
DF
Sum of Squares
Mean Squares
F Statistic
P-Value#
Reporting 1 8.76 8.76 0.58 0.449 Assurance 1 14.39 14.39 0.95 0.166## Reporting X Assurance 1 52.60 52.60 3.48 0.034##* Plan Future Investments 1 82.86 82.86 5.48 0.022 System Trust 1 150.21 150.21 9.93 0.002 Model 5 313.22 62.64 4.14 0.002 Error 75 1134.28 15.12 Corrected Total 80 1447.50 ^Reporting: Treatment, either periodic reporting or continuous reporting. Assurance: Treatment, either without assurance or with assurance. Reporting X Assurance: Treatment, interaction term. Plan Future Investments: Asked participants their intent to invest in the stock market in the future System Trust: Trust in the information delivery mechanism. #P-Values are two-tailed tests unless otherwise indicated. ##P-Values are one-tailed tests. *Significant at .05.
4.4.6.1.3 Additional Analysis of Prediction And Tracking
The impact of the treatments on the participants' performance was further
evaluated by performing ANCOVAs with PREDBASE as a covariate of PREDICTION
and then with TRACKBASE as a covariate of TRACKING. Each analysis showed that
the base period measures were not significant covariates of the dependent variables, an
indication that the treatment had an effect of the performance of the participants. Two
additional analyses were performed. First, a difference score was developed for each of
the two dependent variables, PREDDIFF and TRACKDIFF. PREDDIFF was the
difference between PREDBASE and PREDICTION. TRACKDIFF was the difference
between TRACKBASE and TRACKING. ANCOVAs were performed using PREDDIFF
and TRACKDIFF as the dependent variables and including appropriate covariates.
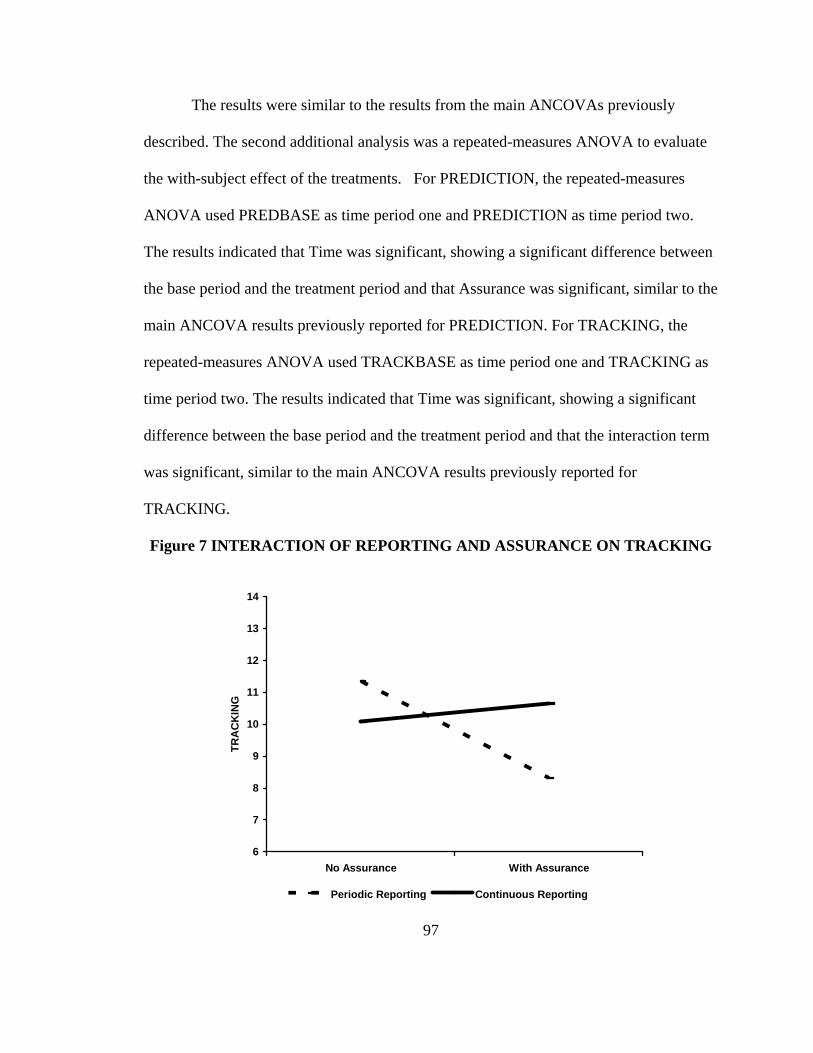
97
The results were similar to the results from the main ANCOVAs previously
described. The second additional analysis was a repeated-measures ANOVA to evaluate
the with-subject effect of the treatments. For PREDICTION, the repeated-measures
ANOVA used PREDBASE as time period one and PREDICTION as time period two.
The results indicated that Time was significant, showing a significant difference between
the base period and the treatment period and that Assurance was significant, similar to the
main ANCOVA results previously reported for PREDICTION. For TRACKING, the
repeated-measures ANOVA used TRACKBASE as time period one and TRACKING as
time period two. The results indicated that Time was significant, showing a significant
difference between the base period and the treatment period and that the interaction term
was significant, similar to the main ANCOVA results previously reported for
TRACKING.
Figure 7 INTERACTION OF REPORTING AND ASSURANCE ON TRACKING
6
7
8
9
10
11
12
13
14
No Assurance With Assurance
TRA
CK
ING
Periodic Reporting Continuous Reporting

98
4.4.6.1.4 Confidence
CONFIDENCE is a measure of the average confidence participants reported for
their decisions in the treatment group. It is not a direct measure of decision quality, but
was a proxy for the participants' belief in the quality of their decisions. The higher the
level of confidence, the higher the participants' own evaluation of their decision quality.
The descriptive statistics for CONFIDENCE are presented in Table 20, showing cell size,
mean, standard deviation, variance and range by grouping for the main effect of
Reporting, the main effect of Assurance and for the interaction of the two treatments. A
review of the means shows that, on average, the participants exhibited around 51-58%
confidence in their predictions.
The overall MANCOVA results for CONFIDENCE, Table 14, Panel D, indicated
that it was not significantly affected by the independent variables and no subsequent
testing of H1 was required for CONFIDENCE. A brief discussion of the descriptive
statistics in relation to the hypotheses follows.
H1a predicted that performance would be different for Periodic Reporting than for
Continuous Reporting. The mean for Continuous Reporting was higher (57.08) than for
Periodic Reporting (52.20). However, difference in the Reporting main effect means was
not significant.
H1b predicted that performance would be higher when assurance was present
than when assurance was absent. The mean for With Assurance was higher (55.50) than
for No Assurance (53.94), indicating that the means of the groups were in the predicted
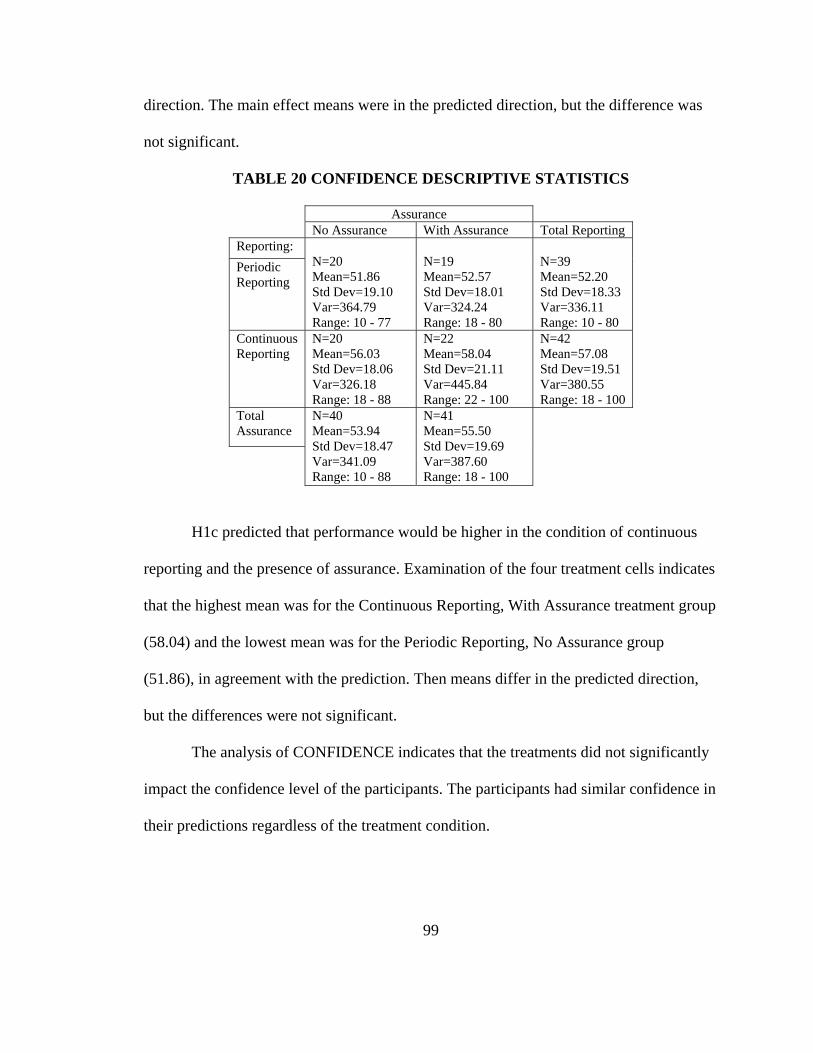
99
direction. The main effect means were in the predicted direction, but the difference was
not significant.
TABLE 20 CONFIDENCE DESCRIPTIVE STATISTICS
Assurance No Assurance With Assurance Total Reporting
Reporting: Periodic Reporting
N=20 Mean=51.86 Std Dev=19.10 Var=364.79 Range: 10 - 77
N=19 Mean=52.57 Std Dev=18.01 Var=324.24 Range: 18 - 80
N=39 Mean=52.20 Std Dev=18.33 Var=336.11 Range: 10 - 80
Continuous Reporting
N=20 Mean=56.03 Std Dev=18.06 Var=326.18 Range: 18 - 88
N=22 Mean=58.04 Std Dev=21.11 Var=445.84 Range: 22 - 100
N=42 Mean=57.08 Std Dev=19.51 Var=380.55 Range: 18 - 100
Total Assurance
N=40 Mean=53.94 Std Dev=18.47 Var=341.09 Range: 10 - 88
N=41 Mean=55.50 Std Dev=19.69 Var=387.60 Range: 18 - 100
H1c predicted that performance would be higher in the condition of continuous
reporting and the presence of assurance. Examination of the four treatment cells indicates
that the highest mean was for the Continuous Reporting, With Assurance treatment group
(58.04) and the lowest mean was for the Periodic Reporting, No Assurance group
(51.86), in agreement with the prediction. Then means differ in the predicted direction,
but the differences were not significant.
The analysis of CONFIDENCE indicates that the treatments did not significantly
impact the confidence level of the participants. The participants had similar confidence in
their predictions regardless of the treatment condition.
100
4.4.6.1.4 Summary of Performance
The results of the analysis of PREDICTION indicated that only the main effect of
Assurance was significant with regard to the number of correct predictions made by the
participants.
The results of the analysis of TRACKING indicated that the interaction of
Assurance and Reporting was significant with regard to the number of tracking
predictions made by the participants, but not in the predicted direction.
The results of the analysis of CONFIDENCE indicated that participant confidence
was not affected by the treatments.
4.4.6.2 Perception (H2, H3 & H4)
The effect of Reporting and Assurance was tested on the perception dependent
variables, SOURCE CREDIBILITY and INFORMATION RELIABILITY using
between-subjects MANCOVA. Covariates that were identified as significant in the
preliminary MANCOVA were included in the reduced MANCOVA model for hypothesis
testing. The results of the overall MANCOVA are reported in Table 15, Panel A. After
controlling for 'Plan Future Investments', Number of Accounting Courses Taken, System
Trust and Information Relevance, the main effect of Reporting was not significant
(Wilks' Lambda=.985, p-value=.779), the main effect of Assurance was significant
(Wilks' Lambda =.812, p-value=.002) and the interaction term was significant (Wilks'
Lambda =.883, p-value=.031). This was an indication of lack of support for H2a and
H4a, but an indication of support for H2b, H2c, H4b and H4c. The individual
MANCOVA results for SOURCE CREDIBILITY and INFORMATION RELIABILITY

101
were subsequently examined to determine if either of the dependent variables was
significantly affected by the independent variables to require subsequent tests of H2b,
H2c, H4b and H4c.
4.4.6.2.1 Source Credibility (H2a, b, c)
SOURCE CREDIBILITY is the perceived credibility of the source of the
information provided in the decision periods. H2 tests the effect of Reporting and
Assurance on SOURCE CREDIBILITY. H2a tests the main effect of Reporting, H2b
tests the main effect of Assurance and H1c tests the interaction term. H2d tests the effect
of SOURCE CREDIBILITY on INFORMATION VALUE. The preliminary
MANCOVA showed no significant effect of the treatments on SOURCE CREDIBILITY.
See Table 14, Panel F. As a result, H2a, b, and c were not tested by separate ANCOVA
and SOURCE CREDIBILITY was not included in the OLS regression analysis of
INFORMATION VALUE to test H2d.
The descriptive statistics for SOURCE CREDIBILITY are presented in Table 21,
showing cell size, mean, standard deviation, variance and range by grouping for the main
effect of Reporting, the main effect of Assurance and for the interaction of the two
treatments and are briefly discussed with regard to the hypotheses. The MANCOVA
results for SOURCE CREDIBILITY indicated that it was not significantly affected by the
independent variables and it was not separately analyzed for hypothesis testing. A brief
discussion of the descriptive statistics in relation to the hypotheses follows.
H2a predicted that source credibility would be perceived to be higher for
continuously reported information than for periodically reported information. The mean

102
for Continuous Reporting (4.56) was lower than the mean for Periodic Reporting (4.69),
opposite to the predicted direction. However, the difference was not statistically
significant.
H2b predicted that source credibility would be perceived to be higher when
assurance was present than when it was absent. The mean for With Assurance (4.63) was
higher than the mean for No Assurance (4.61), in agreement with the predicted direction.
However, the difference in the means was not statistically significant.
TABLE 21 SOURCE CREDIBILITY DESCRIPTIVE STATISTICS
Assurance No Assurance With Assurance Total Reporting
Reporting: Periodic Reporting
N=20 Mean=4.68 Std Dev=0.73 Var=0.54 Range: 3.67 - 5.83
N=19 Mean=4.70 Std Dev=0.92 Var=0.84 Range: 3.67 - 6.17
N=39 Mean=4.69 Std Dev=0.82 Var=0.67 Range: 3.67 - 6.17
Continuous Reporting
N=20 Mean=4.55 Std Dev=0.89 Var=0.79 Range: 2.00 - 6.00
N=22 Mean=4.57 Std Dev=0.51 Var=0.26 Range: 3.33 - 5.50
N=42 Mean=4.56 Std Dev=0.71 Var=0.50 Range: 2.00 - 6.00
Total Assurance
N=40 Mean=4.61 Std Dev=0.81 Var=0.65 Range:2.00 - 6.00
N=41 Mean=4.63 Std Dev=0.72 Var=0.52 Range:3.33 - 6.17

103
H2c predicted that source credibility would be higher in the condition of
continuous reporting and the presence of assurance. Examination of the four treatment
cells indicated that the highest mean was for the Periodic Reporting, With Assurance
condition, not in agreement with the prediction. The differences in the means were not
statistically significant.
4.4.6.2.2 Information Reliability (H4a, b, c)
INFORMATION RELIABILITY is the perceived reliability of the information
provided in the decision periods. H4 tests the effect of Reporting and Assurance on
INFORMATION RELIABILITY. H4a tests the main effect of Reporting, H4b tests the
main effect of Assurance and H4c tests the interaction term. H4d tests the effect of
INFORMATION RELIABILITY on INFORMATION VALUE and was tested using
OLS regression. The overall MANCOVA results indicated the interaction term was
statistically significant for INFORMATION RELIABILITY and a subsequent univariate
analysis was performed.
The descriptive statistics for INFORMATION RELIABILITY are presented in
Table 22, showing cell size, mean, standard deviation, variance and range by grouping
for the main effect of Reporting, the main effect of Assurance and for the interaction of
the two treatments.
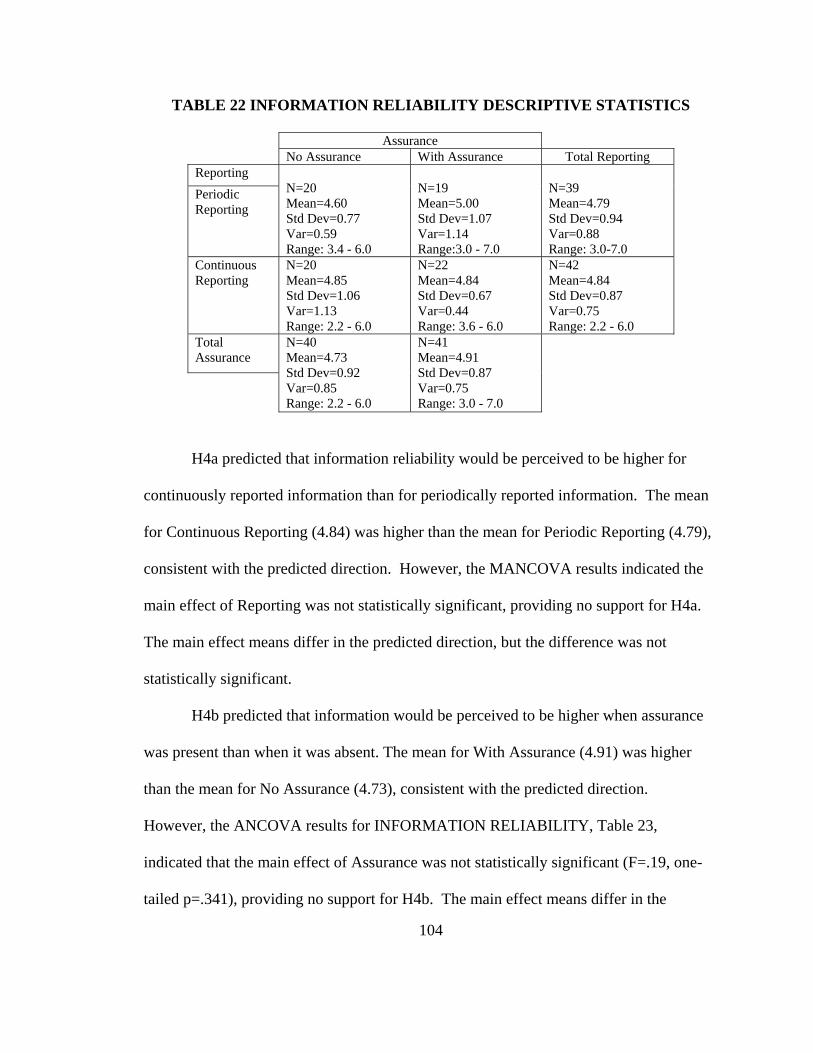
104
TABLE 22 INFORMATION RELIABILITY DESCRIPTIVE STATISTICS
Assurance No Assurance With Assurance Total Reporting
Reporting Periodic Reporting
N=20 Mean=4.60 Std Dev=0.77 Var=0.59 Range: 3.4 - 6.0
N=19 Mean=5.00 Std Dev=1.07 Var=1.14 Range:3.0 - 7.0
N=39 Mean=4.79 Std Dev=0.94 Var=0.88 Range: 3.0-7.0
Continuous Reporting
N=20 Mean=4.85 Std Dev=1.06 Var=1.13 Range: 2.2 - 6.0
N=22 Mean=4.84 Std Dev=0.67 Var=0.44 Range: 3.6 - 6.0
N=42 Mean=4.84 Std Dev=0.87 Var=0.75 Range: 2.2 - 6.0
Total Assurance
N=40 Mean=4.73 Std Dev=0.92 Var=0.85 Range: 2.2 - 6.0
N=41 Mean=4.91 Std Dev=0.87 Var=0.75 Range: 3.0 - 7.0
H4a predicted that information reliability would be perceived to be higher for
continuously reported information than for periodically reported information. The mean
for Continuous Reporting (4.84) was higher than the mean for Periodic Reporting (4.79),
consistent with the predicted direction. However, the MANCOVA results indicated the
main effect of Reporting was not statistically significant, providing no support for H4a.
The main effect means differ in the predicted direction, but the difference was not
statistically significant.
H4b predicted that information would be perceived to be higher when assurance
was present than when it was absent. The mean for With Assurance (4.91) was higher
than the mean for No Assurance (4.73), consistent with the predicted direction.
However, the ANCOVA results for INFORMATION RELIABILITY, Table 23,
indicated that the main effect of Assurance was not statistically significant (F=.19, one-
tailed p=.341), providing no support for H4b. The main effect means differ in the

105
predicted direction but the difference was not statistically significant.
H4c predicted that information reliability would be higher in the condition of
continuous reporting and the presence of assurance. Examination of the four treatment
cell means showed the highest mean to be the Periodic Reporting, With Assurance
treatment group and the lowest mean to be the Periodic Reporting, No Assurance group.
The ANCOVA results for INFORMATION RELIABILITY, Table 23 indicated the
interaction term was not statistically significant (F=1.56, one-tailed p=.108), providing no
support for H4c.
TABLE 23 ANCOVA RESULTS FOR REPORTING AND ASSURANCE ON
INFORMATION RELIABILITY
Variable^
DF
Sum of Squares
Mean Squares
F Statistic
P-Value#
Reporting 1 0.16 0.16 0.29 0.590 Assurance 1 0.09 0.09 0.17 0.341## Reporting X Assurance 1 0.82 0.82 1.56 0.108## Number of Accounting Courses Taken
1 7.46
7.46
14.14
<0.001
System Trust 1 17.53 17.53 33.25 <0.001 Model 5 24.58 4.92 9.32 <0.001 Error 75 39.55 0.53 Corrected Total 80 64.13 ^ Reporting: Treatment, either periodic reporting or continuous reporting. Assurance: Treatment, either without assurance or with assurance. Reporting X Assurance: Treatment, interaction term. Number of Accounting Courses Taken: Number of accounting course participant had taken. System Trust: Trust in the information delivery mechanism. #P-Values are two-tailed tests unless otherwise indicated. ##P-Values are one-tailed tests.
4.4.6.2.3 Information Value (H3a, H3b & H3c)
H3a tests the effect of Timeliness (Reporting) on INFORMATION VALUE. H3b
tests the effect of SOURCE CREDIBILITY on INFORMATION VALUE. H3c tests the

106
effect of INFORMATION RELIABILITY on INFORMATION VALUE. SOURCE
CREDIBILITY and INFORMATION RELIABILITY were found to be insignificant in
previous tests of H2 and H4 and were not included in the OLS regression model to test
H3b and H3c. Reporting was included as the proxy for Time as an explanatory variable
for the OLS regression analysis of INFORMATION VALUE to test H3a. Also included
were the covariates identified as significant in explaining the variation in
INFORMATION VALUE (See Table 7).
H3a predicted that information that is continuously reported would be associated
with higher perceived value than information that is periodically reported. The
descriptive statistics for INFORMATION VALUE at each of the two levels of Reporting
(periodic reporting and continuous reporting) are presented in Table 24. The statistics
indicate that the mean of INFORMATION VALUE was higher for the Continuous
Reporting group (4.13) than for the Periodic Reporting group (3.94) and the standard
deviation was lower (1.25) than that of the Periodic Reporting group (1.54). This was an
indication that different levels of reporting frequency were associated with different
levels of INFORMATION VALUE, in agreement with the predicted direction. The
statistical significance of the association was tested in the regression analysis.

107
TABLE 24 INFORMATION VALUE DESCRIPTIVE STATISTICS
Reporting: Periodic Reporting
N=39 Mean=3.94 Std Dev=1.52 Var=2.30 Range: 1.0 - 6.0
Continuous Reporting
N=42 Mean=4.13 Std Dev=1.25 Var=1.57 Range: 1.0 - 6.0
The analysis of INFORMATION VALUE, testing H3a, was performed using
OLS regression. Reporting was included in the regression analysis as the proxy for
Timeliness, at two levels: Periodic or Continuous. Correlation analysis indicated that
CONFIDENTBASE, age, 'Previous Investments in Common Stock,' System Trust, Lotto
and High Risk were potentially useful covariates in the analysis of INFORMATION
VALUE. See Table 7. The potential covariates were included in the full regression model
and insignificant covariates were removed in development of the reduced regression
model. The initial full model was tested and revealed that Age, High Risk, 'Previous
Investments in Common Stock' and CONFIDENTBASE were significant covariates for
INFORMATION VALUE.
The reduced final regression model was tested and the results are reported in
Table 25. The coefficient for Reporting (-0.12, t-statistic -0.44, p-value 0.330) was not
statistically significant, indicating that there was no statistically significant evidence of an
association between the reporting type (continuous or periodic) and INFORMATION
VALUE. The adjusted R-sq of the model is 0.23. The coefficients for Age (-0.05), High

108
Risk (-0.19), 'Previous Investment in Common Stock' (-0.88) and CONFIDENTBASE
(0.02) were all statistically significant. There was no support for H3.
TABLE 25 INFORMATION VALUE REGRESSION ANALYSIS TESTING H3A (H3b and H3c found to be non-significant)
INFORMATION VALUE = Intercept + Reporting + Age + High Risk + Previous
Investments in Common Stock + CONFIDENTBASE + error term
Variable^
Coefficient-Hypothesis
Predicted Sign
B Coefficients
t-statistic
p-value#
Intercept 5.84 4.40 <0.001 Reporting b1 = H3 + -0.12 -0.47 0.330## Age b2 = Covariate n/a -0.05 -1.80 0.034 High Risk b3 = Covariate n/a -0.19 -1.93 0.028 Previous Investments in Common Stock
b4 = Covariate
n/a
-0.88
-2.71
0.012
CONFIDENTBASE b5 = Covariate n/a 0.02 3.24 0.002 Adjusted R-Sq 0.23 ^Reporting: Timeliness, either periodic reporting or continuous reporting. Age: Participants' age in years. High Risk: Asked question about participant's risk tolerance. Previous Investments in Common Stock: Asked participants if they had ever bought or sold shares of common stock. CONFIDENTBASE: Average self reported confidence in predictions during base period. #P-Values are two-tailed unless otherwise indicated. ##P-Values are one-tailed.
The results of the covariate association with the dependent variable indicated that
older, less risk tolerant participants with previous experience investing in common stocks
had a lower perception of the value of the information. A higher level of confidence in
the base period predictions was also associated with a higher perception of the value of
the information.

109
4.4.6.2.4 Summary of Perception
The analysis of the perception dependent variables showed that participant's
perception of the credibility of the information's source, the reliability of the information
and the value of the information were not significantly affected by the independent
variables.
4.4.7 Power Analysis
A power analysis was conducted for each of the hypotheses. SAS was utilized to
calculate the observed power, which is a measure of the "probability of rejecting the null
hypothesis when the alternative hypothesis is true" (SAS, 2007). An alpha level of .05
was utilized. The power analysis for PREDICTION indicated the power of the main
effect of Reporting was .076, the main effect of Assurance was .973 and the interaction
term was .161. The analysis of TRACKING indicated the power of the main effect of
Reporting was .088, the main effect of Assurance was .263 and the interaction term was
.473. For CONFIDENCE, the power of the main effect of Reporting was .200, the main
effect of Assurance was .061 and the interaction term was .053. The power analysis for
SOURCE CREDIBILITY indicated the power of the main effect of Reporting was .115,
the main effect of Assurance was .052 and the interaction term was .050. The power
analysis for INFORMATION RELIABILITY indicated the power for the main effect of
Reporting was .055, the main effect of Assurance was .158 and the interaction term was
.175. With the exception of the power of the main effect of Assurance on PREDICTION
and the power of the interaction term on TRACKING, the power of the effect of the
independent variables on the dependent variables was very low.

110
4.5 Post Hoc Analysis
In order to more fully explore the various concepts of Performance and
Perception, several post hoc analyses were performed. More specifically, the Difonza
and Bordia (1997) findings are discussed further with respect to TRACKING. An
analysis of the Financial Information Item Rankings and Percentage of Reliance data
captured in the post-test questionnaire is also discussed.
Perception is then further analyzed by examining the components of SOURCE
CREDIBILITY and INFORMATION VALUE.
4.5.1 Tracking Revisited
The main analysis of TRACKING indicated that there were few significant
differences in the means of the treatment groups. Secondary analysis indicated that there
were significant differences between the base level and the treatment level for the
dependent variable. One of the concerns addressed in this study is the potential for
additional information to overwhelm the individual investor and degrade the quality of
the investment decisions. Difonza and Bordia (1997) found that investors who were
provided with information in addition to the stock price data tended to be distracted from
the tracking pattern exhibited by their less informed counterparts (who had to rely on the
stock price data alone for their investment decisions) and to make fewer investment
decisions in line with the tracking behavior. As a result, they made more investment
changes and less profitable decisions. What is not known is why the investors change
their behavior. Difonza and Bordia (1997) conjectured that it may be the result of the

111
investors' lack of understanding of the information and/or their inability to adequately
incorporate it into their decision model.
The inclusion of the base level in the current study allowed for an examination of
the participant's initial predictions to see if they followed the tracking pattern. Table 26
presents the mean, standard deviation and variance for the base level measure of tracking
(TRACKBASE) and for the treatment level measure of tracking (TRACKING). Analysis
of the base level shows the tracking behavior was moderate, with the means indicating
that around 14 out of 30 predictions were in line with the behavior pattern. The standard
deviation and variance indicate a moderate level of dispersion. Analysis of the treatment
level shows a marked deviation from the tracking behavior, with the means indicating
that only about 8-11 out of 30 predictions were in line with the behavior pattern. The
standard deviation and variance indicate a more pronounced level of dispersion in each of
the treatment cells. Each of the treatment level cells indicated deterioration in the tracking
behavior compared to the base level, an indication that the participants were attending to
the additional information and incorporating it into their prediction decisions. The
greatest dispersion was evident in the continuous reporting with assurance cell, which
was the cell with the highest level of information provided to the participants. The
deterioration in the tracking pattern found in the current study is similar to the Difonza
and Bordia (1997) findings. Potentially, the findings are an indication that investors
could be adversely affected by increased levels of financial reporting and/or assurance.

112
TABLE 26 DIFFERENCES IN BASE AND TREATMENT FOR TRACKING (Mean, Std. Dev., Var.)
REPORTING Periodic Periodic Continuous Continuous ASSURANCE No Assurance Assurance No Assurance Assurance TRACKING: BASE (TRACKBASE)
14.35 2.39 5.71
13.84 1.80 3.25
14.45 2.61 6.79
13.82 2.38 5.68
TREATMENT (TRACKING)
11.35 3.72 13.82
8.32 3.46 12.00
10.10 3.97 15.78
10.64 5.21 27.91
DIFFERENCE 3.10 -1.33 -8.11
5.50 -1.66 -8.75
4.35 -1.36 -8.99
3.18 -2.83 -22.23
All cells indicate deterioration in the TRACKING pattern through decreased mean and increased std. dev. and variance. The largest degree of deterioration appears in the CRA cell.
4.5.2 Financial Information Item Analysis
Data were collected in the current study regarding the participants' self-reported
use of the items of information provided during the task. Participants were asked to rank
the twelve items of information from 1 to 12, with 1 assigned to the item they found most
important in performing the task and 12 assigned to the item they found least important.
Table 27 shows the summary of these data by treatment group. The total score for each
item was derived by summing the rankings assigned to each item by the participants in
the group. The average score was derived by dividing the total score by the number of
participants in the group. The average score was used to determine the rank of each item,
with the lower score awarded the higher ranking (1 = highest, 12 = lowest). The ranking
for the three highest ranked items was fairly consistent across the treatment groups: price
percentage change (from the previous day) was ranked number 1 by all groups, today’s
stock price was ranked number 2 by three of the groups and ‘earnings per share’ was
ranked number 3 by three of the groups. The remaining item rankings were fairly

113
inconsistent across the groups. The results of the participants’ rankings were an
indication that the participants remained fixated on the stock price data (price percentage
change and today’s stock price) and earnings per share and did not give much attention to
the other items.
The participants were also asked to indicate which of the twelve information
items they relied upon the most when performing the task by dividing 100% among the
twelve items. Table 28 reports the results of the information items reliance, summarized
by treatment group. Average reliance was derived by averaging the reported reliance for
each information item for each treatment group and a ranking was assigned to the items
based on the average reliance. The higher the average reliance, the higher the rank (1 =
highest, 12 = lowest). Similar to the participants’ rankings results, price percentage
change, today’s stock price and ‘earnings per share’ were the three items most relied
upon, with consistency across the treatment groups. The combined average reliance
percentage for these three items was about 70-73% for the periodic reporting groups and
about 52-62% for the continuous reporting groups and further indicated that the
participants appeared to be fixated on a few of the information items. The continuous
reporting groups percentage of reliance on the top three was less than the periodic
reporting groups, which was an indication of their attention being more dispersed among
the information items than the periodic reporting groups.
Fixation on a limited subset of the information items may be an indication of
information overload or may have been caused by a lack of familiarity with the
information items. The limited results of the main analysis may be related to the fixation.

114
TABLE 27 INFORMATION ITEMS RANKING
Information Item Ranking from 1 to 12
Periodic Reporting/No Assurance
Periodic Reporting/With Assurance
Continuous Reporting/No Assurance
Continuous Reporting/With Assurance
Today’s Stock Price: Total Score Average Score Rank
76 3.8 2
54 2.84 2
105 5.25 3
84 3.82 2
Price Percentage Change: Total Score Average Score Rank
43 2.15 1
39 2.05 1
60 3.00 1
81 3.68 1
Earnings Per Share: Total Score Average Score Rank
99 1.95 3
94 4.95 3
91 4.55 2
93 4.23 3
Return on Equity: Total Score Average Score Rank
131 6.55 6
112 5.89 4
125 6.25 5
137 6.23 5
Inventory: Total Score Average Score Rank
205 10.25 12
174 9.16 11
189 9.45 12
179 8.09 10
Sales: Total Score Average Score Rank
136 6.80 8
124 6.53 6
100 5.00 4
132 6.00 4
Current Ratio: Total Score Average Score Rank
163 8.15 10
117 6.16 5
145 7.25 8
154 7.00 7
Debt to Equity Ratio: Total Score Average Score Rank
137 6.70 7
133 7.00 7
134 6.70 6
172 7.82 9
Accounts Receivable: Total Score Average Score Rank
204 10.2 11
182 9.58 12
159 7.5 10
188 8.55 12
Gross Profit Ratio: Total Score Average Score Rank
126 6.30 5
143 7.53 8
142 7.10 7
167 7.59 8
Return on Assets: Total Score Average Score Rank
136 6.80 9
162 8.53 10
146 7.30 9
186 8.45 11
Operating Income: Total Score Average Score Rank
107 5.35 4
148 7.79 9
164 8.20 11
144 6.55 6
Total Score: Sum of the rankings across each cell (the lower the score, the ‘higher’ ranked). Average Score: Average of the rankings across each cell (the lower the score the ‘higher’ ranked).Rank: Based on the Average Score for each cell, the lower the score, the ‘higher’ the ranking.1 is the highest rank, 12 is the lowest.

115
TABLE 28 INFORMATION ITEMS RELIANCE
Information Item Average Reliance out of 100% Ranking from 1 to 12
Periodic Reporting/No Assurance
Periodic Reporting/With Assurance
Continuous Reporting/No Assurance
Continuous Reporting/With Assurance
Today’s Stock Price: Average Reliance Reliance Rank
27.25 2
32.37 1
17.25 2
29.37 1
Price Percentage Change: Average Reliance Reliance Rank
36.25 1
32.32 2
26.60 1
25.50 2
Earnings Per Share: Average Reliance Reliance Rank
6.75 3
8.16 3
8.15 3
7.18 3
Return on Equity: Average Reliance Reliance Rank
3.00 8
4.21 5
7.25 5
5.68 6
Inventory: Average Reliance Reliance Rank
1.00 12
2.21 10
2.85 12
3.50 9
Sales: Average Reliance Reliance Rank
5.00 6
3.79 7
7.35 4
6.00 5
Current Ratio: Average Reliance Reliance Rank
2.85 9
4.47 4
5.10 9
4.18 7
Debt to Equity Ratio: Average Reliance Reliance Rank
3.10 7
3.79 6
6.30 7
3.50 8
Accounts Receivable: Average Reliance Reliance Rank
1.10 11
1.74 6
3.50 10
3.05 10
Gross Profit Ratio: Average Reliance Reliance Rank
6.55 4
2.63 9
6.50 6
2.41 11
Return on Assets: Average Reliance Reliance Rank
1.75 10
1.74 11
6.10 8
2.32 12
Operating Income: Average Reliance Reliance Rank
5.40 5
2.72 8
3.05 11
7.05 4
Average Reliance: The average assigned reliance across the cell (the larger the average the ‘higher’ the ranking). Reliance Rank: The rank assigned based on the relative average reliance across the cell. 1 is the highest rank, 12 is the lowest.

116
4.5.3 Components of Source Credibility
SOURCE CREDIBILITY was composed of six individual items that consisted of
three questions regarding source expertise and three questions regarding source
trustworthiness (McCroskey and Teven, 1999). Principal components analysis revealed
that the items load appropriately on two separate constructs. Subsequently, each of the
sets of three items was averaged to split SOURCE CREDIBILITY into EXPERTISE and
TRUSTWORTHY, which were each evaluated as a dependent variable. Correlation
analysis showed System Trust to be correlated with EXPERTISE (Pearson coefficient =
0.306, p-value = <.006) and also to be correlated with TRUSTWORTHY (Pearson
coefficient =0.405, p-value = <0.001). The two newly defined dependent variables were
significantly correlated (Pearson coefficient = 0.522, p-value = <.001) and were analyzed
using MANCOVA, including the referent covariates, to test H2a, b and c. The results of
the MANCOVA are reported in Table 29, Panel A. The overall results indicated that the
main effect for Reporting (Wilks' Lambda=0.928, p-value=.061) was significant, but the
main effect of Assurance (Wilks' Lambda=0.994, p-value=.799) and the interaction term
(Wilks' Lambda=0.978, p-value=.444) were not significant. Table 29, Panel B reports the
results for EXPERTISE, which showed no significant effect of Reporting (F=.00, one-
tailed p-value=.484), Assurance (F=.31, one-tailed p-value=.288) or the interaction term
(F=.71, one-tailed p-value=.210). However, the ANCOVA for TRUSTWORTHY, Table
29, Panel C, showed significance for the main effect of Reporting (F=4.44, one-tailed p-
value=.019) though no significant effect from Assurance (F=.00, one-tailed p-value

117
=.477) or the interaction term (F=.21, one-tailed p-value=.326), indicating partial support
for H2a.
TABLE 29 POST HOC MANCOVA: RESULTS FOR REPORTING AND ASSURANCE ON COMPONENTS OF SOURCE CREDIBILITY- EXPERTISE
AND TRUSTWORTHY Panel A. Post Hoc MANCOVA Results for Reporting and Assurance on Components of
SOURCE CREDIBILITY - EXPERTISE and TRUSTWORTHY
Variable Wilks' Lambda F Statistic P Value# Reporting 0.928 2.90 0.061 Assurance 0.994 0.22 0.799 Reporting X Assurance 0.978 0.82 0.444 #P-Values are two-tailed tests.
Panel B. Post Hoc ANCOVA Results for Reporting and Assurance on EXPERTISE
Variable^
DF
Sum of Squares
Mean Squares
F Statistic
P-Value
Reporting 1 0.00 0.00 0.00 0.484## Assurance 1 0.22 0.22 0.31 0.288## Reporting X Assurance 1 0.50 0.50 0.71 0.201## System Trust 1 5.87 5.87 8.38 0.005# Model 4 6.30 1.58 2.25 0.071# Error 76 53.17 0.70 Corrected Total 80 59.47 ^See Panel C for variable descriptions. #P-Values are two-tailed tests. ##P-Values are one-tailed tests.

118
Panel C. Post Hoc ANCOVA Results for Reporting and Assurance on TRUSTWORTHY
Variable^
DF
Sum of Squares
Mean Squares
F Statistic
P-Value
Reporting 1 2.86 2.86 4.44 0.019##* Assurance 1 0.00 0.00 0.00 0.477## Reporting X Assurance 1 0.13 0.13 0.21 0.326## System Trust 1 10.78 10.78 16.72 <0.001# Model 4 13.18 3.29 5.11 0.001# Error 76 48.99 0.64 Corrected Total 80 62.17 ^Reporting: Treatment, either periodic reporting or continuous reporting. Assurance: Treatment, either without assurance or with assurance. Reporting X Assurance: Treatment, interaction term. System Trust: Trust in the information delivery mechanism. #P-Values are two-tailed tests. ##P-Values are one-tailed tests. *Significant at .05.
The descriptive statistics for EXPERTISE are shown in Table 30 and for
TRUSTWORTHY in Table 31. Examination of the TRUSTWORTHY means for the
main effect of Reporting indicated that the Periodic Reporting mean (4.77) was higher
than the Continuous Reporting mean (4.46). This indicated that the participants in the
Periodic Reporting condition perceived the source of the information to be more
trustworthy than in the Continuous Reporting condition. This finding is opposite to the
predicted direction of H2a, thus no support was found for H2a.
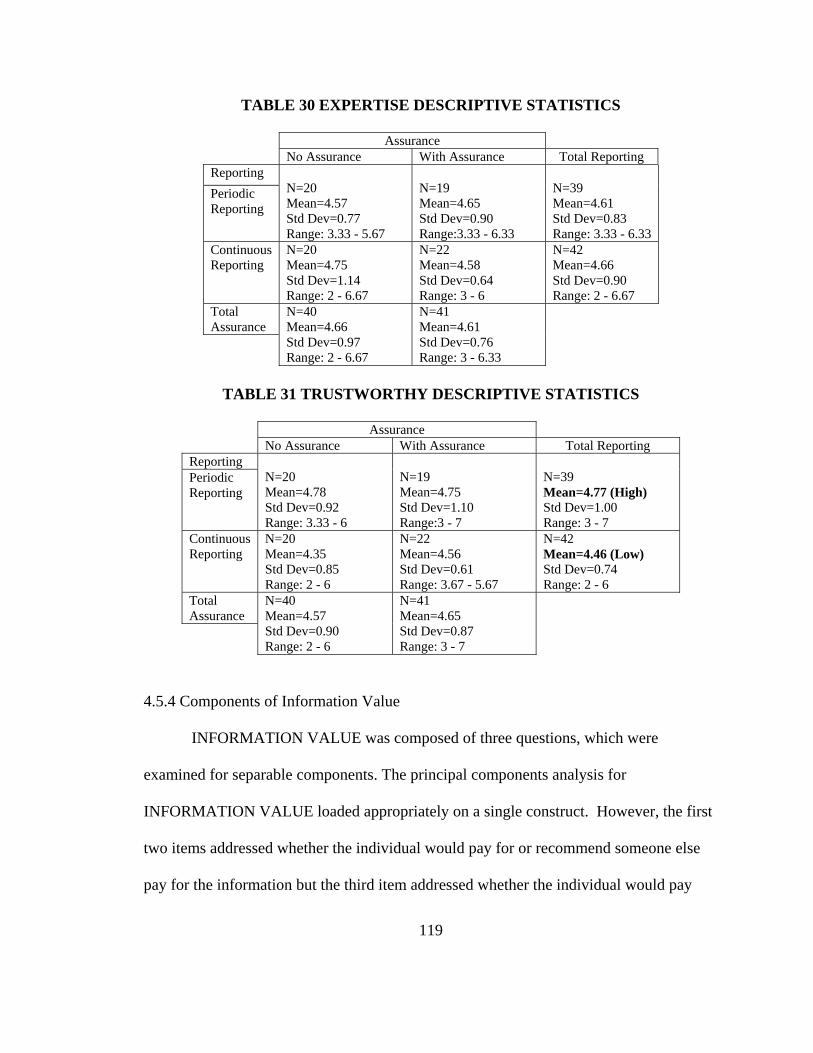
119
TABLE 30 EXPERTISE DESCRIPTIVE STATISTICS
Assurance No Assurance With Assurance Total Reporting
Reporting Periodic Reporting
N=20 Mean=4.57 Std Dev=0.77 Range: 3.33 - 5.67
N=19 Mean=4.65 Std Dev=0.90 Range:3.33 - 6.33
N=39 Mean=4.61 Std Dev=0.83 Range: 3.33 - 6.33
Continuous Reporting
N=20 Mean=4.75 Std Dev=1.14 Range: 2 - 6.67
N=22 Mean=4.58 Std Dev=0.64 Range: 3 - 6
N=42 Mean=4.66 Std Dev=0.90 Range: 2 - 6.67
Total Assurance
N=40 Mean=4.66 Std Dev=0.97 Range: 2 - 6.67
N=41 Mean=4.61 Std Dev=0.76 Range: 3 - 6.33
TABLE 31 TRUSTWORTHY DESCRIPTIVE STATISTICS
Assurance
No Assurance With Assurance Total Reporting Reporting Periodic Reporting
N=20 Mean=4.78 Std Dev=0.92 Range: 3.33 - 6
N=19 Mean=4.75 Std Dev=1.10 Range:3 - 7
N=39 Mean=4.77 (High) Std Dev=1.00 Range: 3 - 7
Continuous Reporting
N=20 Mean=4.35 Std Dev=0.85 Range: 2 - 6
N=22 Mean=4.56 Std Dev=0.61 Range: 3.67 - 5.67
N=42 Mean=4.46 (Low) Std Dev=0.74 Range: 2 - 6
Total Assurance
N=40 Mean=4.57 Std Dev=0.90 Range: 2 - 6
N=41 Mean=4.65 Std Dev=0.87 Range: 3 - 7
4.5.4 Components of Information Value
INFORMATION VALUE was composed of three questions, which were
examined for separable components. The principal components analysis for
INFORMATION VALUE loaded appropriately on a single construct. However, the first
two items addressed whether the individual would pay for or recommend someone else
pay for the information but the third item addressed whether the individual would pay

120
more for the stock of a company that offered the information. In order to separate the
responses and analyze the two issues, INFORMATION VALUE was split into PAYREC
(first two items) and HIGHERSTOCKPRICE (third item) for further analysis of H3.
Correlation analysis indicated 'Previous Investments in Common Stock' (Pearson
coefficient = 0.264, p-value = 0.017 ), Age (Pearson coefficient = -0.243, p-value =
0.029), High Risk (Pearson coefficient = -0.205, p-value = 0.066), and
CONFIDENTBASE (Pearson coefficient = 0.286, p-value = 0.009) were correlated with
PAYREC and Lotto (Pearson coefficient = -0.225, p-value = 0.044), High Risk (Pearson
coefficient = -0.308, p-value = .005), System Trust ( Pearson coefficient = 0.258, p-value
= 0.020), Gender (Pearson coefficient = 0.220, p-value = 0.050 ) and 'Previous
investments in Common Stock' (Pearson coefficient = -0.372, p-value = <.001 ) were
correlated with HIGHERSTOCKPRICE. Regression analysis was then performed on
each of the two components of INFORMATION VALUE, reducing the model to identify
the useful covariates.
The regression for PAYREC found no significance for Reporting (one-tailed
p=.418) in a reduced model that included Reporting, Age, 'Previous Investments in
Common Stock' and CONFIDENTBASE (Adjusted R-sq=.18). See Table 32.

121
TABLE 32 POST HOC INFORMATION VALUE COMPONENT PAYREC REGRESSION ANALYSIS TESTING H3A
PAYREC = Intercept + Reporting + Age + Previous Investments in Common Stock +
CONFIDENTBASE + error term
Variable^ Coefficient-Hypothesis
Predicted Sign
B Coefficients
t-statistic p-value#
Intercept 4.78 5.16 <0.001 Reporting b1 = H3 + -0.07 -0.21 0.418## Age b2 = Covariate n/a -0.06 -2.21 0.039 Previous Investments in Common Stock
b3 = Covariate
n/a
-0.81
-2.12
0.037
CONFIDENTBASE b4 = Covariate n/a 0.03 3.40 <0.001 Adjusted R-Sq 0.18 ^Reporting: Timeliness, either periodic reporting or continuous reporting. Age: Participants' age in years. Previous Investments in Common Stock: Asked participants if they had ever bought or sold shares of common stock. CONFIDENTBASE: Average self reported confidence in predictions during base period. #P-Values are two-tailed unless otherwise indicated. ##P-Values are one-tailed.
The regression for HIGHERSTOCKPRICE also indicated that Reporting was not
significant (one-tailed p=.332) in a reduced model that included Reporting, High Risk,
gender and 'Previous Investments in Common Stock' (Adjusted R-sq=.18). See Table 33.
The results indicate no support for H3a for either of the two components of
INFORMATION VALUE.

122
TABLE 33 POST HOC INFORMATION VALUE COMPONENT HIGHERSTOCKPRICE REGRESSION ANALYSIS TESTING H3A
HIGHERSTOCKPRICE = Intercept + Reporting + High Risk + Gender +Previous
Investments in Common Stock + error term
Variable^
Coefficient-Hypothesis
Predicted Sign
B Coefficients
t-statistic p-value#
Intercept 5.68 5.33 <0.001 Reporting b1 = H3 + 0.15 0.44 0.332## High Risk b2 = Covariate n/a -0.23 -1.96 0.053 Gender b3 = Covariate n/a 0.57 1.71 0.092 Previous Investments in Common Stock
b4 = Covariate
n/a
-1.18
-3.06
0.003
Adjusted R-Sq 0.18 ^Reporting: Timeliness, either periodic reporting or continuous reporting. High Risk: Asked question about participant's risk propensity. Gender: Male or female. Previous Investments in Common Stock: Asked participants if they had ever bought or sold shares of common stock. #P-Values are two-tailed unless otherwise indicated. ##P-Values are one-tailed.
4.5.5 Trustworthy and Information Value
Although the results for Reporting on TRUSTWORTHY discussed in section
4.5.3 were not in the predicted direction, further exploration of the relationship between
TRUSTWORTHY and the components of INFORMATION VALUE was deemed to be
worthwhile to investigate if there was any evidence that the increased perceived
trustworthiness in the source of financial information related to more frequent reporting
might also be associated with an increase in either of the two components of perceived
value of the information. Regression analysis was performed on each of the two
components of INFORMATION VALUE using TRUSTWORTHY as an explanatory
variable and including the significant covariates identified in section 4.5.4.
The regression for PAYREC found no significance for TRUSTWORTHY (one-
tailed p=.378) in a reduced model that included TRUSTWORTHY, 'Previous

123
Investments in Common Stock', Age and CONFIDENTBASE (Adjusted R-sq=.18). See
Table 34.
TABLE 34 POST HOC INFORMATION VALUE COMPONENT PAYREC REGRESSION ANALYSIS TESTING H3B
PAYREC = Intercept + TRUSTWORTHY + Age + Previous Investments in
Common Stock + CONFIDENTBASE + error term
Variable^ Coefficient-Hypothesis
Predicted Sign
B Coefficients
t-statistic p-value#
Intercept 4.91 4.51 <0.001 TRUSTWORTHY b1 = H2d + -0.06 -0.31 0.378## Age b2 = Covariate n/a -0.06 -2.09 0.040 Previous Investments in Common Stock
b3 = Covariate
n/a
-0.80
-2.10
0.039
CONFIDENTBASE b4 = Covariate n/a 0.03 3.43 0.001 Adjusted R-Sq 0.18 ^TRUSTWORTHY: Trustworthiness component of Perceived Credibility of the Source of the information. Age: Participants' age in years. Previous Investments in Common Stock: Asked participants if they had ever bought or sold shares of common stock. CONFIDENTBASE: Average self reported confidence in predictions during base period. #P-Values are two-tailed unless otherwise indicated. ##P-Values are one-tailed.
The regression for HIGHERSTOCKPRICE indicated that TRUSTWORTHY was
significant (one-tailed p=.006) in a reduced model that included TRUSTWORTHY, High
Risk and 'Previous Investments in Common Stock' (Adjusted R-sq=.22). See Table 35.
The results indicate partial support for H3b. The results suggest that investors would be
willing to pay a higher price for stock in a company that offered increased levels of
information reporting. The significance of the covariates indicated that the increased
willingness to pay a higher stock price was also related to the risk tolerance and previous
investing experience of the investors.

124
TABLE 35 POST HOC INFORMATION VALUE COMPONENT
HIGHERSTOCKPRICE REGRESSION ANALYSIS TESTING H3B
HIGHERSTOCKPRICE = Intercept + TRUSTWORTHY + High Risk + Previous Investments in Common Stock + error term
Variable^
Coefficient-Hypothesis
Predicted Sign
B Coefficients
t-statistic p-value#
Intercept 5.13 5.25 <0.001 TRUSTWORTHY b1 = H2d + 0.43 2.35 0.006##* High Risk b2 = Covariate n/a -0.29 -2.57 0.012 Previous Investments in Common Stock
b4 = Covariate
n/a
-1.26
-3.33
0.022
Adjusted R-Sq 0.22 ^TRUSTWORTHY: Trustworthiness component of Perceived Credibility of the Source of the information. High Risk: Asked question about participant's risk propensity. Previous Investments in Common Stock: Asked participants if they had ever bought or sold shares of common stock. #P-Values are two-tailed unless otherwise indicated. ##P-Values are one-tailed. *Significant at .01.
125
5.0 SUMMARY AND CONCLUSION 5.1 Summary
This study was designed to examine the impact of different levels of reporting
frequency (periodic versus continuous) of financial information, both with and without
assurance, on individual investors in a stock price prediction task. Reporting was
manipulated at two levels: periodic reporting and continuous reporting. Assurance was
manipulated at two levels: no assurance and with assurance. In addition, a base level
condition was included for each participant that included only the stock price and percent
of change data. It was predicted that increased levels of reporting would lead to different
levels of performance, increased levels of assurance would lead to higher levels of
performance and the interaction of the two independent variables would lead to higher
levels of performance. Performance was measured using three dependent variables:
PREDICTION, TRACKING and CONFIDENCE.
Predictions were also made regarding the impact of the independent variables on
the individual investors' perceptions of the credibility of the source of the information,
the reliability of the information and the value of the information. It was predicted that
increased levels of reporting and/or assurance would lead to higher levels of perceived

126
source credibility and information reliability. Higher levels of reporting frequency
(continuous versus periodic), source credibility and information reliability were predicted
to be associated with higher levels of perceived information value.
The results of the main analysis are summarized in Table 36
The results of the analysis indicated that the main effect of Assurance was significant
with regard to the performance dependent variable PREDICTION. PREDICTION was a
measure of the number of times participants correctly predicted the change in stock price
direction. Participants in the Assurance condition (mean=16.71) made significantly more
correct predictions than participants in the No Assurance condition (mean=14.80). The
results obtained in the current study indicated that assurance has value in an environment
wherein fundamental financial data are reported either periodically or continuously. This
finding is relevant to reporting entities and regulatory agencies as the move towards
continuous reporting gains momentum – increased reporting frequency did not show a
benefit to investors unless coupled with assurance.

127
TABLE 36 SUMMARY OF FINDINGS-F STATISTIC AND P-VALUE
Hypothesis
Operational Dependent Variable
Independent Variables
Covariates
Results
Table Reference
H1a PREDICTION Reporting None Not Significant
Table 17
H1b PREDICTION Assurance None F=15.51 p=<.001#*
Table 17
H1c PREDICTION Interaction None Not Significant
Table 17
H1a TRACKING Reporting Plan future Investments System Trust
Not Significant
Table 19
H1b TRACKING Assurance Plan future Investments System Trust
Not Significant
Table 19
H1c TRACKING Interaction Plan future Investments System Trust
F=3.48@ p=0.034#**
Table 19
H1a CONFIDENCE Reporting Gender Number of Accounting Courses Taken CONFIDENTBASE
Not Significant
H1b CONFIDENCE Assurance Gender Number of Accounting Courses Taken CONFIDENTBASE
Not Significant
H1c CONFIDENCE Interaction Gender Number of Accounting Courses Taken CONFIDENTBASE
Not Significant
H2a SOURCE CREDIBILITY
Reporting System Trust Not Significant
H2b SOURCE CREDIBILITY
Assurance System Trust Not Significant
H2c SOURCE CREDIBILITY
Interaction System Trust Not Significant

128
TABLE 36 SUMMARY OF FINDINGS-F STATISTIC AND P-VALUE CONTINUED
H3a INFORMATION VALUE
Reporting Age High Risk Previous Investments in Common Stock CONFIDENTBASE
Not Significant
Table 25
H3b INFORMATION VALUE
SOURCE CREDIBILITY
Age High Risk Previous Investments in Common Stock CONFIDENTBASE
Not Significant
H3c INFORMATION VALUE
INFORMATION RELIABILITY
Age High Risk Previous Investments in Common Stock CONFIDENTBASE
Not Significant
H4a INFORMATION RELIABILITY
Reporting Number of Accounting Courses Taken System Trust
Not Significant
Table 23
H4b INFORMATION RELIABILITY
Assurance Number of Accounting Courses Taken System Trust
Not Significant
Table 23
H4c INFORMATION RELIABILITY
Interaction Number of Accounting Courses Taken System Trust
Not Significant
Table 23
@A significant difference in the means occurred, but was mixed with regard to the predicted direction, indicating partial support for the hypothesis. #One-tailed p-value (directional hypothesis) *Significant at .01. **Significant at .05.

129
The results of the analysis also indicated that the interaction of Reporting and
Assurance was significant with regard to the dependent variable TRACKING.
TRACKING was a measure of the number of times participants made stock price change
predictions in accordance with an expectation of mean-reverting stock prices - if the
stock went up today, it will go down tomorrow and if the stock price went down today it
will go up tomorrow. The differences in the means was opposite of the predicted
direction with regard to the periodic reporting condition. The number of TRACKING
predictions in the Periodic Reporting condition decreased as the level of Assurance
condition increased from No Assurance to With Assurance. However, the differences in
the means were in the predicted direction for the Continuous Reporting condition. The
number of TRACKING predictions in the Continuous Reporting condition increased as
the level of Assurance increased from No Assurance to With Assurance. This finding is a
further indication that assurance has value in the continuous reporting environment when
fundamental financial data are reported and is relevant to reporting entities and regulatory
agencies when considering the impact of continuous reporting on individual investors’
investment decision quality. Post hoc analysis on the performance dependent variable
TRACKING indicated that increased levels of reporting frequency and assurance could
adversely affect the quality of individual investors’ investment decisions, a finding that is
also relevant to reporting entities and regulatory agencies.
The results of the main analysis indicated that increased levels of reporting and
assurance were not significant with regard to individual investors’ perception of the

130
credibility of the source of the information, the reliability of the information or the value
of the information. Post hoc analysis provided some evidence that increased levels of
reporting frequency may lead to an increase in the perceived trustworthiness of the source
of the information and that the increase in perceived trustworthiness may lead to an
increased willingness to pay more for the stock of a company that provided increased
levels of reporting of fundamental financial data. Investors, however, do not appear
willing to pay for continuous reporting and assurance directly.
5.2 Implications of Findings
The presence of assurance was found to increase the number of times participants
correctly predicted the change in stock price direction (PREDICTION). The highest level
of PREDICTION performance occurred in the continuous reporting with assurance
condition, although the interaction of reporting and assurance was not significant. The
presence of assurance was also found to increase the number of times participants made
stock price predictions in an ‘expected mean-reverting’ pattern (TRACKING), but only
in the continuous reporting environment. The opposite effect was observed in the
periodic reporting environment. The highest level of TRACKING performance also
occurred in the continuous reporting with assurance condition. Analysis of the results of
the two measures of performance indicates that assurance is potentially beneficial in an
environment wherein fundamental financial data are being made available to investors on
a more frequent basis than the current reporting methods, but may have the most benefit
when the reporting is continuous than when it is periodic. Although analysis of the
treatment period did not find significant differences in the treatment groups for either

131
PREDICTION or TRACKING for reporting frequency, post hoc analysis of TRACKING
indicated that each of the treatment groups’ performance deteriorated when compared to
their performance in the base level treatment, indicating that decision quality may be
affected adversely by more frequent reporting of financial data. The continuous reporting
with assurance group showed the highest level of deterioration.
These results may indicate the impact of information overload on investors and
are potentially useful when considering regulating the more frequent reporting of
information. More frequent reporting of fundamental financial data may have an adverse
effect on investors’ decisions. If the decision is made to require or encourage companies
to provide more frequent reporting, consideration should be given to also requiring that
the information be coupled with assurance.
Although the participants did not report significantly higher perceived source
credibility, information reliability, and information value resulting from increased levels
of reporting or the presence of assurance, post hoc analysis provided some evidence that
increased levels of reporting frequency may lead indirectly to an increased willingness to
pay more for the stock of a company that reports its fundamental financial data more
frequently. This finding is of interest to corporations and to regulatory agencies when
determining who will pay for the implementation of continuous reporting and assurance.
Investors do not appear willing to pay for it directly, but corporations may choose to
voluntarily provide continuous reporting and some companies may be forced to provide
more frequent reporting in order to compete for investors.

132
Implementation of more frequent or continuous reporting is growing increasingly
possible due to advances in technology. Implementation of assurance on the more
frequently reported information is more problematic. Both investor demand and
regulations may lead to more frequent reporting. However, if companies provide more
frequent reporting but do not couple it with assurance, investors may actually end up
making poorer investment decisions than under the current reporting and auditing
environment.
5.3 Contributions
The current study took the perspective that continuous reporting and continuous
assurance represent the coming financial information reporting paradigm and provided ex
ante insight into the effect of different levels of reporting frequency and different levels
of assurance on the investment decision quality and perception of value of information of
individual investors.
The research design represents a novel approach to elicit and analyze investor
behavior in the continuous reporting and continuous assurance environment, with regard
to the reporting/assurance environment and the type of information reported. The
experimental task was implemented via a computer simulation wherein participants were
provided with either periodic or continuous reporting of fundamental financial
information on which to base stock price predictions. The research design consequently
allowed for data regarding the investors’ reactions to periodic reporting frequency
compared to continuous reporting frequency to be collected. The use of continuously
updated fundamental financial data differentiates this study from prior research.

133
Assurance on the information was also manipulated; consequently, the research
design allowed for differentiation between investors’ reaction to information from
continuous reporting without assurance compared to continuous reporting with assurance.
The research design and results provide information that is relevant to reporting
entities, regulatory agencies and software developers regarding the usefulness of
continuous reporting and the need for assurance, though the results need to be considered
in the context of other research and analysis on these issues.
5.4 Limitations
There are a number of limitations to this study. The use of a laboratory
experiment allowed for the study to be conducted in a controlled environment and added
to the internal validity of the results. However, the experiment may have had limited
realism to the participants and reduced the external validity of the results. The
experiment was similar to the stock market investment environment in some ways, but
the task was a reduced surrogate for the act of buying and selling of common stock.
The use of undergraduate accounting students as surrogates for individual
investors may limit the ability to generalize the results to the target population of
individual investors. Students have been found in prior research to be reasonable proxies
for individual investors. However, the majority of the participants in the current study
had no previous experience with investing in common stocks or mutual funds. Their lack
of experience may have lead to results that were not indicative of the way the target
population would respond to the treatments.

134
The experiment was conducted in multiple sessions over several days and the
participants were students in similar classes. The potential exists for discussion among
the participants such that some participants had prior knowledge of the experimental
materials when they performed the task.
The power analysis indicated low power of the treatments, which may have
contributed to limited results. Also, the potential cost to investors or management for the
implementation of continuous reporting and continuous assurance was not addressed.
5.5 Future Research
Future research includes planned changes to the data collection instrument to:
1) include all of the items on the source credibility scale (McCroskey and Teven, 1999),
2) collect perception ratings at the end of the base period as well as post test,
3) operationalize periodic reporting as every 5 periods instead of every 10 periods, and
4) develop manipulation check questions using Likert scales instead of open ended or
specific questions. Future data collections using investment club members, who represent
the target population, are also planned once the experimental materials have been
completed. Additional planned future research includes the reporting of business
performance data instead of, or in addition to, fundamental financial performance data
and the inclusion of costs to investors of continuous reporting and continuous assurance.
5.6 Concluding Remarks
Over the course of the dissertation process, a number of lessons were learned.
Regarding experimental design, it was found that great care should be exercised when
making changes to the design of an experiment. Originally, the base period was a
135
separate treatment group, to be used for between subjects analysis. At the proposal
defense, it was determined to be more effective to measure each participant's
performance in a base period, to allow for within subject analysis. In order to control the
length of the experiment, the perception dependent variable questions were not put into
the experiment after the base period predictions, only at the end of the experiment. As a
result, no base period measure of perception was captured, only the treatment level
measure. Had the questions been asked both at the end of the base period and at the end
of the experiment, data would have been available to do both a within subject and
between subjects analysis and may have yielded results. It is easy to make this type of
error and reinforces the advice to think the design all the way through to the analysis and
to rethink it each time a design change is considered.
Another lesson learned pertains to the experimental software that was used. The
data that comes out of the experimental software may not be in the expected or intended
format. Multiple data elements are sometimes captured in a single cell or row and must
be manually separated into usable data. This can be a time consuming and troublesome
process.

136
REFERENCES
Alles, M., A. Kogan, M.A. Vasarhelyi (2002). Feasibility and Economics of Continuous Assurance. Auditing: A Journal of Practice & Theory, 21(1), 125- 138. Arnold, V., J. C. Lampe, J. Masselli, S.G. Sutton (2000). An analysis of the market for systems reliability assurance services. Journal of Information Systems, 14(Supplement), 65-82. Asthana, S. (2003). Impact of Information Technology on Post-Earnings Announcement Drift. Journal of Information Systems, 17(1): 1-17. Barber, B. and Odean, T. (2001) Boys will be boys: Gender, Overconfidence and Common Stock Investment. Quarterly Journal of Economics (2001), 261-292. Benford, T. L. (2000). Determinants of Audit Performance: An Investigation of Task/Technology Fit and Mental Workload. Unpublished doctoral dissertation, University of South Florida. Boritz, E. and J. E. Hunton (2002). Investigating the Impact of Auditor-Provided Systems Reliability Assurance on Potential Service Recipients. Boritz, J. E. and W. G. No (2003). Assurance Reporting for XBRL: XARL (eXtensible Assurance Reporting Language). In S. J. Roohani, R.J. Smithfield (Eds.), Trust and Data Assurances in Capital Markets: The Role of Technology Solutions. (pp. 17-31). Bryant College. Bovee, M., M. L. Ettredge, R.P. Srivastava, L.A. Watson (2001). An Assessment of the XBRL Taxonomy for Financial Reports. The Third Continuous Reporting and Auditing Conference, Rutgers University, New Jersey. Chewning, E. G., Jr., M. Collier, B. Tuttle (2004). Do market prices reveal the decision models of sophisticated investors? Evidence from the laboratory. Accounting, Organizations and Society, 29, 739-758.

137
Chewning, E. G., Jr. and A. Harrell (1990). The effect of information load on decision makers' cue utilization levels and decision quality in a financial distress decision task. Accounting, Organizations and Society, 15(6): 527-542. CICA/AICPA (1999). Continuous Auditing. Research Report. Toronto, Canada: The Canadian Institute of Chartered Accountants. Cohen, E. E. (2000). When Documents Become Data: On the Road to Continuous Auditing with XML. The Second Continuous Reporting and Auditing Conference, Rutgers University, New Jersey. Cohen, E. E. (2001). XBRL and Continuous Auditing/Assurance. The Third Continuous Reporting and Auditing Conference, Rutgers University, New Jersey. Cohen, E. E. (2002). Data Level Assurance: Bringing Data into Continuous Audit Using XML Derivatives. The Fifth Continuous Assurance Symposium, Rutgers University, New Jersey. Cohen, E. E., B. Lamberton, S.J. Roohani (2003). The Implications of Economic Theories and Data Level Assurance Services: Research Opportunities. In S. J. Roohani, R.J. Smithfield (Eds.), Trust and Data Assurances in Capital Markets: The Role of Technology Solutions (pp.51-62). Bryant College. Daigle, R. J. and J. C. Lampe (2000). Determining the Market Demand for Continuous Online Attestation: Preliminary Work on a Ph.D. Dissertation. Daigle, R. J. and J. C. Lampe (2003). The Impact of the Risk of Consequence on the Relative Demand for Continuous Online Assurance. Accounting Information Systems Symposium, Scottsdale, AZ. Daigle, R. J. and J. C. Lampe (2004). The Level of Assurance Precision and Associated Cost Demanded When Providing Continuous Online Assurance in and Environment Open to Assurance Competition. Accounting Information Systems Research Symposium, Scottsdale, AZ. DiFonza, N. and P. Bordia (1997). Rumor and Prediction: Making Sense (but Losing Dollars) in the Stock Market. Organizational Behavior and Human Decision Processes, 71(3), 329-353. EDGAR online (2008) Online products. Website: http://www.edgar-online.com/products/imetrix.apsx

138
Elliott, R. K. (2001). Introductory Remarks at Third Continuous Reporting and Auditing Conference. The Third Continuous Reporting and Auditing Conference, Rutgers University, New Jersey. Elliott, R. K. (2002). Twenty-First Century Assurance. Auditing: A Journal of Practice & Theory, 21(1), 139-2002. Ettredge, M. L., V. J. Richardson, S. Sholz (2001). The presentation of financial information at corporate Web sites. International Journal of Accounting Information Systems, 2, 2001. FASB (2001). Electronic Distribution of Business Reporting Information, FASB. 2001, 1-94. Groomer, S. M. and U. S. Murthy (1989). Continuous auditing of database applications: An embedded audit module approach. Journal of Information Systems, 3(2), 53- 69. Hair, J. F., R. E. Anderson, R. L. Tatham, W. C. Black (1998). Multivariate data analysis. Englewood Cliffs, NJ: Prentice Hall. Hart, S. G. and Shreveland, L. E. (1987). Development of NASA TLX (Task Load Index): Results of Empirical and Theoretical Research. In P.A. Hancock and N. Meschkati, (Eds.) Human Mental Workload. Amsterdam, The Netherlands: Elsevier Science Publishing Company, Inc. Hirst, D. E., L. Koonce, J. Miller (1999). The Joint Effect of Management's Prior Forecast Accuracy and the Form of Its Financial Forecasts on Investor Judgment. Journal of Accounting Research, 37(Supplement), 101-124. Hodge, F. D. (2001). Hyperlinking unaudited information to audited financial statements: effects on investor judgments. The Accounting Review, 76(4), 675- 692. Hodge, F. D. (2003). Investors' Perceptions of Earnings Quality, Auditor Independence, and the Usefulness of Audited Financial Information. Accounting Horizons, 17(Supplement), 37-48. Holthausen, R. W. and D. F. Larcker (1992). The prediction of stock returns using financial statement information. Journal of Accounting and Economics, 15, 373- 411.

139
Hunton, J. E., J. L. Reck, R. E. Pinsker (2002). Investigating the Reaction of Relatively Unsophisticated Investors to Audit Assurance on Firm-Released News Announcements. The Fifth Continuous Assurance Symposium, Rutgers University, New Jersey. Hunton, J. E., A. M. Wright, S. Wright (2002). Assessing the Impact of More Frequent External Financial Statement Reporting and Independent Auditor Assurance on Quality of Earnings and Stock Market Effects. The Fifth Continuous Assurance Symposium, Rutgers University, New Jersey. Hunton, J. E., A. M. Wright, S. Wright (2003). The Supply and Demand for Continuous Reporting. In S. J. Roohani, R.J. Smithfield (Eds.), Trust and Data Assurances in Capital Markets: The Role of Technology Solutions (pp.7-16). Bryant College. Hunton, J. E., A. M. Wright, S. Wright (2004). Continuous Reporting and Continuous Assurance: Opportunities for Behavioral Accounting research. Journal of Emerging Technologies in Accounting, 1, 91-102. Hunton, J. E., E. Mauldin, P. Wheeler (2008). Functional and Dysfunctional Effects of Continuous Monitoring, The Accounting Review, Forthcoming, Jones, M. J. and J. Z. Xiao (2004). Financial reporting on the Internet by 2010: a consensus view. Accounting Forum, 28, 237-263. Kogan, A., E.F. Sudit, M.A. Vasarhelyi (1999). Continuous Online Auditing: A Program of Research. Journal of Information Systems, 13(2), 87-103. Lampe, J. C. & Daigle, R. J. (2006). Cost-Effective Continuous Assurance. Internal Auditing, 21 (4), 26-36. Lev, B. and S. R. Thiagarajan (1993). Fundamental Information Analysis. Journal of Accounting Research, 31(2), 190-215. Lewellen, W.G., R.C. Lease, G.G. Schlarbaum (1977). Patterns of Investment Strategy and Behavior Among Individual Investors. The Journal of Business, 50 (3), 296- 333. Libbon, R. P. (2001). Who is making online trades? American Demographics, 23(3), 53-58. Libby, R., R. Bloomfield, M. W. Nelson (2002). Experimental research in financial accounting. Accounting, Organizations and Society, 27, 775-810.

140
Lipe, M. G. (1998). Individual Investors' Risk Judgments and Investment Decisions: the Impact of Accounting and Market Data. Accounting, Organizations and Society, 23(7), 625-640. Lymer, A. and R. Debreceny (2002). The Audit of Corporate Reporting on the Internet: Challenges, Institutional Responses and Yet More. The Fourth Continuous Assurance Symposium, Salford University, Salford, England. McCroskey, J. and J. Teven (1999). Goodwill: A reexamination of the construct and its measurement. Communications Monographs, 66, 90-103.
Mercer, M. (2002). The Credibility of Consequences of Managers' Decisions to Provide Warnings about Unexpected Earnings. Available at SSRN: http://ssrn.com/abstract=311100 or DOI: 10.21.39/ssrn.311100 Murthy, U. S. and S. M. Groomer (2004). A Continuous Auditing Web Services (CAWS) Model for XML Based Accounting Systems. International Journal of Accounting Information Systems, 5, 139-163. Nadiminti, R., T. Mukhopakhyay, C.H. Kriebel (1996). Risk aversion and the value of information. Decision Support Systems, 16, 241-254. Nicolaou, A. I., A. T. Lord, L. Liu (2003). Demand for Data Assurances in Electronic Commerce: An Experimental Examination of a Web-Based Data Exchange Using XML. In S. J. Roohani, R.J. Smithfield (Eds.), Trust and Data Assurances in Capital Markets: The Role of Technology Solutions (pp. 32-42). Bryant College. Nunnally, J. (1978). Psychometric Theory. New York, NY: McGraw-Hill, Inc. NYSE (2000). The Investing Public. O'Donnell, E. and J. S. David (2000). How information systems influence user decisions: a research framework and literature review. International Journal of Accounting Information Systems, 1(3), 178-203 Ou, J. A. (1990). The Information content of nonearnings accounting numbers as earnings predictors. Journal of Accounting Research, 28(1), 144-163. Ou, J. A. and S. H. Penman (1989a). Accounting measurement, price-earnings ratio, and the information content of security prices. Journal of Accounting Research, 27(Current studies on the information content of accounting earnings), 111-144. Ou, J. A. and S. H. Penman (1989b). Financial statement analysis and the prediction of stock returns. Journal of Accounting and Economics, 11, 295-329.

141
Pany, K. and C. H. Smith (1982). Auditor Association with Quarterly Financial Information: An Empirical Test. Journal of Accounting Research, 20(2, Part I), 472-481. Pedhazur, E.J. and L.P. Schmelkin (1991). Measurement, Design and Analysis: An Integrated Approach. Hillsdale NJ: Lawrence Erlbaum Associates Inc. Pinello, A. S. (2004). Individual Investor Reaction to the Earnings Expectations Path and Its Components. Unpublished doctoral dissertation, Florida State University. Rezaee, Z., W. Ford, R. Elam (2000). Real Time Accounting Systems. The Internal Auditor, 62-67. Rezaee, Z., C. Hoffman, N. Marks (2001). XBRL: Standardized electronic financial reporting. The Internal Auditor, 58(4), 46-51. Rezaee, Z., A. Sharbatoghlie, R. Elam, P.L. McMickle (2002). Continuous Auditing: Building Automated Auditing Capability. Auditing: A Journal of Practice & Theory, 21(1), 147-163. Schroder, H. M., M. J. Driver, S. Struefert (1967). Human Information Processing. New York, Holt, Rinehart and Wilson. Securities and Exchange Commission (2005). SEC Encourages Participation in its XBRL Voluntary Program.. Retrieved December 21, 2005 from http://www.sec.gov/news/press/2005-64.htm Securities and Exchange Commission (2008). Proposed Regulation 33-8924: Interactive Data to Improve Financial Reporting. Retrieved November 6, 2008 from http://www.sec.gov/rules/proposed.stml Vasarhelyi, M. A., M. Alles, A. Kogan (2003). Principles of Analytic Monitoring for Continuous Assurance. Accounting Information Systems Symposium, Scottsdale, AZ. Vasarhelyi, M. A. and F. B. Halper (1991). The Continuous Audit of Online Systems. Auditing: A Journal of Practice & Theory, 10(1), 110-125.

142
APPENDICES

143
Appendix A: Audit and Assurance Reports Independent Auditor’s Report
Independent Auditor’s Report
We audit the accompanying information released by ACME, Inc. The information is the responsibility of the Company’s management. Our responsibility is to express an opinion based on our audit. Our agreement with ACME, Inc. requires that we provide a probability assessment on the face of each report that reflects our level of assurance on the accompanying information. The probability assessment range is from 0% (no assurance) to 100% (complete assurance).
We conduct our audit in accordance with generally accepted auditing standards. Those standards require that we plan and perform the audit to obtain reasonable assurance about whether the accompanying information is free of material misstatement. An audit includes examining, on a test basis, evidence supporting the amounts and disclosures in the accompanying information. An audit also includes assessing the accounting principles used and significant estimates made by management. We believe our audit provides a reasonable basis for our opinion. Pursuant to our agreement with ACME, Inc., we provide a probability assessment on the face of the accompanying information report that reflects our level of assurance. We conduct our audit, and update our probability assessment, on a continuous (biweekly) basis.
In our opinion, the accompanying information report presents fairly, in all material respects, the accompanying information, as of the date specified and subject to the probability assessment that is presented on the face of the accompanying information report. Signed: Independent Auditors
Assurance Probability Report
Auditor’s Report Pursuant to our agreement with ACME, Inc., we are required to provide a probability assessment that reflects our level of assurance on the accompanying information. The probability assessment for the current information is 99.99 %. (For each report, the percentage is between 87%-97% and is shown in red, bold format)

144
Appendix B: Experimental Materials The experiment was conducted entirely via a computerized stock price change
prediction task. The materials presented here are representations of the materials used for
the experiment.
The initial screens introduced the experiment and provided the consent form. A
control button allowed the participant to consent to participate in the study and permitted
the participant to continue with the experiment. Failure to consent resulted in termination
of the participant’s data collection. The subsequent screens provided the participant a
more complete description of the task, including a description and the financial
statements of the task company. The participants were allowed to page through the
instructions at their own pace before moving to the prediction task. The instructions
included an example screen for the task. The participants next completed the base level
predictions, which were followed by a description of the treatment level task. The
treatment level task description included a list of the financial information items that
might be presented and a definition of each item. For those participants in the 'with
assurance' conditions, a description and example of the audit report and assurance report
were included. An example screen was presented for the participants to review before
continuing. An After completing the treatment level task, the participants were provided
access to a series of screens (the post-test questionnaire) to collect additional data
regarding demographic information including investing experience, education, major, age
and gender. The next series of screens collected data including manipulation check

145
questions, information regarding the covariates cognitive load, risk tolerance, system
trust and information relevance and the measurement of the dependent variables.
The details of the post-test questionnaire are now presented:
Post-Test Questionnaire Manipulation Check Questions Number of forms of Reporting System a. How many forms of the information system did you test for ACME, Inc.? 1 or 2 b. If you tested more than one form of the information reporting system for ACME, Inc., please indicate how the second form of the system was different from the first form of the system. I received additional items of information. I could click on a button to read an Audit Report. I could click on a button to read an Assurance Probability Report. Financial Information and Reporting Manipulation Check
When answering these questions, think about the second form of the information reporting system that you tested. a. How often was financial information in addition to the stock price and percent of change in stock price provided? Every decision period. Only in some decision periods. b. How many decision periods had a button for you to click on to read an Audit report? Provide value between 0 and 35. c. How many times did you read the Audit report? Provide value between 0 and 35. d. How many decision periods had a button for you to click on to read an Assurance Probability report? Provide value between 0 and 35.

146
e. How many times did you read the Assurance Probability report? Provide value between 0 and 35. Potential Covariates Risk Tolerance LOTTO 1. Given the choice to participate in a lottery in which you have a 50% chance of winning $10 and a 50% chance of losing $10, to what extent are you willing to play the lottery? Please indicate your own personal preference: This question was measured on a seven point scale from Extremely Unwilling to Extremely Willing. HI-RISK 2. Generally, I am willing to take high financial risks in order to realize higher average gains. Please indicate the extent to which you agree with this statement: This question was measured on a seven point scale from Strongly Disagree to Strongly Agree. Cognitive Load Questions Each of the six questions was measured on a seven point scale from Strongly Disagree to Strongly Agree. 1. Mental Demand is defined as how much mental and perceptual activity was required (e.g. thinking, deciding, calculating, remembering, looking, searching, etc.). Was the task easy or demanding, simple or complex, exacting or forgiving? Indicate the extent to which you agree with this statement: During the stock price prediction task, I experienced high levels of Mental Demand. 2. Physical Demand is defined as how much physical activity was required (e.g. pushing, pulling, turning, controlling, activating, etc.) Was the task easy or demanding, slow or brisk, slack or strenuous, restful or laborious? Indicate the extent to which you agree with this statement: During the stock price prediction task, I experienced high levels of Physical Demand. 3. Time Demand is defined as how much pressure you felt due to the rate or pace at which the tasks occurred. Was the pace slow and leisurely or rapid and frantic?

147
Indicate the extent to which you agree with this statement: During the stock price prediction task, I experienced high levels of Time Demand. 4. Performance is defined as how successful you think you were in accomplishing the goals of the task. How satisfied were you with your performance in accomplishing these goals? Indicate the extent to which you agree with this statement: During the stock price prediction task, I experienced high levels of Performance. 5. Effort is defined as how hard you had to work (mentally and physically) to accomplish your level of performance. Indicate the extent to which you agree with this statement: During the stock price prediction task, I experienced high levels of Effort. 6. Frustration Level is defined as how insecure, discouraged, irritated, stressed and annoyed versus secure, gratified, content, relaxed and complacent you felt during the task. Indicate the extent to which you agree with this statement: During the stock price prediction task, I experienced high levels of Frustration. System Trust Questions Please answer the following questions about the information reporting system you tested. Each question was measured on a seven point scale from Strongly Disagree to Strongly Agree. 1. The system that provided the information ensured the secure transmission of the financial information. Please indicate the extent to which you agree with this statement. 2. Other people who use the system that provided the financial information would consider it to be trustworthy. Please indicate the extent to which you agree with this statement. 3. The system that provided the financial information protects the data from unauthorized tampering during transmission. Please indicate the extent to which you agree with this statement.

148
Perceived Information Relevance Questions Each of the three questions was measured on a seven point scale from Strongly Disagree to Strongly Agree. 1. I used the financial information to make my stock price predictions. 2. The financial information was appropriate for the stock price prediction task. 3. The financial information had an influence on my stock price decision. Perception Dependent Variables Perceived Source Credibility Questions McCroskey & Teven 1999 Each of the six questions was measured on a seven point scale from Strongly Disagree to Strongly Agree. Expertise: 1. I believe that management of ACME, Inc. is informed. 2. I believe that management of ACME, Inc. is expert. 3. I believe that management of ACME, Inc. is competent. Trustworthy: 4. I believe that management of ACME, Inc. is honest. 5. I believe that management of ACME, Inc. is trustworthy. 6. I believe that management of ACME, Inc. is ethical. Perceived Information Reliability Questions Each of the five questions was measured on a seven point scale from Strongly Disagree to Strongly Agree. 1. The financial information I received was accurately presented 2. The financial information I received was valid. 3. The financial information I received was verifiable. 4. The financial information I received was consistent.

149
5. The financial information I received was credible. Perceived Value of Information Questions Each of the three questions was measured on a seven point scale from Strongly Disagree to Strongly Agree. 1. I would pay to have this type of information provided to me. 2. I would recommend to friends and family that they pay to have similar information provide to them. 3. I would pay a higher price for stock in a company that offered this form of information reporting compared to a company that did not.

150
Appendix C. Selected Screen Shots from Experiment
Base Level Decision Periods 1 & 2 (All treatment versions are the same)

151

152
Version 1, Periodic Reporting Without Assurance Decisions 39 Through 41

153
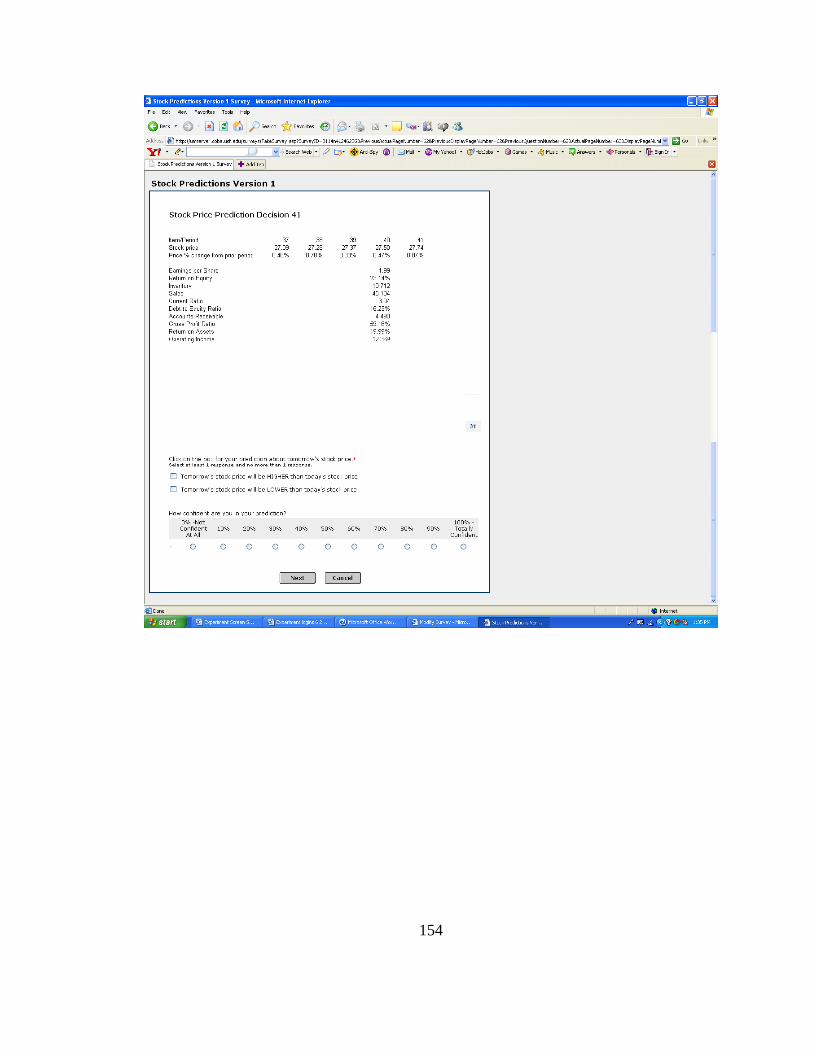
154

155
Version 2, Periodic Reporting With Assurance Decisions 39 Through 41

156

157
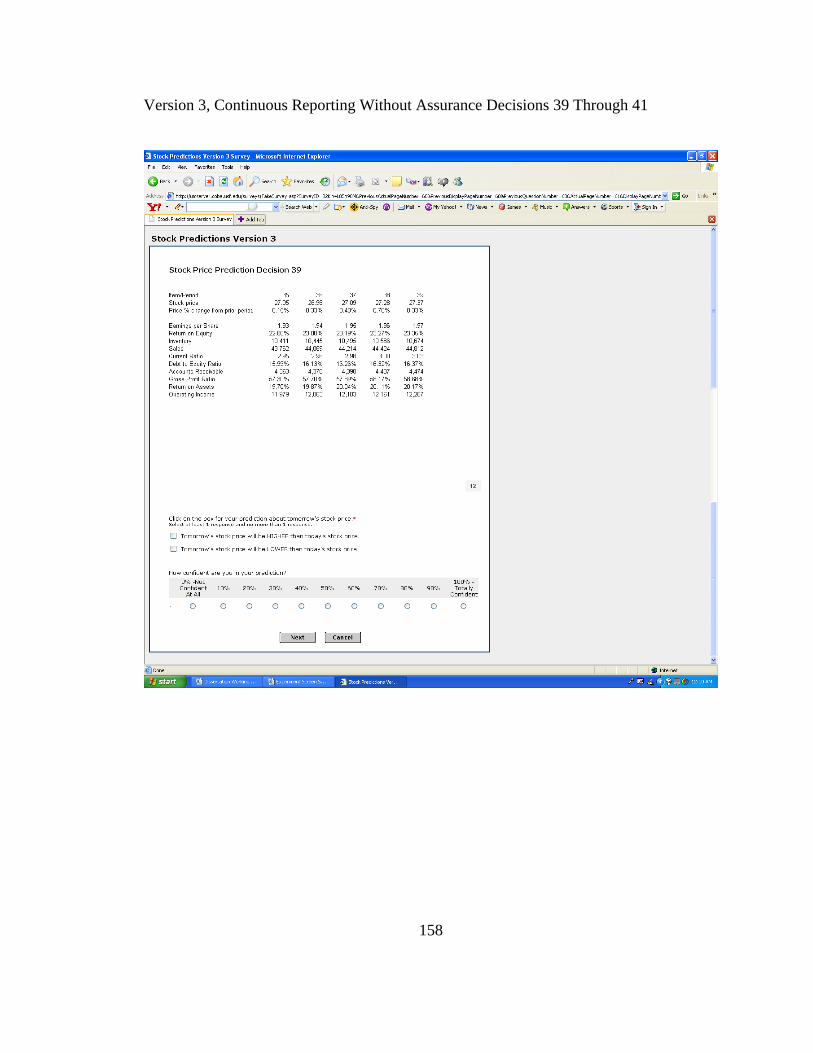
158
Version 3, Continuous Reporting Without Assurance Decisions 39 Through 41

159

160

161
Version 4, Continuous Reporting with Assurance Decisions 39 Through 41

162

163

ABOUT THE AUTHOR
Dr. Anita Reed was born and raised in Texas and is the parent of two children,
James Andrew and Elizabeth Amanda Burch and the grandparent of Jamie Ann and
Hailey McKennah Burch.
Dr. Reed graduated from Trent High School in 1973. She received an Associate
in Arts degree from Del Mar College in Corpus Christi, Texas in 1982, a Bachelor of
Business Administration from Corpus Christi State University in1984 and a Masters of
Business Administration from Texas A & M University - Corpus Christi in 2000. She
received her Ph.D. in Accounting from the University of South Florida in 2008.
Dr. Reed is a licensed Certified Public Accountant. She was employed with
KPMG from 1984 through 1991 and was the sole proprietor of Anita Reed, CPA from
1991 through 2000. She is currently a faculty member at Texas A & M-Corpus Christi.