perforating design for hthp completion: rigorous · pdf fileperforating design for hthp...
TRANSCRIPT
Perforating Design for HTHP Completion: Rigorous
Testing to Maximize Well Productivity
Alex Procyk, ConocoPhillips, David Atwood, Schlumberger
Presented at the 2012 International
Perforating Symposium
Amsterdam
Nov 8-9, 2012
SPE 159920Optimized Cased and Perforated Completion Designs Through The Use of API RP-
19B Laboratory Testing to Maximize Well Productivity
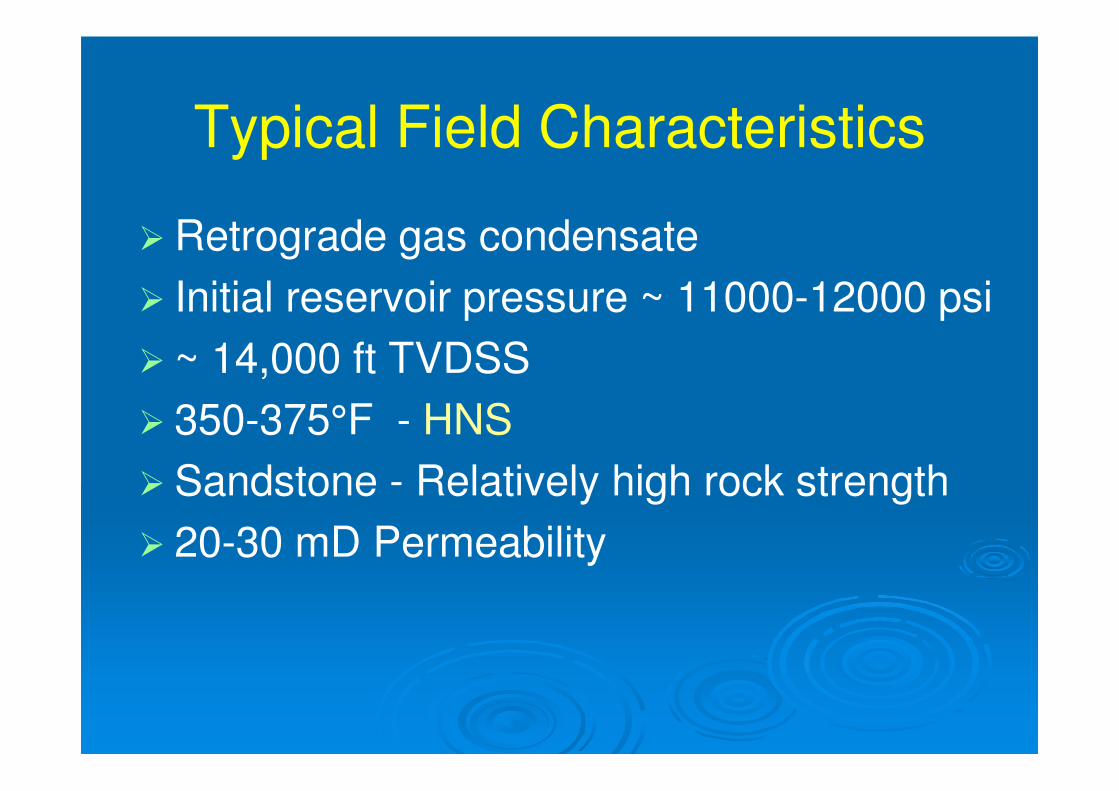
Typical Field Characteristics
� Retrograde gas condensate
� Initial reservoir pressure ~ 11000-12000 psi
� ~ 14,000 ft TVDSS
� 350-375°F - HNS
� Sandstone - Relatively high rock strength
� 20-30 mD Permeability

Proposed Well Configuration
Cased & Perforated Completion
Why are we looking into the perforating process so closely?.....
……A real world example from a similar field, with similar completion design and similar conditions

2003 PLT 2008 PLT
Additional
Perfs Oct 2005
Initial Perf job:
• Perforated 1000 psi overbalanced in oil based mud
• Poor Well Response from first perfJob Compared to Benchmark well perforated underbalanced
Well 4
Low PLT Response across High Perm zones
Reperf Job:
• 3 years after first perf job
• UB (live well)
• During the perforating operations the shut-in tubing pressure increased from 3,649 to 5,001 psi.
?

Perforating Design Goal
� Design perfs to achieve desired skin, the first time!
� Get full production across entire perforated zone
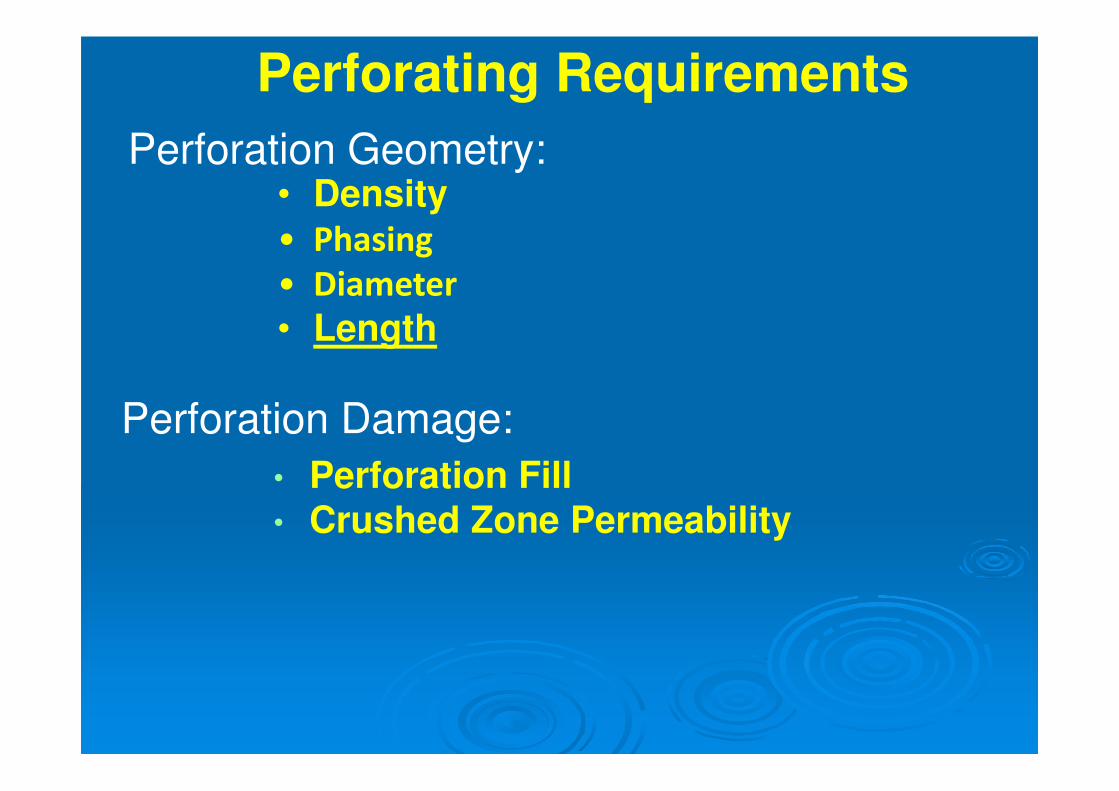
Perforating Requirements
• Perforation Fill• Crushed Zone Permeability
Perforation Damage:
Perforation Geometry:• Density• Phasing
• Diameter
• Length

Perforating Requirements
What perforation length do we need?

WHAT PERFORATION LENGTH DO WE NEED? Slide 9
Increasing perforation length provides more skin improvement than increasing shot density
5” Lp: 12 spf/6 spf = 1, 5”/10” = 1.5
Evaluation of Perforation Geometry and Damage EffectsKh=10 md, Kh/Kv=1, H=500 ft TVT, b=Hp/H=1, Incl=0 deg, Kmf/Kr=0.5, rmf=rw+1 ft and rw=0.354 ft for all cases
-2
0
2
4
6
8
10
12
14
16
18
20
22
24
26
28
30
0 2 4 6 8 10 12 14 16 18 20 22 24
Perforation Length, inches
Da
rcy
Sk
in
SPF=6, Dp=0.25",Phasing=60 deg and Kc/K=0.02 for OB Perforating in High Density Mud
SPF=6, Dp=0.25",Phasing=60 deg and Kc/K=0.12 for OB Perforating in Filtered Brine
SPF=6, Dp=0.25",Phasing=60 deg and Kc/K=0.20 for UB Perforating in Filtered Brine
SPF=6, Dp=0.25",Phasing=60 deg and Kc/K=0.40 for UB Perforating with Best Practices
Target: Best Practices

Beware!Core Penetration Length Variability
0.00
5.00
10.00
15.00
20.00
25.00
30.00
Test: Rock Penetration Prediction: Rock
Penetration
Section 1: Concrete
Penetration
Co
re P
en
etr
ati
on
Le
ng
th (
in.)
2-7/8" gun, 4500 psi UCS rock strength, 7150 psi apparent effective stress
?

Perforating Requirements
How should we perforate?
• Overbalanced
• Underbalanced
• In Mud?
• In Brine?
What perforation conditions do we need?

Perforating Damage—Performance
Sand debris
Reduced permeability crushed zone, Kc
Damaged zone, Kd Undamaged formation, K
Dmg depth
Penetration, P
Sand debris
Reduced permeability crushed zone, Kc
Damaged zone, Kd Undamaged formation, K
Dmg depthDmg depth
Penetration, P
Sand debris
Damaged zone, Kd Undamaged formation, K
Dmg depth
Penetration, P
Sand debris
Damaged zone, Kd Undamaged formation, K
Dmg depthDmg depth
Penetration, P
Damaged zone, Kd Undamaged formation, K
Dmg depth
Penetration, P
Damaged zone, Kd Undamaged formation, K
Dmg depthDmg depth
Penetration, P
Poor skin
Good skin
Fair skin

Perforation Design: Competing Interests
Best Practice for Completions
� Perforate Underbalanced in filtered brine
� Run as large guns as possible – 3.5”
Can the Two Competing Interests meet?
Best Practice for Operations
�Perforate overbalanced in mud
�Run 2-7/8” gun
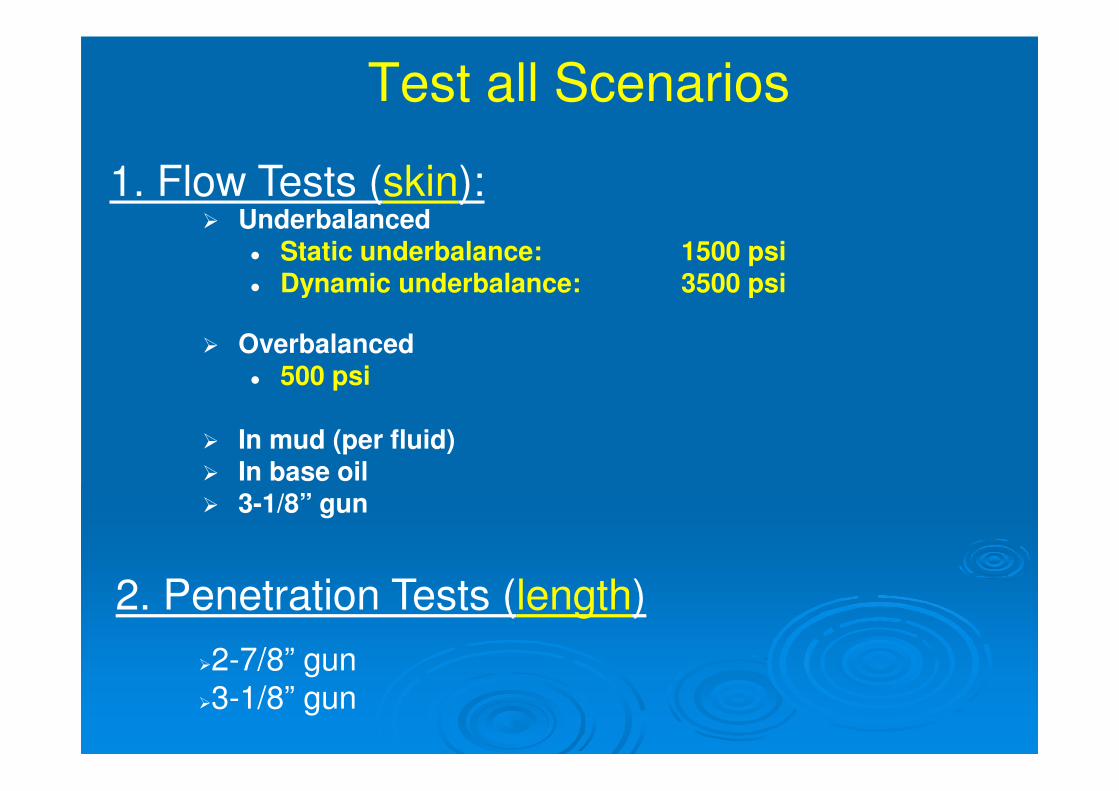
Test all Scenarios
� Underbalanced� Static underbalance: 1500 psi� Dynamic underbalance: 3500 psi
� Overbalanced� 500 psi
� In mud (per fluid)� In base oil� 3-1/8” gun
1. Flow Tests (skin):
2. Penetration Tests (length)
�2-7/8” gun
�3-1/8” gun
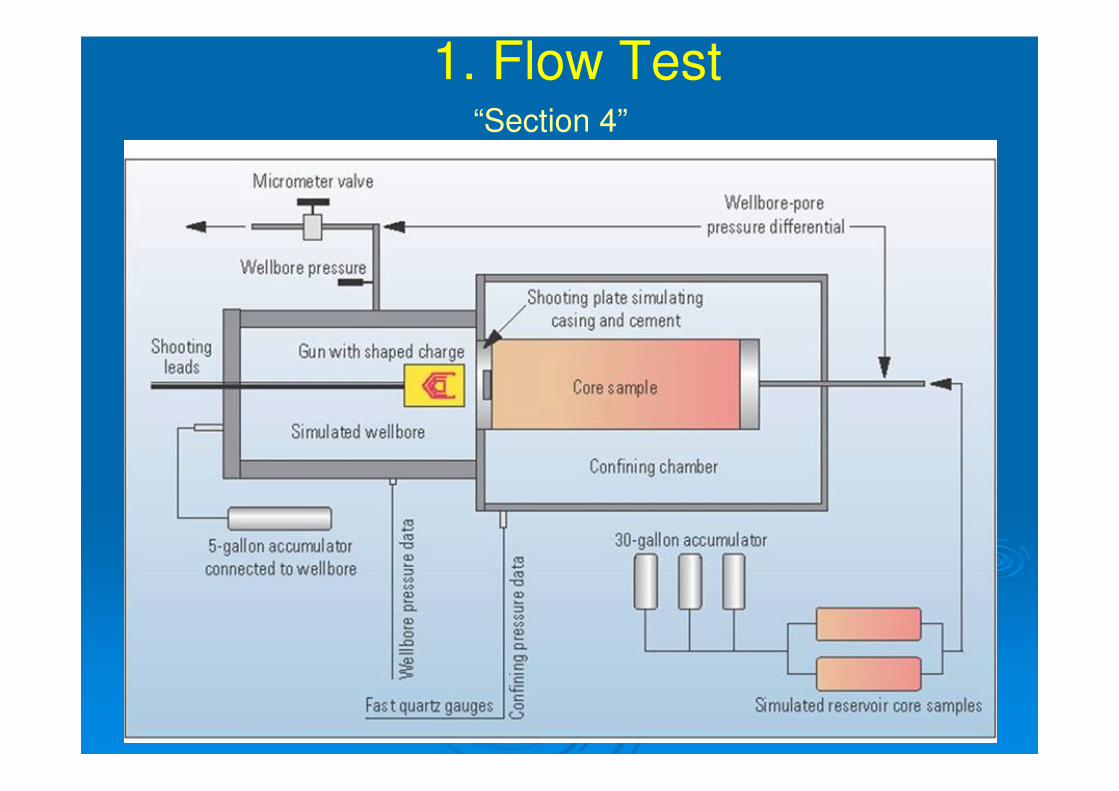
1. Flow Test“Section 4”

Crushed Zone Permeability Measurement

Section 4 test not rated for actual conditions
Confinement: 5800 psia (13000 psia)
Pore Pressure: 4500 psia (11700 psia)
Wellbore Pressure: 3000-5000 psia
Temperature: 200°°°°F (350°°°°F)
Core Fluid: Mineral Spirits (condensate)

Test Scenarios
Scenario A: Shoot overbalanced with mud, no DUB, kill
Scenario B: Shoot overbalanced with mud, 3500 psi DUB, kill
Scenario C: Shoot 1500 psi underbalanced in base oil, no DUB
Scenario D: Shoot balanced in base oil, 3500 psi DUB
Number of Type of Fluid Static Wellbore Pressure Dynamic Underbalance Post-Perforation
Perforation Tests In Wellbore Prior to Perforating Applied During Test Well Kill Performed
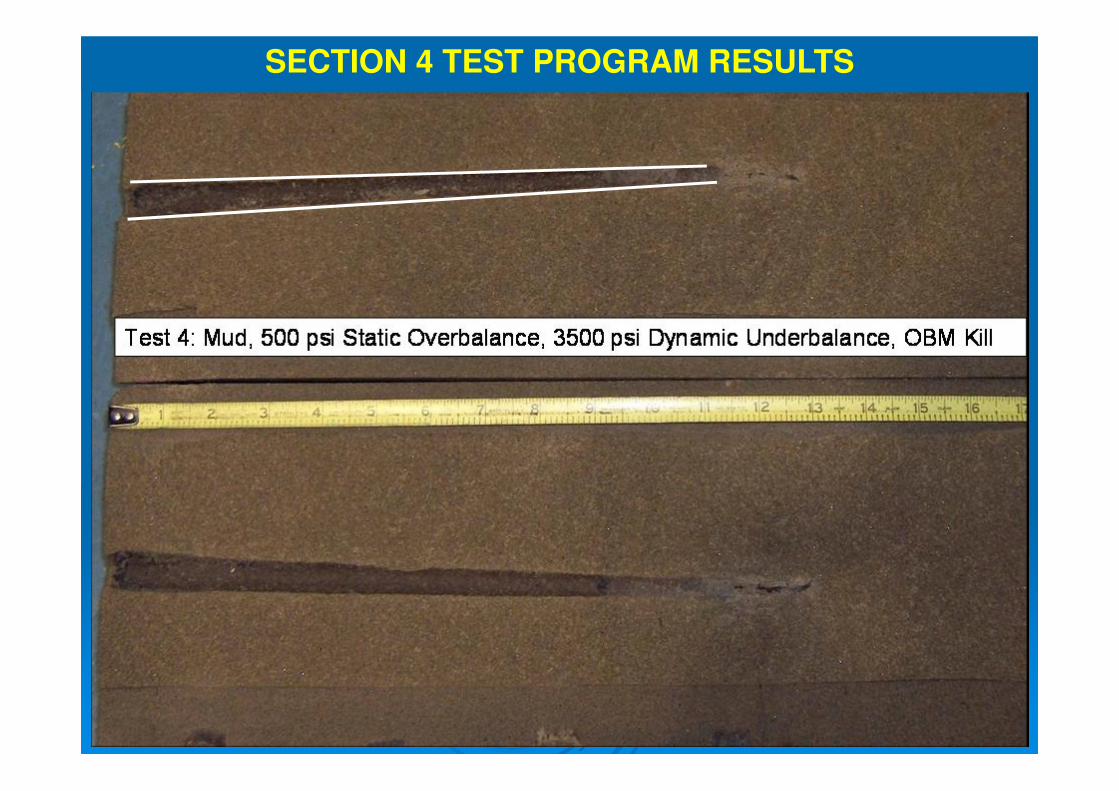
2 Tests 16.5 ppg OBM 500 psi Overbalance 3500 psi Dynamic Underbalance Kill with OBM/Hold for 72 hrs
2 Tests 7.0 ppg Base Oil 50 psi Underbalance 3500 psi Dynamic Underbalance Kill with Base Oil/No Hold
1 Test 7.0 ppg Base Oil 1500 psi Underbalance No Dynamic Underbalance Kill with Base Oil/No Hold
1 Test 16.5 ppg OBM 500 psi Overbalance No Dynamic Underbalance Kill with OBM/Hold for 72 hrs
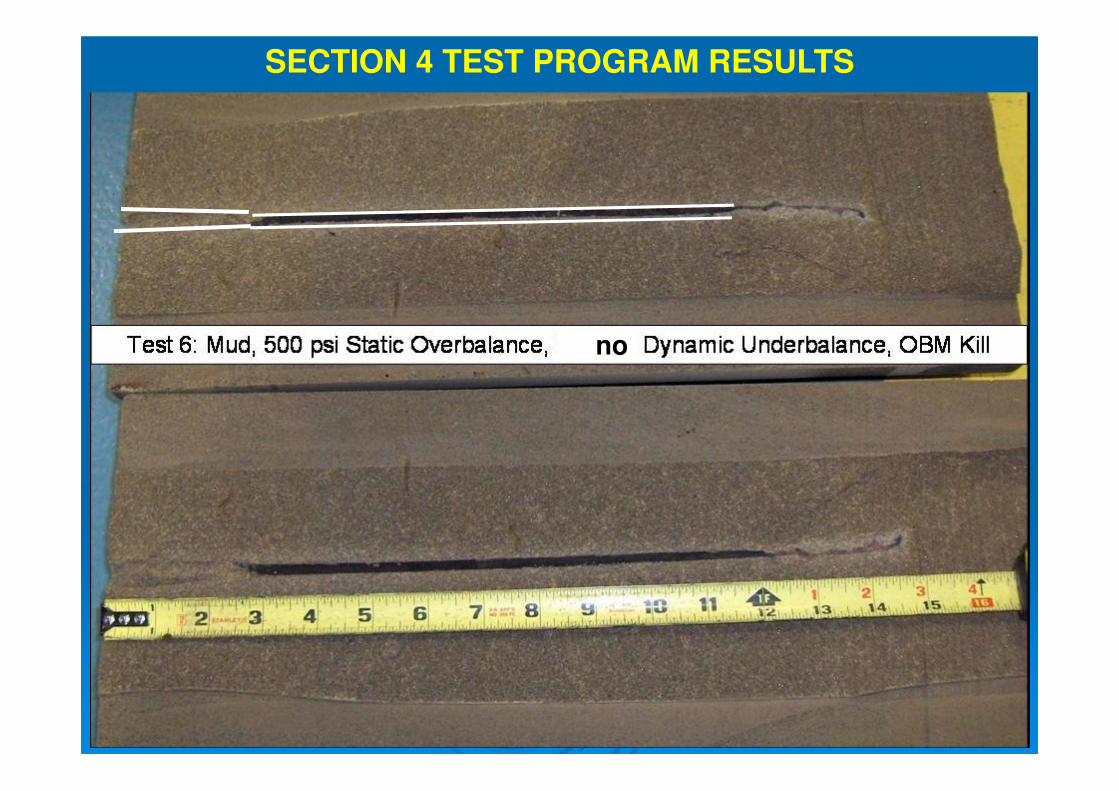
no
SECTION 4 TEST PROGRAM RESULTS
SECTION 4 TEST PROGRAM RESULTS

SECTION 4 TEST PROGRAM RESULTS Slide 21
159920• Optimized Cased and Perforated Completion Designs• Alexander Procyk
Test 3: Base Oil, 1500 psi Static Underbalance, no Dynamic Underbalance, Base Oil kill

Slide 22
159920• Optimized Cased and Perforated Completion Designs• Alexander Procyk
SECTION 4 TEST PROGRAM RESULTS
Test 5: Base Oil, 50 PSI Underbalanced, Dynamic Underbalance, Base Oil kill

SECTION 4 TEST PROGRAM RESULTS Slide 23
CFE Comparison
0.00 0.10 0.20 0.30 0.40 0.50 0.60 0.70
500 psi SOB, 3500 psi
DUB, Mud
50 psi SUB, 3500 psi DUB,
Base oil
500 psi SOB, 3500 psi
DUB, mud (repeat test 1)
50 psi SUB, 3500 psi DUB,
base oil (test 2 repeat)
1500 psi SUB, no DUB,
base oil
500 psi OB, no SUB, No
DUB, mudT
es
t 1
Te
st
2T
es
t 4
Te
st
5T
es
t 3
Te
st
6
CFE
No underbalance
1500 psi SUB
3500 psi DUB
FEA Method

SECTION 4 TEST PROGRAM RESULTS Slide 24
Kc/K Summary
0.00 0.10 0.20 0.30 0.40 0.50 0.60 0.70 0.80
500 psi SOB, 3500 psi DUB,
Mud
50 psi SUB, 3500 psi DUB,
Base oil
500 psi SOB, 3500 psi DUB,
mud (repeat test 1)
50 psi SUB, 3500 psi DUB,
base oil (test 2 repeat)
1500 psi SUB, no DUB, base
oil
500 psi OB, no SUB, No
DUB, mud
Te
st
1T
es
t 2
Te
st
4T
es
t 5
Te
st
3T
es
t 6
Kc/K
Crush zone thickness = rscrubbed - rjet; djet = 0.15"
3500 psi DUB
no underbalance
1500 psi SUB
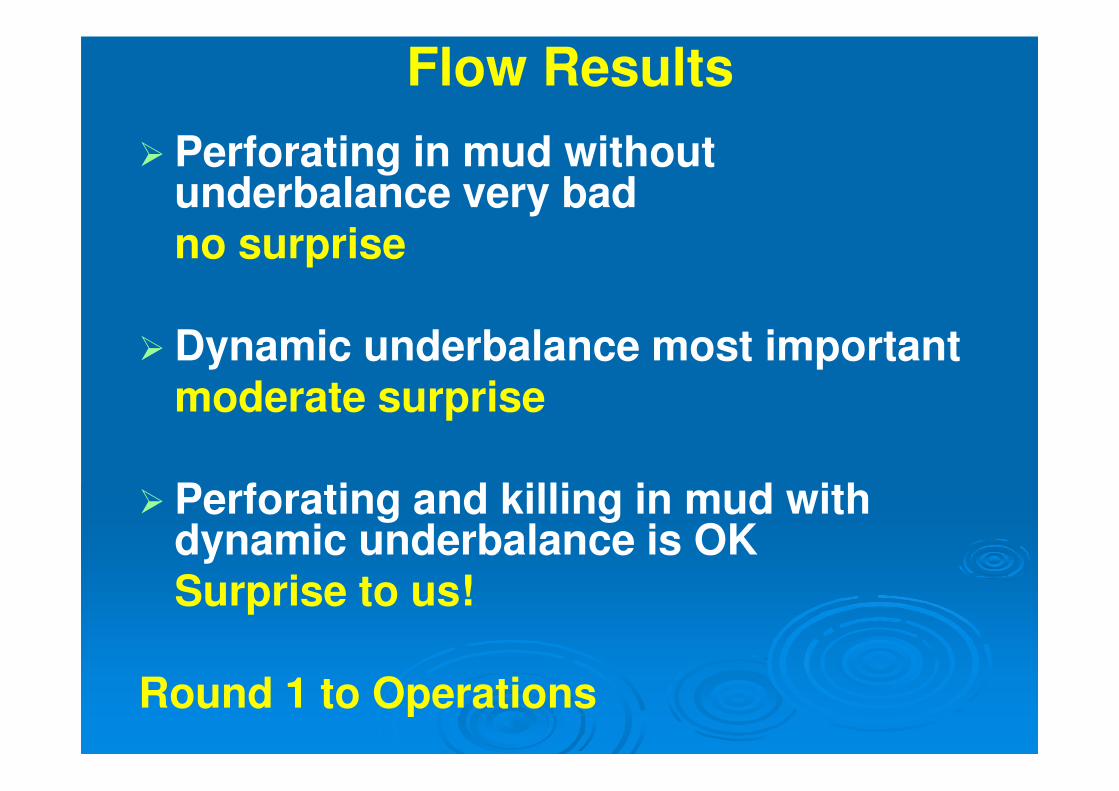
Flow Results
� Perforating in mud without underbalance very badno surprise
� Dynamic underbalance most important moderate surprise
� Perforating and killing in mud with dynamic underbalance is OKSurprise to us!
Round 1 to Operations
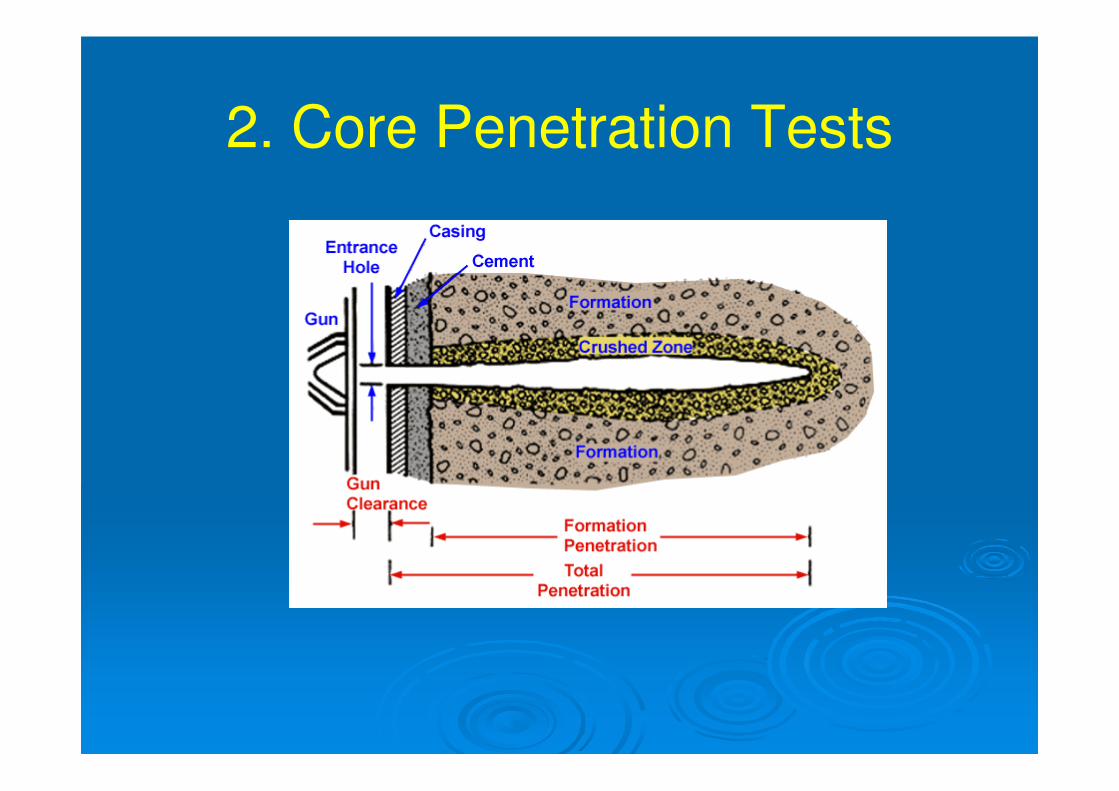
2. Core Penetration Tests

� Perform tests at realistic conditions
� Compare against predictions
� Select deepest penetrating charge
Confirm Actual Penetration with Testing
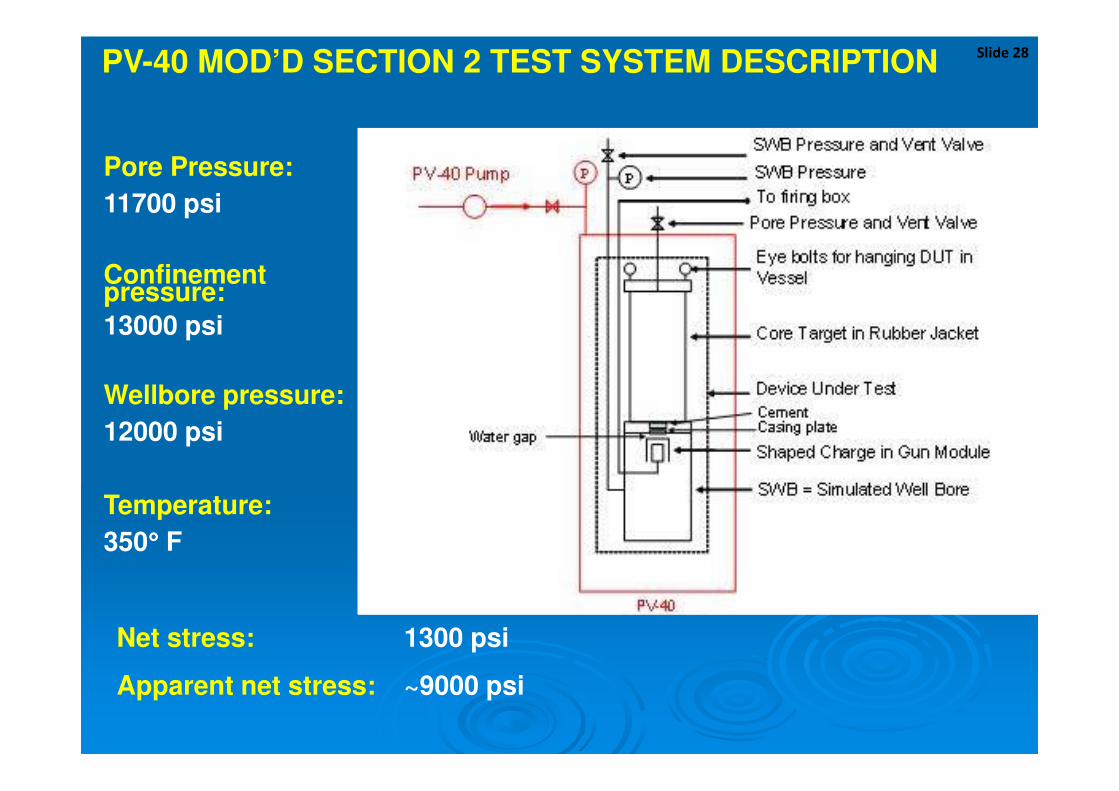
PV-40 MOD’D SECTION 2 TEST SYSTEM DESCRIPTION Slide 28
Pore Pressure:
11700 psi
Confinement pressure:
13000 psi
Wellbore pressure:
12000 psi
Temperature:
350°°°° F
Net stress: 1300 psi
Apparent net stress: ~9000 psi
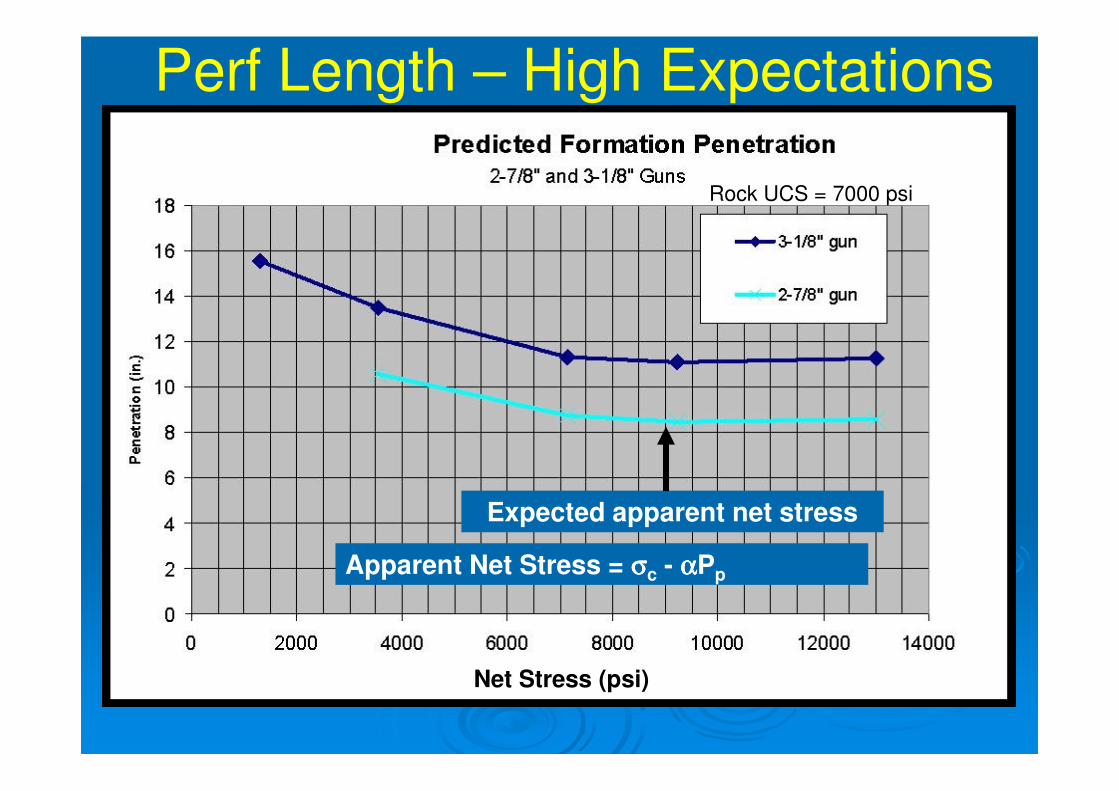
Rock UCS = 7000 psi
Net Stress (psi)
Perf Length – High Expectations
Expected apparent net stress
Apparent Net Stress = σσσσc - ααααPp
MODIFIED SECTION 2 TEST PROGRAM RESULTS
Perforation Created By 23 g HNS Charge At HPHT Conditions
Slide 30
no
SECTION 4 TEST PROGRAM RESULTS
Apparent net stress = 4400 psi

MODIFIED SECTION 2 TEST PROGRAM RESULTS
Perforation Created By 19 g HNS Charge At HPHT Conditions
Slide 32
Test Core 6B = 4.6 inchTest Core 3T = 5.2 inch
Test Core 7T = 5.81 inchTest Core 2B = 6.75 inch
Test Core 4B = 6.38 inch
Test Core 5T = 6.56 inch
Post Shot - Perf Test Photo’s

0.00
2.00
4.00
6.00
8.00
10.00
12.00
A A B B C C
Co
re P
en
etr
ati
on
(in
.)
Solid: Predicted
Shaded: Actual
Core Penetration: Predicted vs. Actual
Company
2-7/8" gun, 4500 psi UCS rock strength, 7150 psi apparent net stress
REVISED RESULTS USING SECTION 2 AND 4 RESULTS Slide 35
Skin Evaluation Incorporating Section-2 and Section-4 Test Results
Kh=10 md, Kh/Kv=10, H=500 ft TVT, b=Hp/H=1, Incl=0 deg, rmf=rw+1 ft and rw=0.354 ft for all cases
-2
-1
0
1
2
3
4
5
6
7
8
9
10
0 1 2 3 4 5 6 7 8 9 10 11 12 13 14 15 16 17 18
Perforation Length, inches
To
tal S
kin
: S
tota
l=S
+D
*Q w
ith
Q=
10
0 M
MS
CF
D
.
Initial Screening Case: SPF=6, Dp=0.25",Phasing=60 deg and Kc/K=0.4 for UB Perforating with Kmf=0.50
Modified Screening Case: SPF=6, Dp=0.25",Phasing=60 deg and Kc/K=0.4 for UB Best Practices with Kmf=0.75
Design Case with Section-2 and Section-4 Results: SPF=6, Dp=0.85",Phasing=60 deg and Kc/K=0.4 for DUB with Kmf=0.75
Best Laboratory Test Case: SPF=6, Dp=0.85",Phasing=60 deg and Kc/K=0.7 for DUB with Kmf=0.75
Initial Skin = +1.9 with
Lp=12" and Dp=0.25"
Final Skin = +1.0 with
Lp=6.75" and Dp=0.85"
Expected skin @
12” penetration,
0.25” diameter
Perf Geometry much different than expected, but yields roughly the same skin due to
huge diameter (= flow area)

Some things to think about
• Perforation characteristics : - “Carrot Shape”(Short & Dumpy) –
• Is this an HNS artifact?
• What effect does the saturating fluid play?
• Is the carrot shape indicative to the lower rockstrength only. What happens in higher rock strength?
Is Short and Fat still acceptable with a low perm mud filtrate invaded zone?

Pushing Testing Further
• How do we encourage the industry to cut larger IDcore in actual HPHT rock to advance testingfurther……..(UK & Norway) are the main user of thisHPHT perf technology..
• How do we improve analogue rock selection, issynthetic rock a option? where are we with thistechnology?
• Testing in Brine. Tests resulted in vastly improvedpenetration. "Reality" future testing requiresaccurate saturation of the core to demonstrate ifimprovement associated with rock saturation.

• Gun design for 2 7/8" HPHT Guns (CentralGrabben Type Formation use 2 7/8“ due to 5”Tubing /Liners ) has probably reached its limit.There has to be quantum leap in technology tomake any difference and this does not seem tobe available today.
• DUB: Cannot actually measure the event inreal time due to limitations of gaugetechnology (temp) both in the lab and in thefield.
Pushing Equipment Further

Acknowledgements / Thank You / Questions
Paper # • Paper Title • Presenter Name
The authors wish to thank the management of both ConocoPhillips Company and Schlumberger for permission to publish this work. The authors also wish to thank the PERF Lab engineers and technicians involved in this work for their diligence in performing these tests to ensure meaningful and consistent test results.
Slide 39

Perf Length Test Results
� Charges shot shorter than expected in HPHT Tests
� Charges had larger perforation diameters in HPHT Tests
� 3-1/8” did not shoot significantly deeper than
2-7/8”, at least settling that argument

Perf Length Test Results
� Charges shot shorter than expected in HPHT Tests
� Charges had larger perforation diameters in HPHT Tests
� Perf Geometry depended upon saturating fluid (OMS vs brine)
� 3-1/8” did not shoot significantly deeper than
2-7/8”, at least settling that argument
� DUB and perf geometry should be sufficient for our skin goals (stay tuned)
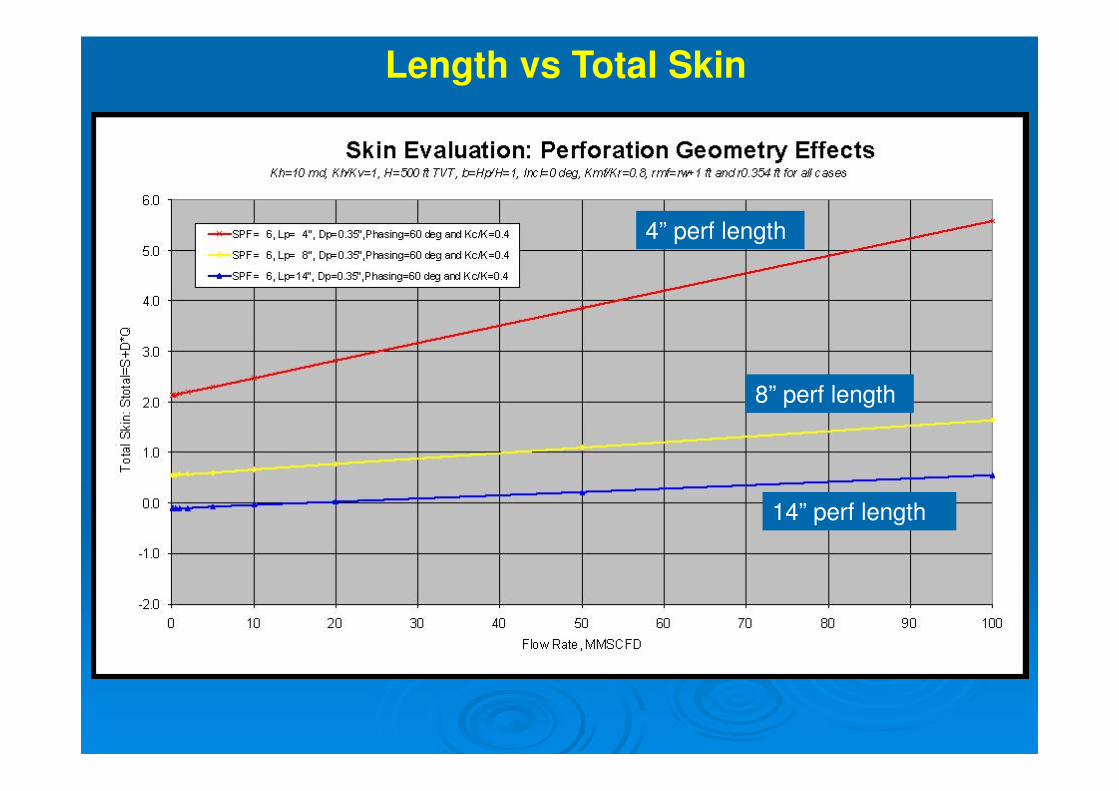
4” perf length
8” perf length
14” perf length
Length vs Total Skin

Well 3
Additional Perfs Oct
2006
2003 PLT
Low PLT Response across High
Perm zones
Initial Perf job:
• Perforated overbalanced in oil
based mud
• Poor Well Response from first perf
Job Compared to Benchmark well
perforated underbalanced
Reperf Job:
• 3 years after first perf job
• UB (live well)
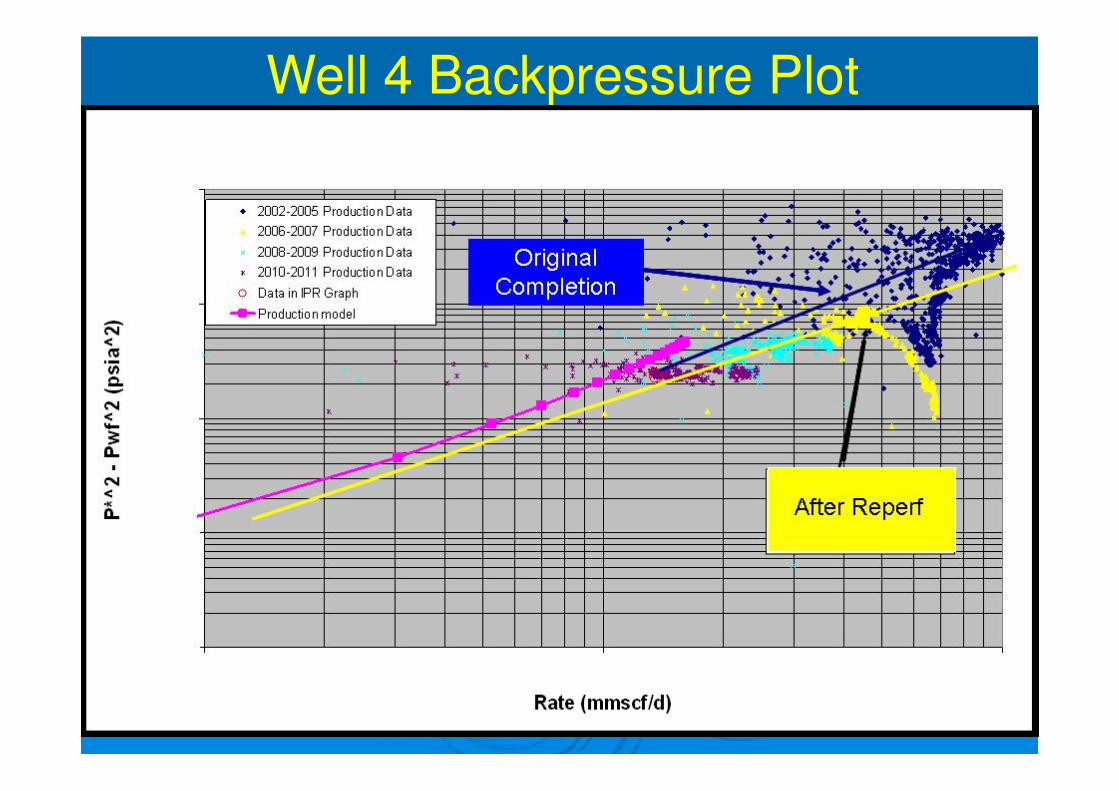
Well 4 Backpressure Plot

J03 Backpressure Plot
1.0E+05
1.0E+06
1.0E+07
1.0E+08
1 10 100
Rate (mmscf/d)
P*^
2 -
Pw
f^2 (
psia
^2
)
2002-2004
2005-2006
2007-2009
2010
Data in IPR Graph
Production Model, S = 12.5
Well 3 Backpressure Plot
Original
Completion
After Reperf