perfil de la industria automotriz global— enfoque · pdf fileventas globales...
TRANSCRIPT
Perfil de la industria automotriz global—Enfoque Argentina
Guido VildozoManager, Latin America September, 2012

Copyright © 2010 IHS Inc. All Rights Reserved.
Agenda
• Global• Regional• Brasil• Argentina• Venezuela• Chile• Colombia• Conclusiones

Copyright © 2010 IHS Inc. All Rights Reserved.
-10
-5
0
5
10
1974 1978 1982 1986 1990 1994 1998 2002 2006 2010 2014
Real GDP Industrial Production
(Percent change)
La Economía Global Procede con Cautela
3

Copyright © 2010 IHS Inc. All Rights Reserved.
-4
-2
0
2
4
6
8
10
1990 1993 1996 1999 2002 2005 2008 2011 2014
World Advanced Countries Emerging Markets
(Real GDP, percent change)
Los Mercados Emergentes Lideran la Expansión Global, No Son Inmunes
4

Copyright © 2010 IHS Inc. All Rights Reserved.
-30 -20 -10 0 10 20
China (SSEA)
Emerging Markets* (MSCI)
Japan (Nikkei 225)
Eurozone (FTSE Euro 100)
Canada (S&P TSX)
World, Developed* (MSCI)
United Kingdom (FTSE 100)
United States (S&P 500)
2012 year-to-date (Aug. 15) 2011 2010
(Percent change)
* In US dollars
Mercados Presentan Ganancias en el 2012
5

Copyright © 2010 IHS Inc. All Rights Reserved.
(Index, over 50 indicates expansion)
25
30
35
40
45
50
55
60
65
2005 2006 2007 2008 2009 2010 2011 2012
United States Eurozone China Japan
Índices de Manufactura Anuncian un Estancamiento
6
Sources: Institute for Supply Management, Markit, China Federation of Logistics and Purchasing
Copyright © 2010 IHS Inc. All Rights Reserved.
-2
0
2
4
6
8
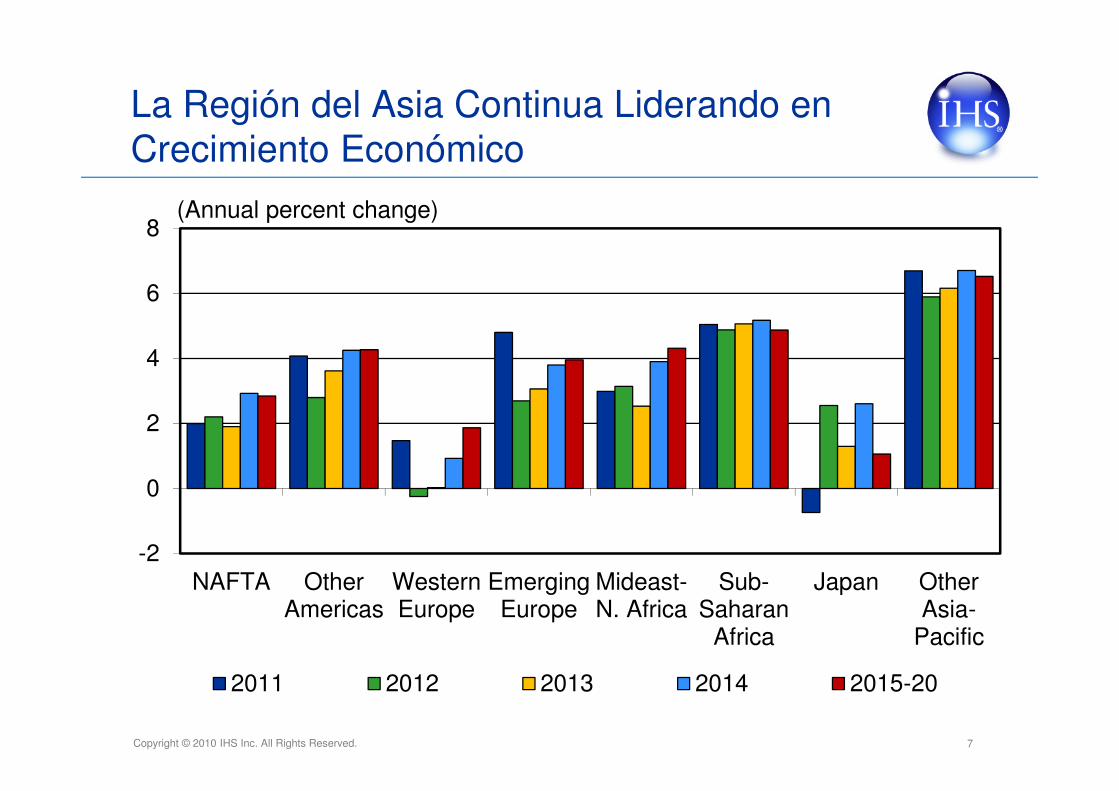
NAFTA OtherAmericas
WesternEurope
EmergingEurope
Mideast-N. Africa
Sub-Saharan
Africa
Japan OtherAsia-
Pacific
2011 2012 2013 2014 2015-20
(Annual percent change)
La Región del Asia Continua Liderando en Crecimiento Económico
7

Copyright © 2010 IHS Inc. All Rights Reserved.
-2
0
2
4
6
8
10
NAFTA OtherAmericas
WesternEurope
EmergingEurope
Mideast-N. Africa
Sub-Saharan
Africa
Japan OtherAsia-
Pacific
2011 2012 2013 2014 2015-20
(Annual percent change)
Las Tasas de Inflación Varían Regionalmente
8

Copyright © 2010 IHS Inc. All Rights Reserved.
Shocks Externos a la Industria Automotriz
Spluttering Along
Spain & Italy Defaults, EurozoneBreaks ApartGlobal FinancialCrisis II(Early Vortex)
Greece Exits
RECOVERYRe-ignites
Sub-Prime CrisisBear Sterns
OilHits $147
Lehman Bros
Economies Rebound (inventory)
Libya, Arab Spring, Oil Surges
Japan Disasters
Greek Debt Crisis kicks off
Liquidity Freeze
Global Great Recession
US Debt Ceiling DebacleDowngraded
Is Greece Europe's Lehman Bros ?
Confidence Slumps
MarketsDrag Italy Into PIIGSClass
Inflation Surges in Emerging Markets
TARP China Stimulates
Banks Recapitalised,Nationalised, Guaranteed
Fiscal Pump Priming
Private Sector Debt => Sovereign Debt
Confidence Slumps
Banking System is Stabilized
Consumer De-leveraging
Mature EconomiesGrowth Fades
Consumer De-leveragingStill There
Po
lic
y R
es
po
ns
e
Event or Shock
QEIIInterest Rates Slashed, QEI
Auto Incentives Europe, China, Brazil, Japan, US India
Auto Incentives Ending
Auto Incentives Phasing out
Auto Bail Outs, Financing and Restructuring
World Auto Sales Track
Cooling Measures In EM
Japan Supply Chain Crisis
Fiscal TighteningAccelerated
Successive EU Summits-no silver bullet
Q3 08 Q4 08 Q1 09 Q2 09 Q3 09 Q4 09 Q1 10 Q2 10 Q3 10 Q4 10 Q1 11 Q2 11 Q3 11 Q4 11 Q1 12
ECB (LTRO)
ESM
Iranembargo
?

Copyright © 2010 IHS Inc. All Rights Reserved.
Ventas Globales
50
60
70
80
90
100
110
120
2000 2002 2004 2006 2008 2010 2012 2014 2016 2018 2020
Mil
lio
ns
BASE OPTIMISTIC PESSIMISTIC
.
% CHANGE 2011 2012 2013 2014 2015
BASE 4.3% 4.7% 3.1% 6.7% 5.9%

Copyright © 2010 IHS Inc. All Rights Reserved. 11
Ventas Globales — 10 Armadoras mas Grandes
0
2
4
6
8
10
12
2000
2001
2002
2003
2004
2005
2006
2007
2008
2009
2010
2011
2012
2013
2014
2015
2016
2017
2018
2019
2020
Mil
lio
ns
Volkswagen-Porsche Toyota General Motors
Renault-Nissan Hyundai-Kia Ford
Fiat Auto-Chrysler Honda PSA
Suzuki
Units/MM Empresas buscan mayor cobertura global e eficiencia de costos

Copyright © 2010 IHS Inc. All Rights Reserved.
Ventas Globales- El Nuevo Coloso Llamado China
0
5
10
15
20
25
30
35
2000 2002 2004 2006 2008 2010 2012 2014 2016 2018 2020
Mil
lio
ns
% CHANGE 2011 2012 2013 2014 2015
BASE 3.6% 7.2% 8.7% 10.7% 8.9%
Sales struggling a bit this year, soft landing is key to long-term growth

Copyright © 2010 IHS Inc. All Rights Reserved.
Ventas Globales – Japón
3.5
4.0
4.5
5.0
5.5
6.0
2000 2002 2004 2006 2008 2010 2012 2014 2016 2018 2020
Mil
lio
ns
Tendencia de caída dada la edad de su población
% CHANGE 2011 2012 2013 2014 2015
BASE -15.6% 24.5% -7.8% -0.9% -0.1%

Copyright © 2010 IHS Inc. All Rights Reserved. 14
Ventas Globales — Europa Occidental
12
13
14
15
16
17
2000
2001
2002
2003
2004
2005
2006
2007
2008
2009
2010
2011
2012
2013
2014
2015
2016
2017
2018
2019
2020
Millio
ns
Units/MM
% CHANGE 2011 2012 2013 2014 2015
BASE -0.3% -8.8% -2.0% 5.5% 5.3%
Austeridad fiscal limita el potencial de ventas

Copyright © 2010 IHS Inc. All Rights Reserved.
Ventas Globales – Europa Occidental
0.0
0.5
1.0
1.5
2.0
2.5
3.0
3.5
4.0
2000 2002 2004 2006 2008 2010 2012 2014 2016 2018 2020
Mil
lio
ns
France Germany Italy Spain United Kingdom
% CHANGE 2011 2012 2013 2014 2015
France -1.4% -10.5% -4.2% 5.9% 2.7%
Germany 9.7% -2.2% -0.1% 4.1% 1.7%
Italy -9.9% -21.5% -1.0% 7.6% 11.8%
Spain -17.0% -16.7% -2.4% 13.1% 24.3%
UK -2.3% 1.1% -0.8% 5.6% 5.6%
El sur sufre, mientras que el norte aun paga los programas de incentivos

Copyright © 2010 IHS Inc. All Rights Reserved. 16
Ventas Globales — Europa Oriental y Central
2
3
4
5
6
7
8
2000
2001
2002
2003
2004
2005
2006
2007
2008
2009
2010
2011
2012
2013
2014
2015
2016
2017
2018
2019
2020
Millio
ns
Units/MM
% CHANGE 2011 2012 2013 2014 2015
BASE 23.8% 3.3% 3.0% 9.3% 6.0%
La nueva esperanza Europea

Copyright © 2010 IHS Inc. All Rights Reserved.
Ventas Globales – Norte América
10
11
12
13
14
15
16
17
18
19
20
21
22
2000 2002 2004 2006 2008 2010 2012 2014 2016 2018 2020
Mil
lio
ns
BASE OPTIMISTIC PESSIMISTIC
% CHANGE 2011 2012 2013 2014 2015
BASE 9.3% 10.3% 3.8% 5.2% 3.7%
EUA lidera la recuperación regional con el apoyo de México y Canadá

Copyright © 2010 IHS Inc. All Rights Reserved.
Ventas Globales - Sud América
1
2
3
4
5
6
7
8
9
10
2000 2002 2004 2006 2008 2010 2012 2014 2016 2018 2020
Mil
lio
ns
BASE OPTIMISTIC PESSIMISTIC
% CHANGE 2011 2012 2013 2014
BASE 9.3% 5.5% -0.6% 6.1%
Copyright © 2010 IHS Inc. All Rights Reserved. 19
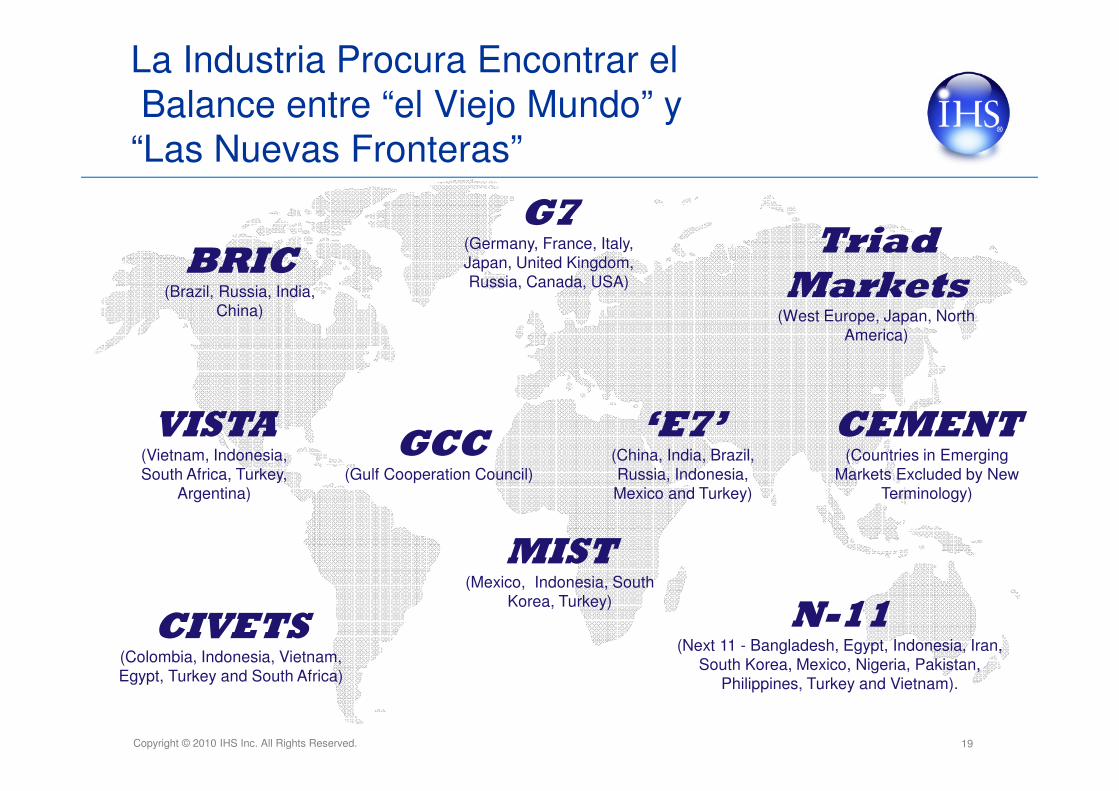
La Industria Procura Encontrar elBalance entre “el Viejo Mundo” y
“Las Nuevas Fronteras”
Triad
Markets(West Europe, Japan, North
America)
‘E7’(China, India, Brazil, Russia, Indonesia, Mexico and Turkey)
G7(Germany, France, Italy, Japan, United Kingdom, Russia, Canada, USA)
BRIC(Brazil, Russia, India,
China)
VISTA(Vietnam, Indonesia, South Africa, Turkey,
Argentina)
MIST(Mexico, Indonesia, South
Korea, Turkey)
GCC(Gulf Cooperation Council)
N-11(Next 11 - Bangladesh, Egypt, Indonesia, Iran,
South Korea, Mexico, Nigeria, Pakistan, Philippines, Turkey and Vietnam).
CEMENT(Countries in Emerging
Markets Excluded by New Terminology)
CIVETS(Colombia, Indonesia, Vietnam, Egypt, Turkey and South Africa)

Copyright © 2010 IHS Inc. All Rights Reserved. 20
Tasas de MotorizaciónV
ehic
les
In U
se P
er 1
000
Peo
ple
GDP Per Capita (in thousand 2005 US$)
US
Sweden
Russia
S Korea
Japan
Australia
Brazil
ItalySlovenia
Spain
China
PolandCzech Rep
Canada
UK
France
Germany
Taiwan
India
Thailand
Hungary
Mexico
TurkeyChile
Each $1000 increase in wealth leads to 15 more vehicles per 1000
people.
Source: CY2010 Data, IHS Data Insights

Copyright © 2010 IHS Inc. All Rights Reserved.
y = -0.0000003749x2 + 0.0272263164x - 76.5859828870
R2 = 0.7429749568-100
0
100
200
300
400
500
600
0 5000 10000 15000 20000 25000 30000 35000 40000 45000 50000 55000
21
Ventas Globales Modelo de Saturación de Carros Pasajeros
GDP Per Capita PPP in USD (2005)
Car densityper 1000 pop

Copyright © 2010 IHS Inc. All Rights Reserved. 22
Ventas Globales –Triad vs BRICs vs ROW
0
20.000.000
40.000.000
60.000.000
80.000.000
100.000.000
120.000.000Beyond BRIC BRIC Mature
Realces:
• El 2000 aprox 80% de la ventasglobales era en los mercadosmaduros. Este año será el 48% ypara el 2019 se reduce a 40%.
• Los mercados maduros novolverán a los volúmenes previosa la crisis del 2007.
• China va contribuir cerca al28% del crecimiento global hastael 2019.
78.7 million
105.5 million

Copyright © 2010 IHS Inc. All Rights Reserved. 23
El “Viejo Mundo” cede a “Nuevas Fronteras”
0
5
10
15
20
25
30
35
40
45
50
2000
2001
2002
2003
2004
2005
2006
2007
2008
2009
2010
2011
2012
2013
2014
2015
2016
2017
2018
2019
2020
Mil
lio
ns
TRIAD BRICS ROW
Units/MM
ROW = Rest of World
BRICS = Brazil, Russia, India, China
TRIAD = North America, Western Europe, Japan
ROW – Iran, Saudi Arabia, South Africa are the volume leaders

Copyright © 2010 IHS Inc. All Rights Reserved. 24
Ventas Globales: La próxima onda expansiva
Population in Mio.
GDP/Capita in Real US-$
Population in Mio.
GDP/Capita in Real US-$
PopulationChange
GDP/CapitaChange
BRIC China 1,347 3,142 1,385 5,547 3% 77%BRIC India 1,241 1,065 1,372 1,802 10% 69%BRIC Brazil 197 5,729 209 7,486 6% 31%BRIC Russia 143 6,872 141 8,849 -1% 29%
1 Indonesia 242 1,660 261 2,419 7% 46%2 Mexico 115 8,378 125 10,455 9% 25%3 Philippines 95 1,434 108 1,834 14% 28%4 Turkey 74 8,325 80 10,528 9% 26%5 Thailand 70 3,024 72 4,112 3% 36%6 South Africa 50 5,969 52 7,896 4% 32%7 Colombia 47 4,130 52 5,403 11% 31%8 Argentina 41 6,773 44 8,685 7% 28%9 Malaysia 29 5,735 33 7,979 13% 39%
10 Chile 17 8,568 18 11,490 6% 34%
2011 2019
Beyond BRIC Beyond BRIC
2011 vs. 2019
Beyond BRIC
Source: IHS – August 2012 Forecast

Copyright © 2010 IHS Inc. All Rights Reserved.
Producción en los BRICsA-Segment
0%
10%
20%
30%
40%
50%2007
2010
20132016
2019
BrazilChinaIndiaRussiaGlobal
25
El “share” cae globalmente excepto en Brasil
Domina en India y China pero declina a partir del 2013
Representado por OEMsChinas e Hindús y en menor escala en los OEMs Globales

Copyright © 2010 IHS Inc. All Rights Reserved.
Producción en los BRICsB-Segment
0%
20%
40%
60%
80%
100%2007
2010
20132016
2019
BrazilChinaIndiaRussiaGlobal
26
China es el mercado que menos acogida tiene para el segmento B
Domina en Brasil pero vera la presión de importados e dificultad para exportarlos
Crecimiento en Rusia en India capturando al consumidor primicio
India se fortalece con solidas exportaciones
Alta integración de plataformas globales

Copyright © 2010 IHS Inc. All Rights Reserved.
Producción en los BRICsC-Segment
0%
10%
20%
30%
40%
50%2007
2010
20132016
2019
Brazil
China
India
Russia
Global
27
Brasil e India están por debajo del estándar global
El segmento pierde mercado en Rusia
Segmento con mucho potencial en la China
Casi todas las plataformas en el segmento son global e tienen “economía de escala”

Copyright © 2010 IHS Inc. All Rights Reserved.
Producción en los BRICsD/E-Segment
0%
10%
20%
30%2007
2010
20132016
2019
Brazil
China
India
Russia
Global
28
Todos los BRICs están debajo del estándar global
Rusia se estabiliza conforme revisa sus aranceles de aduana
Brasil e India tienen presencia marginal
Plataformas globales donde hay una fuerte presencia de “Crossovers”

Copyright © 2010 IHS Inc. All Rights Reserved.
Producción en los BRICsFull-Frame
0%
10%
20%
30%2007
2010
20132016
2019
Brazil
China
India
Russia
Global
29
Cambio a “uni-body” afecta a todos los mercados
Solo India tiene planes de desarrolo en “mini” chassis
Porcentaje se contrae en China e Russia con el crecimiento de sistemas de transporte publico
Lenta integracion con plataformas globales

Copyright © 2010 IHS Inc. All Rights Reserved.
40%
50%
60%
70%
80%
90%
100%
0
2
4
6
8
10
12
14
Brazil China India Russia ROW
2019 Capacity U
tilization %S
trai
ght T
ime
Cap
acity
Cha
nge
(Mill
ions
)
2012-2019 Change 2012 Utilization 2019 Utilization
Straight-Time Capacity = Core shift set up 1, 2 or 3 shifts
Crecimiento en Capacidad 2012 vs. 2019

Copyright © 2010 IHS Inc. All Rights Reserved.
Expansión en Capacidad 2012 - 2019
0 100 200 300 400
Ford
Mitsubishi
PSA
GM
Jianghuai
Chery
Honda
Ren/Niss
VW
Fiat
Straight-time Capacity - Thousands
Brasil
0 30 60 90 120
Ren/Niss
PSA
GAZ Group
Fiat
VW
Straight-time Capacity - Thousands
Rusia
31

Copyright © 2010 IHS Inc. All Rights Reserved.
Expansión en Capacidad 2012 - 2019
0 250 500 750 1000
Honda
Ren/Niss
Tata
Hyundai
VW
GM
Ford
Bajaj Auto
Mahindra
Maruti/Suzuki
Straight-time Capacity – Thousands
India
0 300 600 900 1200
Geely
Dongfeng
FAW-VW
Dongfeng-Yueda-Kia
Great Wall
SAIC-GM-Wuling
**S-GM
Chery
Changan-Ford-Mazda
*S-VW
Straight-time Capacity - Thousands
China
32
* S-VW = Shanghai VW, ** S-GM = Shanghai GM

Copyright © 2010 IHS Inc. All Rights Reserved. 33
0,0
1,0
2,0
3,0
4,0
5,0
6,0
7,0
8,0
9,0
Millo
nes
Venezuela
Uruguay
Peru
Paraguay
Ecuador
Colombia
Chile
Brazil
Bolivia
Argentina
Venta Regional por País-Volumen

Copyright © 2010 IHS Inc. All Rights Reserved. 34
0,0
1,0
2,0
3,0
4,0
5,0
6,0
7,0
8,0
Millo
nes
Venezuela
Uruguay
Peru
Ecuador
Colombia
Chile
Brazil
Argentina
Producción Regional por País-Volumen
Copyright © 2010 IHS Inc. All Rights Reserved.
Brasil – Afrontando la desaceleración• Brasil no es inmune a la situación económica global, lo bueno es que hay
bastante inversión publica por delante que compensaran los efectos de la crisis.• La administración Rousseff consolida el rol del aparato publico, controlando
gastos para preparar fondos de emergencia. También se lanzan subsidios al consumo, reduciendo el IPI para componentes críticos de la economía.
• El Banco Central de Brasil continua con su política monetaria expansiva al reducir las tasas del SELIC.
• Las finanzas de Brasil son positivas si se comparan las reservas internacionales con la deuda externa del país.
• El Banco Central interviene la moneda mediante la venta de dólares para mantener el cambio cerca a 2 Reales por Dólar.
• Anticipamos un 2% de crecimiento para el 2012.• Complementa toda la inversión relacionada a la Copa Mundial del 2014 y las
Olimpiadas en Rio para el 2016 (aprox US$ 50 bil).• Brasil continua enfocado en ser el mayor productor de petróleo en la región en
los próximos cinco años.

Copyright © 2010 IHS Inc. All Rights Reserved.
*Annual average, **Billions of US dollars
-60
-40
-20
0
20
2004 2006 2008 2010 2012 20141,5
2,0
2,5
3,0
2004 2006 2008 2010 2012 2014
-202468
2004 2006 2008 2010 2012 2014
Real GDP Growth (%) Consumer Price Inflation (%)
Exchange Rate per USD* Current-Account Balance**
0
2
4
6
8
2004 2006 2008 2010 2012 2014
Brasil Perfil Económico

Copyright © 2010 IHS Inc. All Rights Reserved. 37
-10,0
-8,0
-6,0
-4,0
-2,0
0,0
2,0
4,0
6,0
8,0
10,0
1990 1995 2000 2005 2010 2015 2020
Real GDP
(Percent Change)
PIB- Crecimiento Económico
El PIB creció 2.8% en promedio entre 1955-2005El PIB creció 2.8% en promedio entre 1955-2005
GDP Growth 2006-10 (4.45%) 2011-15 (3.48%) 2016-20 (4.51%)

Copyright © 2010 IHS Inc. All Rights Reserved. 38
60
70
80
90
100
110
120
50
100
150
200
250
300
350
2000 2001 2002 2003 2004 2005 2006 2007 2008 2009 2010 2011 2012
LV Sales (left scale) Employment Index (right scale)
Ventas Mensuales– Promedio Trimestral vs Índice de Empleo Formal
El empleo formal genera consumoEl empleo formal genera consumo
Thousand Units

Copyright © 2010 IHS Inc. All Rights Reserved. 39
Ventas Mensuales – Promedio Trimestral vs Financiamiento
20
25
30
35
40
45
50
55
6050
100
150
200
250
300
350
2000 2001 2002 2003 2004 2005 2006 2007 2008 2009 2010 2011 2012
LV Sales (left scale) APR Financing (right scale)
PercentThousand Units

Copyright © 2010 IHS Inc. All Rights Reserved. 40
Incremento en Mora Bancaria para Prestamos al Consumo Automotriz
0,0
1,0
2,0
3,0
4,0
5,0
6,0
7,0
2000 2001 2002 2003 2004 2005 2006 2007 2008 2009 2010 2011 2012
Percent

Copyright © 2010 IHS Inc. All Rights Reserved. 41
Brasil: tasas de empleo, financiamiento e salarios tienen un impacto histórico
-.15
-.10
-.05
.00
.05
.10
.15
13.2
13.6
14.0
14.4
14.8
15.2
90 92 94 96 98 00 02 04 06 08 10
Residual Actual Fitted

Copyright © 2010 IHS Inc. All Rights Reserved. 42
0,0
1,0
2,0
3,0
4,0
5,0
6,0
7,0
8,0
0,0
1,0
2,0
3,0
4,0
5,0
6,0
7,0
8,0
1994 1996 1998 2000 2002 2004 2006 2008 2010 2012 2014 2016 2018 2020
Current Base Pessimistic (20%) Optimistic (20%)
Million Units
Perspectiva de Ventas Brasil
El IPI genera incertidumbre a corto plazoEl IPI genera incertidumbre a corto plazo

Copyright © 2010 IHS Inc. All Rights Reserved.
0%
10%
20%
30%
40%
50%
60%
70%
80%
90%
100%
2005 2007 2009 2011 2013 2015 2017 2019
Others Chery Jianghuai Mitsubishi Honda
Toyota PSA Hyundai Renault/Nissan Ford
General Motors Volkswagen Fiat
Percentage
Brasil –Market Share
Los grandes pierdenLos grandes pierden

Copyright © 2010 IHS Inc. All Rights Reserved.
Brasil tiene una nueva estructura del IPI queimpacta vehículos importados
OEMs with local content
OEMs that don’t meet requirements
IPI IPI
Passenger Cars Fuel Type
Up to 1000cc Flex-Fuel 7 37
Up to 1000cc Gasoline 7 37
1001cc to 2000cc Flex-Fuel 11 41
1001cc to 2000cc Gasoline 13 43
2001cc Flex-Fuel 18 48
2001cc Gasoline 25 55
HCVs NA 30
Light Commercial Vehicles (PUPs/Vans)
NA 4 34

Copyright © 2010 IHS Inc. All Rights Reserved.
0
1000
2000
3000
4000
5000
6000
7000
8000
Investment OEMs Investment Suppliers
US $ 76 Billion 1980-2010US $ 26 Billion 2011-2026US $ 76 Billion 1980-2010US $ 26 Billion 2011-2026
US$ Millions
Inversion de la Industria Automotriz

Copyright © 2010 IHS Inc. All Rights Reserved. 46
0,50
1,50
2,50
3,50
4,50
5,50
6,50
7,50
1994 1996 1998 2000 2002 2004 2006 2008 2010 2012 2014 2016 2018 2020
Light Vehicle Production Capacity
• 5 MM capacity by 2015 • Two new plants in 2012: Hyundai, Toyota
• 5 MM capacity by 2015 • Two new plants in 2012: Hyundai, Toyota
Million Units
Producción: Inversiones Para Atender Demanda de los próximos Diez Anos

Copyright © 2010 IHS Inc. All Rights Reserved. 47
Brasil Scorecard
Pluses:
• Estabilidad Economica• Inversion Directa Extranjera• Empleo• Financiamiento
• Rentabilidad/Lucratividad• Hasta 84 Meses• Reduccion de Tasas
• Cambio de Moneda (Importados)• Apoyo Gubernamental a la Industria• PIB per Capita• Baja Densidad de Motorizacion• Producto Nuevo• Inversion de la Industria
Minuses:• Capacidad Ociosa en plantas• Falta de Capacidad del Sector
Autopartista• Infraestructura Ineficiente• Cambio de Moneda (Exportaciones)• Precio de Vehiculos Nuevos• Riesgo de Credito Privado/PIB• Crecimiento Salarial vs Inflacion• Congestion Vehicular• Dependencia en commodities

Copyright © 2010 IHS Inc. All Rights Reserved.
*Annual average, **Billions of US dollars
-5
0
5
10
15
2004 2006 2008 2010 2012 20141,52,53,54,55,56,5
2004 2006 2008 2010 2012 2014
02468
10
2004 2006 2008 2010 2012 2014
Real GDP Growth (%) Consumer Price Inflation (%)
Exchange Rate per USD* Current-Account Balance**
0
5
10
15
2004 2006 2008 2010 2012 2014
Argentina Perfil Económico
Copyright © 2010 IHS Inc. All Rights Reserved. 49
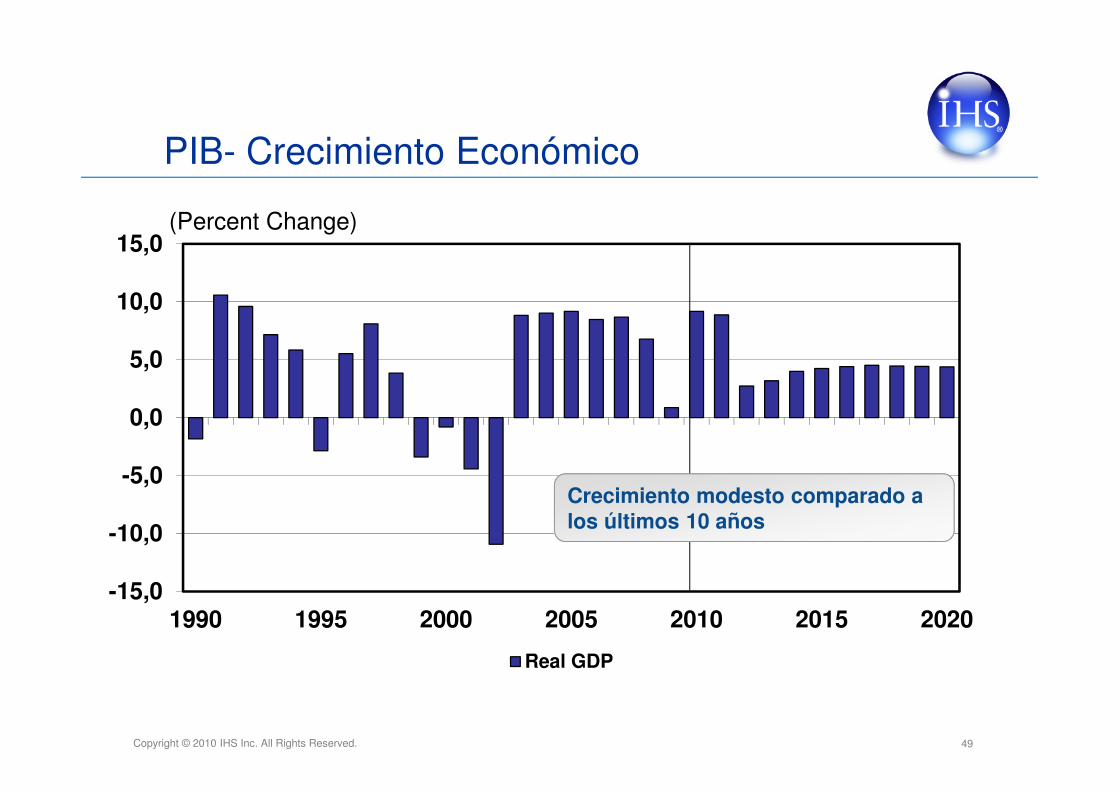
-15,0
-10,0
-5,0
0,0
5,0
10,0
15,0
1990 1995 2000 2005 2010 2015 2020
Real GDP
(Percent Change)
PIB- Crecimiento Económico
Crecimiento modesto comparado a los últimos 10 añosCrecimiento modesto comparado a los últimos 10 años

Copyright © 2010 IHS Inc. All Rights Reserved. 50
Ventas Mensuales – Promedio Trimestral vs Índice de Confianza del Consumidor
30
35
40
45
50
55
60
65
70
0
15
30
45
60
75
90
2003 2004 2005 2006 2007 2008 2009 2010 2011 2012
LV Sales (left scale) Consumer Sentiment (right scale)
PercentThousand Units
Sector permanece robusto a pesar de caída en confianzaSector permanece robusto a pesar de caída en confianza

Copyright © 2010 IHS Inc. All Rights Reserved. 51
Ventas Mensuales – Promedio Trimestral vs Exportaciones
1
2
3
4
5
6
7
8
9
0
15
30
45
60
75
90
2003 2004 2005 2006 2007 2008 2009 2010 2011 2012
LV Sales (left scale) Exports (Right)
Billion US $Thousand Units
Las exportaciones impactan el movimiento economico
Las exportaciones impactan el movimiento economico

Copyright © 2010 IHS Inc. All Rights Reserved. 52
Argentina: crecimiento económico, población y balanza comercial
-.2
-.1
.0
.1
.2
11.0
11.5
12.0
12.5
13.0
13.5
1992 1994 1996 1998 2000 2002 2004 2006 2008 2010
Residual Actual Fitted

Copyright © 2010 IHS Inc. All Rights Reserved. 53
0,0
0,2
0,4
0,6
0,8
1,0
1994 1996 1998 2000 2002 2004 2006 2008 2010 2012 2014 2016 2018 2020
Current Base Pessimistic (20%) Optimistic (20%)
Million Units
Perspectiva de Ventas Argentina
Escenario incierto a causa del panorma politico e exportaciones
Exportaciones estables, pero controles de cambio preocupanExportaciones estables, pero controles de cambio preocupan

Copyright © 2010 IHS Inc. All Rights Reserved.
0,0
50,0
100,0
150,0
200,0
250,0
300,0
350,0
400,0
0,00
2,00
4,00
6,00
8,00
10,00
12,00
14,00
16,00
18,00
Volume - L Market Share - R
Million Units
Argentina –Parque automotor
Units per ‘000

Copyright © 2010 IHS Inc. All Rights Reserved.
0%
10%
20%
30%
40%
50%
60%
70%
80%
90%
100%
2005 2007 2009 2011 2013 2015 2017 2019
Others BMW Chery Daimler Hyundai
Honda Toyota Fiat Ford PSA
Renault/Nissan General Motors Volkswagen
Percentage
Argentina –Market Share
Los Asiaticos quieren crecerLos Asiaticos quieren crecer
Copyright © 2010 IHS Inc. All Rights Reserved. 56
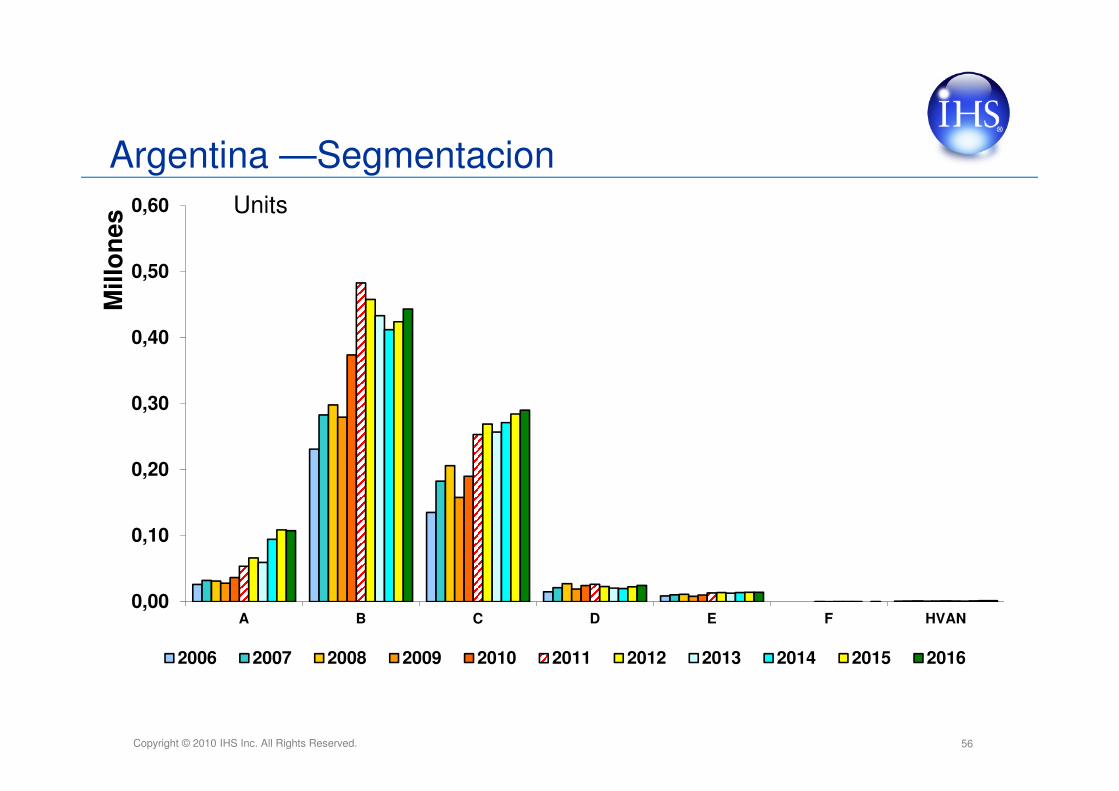
Argentina —Segmentacion
0,00
0,10
0,20
0,30
0,40
0,50
0,60
A B C D E F HVAN
Mil
lon
es
2006 2007 2008 2009 2010 2011 2012 2013 2014 2015 2016
Units

Copyright © 2010 IHS Inc. All Rights Reserved. 57
0,00
0,20
0,40
0,60
0,80
1,00
1,20
1,40
1,60
1,80
1995 1997 1999 2001 2003 2005 2007 2009 2011 2013 2015 2017 2019
Light Vehicle Production Capacity
• Capacidad: 1.2 million • No hay plantas adicionales• Capacidad: 1.2 million • No hay plantas adicionales
Million Units
Producción: Inversiones que Complementan el Crecimiento de MERCOSUR

Copyright © 2010 IHS Inc. All Rights Reserved. 58
Argentina Scorecard
Pluses:
• Commodities• Mayor exportador de oro• Estabilizacion de Finanzas Publicas• Infraestructura (Energia)• Empleo• Cambio de moneda (Exportaciones)• Apoyo Gubernamental a la Industria• Nueva gama de productos• Inversion de las terminales
Minuses:
• Inflacion• Confianza del Consumidor• Cambio de Moneda (Importados)• Demografias• Crecimiento de la Poblacion• Motorizacion• Dependencia en commodities

Copyright © 2010 IHS Inc. All Rights Reserved.
*Annual average, **Billions of US dollars
0
10
20
30
40
2004 2006 2008 2010 2012 20141,52,53,54,55,56,5
2004 2006 2008 2010 2012 2014
-505
101520
2004 2006 2008 2010 2012 2014
Real GDP Growth (%) Consumer Price Inflation (%)
Exchange Rate per USD* Current-Account Balance**
0
10
20
30
40
2004 2006 2008 2010 2012 2014
Venezuela Perfil Económico

Copyright © 2010 IHS Inc. All Rights Reserved. 60
0,0
0,1
0,2
0,3
0,4
0,5
0,0
0,1
0,2
0,3
0,4
0,5
1994 1996 1998 2000 2002 2004 2006 2008 2010 2012 2014 2016 2018 2020
Current Base Pessimistic (25%) Optimistic (15%)
Million Units
Perspectiva de Ventas Venezuela
Mas un arte que cienciaMas un arte que ciencia

Copyright © 2010 IHS Inc. All Rights Reserved. 61
0,00
0,05
0,10
0,15
0,20
0,25
0,30
1995 1997 1999 2001 2003 2005 2007 2009 2011 2013 2015 2017 2019
Light Vehicle Production Capacity
• Capacidad 250K• Riesgo de nacionalización• Nuevos players?
• Capacidad 250K• Riesgo de nacionalización• Nuevos players?
Million Units
Producción: Limitados por políticas de cambio de moneda

Copyright © 2010 IHS Inc. All Rights Reserved. 62
Venezuela Scorecard
Pluses:
• Precios establecidos por orden Gubernamental
• Precio de usados• Tiendas “sociales”• Precio del petróleo• Elecciones• Potencial de 500K• Baja motorización
Minuses:• Quota de importacion• Acceso a moneda extranjera• Inflacion• Panorama Politico• Diferentes tarifas de cambio de
moneda• Sindicatos• Precios establecidos por el Gobierno• Perdidas de las terminales• Capacidad de sector de autopartes• Nacionalizacion• Dependencia del petroleo

Copyright © 2010 IHS Inc. All Rights Reserved.
*Annual average, **Billions of US dollars
-10
-5
0
5
10
2004 2006 2008 2010 2012 20141,5
201,5
401,5
601,5
801,5
2004 2006 2008 2010 2012 2014
-4-202468
2004 2006 2008 2010 2012 2014
Real GDP Growth (%) Consumer Price Inflation (%)
Exchange Rate per USD* Current-Account Balance**
02468
10
2004 2006 2008 2010 2012 2014
Chile Perfil Económico

Copyright © 2010 IHS Inc. All Rights Reserved. 64
Chile: economía, población y demografías salariales
-.3
-.2
-.1
.0
.1
.2
.3
11.2
11.6
12.0
12.4
12.8
1992 1994 1996 1998 2000 2002 2004 2006 2008 2010
Residual Actual Fitted

Copyright © 2010 IHS Inc. All Rights Reserved. 65
0,0
0,1
0,2
0,3
0,4
0,5
1995 1997 1999 2001 2003 2005 2007 2009 2011 2013 2015 2017 2019
Current Base
Million Units
Perspectiva de Ventas Chile
Chile should post a negative 2012 given global economicsChile should post a negative 2012 given global economicsChile contraerá el 2012 dado el comportamiento económico global
Chile contraerá el 2012 dado el comportamiento económico global

Copyright © 2010 IHS Inc. All Rights Reserved.
*Annual average, **Billions of US dollars
-15
-10
-5
0
2004 2006 2008 2010 2012 20141500,0
2000,0
2500,0
3000,0
2004 2006 2008 2010 2012 2014
0
2
4
6
8
2004 2006 2008 2010 2012 2014
Real GDP Growth (%) Consumer Price Inflation (%)
Exchange Rate per USD* Current-Account Balance**
0
2
4
6
8
2004 2006 2008 2010 2012 2014
Colombia Perfil Económico

Copyright © 2010 IHS Inc. All Rights Reserved. 67
Colombia: economía, población y demografías salariales
-.6
-.4
-.2
.0
.2
.4
.6
10.5
11.0
11.5
12.0
12.5
13.0
1992 1994 1996 1998 2000 2002 2004 2006 2008 2010
Residual Actual Fitted

Copyright © 2010 IHS Inc. All Rights Reserved. 68
0,0
0,1
0,2
0,3
0,4
0,5
0,6
0,7
0,8
1995 1997 1999 2001 2003 2005 2007 2009 2011 2013 2015 2017 2019
Current Base
Million Units
Perspectiva de Ventas Colombia
Colombia tiene el reto de incertidumbre en la economía global a corto plazo
Colombia tiene el reto de incertidumbre en la economía global a corto plazo

Copyright © 2010 IHS Inc. All Rights Reserved. 69
Conclusiones• Crecimiento económico y mejor disponibilidad de crédito
han generado ventas automotrices.
• Existe un cambio, donde los mercados “emergentes” generaran crecimiento.
• Hay que estar alerta al riesgo en Europa.
• La región tiene mucho potencial pero vemos medidas proteccionistas.
• La region se separa en dos grupos: Brasil, Chile, Colombia e Peru y Argentina, Ecuador, Venezuela
• Las OEMs Koreanas e Chinas quieren ser parte del crecimiento proyectado

Copyright © 2010 IHS Inc. All Rights Reserved. 70
Muchas Gracias por VuestraAtencion!
Guido VildozoManager, Latin AmericaSeptember, [email protected]