perceptually optimized coding of color images for band-limited information networks
DESCRIPTION
http://www.seipub.org/ijc/paperInfo.aspx?ID=3335 The Mean Square Error (MSE) or the Peak Signal to Noise Ratio (PSNR) are common distortion measures used to assess image quality. Nevertheless, they are usually chosen due to their simplicity and not their performance as they are not always suitable compared to the human observer. In this work we present a Rate-Distortion approach to color image compression based on subband transforms using perceptual optimization of the compression quality. This approach is based on minimization of the Weighted Mean Square Error (WMSE) of the encoded image, which better corresponds to the quality assessment of the human eye. The WMSE can be measured in the YCbCr color space, for which visual weights are relatively easily derived. Based on the new approach, new optimized compression algorithms are introduced using the Discrete Cosine Transform and the Discrete Wavelet Transform. We compare the new algorithms to presently available algorithms suchTRANSCRIPT
International Journal of Communications (IJC) Volume 2 Issue 2, June 2013 www.seipub.org/ijc
49
Perceptually Optimized Coding of Color
Images for Band‐Limited Information
Networks Evgeny Gershikov
Department of Electrical Engineering, Ort Braude Academic College of Engineering, Karmiel, Israel
and Department of Electrical Engineering, Technion – IIT, Haifa, Israel
Abstract
The Mean Square Error (MSE) or the Peak Signal to Noise
Ratio (PSNR) are common distortion measures used to
assess image quality. Nevertheless, they are usually chosen
due to their simplicity and not their performance as they are
not always suitable compared to the human observer. In this
work we present a Rate‐Distortion approach to color image
compression based on subband transforms using perceptual
optimization of the compression quality. This approach is
based on minimization of the Weighted Mean Square Error
(WMSE) of the encoded image, which better corresponds to
the quality assessment of the human eye. The WMSE can be
measured in the YCbCr color space, for which visual weights
are relatively easily derived. Based on the new approach,
new optimized compression algorithms are introduced
using the Discrete Cosine Transform and the Discrete
Wavelet Transform. We compare the new algorithms to
presently available algorithms such as JPEG and JPEG2000.
Our conclusion is that the new WMSE optimization
approach outperforms presently available compression
systems when a human observer is considered.
Keywords
Color Image Compression; Weighted Mean Square Error; Discrete
Cosine Transform; Discrete Wavelet Transform; Perceptual Rate‐
Distortion Model; Optimal Color Component Transform; Optimal
Rate Allocation
Introduction
Many color image coding algorithms are based on
subband transforms for the compression process. The
complexity of such algorithms varies from systems
based on elementary block transforms like the DCT
(Discrete Cosine Transform) [14] used, for example, in
JPEG [21] to more complicated algorithms based on
the Lapped Biorthogonal Transform (LBT), the
Discrete Wavelet Transform (DWT), wavelet packets
and filter banks, such as EZW (Embedded Zerotree
Wavelet)[19], JPEG2000 [13][15], JPEG XR [2][16] or
uniform DFT filter banks [18]. Still it is not always
clear that the added complexity also improves the
compression results. The recently introduced Rate‐
Distortion (R‐D) model for subband transform coders
[5] can be used in such applications to assess the
performance of the compression algorithm. This R‐D
model, however, approximates the MSE distortion of
the compression results, which is not always well
correlated with subjective image quality as seen by the
human eye. More complicated distortion measures can
be proposed, such as calculating the MSE distortion
between two images after an intensity transformation
and filtering for gray‐scale images [11] or a similar
process using a non‐linear transformation of the
primary color components, followed by filtering, for a
color image [1]. A basic measure that is similar to the
MSE, but can incorporate perceptual weights is the
Weighted MSE (WMSE). This measure assigns a
different weight to the MSE of each subband of the
image, thus simulating the varying sensitivity of the
Human Visual System (HVS) to different horizontal
and vertical spatial frequencies. As a more realistic
tool, it can improve the assessment of the model.
The goal of this work is to develop a perceptual Rate‐
Distortion (R‐D) model of subband transform coders
based on the WMSE as the distortion measure. We
demonstrate the efficiency of the new model for
subband transform coding by presenting a new type of
compression algorithms based on perceptual
optimization of the pre‐processing stage and of the
subband rates allocation.
Objective Rate‐Distortion Theory of Subband
Transform Coders
Consider a general subband transform coder for color
images. Typically, the image samples are first pre‐
processed, then subband transformed and quantized
and finally post‐processed losslessly. A detailed
description of these stages is given below.

www.seipub.org/ijc International Journal of Communications (IJC) Volume 2 Issue 2, June 2013
50
1) Pre‐processing
Here a CCT (Color Components Transform) is applied
to the RGB color components of the image. We denote
the RGB components in vector form as
and the new color components as . The
size CCT matrix is denoted as M. This stage can
be written as:
(1)
The goal of using the CCT transform is usually to de‐
correlate the highly correlated RGB components
[7][10][15][23]. The CCT transform is often followed by
level shifting as for example is the case in JPEG2000
[13] so that the sample range of values becomes
symmetric around zero.
2) Subband Transforming and Quantizing
A subband transform, such as the DCT or the DWT is
applied to each color component. The subband
coefficients of each color component are then
quantized. An independent uniform scalar quantizer
for each subband is used.
3) Post‐processing
The quantized coefficients are encoded losslessly. The
goal is to reduce the number of bits required for the
coefficients without loss of information. Techniques
such as run‐length encoding, zero trees, delta
modulation and entropy coding are used here. This
stage has to be adapted to the subband transform used.
To derive the R‐D behavior of the algorithm, first the
R‐D of a scalar uniform quantizer needs to be
considered. Assuming that a random signal with
variance is quantized by such a quantizer, its Rate‐
Distortion behavior has been approximated by [6][20]:
(2)
where R is the rate and is a constant dependent
upon the distribution of . Then based on (2) the R‐D
model of a general monochromatic subband coder
with subbands can be expressed as:
(3)
Here is the MSE of subband ,
is its variance, is its energy gain [20] and is the
rate allocated to it. Also is its sample rate, i.e., the
relative part of the number of coefficients in it from the
total number of samples in the signal. is a constant
equal to .
Consider now a color image. The coding algorithm
described in the beginning of this section may be
regarded as applying a CCT to the image, followed by
monochromaticly subband coding each of the new
color components. The Rate‐Distortion model of this
algorithm is [2]:
(4)
where and have the same meaning as before,
but for subband of color component ( ).
Optimal rates allocation for the subbands can be found
by minimizing the expression of Equation (4) under
the rate constraint:
(5)
for some total image rate . Here down‐sampling
factors have been used. denotes how much the
number of samples of color component has been
reduced by down‐sampling. For example, if the down‐
sampling is by a factor of 2 horizontally and vertically
then:
The optimal rates under the rate constraint of (5) as
well as non‐negativity constraints are:
3
1
3
1
2 2 1
1 23
1
( )
1 ,
( )k k
j jj
bi
j jj
Ti b bi ii
i
T Actk kkk
kk
RR
G
lna
GM
MM
MM
(6)

International Journal of Communications (IJC) Volume 2 Issue 2, June 2013 www.seipub.org/ijc
51
Where ib Act with iAct denoting the set of non zero (or active) rates in the color component
, i.e.,
(7)
Also
(8)
The structure of this work is as follows. In the next
section the perceptual Rate‐Distortion model is
introduced. Section “Perceptually Optimized
Compression” presents new color compression
algorithms optimized according to this model based
on the DCT subband transform and on the DWT.
Simulations of the new algorithms and comparison to
presently available algorithms are provided in this
section. Our conclusions and summary are given in
the final section.
The Perceptual R-D Model
We assume here that we are given the visual
perception weights corresponding to the subbands of
a certain subband transform (SBT) in a color space.
Such a space can be, for example, YCbCr as we have
chosen in this work. We now wish to derive an
expression for the WMSE distortion of a coder based
on the subband transform. The same coder described
in Subsection “Objective Rate‐Distortion theory of
subband transform coders” is assumed, so that a CCT
is applied to the RGB color components of the image
prior to coding and the actual image data compression
is performed in another color space denoted C1C2C3.
We denote as the vector of the SBT
coefficients at some index in subband in the YCbCr
color space. Similarly, the vector of subband
coefficients in the C1C2C3 color space is denoted
. Due to the linearity of the SBT, the
following relationship holds:
(9)
where stands for the CCT matrix from the YCbCr
color space to the C1C2C3 space. If is the CCT
matrix from RGB to C1C2C3 and is the RGB to
YCbCr matrix, then:
(10)
Since the SBT coefficients are lossy encoded, errors are
introduced between the reconstructed coefficients
in the YCbCr color space and the original ones. The
error covariance matrix for the subband in the
YCbCr domain is:
(11)
where denotes statistic mean. Similarly in the
C1C2C3 domain:
(12)
and using (9) we can express by as:
(13)
The MSE distortions of the YCbCr color
components in subband are the diagonal elements of
and thus:
(14)
where is the row of in column form. In a
similar fashion, the diagonal elements of can be
recognized as the MSE distortions of the , ,
color components, given by (2) and slightly rewritten
to become:
(15)
where and biR and , denote the
rate and variance of subband of color component ,
respectively. Note that we continue here with the
consistent notation of a tilde for the variables related
to the C1C2C3 color space. Assuming that the
quantization errors of the three color components in
each subband in the C1C2C3 domain are uncorrelated,
becomes a diagonal matrix and (14) becomes
(16)
once (15) is substituted for . Now if, for the sake of
convenience, we denote the YCbCr color components
at each pixel as a vector , then the
WMSE of the color component is:
(17)
As can be seen, this expression incorporates the energy
gains of the subbands as well as their sample rates
. Also the visual weights are part of the
expression, providing varying significance to different
subbands of the same color component as well as
between color components. Defining the total WMSE
as the average WMSE of the YCbCr color components,
we get:
3
1
3 1
1 0
1( )
3
1
3
ii
B
b b bi bii b
WMSE WMSE x
G w d
YCbCr
(18)
and after substituting (16) for the expression
becomes:

www.seipub.org/ijc International Journal of Communications (IJC) Volume 2 Issue 2, June 2013
52
21 23 1 32
1 0 1
2121 3 3 _2
0 1 1
_
13
1.
3
bk
bk
BaR
bkb b bi ki b k ik
BaR
bkb b k bib k i ik
WMSE G w e
G e w
M
M
(19)
To simplify (19) we denote:
(20)
so that the WMSE expression becomes:
(21)
Clearly, if the visual weights are all equal to 1, the
WMSE expression of (21) should become the
expression for the MSE in the YCbCr domain. This
expression is given exactly by (4) with the difference
that there is to be replaced by in our case. From
the comparison of equations (21) and (4) we conclude
that in that case, which means
according to (20) that
(22)
A straightforward check proves that this is indeed the
case.
De‐correlation of the Quantization Errors
In the derivation of the WMSE expression of (21) we
have assumed that the quantization errors of the , ,
color components are uncorrelated in each subband.
It is of interest to note that the assumption in the
derivation of the MSE expression of (4) was the lack of
correlation of the quantization errors in the image
domain [2], i.e. that and have zero
correlation for , . Note that
denotes here the reconstructed component. The
question that rises is whether the assumption of zero
correlation in each subband means also zero
correlation in the image domain.
Using the vector space interpretation of subband
transforms [20], we can write for the color component
:
(23)
here is the color component in vector form after
lexicographic ordering. are the SBT synthesis
vectors. Also the sum on is on all the coefficient
indices in the subband, denotes the subband
coefficient of at index and is the same
coefficient after quantization and reconstruction. Now
consider the expression for
, where is the number of the image pixels.
Using Equation (23), it can be written as:
(24)
where . Assuming zero
correlation of the quantization errors of the different
color components in each subband and between
subbands means that , hence
immediately follows
according to (24). But this means exactly zero
correlation of the quantization errors in image domain.
Thus the derivation of the WMSE expression of (21) is
once again consistent with the derivation of the MSE
expression of (4).
Basic Optimization Using the WMSE Model
After deriving the WMSE expression, the natural next
step is to use it to find the optimal rates and optimal
CCT in the WMSE sense. First we wish to minimize
the WMSE of (21), subject to the rate constraint
, resulting in the following
Lagrangian ( is the Lagrange multiplier):
(25)
which is minimized by the optimal rates given by:
(26)
Here
(27)
Note that no constraints for non‐negativity of the rates
are used here, which means that high rates are
assumed. As for the optimal CCT matrix : it can be
found by minimizing the target function , that is
actually the denominator of the in (26) after some
straightforward manipulations:
(28)

International Journal of Communications (IJC) Volume 2 Issue 2, June 2013 www.seipub.org/ijc
53
We should remind here that is a function of as
given in (20). Also the variances depend on , or
more specifically on . These variances are the
diagonal elements of the subband covariance matrix
in the C1C2C3 image domain:
(29)
and can also be expressed using the matrix and the
subband b covariance matrix in the RGB image
domain:
Λ ,
T
Y YE Y Y
b b
RGB RGB RGB RGBb b b
Y E Y b
RGB RGBb
(30)
according to:
(31)
Here is defined similarly to the
definitions in the beginning of the section of . Also
denotes the row of the matrix in vector form.
Thus the target function can be rewritten as:
3 1_
1 0
213 _
1
( ) ( Λ ) ,
.
bB
Tb bk
k b
bk bii ik
f m m G
w
k b kM
M
(32)
Optimal Rates with Down‐Sampling
When considering potential down‐sampling of some
of the color components, the rate constraint becomes (5)
and the Lagrangian that incorporates this constraint,
as well as constraints for the non‐negativity of the
subband rates, is:
21 3
2
0 1
3 1 3 1
1 0 1 0
1{ }, , ,{ }
3
,
bk
BaR
bkbi bi b b k bkb k
B B
i b bi bi bii b i b
L R G e
R R R
M
(33)
where are the Lagrange multipliers for the new
constraints. The rates that minimize (33) are:
3
1
3
1
2 2
23
1
1 ,
k k
j jj
bi
j jj
i b bi bk
i
Act Actk k k
kk
RR
G
lna
GM
(34)
where ib Act with iAct defined in (7) while
and i are as in (8). As for , it is given by:
(35)
Perceptually Optimized Compression
In this section we present a general approach to color
image compression using a subband transform with
perceptual optimization of the CCT and of the
subband rates allocation. This approach consists of the
stages described in the beginning of Section “Objective
Rate‐Distortion theory of subband transform coders”.
The differences here is that in the pre‐processing stage,
the perceptually optimal CCT transform is applied to
the color components and in the quantization stage the
perceptually optimal rates allocation is used. We
demonstrate this approach both for the DCT and the
DWT in the following subsections. Note that a
probability distribution model can be used for the SBT
coefficients to improve the performance of the
algorithms with respect to run‐time and compression
quality [4]. For example, the Laplacian probability
model can be assumed for DCT coefficients [9].
DCT‐Based Compression Algorithm
Since the DCT is a subband transform, the Rate‐
Distortion theory of Section “The Perceptual R‐D
Model” can be applied to it. To find the DCT visual
weights we use the HVS CSF (Contrast Sensitivity
Function) curves for the YCbCr color space that can be
found, for example, in [20]. To convert the cpd (cycle
per degree) units of these graphs to spatial frequency
units for the DCT, the equations proposed in [22] can
be used. We consider, for example,
512 512 images displayed as
on a display with dot pitch of 0.25mm.
The viewing distance is assumed to be four times the
image height [12], i.e., in this example 50cm. Similarly
we can consider images displayed as
on a big screen at a viewing distance
of 100cm.
The stages of the proposed algorithm are as follows:
1. Find the optimal CCT by minimizing (32).
2. Apply the CCT to the RGB color
components of the image to receive the new color
components , , .
3. Apply the DCT block transform to each color
component , .
www.seipub.org/ijc International Journal of Communications (IJC) Volume 2 Issue 2, June 2013
54
4. Calculate the optimal rates according to (34)
substituting there the used CCT matrix and the
variances of the DCT subbands. To find the active
subbands, the algorithm presented in [5] can be
used.
5. Quantize the DCT coefficients using a uniform
scalar quantizer in each subband. The (optimal)
quantization steps are found using an iterative
algorithm [5].
6. Use post‐quantization coding similar to the
one used in JPEG. Adaptive Huffman coding is
employed and the codes are sent with the image
data. This stage is lossless and does not affect the
image distortion.
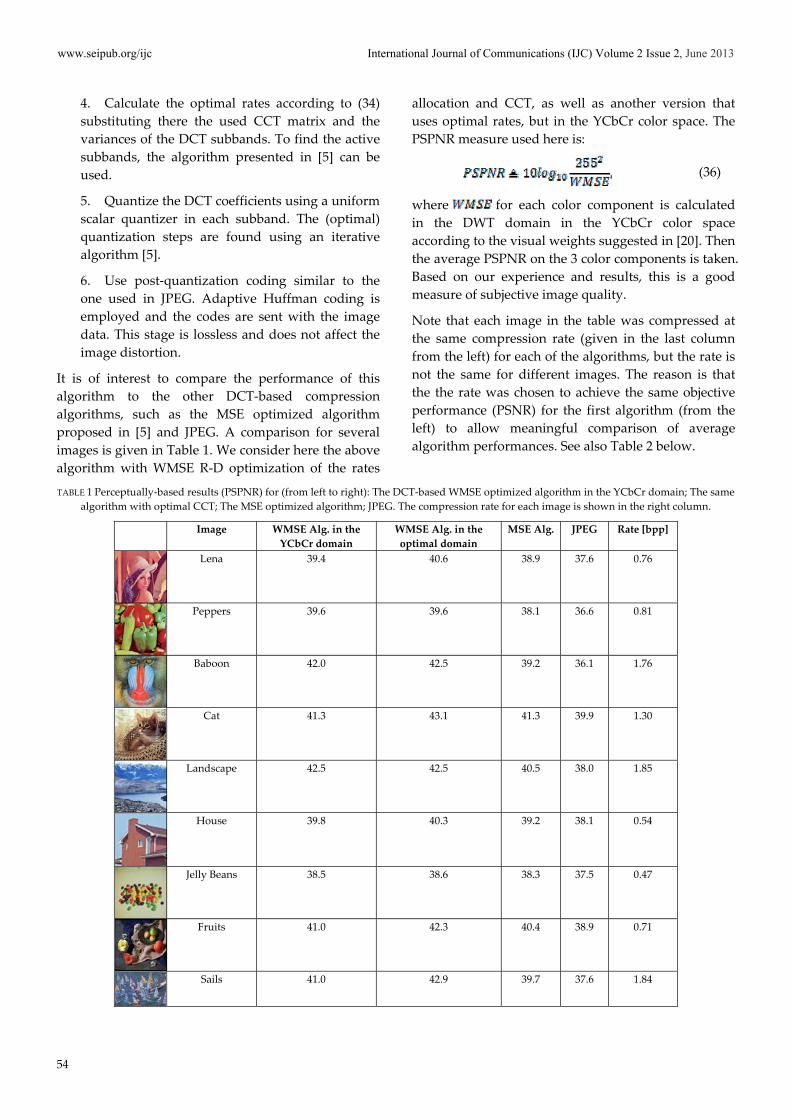
It is of interest to compare the performance of this
algorithm to the other DCT‐based compression
algorithms, such as the MSE optimized algorithm
proposed in [5] and JPEG. A comparison for several
images is given in Table 1. We consider here the above
algorithm with WMSE R‐D optimization of the rates
allocation and CCT, as well as another version that
uses optimal rates, but in the YCbCr color space. The
PSPNR measure used here is:
(36)
where for each color component is calculated
in the DWT domain in the YCbCr color space
according to the visual weights suggested in [20]. Then
the average PSPNR on the 3 color components is taken.
Based on our experience and results, this is a good
measure of subjective image quality.
Note that each image in the table was compressed at
the same compression rate (given in the last column
from the left) for each of the algorithms, but the rate is
not the same for different images. The reason is that
the the rate was chosen to achieve the same objective
performance (PSNR) for the first algorithm (from the
left) to allow meaningful comparison of average
algorithm performances. See also Table 2 below.
TABLE 1 Perceptually‐based results (PSPNR) for (from left to right): The DCT‐based WMSE optimized algorithm in the YCbCr domain; The same
algorithm with optimal CCT; The MSE optimized algorithm; JPEG. The compression rate for each image is shown in the right column.
Image WMSE Alg. in the
YCbCr domain
WMSE Alg. in the
optimal domain
MSE Alg. JPEG Rate [bpp]
Lena 39.4 40.6 38.9 37.6 0.76
Peppers 39.6 39.6 38.1 36.6 0.81
Baboon 42.0 42.5 39.2 36.1 1.76
Cat 41.3 43.1 41.3 39.9 1.30
Landscape 42.5 42.5 40.5 38.0 1.85
House 39.8 40.3 39.2 38.1 0.54
Jelly Beans 38.5 38.6 38.3 37.5 0.47
Fruits 41.0 42.3 40.4 38.9 0.71
Sails 41.0 42.9 39.7 37.6 1.84

International Journal of Communications (IJC) Volume 2 Issue 2, June 2013 www.seipub.org/ijc
55
Monarch 39.8 40.2 38.7 37.5 1.03
Goldhill 42.9 43.4 41.9 40.6 2.17
Mean 40.7 41.5 39.7 38.0
TABLE 2 Same as Table 1, but for PSNR instead of PSNR. Note that optimization of PSPNR, as induced by the human observer, does not
necessarily mean optimization of the arbitrarily used PSNR (see text).
PSNR Image WMSE Alg. in the
YCbCr domain
WMSE Alg. in the
optimal domain
MSE Alg. JPEG Rate [bpp]
Lena 30.0 30.5 30.7 29.7 0.76
Peppers 30.0 30.1 30.5 29.3 0.81
Baboon 30.0 29.0 30.5 26.5 1.76
Cat 30.0 29.6 31.3 29.5 1.30
Landscape 30.0 30.1 30.3 25.9 1.85
House 30.0 30.2 30.3 29.5 0.54
Jelly Beans 30.0 30.3 30.6 29.7 0.47
Fruits 30.0 29.8 30.6 30.6 0.71
Sails 30.0 29.7 30.6 28.9 1.84
Monarch 30.0 29.6 30.6 29.4 1.03
Goldhill 30.0 30.2 31.7 29.2 2.17
Mean 30.0 29.9 30.7 28.9
It can be concluded from the table that the WMSE
optimized algorithm with the optimal CCT achieves
the highest PSPNR, which is 1.8dB higher on average
than the PSPNR of the MSE optimized algorithm and
3.5dB above JPEG. The use of the optimal CCT in
WMSE sense increases the performance by almost 1dB
(0.8dB) on average when perceptually optimal rates
are employed. Another comparison of interest is of the
standard or objective distortions of the algorithm, i.e.,
the PSNR as presented in Table 2. As expected, the
MSE optimized algorithm is superior here, but what is
perhaps less intuitive is the fact that the use of the
optimal CCT slightly decreases the PSNR, indicating
that PSNR and PSPNR are different measures. As can
be seen in the examples of Figs. 1 ‐ 2 below, the human
observer judgement is closely related to the PSPNR,
not the PSNR. Despite this both WMSE algorithms
have MSE performance superior to JPEG with a gain
www.seipub.org/ijc International Journal of Communications (IJC) Volume 2 Issue 2, June 2013
56
of 1.1dB in the PSNR without using the optimal CCT
and slightly less (1dB) with the optimal CCT. We
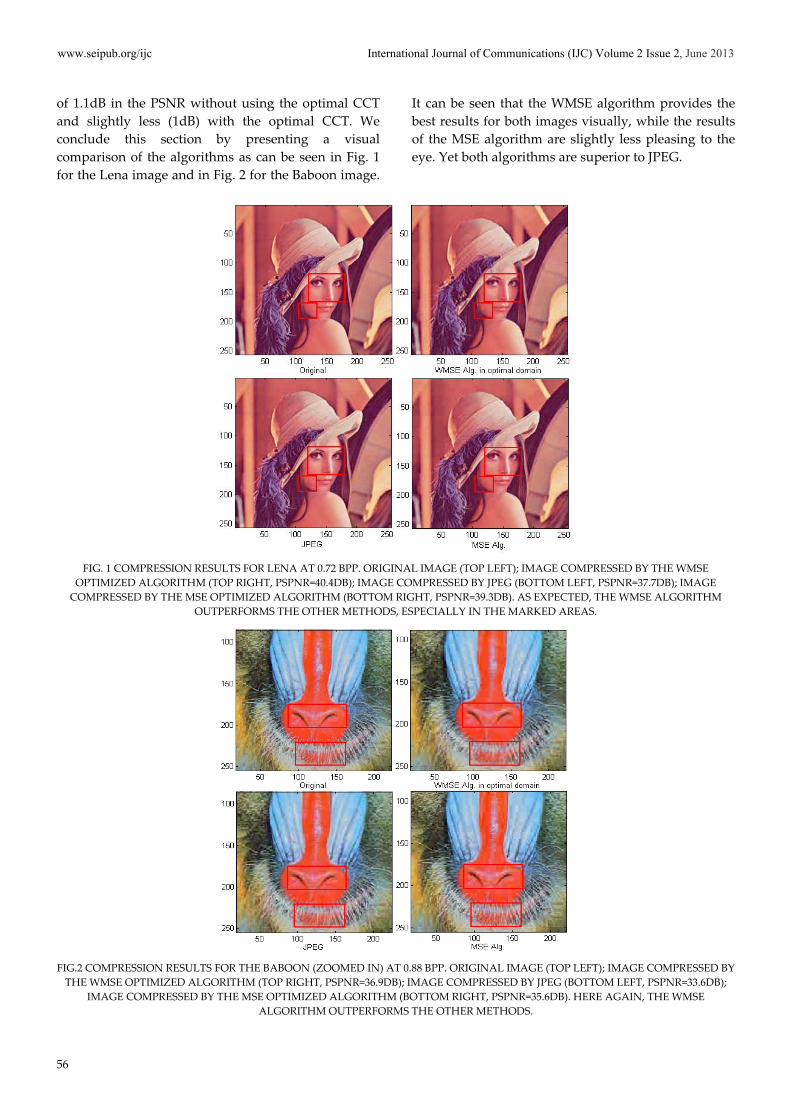
conclude this section by presenting a visual
comparison of the algorithms as can be seen in Fig. 1
for the Lena image and in Fig. 2 for the Baboon image.
It can be seen that the WMSE algorithm provides the
best results for both images visually, while the results
of the MSE algorithm are slightly less pleasing to the
eye. Yet both algorithms are superior to JPEG.
FIG. 1 COMPRESSION RESULTS FOR LENA AT 0.72 BPP. ORIGINAL IMAGE (TOP LEFT); IMAGE COMPRESSED BY THE WMSE
OPTIMIZED ALGORITHM (TOP RIGHT, PSPNR=40.4DB); IMAGE COMPRESSED BY JPEG (BOTTOM LEFT, PSPNR=37.7DB); IMAGE
COMPRESSED BY THE MSE OPTIMIZED ALGORITHM (BOTTOM RIGHT, PSPNR=39.3DB). AS EXPECTED, THE WMSE ALGORITHM
OUTPERFORMS THE OTHER METHODS, ESPECIALLY IN THE MARKED AREAS.
FIG.2 COMPRESSION RESULTS FOR THE BABOON (ZOOMED IN) AT 0.88 BPP. ORIGINAL IMAGE (TOP LEFT); IMAGE COMPRESSED BY
THE WMSE OPTIMIZED ALGORITHM (TOP RIGHT, PSPNR=36.9DB); IMAGE COMPRESSED BY JPEG (BOTTOM LEFT, PSPNR=33.6DB);
IMAGE COMPRESSED BY THE MSE OPTIMIZED ALGORITHM (BOTTOM RIGHT, PSPNR=35.6DB). HERE AGAIN, THE WMSE
ALGORITHM OUTPERFORMS THE OTHER METHODS.
International Journal of Communications (IJC) Volume 2 Issue 2, June 2013 www.seipub.org/ijc
57
DWT‐Based Compression Algorithm
When the DWT is considered, there are quite a few
options for the wavelet filter bank to be used for the
decomposition. We have chosen the Daubechies 9/7
filter bank, but obviously other choices can be
considered as well. No tiling [13] is used. The choice of
the visual weights is according to [20]. The stages of
the proposed algorithm are:
1. Find the optimal CCT by minimizing (32).
2. Apply the CCT to the RGB color
components of the image to receive the new color
components , , .
3. Apply the DWT tree decomposition up to the
required depth of the tree (3, 4, 5 or higher
according to image size) to each color component
, .
4. Calculate the optimal rates according to (34)
substituting there the used CCT matrix and the
variances, sample rates and energy gains of the
DWT subbands. The determination of the active
subbands is the same as for the DCT‐based
algorithm of the previous subsection.
5. Quantize the DWT coefficients by a uniform
quantizer with a central dead‐zone in each
subband similar to the one used in JPEG2000 Part I [8]. Use optimal quantization steps.
6. Use the post‐quantization coding of the EZW
algorithm [19] on the quantized subband coefficients. This stage is lossless and includes bit
plane coding using zero trees. The bit plane
coding is split into two passes (dominant and
subordinate) and a separate arithmetic coder is
employed for each pass.
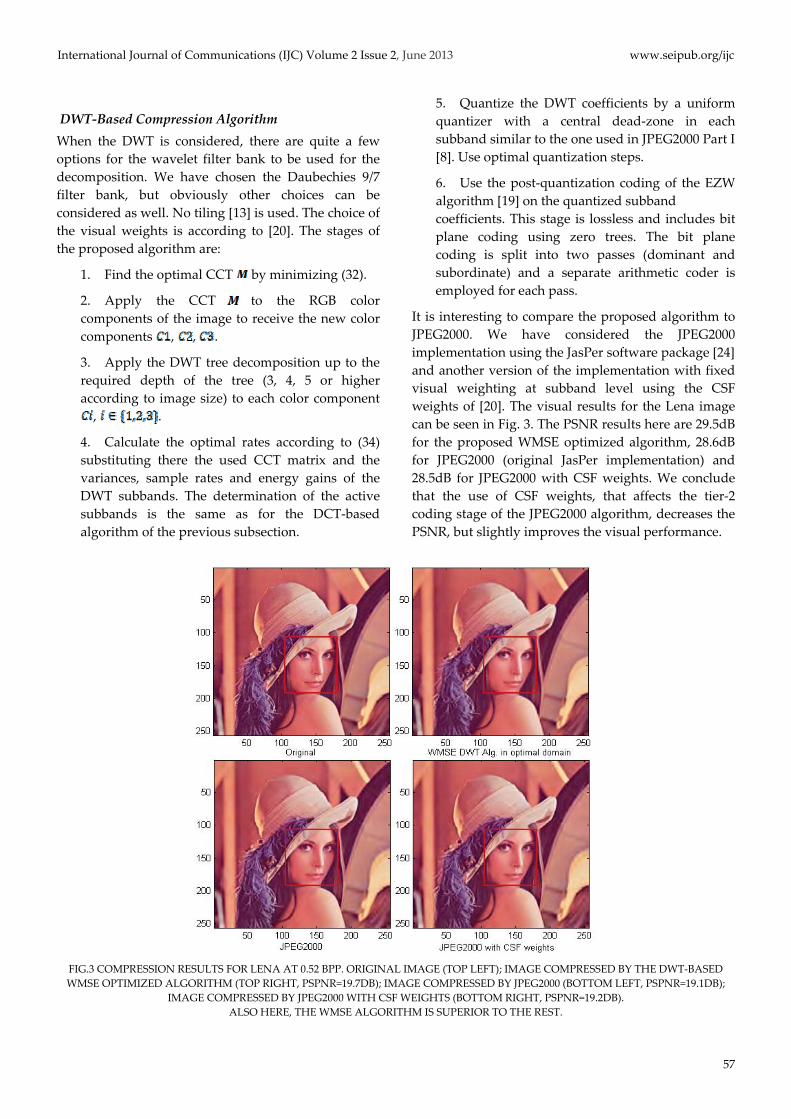
It is interesting to compare the proposed algorithm to
JPEG2000. We have considered the JPEG2000
implementation using the JasPer software package [24] and another version of the implementation with fixed
visual weighting at subband level using the CSF
weights of [20]. The visual results for the Lena image
can be seen in Fig. 3. The PSNR results here are 29.5dB
for the proposed WMSE optimized algorithm, 28.6dB
for JPEG2000 (original JasPer implementation) and
28.5dB for JPEG2000 with CSF weights. We conclude
that the use of CSF weights, that affects the tier‐2
coding stage of the JPEG2000 algorithm, decreases the
PSNR, but slightly improves the visual performance.
FIG.3 COMPRESSION RESULTS FOR LENA AT 0.52 BPP. ORIGINAL IMAGE (TOP LEFT); IMAGE COMPRESSED BY THE DWT‐BASED
WMSE OPTIMIZED ALGORITHM (TOP RIGHT, PSPNR=19.7DB); IMAGE COMPRESSED BY JPEG2000 (BOTTOM LEFT, PSPNR=19.1DB);
IMAGE COMPRESSED BY JPEG2000 WITH CSF WEIGHTS (BOTTOM RIGHT, PSPNR=19.2DB).
ALSO HERE, THE WMSE ALGORITHM IS SUPERIOR TO THE REST.

www.seipub.org/ijc International Journal of Communications (IJC) Volume 2 Issue 2, June 2013
58
Also the proposed algorithm produces an image that
is much more pleasing to the eye than JPEG2000.
Similar results can be seen in the comparison of the
proposed algorithm and JPEG2000 for other example
images in Figs. 4, 5 and 6. In Fig. 4 the loss of spatial
details at high frequencies in the Landscape and
House images as well as the introduction of false
contours in the Jelly Beans image should be noted for
JPEG2000. These effects can be seen in the marked
regions. In Fig. 5 once again the superiority of the
WMSE optimized algorithm on JPEG2000 can be seen
in regions of high frequency details as demonstrated
by the Fruits and Cat images. For example, the details
of the apple texture in the Fruits image and of the fur
and mustache textures in the Cat image are lost. In the
case of the Peppers image, the compression result of
JPEG2000 is less pleasing to the eye due to the color
artifacts introduced. Fig. 6 further demonstrates the
loss of spatial details in the case of JPEG2000
compression of the Sails image, the blurring of the
contours in the Monarch image and both effects in the
Goldhill image (see the top marked area for the
blurred contour effect and, for example, the bottom
left marked area for the loss of spatial details).
Furthermore, color artifacts are introduced by
JPEG2000 in the Goldhill image as indicated, for
instance, in the marked area in the center of the image.
FIG.4 LANDSCAPE, HOUSE AND JELLY BEANS IMAGES ‐ FROM LEFT TO RIGHT: ORIGINAL, COMPRESSED BY THE WMSE
ALGORITHM (WMSE ALG.) AND COMPRESSED BY JPEG2000.
PSPNR FOR THE LANDSCAPE IMAGE: 17.1DB (WMSE ALG.) AND 15.7DB (JPEG2000).
PSNR: 28.7DB (WMSE ALG.) AND 25.3DB (JPEG2000) AT 0.97BPP.
PSPNR FOR THE HOUSE IMAGE: 19.4DB (WMSE ALG.) AND 19.0DB (JPEG2000).
PSNR: 31.2DB (WMSE ALG.) AND 33.1DB (JPEG2000) AT 0.68BPP.
PSPNR FOR THE JELLY BEANS IMAGE: 18.8DB (WMSE ALG.) AND 18.2DB (JPEG2000).
PSNR: 32.3DB (WMSE ALG.) AND 32.1DB (JPEG2000) AT 0.48BPP.
IN THE ONLY CASE WHERE THE PSNR OF JPEG2000 IS HIGHER THAN THE NEW ALGORITHM (HOUSE), THE PSPNR RESULT
SUPPORTS THE FACT THAT VISUALLY THE NEW ALGORITHM PROVIDES SUPERIOR RESULTS.

International Journal of Communications (IJC) Volume 2 Issue 2, June 2013 www.seipub.org/ijc
59
FIG. 5 FRUITS, CAT AND PEPPERS IMAGES ‐ FROM LEFT TO RIGHT: ORIGINAL, COMPRESSED BY THE WMSE ALGORITHM (WMSE
ALG.) AND COMPRESSED BY JPEG2000.
PSPNR FOR THE FRUITS IMAGE: 22.2DB (WMSE ALG.) AND 21.1DB (JPEG2000).
PSNR: 30.0DB (WMSE ALG.) AND 29.0DB (JPEG2000) AT 1.34BPP.
PSPNR FOR THE CAT IMAGE: 17.0DB (WMSE ALG.) AND 16.2DB (JPEG2000).
PSNR: 28.9DB (WMSE ALG.) AND 26.9DB (JPEG2000) AT 0.63BPP.
PSPNR FOR THE PEPPERS IMAGE: 20.3DB (WMSE ALG.) AND 19.3DB (JPEG2000).
PSNR: 30.8DB (WMSE ALG.) AND 30.7DB (JPEG2000) AT 0.86BPP.
AS CAN BE SEEN, PSNR AND PSPNR RESULTS ARE SUPERIOR FOR THE NEW ALGORITHM COMPARED TO JPEG2000. IT IS ALSO
OBSERVED VISUALLY ‐ EXAMPLES ARE INDICATED IN THE MARKED AREAS.

www.seipub.org/ijc International Journal of Communications (IJC) Volume 2 Issue 2, June 2013
60
FIG. 6 SAILS (ZOOMED IN), MONARCH (ZOOMED IN) AND GOLDHILL IMAGES ‐ FROM LEFT TO RIGHT: ORIGINAL, COMPRESSED
BY THE WMSE ALGORITHM (WMSE ALG.) AND COMPRESSED BY JPEG2000.
PSPNR FOR THE SAILS IMAGE: 19.2DB (WMSE ALG.) AND 18.0DB (JPEG2000).
PSNR: 28.9DB (WMSE ALG.) AND 26.6DB (JPEG2000) AT 0.70BPP.
PSPNR FOR THE MONARCH IMAGE: 19.9DB (WMSE ALG.) AND 19.6DB (JPEG2000).
PSNR: 29.0DB (WMSE ALG.) AND 28.8DB (JPEG2000) AT 0.56BPP.
PSPNR FOR THE GOLDHILL IMAGE: 17.6DB (WMSE ALG.) AND 16.6DB (JPEG2000).
PSNR: 27.0DB (WMSE ALG.) AND 24.5DB (JPEG2000) AT 0.59BPP.
ONCE AGAIN, THE PSNR AND PSPNR RESULTS ARE SUPERIOR FOR THE NEW ALGORITHM COMPARED TO JPEG2000 (SEE
EXAMPLES INDICATED IN THE MARKED AREAS).
Summary
A perceptually‐based model for the Rate‐Distortion
function of color subband coders has been introduced.
The new model approximates the WMSE distortion of
an image in a given color space, such as YCbCr. This
distortion is then minimized to achieve perceptual
optimization of the compression. When the weights in
the WMSE calculation are taken based on the CSF
curves of the human visual system, better
correspondence to image quality assessment by the
human eye is achieved.
Based on the Rate‐Distortion model, new algorithms
have been introduced consisting of a pre‐processing
stage using a CCT, followed by a subband transform,
quantization stage, and lossless entropy encoding. The
algorithms are optimized with regard to the color
component transform in the pre‐processing stage of
the compression as well as the quantization tables
used in the coding stage, both with respect to WMSE.
The proposed DCT‐based algorithm outperforms both
JPEG and the corresponding MSE optimized
algorithm. The DWT‐based algorithm, as expected,
achieves higher compression ratios for the same image
quality than DCT‐based techniques. We demonstrate
in this work that even when a relatively basic
algorithm is used in the post‐processing stage
(introduced for EZW), superior results are obtained by

International Journal of Communications (IJC) Volume 2 Issue 2, June 2013 www.seipub.org/ijc
61
the proposed algorithm when compared to other
DWT‐based algorithms, such as JPEG2000. This holds
even if the same WMSE distortion is used in both
JPEG2000 and the proposed algorithm. Our conclusion
is that based on the new perceptual Rate‐Distortion
model, optimized compression algorithms can be
designed with compression results superior to
presently available techniques.
ACKNOWLEDGMENT
This research was supported in part by the HASSIP
Research Program HPRN‐CT‐2002‐00285 of the
European Commission, and by the Ollendorff Minerva
Center. Minerva is funded through the BMBF.
REFERENCES
[1] Faugeras, O. D. “Digital Color Image Processing Within
the Framework of a Human Visual Model.” IEEE Trans.
on Acoustics Speech and Signal Processing ASSP‐27
(1979): 380–393.
[2] Fiorucci, F., Baruffa, G. and Frescura, F. “Objective and
subjective quality assessment between JPEG XR with
overlap and JPEG 2000.", Journal of Visual
Communication and Image Representation 23 (Aug.
2012): 835–844.
[3] Gershikov, E. and Porat, M. “A Rate‐Distortion
Approach to Optimal Color Image Compression.” Proc.
of EUSIPCO, Florence, Italy, 2006.
[4] Gershikov, E. and Porat, M. “Data Compression of
Color Images using a Probabilistic Linear Transform
Approach“, in LNCS #4310, T. Boyanov, S. Dimova, K.
Georgiev, G. Nikolov (Eds.), 582‐589, Springer‐Verlag
Berlin Heidelberg, 2007.
[5] Gershikov, E. and Porat, M. “On color transforms and
bit allocation for optimal subband image compression”.
Signal Processing: Image Communication 22 (2007): 1‐18.
[6] Gersho, A. and Gray, R. M. “Vector Quantization and
Signal Compression”, Boston, MA: Kluwer, 1992, ch. 2.
[7] Goffman‐Vinopal, L. and Porat, M. “Color image
compression using inter‐color correlation.” Proc. of
IEEE ICIP (2002): II‐353 ‐ II‐356.
[8] JPEG 2000 Part I: Final Draft International Standard
(ISO/IECFDIS15444‐1), NCITS ISO/IEC JTC1/SC29/WG1
N1855 (Aug. 2000).
[9] Lam, E. Y. and Goodman, J. W. “A mathematical
analysis of the DCT coefficient distributions for
images.” IEEE Trans. on Image Processing 9 (2000):
1661‐1666.
[10] Limb J. O. and Rubinstein C.B. “Statistical Dependence
Between Components of A Differentially Quantized
Color Signal.” IEEE Trans. on Communications Com‐20
(Oct. 1971): 890‐899.
[11] Mannos, J. and Sakrison, D. “The effects of a visual
fidelity criterion of the encoding of images.ʺ IEEE Trans.
on Information Theory 20 (Jul. 1974): 525‐536.
[12] Ngan, K. N., Leong, K. S. and Singh, H. “Adaptive
cosine transform coding of images in perceptual
domain.” IEEE Trans. on Acoustics, Speech, and Signal
Processing 37 (Nov. 1989): 1743‐1750.
[13] Rabbani, M. and Joshi, R. “An overview of the JPEG
2000 still image compression standard”. Signal
Processing: Image Communication 17 (2002): 3‐48.
[14] Rao, K. R. and Yip, P. “Discrete cosine transform:
algorithms, advantages, applications.” Academic Press,
1990.
[15] Richter, T. and Simon, S. ʺOn the JPEG 2000 ultrafast
modeʺ. Proc. of ICIP (Oct. 2012): 2501‐2504.
[16] Richter, T. ʺSpatial Constant Quantization in JPEG XR is
Nearly Optimalʺ. Proc. Of the Data Compression
Conference (March 2010): 79‐88.
[17] Roterman, Y. and Porat, M. “Color image coding using
regional correlation of primary colors”. Image and
Vision Computing 25 (2007): 637‐651.
[18] Satt, A. and Malah, D. “Design of Uniform DFT Filter
Banks Optimized for Subband Coding of Speech”, IEEE
Trans. on Acoustics, Speech and signal Processing 37
(Nov. 1989): 1672‐1679.
[19] Shapiro, J. M. “Embedded Image Coding Using
Zerotrees of Wavelet Coefficients”, IEEE Trans. on
Signal Processing 41 (1993): 3345‐3462.
www.seipub.org/ijc International Journal of Communications (IJC) Volume 2 Issue 2, June 2013
62
[20] Taubman, D. S. and Marcellin, M. W. “JPEG2000: image
compression, fundamentals, standards and practice”,
Kluwer Academic Publishers, 2002.
[21] Wallace, G. K. “The JPEG still picture compression
standard”. IEEE Trans. Consumer Electronics 38 (1992):
xviii‐xxxiv.
[22] Wang, C. Y., Lee, S. M. and Chang, L. W. “Designing
JPEG quantization tables based on human visual
system.” Signal Processing: Image Communication 16
(2001): 501‐506.
[23] Yamaguchi, H. “Efficient Encoding of Colored Pictures
in R, G, B Components.” Trans. on Communications 32
(Nov. 1984): 1201‐1209.
[24] http://www.ece.uvic.ca/ mdadams/jasper
Evgeny Gershikov received his
Ph.D. in Electrical Engineering from
Technion – Israel Institute of
Technology in Haifa, Israel in 2011.
His areas of interest are Signal and
Image Processing, Color Processing
and Vision, Computer Vision,
Pattern Recognition and Speech
Recognition.