perceptions of software modeling:tcl/gradtheses/aforwardphd/tr-2008-07... · web viewthe aim of...
TRANSCRIPT

Perceptions of Software Modeling: A Survey of Software Practitioners
Andrew ForwardTimothy C. Lethbridge
School of Information Technology and EngineeringUniversity of Ottawa
800 King Edward Ave.Ottawa, Ontario, Canada K1N 6N5
Telephone: + 1 613 562 5800 x 6685Email: {aforward,tcl}@site.uottawa.ca
Technical Report: TR-2008-07
Permanent Location: http://www.site.uottawa.ca/eng/school/publications/techrep/2008
Abstract
We present a summary of the results of 113 software practitioners conducted between April and December 2007. The aim of the survey was to uncover their attitudes and experiences regarding software modeling, and development approaches that avoid modeling. We were motivated by observations that modeling is not widely adopted; many developers continue to take a code-centric approach. We sought to understand the extent to which this is true and the reasons why. We also wanted to learn how tools can be improved. Key findings include: UML is confirmed as the dominant modeling notation; modeling tools are primarily used to create documentation and for up-front design with little code generation; modeling tools are also used to transcribe models from other media including whiteboards; participants believe that model-centric approaches to software engineering are easier but are currently not very popular as most participants currently work in code-centric environments. The type and quality of generated code is one of the biggest reported problems.
Additional analysis (presented in Microsoft Excel) is available in TR-2008-08.
The software taxonomy referenced in this document is available in TR-2008-06.
1

Table of ContentsPerceptions of Software Modeling:...............................................................................................................1
Table of Contents...........................................................................................................................................2
Method...........................................................................................................................................................3
Survey results for the entire population.........................................................................................................5
Survey results for the software developers..................................................................................................24
Survey results for the software modellers....................................................................................................35
Survey results for the code generators.........................................................................................................46
Survey results for the software veterans......................................................................................................57
Survey results within Canada / USA...........................................................................................................68
Survey results for outside Canada / USA....................................................................................................79
Survey results for real time developers........................................................................................................90
Additional Sub Population Data................................................................................................................101
2

MethodThe survey was conducted online. We sent targeted requests to personal contacts in a wide variety of organizations. We also asked for participation using a variety of Internet forums.
The survey consisted of 18 questions. Most of these involved several sub-questions answered using 5-point Likert scales. Responses were in ranges such as strongly disagree to strongly agree, or never to always.
The survey was divided into groups of questions as follows:
• Q1: What is or is not a model? Various options were presented ranging from class diagrams, use cases, to source code. Our objective was to see if participants had a preconceived notion about what they considered a model to be.
• Q2-5: How and when do you model, and using which notations? The objective of these questions was to understand the state of the practice.
• Q6: How do you approach a new task or feature with respect to requirements, design, modeling, testing and documentation?
• Q7-10: What tools, methods and platforms do you use, and what type of software do you develop?
• Q11-14: To what extent do you use modeling, and how good is it for various tasks.
• Q15-16: What are the principal difficulties you perceive with the model-centric and code-centric approaches?
• Q17: An open-ended free form question for comments about the survey and / or modeling in general.
• Q18: Demographics question with sub-questions about country of origin, education level, and years of experience of the participant.
Some randomization of the order of question was applied to reduce bias towards either code-centric or model-centric questions. Questions 2 to 5 were presented in a random order. Questions 7 through 16 were then presented in a random order.
3

Threats to ValidityThe main threats to validity of our work are summarized below. We have also outlined the steps we have taken to help mitigate these threats.
Question interpretation. The survey was conducted over the Internet and respondents may have misunderstood the intended meaning of our questions. We took two steps to reduce the ambiguity of our questions by asking colleagues to first review the questions, and then having team members complete the survey during our trial run. Both activities helped improved the overall survey prior to go-live. We also separated the survey into two main parts: the first part to solicit the participants’ personal thoughts towards "what is a model", and the second to answer modeling based question based on our explicit definition.
Researcher bias. The survey questions attempt to uncover problems with both model-centric and code-centric approaches to software development. A potential bias could be introduced if our survey appeared to be overly negative towards either modeling or software coding. To reduce the chance of bias we tried to be objective when referring to both code-centric and model-centric questions, as well as presenting the questions in a random order.
Non randomized sample. To help ensure that our sample was based on a representative collection of software practitioners we approached both open and closed forums for participation. In particular, we submitted link articles to Digg.com, and Dzone.com - two popular technology and news sites. We submitted email requests to UML user groups, agile user groups, Java user groups, and RUP user groups. We also submitted personal requests to current and former colleagues. Our demographics results indicate that we do have representation from most regions of the world, most educational backgrounds, most software industries, and most types of developers. Prior to conducting the survey we also developed a software taxonomy (TR-2008-06) to categorize software applications and our results do include representation from each of the top-level application types.
4

Survey results for the entire sample.
Questions with a user defined notion of a modelFor questions 1-5, the participants were asked to use their own interpretation of what a software model is and what consists of software modeling.
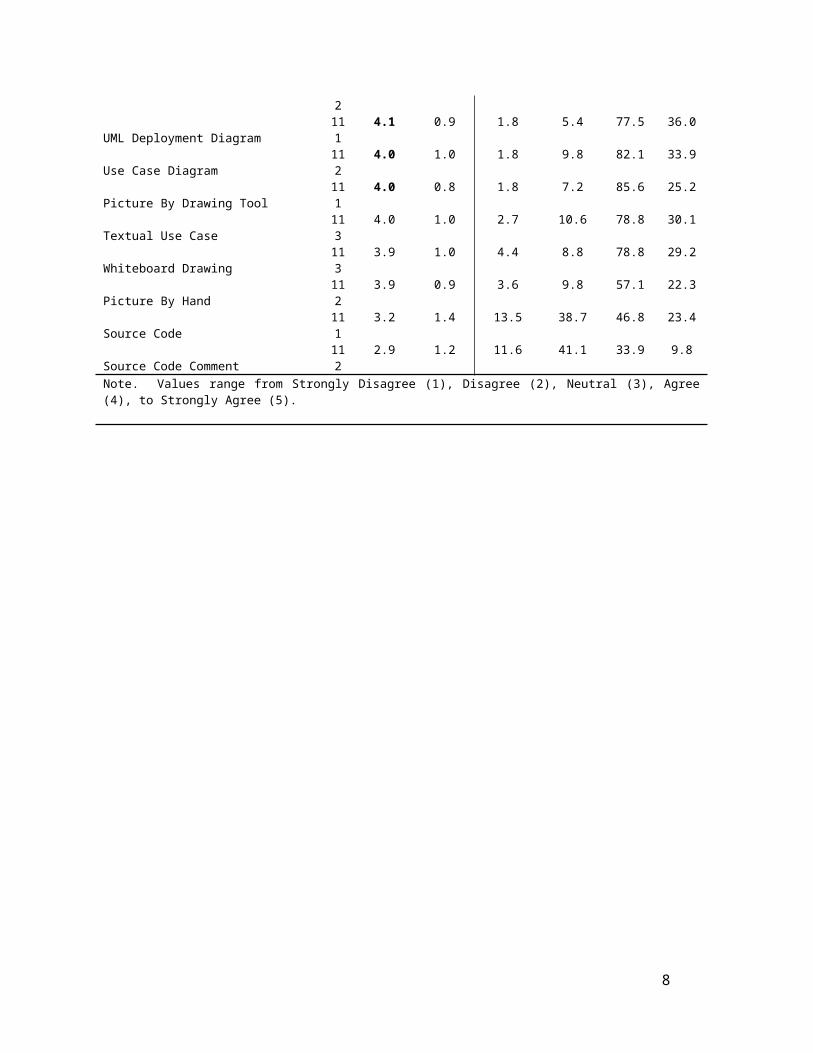
Question 1: To what extent do you consider the following to be a model of a software system?
The participant selected one of the following options for each sub-question listed: Strongly Disagree, Disagree, Neutral, Agree, and Strongly Agree.
a) A class diagram can be a model, or part of a model of a software systemb) A textual use case description can be a model, or part of a model of a software systemc) A whiteboard drawing can be a model, or part of a model of a software systemd) A picture created in a drawing program can be a model, or part of a model of a software systeme) The source code for a system can be a model, or part of a model of a software systemf) A use case diagram can be a model, or part of a model of a software systemg) A UML deployment diagram can be a model, or part of a model of a software systemh) A source code comment can be a model, or part of a model of a software systemi) A picture created by hand can be a model, or part of a model of a software system
Responses for Question 1: What is a Model? (Data from the entire sample)
Entity that might be a model N mean s.d. % Str. Disagree (1)
% Disagree (1 + 2)
% Agree (4 + 5)
% Str. Agree (5)
Class Diagram 112 4.3 0.8 0.9 2.7 88.4 48.2UML Deployment Diagram 111 4.1 0.9 1.8 5.4 77.5 36.0
Use Case Diagram 112 4.0 1.0 1.8 9.8 82.1 33.9
Picture By Drawing Tool 111 4.0 0.8 1.8 7.2 85.6 25.2
Textual Use Case 113 4.0 1.0 2.7 10.6 78.8 30.1
Whiteboard Drawing 113 3.9 1.0 4.4 8.8 78.8 29.2
Picture By Hand 112 3.9 0.9 3.6 9.8 57.1 22.3
Source Code 111 3.2 1.4 13.5 38.7 46.8 23.4
Source Code Comment 112 2.9 1.2 11.6 41.1 33.9 9.8
Note. Values range from Strongly Disagree (1), Disagree (2), Neutral (3), Agree (4), to Strongly Agree (5).
5

Question 2: To what extent do you create or modify software models or modeling information in the following ways?
The participant selected one of the following options for each sub-question listed: Never, Sometimes, Moderately often, Very often, and Always.
a) Word of mouth (such as discussions in meetings without records)b) Informal handwritten materials (like Index Cards, Post-it notes, handwritten paper prototypes)c) Drawing or writing on a whiteboard or blackboardd) Drawing or painting software (like MS Paint, Photoshop, Gimp, Freehand)e) Comments embedded in codef) Word processing software or other purely textual approachesg) Diagramming tools that have templates for diagrams of software (like Visio, ArgoUML)h) Fully integrated modeling/CASE tools (like Rational XDE, Rational Software Modeler, Borland
Together J, Rational Rose)
Responses for Question 2: How do you model? (Data from the entire sample)
Medium or method used to model N mean s.d. % Never (1)
% Sometimes (1 + 2)
% Very often (4 + 5)
% Always (5)
Whiteboard drawing 111 3.2 1.1 5.4 33.3 45.0 9.9Diagramming tool (e.g. Visio) 111 2.9 1.2 15.3 42.3 36.9 9.9
Word processor / text 112 2.8 1.1 7.1 45.5 26.8 8.9
Word of mouth 111 2.8 1.1 12.6 42.3 27.0 8.1
Handwritten material 111 2.6 1.1 13.5 51.4 22.5 4.5
Comments in source code 111 2.5 1.2 27.0 51.4 21.6 5.4
Modeling tool/CASE 112 2.4 1.4 38.4 58.9 29.5 10.7
Drawing software 111 2.1 1.0 29.7 72.1 12.6 2.7
Note. Values range from Never (1), Sometimes (2), Moderately often (3), Very often(4), to Always (5).
6

Question 3: To what extent do you refer to the following sources of information when you want to learn about the design of a software system?
The participant selected one of the following options for each sub-question listed: Never, Sometimes, Moderately often, Very often, and Always.
a) Word of mouth (such as discussions in meetings without records)b) Informal handwritten materials (like Index Cards, Post-it notes, handwritten paper prototypes)
that have been saved.c) Drawing or writing on a whiteboard or blackboard (including a photo made of material originally
recorded on a board)d) Material originally created using drawing or painting Software (like MS Paint, Photoshop, Gimp,
Freehand)e) Comments embedded in codef) Material originally created using word processing software or other purely textual approachesg) Material created using diagramming tools that have templates for diagrams of software (like
Visio, ArgoUML)h) Material in fully integrated modeling/CASE tools (like Rational XDE, Rational Software Modeler,
Borland Together J, Rational Rose)
Responses for Question 3: How do you learn about the design of software? (Data from the entire sample)
Refer to material created by/as N mean s.d. % Never (1)
% Sometimes (1 + 2)
% Very often (4 + 5)
% Always (5)
Word of mouth 112 3.4 1.1 4.5 22.3 54.5 17.0Word processor / text 110 3.3 1.1 2.7 30.0 48.2 10.0
Diagramming tool (e.g. Visio) 111 3.1 1.1 9.9 32.4 42.3 9.0
Whiteboard drawing 110 3.0 1.1 9.1 34.5 41.8 5.5
Comments in source code 112 2.9 1.2 11.6 42.0 30.4 10.7
Drawing software 109 2.6 1.0 14.7 57.8 13.8 3.7
Modeling tool/CASE 111 2.5 1.4 33.3 55.9 31.5 8.1
Handwritten material 109 2.4 1.1 23.9 56.0 20.2 3.7
Note. Values range from Never (1) to Always (5).
7
Question 4: At what point(s) in time do you visually document a design?
The participant selected one of the following options for each sub-question listed: Never, Sometimes, Moderately often, Very often, and Always.
a) Before implementation (before writing code)b) During implementation (while writing code)c) After implementation (after writing code)d) I only visually document a design on request
Responses for Question 4: When do you visually document a design? (Data from the entire sample)
Timeline N mean s.d. % Never (1)
% Sometimes (1 + 2)
% Very often (4 + 5)
% Always (5)
Before coding 112 3.7 1.2 2.7 19.6 25.9 33.9During coding 111 3.1 1.1 6.3 30.6 27.0 9.0
After coding 111 2.5 1.1 16.2 47.7 15.3 4.5
Only on request 107 1.9 1.1 43.9 38.2 6.5 3.7
Note. Values range from Never (1) to Always (5).
8

Question 5: To what extent do you use the following notations for the purpose of modeling or design (if you don't know what one of these is, then ignore that particular item) .
The participant selected one of the following options for each sub-question listed: Never, Sometimes, Moderately often, Very often, and Always.
a) UML (regardless of the version)b) UML 1.*c) UML 2.* (i.e. as revised in 2004)d) Real-Time extensions to UML or ROOM (Realtime Object-Oriented Modeling)e) BPEL (Business Process Execution Language)f) Data Flow Diagrams, Structure Charts, and other diagrams used in classic Structured Designg) Methodsh) ERD (Entity-Relation Diagram)i) SQL (i.e. table definitions and queries)j) SDL (Specification and Description Language)k) Formal languages based on logic and set theory (like Z, OCL)l) Well-defined domain specific languages (e.g. a notation most developers in your company would
understand that shows hooking up of telephones in a telecommunication system)m) Other (specify)
Responses for Question 5: What modeling notation do you use? (Data from the entire sample)
Language used to model N mean s.d. % Never (1)
% Sometimes (1 + 2)
% Very often (4 + 5)
% Always (5)
UML (any version) 110 3.3 1.4 18.2 30.9 51.8 22.7UML 2.* 96 2.6 1.4 30.2 52.1 34.4 12.5
SQL 108 2.5 1.4 30.6 55.6 29.6 10.2
Structured Design models 102 2.5 1.2 19.6 58.8 21.6 9.8
UML 1.* 93 2.4 1.4 38.7 54.8 28.0 7.5
ERD 106 2.3 1.3 33.0 63.2 20.8 10.4
Well-defined DSL 104 1.7 1.0 54.8 78.8 5.8 1.0
ROOM / RT for UML 99 1.5 1.0 69.7 85.9 7.1 2.0
SDL 93 1.3 0.8 80.6 89.2 3.2 0.0
Formal (e.g. Z, OCL) 99 1.3 0.7 78.8 93.9 2.0 1.0
BPEL 97 1.3 0.7 80.4 92.8 3.1 0.0
Note. Values range from Never (1) to Always (5).
9

Questions with a well-defined notion of a modelFor the remainder of the survey, the participants were asked to assume that any reference to a software model refers to an artefact that represents an abstraction of the software you are building. A model can typically be viewed as a set of diagrams and/or pieces of structured text. It can be recorded on a white board, paper, or using a software tool. A model could use formal syntax and semantics but this is not necessary. We will consider the final source code of the system, and requirements written in natural language to not be models, although models can be embedded in a requirements document.
Question 6: Consider the situation in which you, as a software developer, have just been assigned a new feature to develop. In general, when working on this feature, at what point(s) in time do you perform the following tasks.
The participant selected one of the following options for each sub-question listed: Never, Primarily near the start of development, Primarily near the middle of development , Primarily near the end, In small increments at a few points in developments, and Constantly throughout a large part of the process.
a) Develop requirementsb) Develop the designc) Implement the system (write code or generate it)d) Perform modelinge) Develop testsf) Perform testingg) Create documentationh) Perform knowledge transfer (i.e. sharing information with others about the system)i) Perform knowledge searching (i.e. search for an answer about some aspect of how the system
works or what it does)
Responses for Question 6: When do you perform the following tasks? (Data from the entire sample)
Available tasks N Mode % Mode % Never % Start % Middle
% End
Searching 93 Constantly 64.5 6.5 17.2 5.4 5.4Requirements 110 Start 60.0 1.8 60.0 0.0 0.0
Design 93 Start 53.8 1.1 53.8 11.8 0.0
Modeling 99 Start 46.5 6.1 46.5 5.1 0.9
Perform testing 102 Constantly 44.1 3.9 1.0 10.8 18.2
Coding 96 Constantly 41.7 4.2 3.1 32.3 12.7
Knowledge transfer 108 Constantly 41.7 3.7 0.9 2.8 33.3
Develop tests 97 Constantly 40.2 4.1 10.3 15.5 15.2
Documentation 106 End 38.7 3.8 11.3 2.8 36.9
10

Question 7: To what extent to you work on the following types of software?
The participant selected one of the following options for each sub-question listed: Never, Sometimes, Moderately often, Very often, and Always.
a) Computational-dominant software (e.g., Simulation, Scientific, Image Processing, Machine Learning)
b) Business software (e.g., Bank Transaction Processing, Financial Analysis, GIS, Software Tools)c) Consumer software (e.g., Word Processors, Spreadsheets, Browsers, Games)d) Information display and transaction entry (e.g., Search Engines, Maps, Weather, News)e) Operating systems (e.g., Mac, Windows, Linux)f) Middleware and system components (e.g., Database servers, Virtual Machines)g) System Support utilities (e.g., Security, Anti-Virus, Spam Filter, Encryption)h) Website content managementi) Servers (e.g., Email, IM, Proxies, Load Balancers)j) Malware (e.g. Virus, Spyware, Spam)k) Embedded real time software (e.g., Firmware, Routers)l) Industrial control software (e.g., Air Traffic Control)m) Design and engineering software (e.g., Testing tools, Development environments, Database /
Reporting, Modeling Tools)
Responses for Question 7: What types of software do you build? (Data from the entire sample)
Available options N mean s.d. % Never (1)
% Sometimes (1 + 2)
% Very often (4 + 5)
% Always (5)
Business 96 2.9 1.6 32.3 44.8 45.8 17.7Design and Engineering 96 2.4 1.3 29.2 60.4 25.0 6.3
Website Content Management 95 2.3 1.3 37.9 62.1 23.2 4.2
Information Display (Search / News) 97 2.2 1.4 50.5 66.0 26.8 9.3
Middleware 97 2.2 1.3 42.3 67.0 23.7 3.1
Consumer 96 2.1 1.4 52.1 67.7 21.9 9.4
Operating Systems 96 2.0 1.5 62.5 74.0 21.9 11.5
Computational 94 1.9 1.1 44.7 76.6 11.7 3.2
Servers 97 1.9 1.2 54.6 75.3 12.4 4.1
Embedded Real-Time 95 1.8 1.2 63.2 76.8 14.7 5.3
System Utilities 95 1.6 1.0 65.3 84.2 7.4 1.1
Industrial Control 95 1.5 1.0 71.6 89.5 9.5 3.2
Malware 96 1.2 0.6 87.5 92.7 2.1 0.0
Note. Values range from Never (1) to Always (5).
11

Question 8: To what extent have you worked with the following tools during the last 6 months.
The participant selected one of the following options for each sub-question listed: Never, Sometimes, Moderately often, Very often, and Always.
a) Eclipseb) Rational Rosec) Rational XDEd) Rational RSA, RSM or RSDe) Together Jf) Visual Studiog) Other (specify)
Responses for Question 8: What development tools do you use? (Data from the entire sample)
Available options N mean s.d. % Never (1)
% Sometimes (1 + 2)
% Very often (4 + 5)
% Always (5)
Eclipse 98 3.0 1.5 22.4 43.9 40.8 22.4Visual Studio 97 2.4 1.4 39.2 56.7 32.0 5.2
Rational Rose 98 1.8 1.3 65.3 76.5 17.3 4.1
Rational RSx 98 1.4 1.0 82.7 85.7 10.2 2.0
Rational XDE 97 1.4 0.8 81.4 89.7 5.2 1.0
Together J 98 1.2 0.5 86.7 96.9 1.0 0.0
Note. Values range from Never (1) to Always (5).
12

Question 9: To what extent have you worked in the following technologies or platforms during the last 6 months.
The participant selected one of the following options for each sub-question listed: Never, Sometimes, Moderately often, Very often, and Always.
a) Asp.netb) J2SEc) J2EEd) PHP / Perle) Ruby, Pythonf) Other (specify)
Responses for Question 9: What technologies / platforms do you use? (Data from the entire sample)
Available options N mean s.d. % Never (1)
% Sometimes (1 + 2)
% Very often (4 + 5)
% Always (5)
J2SE 95 2.4 1.5 46.3 46.3 31.6 13.7J2EE 97 2.3 1.5 50.5 59.8 29.9 12.4
PHP / Perl 93 2.0 1.3 48.4 74.2 19.4 5.4
ASP.Net 97 1.8 1.3 64.9 79.4 14.4 9.3
Ruby / Python 94 1.6 1.0 66.0 88.3 8.5 2.1
C / C++* 40 2.4 1.6 52.5 60.0 30.0 17.5
Note. Values range from Never (1) to Always (5). *Where C/C++ was identified as an “other” technology.
13

Question 10: To what extent do you perform the following tasks.
The participant selected one of the following options for each sub-question listed: Never, Sometimes, Moderately often, Very often, and Always.
a) Lead or coordinate your software teamb) Run or attend meetingsc) Write new coded) Maintain existing codee) Fix bugsf) Perform manual testingg) Write or maintain automated tests scriptsh) Design software systemsi) Model software systemsj) Write or maintain software requirementsk) Perform general administration tasks related to software developmentl) Explain a system's design to othersm) Search related to a software systemn) Think about your software system
Responses for Question 10: What are your daily tasks?
Available tasks N mean s.d. % Never (1)
% Sometimes (1 + 2)
% Very often (4 + 5)
% Always (5)
Think about s/w system 96 4.1 1.0 1.0 9.4 77.1 41.7Run / attend meetings 96 3.6 1.0 2.1 19.8 60.4 17.7
Explain s/w design to others 95 3.5 0.9 0.0 15.8 51.6 13.7
Design a s/w system 96 3.5 1.0 4.2 18.8 57.3 13.5
Lead software project 96 3.3 1.2 9.4 29.2 53.1 16.7
Search about s/w system 93 3.2 1.1 5.4 31.2 46.2 12.9
Model a s/w system 96 3.2 1.2 8.3 30.2 45.8 11.5
Write new code 96 3.1 1.3 13.5 37.5 49.0 13.5
Maintain existing code 96 3.0 1.3 15.6 37.5 40.6 10.4
Fix bugs 94 3.0 1.2 13.8 39.4 39.4 10.6
Perform manual testing 94 2.9 1.1 11.7 35.1 34.0 7.4
Write / maintain requirements 95 2.9 1.1 10.5 41.1 40.0 4.2
General administration 94 2.8 1.1 12.8 40.4 29.8 7.4
Write / maintain test scripts 96 2.4 1.1 22.9 58.3 17.7 5.2
Note. Values range from Never (1) to Always (5).
14

Question 11: To what extent do you use software tools in the modeling process for the following activities?
The question included an option to ignore this question if the participant does not use software design applications (which explains the lower number of participants answering this question). The participant selected one of the following options for each sub-question listed: Never, Sometimes, Moderately often, Very often, and Always.
a) To brainstorm about possible design ideas and alternativesb) To transcribe a design into a digital formatc) To develop a designd) To prototype a design (i.e. simulation, verification, validation)e) To generate source code templates (which will be edited manually in order to complete their
internal functionality)f) To generate all necessary code (no manual modification of code is needed)
Responses for Question 11: What do you use modeling tools for? (Data from the entire sample)
Activity N mean s.d. % Never (1)
% Sometimes (1 + 2)
% Very often (4 + 5)
% Always (5)
Developing a design 64 3.3 1.2 6.3 26.6 48.4 17.2Transcribing a design into digital format 64 3.1 1.3 14.1 32.8 39.1 14.1
Prototyping a design 64 2.7 1.3 20.3 53.1 32.8 12.5
Brainstorming possible designs 64 2.6 1.2 18.8 54.7 23.4 10.9
Generating code (code editable) 63 2.2 1.2 36.5 65.1 17.5 6.3
Generating all code 64 1.8 1.2 65.6 76.6 14.1 4.7
Note. Values range from Never (1) to Always (5).
15

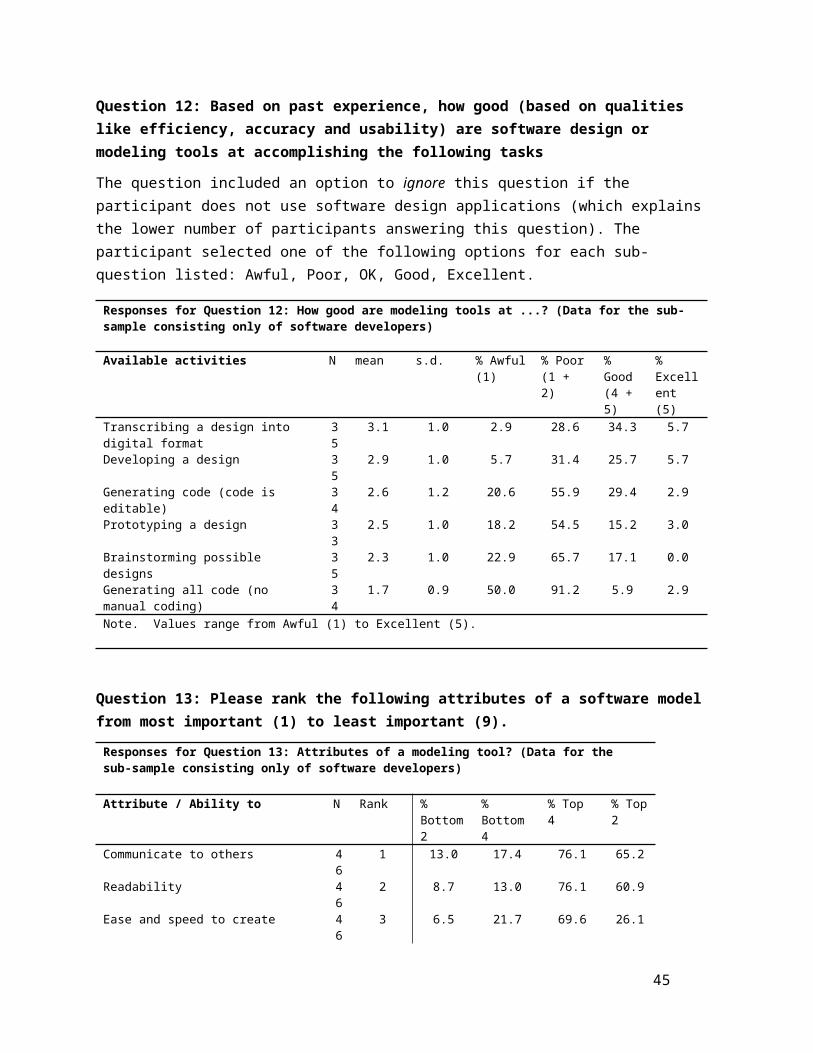
Question 12: Based on past experience, how good (based on qualities like efficiency, accuracy and usability) are software design or modeling tools at accomplishing the following tasks
The question included an option to ignore this question if the participant does not use software design applications (which explains the lower number of participants answering this question). The participant selected one of the following options for each sub-question listed: Awful, Poor, OK, Good, Excellent.
a) To brainstorm about possible design ideas and alternativesb) To transcribe a design into a digital formatc) To develop a designd) To prototype a design (i.e. simulation, verification, validation)e) To generate source code templates (which will be edited manually in order to complete their
internal functionality)f) To generate all necessary code (no manual modification of code is needed)
Responses for Question 12: How good are modeling tools at ...? (Data from the entire sample)
Available activities N mean s.d. % Awful (1)
% Poor (1 + 2)
% Good (4 + 5)
% Excellent (5)
Developing a design 71 3.4 1.0 2.8 16.9 47.9 12.7Transcribing a design into digital format 69 3.2 1.0 2.9 24.6 42.0 7.2
Generating code (code is editable) 69 2.9 1.1 10.1 39.1 29.0 8.7
Prototyping a design 68 2.9 1.1 10.3 41.2 29.4 8.8
Brainstorming possible designs 71 2.8 1.2 15.5 45.1 32.4 4.2
Generating all code (no manual coding) 69 1.9 1.1 42.0 79.7 8.7 4.3
Note. Values range from Awful (1) to Excellent (5).
16

Question 13: Please rank the following attributes of a software model from most important (1) to least important (9).
a) The information density of the modelb) The ability to communicate to others using the modelc) The ability to generate code from the modeld) Readability of the modele) The ease and speed with which the model can be createdf) The ease with which several developers can collaborate to develop or modify the modelg) The ease with which one can analyse the model to better understand it, compute properties of the
system, or detect potential problemsh) The ability to view different aspects of the model (e.g. different diagrams, views, perspectives, or
parts of the system)i) The ability to embed information extracted from the model in documentation
Responses for Question 13: Attributes of a modeling tool? (Data from the entire sample)
Attribute / Ability to N Rank % Bottom 2
% Bottom 4
% Top 4 % Top 2
Communicate to others 89 1 10.1 16.9 78.7 68.5Readability 89 2 10.1 20.2 68.5 51.7Ease and speed to create 89 3 7.9 36.0 55.1 19.1Ability to analyze 89 4 10.1 33.7 55.1 21.3Collaborate amongst developers 89 5 12.4 38.2 43.8 15.7Ability to view different aspects of a model 89 6 10.1 42.7 40.4 13.5Generate code 89 7 52.8 70.8 23.6 11.2Information density 88 8 51.1 72.7 17.0 3.4Embed parts of model in documentation 89 9 55.1 82.0 13.5 4.5
Note. The % top 4 represents the percentage of participants that listed the attribute in their top four. Similarly for % bottom four. The same applies for % top2, and % bottom 2.
Question 14: For each of the following, how do code-centric development approaches compare to model-centric approaches.
This question asks about code-centric vs. model-centric approaches to software development. In a model-centric approach, the developers look to the model to see the design, and change the model as the first step in performing any design change. Extensive modeling is performed, and the coding is either automated, or at least straightforwardly determined from the model. In a code-centric approach, the code is seen as the main artefact; developers understand the design by understanding the code, and the process of design change is equated with changing the code.
The participant selected one of the following options for each sub-question listed: Much easier in a model-centric approach, Somewhat easier in a model-centric approach, About the same, Somewhat easier in a code centric approach, and Much easier in a code centric approach.
17

a) Creating a new system overallb) Making a system that most accurately meets the requirements or solves the problems of the
customers and usersc) Making an efficient system in terms of software performanced) Making a system that is as usable as possible for end userse) Making a system that can be reusedf) Creating a system as quickly as possibleg) Comprehending a system's behaviourh) Modifying an existing system when a requirement changesi) Fixing a bugj) Explaining the system to othersk) Creating a prototype
Responses for Question 14: Tasks that are better in a model-centric or code centric approach. (Data from the entire sample)
Available activities N mean s.d. % Much easier in Models (1)
% Somewhat easier in Models (1 + 2)
% Somewhat easier in Code (4 + 5)
% Much easier in Code (5)
Fixing a bug 90 3.2 1.5 21.1 28.9 43.3 25.6Creating efficient software 92 3.1 1.4 16.3 35.9 43.5 21.7Creating a system as quickly as possible 92 3.0 1.5 23.9 46.7 42.4 23.9Creating a prototype 92 2.9 1.5 26.7 43.0 32.6 22.8Creating a usable system for end users 92 2.7 1.3 26.1 42.4 22.8 10.9
Modifying a system when requirements change
91 2.5 1.4 34.1 54.9 24.2 13.2
Creating a system that most accurately meets requirements
91 2.2 1.3 42.9 67.0 19.8 8.8
Creating a re-usable system 92 2.2 1.3 44.6 63.0 15.2 9.8
Creating a new system overall 92 2.2 1.3 43.5 68.5 20.7 7.6
Comprehending a system's behaviour 89 2.0 1.3 51.7 71.9 15.7 5.6
Explaining a system to others 92 1.7 1.1 61.1 81.8 7.6 6.5
Note. Values range from Much easier in a model-centric approach (1), to much easier in a code-centric approach (5).
18

Question 15: Which of the following are potential difficulties with modeling. These may be reasons why you don’t model much, or things you find hard about modeling.
The participant selected one of the following options for each sub-question listed: Not a problem, a slight problem, a moderate problem, a bad problem, and a terrible problem.
a) Modeling languages are hard to understandb) My organizational culture does not like the concept of modelingc) The semantics of modeling languages do not correspond well with the programming languages
we used) You cannot describe in modeling languages the kinds of detail that need to be implemented in the
source code in order to meet specific requirementse) Modeling tools are too expensivef) Modeling tools are too ‘heavyweight’ (e.g. taking a long time to install, learn and configure, with
more features than I need and/or consuming too many computational resources)g) Modeling tools change and tool licenses need renewal, so a model may become obsolete, whereas
source code has a longer ‘shelf life’h) With source code, all the system’s details are visible and searchable using a simple text editor,
whereas with a modeling tool some details may not be visible.i) Creating and editing a model is too slowj) Modeling tools don’t allow me to analyse my design in ways I would wantk) Modeling tools lack features I need or wantl) We don’t trust that the companies creating modeling tools will continue to support themm) Modeling languages are not expressive enoughn) The code generated from a modeling tool is not of the kind I would likeo) Models cannot be easily exchanged between toolsp) We have had bad experiences with modeling in the pastq) Even when we do modeling, developers tend to maintain the source code, resulting in the
models becoming out of date and inconsistent with the code.
19

Responses for Question 15: Problems with a model-centric approach. (Data from the entire sample)
Potential problems N mean s.d. % Not Problem (1)
% Slight Problem (1 + 2)
% Bad Problem (4 + 5)
% Terrible Problem (5)
Models become out of date and inconsistent with code
92 3.8 1.2 7.6 16.3 68.5 37.0
Models cannot be easily exchanged between tools
91 3.3 1.3 15.4 26.4 51.6 17.6
Modeling tools are 'heavyweight' (install, learn, configure, use)
92 3.1 1.2 10.9 31.5 39.1 12.0
Code generated from a modeling tool not of the kind I would like
91 3.0 1.4 18.7 39.6 38.5 16.5
Not enough detail to be implemented in code
89 2.8 1.3 23.6 43.8 36.0 7.9
Creating and editing a model is slow92 2.7 1.2 17.4 43.5 22.8 12.0
Modeling tools change, models become obsolete
92 2.7 1.2 22.8 44.6 32.6 5.4
Modeling tools lack features I need or want89 2.6 1.1 19.1 44.9 21.3 5.6
Modeling tools hide details (source code fully visible)
92 2.6 1.1 19.6 44.6 23.9 1.1
Modeling tools are too expensive90 2.6 1.3 26.7 46.7 26.7 6.7
Modeling tools cannot be analyzed as intended
90 2.5 1.3 28.9 51.1 25.6 6.7
Organization culture does not like modeling92 2.5 1.2 31.5 48.9 23.9 4.3
Semantics of models different from prog. language
90 2.4 1.3 31.1 56.7 23.3 8.9
Modeling languages are not expressive enough
91 2.4 1.1 28.6 54.9 17.6 2.2
Modeling language hard to understand91 2.2 1.0 28.6 62.6 9.9 3.3
Have had bad experiences with modeling91 2.2 1.2 39.6 63.7 16.5 6.6
Do not trust companies will continue to support their tools
89 2.0 1.0 44.9 67.4 10.1 0.0
Note. Values range from Not a problem (1), to Terrible problem (5).
20

Question 16: Which of the following are potential difficulties with code-centric development (i.e. lacking modeling).
The participant selected one of the following options for each sub-question listed: Not a problem, a slight problem, a moderate problem, a bad problem, and a terrible problem.
a) It is hard to see the overall design in the mass of codeb) Changing the code without introducing bugs is difficultc) Changing the code takes too much timed) Understanding the behaviour of the system is difficulte) My organizational culture does not like the code-centric approachf) Code becomes of poorer and poorer quality over time as many different people make changes.g) It is too difficult to completely restructure the system when neededh) The programming language(s) we use lead to excessively complex codei) The programming language(s) we use are obsolete or are likely to become obsoletej) Programming languages are not expressive enoughk) It requires more skill than we have available to develop high quality code (e.g. that is efficient,
reliable, maintainable, and avoids security problems)
Responses for Question 16: Problems with a code-centric approach. (Data from the entire sample)
Potential problems N mean s.d. % Not Problem (1)
% Slight Problem (1 + 2)
% Bad Problem (4 + 5)
% Terrible Problem (5)
Hard to see overall design 94 3.8 1.1 4.3 13.8 66.0 35.1
Hard to understand behaviour of system94 3.6 1.1 4.3 19.1 60.6 21.3
Code becomes of poorer quality over time92 3.4 1.3 9.8 28.3 55.4 25.0
Too difficult to restructure system when needed
93 3.4 1.2 8.6 22.6 51.6 17.2
Difficult to change code without adding bugs
93 3.4 1.2 9.7 22.6 50.5 18.3
Changing code takes too much time94 2.8 1.2 20.2 39.4 27.7 8.5
Our prog. language leads to complex code94 2.5 1.2 26.6 51.1 20.2 8.5
More skill than available to develop high quality code
91 2.5 1.2 29.7 53.8 22.0 6.6
Prog. Languages not expressive enough 91 2.1 1.2 46.2 64.8 14.3 5.5
Organization culture does not like code-centric
92 1.9 1.2 58.7 72.8 14.1 4.3
Our prog. language likely to become obsolete
93 1.9 1.1 51.6 75.3 9.7 3.2
Note. Values range from Not a problem (1) to Terrible problem (5).
21

Closing Questions
Question 17: Open ended question: Please provide any other comments you may have about the pros and cons of modeling, or your experiences regarding the topic of this survey.
Question 18: Demographic questions to help us understand the different backgrounds of people answering this survey:
a) How many years of experience do you have developing software?b) What is the highest level of education you have obtained? The participant selected one of the
following options for each sub-question listed: High school, Community college, Some university, but never graduated, Bachelors degree, Masters degree, and PhD.
c) What country do you live in
Participants’ Software Experience Software
Experience (years)
N % % Valid Cumulative %
Valid < 1 0 0.0 0.0 0.01 to 5 16 14.2 17.6 17.66 to 10 23 20.4 25.3 42.911 to 15 21 18.6 23.1 65.916 to 20 11 9.7 12.1 78.0> 20 20 17.7 22.0 100.0Total 91 80.5 100.0
Missing Unanswered 22 19.5Total 113 100.0
Participants’ Level of Education Highest Level
ObtainedN % % Valid Cumulative
%Valid High School 1 0.9 1.1 1.1
Community College
2 1.8 2.2 3.3
Some University
4 3.5 4.4 7.7
Bachelors Degree
35 31.0 38.5 46.2
Masters Degree
40 35.4 44.0 90.1
PhD 9 8.0 9.9 100.0Total 91 80.5 100.0
Missing Unanswered 22 19.5Total 113 100.0
22

Participants’ Country of Residence Country of
ResidenceN % % Valid
Valid Canada 39 34.5 43.3USA 24 21.2 26.7UK 6 5.3 6.7Other Europe 7 6.2 7.8India, Pakistan 8 7.1 8.9Other Asia 3 2.7 3.3Other 3 2.7 3.3Total 90 79.6 100.0
Missing Unanswered 23 20.4Total 113 100.0
23

Survey results for the software developers.The following data is based on those individuals that at either write or maintain software very-often to always.
Questions with a user defined notion of a modelFor questions 1-5, the participants were asked to use their own interpretation of what a software model is and what consists of software modeling.
Question 1: To what extent do you consider the following to be a model of a software system?
The participant selected one of the following options for each sub-question listed: Strongly Disagree, Disagree, Neutral, Agree, and Strongly Agree.
Responses for Question 1: What is a Model? (Data for the sub-sample consisting only of software developers)
Entity that might be a model N mean s.d. % Str. Disagree (1)
% Disagree (1 + 2)
% Agree (4 + 5)
% Str. Agree (5)
Class Diagram 52 4.3 0.8 0.0 1.9 86.5 46.2Picture By Drawing Tool 52 4.1 0.7 0.0 3.8 88.5 28.8Whiteboard Drawing 53 4.1 0.9 3.8 5.7 84.9 30.2Use Case Diagram 53 4.0 0.9 0.0 9.4 79.2 30.2Textual Use Case 53 4.0 0.9 0.0 7.5 77.4 28.3UML Deployment Diagram 52 4.0 1.0 1.9 7.7 75.0 32.7Picture By Hand 53 4.0 0.8 1.9 5.7 58.5 22.6Source Code 53 3.2 1.3 9.4 41.5 47.2 20.8Source Code Comment 53 2.9 1.1 9.4 39.6 30.2 5.7
Note. Values range from Strongly Disagree (1), Disagree (2), Neutral (3), Agree (4), to Strongly Agree (5).
24

Question 2: To what extent do you create or modify software models or modeling information in the following ways?
The participant selected one of the following options for each sub-question listed: Never, Sometimes, Moderately often, Very often, and Always.
Responses for Question 2: How do you model? (Data for the sub-sample consisting only of software developers)
Medium or method used to model N mean s.d. % Never (1)
% Sometimes (1 + 2)
% Very often (4 + 5)
% Always (5)
Whiteboard drawing 53 3.3 1.1 3.8 28.3 50.9 11.3Word of mouth 53 3.0 1.1 9.4 35.8 34.0 9.4Word processor / text 53 2.8 1.0 3.8 43.4 24.5 7.5Handwritten material 53 2.8 1.0 9.4 39.6 28.3 1.9Comments in source code 52 2.7 1.3 25.0 44.2 30.8 9.6Diagramming tool (e.g. Visio) 52 2.7 1.3 19.2 51.9 32.7 7.7Drawing software 53 2.2 1.1 30.2 67.9 15.1 3.8Modeling tool/CASE 53 1.9 1.2 54.7 77.4 13.2 5.7
Note. Values range from Never (1), Sometimes (2), Moderately often (3), Very often(4), to Always (5).
Question 3: To what extent do you refer to the following sources of information when you want to learn about the design of a software system?
The participant selected one of the following options for each sub-question listed: Never, Sometimes, Moderately often, Very often, and Always.
Responses for Question 3: How do you learn about the design of software? (Data for the sub-sample consisting only of software developers)
Refer to material created by/as N mean s.d. % Never (1)
% Sometimes (1 + 2)
% Very often (4 + 5)
% Always (5)
Word of mouth 53 3.5 1.1 3.8 20.8 58.5 18.9Comments in source code 53 3.2 1.2 5.7 34.0 37.7 18.9Word processor / text 52 3.2 1.1 5.8 32.7 44.2 9.6Whiteboard drawing 52 3.0 1.2 13.5 32.7 40.4 7.7Diagramming tool (e.g. Visio) 53 2.9 1.2 15.1 37.7 35.8 9.4Drawing software 52 2.6 1.2 19.2 57.7 17.3 5.8Handwritten material 52 2.5 1.2 25.0 53.8 21.2 3.8Modeling tool/CASE 53 2.1 1.3 47.2 69.8 18.9 7.5
Note. Values range from Never (1) to Always (5).
25

Question 4: At what point(s) in time do you visually document a design?
The participant selected one of the following options for each sub-question listed: Never, Sometimes, Moderately often, Very often, and Always.
Responses for Question 4: When do you visually document a design? (Data for the sub-sample consisting only of software developers)
Timeline N mean s.d. % Never (1)
% Sometimes (1 + 2)
% Very often (4 + 5)
% Always (5)
Before coding 53 3.4 1.2 3.8 24.5 28.3 22.6During coding 53 3.2 1.0 3.8 26.4 32.1 9.4After coding 52 2.6 1.1 13.5 40.3 15.4 5.8Only on request 51 2.0 1.1 45.1 31.3 7.8 3.9
Note. Values range from Never (1) to Always (5).
Question 5: To what extent do you use the following notations for the purpose of modeling or design (if you don't know what one of these is, then ignore that particular item) .
The participant selected one of the following options for each sub-question listed: Never, Sometimes, Moderately often, Very often, and Always.
Responses for Question 5: What modeling notation do you use? (Data for the sub-sample consisting only of software developers)
Language used to model N mean s.d. % Never (1)
% Sometimes (1 + 2)
% Very often (4 + 5)
% Always (5)
UML (any version) 53 3.0 1.4 20.8 37.7 45.3 15.1Structured Design models 49 2.6 1.2 20.4 53.1 20.4 8.2SQL 51 2.4 1.2 29.4 58.8 25.5 3.9UML 1.* 46 2.3 1.3 39.1 56.5 21.7 4.3UML 2.* 48 2.3 1.3 39.6 64.6 22.9 8.3ERD 52 2.3 1.3 38.5 63.5 21.2 5.8Well-defined DSL 50 1.7 1.1 60.0 78.0 8.0 2.0ROOM / RT for UML 48 1.5 1.1 75.0 87.5 10.4 4.2BPEL 46 1.3 0.8 84.8 91.3 4.3 0.0SDL 45 1.2 0.7 88.9 91.1 2.2 0.0Formal (e.g. Z, OCL) 47 1.2 0.6 89.4 97.9 2.1 2.1
Note. Values range from Never (1) to Always (5).
26

Questions with a well-defined notion of a modelFor the remainder of the survey, the participants were asked to assume that any reference to a software model refers to an artefact that represents an abstraction of the software you are building. A model can typically be viewed as a set of diagrams and/or pieces of structured text. It can be recorded on a white board, paper, or using a software tool. A model could use formal syntax and semantics but this is not necessary. We will consider the final source code of the system, and requirements written in natural language to not be models, although models can be embedded in a requirements document.
Question 6: Consider the situation in which you, as a software developer, have just been assigned a new feature to develop. In general, when working on this feature, at what point(s) in time do you perform the following tasks.
The participant selected one of the following options for each sub-question listed: Never, Primarily near the start of development, Primarily near the middle of development , Primarily near the end, In small increments at a few points in developments, and Constantly throughout a large part of the process.
Responses for Question 6: When do you perform the following tasks? (Data for the sub-sample consisting only of software developers)
Available tasks N Mode % Mode % Never % Start % Middle
% End
Searching 45 Constantly 66.7 4.4 20.0 6.7 1.9Requirements 53 Start 62.3 1.9 62.3 0.0 0.0Design 46 Start 56.5 0.0 56.5 2.2 0.0Modeling 48 Start 54.2 8.3 54.2 4.2 1.9Coding 48 Constantly 50.0 0.0 4.2 37.5 5.8Perform testing 49 Constantly 49.0 4.1 2.0 6.1 13.5Develop tests 46 Constantly 47.8 6.5 6.5 10.9 11.3Documentation 52 End 44.2 7.7 11.5 1.9 43.4Knowledge transfer 51 End 43.1 5.9 2.0 2.0 41.5
27

Question 7: To what extent to you work on the following types of software?
The participant selected one of the following options for each sub-question listed: Never, Sometimes, Moderately often, Very often, and Always.
Responses for Question 7: What types of software do you build? (Data for the sub-sample consisting only of software developers)
Available options N mean s.d. % Never (1)
% Sometimes (1 + 2)
% Very often (4 + 5)
% Always (5)
Business 50 2.9 1.5 28.0 44.0 46.0 14.0Website Content Management 49 2.5 1.3 32.7 55.1 30.6 4.1Middleware 50 2.4 1.3 32.0 60.0 32.0 4.0Design and Engineering 49 2.3 1.3 34.7 65.3 26.5 4.1Information Display (Search / News) 50 2.2 1.4 46.0 64.0 24.0 6.0Servers 50 2.1 1.3 44.0 66.0 16.0 6.0Computational 48 2.0 1.2 45.8 70.8 14.6 4.2Consumer 50 2.0 1.2 48.0 74.0 16.0 6.0Operating Systems 49 2.0 1.5 61.2 73.5 22.4 10.2Embedded Real-Time 49 1.8 1.3 65.3 79.6 14.3 6.1Industrial Control 49 1.7 1.2 69.4 85.7 14.3 6.1System Utilities 49 1.6 0.8 63.3 85.7 4.1 0.0Malware 50 1.1 0.4 92.0 96.0 0.0 0.0
Note. Values range from Never (1) to Always (5).
Question 8: To what extent have you worked with the following tools during the last 6 months.
The participant selected one of the following options for each sub-question listed: Never, Sometimes, Moderately often, Very often, and Always.
Responses for Question 8: What development tools do you use? (Data for the sub-sample consisting only of software developers)
Available options N mean s.d. % Never (1)
% Sometimes (1 + 2)
% Very often (4 + 5)
% Always (5)
Eclipse 50 3.3 1.6 20.0 36.0 56.0 32.0Visual Studio 49 2.4 1.4 40.8 55.1 32.7 8.2Rational Rose 49 1.5 1.2 77.6 85.7 10.2 6.1Rational RSx 49 1.3 0.9 91.8 91.8 6.1 4.1Rational XDE 49 1.2 0.8 89.8 91.8 4.1 2.0Together J 50 1.1 0.3 88.0 100.0 0.0 0.0
Note. Values range from Never (1) to Always (5).
28

Question 9: To what extent have you worked in the following technologies or platforms during the last 6 months.
The participant selected one of the following options for each sub-question listed: Never, Sometimes, Moderately often, Very often, and Always.
Responses for Question 9: What technologies / platforms do you use? (Data for the sub-sample consisting only of software developers)
Available options N mean s.d. % Never (1)
% Sometimes (1 + 2)
% Very often (4 + 5)
% Always (5)
J2SE 50 2.6 1.6 42.0 42.0 38.0 16.0J2EE 50 2.4 1.5 48.0 60.0 30.0 14.0PHP / Perl 49 2.2 1.4 42.9 69.4 26.5 6.1Ruby / Python 50 1.9 1.2 50.0 82.0 16.0 4.0ASP.Net 50 1.7 1.3 70.0 78.0 14.0 8.0C / C++* 24 2.6 1.7 45.8 50.0 37.5 20.8
Note. Values range from Never (1) to Always (5). *Where C/C++ was identified as an “other” technology.
Question 10: To what extent do you perform the following tasks.
The participant selected one of the following options for each sub-question listed: Never, Sometimes, Moderately often, Very often, and Always.
Responses for Question 10: What are your daily tasks? (Data for the sub-sample consisting only of software developers)
Available tasks N mean s.d. % Never (1)
% Sometimes (1 + 2)
% Very often (4 + 5)
% Always (5)
Think about s/w system 51 4.3 0.9 2.0 5.9 88.2 47.1Write new code 51 4.1 0.7 2.0 3.9 92.2 25.5Maintain existing code 51 3.9 0.7 0.0 3.9 76.5 19.6Fix bugs 50 3.9 0.8 0.0 6.0 72.0 20.0Design a s/w system 51 3.7 0.8 0.0 7.8 64.7 11.8Explain s/w design to others 50 3.5 0.8 0.0 12.0 54.0 10.0Perform manual testing 50 3.5 1.0 4.0 18.0 58.0 12.0Run / attend meetings 51 3.4 1.1 3.9 21.6 52.9 15.7Search about s/w system 49 3.3 1.0 0.0 28.6 49.0 10.2Lead software project 51 3.2 1.2 11.8 29.4 47.1 13.7Model a s/w system 51 3.1 1.1 7.8 31.4 45.1 7.8Write / maintain test scripts 51 2.9 1.2 11.8 37.3 29.4 9.8General administration 50 2.9 1.0 8.0 36.0 30.0 4.0Write / maintain requirements 50 2.7 1.0 12.0 48.0 30.0 0.0
Note. Values range from Never (1) to Always (5).
29

Question 11: To what extent do you use software tools in the modeling process for the following activities?
The question included an option to ignore this question if the participant does not use software design applications (which explains the lower number of participants answering this question). The participant selected one of the following options for each sub-question listed: Never, Sometimes, Moderately often, Very often, and Always.
Responses for Question 11: What do you use modeling tools for? (Data for the sub-sample consisting only of software developers)Activity N mean s.d. % Never
(1)% Sometimes (1 + 2)
% Very often (4 + 5)
% Always (5)
Transcribing a design into digital format 30 3.1 1.3 13.3 36.7 40.0 16.7Developing a design 30 2.9 1.2 6.7 46.7 30.0 16.7Prototyping a design 30 2.4 1.3 26.7 63.3 23.3 10.0Brainstorming possible designs 29 2.4 1.2 20.7 65.5 20.7 6.9Generating code (code editable) 29 1.9 1.2 51.7 79.3 13.8 3.4Generating all code 30 1.7 1.3 73.3 80.0 16.7 6.7
Note. Values range from Never (1) to Always (5).
Question 12: Based on past experience, how good (based on qualities like efficiency, accuracy and usability) are software design or modeling tools at accomplishing the following tasks
The question included an option to ignore this question if the participant does not use software design applications (which explains the lower number of participants answering this question). The participant selected one of the following options for each sub-question listed: Awful, Poor, OK, Good, Excellent.
Responses for Question 12: How good are modeling tools at ...? (Data for the sub-sample consisting only of software developers)
Available activities N mean s.d. % Awful (1)
% Poor (1 + 2)
% Good (4 + 5)
% Excellent (5)
Transcribing a design into digital format 35 3.1 1.0 2.9 28.6 34.3 5.7Developing a design 35 2.9 1.0 5.7 31.4 25.7 5.7Generating code (code is editable) 34 2.6 1.2 20.6 55.9 29.4 2.9Prototyping a design 33 2.5 1.0 18.2 54.5 15.2 3.0Brainstorming possible designs 35 2.3 1.0 22.9 65.7 17.1 0.0Generating all code (no manual coding) 34 1.7 0.9 50.0 91.2 5.9 2.9
Note. Values range from Awful (1) to Excellent (5).
Question 13: Please rank the following attributes of a software model from most important (1) to least important (9).
Responses for Question 13: Attributes of a modeling tool? (Data for the sub-sample consisting only of software developers)
30

Attribute / Ability to N Rank % Bottom 2
% Bottom 4
% Top 4 % Top 2
Communicate to others 46 1 13.0 17.4 76.1 65.2Readability 46 2 8.7 13.0 76.1 60.9Ease and speed to create 46 3 6.5 21.7 69.6 26.1Collaborate amongst developers 46 4 10.9 30.4 43.5 19.6Ability to analyze 46 5 10.9 43.5 45.7 13.0Ability to view different aspects of a model 46 6 6.5 52.2 32.6 8.7Information density 46 7 47.8 69.6 21.7 6.5Embed parts of model in documentation 46 8 54.3 82.6 13.0 4.3Generate code 46 9 60.9 84.8 15.2 6.5
Note. The % top 4 represents the percentage of participants that listed the attribute in their top four. Similarly for % bottom four. The same applies for % top2, and % bottom 2.
31

Question 14: For each of the following, how do code-centric development approaches compare to model-centric approaches.
This question asks about code-centric vs. model-centric approaches to software development. In a model-centric approach, the developers look to the model to see the design, and change the model as the first step in performing any design change. Extensive modeling is performed, and the coding is either automated, or at least straightforwardly determined from the model. In a code-centric approach, the code is seen as the main artefact; developers understand the design by understanding the code, and the process of design change is equated with changing the code.
The participant selected one of the following options for each sub-question listed: Much easier in a model-centric approach, Somewhat easier in a model-centric approach, About the same, Somewhat easier in a code centric approach, and Much easier in a code centric approach.
Responses for Question 14: Tasks that are better in a model-centric or code centric approach. (Data for the sub-sample consisting only of software developers)
Available activities N mean s.d. % Much easier in Models (1)
% Somewhat easier in Models (1 + 2)
% Somewhat easier in Code (4 + 5)
% Much easier in Code (5)
Fixing a bug 48 3.7 1.3 12.5 12.5 56.3 37.5Creating efficient software 48 3.7 1.3 6.3 22.9 58.3 37.5Creating a prototype 48 3.5 1.4 14.6 20.8 50.0 35.4Creating a system as quickly as possible 48 3.4 1.6 16.7 35.4 56.3 37.5Modifying a system when requirements change
48 2.9 1.5 22.9 39.6 33.3 22.9
Creating a usable system for end users 48 2.9 1.3 18.8 33.3 29.2 14.6
Creating a system that most accurately meets requirements
48 2.7 1.4 29.2 47.9 33.3 14.6
Creating a new system overall 48 2.6 1.5 35.4 52.1 33.3 14.6
Creating a re-usable system 48 2.6 1.5 37.5 47.9 25.0 16.7
Comprehending a system's behaviour 47 2.3 1.3 36.2 61.7 19.1 8.5
Explaining a system to others 48 2.0 1.3 47.9 70.8 10.4 10.4
Note. Values range from Much easier in a model-centric approach (1), to much easier in a code-centric approach (5).
32

Question 15: Which of the following are potential difficulties with modeling. These may be reasons why you don’t model much, or things you find hard about modeling.
The participant selected one of the following options for each sub-question listed: Not a problem, a slight problem, a moderate problem, a bad problem, and a terrible problem.
Responses for Question 15: Problems with a model-centric approach. (Data for the sub-sample consisting only of software developers)Potential problems N mean s.d. % Not
Problem (1)
% Slight Problem (1 + 2)
% Bad Problem (4 + 5)
% Terrible Problem (5)
Models become out of date and inconsistent with code
48 4.1 1.0 2.1 8.3 77.1 47.9
Models cannot be easily exchanged between tools
47 3.5 1.3 12.8 19.1 61.7 23.4
Modeling tools are 'heavyweight' (install, learn, configure, use)
48 3.4 1.1 6.3 20.8 54.2 16.7
Code generated from a modeling tool not of the kind I would like
47 3.4 1.4 14.9 23.4 53.2 25.5
Creating and editing a model is slow 48 3.1 1.3 12.5 33.3 35.4 20.8
Not enough detail to be implemented in code
47 3.0 1.3 17.0 38.3 40.4 10.6
Modeling tools change, models become obsolete
48 2.9 1.3 16.7 39.6 39.6 10.4
Modeling tools hide details (source code fully visible)
48 2.9 1.0 10.4 33.3 31.3 2.1
Modeling tools cannot be analyzed as intended
47 2.9 1.3 21.3 38.3 38.3 10.6
Modeling tools lack features I need or want 46 2.8 1.2 19.6 37.0 28.3 8.7
Modeling languages are not expressive enough
47 2.6 1.1 21.3 38.3 23.4 0.0
Semantics of models different from prog. language
47 2.6 1.4 29.8 48.9 27.7 12.8
Modeling tools are too expensive 46 2.6 1.3 28.3 45.7 26.1 6.5
Organization culture does not like modeling 48 2.4 1.3 37.5 52.1 20.8 4.2
Have had bad experiences with modeling 48 2.4 1.5 43.8 58.3 27.1 10.4
Modeling language hard to understand 48 2.2 1.0 31.3 64.6 10.4 2.1
Do not trust companies will continue to support their tools
45 2.0 1.1 48.9 66.7 15.6 0.0
Note. Values range from Not a problem (1), to Terrible problem (5).
33

Question 16: Which of the following are potential difficulties with code-centric development (i.e. lacking modeling).
The participant selected one of the following options for each sub-question listed: Not a problem, a slight problem, a moderate problem, a bad problem, and a terrible problem.
Responses for Question 16: Problems with a code-centric approach. (Data for the sub-sample consisting only of software developers)
Potential problems N mean s.d. % Not Problem (1)
% Slight Problem (1 + 2)
% Bad Problem (4 + 5)
% Terrible Problem (5)
Hard to see overall design 49 3.4 1.2 8.2 18.4 51.0 20.4Hard to understand behaviour of system 49 3.3 1.1 6.1 26.5 46.9 12.2
Difficult to change code without adding bugs
49 3.0 1.3 18.4 30.6 42.9 10.2
Code becomes of poorer quality over time 48 3.0 1.4 18.8 43.8 41.7 20.8
Too difficult to restructure system when needed
48 2.9 1.1 14.6 35.4 29.2 6.3
Changing code takes too much time 49 2.3 1.1 32.7 53.1 14.3 2.0
More skill than available to develop high quality code
46 2.2 1.1 37.0 63.0 10.9 4.3
Our prog. language leads to complex code 49 2.1 1.2 38.8 67.3 10.2 6.1
Prog. Languages not expressive enough 46 1.8 1.1 58.7 71.7 8.7 2.2Organization culture does not like code-centric
49 1.7 1.1 67.3 79.6 12.2 2.0
Our prog. language likely to become obsolete
48 1.6 0.9 62.5 83.3 6.3 0.0
Note. Values range from Not a problem (1) to Terrible problem (5).
34

Survey results for the software modellers.The following data is based on those individuals that model a software system very-often to always.
Questions with a user defined notion of a modelFor questions 1-5, the participants were asked to use their own interpretation of what a software model is and what consists of software modeling.
Question 1: To what extent do you consider the following to be a model of a software system?
The participant selected one of the following options for each sub-question listed: Strongly Disagree, Disagree, Neutral, Agree, and Strongly Agree.
Responses for Question 1: What is a Model? (Data for the sub-sample consisting only of software modellers)
Entity that might be a model N mean s.d. % Str. Disagree (1)
% Disagree (1 + 2)
% Agree (4 + 5)
% Str. Agree (5)
Class Diagram 45 4.3 0.9 2.2 6.7 88.9 53.3UML Deployment Diagram 46 4.1 1.0 4.3 6.5 78.3 43.5Use Case Diagram 46 4.1 1.1 4.3 10.9 84.8 41.3Textual Use Case 46 4.0 1.2 6.5 13.0 76.1 43.5Picture By Drawing Tool 46 3.9 1.1 4.3 15.2 80.4 30.4Whiteboard Drawing 46 3.9 1.2 8.7 13.0 76.1 34.8Picture By Hand 46 3.8 1.2 6.5 15.2 41.3 28.3Source Code 46 3.1 1.5 23.9 37.0 47.8 21.7Source Code Comment 46 2.8 1.3 21.7 41.3 32.6 13.0
Note. Values range from Strongly Disagree (1), Disagree (2), Neutral (3), Agree (4), to Strongly Agree (5).
35

Question 2: To what extent do you create or modify software models or modeling information in the following ways?
The participant selected one of the following options for each sub-question listed: Never, Sometimes, Moderately often, Very often, and Always.
Responses for Question 2: How do you model? (Data for the sub-sample consisting only of software modellers)
Medium or method used to model N mean s.d. % Never (1)
% Sometimes (1 + 2)
% Very often (4 + 5)
% Always (5)
Diagramming tool (e.g. Visio) 45 3.3 1.3 6.7 37.8 55.6 17.8Whiteboard drawing 45 3.1 1.2 6.7 37.8 42.2 15.6Modeling tool/CASE 46 3.1 1.5 21.7 39.1 47.8 19.6Word processor / text 46 3.0 1.2 4.3 41.3 30.4 17.4Word of mouth 45 2.8 1.2 15.6 42.2 22.2 13.3Handwritten material 46 2.6 1.2 17.4 54.3 26.1 8.7Drawing software 46 2.5 1.2 19.6 58.7 23.9 6.5Comments in source code 46 2.3 1.3 37.0 58.7 17.4 6.5
Note. Values range from Never (1), Sometimes (2), Moderately often (3), Very often(4), to Always (5).
Question 3: To what extent do you refer to the following sources of information when you want to learn about the design of a software system?
The participant selected one of the following options for each sub-question listed: Never, Sometimes, Moderately often, Very often, and Always.
Responses for Question 3: How do you learn about the design of software? (Data for the sub-sample consisting only of software modellers)
Refer to material created by/as N mean s.d. % Never (1)
% Sometimes (1 + 2)
% Very often (4 + 5)
% Always (5)
Word processor / text 46 3.5 1.1 2.2 21.7 56.5 17.4Diagramming tool (e.g. Visio) 46 3.4 1.0 2.2 21.7 50.0 15.2Word of mouth 46 3.4 1.1 4.3 26.1 52.2 17.4Whiteboard drawing 46 3.2 1.2 8.7 30.4 47.8 10.9Modeling tool/CASE 46 3.2 1.4 15.2 34.8 52.2 17.4Drawing software 46 3.0 1.1 6.5 45.7 23.9 6.5Comments in source code 46 2.6 1.2 17.4 56.5 23.9 10.9Handwritten material 44 2.5 1.2 22.7 61.4 25.0 4.5
Note. Values range from Never (1) to Always (5).
36

Question 4: At what point(s) in time do you visually document a design?
The participant selected one of the following options for each sub-question listed: Never, Sometimes, Moderately often, Very often, and Always.
Responses for Question 4: When do you visually document a design? (Data for the sub-sample consisting only of software modellers)
Timeline N mean s.d. % Never (1)
% Sometimes (1 + 2)
% Very often (4 + 5)
% Always (5)
Before coding 46 4.0 1.2 2.2 19.6 26.1 47.8During coding 46 3.2 1.2 6.5 28.3 26.1 15.2After coding 46 2.8 1.2 13.0 39.1 26.1 8.7Only on request 44 2.1 1.3 43.2 38.3 6.8 9.1
Note. Values range from Never (1) to Always (5).
Question 5: To what extent do you use the following notations for the purpose of modeling or design (if you don't know what one of these is, then ignore that particular item) .
The participant selected one of the following options for each sub-question listed: Never, Sometimes, Moderately often, Very often, and Always.
Responses for Question 5: What modeling notation do you use? (Data for the sub-sample consisting only of software modellers)
Language used to model N mean s.d. % Never (1)
% Sometimes (1 + 2)
% Very often (4 + 5)
% Always (5)
UML (any version) 46 3.8 1.3 6.5 21.7 69.6 34.8UML 1.* 38 3.1 1.4 18.4 39.5 47.4 18.4UML 2.* 39 3.1 1.4 17.9 41.0 46.2 20.5SQL 44 2.9 1.4 20.5 45.5 36.4 15.9ERD 45 2.8 1.3 17.8 51.1 31.1 13.3Structured Design models 41 2.7 1.3 14.6 51.2 24.4 14.6Well-defined DSL 42 1.9 1.1 50.0 71.4 9.5 2.4ROOM / RT for UML 42 1.8 1.2 61.9 76.2 14.3 4.8SDL 40 1.6 1.0 75.0 77.5 7.5 0.0BPEL 40 1.5 0.9 72.5 90.0 7.5 0.0Formal (e.g. Z, OCL) 41 1.4 0.8 73.2 95.1 2.4 2.4
Note. Values range from Never (1) to Always (5).
37

Questions with a well-defined notion of a modelFor the remainder of the survey, the participants were asked to assume that any reference to a software model refers to an artefact that represents an abstraction of the software you are building. A model can typically be viewed as a set of diagrams and/or pieces of structured text. It can be recorded on a white board, paper, or using a software tool. A model could use formal syntax and semantics but this is not necessary. We will consider the final source code of the system, and requirements written in natural language to not be models, although models can be embedded in a requirements document.
Question 6: Consider the situation in which you, as a software developer, have just been assigned a new feature to develop. In general, when working on this feature, at what point(s) in time do you perform the following tasks.
The participant selected one of the following options for each sub-question listed: Never, Primarily near the start of development, Primarily near the middle of development , Primarily near the end, In small increments at a few points in developments, and Constantly throughout a large part of the process.
Responses for Question 6: When do you perform the following tasks? (Data for the sub-sample consisting only of software modellers)
Available tasks N Mode % Mode % Never % Start % Middle
% End
Searching 40 Constantly 72.5 5.0 12.5 2.5 2.2Knowledge transfer 44 Constantly 59.1 2.3 2.3 0.0 23.9Requirements 46 Start 52.2 0.0 52.2 0.0 0.0Design 38 Constantly 44.7 2.6 42.1 13.2 0.0Develop tests 40 Constantly 42.5 5.0 17.5 10.0 13.0Perform testing 41 Constantly 41.5 7.3 0.0 12.2 15.2Coding 39 Constantly 41.0 7.7 2.6 28.2 19.6Modeling 42 Start 38.1 2.4 38.1 4.8 2.2Documentation 45 Constantly 31.1 4.4 15.6 4.4 23.9
38

Question 7: To what extent to you work on the following types of software?
The participant selected one of the following options for each sub-question listed: Never, Sometimes, Moderately often, Very often, and Always.
Responses for Question 7: What types of software do you build? (Data for the sub-sample consisting only of software modellers)
Available options N mean s.d. % Never (1)
% Sometimes (1 + 2)
% Very often (4 + 5)
% Always (5)
Business 42 3.4 1.5 19.0 31.0 64.3 23.8Design and Engineering 43 2.7 1.3 20.9 51.2 30.2 9.3Website Content Management 43 2.5 1.3 30.2 55.8 30.2 7.0Information Display (Search / News) 43 2.5 1.4 34.9 60.5 30.2 11.6Middleware 43 2.3 1.4 44.2 65.1 30.2 4.7Consumer 43 2.2 1.4 48.8 65.1 25.6 9.3Computational 42 2.2 1.2 35.7 73.8 19.0 7.1Servers 43 1.9 1.2 51.2 76.7 14.0 7.0Operating Systems 43 1.9 1.4 65.1 74.4 20.9 9.3Embedded Real-Time 42 1.8 1.3 66.7 76.2 16.7 4.8System Utilities 42 1.7 1.0 54.8 83.3 7.1 2.4Industrial Control 43 1.5 1.1 69.8 90.7 9.3 4.7Malware 42 1.2 0.5 85.7 95.2 0.0 0.0
Note. Values range from Never (1) to Always (5).
Question 8: To what extent have you worked with the following tools during the last 6 months.
The participant selected one of the following options for each sub-question listed: Never, Sometimes, Moderately often, Very often, and Always.
Responses for Question 8: What development tools do you use? (Data for the sub-sample consisting only of software modellers)
Available options N mean s.d. % Never (1)
% Sometimes (1 + 2)
% Very often (4 + 5)
% Always (5)
Eclipse 41 2.7 1.5 29.3 53.7 31.7 19.5Visual Studio 40 2.7 1.4 30.0 50.0 35.0 10.0Rational Rose 40 2.2 1.5 55.0 67.5 30.0 10.0Rational RSx 40 1.7 1.2 70.0 77.5 12.5 5.0Rational XDE 40 1.6 1.0 70.0 85.0 7.5 2.5Together J 41 1.2 0.4 82.9 100.0 0.0 0.0
Note. Values range from Never (1) to Always (5).
39

Question 9: To what extent have you worked in the following technologies or platforms during the last 6 months.
The participant selected one of the following options for each sub-question listed: Never, Sometimes, Moderately often, Very often, and Always.
Responses for Question 9: What technologies / platforms do you use? (Data for the sub-sample consisting only of software modellers)
Available options N mean s.d. % Never (1)
% Sometimes (1 + 2)
% Very often (4 + 5)
% Always (5)
J2EE 42 2.5 1.6 42.9 54.8 33.3 16.7J2SE 42 2.4 1.6 47.6 47.6 33.3 16.7PHP / Perl 42 2.0 1.4 54.8 71.4 21.4 9.5ASP.Net 44 2.0 1.5 59.1 70.5 18.2 15.9Ruby / Python 42 1.5 0.9 71.4 90.5 7.1 0.0C / C++* 19 2.2 1.6 63.2 63.2 26.3 15.8
Note. Values range from Never (1) to Always (5). *Where C/C++ was identified as an “other” technology.
Question 10: To what extent do you perform the following tasks.
The participant selected one of the following options for each sub-question listed: Never, Sometimes, Moderately often, Very often, and Always.
Responses for Question 10: What are your daily tasks? (Data for the sub-sample consisting only of software modellers)
Available tasks N mean s.d. % Never (1)
% Sometimes (1 + 2)
% Very often (4 + 5)
% Always (5)
Model a s/w system 44 4.3 0.4 0.0 0.0 100.0 25.0Think about s/w system 44 4.2 1.0 2.3 9.1 84.1 50.0Design a s/w system 44 4.1 0.7 0.0 4.5 88.6 27.3Run / attend meetings 44 3.9 1.0 2.3 13.6 79.5 25.0Explain s/w design to others 44 3.8 0.8 0.0 6.8 70.5 15.9Search about s/w system 43 3.6 1.0 0.0 20.9 67.4 16.3Lead software project 44 3.6 1.1 6.8 20.5 68.2 15.9Write / maintain requirements 44 3.5 1.0 2.3 22.7 61.4 9.1Write new code 44 3.1 1.4 20.5 34.1 50.0 13.6General administration 44 3.1 1.1 2.3 36.4 34.1 11.4Fix bugs 42 3.0 1.2 16.7 35.7 38.1 9.5Maintain existing code 44 2.9 1.4 20.5 38.6 38.6 13.6Perform manual testing 43 2.9 1.3 14.0 41.9 34.9 11.6Write / maintain test scripts 44 2.4 1.1 22.7 61.4 18.2 4.5
Note. Values range from Never (1) to Always (5).
40

Question 11: To what extent do you use software tools in the modeling process for the following activities?
The question included an option to ignore this question if the participant does not use software design applications (which explains the lower number of participants answering this question). The participant selected one of the following options for each sub-question listed: Never, Sometimes, Moderately often, Very often, and Always.
Responses for Question 11: What do you use modeling tools for? (Data for the sub-sample consisting only of software modellers)Activity N mean s.d. % Never
(1)% Sometimes (1 + 2)
% Very often (4 + 5)
% Always (5)
Developing a design 37 3.8 1.0 2.7 10.8 64.9 29.7Transcribing a design into digital format 37 3.4 1.2 8.1 21.6 48.6 24.3Prototyping a design 37 3.1 1.4 16.2 43.2 43.2 21.6Brainstorming possible designs 37 2.9 1.4 16.2 45.9 35.1 18.9Generating code (code editable) 36 2.6 1.3 19.4 55.6 27.8 11.1Generating all code 37 2.0 1.4 56.8 70.3 21.6 8.1
Note. Values range from Never (1) to Always (5).
Question 12: Based on past experience, how good (based on qualities like efficiency, accuracy and usability) are software design or modeling tools at accomplishing the following tasks
The question included an option to ignore this question if the participant does not use software design applications (which explains the lower number of participants answering this question). The participant selected one of the following options for each sub-question listed: Awful, Poor, OK, Good, Excellent.
Responses for Question 12: How good are modeling tools at ...? (Data for the sub-sample consisting only of software modellers)
Available activities N mean s.d. % Awful (1)
% Poor (1 + 2)
% Good (4 + 5)
% Excellent (5)
Developing a design 40 3.6 1.0 5.0 10.0 55.0 17.5Transcribing a design into digital format 40 3.4 1.0 0.0 22.5 47.5 12.5Generating code (code is editable) 40 3.2 1.2 5.0 32.5 40.0 15.0Prototyping a design 39 3.0 1.1 7.7 35.9 35.9 10.3Brainstorming possible designs 40 2.8 1.2 12.5 45.0 30.0 7.5Generating all code (no manual coding) 40 2.0 1.1 37.5 77.5 12.5 5.0
Note. Values range from Awful (1) to Excellent (5).
Question 13: Please rank the following attributes of a software model from most important (1) to least important (9).
Responses for Question 13: Attributes of a modeling tool? (Data for the sub-sample consisting only of software modellers)
41

Attribute / Ability to N Rank % Bottom 2
% Bottom 4
% Top 4 % Top 2
Communicate to others 40 1 15.0 17.5 75.0 57.5Readability 40 2 10.0 25.0 62.5 42.5Ability to analyze 40 3 12.5 32.5 57.5 30.0Ability to view different aspects of a model 40 4 7.5 35.0 47.5 15.0Collaborate amongst developers 40 5 12.5 40.0 45.0 17.5Ease and speed to create 40 6 12.5 52.5 40.0 17.5Generate code 40 7 60.0 72.5 22.5 10.0Information density 39 8 48.7 74.4 15.4 5.1Embed parts of model in documentation 40 9 52.5 77.5 15.0 2.5
Note. The % top 4 represents the percentage of participants that listed the attribute in their top four. Similarly for % bottom four. The same applies for % top2, and % bottom 2.
42

Question 14: For each of the following, how do code-centric development approaches compare to model-centric approaches.
This question asks about code-centric vs. model-centric approaches to software development. In a model-centric approach, the developers look to the model to see the design, and change the model as the first step in performing any design change. Extensive modeling is performed, and the coding is either automated, or at least straightforwardly determined from the model. In a code-centric approach, the code is seen as the main artefact; developers understand the design by understanding the code, and the process of design change is equated with changing the code.
The participant selected one of the following options for each sub-question listed: Much easier in a model-centric approach, Somewhat easier in a model-centric approach, About the same, Somewhat easier in a code centric approach, and Much easier in a code centric approach.
Responses for Question 14: Tasks that are better in a model-centric or code centric approach. (Data for the sub-sample consisting only of software modellers)
Available activities N mean s.d. % Much easier in Models (1)
% Somewhat easier in Models (1 + 2)
% Somewhat easier in Code (4 + 5)
% Much easier in Code (5)
Creating a system as quickly as possible 41 2.9 1.5 24.4 48.8 39.0 19.5Creating efficient software 41 2.8 1.3 22.0 41.5 31.7 12.2Creating a prototype 41 2.8 1.6 33.3 50.4 36.6 24.4Fixing a bug 39 2.8 1.5 30.8 41.0 33.3 15.4Creating a usable system for end users 41 2.3 1.2 36.6 53.7 17.1 4.9
Modifying a system when requirements change
40 2.2 1.3 42.5 60.0 20.0 5.0
Creating a re-usable system 41 1.9 1.3 61.0 73.2 14.6 7.3
Creating a system that most accurately meets requirements
41 1.8 1.1 58.5 80.5 9.8 4.9
Comprehending a system's behaviour 40 1.7 1.2 65.0 80.0 10.0 5.0
Creating a new system overall 41 1.6 1.0 63.4 85.4 9.8 2.4
Explaining a system to others 41 1.4 1.0 82.1 91.8 4.9 4.9
Note. Values range from Much easier in a model-centric approach (1), to much easier in a code-centric approach (5).
43

Question 15: Which of the following are potential difficulties with modeling. These may be reasons why you don’t model much, or things you find hard about modeling.
The participant selected one of the following options for each sub-question listed: Not a problem, a slight problem, a moderate problem, a bad problem, and a terrible problem.
Responses for Question 15: Problems with a model-centric approach. (Data for the sub-sample consisting only of software modellers)Potential problems N mean s.d. % Not
Problem (1)
% Slight Problem (1 + 2)
% Bad Problem (4 + 5)
% Terrible Problem (5)
Models become out of date and inconsistent with code
42 3.8 1.3 9.5 16.7 66.7 38.1
Models cannot be easily exchanged between tools
41 3.2 1.4 17.1 29.3 46.3 19.5
Modeling tools are 'heavyweight' (install, learn, configure, use)
42 3.0 1.2 11.9 40.5 40.5 11.9
Code generated from a modeling tool not of the kind I would like
41 2.9 1.4 22.0 43.9 36.6 17.1
Modeling tools are too expensive 41 2.8 1.2 24.4 34.1 31.7 2.4
Modeling tools lack features I need or want 40 2.7 1.2 15.0 47.5 27.5 7.5
Not enough detail to be implemented in code
42 2.5 1.2 28.6 50.0 23.8 4.8
Modeling tools change, models become obsolete
42 2.5 1.3 31.0 57.1 33.3 4.8
Modeling tools cannot be analyzed as intended
41 2.5 1.4 31.7 56.1 26.8 9.8
Creating and editing a model is slow 42 2.5 1.3 31.0 50.0 19.0 9.5
Organization culture does not like modeling 42 2.4 1.3 35.7 50.0 26.2 2.4
Modeling tools hide details (source code fully visible)
42 2.4 1.1 28.6 54.8 23.8 0.0
Have had bad experiences with modeling 41 2.3 1.3 39.0 56.1 19.5 7.3
Semantics of models different from prog. language
42 2.2 1.2 38.1 61.9 19.0 4.8
Modeling languages are not expressive enough
41 2.1 1.0 36.6 58.5 7.3 0.0
Do not trust companies will continue to support their tools
40 2.1 1.1 37.5 67.5 15.0 0.0
Modeling language hard to understand 42 2.0 1.0 38.1 71.4 7.1 2.4
Note. Values range from Not a problem (1), to Terrible problem (5).
44
Question 16: Which of the following are potential difficulties with code-centric development (i.e. lacking modeling).
The participant selected one of the following options for each sub-question listed: Not a problem, a slight problem, a moderate problem, a bad problem, and a terrible problem.
Responses for Question 16: Problems with a code-centric approach. (Data for the sub-sample consisting only of software modellers)
Potential problems N mean s.d. % Not Problem (1)
% Slight Problem (1 + 2)
% Bad Problem (4 + 5)
% Terrible Problem (5)
Hard to see overall design 42 4.0 1.2 7.1 9.5 73.8 40.5Hard to understand behaviour of system 42 3.8 1.1 7.1 9.5 73.8 26.2
Code becomes of poorer quality over time 42 3.8 1.2 7.1 14.3 71.4 31.0
Too difficult to restructure system when needed
41 3.6 1.0 4.9 12.2 58.5 19.5
Difficult to change code without adding bugs
41 3.6 1.2 9.8 17.1 61.0 22.0
Changing code takes too much time 42 2.8 1.2 16.7 40.5 26.2 7.1
Our prog. language leads to complex code 42 2.6 1.3 26.2 40.5 21.4 9.5
More skill than available to develop high quality code
40 2.6 1.3 25.0 52.5 25.0 10.0
Prog. Languages not expressive enough 41 2.2 1.3 46.3 61.0 19.5 7.3Organization culture does not like code-centric
42 2.1 1.3 47.6 64.3 19.0 4.8
Our prog. language likely to become obsolete
41 2.0 1.1 43.9 73.2 9.8 4.9
Note. Values range from Not a problem (1) to Terrible problem (5).
45

Survey results for the participants who generate code from models.The following data is based on those individuals that either generate source code templates (which will be edited manually to complete their internal functionality), or generate all necessary code (no manual modification of code necessary) very-often or always.
Questions with a user defined notion of a modelFor questions 1-5, the participants were asked to use their own interpretation of what a software model is and what consists of software modeling.
Question 1: To what extent do you consider the following to be a model of a software system?
The participant selected one of the following options for each sub-question listed: Strongly Disagree, Disagree, Neutral, Agree, and Strongly Agree.
Responses for Question 1: What is a Model? (Data for the sub-sample consisting only of participants who generate code from models)Entity that might be a model N mean s.d. % Str.
Disagree (1)
% Disagree (1 + 2)
% Agree (4 + 5)
% Str. Agree (5)
Class Diagram 15 4.5 0.8 0.0 6.7 93.3 66.7UML Deployment Diagram 15 4.4 0.7 0.0 0.0 86.7 53.3Use Case Diagram 15 4.0 1.3 6.7 20.0 80.0 46.7Picture By Drawing Tool 15 3.7 1.2 6.7 20.0 80.0 20.0Textual Use Case 15 3.6 1.5 13.3 26.7 66.7 33.3Whiteboard Drawing 15 3.5 1.4 20.0 20.0 73.3 20.0Source Code 15 3.5 1.6 13.3 33.3 60.0 40.0Picture By Hand 15 3.4 1.4 13.3 26.7 40.0 20.0Source Code Comment 15 2.7 1.4 26.7 53.3 33.3 13.3
Note. Values range from Strongly Disagree (1), Disagree (2), Neutral (3), Agree (4), to Strongly Agree (5).
46

Question 2: To what extent do you create or modify software models or modeling information in the following ways?
The participant selected one of the following options for each sub-question listed: Never, Sometimes, Moderately often, Very often, and Always.
Responses for Question 2: How do you model?
Medium or method used to model N mean s.d. % Never (1)
% Sometimes (1 + 2)
% Very often (4 + 5)
% Always (5)
Modeling tool/CASE 15 3.4 1.5 13.3 33.3 60.0 26.7Diagramming tool (e.g. Visio) 14 3.1 1.2 7.1 35.7 42.9 14.3Word processor / text 15 2.7 1.1 13.3 46.7 20.0 6.7Whiteboard drawing 15 2.7 1.2 13.3 46.7 13.3 13.3Handwritten material 15 2.4 1.4 33.3 60.0 20.0 13.3Word of mouth 15 2.3 1.5 46.7 60.0 20.0 13.3Drawing software 15 1.8 1.1 46.7 86.7 6.7 6.7Comments in source code 15 1.7 1.0 60.0 66.7 0.0 0.0
Note. Values range from Never (1), Sometimes (2), Moderately often (3), Very often(4), to Always (5).
Question 3: To what extent do you refer to the following sources of information when you want to learn about the design of a software system?
The participant selected one of the following options for each sub-question listed: Never, Sometimes, Moderately often, Very often, and Always.
Responses for Question 3: How do you learn about the design of software? (Data for the sub-sample consisting only of participants who generate code from models)
Refer to material created by/as N mean s.d. % Never (1)
% Sometimes (1 + 2)
% Very often (4 + 5)
% Always (5)
Modeling tool/CASE 15 3.5 1.1 0.0 26.7 60.0 20.0Diagramming tool (e.g. Visio) 15 3.3 0.9 0.0 20.0 46.7 6.7Word processor / text 15 3.2 1.1 6.7 26.7 46.7 6.7Whiteboard drawing 15 2.9 1.2 13.3 40.0 40.0 6.7Word of mouth 15 2.9 1.2 13.3 46.7 40.0 6.7Drawing software 14 2.4 1.2 14.3 57.1 7.1 7.1Comments in source code 15 2.4 1.2 26.7 60.0 20.0 6.7Handwritten material 14 2.3 0.9 14.3 71.4 14.3 0.0
Note. Values range from Never (1) to Always (5).
47

Question 4: At what point(s) in time do you visually document a design?
The participant selected one of the following options for each sub-question listed: Never, Sometimes, Moderately often, Very often, and Always.
Responses for Question 4: When do you visually document a design? (Data for the sub-sample consisting only of participants who generate code from models)
Timeline N mean s.d. % Never (1)
% Sometimes (1 + 2)
% Very often (4 + 5)
% Always (5)
Before coding 15 3.7 1.3 6.7 26.7 20.0 40.0During coding 15 2.9 1.2 13.3 40.0 13.3 13.3After coding 15 2.7 1.4 26.7 40.0 20.0 13.3Only on request 15 2.2 1.4 40.0 46.7 6.7 13.3
Note. Values range from Never (1) to Always (5).
Question 5: To what extent do you use the following notations for the purpose of modeling or design (if you don't know what one of these is, then ignore that particular item) .
The participant selected one of the following options for each sub-question listed: Never, Sometimes, Moderately often, Very often, and Always.
Responses for Question 5: What modeling notation do you use? (Data for the sub-sample consisting only of participants who generate code from models)
Language used to model N mean s.d. % Never (1)
% Sometimes (1 + 2)
% Very often (4 + 5)
% Always (5)
UML (any version) 15 4.0 1.3 6.7 13.3 73.3 46.7UML 1.* 12 3.5 1.3 8.3 25.0 58.3 25.0UML 2.* 13 3.2 1.6 23.1 38.5 53.8 23.1ERD 14 2.7 1.4 14.3 64.3 35.7 14.3SQL 15 2.7 1.4 26.7 53.3 33.3 13.3Structured Design models 13 2.4 0.9 0.0 76.9 7.7 7.7Well-defined DSL 15 2.1 1.0 40.0 60.0 6.7 0.0ROOM / RT for UML 13 2.0 1.5 61.5 69.2 23.1 7.7Formal (e.g. Z, OCL) 14 1.6 1.2 64.3 85.7 7.1 7.1SDL 13 1.6 1.0 69.2 76.9 7.7 0.0BPEL 14 1.6 0.9 64.3 85.7 7.1 0.0
Note. Values range from Never (1) to Always (5).
48

Questions with a well-defined notion of a modelFor the remainder of the survey, the participants were asked to assume that any reference to a software model refers to an artefact that represents an abstraction of the software you are building. A model can typically be viewed as a set of diagrams and/or pieces of structured text. It can be recorded on a white board, paper, or using a software tool. A model could use formal syntax and semantics but this is not necessary. We will consider the final source code of the system, and requirements written in natural language to not be models, although models can be embedded in a requirements document.
Question 6: Consider the situation in which you, as a software developer, have just been assigned a new feature to develop. In general, when working on this feature, at what point(s) in time do you perform the following tasks.
The participant selected one of the following options for each sub-question listed: Never, Primarily near the start of development, Primarily near the middle of development , Primarily near the end, In small increments at a few points in developments, and Constantly throughout a large part of the process.
Responses for Question 6: When do you perform the following tasks? (Data for the sub-sample consisting only of participants who generate code from models)
Available tasks N Mode % Mode % Never % Start % Middle
% End
Searching 13 Constantly 61.5 0.0 30.8 0.0 0.0Design 12 Start 58.3 8.3 58.3 0.0 0.0Requirements 15 Start 53.3 0.0 53.3 0.0 0.0Perform testing 13 Constantly 46.2 7.7 0.0 15.4 13.3Knowledge transfer 15 Constantly 40.0 0.0 6.7 0.0 20.0Modeling 13 Constantly 38.5 0.0 38.5 7.7 0.0Documentation 14 Constantly 35.7 7.1 21.4 0.0 20.0Coding 13 Middle 30.8 7.7 7.7 30.8 20.0Develop tests 14 Constantly 28.6 0.0 21.4 14.3 13.3
49

Question 7: To what extent to you work on the following types of software?
The participant selected one of the following options for each sub-question listed: Never, Sometimes, Moderately often, Very often, and Always.
Responses for Question 7: What types of software do you build? (Data for the sub-sample consisting only of participants who generate code from models)
Available options N mean s.d. % Never (1)
% Sometimes (1 + 2)
% Very often (4 + 5)
% Always (5)
Business 12 3.5 1.4 16.7 25.0 66.7 25.0Design and Engineering 13 3.4 1.2 7.7 23.1 53.8 15.4Computational 13 2.5 1.6 38.5 61.5 38.5 15.4Middleware 13 2.4 1.4 38.5 61.5 30.8 7.7Website Content Management 13 2.3 1.4 38.5 61.5 23.1 7.7Information Display (Search / News) 13 2.2 1.5 46.2 69.2 23.1 15.4Operating Systems 13 2.1 1.4 53.8 69.2 23.1 7.7Embedded Real-Time 13 2.0 1.6 69.2 69.2 23.1 15.4Consumer 13 1.9 1.3 61.5 69.2 23.1 0.0Industrial Control 12 1.8 1.5 66.7 83.3 16.7 16.7System Utilities 12 1.6 1.1 75.0 75.0 8.3 0.0Servers 13 1.5 1.2 76.9 84.6 7.7 7.7Malware 13 1.2 0.6 84.6 92.3 0.0 0.0
Note. Values range from Never (1) to Always (5).
Question 8: To what extent have you worked with the following tools during the last 6 months.
The participant selected one of the following options for each sub-question listed: Never, Sometimes, Moderately often, Very often, and Always.
Responses for Question 8: What development tools do you use? (Data for the sub-sample consisting only of participants who generate code from models)
Available options N mean s.d. % Never (1)
% Sometimes (1 + 2)
% Very often (4 + 5)
% Always (5)
Visual Studio 12 2.9 0.9 8.3 25.0 25.0 0.0Rational Rose 11 2.8 1.6 36.4 45.5 54.5 9.1Eclipse 12 2.8 1.5 25.0 50.0 33.3 16.7Rational RSx 12 2.1 1.5 58.3 66.7 25.0 8.3Rational XDE 12 1.9 1.3 50.0 83.3 16.7 8.3Together J 12 1.1 0.3 91.7 100.0 0.0 0.0
Note. Values range from Never (1) to Always (5).
50

Question 9: To what extent have you worked in the following technologies or platforms during the last 6 months.
The participant selected one of the following options for each sub-question listed: Never, Sometimes, Moderately often, Very often, and Always.
Responses for Question 9: What technologies / platforms do you use? (Data for the sub-sample consisting only of participants who generate code from models)
Available options N mean s.d. % Never (1)
% Sometimes (1 + 2)
% Very often (4 + 5)
% Always (5)
J2EE 11 2.5 1.6 36.4 54.5 27.3 18.2ASP.Net 12 2.4 1.9 58.3 66.7 33.3 33.3J2SE 11 2.2 1.7 54.5 54.5 27.3 18.2PHP / Perl 11 1.9 1.2 54.5 72.7 18.2 0.0Ruby / Python 11 1.5 0.9 72.7 90.9 9.1 0.0C / C++* 10 1.6 1.3 80.0 80.0 10.0 10.0
Note. Values range from Never (1) to Always (5). *Where C/C++ was identified as an “other” technology.
Question 10: To what extent do you perform the following tasks.
The participant selected one of the following options for each sub-question listed: Never, Sometimes, Moderately often, Very often, and Always.
Responses for Question 10: What are your daily tasks? (Data for the sub-sample consisting only of participants who generate code from models)
Available tasks N mean s.d. % Never (1)
% Sometimes (1 + 2)
% Very often (4 + 5)
% Always (5)
Model a s/w system 12 4.3 0.7 0.0 0.0 91.7 41.7Think about s/w system 12 4.3 0.9 0.0 8.3 91.7 50.0Run / attend meetings 12 4.3 0.6 0.0 0.0 91.7 33.3Design a s/w system 12 4.1 1.0 0.0 8.3 75.0 41.7Explain s/w design to others 12 4.0 0.9 0.0 8.3 83.3 25.0Lead software project 12 4.0 1.0 0.0 8.3 75.0 33.3General administration 12 3.8 0.9 0.0 8.3 66.7 25.0Write / maintain requirements 12 3.6 1.2 8.3 25.0 75.0 16.7Search about s/w system 11 3.5 1.1 0.0 27.3 63.6 18.2Fix bugs 12 2.9 1.3 16.7 41.7 41.7 8.3Write / maintain test scripts 12 2.6 1.5 33.3 58.3 41.7 8.3Maintain existing code 12 2.6 1.6 33.3 58.3 33.3 16.7Perform manual testing 12 2.5 1.4 33.3 58.3 33.3 8.3Write new code 12 2.5 1.6 41.7 58.3 33.3 16.7
Note. Values range from Never (1) to Always (5).
51

Question 11: To what extent do you use software tools in the modeling process for the following activities?
The question included an option to ignore this question if the participant does not use software design applications (which explains the lower number of participants answering this question). The participant selected one of the following options for each sub-question listed: Never, Sometimes, Moderately often, Very often, and Always.
Responses for Question 11: What do you use modeling tools for? (Data for the sub-sample consisting only of participants who generate code from models)Activity N mean s.d. % Never
(1)% Sometimes (1 + 2)
% Very often (4 + 5)
% Always (5)
Developing a design 13 4.4 0.7 0.0 0.0 92.3 46.2Generating code (code editable) 12 4.3 0.6 0.0 0.0 91.7 33.3Prototyping a design 13 4.1 1.1 0.0 15.4 76.9 46.2Transcribing a design into digital format 13 3.8 1.3 7.7 15.4 69.2 38.5Generating all code 13 3.6 1.3 15.4 15.4 69.2 23.1Brainstorming possible designs 13 3.3 1.5 15.4 30.8 46.2 30.8
Note. Values range from Never (1) to Always (5).
Question 12: Based on past experience, how good (based on qualities like efficiency, accuracy and usability) are software design or modeling tools at accomplishing the following tasks
The question included an option to ignore this question if the participant does not use software design applications (which explains the lower number of participants answering this question). The participant selected one of the following options for each sub-question listed: Awful, Poor, OK, Good, Excellent.
Responses for Question 12: How good are modeling tools at ...? (Data for the sub-sample consisting only of participants who generate code from models)
Available activities N mean s.d. % Awful (1)
% Poor (1 + 2)
% Good (4 + 5)
% Excellent (5)
Generating code (code is editable) 12 3.9 1.1 0.0 16.7 75.0 33.3Developing a design 12 3.8 0.8 0.0 0.0 58.3 16.7Transcribing a design into digital format 12 3.6 0.9 0.0 8.3 50.0 16.7Prototyping a design 11 3.5 1.1 0.0 27.3 54.5 18.2Brainstorming possible designs 12 3.3 1.2 8.3 25.0 50.0 16.7Generating all code (no manual coding) 12 3.0 1.4 8.3 50.0 33.3 25.0
Note. Values range from Awful (1) to Excellent (5).
Question 13: Please rank the following attributes of a software model from most important (1) to least important (9).
Responses for Question 13: Attributes of a modeling tool? (Data for the sub-sample consisting only of participants who generate code from models)
52

Attribute / Ability to N Rank % Bottom 2
% Bottom 4
% Top 4 % Top 2
Ability to analyze 12 1 8.3 33.3 66.7 25.0Ability to view different aspects of a model 12 2 8.3 25.0 50.0 25.0Communicate to others 12 3 33.3 33.3 58.3 33.3Readability 12 4 16.7 50.0 41.7 25.0Generate code 12 5 33.3 50.0 33.3 33.3Collaborate amongst developers 12 6 33.3 58.3 33.3 8.3Ease and speed to create 12 7 25.0 75.0 16.7 0.0Information density 11 8 36.4 72.7 18.2 9.1Embed parts of model in documentation 12 9 66.7 75.0 25.0 8.3
Note. The % top 4 represents the percentage of participants that listed the attribute in their top four. Similarly for % bottom four. The same applies for % top2, and % bottom 2.
53

Question 14: For each of the following, how do code-centric development approaches compare to model-centric approaches.
This question asks about code-centric vs. model-centric approaches to software development. In a model-centric approach, the developers look to the model to see the design, and change the model as the first step in performing any design change. Extensive modeling is performed, and the coding is either automated, or at least straightforwardly determined from the model. In a code-centric approach, the code is seen as the main artefact; developers understand the design by understanding the code, and the process of design change is equated with changing the code.
The participant selected one of the following options for each sub-question listed: Much easier in a model-centric approach, Somewhat easier in a model-centric approach, About the same, Somewhat easier in a code centric approach, and Much easier in a code centric approach.
Responses for Question 14: Tasks that are better in a model-centric or code centric approach. (Data for the sub-sample consisting only of participants who generate code from models)
Available activities N mean s.d. % Much easier in Models (1)
% Somewhat easier in Models (1 + 2)
% Somewhat easier in Code (4 + 5)
% Much easier in Code (5)
Creating a system as quickly as possible 12 2.2 1.3 41.7 66.7 16.7 8.3Creating efficient software 12 2.1 1.2 50.0 58.3 16.7 0.0Creating a prototype 12 2.1 1.6 63.6 72.0 16.7 16.7Fixing a bug 11 2.0 1.4 54.5 72.7 18.2 9.1Creating a system that most accurately meets requirements
12 1.9 1.6 66.7 75.0 16.7 16.7
Creating a usable system for end users 12 1.8 0.9 50.0 66.7 0.0 0.0
Modifying a system when requirements change
12 1.4 1.0 83.3 83.3 8.3 0.0
Creating a re-usable system 12 1.3 0.8 83.3 83.3 0.0 0.0
Creating a new system overall 12 1.1 0.3 91.7 100.0 0.0 0.0
Comprehending a system's behaviour 12 1.1 0.3 91.7 100.0 0.0 0.0
Explaining a system to others 12 1.0 0.0 109.1 109.1 0.0 0.0
Note. Values range from Much easier in a model-centric approach (1), to much easier in a code-centric approach (5).
54

Question 15: Which of the following are potential difficulties with modeling. These may be reasons why you don’t model much, or things you find hard about modeling.
The participant selected one of the following options for each sub-question listed: Not a problem, a slight problem, a moderate problem, a bad problem, and a terrible problem.
Responses for Question 15: Problems with a model-centric approach. (Data for the sub-sample consisting only of participants who generate code from models)Potential problems N mean s.d. % Not
Problem (1)
% Slight Problem (1 + 2)
% Bad Problem (4 + 5)
% Terrible Problem (5)
Modeling tools are too expensive 12 3.3 1.2 16.7 16.7 50.0 8.3
Models become out of date and inconsistent with code
12 3.2 1.4 16.7 33.3 50.0 16.7
Models cannot be easily exchanged between tools
12 3.1 1.4 25.0 25.0 50.0 8.3
Modeling tools lack features I need or want 10 3.0 1.3 0.0 60.0 40.0 20.0
Modeling tools are 'heavyweight' (install, learn, configure, use)
12 2.9 1.2 16.7 33.3 41.7 0.0
Have had bad experiences with modeling 11 2.8 1.5 27.3 45.5 36.4 18.2
Modeling tools change, models become obsolete
12 2.6 1.4 33.3 50.0 33.3 8.3
Do not trust companies will continue to support their tools
11 2.5 0.9 18.2 36.4 9.1 0.0
Semantics of models different from prog. language
12 2.5 1.6 41.7 58.3 33.3 16.7
Modeling tools cannot be analyzed as intended
11 2.5 1.4 27.3 63.6 18.2 18.2
Not enough detail to be implemented in code
12 2.3 1.0 25.0 50.0 8.3 0.0
Modeling language hard to understand 12 2.3 1.4 33.3 66.7 25.0 8.3
Organization culture does not like modeling 12 2.3 1.4 41.7 50.0 16.7 8.3
Modeling languages are not expressive enough
11 2.3 1.0 27.3 54.5 9.1 0.0
Code generated from a modeling tool not of the kind I would like
11 2.3 1.0 27.3 54.5 9.1 0.0
Creating and editing a model is slow 12 2.3 1.0 25.0 58.3 8.3 0.0
Modeling tools hide details (source code fully visible)
12 2.0 1.0 33.3 75.0 8.3 0.0
Note. Values range from Not a problem (1), to Terrible problem (5).
55

Question 16: Which of the following are potential difficulties with code-centric development (i.e. lacking modeling).
The participant selected one of the following options for each sub-question listed: Not a problem, a slight problem, a moderate problem, a bad problem, and a terrible problem.
Responses for Question 16: Problems with a code-centric approach. (Data for the sub-sample consisting only of participants who generate code from models)
Potential problems N mean s.d. % Not Problem (1)
% Slight Problem (1 + 2)
% Bad Problem (4 + 5)
% Terrible Problem (5)
Hard to see overall design 12 4.2 0.8 0.0 0.0 75.0 41.7Hard to understand behaviour of system 12 3.9 0.5 0.0 0.0 83.3 8.3
Too difficult to restructure system when needed
12 3.9 0.9 0.0 8.3 75.0 25.0
Code becomes of poorer quality over time 12 3.9 1.2 8.3 8.3 75.0 33.3
Difficult to change code without adding bugs
12 3.7 1.2 8.3 8.3 58.3 25.0
More skill than available to develop high quality code
11 3.1 1.4 18.2 36.4 45.5 18.2
Changing code takes too much time 12 3.1 1.2 8.3 33.3 41.7 8.3
Our prog. language leads to complex code 12 3.1 1.2 8.3 33.3 33.3 16.7
Prog. Languages not expressive enough 12 2.9 1.6 33.3 33.3 41.7 16.7Our prog. language likely to become obsolete
12 2.6 1.5 33.3 50.0 25.0 16.7
Organization culture does not like code-centric
11 2.3 1.7 54.5 63.6 27.3 18.2
Note. Values range from Not a problem (1) to Terrible problem (5).
56

Survey results for the software veterans.The following data is based on those individuals that have at least 12 years experience in the software industry.
Questions with a user defined notion of a modelFor questions 1-5, the participants were asked to use their own interpretation of what a software model is and what consists of software modeling.
Question 1: To what extent do you consider the following to be a model of a software system?
The participant selected one of the following options for each sub-question listed: Strongly Disagree, Disagree, Neutral, Agree, and Strongly Agree.
Responses for Question 1: What is a Model? (Data for the sub-sample consisting only of participants with at least 12 years experience)Entity that might be a model N mean s.d. % Str.
Disagree (1)
% Disagree (1 + 2)
% Agree (4 + 5)
% Str. Agree (5)
Class Diagram 56 4.3 0.9 1.8 3.6 83.9 51.8Picture By Drawing Tool 55 4.1 0.8 1.8 5.5 89.1 29.1Whiteboard Drawing 56 4.0 1.0 5.4 7.1 85.7 26.8UML Deployment Diagram 55 4.0 1.0 3.6 7.3 74.5 36.4Use Case Diagram 56 4.0 1.1 3.6 12.5 80.4 35.7Picture By Hand 56 3.9 0.9 1.8 8.9 58.9 23.2Textual Use Case 56 3.8 1.1 3.6 14.3 73.2 26.8Source Code 56 3.4 1.5 14.3 33.9 57.1 32.1Source Code Comment 56 2.8 1.2 14.3 46.4 35.7 8.9
Note. Values range from Strongly Disagree (1), Disagree (2), Neutral (3), Agree (4), to Strongly Agree (5).
57
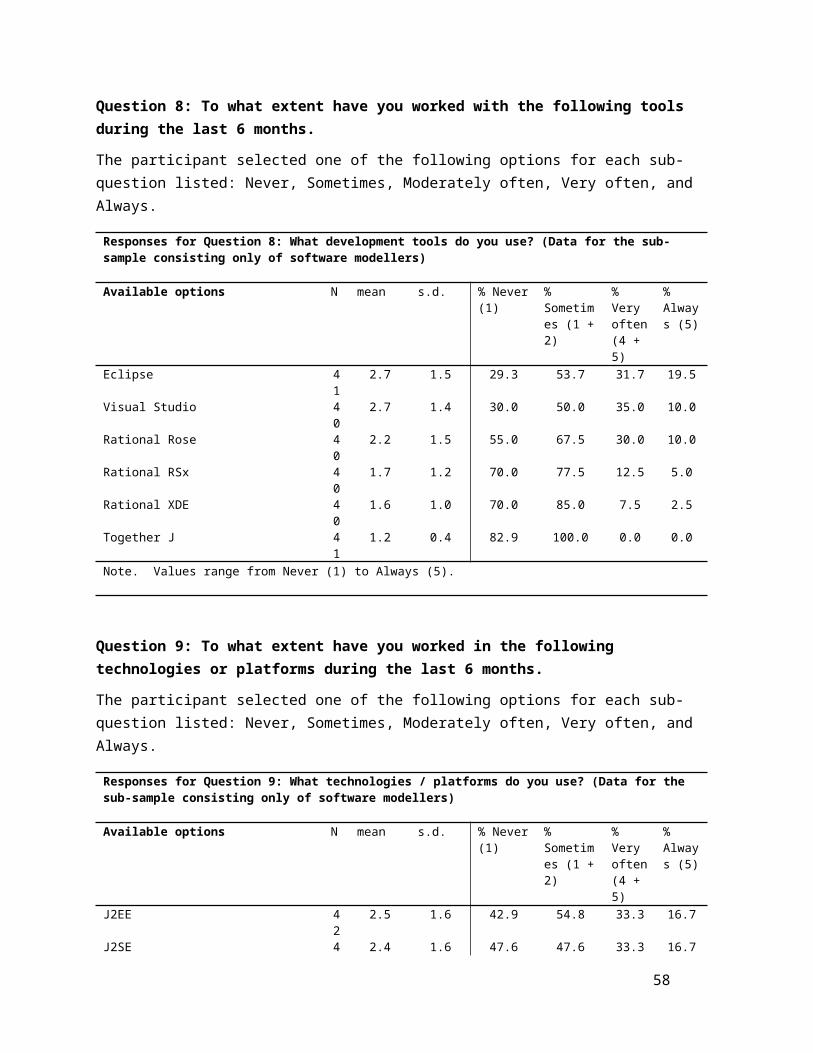
Question 2: To what extent do you create or modify software models or modeling information in the following ways?
The participant selected one of the following options for each sub-question listed: Never, Sometimes, Moderately often, Very often, and Always.
Responses for Question 2: How do you model? (Data for the sub-sample consisting only of participants with at least 12 years experience)
Medium or method used to model N mean s.d. % Never (1)
% Sometimes (1 + 2)
% Very often (4 + 5)
% Always (5)
Whiteboard drawing 55 3.1 1.1 5.5 36.4 41.8 7.3Word processor / text 56 2.8 1.1 8.9 48.2 26.8 7.1Word of mouth 55 2.7 1.1 14.5 47.3 25.5 7.3Diagramming tool (e.g. Visio) 56 2.7 1.2 17.9 53.6 33.9 3.6Handwritten material 56 2.6 1.0 8.9 53.6 19.6 3.6Comments in source code 55 2.4 1.2 30.9 54.5 18.2 3.6Modeling tool/CASE 56 2.3 1.4 42.9 60.7 28.6 7.1Drawing software 56 1.9 0.9 35.7 78.6 8.9 0.0
Note. Values range from Never (1), Sometimes (2), Moderately often (3), Very often(4), to Always (5).
Question 3: To what extent do you refer to the following sources of information when you want to learn about the design of a software system?
The participant selected one of the following options for each sub-question listed: Never, Sometimes, Moderately often, Very often, and Always.
Responses for Question 3: How do you learn about the design of software? (Data for the sub-sample consisting only of participants with at least 12 years experience)
Refer to material created by/as N mean s.d. % Never (1)
% Sometimes (1 + 2)
% Very often (4 + 5)
% Always (5)
Word of mouth 56 3.4 1.1 5.4 21.4 57.1 12.5Word processor / text 55 3.3 1.0 5.5 21.8 54.5 7.3Whiteboard drawing 55 3.1 1.1 7.3 32.7 47.3 5.5Diagramming tool (e.g. Visio) 56 3.0 1.1 12.5 33.9 37.5 5.4Comments in source code 56 2.6 1.1 12.5 51.8 19.6 8.9Drawing software 54 2.5 1.0 16.7 61.1 11.1 1.9Handwritten material 54 2.3 1.1 27.8 61.1 20.4 1.9Modeling tool/CASE 56 2.3 1.3 37.5 60.7 26.8 1.8
Note. Values range from Never (1) to Always (5).
58

Question 4: At what point(s) in time do you visually document a design?
The participant selected one of the following options for each sub-question listed: Never, Sometimes, Moderately often, Very often, and Always.
Responses for Question 4: When do you visually document a design? (Data for the sub-sample consisting only of participants with at least 12 years experience)
Timeline N mean s.d. % Never (1)
% Sometimes (1 + 2)
% Very often (4 + 5)
% Always (5)
Before coding 56 3.6 1.2 5.4 17.9 28.6 30.4During coding 56 3.0 1.1 7.1 28.6 26.8 7.1After coding 56 2.4 1.0 12.5 51.8 16.1 1.8Only on request 53 1.8 1.0 49.1 37.6 1.9 3.8
Note. Values range from Never (1) to Always (5).
Question 5: To what extent do you use the following notations for the purpose of modeling or design (if you don't know what one of these is, then ignore that particular item) .
The participant selected one of the following options for each sub-question listed: Never, Sometimes, Moderately often, Very often, and Always.
Responses for Question 5: What modeling notation do you use? (Data for the sub-sample consisting only of participants with at least 12 years experience)
Language used to model N mean s.d. % Never (1)
% Sometimes (1 + 2)
% Very often (4 + 5)
% Always (5)
UML (any version) 56 3.1 1.4 17.9 39.3 50.0 17.9UML 2.* 49 2.5 1.3 26.5 57.1 28.6 8.2Structured Design models 52 2.4 1.0 19.2 59.6 13.5 3.8UML 1.* 49 2.3 1.3 36.7 59.2 22.4 6.1SQL 55 2.2 1.2 38.2 63.6 18.2 5.5ERD 55 2.1 1.2 36.4 70.9 14.5 7.3Well-defined DSL 53 1.6 0.7 56.6 84.9 0.0 0.0ROOM / RT for UML 50 1.3 0.7 76.0 94.0 2.0 0.0BPEL 50 1.3 0.6 80.0 94.0 2.0 0.0Formal (e.g. Z, OCL) 52 1.3 0.6 78.8 96.2 1.9 0.0SDL 46 1.2 0.7 89.1 93.5 4.3 0.0
Note. Values range from Never (1) to Always (5).
59

Questions with a well-defined notion of a modelFor the remainder of the survey, the participants were asked to assume that any reference to a software model refers to an artefact that represents an abstraction of the software you are building. A model can typically be viewed as a set of diagrams and/or pieces of structured text. It can be recorded on a white board, paper, or using a software tool. A model could use formal syntax and semantics but this is not necessary. We will consider the final source code of the system, and requirements written in natural language to not be models, although models can be embedded in a requirements document.
Question 6: Consider the situation in which you, as a software developer, have just been assigned a new feature to develop. In general, when working on this feature, at what point(s) in time do you perform the following tasks.
The participant selected one of the following options for each sub-question listed: Never, Primarily near the start of development, Primarily near the middle of development , Primarily near the end, In small increments at a few points in developments, and Constantly throughout a large part of the process.
Responses for Question 6: When do you perform the following tasks? (Data for the sub-sample consisting only of participants with at least 12 years experience)
Available tasks N Mode % Mode % Never % Start % Middle
% End
Searching 46 Constantly 73.9 6.5 19.6 4.3 0.0Perform testing 52 Constantly 59.6 1.9 0.0 1.9 16.4Requirements 56 Start 55.4 0.0 55.4 0.0 0.0Develop tests 50 Constantly 54.0 0.0 8.0 12.0 14.3Knowledge transfer 55 Constantly 49.1 3.6 0.0 1.8 32.1Coding 49 Constantly 49.0 4.1 2.0 28.6 10.9Modeling 50 Start 46.0 6.0 46.0 4.0 0.0Design 49 Start 44.9 2.0 44.9 8.2 0.0Documentation 55 End 40.0 1.8 10.9 0.0 39.3
60

Question 7: To what extent to you work on the following types of software?
The participant selected one of the following options for each sub-question listed: Never, Sometimes, Moderately often, Very often, and Always.
Responses for Question 7: What types of software do you build? (Data for the sub-sample consisting only of participants with at least 12 years experience)
Available options N mean s.d. % Never (1)
% Sometimes (1 + 2)
% Very often (4 + 5)
% Always (5)
Business 52 2.6 1.5 36.5 53.8 38.5 13.5Design and Engineering 52 2.4 1.2 26.9 61.5 23.1 3.8Website Content Management 51 2.2 1.2 41.2 62.7 21.6 2.0Computational 51 2.1 1.1 33.3 72.5 15.7 2.0Information Display (Search / News) 53 2.1 1.4 50.9 71.7 20.8 7.5Middleware 53 2.0 1.1 45.3 75.5 17.0 0.0Embedded Real-Time 51 2.0 1.3 58.8 70.6 19.6 5.9Operating Systems 52 1.8 1.4 63.5 78.8 17.3 9.6Consumer 53 1.8 1.3 58.5 81.1 15.1 7.5Servers 53 1.8 1.0 50.9 79.2 11.3 0.0System Utilities 52 1.6 1.0 67.3 80.8 7.7 1.9Industrial Control 51 1.5 0.9 66.7 92.2 5.9 2.0Malware 53 1.2 0.5 88.7 96.2 0.0 0.0
Note. Values range from Never (1) to Always (5).
Question 8: To what extent have you worked with the following tools during the last 6 months.
The participant selected one of the following options for each sub-question listed: Never, Sometimes, Moderately often, Very often, and Always.
Responses for Question 8: What development tools do you use? (Data for the sub-sample consisting only of participants with at least 12 years experience)
Available options N mean s.d. % Never (1)
% Sometimes (1 + 2)
% Very often (4 + 5)
% Always (5)
Eclipse 53 3.0 1.4 17.0 39.6 41.5 18.9Visual Studio 52 2.3 1.4 44.2 63.5 30.8 3.8Rational Rose 53 1.7 1.1 67.9 79.2 15.1 0.0Rational RSx 52 1.4 1.0 82.7 86.5 9.6 0.0Rational XDE 52 1.3 0.8 82.7 90.4 5.8 0.0Together J 53 1.2 0.6 83.0 96.2 1.9 0.0
Note. Values range from Never (1) to Always (5).
61

Question 9: To what extent have you worked in the following technologies or platforms during the last 6 months.
The participant selected one of the following options for each sub-question listed: Never, Sometimes, Moderately often, Very often, and Always.
Responses for Question 9: What technologies / platforms do you use? (Data for the sub-sample consisting only of participants with at least 12 years experience)
Available options N mean s.d. % Never (1)
% Sometimes (1 + 2)
% Very often (4 + 5)
% Always (5)
J2SE 51 2.4 1.5 49.0 49.0 29.4 13.7J2EE 52 1.9 1.3 59.6 71.2 17.3 3.8PHP / Perl 50 1.9 1.2 52.0 78.0 16.0 4.0ASP.Net 52 1.7 1.3 71.2 78.8 13.5 7.7Ruby / Python 51 1.6 1.0 62.7 90.2 7.8 3.9C / C++* 25 2.4 1.7 52.0 60.0 32.0 20.0
Note. Values range from Never (1) to Always (5). *Where C/C++ was identified as an “other” technology.
Question 10: To what extent do you perform the following tasks.
The participant selected one of the following options for each sub-question listed: Never, Sometimes, Moderately often, Very often, and Always.
Responses for Question 10: What are your daily tasks? (Data for the sub-sample consisting only of participants with at least 12 years experience)
Available tasks N mean s.d. % Never (1)
% Sometimes (1 + 2)
% Very often (4 + 5)
% Always (5)
Think about s/w system 53 4.2 0.9 0.0 3.8 81.1 47.2Lead software project 53 3.5 1.0 1.9 18.9 58.5 17.0Design a s/w system 53 3.5 0.9 1.9 13.2 58.5 9.4Run / attend meetings 53 3.5 1.0 3.8 17.0 60.4 13.2Explain s/w design to others 53 3.5 0.8 0.0 7.5 45.3 11.3Search about s/w system 51 3.3 1.0 2.0 25.5 45.1 7.8Model a s/w system 53 3.2 1.0 3.8 30.2 45.3 7.5Write new code 53 3.2 1.3 11.3 34.0 49.1 15.1Fix bugs 52 3.0 1.1 7.7 36.5 38.5 9.6Maintain existing code 53 3.0 1.2 11.3 37.7 39.6 7.5Write / maintain requirements 52 2.9 1.1 11.5 42.3 36.5 3.8Perform manual testing 51 2.8 1.1 11.8 37.3 27.5 3.9General administration 52 2.8 1.1 13.5 42.3 26.9 5.8Write / maintain test scripts 53 2.5 1.1 18.9 52.8 18.9 3.8
Note. Values range from Never (1) to Always (5).
62

Question 11: To what extent do you use software tools in the modeling process for the following activities?
The question included an option to ignore this question if the participant does not use software design applications (which explains the lower number of participants answering this question). The participant selected one of the following options for each sub-question listed: Never, Sometimes, Moderately often, Very often, and Always.
Responses for Question 11: What do you use modeling tools for? (Data for the sub-sample consisting only of participants with at least 12 years experience)Activity N mean s.d. % Never
(1)% Sometimes (1 + 2)
% Very often (4 + 5)
% Always (5)
Developing a design 38 3.4 1.0 2.6 21.1 47.4 13.2Transcribing a design into digital format 38 2.8 1.2 15.8 34.2 26.3 7.9Prototyping a design 38 2.6 1.3 23.7 55.3 31.6 7.9Brainstorming possible designs 38 2.5 1.2 21.1 57.9 21.1 7.9Generating code (code editable) 37 2.2 1.2 32.4 67.6 13.5 5.4Generating all code 38 1.7 1.2 68.4 76.3 13.2 5.3
Note. Values range from Never (1) to Always (5).
Question 12: Based on past experience, how good (based on qualities like efficiency, accuracy and usability) are software design or modeling tools at accomplishing the following tasks
The question included an option to ignore this question if the participant does not use software design applications (which explains the lower number of participants answering this question). The participant selected one of the following options for each sub-question listed: Awful, Poor, OK, Good, Excellent.
Responses for Question 12: How good are modeling tools at ...? (Data for the sub-sample consisting only of participants with at least 12 years experience)
Available activities N mean s.d. % Awful (1)
% Poor (1 + 2)
% Good (4 + 5)
% Excellent (5)
Developing a design 41 3.4 1.0 2.4 17.1 46.3 14.6Transcribing a design into digital format 40 3.1 1.0 2.5 27.5 32.5 10.0Prototyping a design 39 2.8 1.1 10.3 43.6 28.2 7.7Brainstorming possible designs 41 2.8 1.2 17.1 43.9 31.7 4.9Generating code (code is editable) 40 2.7 1.1 10.0 45.0 20.0 7.5Generating all code (no manual coding) 40 1.8 1.0 42.5 85.0 7.5 2.5
Note. Values range from Awful (1) to Excellent (5).
Question 13: Please rank the following attributes of a software model from most important (1) to least important (9).
Responses for Question 13: Attributes of a modeling tool? (Data for the sub-sample consisting only of participants with at least 12 years experience)
63

Attribute / Ability to N Rank % Bottom 2
% Bottom 4
% Top 4 % Top 2
Communicate to others 51 1 5.9 9.8 84.3 74.5Readability 51 2 5.9 15.7 74.5 56.9Ease and speed to create 51 3 7.8 33.3 62.7 19.6Ability to analyze 51 4 9.8 37.3 49.0 15.7Collaborate amongst developers 51 5 13.7 41.2 43.1 11.8Ability to view different aspects of a model 51 6 7.8 49.0 31.4 11.8Generate code 51 7 54.9 72.5 23.5 11.8Information density 51 8 51.0 70.6 17.6 0.0Embed parts of model in documentation 51 9 54.9 84.3 9.8 2.0
Note. The % top 4 represents the percentage of participants that listed the attribute in their top four. Similarly for % bottom four. The same applies for % top2, and % bottom 2.
64

Question 14: For each of the following, how do code-centric development approaches compare to model-centric approaches.
This question asks about code-centric vs. model-centric approaches to software development. In a model-centric approach, the developers look to the model to see the design, and change the model as the first step in performing any design change. Extensive modeling is performed, and the coding is either automated, or at least straightforwardly determined from the model. In a code-centric approach, the code is seen as the main artefact; developers understand the design by understanding the code, and the process of design change is equated with changing the code.
The participant selected one of the following options for each sub-question listed: Much easier in a model-centric approach, Somewhat easier in a model-centric approach, About the same, Somewhat easier in a code centric approach, and Much easier in a code centric approach.
Responses for Question 14: Tasks that are better in a model-centric or code centric approach. (Data for the sub-sample consisting only of participants with at least 12 years experience)
Available activities N mean s.d. % Much easier in Models (1)
% Somewhat easier in Models (1 + 2)
% Somewhat easier in Code (4 + 5)
% Much easier in Code (5)
Creating efficient software 52 3.5 1.4 13.5 26.9 59.6 32.7Fixing a bug 50 3.2 1.4 18.0 28.0 40.0 28.0Creating a system as quickly as possible 52 3.0 1.5 17.3 50.0 44.2 26.9Creating a prototype 52 3.0 1.4 22.0 39.3 32.7 23.1Creating a usable system for end users 52 2.8 1.3 21.2 38.5 26.9 13.5
Modifying a system when requirements change
51 2.7 1.5 27.5 52.9 29.4 19.6
Creating a system that most accurately meets requirements
52 2.5 1.4 34.6 59.6 26.9 13.5
Creating a re-usable system 52 2.3 1.4 38.5 57.7 17.3 11.5
Creating a new system overall 52 2.3 1.4 42.3 65.4 26.9 11.5
Comprehending a system's behaviour 49 2.1 1.3 46.9 71.4 16.3 8.2
Explaining a system to others 52 1.8 1.3 60.0 79.2 9.6 9.6
Note. Values range from Much easier in a model-centric approach (1), to much easier in a code-centric approach (5).
65

Question 15: Which of the following are potential difficulties with modeling. These may be reasons why you don’t model much, or things you find hard about modeling.
The participant selected one of the following options for each sub-question listed: Not a problem, a slight problem, a moderate problem, a bad problem, and a terrible problem.
Responses for Question 15: Problems with a model-centric approach. (Data for the sub-sample consisting only of participants with at least 12 years experience)Potential problems N mean s.d. % Not
Problem (1)
% Slight Problem (1 + 2)
% Bad Problem (4 + 5)
% Terrible Problem (5)
Models become out of date and inconsistent with code
52 3.8 1.2 5.8 15.4 67.3 30.8
Models cannot be easily exchanged between tools
51 3.4 1.2 9.8 21.6 56.9 15.7
Modeling tools are 'heavyweight' (install, learn, configure, use)
52 3.4 1.0 0.0 19.2 42.3 13.5
Code generated from a modeling tool not of the kind I would like
52 3.1 1.4 17.3 32.7 44.2 19.2
Not enough detail to be implemented in code
50 2.9 1.3 22.0 38.0 44.0 10.0
Modeling tools change, models become obsolete
52 2.9 1.2 15.4 38.5 36.5 5.8
Modeling tools are too expensive 50 2.8 1.2 18.0 40.0 28.0 6.0
Modeling tools hide details (source code fully visible)
52 2.7 1.0 13.5 44.2 23.1 1.9
Creating and editing a model is slow 52 2.7 1.2 15.4 48.1 19.2 9.6
Modeling tools lack features I need or want 51 2.6 1.1 15.7 47.1 21.6 5.9
Semantics of models different from prog. language
51 2.5 1.2 21.6 56.9 21.6 9.8
Organization culture does not like modeling 52 2.4 1.1 25.0 48.1 15.4 1.9
Modeling tools cannot be analyzed as intended
52 2.4 1.2 28.8 55.8 21.2 5.8
Modeling languages are not expressive enough
52 2.3 1.1 26.9 57.7 17.3 0.0
Modeling language hard to understand 51 2.3 1.1 25.5 64.7 11.8 5.9
Have had bad experiences with modeling 52 2.2 1.3 38.5 67.3 19.2 5.8
Do not trust companies will continue to support their tools
51 1.9 1.0 47.1 70.6 9.8 0.0
Note. Values range from Not a problem (1), to Terrible problem (5).
66

Question 16: Which of the following are potential difficulties with code-centric development (i.e. lacking modeling).
The participant selected one of the following options for each sub-question listed: Not a problem, a slight problem, a moderate problem, a bad problem, and a terrible problem.
Responses for Question 16: Problems with a code-centric approach. (Data for the sub-sample consisting only of participants with at least 12 years experience)
Potential problems N mean s.d. % Not Problem (1)
% Slight Problem (1 + 2)
% Bad Problem (4 + 5)
% Terrible Problem (5)
Hard to see overall design 53 3.8 1.1 5.7 11.3 69.8 32.1Hard to understand behaviour of system 53 3.6 1.1 3.8 18.9 62.3 17.0
Difficult to change code without adding bugs
53 3.3 1.2 9.4 22.6 52.8 13.2
Too difficult to restructure system when needed
52 3.3 1.2 5.8 26.9 48.1 17.3
Code becomes of poorer quality over time 52 3.2 1.3 11.5 32.7 46.2 19.2
Changing code takes too much time 53 2.7 1.2 22.6 43.4 26.4 5.7
Our prog. language leads to complex code 53 2.4 1.2 30.2 54.7 17.0 5.7
More skill than available to develop high quality code
51 2.3 1.2 33.3 58.8 17.6 5.9
Prog. Languages not expressive enough 50 2.0 1.3 54.0 74.0 18.0 6.0Our prog. language likely to become obsolete
52 1.7 1.1 59.6 82.7 7.7 3.8
Organization culture does not like code-centric
52 1.6 1.0 69.2 84.6 9.6 1.9
Note. Values range from Not a problem (1) to Terrible problem (5).
67

Survey results within Canada / USA.The following data is based on those individuals that live within Canada or the United States of America.
Questions with a user defined notion of a modelFor questions 1-5, the participants were asked to use their own interpretation of what a software model is and what consists of software modeling.
Question 1: To what extent do you consider the following to be a model of a software system?
The participant selected one of the following options for each sub-question listed: Strongly Disagree, Disagree, Neutral, Agree, and Strongly Agree.
Responses for Question 1: What is a Model? (Data for the sub-sample consisting only of participants from Canada and the USA)Entity that might be a model N mean s.d. % Str.
Disagree (1)
% Disagree (1 + 2)
% Agree (4 + 5)
% Str. Agree (5)
Class Diagram 62 4.3 0.9 1.6 3.2 82.3 50.0UML Deployment Diagram 62 4.1 0.9 1.6 4.8 75.8 41.9Picture By Drawing Tool 62 4.1 0.8 1.6 6.5 87.1 30.6Use Case Diagram 63 4.0 1.1 3.2 12.7 81.0 39.7Whiteboard Drawing 63 4.0 1.1 6.3 9.5 79.4 33.3Picture By Hand 63 3.9 1.0 3.2 11.1 54.0 25.4Textual Use Case 63 3.9 1.1 3.2 14.3 74.6 30.2Source Code 63 3.3 1.4 15.9 36.5 52.4 25.4Source Code Comment 63 2.7 1.2 15.9 50.8 31.7 7.9
Note. Values range from Strongly Disagree (1), Disagree (2), Neutral (3), Agree (4), to Strongly Agree (5).
68

Question 2: To what extent do you create or modify software models or modeling information in the following ways?
The participant selected one of the following options for each sub-question listed: Never, Sometimes, Moderately often, Very often, and Always.
Responses for Question 2: How do you model? (Data for the sub-sample consisting only of participants from Canada and the USA)
Medium or method used to model N mean s.d. % Never (1)
% Sometimes (1 + 2)
% Very often (4 + 5)
% Always (5)
Whiteboard drawing 63 3.4 1.1 4.8 23.8 55.6 12.7Word processor / text 63 2.9 1.2 9.5 41.3 30.2 11.1Word of mouth 63 2.8 1.2 12.7 44.4 28.6 11.1Diagramming tool (e.g. Visio) 62 2.8 1.3 19.4 48.4 37.1 9.7Handwritten material 63 2.6 1.1 14.3 54.0 22.2 6.3Comments in source code 62 2.4 1.3 30.6 53.2 19.4 8.1Drawing software 63 2.2 1.1 30.2 69.8 15.9 3.2Modeling tool/CASE 63 2.1 1.4 47.6 66.7 19.0 9.5
Note. Values range from Never (1), Sometimes (2), Moderately often (3), Very often(4), to Always (5).
Question 3: To what extent do you refer to the following sources of information when you want to learn about the design of a software system?
The participant selected one of the following options for each sub-question listed: Never, Sometimes, Moderately often, Very often, and Always.
Responses for Question 3: How do you learn about the design of software? (Data for the sub-sample consisting only of participants from Canada and the USA)
Refer to material created by/as N mean s.d. % Never (1)
% Sometimes (1 + 2)
% Very often (4 + 5)
% Always (5)
Word of mouth 63 3.6 1.0 0.0 17.5 55.6 17.5Word processor / text 62 3.3 1.1 4.8 25.8 50.0 12.9Diagramming tool (e.g. Visio) 63 3.2 1.2 11.1 27.0 47.6 11.1Whiteboard drawing 62 3.2 1.1 8.1 29.0 45.2 9.7Comments in source code 63 2.8 1.2 14.3 46.0 25.4 12.7Drawing software 62 2.6 1.0 16.1 56.5 17.7 4.8Handwritten material 61 2.3 1.2 31.1 59.0 18.0 3.3Modeling tool/CASE 63 2.3 1.3 41.3 61.9 22.2 7.9
Note. Values range from Never (1) to Always (5).
69

Question 4: At what point(s) in time do you visually document a design?
The participant selected one of the following options for each sub-question listed: Never, Sometimes, Moderately often, Very often, and Always.
Responses for Question 4: When do you visually document a design? (Data for the sub-sample consisting only of participants from Canada and the USA)
Timeline N mean s.d. % Never (1)
% Sometimes (1 + 2)
% Very often (4 + 5)
% Always (5)
Before coding 63 3.7 1.2 4.8 19.0 30.2 33.3During coding 63 3.0 1.1 6.3 33.3 28.6 9.5After coding 62 2.6 1.1 12.9 45.1 21.0 4.8Only on request 61 1.9 1.1 44.3 36.0 4.9 4.9
Note. Values range from Never (1) to Always (5).
Question 5: To what extent do you use the following notations for the purpose of modeling or design (if you don't know what one of these is, then ignore that particular item) .
The participant selected one of the following options for each sub-question listed: Never, Sometimes, Moderately often, Very often, and Always.
Responses for Question 5: What modeling notation do you use? (Data for the sub-sample consisting only of participants from Canada and the USA)
Language used to model N mean s.d. % Never (1)
% Sometimes (1 + 2)
% Very often (4 + 5)
% Always (5)
UML (any version) 62 3.2 1.5 21.0 37.1 51.6 22.6Structured Design models 58 2.7 1.3 20.7 50.0 25.9 13.8UML 2.* 55 2.6 1.4 30.9 52.7 30.9 14.5SQL 61 2.4 1.4 37.7 55.7 26.2 8.2UML 1.* 53 2.4 1.4 41.5 54.7 24.5 9.4ERD 60 2.3 1.3 38.3 66.7 20.0 10.0Well-defined DSL 57 1.6 0.7 57.9 86.0 0.0 0.0ROOM / RT for UML 58 1.4 0.9 72.4 89.7 5.2 1.7Formal (e.g. Z, OCL) 55 1.3 0.8 78.2 92.7 3.6 1.8SDL 53 1.3 0.7 79.2 90.6 1.9 0.0BPEL 56 1.3 0.6 83.9 92.9 1.8 0.0
Note. Values range from Never (1) to Always (5).
70

Questions with a well-defined notion of a modelFor the remainder of the survey, the participants were asked to assume that any reference to a software model refers to an artefact that represents an abstraction of the software you are building. A model can typically be viewed as a set of diagrams and/or pieces of structured text. It can be recorded on a white board, paper, or using a software tool. A model could use formal syntax and semantics but this is not necessary. We will consider the final source code of the system, and requirements written in natural language to not be models, although models can be embedded in a requirements document.
Question 6: Consider the situation in which you, as a software developer, have just been assigned a new feature to develop. In general, when working on this feature, at what point(s) in time do you perform the following tasks.
The participant selected one of the following options for each sub-question listed: Never, Primarily near the start of development, Primarily near the middle of development , Primarily near the end, In small increments at a few points in developments, and Constantly throughout a large part of the process.
Responses for Question 6: When do you perform the following tasks? (Data for the sub-sample consisting only of participants from Canada and the USA)
Available tasks N Mode % Mode % Never % Start % Middle
% End
Requirements 62 Start 64.5 0.0 64.5 0.0 0.0Searching 53 Constantly 60.4 7.5 20.8 5.7 3.2Design 53 Start 56.6 1.9 56.6 7.5 0.0Develop tests 56 Constantly 51.8 1.8 12.5 8.9 12.7Modeling 58 Start 51.7 6.9 51.7 5.2 0.0Perform testing 58 Constantly 48.3 3.4 1.7 6.9 16.1Coding 55 Constantly 45.5 5.5 5.5 34.5 9.7Documentation 60 End 41.7 5.0 11.7 0.0 39.7Knowledge transfer 61 Constantly 41.0 1.6 1.6 3.3 38.1
71

Question 7: To what extent to you work on the following types of software?
The participant selected one of the following options for each sub-question listed: Never, Sometimes, Moderately often, Very often, and Always.
Responses for Question 7: What types of software do you build? (Data for the sub-sample consisting only of participants from Canada and the USA)
Available options N mean s.d. % Never (1)
% Sometimes (1 + 2)
% Very often (4 + 5)
% Always (5)
Business 61 2.6 1.6 39.3 52.5 37.7 16.4Design and Engineering 61 2.5 1.3 26.2 60.7 26.2 8.2Information Display (Search / News) 62 2.3 1.5 45.2 64.5 27.4 11.3Website Content Management 60 2.2 1.3 40.0 61.7 21.7 3.3Computational 60 2.2 1.2 35.0 68.3 16.7 5.0Middleware 62 2.1 1.2 41.9 69.4 21.0 1.6Consumer 61 2.1 1.4 50.8 72.1 23.0 9.8Embedded Real-Time 61 2.1 1.3 50.8 67.2 19.7 6.6Operating Systems 61 2.0 1.4 60.7 75.4 21.3 9.8Servers 62 1.7 1.0 58.1 80.6 8.1 1.6System Utilities 61 1.6 1.0 63.9 82.0 6.6 1.6Industrial Control 61 1.6 1.1 68.9 88.5 9.8 4.9Malware 62 1.3 0.7 85.5 91.9 3.2 0.0
Note. Values range from Never (1) to Always (5).
Question 8: To what extent have you worked with the following tools during the last 6 months.
The participant selected one of the following options for each sub-question listed: Never, Sometimes, Moderately often, Very often, and Always.
Responses for Question 8: What development tools do you use? (Data for the sub-sample consisting only of participants from Canada and the USA)
Available options N mean s.d. % Never (1)
% Sometimes (1 + 2)
% Very often (4 + 5)
% Always (5)
Eclipse 63 3.1 1.5 23.8 39.7 46.0 23.8Visual Studio 63 2.5 1.4 36.5 55.6 34.9 4.8Rational Rose 62 1.8 1.2 62.9 77.4 16.1 3.2Rational XDE 62 1.4 0.9 79.0 88.7 6.5 1.6Rational RSx 62 1.4 0.9 85.5 88.7 8.1 1.6Together J 63 1.2 0.5 85.7 96.8 1.6 0.0
Note. Values range from Never (1) to Always (5).
72

Question 9: To what extent have you worked in the following technologies or platforms during the last 6 months.
The participant selected one of the following options for each sub-question listed: Never, Sometimes, Moderately often, Very often, and Always.
Responses for Question 9: What technologies / platforms do you use? (Data for the sub-sample consisting only of participants from Canada and the USA)
Available options N mean s.d. % Never (1)
% Sometimes (1 + 2)
% Very often (4 + 5)
% Always (5)
J2SE 62 2.5 1.6 45.2 45.2 35.5 14.5J2EE 62 2.2 1.5 58.1 61.3 29.0 9.7PHP / Perl 60 1.9 1.2 51.7 78.3 16.7 5.0ASP.Net 62 1.8 1.3 66.1 77.4 16.1 8.1Ruby / Python 61 1.7 1.1 60.7 85.2 9.8 3.3C / C++* 26 2.3 1.6 53.8 61.5 26.9 19.2
Note. Values range from Never (1) to Always (5). *Where C/C++ was identified as an “other” technology.
Question 10: To what extent do you perform the following tasks.
The participant selected one of the following options for each sub-question listed: Never, Sometimes, Moderately often, Very often, and Always.
Responses for Question 10: What are your daily tasks? (Data for the sub-sample consisting only of participants from Canada and the USA)
Available tasks N mean s.d. % Never (1)
% Sometimes (1 + 2)
% Very often (4 + 5)
% Always (5)
Think about s/w system 63 4.3 0.9 0.0 6.3 81.0 50.8Run / attend meetings 63 3.6 1.0 1.6 17.5 58.7 20.6Explain s/w design to others 62 3.6 0.9 0.0 12.9 56.5 16.1Design a s/w system 63 3.5 1.1 6.3 17.5 60.3 14.3Lead software project 63 3.3 1.3 11.1 30.2 52.4 15.9Search about s/w system 61 3.2 1.1 4.9 31.1 42.6 14.8Write new code 63 3.2 1.3 12.7 34.9 50.8 15.9Model a s/w system 63 3.1 1.2 11.1 33.3 39.7 11.1Fix bugs 63 3.0 1.2 12.7 38.1 38.1 12.7Maintain existing code 63 3.0 1.2 15.9 36.5 39.7 9.5Perform manual testing 61 3.0 1.1 11.5 32.8 34.4 6.6General administration 61 2.9 1.2 14.8 39.3 32.8 8.2Write / maintain requirements 62 2.9 1.1 14.5 40.3 37.1 3.2Write / maintain test scripts 63 2.6 1.2 19.0 54.0 23.8 7.9
Note. Values range from Never (1) to Always (5).
73

Question 11: To what extent do you use software tools in the modeling process for the following activities?
The question included an option to ignore this question if the participant does not use software design applications (which explains the lower number of participants answering this question). The participant selected one of the following options for each sub-question listed: Never, Sometimes, Moderately often, Very often, and Always.
Responses for Question 11: What do you use modeling tools for? (Data for the sub-sample consisting only of participants from Canada and the USA)Activity N mean s.d. % Never
(1)% Sometimes (1 + 2)
% Very often (4 + 5)
% Always (5)
Developing a design 42 3.2 1.2 7.1 31.0 42.9 16.7Transcribing a design into digital format 42 3.0 1.4 19.0 35.7 40.5 16.7Brainstorming possible designs 42 2.7 1.3 19.0 50.0 23.8 14.3Prototyping a design 42 2.7 1.4 23.8 57.1 31.0 16.7Generating code (code editable) 41 2.0 1.2 43.9 73.2 14.6 7.3Generating all code 42 1.6 1.3 78.6 83.3 14.3 7.1
Note. Values range from Never (1) to Always (5).
Question 12: Based on past experience, how good (based on qualities like efficiency, accuracy and usability) are software design or modeling tools at accomplishing the following tasks
The question included an option to ignore this question if the participant does not use software design applications (which explains the lower number of participants answering this question). The participant selected one of the following options for each sub-question listed: Awful, Poor, OK, Good, Excellent.
Responses for Question 12: How good are modeling tools at ...? (Data for the sub-sample consisting only of participants from Canada and the USA)
Available activities N mean s.d. % Awful (1)
% Poor (1 + 2)
% Good (4 + 5)
% Excellent (5)
Developing a design 44 3.3 0.9 2.3 18.2 40.9 9.1Transcribing a design into digital format 44 3.1 0.9 2.3 25.0 36.4 4.5Brainstorming possible designs 44 2.8 1.0 9.1 43.2 29.5 2.3Prototyping a design 42 2.8 1.2 14.3 42.9 23.8 9.5Generating code (code is editable) 43 2.7 1.0 14.0 41.9 20.9 2.3Generating all code (no manual coding) 43 1.6 0.7 48.8 90.7 2.3 0.0
Note. Values range from Awful (1) to Excellent (5).
Question 13: Please rank the following attributes of a software model from most important (1) to least important (9).
Responses for Question 13: Attributes of a modeling tool? (Data for the sub-sample consisting only of participants from Canada and the USA)
74

Attribute / Ability to N Rank % Bottom 2
% Bottom 4
% Top 4 % Top 2
Communicate to others 61 1 8.2 13.1 85.2 75.4Readability 61 2 6.6 16.4 70.5 49.2Ease and speed to create 61 3 4.9 32.8 57.4 19.7Ability to analyze 61 4 6.6 32.8 55.7 19.7Collaborate amongst developers 61 5 13.1 39.3 42.6 18.0Ability to view different aspects of a model 61 6 8.2 42.6 39.3 9.8Generate code 61 7 57.4 73.8 21.3 13.1Embed parts of model in documentation 61 8 49.2 78.7 16.4 4.9Information density 61 9 54.1 75.4 14.8 1.6
Note. The % top 4 represents the percentage of participants that listed the attribute in their top four. Similarly for % bottom four. The same applies for % top2, and % bottom 2.
75

Question 14: For each of the following, how do code-centric development approaches compare to model-centric approaches.
This question asks about code-centric vs. model-centric approaches to software development. In a model-centric approach, the developers look to the model to see the design, and change the model as the first step in performing any design change. Extensive modeling is performed, and the coding is either automated, or at least straightforwardly determined from the model. In a code-centric approach, the code is seen as the main artefact; developers understand the design by understanding the code, and the process of design change is equated with changing the code.
The participant selected one of the following options for each sub-question listed: Much easier in a model-centric approach, Somewhat easier in a model-centric approach, About the same, Somewhat easier in a code centric approach, and Much easier in a code centric approach.
Responses for Question 14: Tasks that are better in a model-centric or code centric approach. (Data for the sub-sample consisting only of participants from Canada and the USA)
Available activities N mean s.d. % Much easier in Models (1)
% Somewhat easier in Models (1 + 2)
% Somewhat easier in Code (4 + 5)
% Much easier in Code (5)
Fixing a bug 62 3.4 1.4 16.1 21.0 48.4 29.0Creating efficient software 63 3.3 1.4 11.1 33.3 49.2 25.4Creating a system as quickly as possible 63 3.0 1.5 19.0 44.4 42.9 25.4Creating a prototype 63 3.0 1.5 22.6 38.5 36.5 25.4Creating a usable system for end users 63 2.8 1.4 25.4 39.7 28.6 14.3
Modifying a system when requirements change
63 2.6 1.4 25.4 54.0 25.4 15.9
Creating a re-usable system 63 2.4 1.4 38.1 57.1 19.0 12.7
Creating a new system overall 63 2.3 1.4 34.9 65.1 22.2 11.1
Creating a system that most accurately meets requirements
62 2.3 1.4 40.3 62.9 22.6 9.7
Comprehending a system's behaviour 61 2.1 1.4 49.2 67.2 19.7 8.2
Explaining a system to others 63 1.9 1.2 58.1 75.5 9.5 7.9
Note. Values range from Much easier in a model-centric approach (1), to much easier in a code-centric approach (5).
76

Question 15: Which of the following are potential difficulties with modeling. These may be reasons why you don’t model much, or things you find hard about modeling.
The participant selected one of the following options for each sub-question listed: Not a problem, a slight problem, a moderate problem, a bad problem, and a terrible problem.
Responses for Question 15: Problems with a model-centric approach. (Data for the sub-sample consisting only of participants from Canada and the USA)Potential problems N mean s.d. % Not
Problem (1)
% Slight Problem (1 + 2)
% Bad Problem (4 + 5)
% Terrible Problem (5)
Models become out of date and inconsistent with code
62 3.9 1.1 3.2 12.9 69.4 35.5
Models cannot be easily exchanged between tools
62 3.2 1.2 12.9 27.4 48.4 14.5
Modeling tools are 'heavyweight' (install, learn, configure, use)
62 3.0 1.2 11.3 32.3 37.1 11.3
Code generated from a modeling tool not of the kind I would like
61 3.0 1.3 16.4 37.7 39.3 16.4
Not enough detail to be implemented in code
60 2.9 1.3 21.7 40.0 40.0 10.0
Creating and editing a model is slow 62 2.8 1.2 14.5 45.2 24.2 11.3
Modeling tools change, models become obsolete
62 2.6 1.3 25.8 45.2 30.6 4.8
Modeling tools lack features I need or want 61 2.6 1.1 18.0 45.9 19.7 4.9
Semantics of models different from prog. language
60 2.6 1.3 25.0 53.3 26.7 11.7
Modeling tools hide details (source code fully visible)
62 2.5 1.1 19.4 46.8 19.4 1.6
Modeling tools are too expensive 60 2.5 1.2 28.3 48.3 23.3 5.0
Modeling tools cannot be analyzed as intended
61 2.5 1.3 31.1 52.5 27.9 6.6
Organization culture does not like modeling 62 2.5 1.2 29.0 48.4 22.6 1.6
Modeling languages are not expressive enough
61 2.4 1.1 24.6 52.5 18.0 1.6
Modeling language hard to understand 61 2.2 1.0 31.1 62.3 9.8 0.0
Have had bad experiences with modeling 62 2.1 1.3 41.9 71.0 17.7 9.7
Do not trust companies will continue to support their tools
59 1.9 1.0 49.2 69.5 8.5 0.0
Note. Values range from Not a problem (1), to Terrible problem (5).
77

Question 16: Which of the following are potential difficulties with code-centric development (i.e. lacking modeling).
The participant selected one of the following options for each sub-question listed: Not a problem, a slight problem, a moderate problem, a bad problem, and a terrible problem.
Responses for Question 16: Problems with a code-centric approach. (Data for the sub-sample consisting only of participants from Canada and the USA)
Potential problems N mean s.d. % Not Problem (1)
% Slight Problem (1 + 2)
% Bad Problem (4 + 5)
% Terrible Problem (5)
Hard to see overall design 62 3.7 1.1 3.2 14.5 59.7 30.6Hard to understand behaviour of system 62 3.4 1.1 4.8 21.0 53.2 16.1
Too difficult to restructure system when needed
61 3.2 1.1 8.2 26.2 45.9 8.2
Difficult to change code without adding bugs
61 3.2 1.2 11.5 26.2 47.5 9.8
Code becomes of poorer quality over time 61 3.2 1.3 9.8 32.8 44.3 18.0
Changing code takes too much time 62 2.5 1.0 21.0 43.5 16.1 1.6
Our prog. language leads to complex code 62 2.4 1.2 25.8 54.8 17.7 6.5
More skill than available to develop high quality code
59 2.1 1.1 33.9 66.1 11.9 1.7
Prog. Languages not expressive enough 59 1.9 1.2 50.8 74.6 13.6 3.4Organization culture does not like code-centric
62 1.7 1.1 66.1 80.6 11.3 1.6
Our prog. language likely to become obsolete
61 1.6 1.0 60.7 83.6 6.6 1.6
Note. Values range from Not a problem (1) to Terrible problem (5).
78

Survey results for outside Canada / USA.The following data is based on those individuals that live outside Canada and the United States of America.
Questions with a user defined notion of a modelFor questions 1-5, the participants were asked to use their own interpretation of what a software model is and what consists of software modeling.
Question 1: To what extent do you consider the following to be a model of a software system?
The participant selected one of the following options for each sub-question listed: Strongly Disagree, Disagree, Neutral, Agree, and Strongly Agree.
Responses for Question 1: What is a Model? (Data for the sub-sample consisting only of participants from countries other than Canada and the USA)Entity that might be a model N mean s.d. % Str.
Disagree (1)
% Disagree (1 + 2)
% Agree (4 + 5)
% Str. Agree (5)
Class Diagram 27 4.4 0.7 0.0 3.7 92.6 48.1Use Case Diagram 27 4.0 0.9 0.0 7.4 77.8 25.9Textual Use Case 27 3.9 1.0 3.7 7.4 77.8 25.9UML Deployment Diagram 27 3.8 1.0 3.7 11.1 70.4 25.9Picture By Hand 27 3.8 1.0 3.7 11.1 55.6 18.5Whiteboard Drawing 27 3.8 1.1 3.7 14.8 74.1 22.2Picture By Drawing Tool 27 3.7 1.0 3.7 14.8 77.8 14.8Source Code 27 3.2 1.4 7.4 40.7 40.7 25.9Source Code Comment 27 3.1 1.2 7.4 33.3 40.7 11.1
Note. Values range from Strongly Disagree (1), Disagree (2), Neutral (3), Agree (4), to Strongly Agree (5).
79

Question 2: To what extent do you create or modify software models or modeling information in the following ways?
The participant selected one of the following options for each sub-question listed: Never, Sometimes, Moderately often, Very often, and Always.
Responses for Question 2: How do you model? (Data for the sub-sample consisting only of participants from countries other than Canada and the USA)
Medium or method used to model N mean s.d. % Never (1)
% Sometimes (1 + 2)
% Very often (4 + 5)
% Always (5)
Diagramming tool (e.g. Visio) 27 3.2 1.1 3.7 29.6 48.1 7.4Modeling tool/CASE 27 3.1 1.5 22.2 40.7 55.6 14.8Word processor / text 27 2.9 1.0 3.7 40.7 25.9 7.4Whiteboard drawing 26 2.7 1.0 7.7 50.0 23.1 3.8Word of mouth 26 2.7 0.9 11.5 42.3 19.2 0.0Handwritten material 26 2.7 1.0 11.5 50.0 26.9 0.0Comments in source code 27 2.4 1.2 25.9 55.6 22.2 3.7Drawing software 26 2.2 1.1 34.6 65.4 11.5 3.8
Note. Values range from Never (1), Sometimes (2), Moderately often (3), Very often(4), to Always (5).
Question 3: To what extent do you refer to the following sources of information when you want to learn about the design of a software system?
The participant selected one of the following options for each sub-question listed: Never, Sometimes, Moderately often, Very often, and Always.
Responses for Question 3: How do you learn about the design of software? (Data for the sub-sample consisting only of participants from countries other than Canada and the USA)
Refer to material created by/as N mean s.d. % Never (1)
% Sometimes (1 + 2)
% Very often (4 + 5)
% Always (5)
Word processor / text 27 3.4 1.0 0.0 25.9 59.3 7.4Diagramming tool (e.g. Visio) 27 3.2 0.9 0.0 25.9 44.4 3.7Word of mouth 27 3.2 1.2 7.4 33.3 48.1 14.8Modeling tool/CASE 27 3.1 1.4 18.5 33.3 55.6 11.1Comments in source code 27 3.0 1.3 11.1 40.7 33.3 14.8Whiteboard drawing 27 2.9 1.1 14.8 37.0 40.7 0.0Drawing software 26 2.8 1.2 15.4 46.2 11.5 3.8Handwritten material 27 2.7 1.1 14.8 48.1 25.9 3.7
Note. Values range from Never (1) to Always (5).
80

Question 4: At what point(s) in time do you visually document a design?
The participant selected one of the following options for each sub-question listed: Never, Sometimes, Moderately often, Very often, and Always.
Responses for Question 4: When do you visually document a design? (Data for the sub-sample consisting only of participants from countries other than Canada and the USA)
Timeline N mean s.d. % Never (1)
% Sometimes (1 + 2)
% Very often (4 + 5)
% Always (5)
Before coding 27 3.8 1.0 0.0 11.1 22.2 33.3During coding 26 3.3 1.0 3.8 19.1 38.5 7.7After coding 27 2.5 1.0 11.1 51.9 14.8 3.7Only on request 26 2.0 1.1 42.3 42.2 11.5 3.8
Note. Values range from Never (1) to Always (5).
Question 5: To what extent do you use the following notations for the purpose of modeling or design (if you don't know what one of these is, then ignore that particular item) .
The participant selected one of the following options for each sub-question listed: Never, Sometimes, Moderately often, Very often, and Always.
Responses for Question 5: What modeling notation do you use? (Data for the sub-sample consisting only of participants from countries other than Canada and the USA)
Language used to model N mean s.d. % Never (1)
% Sometimes (1 + 2)
% Very often (4 + 5)
% Always (5)
UML (any version) 27 3.7 1.0 3.7 11.1 59.3 22.2SQL 26 2.9 1.4 19.2 46.2 42.3 11.5UML 2.* 22 2.8 1.4 27.3 45.5 40.9 9.1UML 1.* 22 2.7 1.2 22.7 45.5 31.8 4.5ERD 26 2.5 1.1 19.2 53.8 19.2 3.8Structured Design models 24 2.4 1.1 16.7 66.7 20.8 4.2Well-defined DSL 26 2.0 1.2 50.0 69.2 15.4 3.8ROOM / RT for UML 21 1.5 0.8 66.7 90.5 4.8 0.0SDL 21 1.5 1.0 81.0 81.0 9.5 0.0BPEL 22 1.4 0.9 77.3 90.9 9.1 0.0Formal (e.g. Z, OCL) 24 1.2 0.4 83.3 100.0 0.0 0.0
Note. Values range from Never (1) to Always (5).
81

Questions with a well-defined notion of a modelFor the remainder of the survey, the participants were asked to assume that any reference to a software model refers to an artefact that represents an abstraction of the software you are building. A model can typically be viewed as a set of diagrams and/or pieces of structured text. It can be recorded on a white board, paper, or using a software tool. A model could use formal syntax and semantics but this is not necessary. We will consider the final source code of the system, and requirements written in natural language to not be models, although models can be embedded in a requirements document.
Question 6: Consider the situation in which you, as a software developer, have just been assigned a new feature to develop. In general, when working on this feature, at what point(s) in time do you perform the following tasks.
The participant selected one of the following options for each sub-question listed: Never, Primarily near the start of development, Primarily near the middle of development , Primarily near the end, In small increments at a few points in developments, and Constantly throughout a large part of the process.
Responses for Question 6: When do you perform the following tasks? (Data for the sub-sample consisting only of participants from countries other than Canada and the USA)
Available tasks N Mode % Mode % Never % Start % Middle
% End
Searching 21 Constantly 85.7 4.8 14.3 9.5 3.7Requirements 27 Start 66.7 3.7 66.7 0.0 0.0Modeling 21 Start 57.1 0.0 57.1 9.5 3.8Design 22 Start 54.5 0.0 54.5 22.7 0.0Perform testing 24 Constantly 54.2 4.2 0.0 16.7 11.1Knowledge transfer 26 Constantly 53.8 3.8 0.0 3.8 22.2Coding 22 Constantly 40.9 4.5 0.0 36.4 18.5Develop tests 22 Constantly 36.4 9.1 13.6 22.7 11.1Documentation 26 Constantly 30.8 3.8 11.5 11.5 25.9
82

Question 7: To what extent to you work on the following types of software?
The participant selected one of the following options for each sub-question listed: Never, Sometimes, Moderately often, Very often, and Always.
Responses for Question 7: What types of software do you build? (Data for the sub-sample consisting only of participants from countries other than Canada and the USA)
Available options N mean s.d. % Never (1)
% Sometimes (1 + 2)
% Very often (4 + 5)
% Always (5)
Business 27 3.5 1.3 14.8 22.2 66.7 18.5Website Content Management 27 2.6 1.4 29.6 55.6 33.3 7.4Design and Engineering 27 2.3 1.2 37.0 59.3 18.5 3.7Consumer 27 2.3 1.4 48.1 55.6 18.5 11.1Middleware 27 2.2 1.4 44.4 66.7 25.9 7.4Servers 27 2.2 1.4 44.4 66.7 22.2 11.1Information Display (Search / News) 27 2.1 1.5 59.3 66.7 25.9 7.4Operating Systems 27 1.9 1.6 70.4 74.1 22.2 14.8Computational 27 1.6 0.8 55.6 88.9 3.7 0.0System Utilities 26 1.5 0.9 69.2 88.5 7.7 0.0Industrial Control 26 1.3 0.7 80.8 96.2 3.8 0.0Embedded Real-Time 26 1.3 0.8 84.6 96.2 3.8 3.8Malware 27 1.1 0.4 92.6 96.3 0.0 0.0
Note. Values range from Never (1) to Always (5).
Question 8: To what extent have you worked with the following tools during the last 6 months.
The participant selected one of the following options for each sub-question listed: Never, Sometimes, Moderately often, Very often, and Always.
Responses for Question 8: What development tools do you use? (Data for the sub-sample consisting only of participants from countries other than Canada and the USA)
Available options N mean s.d. % Never (1)
% Sometimes (1 + 2)
% Very often (4 + 5)
% Always (5)
Eclipse 26 2.8 1.4 19.2 50.0 30.8 19.2Visual Studio 25 2.4 1.4 40.0 56.0 28.0 8.0Rational Rose 26 1.9 1.5 69.2 73.1 23.1 7.7Rational RSx 26 1.5 1.1 80.8 84.6 7.7 3.8Rational XDE 26 1.3 0.8 84.6 88.5 3.8 0.0Together J 26 1.2 0.5 84.6 96.2 0.0 0.0
Note. Values range from Never (1) to Always (5).
83

Question 9: To what extent have you worked in the following technologies or platforms during the last 6 months.
The participant selected one of the following options for each sub-question listed: Never, Sometimes, Moderately often, Very often, and Always.
Responses for Question 9: What technologies / platforms do you use? (Data for the sub-sample consisting only of participants from countries other than Canada and the USA)
Available options N mean s.d. % Never (1)
% Sometimes (1 + 2)
% Very often (4 + 5)
% Always (5)
J2EE 26 2.3 1.5 42.3 61.5 23.1 15.4J2SE 25 2.3 1.5 48.0 48.0 24.0 16.0PHP / Perl 25 2.2 1.3 44.0 64.0 24.0 4.0ASP.Net 27 1.8 1.3 59.3 81.5 11.1 11.1Ruby / Python 25 1.4 0.9 72.0 92.0 8.0 0.0C / C++* 17 2.5 1.7 47.1 52.9 35.3 17.6
Note. Values range from Never (1) to Always (5). *Where C/C++ was identified as an “other” technology.
Question 10: To what extent do you perform the following tasks.
The participant selected one of the following options for each sub-question listed: Never, Sometimes, Moderately often, Very often, and Always.
Responses for Question 10: What are your daily tasks? (Data for the sub-sample consisting only of participants from countries other than Canada and the USA)
Available tasks N mean s.d. % Never (1)
% Sometimes (1 + 2)
% Very often (4 + 5)
% Always (5)
Think about s/w system 27 3.8 1.0 3.7 11.1 70.4 25.9Model a s/w system 27 3.5 0.9 0.0 18.5 59.3 11.1Design a s/w system 27 3.5 0.9 0.0 14.8 51.9 11.1Lead software project 27 3.4 1.2 3.7 29.6 51.9 18.5Search about s/w system 26 3.3 1.1 3.8 26.9 53.8 11.5Explain s/w design to others 27 3.3 0.9 0.0 18.5 40.7 11.1Run / attend meetings 27 3.3 1.1 3.7 29.6 59.3 7.4Write / maintain requirements 27 3.2 1.0 0.0 37.0 48.1 7.4Maintain existing code 27 3.1 1.3 14.8 33.3 44.4 11.1Write new code 27 3.0 1.3 14.8 37.0 48.1 7.4Perform manual testing 27 3.0 1.1 11.1 33.3 33.3 7.4Fix bugs 25 3.0 1.2 16.0 36.0 44.0 4.0General administration 27 2.9 1.1 7.4 37.0 25.9 7.4Write / maintain test scripts 27 2.3 0.9 22.2 59.3 7.4 0.0
Note. Values range from Never (1) to Always (5).
84

Question 11: To what extent do you use software tools in the modeling process for the following activities?
The question included an option to ignore this question if the participant does not use software design applications (which explains the lower number of participants answering this question). The participant selected one of the following options for each sub-question listed: Never, Sometimes, Moderately often, Very often, and Always.
Responses for Question 11: What do you use modeling tools for? (Data for the sub-sample consisting only of participants from countries other than Canada and the USA)Activity N mean s.d. % Never
(1)% Sometimes (1 + 2)
% Very often (4 + 5)
% Always (5)
Developing a design 20 3.5 1.1 5.0 20.0 55.0 20.0Transcribing a design into digital format 20 3.1 1.1 5.0 30.0 30.0 10.0Prototyping a design 20 2.8 1.2 15.0 45.0 35.0 5.0Generating code (code editable) 20 2.5 1.2 25.0 50.0 20.0 5.0Brainstorming possible designs 20 2.4 1.1 20.0 65.0 20.0 5.0Generating all code 20 2.1 1.1 40.0 65.0 15.0 0.0
Note. Values range from Never (1) to Always (5).
Question 12: Based on past experience, how good (based on qualities like efficiency, accuracy and usability) are software design or modeling tools at accomplishing the following tasks
The question included an option to ignore this question if the participant does not use software design applications (which explains the lower number of participants answering this question). The participant selected one of the following options for each sub-question listed: Awful, Poor, OK, Good, Excellent.
Responses for Question 12: How good are modeling tools at ...? (Data for the sub-sample consisting only of participants from countries other than Canada and the USA)
Available activities N mean s.d. % Awful (1)
% Poor (1 + 2)
% Good (4 + 5)
% Excellent (5)
Developing a design 20 3.6 1.0 0.0 15.0 55.0 20.0Transcribing a design into digital format 20 3.5 1.1 5.0 20.0 55.0 15.0Generating code (code is editable) 20 3.3 1.3 5.0 35.0 40.0 25.0Prototyping a design 20 3.0 1.1 0.0 45.0 30.0 10.0Brainstorming possible designs 20 2.6 1.4 30.0 55.0 30.0 10.0Generating all code (no manual coding) 20 2.5 1.4 30.0 65.0 25.0 15.0
Note. Values range from Awful (1) to Excellent (5).
Question 13: Please rank the following attributes of a software model from most important (1) to least important (9).
Responses for Question 13: Attributes of a modeling tool? (Data for the sub-sample consisting only of participants from countries other than Canada and the USA)
85

Attribute / Ability to N Rank % Bottom 2
% Bottom 4
% Top 4 % Top 2
Communicate to others 25 1 16.0 28.0 60.0 48.0Readability 25 2 20.0 32.0 60.0 52.0Ease and speed to create 25 4 16.0 44.0 48.0 20.0Ability to analyze 25 4 20.0 40.0 48.0 24.0Ability to view different aspects of a model 25 6 16.0 48.0 40.0 20.0Collaborate amongst developers 25 6 12.0 32.0 48.0 8.0Generate code 25 7 40.0 64.0 28.0 8.0Information density 24 8 50.0 70.8 20.8 8.3Embed parts of model in documentation 25 9 68.0 92.0 4.0 0.0
Note. The % top 4 represents the percentage of participants that listed the attribute in their top four. Similarly for % bottom four. The same applies for % top2, and % bottom 2.
86

Question 14: For each of the following, how do code-centric development approaches compare to model-centric approaches.
This question asks about code-centric vs. model-centric approaches to software development. In a model-centric approach, the developers look to the model to see the design, and change the model as the first step in performing any design change. Extensive modeling is performed, and the coding is either automated, or at least straightforwardly determined from the model. In a code-centric approach, the code is seen as the main artefact; developers understand the design by understanding the code, and the process of design change is equated with changing the code.
The participant selected one of the following options for each sub-question listed: Much easier in a model-centric approach, Somewhat easier in a model-centric approach, About the same, Somewhat easier in a code centric approach, and Much easier in a code centric approach.
Responses for Question 14: Tasks that are better in a model-centric or code centric approach. (Data for the sub-sample consisting only of participants from countries other than Canada and the USA)
Available activities N mean s.d. % Much easier in Models (1)
% Somewhat easier in Models (1 + 2)
% Somewhat easier in Code (4 + 5)
% Much easier in Code (5)
Creating efficient software 26 2.8 1.4 23.1 38.5 30.8 15.4Creating a system as quickly as possible 26 2.8 1.6 30.8 50.0 42.3 23.1Fixing a bug 25 2.8 1.5 28.0 44.0 32.0 20.0Creating a prototype 26 2.6 1.5 36.0 51.4 26.9 19.2Creating a usable system for end users 26 2.4 1.1 26.9 50.0 11.5 3.8
Modifying a system when requirements change
25 2.2 1.5 52.0 56.0 24.0 8.0
Creating a system that most accurately meets requirements
26 2.0 1.3 50.0 73.1 15.4 7.7
Creating a re-usable system 26 1.8 1.1 57.7 76.9 7.7 3.8
Comprehending a system's behaviour 25 1.8 1.0 52.0 80.0 8.0 0.0
Creating a new system overall 26 1.7 1.2 65.4 76.9 15.4 0.0
Explaining a system to others 26 1.5 0.9 72.0 95.1 3.8 3.8
Note. Values range from Much easier in a model-centric approach (1), to much easier in a code-centric approach (5).
87

Question 15: Which of the following are potential difficulties with modeling. These may be reasons why you don’t model much, or things you find hard about modeling.
The participant selected one of the following options for each sub-question listed: Not a problem, a slight problem, a moderate problem, a bad problem, and a terrible problem.
Responses for Question 15: Problems with a model-centric approach. (Data for the sub-sample consisting only of participants from countries other than Canada and the USA)Potential problems N mean s.d. % Not
Problem (1)
% Slight Problem (1 + 2)
% Bad Problem (4 + 5)
% Terrible Problem (5)
Models become out of date and inconsistent with code
26 3.7 1.5 15.4 23.1 69.2 38.5
Models cannot be easily exchanged between tools
25 3.4 1.4 20.0 24.0 60.0 24.0
Modeling tools are 'heavyweight' (install, learn, configure, use)
26 3.2 1.1 7.7 26.9 46.2 11.5
Modeling tools change, models become obsolete
26 3.0 1.2 11.5 38.5 42.3 7.7
Code generated from a modeling tool not of the kind I would like
26 2.9 1.5 23.1 42.3 38.5 19.2
Modeling tools lack features I need or want 24 2.8 1.2 16.7 41.7 29.2 8.3
Modeling tools hide details (source code fully visible)
26 2.8 1.1 19.2 38.5 34.6 0.0
Modeling tools are too expensive 26 2.7 1.3 23.1 46.2 34.6 7.7
Creating and editing a model is slow 26 2.7 1.3 23.1 42.3 19.2 11.5
Not enough detail to be implemented in code
25 2.5 1.3 28.0 52.0 28.0 4.0
Modeling tools cannot be analyzed as intended
26 2.5 1.2 23.1 50.0 15.4 7.7
Organization culture does not like modeling 26 2.3 1.4 42.3 53.8 23.1 7.7
Modeling languages are not expressive enough
26 2.3 1.2 34.6 57.7 19.2 3.8
Have had bad experiences with modeling 25 2.3 1.1 36.0 52.0 16.0 0.0
Modeling language hard to understand 26 2.3 1.2 26.9 69.2 11.5 11.5
Do not trust companies will continue to support their tools
26 2.2 1.1 34.6 61.5 15.4 0.0
Semantics of models different from prog. language
26 2.0 1.1 46.2 65.4 11.5 0.0
Note. Values range from Not a problem (1), to Terrible problem (5).
88
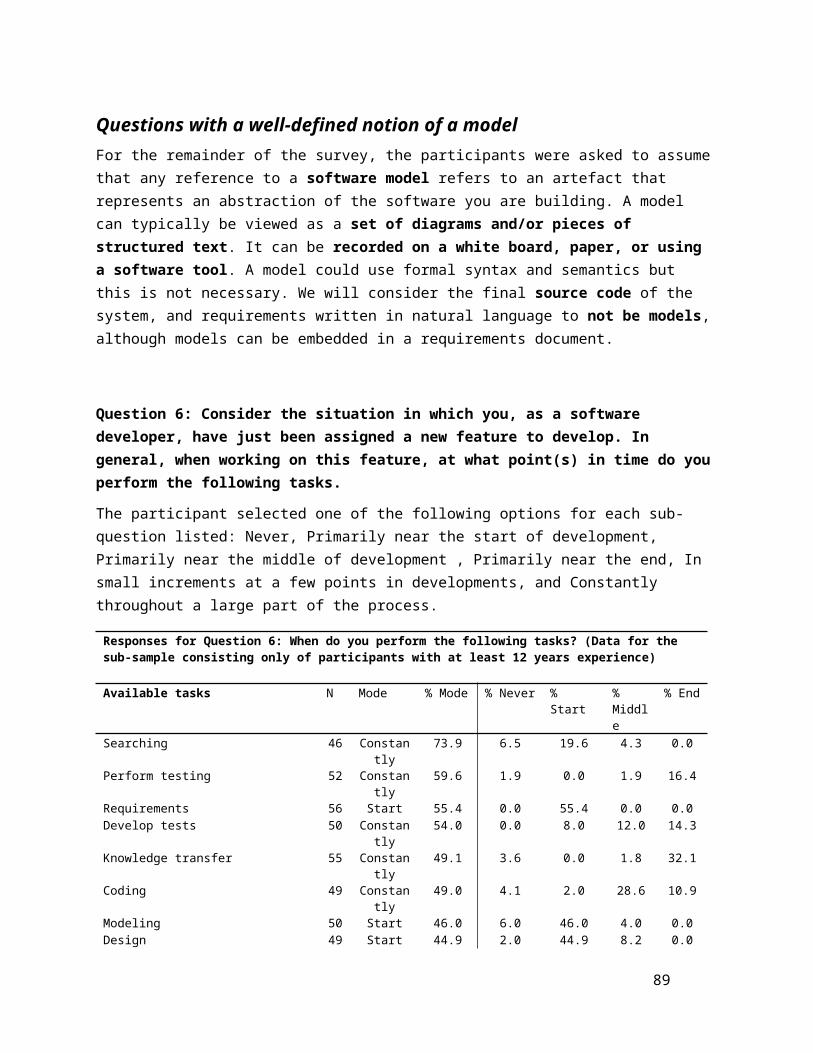
Question 16: Which of the following are potential difficulties with code-centric development (i.e. lacking modeling).
The participant selected one of the following options for each sub-question listed: Not a problem, a slight problem, a moderate problem, a bad problem, and a terrible problem.
Responses for Question 16: Problems with a code-centric approach. (Data for the sub-sample consisting only of participants from countries other than Canada and the USA)
Potential problems N mean s.d. % Not Problem (1)
% Slight Problem (1 + 2)
% Bad Problem (4 + 5)
% Terrible Problem (5)
Hard to see overall design 26 4.2 1.0 3.8 7.7 80.8 46.2Code becomes of poorer quality over time 26 4.0 1.2 7.7 15.4 84.6 42.3
Hard to understand behaviour of system 26 3.9 0.9 0.0 11.5 76.9 26.9
Difficult to change code without adding bugs
26 3.8 1.2 7.7 11.5 61.5 38.5
Too difficult to restructure system when needed
26 3.7 1.2 7.7 11.5 61.5 30.8
Changing code takes too much time 26 3.3 1.5 19.2 30.8 53.8 23.1
More skill than available to develop high quality code
26 3.1 1.4 19.2 30.8 42.3 19.2
Our prog. language leads to complex code 26 2.6 1.3 26.9 42.3 19.2 11.5
Prog. Languages not expressive enough 26 2.4 1.4 38.5 50.0 15.4 11.5Organization culture does not like code-centric
25 2.4 1.4 40.0 52.0 20.0 8.0
Our prog. language likely to become obsolete
26 2.3 1.3 34.6 57.7 15.4 7.7
Note. Values range from Not a problem (1) to Terrible problem (5).
89

Survey results for real time developers.The following data is based on those individuals that work with embedded real time software (e.g. Firmware, Routers) or industrial control software (e.g. Air Traffic Control) very-often to always.
Questions with a user defined notion of a modelFor questions 1-5, the participants were asked to use their own interpretation of what a software model is and what consists of software modeling.
Question 1: To what extent do you consider the following to be a model of a software system?
The participant selected one of the following options for each sub-question listed: Strongly Disagree, Disagree, Neutral, Agree, and Strongly Agree.
Responses for Question 1: What is a Model? (Data for the sub-sample consisting only of developers of real time software)Entity that might be a model N mean s.d. % Str.
Disagree (1)
% Disagree (1 + 2)
% Agree (4 + 5)
% Str. Agree (5)
Class Diagram 19 4.2 0.7 0.0 0.0 84.2 36.8UML Deployment Diagram 18 4.1 0.6 0.0 0.0 83.3 22.2Picture By Drawing Tool 18 4.0 0.6 0.0 5.6 94.4 11.1Use Case Diagram 19 3.9 0.8 5.3 5.3 89.5 15.8Whiteboard Drawing 19 3.8 0.7 0.0 5.3 78.9 10.5Textual Use Case 19 3.7 1.1 5.3 15.8 73.7 15.8Picture By Hand 19 3.6 1.0 5.3 15.8 63.2 10.5Source Code 19 3.5 1.2 0.0 31.6 57.9 21.1Source Code Comment 19 3.4 1.0 0.0 26.3 52.6 10.5
Note. Values range from Strongly Disagree (1), Disagree (2), Neutral (3), Agree (4), to Strongly Agree (5).
90

Question 2: To what extent do you create or modify software models or modeling information in the following ways?
The participant selected one of the following options for each sub-question listed: Never, Sometimes, Moderately often, Very often, and Always.
Responses for Question 2: How do you model? (Data for the sub-sample consisting only of developers of real time software)
Medium or method used to model N mean s.d. % Never (1)
% Sometimes (1 + 2)
% Very often (4 + 5)
% Always (5)
Word of mouth 19 3.1 1.1 10.5 26.3 36.8 10.5Diagramming tool (e.g. Visio) 18 2.9 1.3 16.7 44.4 38.9 11.1Whiteboard drawing 19 2.7 1.0 5.3 52.6 26.3 5.3Handwritten material 19 2.6 1.0 10.5 52.6 15.8 5.3Comments in source code 19 2.6 1.2 26.3 42.1 21.1 5.3Word processor / text 19 2.5 1.1 10.5 63.2 10.5 10.5Modeling tool/CASE 19 2.3 1.5 52.6 57.9 31.6 5.3
Note. Values range from Never (1), Sometimes (2), Moderately often (3), Very often(4), to Always (5).
Question 3: To what extent do you refer to the following sources of information when you want to learn about the design of a software system?
The participant selected one of the following options for each sub-question listed: Never, Sometimes, Moderately often, Very often, and Always.
Responses for Question 3: How do you learn about the design of software? (Data for the sub-sample consisting only of developers of real time software)
Refer to material created by/as N mean s.d. % Never (1)
% Sometimes (1 + 2)
% Very often (4 + 5)
% Always (5)
Word of mouth 19 3.5 1.2 5.3 21.1 57.9 21.1Word processor / text 19 3.4 1.2 0.0 26.3 42.1 26.3Whiteboard drawing 19 3.2 1.1 5.3 31.6 47.4 5.3Diagramming tool (e.g. Visio) 19 3.1 1.4 21.1 31.6 42.1 15.8Comments in source code 19 3.0 1.4 15.8 42.1 36.8 21.1Drawing software 18 2.7 1.1 11.1 61.1 5.6 5.6Modeling tool/CASE 19 2.6 1.5 36.8 52.6 42.1 5.3Handwritten material 19 2.3 1.0 26.3 63.2 15.8 0.0
Note. Values range from Never (1) to Always (5).
91

Question 4: At what point(s) in time do you visually document a design?
The participant selected one of the following options for each sub-question listed: Never, Sometimes, Moderately often, Very often, and Always.
Responses for Question 4: When do you visually document a design? (Data for the sub-sample consisting only of developers of real time software)
Timeline N mean s.d. % Never (1)
% Sometimes (1 + 2)
% Very often (4 + 5)
% Always (5)
Before coding 19 3.5 1.2 5.3 21.1 26.3 26.3During coding 19 2.8 1.1 10.5 36.8 21.1 5.3After coding 18 2.7 1.2 16.7 44.2 27.8 5.6Only on request 19 1.9 1.0 47.4 31.6 10.5 0.0
Note. Values range from Never (1) to Always (5).
Question 5: To what extent do you use the following notations for the purpose of modeling or design (if you don't know what one of these is, then ignore that particular item) .
The participant selected one of the following options for each sub-question listed: Never, Sometimes, Moderately often, Very often, and Always.
Responses for Question 5: What modeling notation do you use? (Data for the sub-sample consisting only of developers of real time software)
Language used to model N mean s.d. % Never (1)
% Sometimes (1 + 2)
% Very often (4 + 5)
% Always (5)
UML (any version) 19 2.8 1.7 42.1 47.4 47.4 21.1Structured Design models 19 2.5 1.2 21.1 57.9 15.8 10.5UML 2.* 17 2.4 1.7 52.9 58.8 35.3 17.6UML 1.* 17 2.2 1.6 52.9 64.7 23.5 17.6ROOM / RT for UML 19 2.1 1.4 52.6 68.4 21.1 5.3SQL 19 2.0 1.2 42.1 78.9 15.8 5.3ERD 19 1.9 1.2 47.4 78.9 15.8 5.3Well-defined DSL 18 1.8 1.0 55.6 72.2 5.6 0.0SDL 18 1.4 0.9 83.3 83.3 5.6 0.0Formal (e.g. Z, OCL) 17 1.4 1.0 82.4 94.1 5.9 5.9BPEL 17 1.2 0.5 88.2 94.1 0.0 0.0
Note. Values range from Never (1) to Always (5).
92

Questions with a well-defined notion of a modelFor the remainder of the survey, the participants were asked to assume that any reference to a software model refers to an artefact that represents an abstraction of the software you are building. A model can typically be viewed as a set of diagrams and/or pieces of structured text. It can be recorded on a white board, paper, or using a software tool. A model could use formal syntax and semantics but this is not necessary. We will consider the final source code of the system, and requirements written in natural language to not be models, although models can be embedded in a requirements document.
Question 6: Consider the situation in which you, as a software developer, have just been assigned a new feature to develop. In general, when working on this feature, at what point(s) in time do you perform the following tasks.
The participant selected one of the following options for each sub-question listed: Never, Primarily near the start of development, Primarily near the middle of development , Primarily near the end, In small increments at a few points in developments, and Constantly throughout a large part of the process.
Responses for Question 6: When do you perform the following tasks? (Data for the sub-sample consisting only of developers of real time software)
Available tasks N Mode % Mode % Never % Start % Middle
% End
Requirements 19 Start 73.7 0.0 73.7 0.0 0.0Searching 18 Constantly 50.0 22.2 22.2 0.0 0.0Design 17 Start 47.1 0.0 47.1 17.6 0.0Knowledge transfer 19 End 42.1 5.3 5.3 5.3 42.1Modeling 19 Start 36.8 15.8 36.8 10.5 5.6Perform testing 19 Constantly 36.8 5.3 0.0 15.8 15.8Coding 17 End 35.3 0.0 5.9 29.4 31.6Documentation 19 End 31.6 10.5 21.1 0.0 31.6Develop tests 17 Constantly 29.4 5.9 23.5 23.5 10.5
93

Question 7: To what extent to you work on the following types of software?
The participant selected one of the following options for each sub-question listed: Never, Sometimes, Moderately often, Very often, and Always.
Responses for Question 7: What types of software do you build? (Data for the sub-sample consisting only of developers of real time software)
Available options N mean s.d. % Never (1)
% Sometimes (1 + 2)
% Very often (4 + 5)
% Always (5)
Embedded Real-Time 18 3.7 1.3 11.1 22.2 77.8 27.8Industrial Control 18 3.0 1.5 22.2 44.4 50.0 16.7Computational 16 2.7 1.4 25.0 50.0 37.5 6.3Design and Engineering 18 2.6 1.2 22.2 55.6 27.8 5.6Operating Systems 17 2.5 1.5 35.3 58.8 35.3 11.8Middleware 18 2.3 1.2 27.8 72.2 27.8 0.0Information Display (Search / News) 18 1.9 1.3 55.6 77.8 22.2 5.6Consumer 18 1.9 1.5 61.1 77.8 22.2 11.1Servers 18 1.8 1.2 55.6 72.2 5.6 5.6Website Content Management 18 1.6 1.2 72.2 83.3 11.1 5.6Business 18 1.6 1.3 72.2 88.9 11.1 11.1System Utilities 18 1.6 0.9 61.1 88.9 5.6 0.0Malware 17 1.2 0.5 88.2 94.1 0.0 0.0
Note. Values range from Never (1) to Always (5).
Question 8: To what extent have you worked with the following tools during the last 6 months.
The participant selected one of the following options for each sub-question listed: Never, Sometimes, Moderately often, Very often, and Always.
Responses for Question 8: What development tools do you use? (Data for the sub-sample consisting only of developers of real time software)
Available options N mean s.d. % Never (1)
% Sometimes (1 + 2)
% Very often (4 + 5)
% Always (5)
Eclipse 16 3.2 1.4 12.5 37.5 50.0 18.8Visual Studio 16 2.4 1.3 31.3 56.3 25.0 6.3Rational Rose 15 2.1 1.4 53.3 73.3 26.7 6.7Rational XDE 16 1.6 1.3 75.0 81.3 12.5 6.3Rational RSx 15 1.6 1.3 80.0 80.0 13.3 6.7Together J 16 1.3 0.6 81.3 93.8 0.0 0.0
Note. Values range from Never (1) to Always (5).
94

Question 9: To what extent have you worked in the following technologies or platforms during the last 6 months.
The participant selected one of the following options for each sub-question listed: Never, Sometimes, Moderately often, Very often, and Always.
Responses for Question 9: What technologies / platforms do you use? (Data for the sub-sample consisting only of developers of real time software)
Available options N mean s.d. % Never (1)
% Sometimes (1 + 2)
% Very often (4 + 5)
% Always (5)
J2SE 18 2.1 1.5 61.1 61.1 27.8 5.6PHP / Perl 18 2.0 1.1 44.4 72.2 16.7 0.0Ruby / Python 18 1.7 1.1 55.6 88.9 11.1 5.6J2EE 18 1.7 1.3 72.2 77.8 16.7 5.6ASP.Net 18 1.0 0.0 100.0 100.0 0.0 0.0C / C++* 9 2.3 1.7 55.6 55.6 22.2 22.2
Note. Values range from Never (1) to Always (5). *Where C/C++ was identified as an “other” technology.
Question 10: To what extent do you perform the following tasks.
The participant selected one of the following options for each sub-question listed: Never, Sometimes, Moderately often, Very often, and Always.
Responses for Question 10: What are your daily tasks? (Data for the sub-sample consisting only of developers of real time software)
Available tasks N mean s.d. % Never (1)
% Sometimes (1 + 2)
% Very often (4 + 5)
% Always (5)
Think about s/w system 17 4.3 0.6 0.0 0.0 94.1 35.3Design a s/w system 17 3.8 0.7 0.0 5.9 76.5 5.9Lead software project 17 3.6 0.8 0.0 11.8 64.7 5.9Explain s/w design to others 17 3.6 0.8 0.0 5.9 52.9 11.8Search about s/w system 16 3.5 1.2 0.0 25.0 50.0 25.0Run / attend meetings 17 3.4 1.1 5.9 17.6 52.9 11.8Model a s/w system 17 3.4 1.2 11.8 17.6 47.1 17.6Write new code 17 3.4 1.4 11.8 29.4 52.9 23.5Fix bugs 17 3.2 1.3 11.8 29.4 52.9 11.8Maintain existing code 17 3.2 1.4 17.6 29.4 47.1 17.6Perform manual testing 15 3.1 0.9 0.0 26.7 33.3 6.7Write / maintain requirements 17 3.1 1.2 11.8 35.3 47.1 5.9Write / maintain test scripts 17 2.8 1.0 0.0 52.9 23.5 5.9General administration 17 2.6 1.1 11.8 58.8 23.5 5.9
Note. Values range from Never (1) to Always (5).
95

Question 11: To what extent do you use software tools in the modeling process for the following activities?
The question included an option to ignore this question if the participant does not use software design applications (which explains the lower number of participants answering this question). The participant selected one of the following options for each sub-question listed: Never, Sometimes, Moderately often, Very often, and Always.
Responses for Question 11: What do you use modeling tools for? (Data for the sub-sample consisting only of developers of real time software)Activity N mean s.d. % Never
(1)% Sometimes (1 + 2)
% Very often (4 + 5)
% Always (5)
Developing a design 12 3.7 1.0 0.0 16.7 66.7 16.7Prototyping a design 12 3.6 1.2 8.3 16.7 58.3 25.0Transcribing a design into digital format 12 2.6 1.4 33.3 50.0 33.3 8.3Brainstorming possible designs 12 2.3 1.3 25.0 75.0 25.0 8.3Generating code (code editable) 12 2.3 1.6 41.7 66.7 25.0 16.7Generating all code 12 2.3 1.7 58.3 58.3 25.0 16.7
Note. Values range from Never (1) to Always (5).
Question 12: Based on past experience, how good (based on qualities like efficiency, accuracy and usability) are software design or modeling tools at accomplishing the following tasks
The question included an option to ignore this question if the participant does not use software design applications (which explains the lower number of participants answering this question). The participant selected one of the following options for each sub-question listed: Awful, Poor, OK, Good, Excellent.
Responses for Question 12: How good are modeling tools at ...? (Data for the sub-sample consisting only of developers of real time software)
Available activities N mean s.d. % Awful (1)
% Poor (1 + 2)
% Good (4 + 5)
% Excellent (5)
Developing a design 11 3.7 0.6 0.0 0.0 63.6 9.1Generating code (code is editable) 11 3.1 1.0 9.1 27.3 45.5 0.0Prototyping a design 11 2.9 1.1 9.1 36.4 27.3 9.1Brainstorming possible designs 11 2.8 1.0 9.1 36.4 27.3 0.0Transcribing a design into digital format 11 2.8 1.1 9.1 45.5 36.4 0.0Generating all code (no manual coding) 11 2.2 0.9 18.2 72.7 9.1 0.0
Note. Values range from Awful (1) to Excellent (5).
96

Question 13: Please rank the following attributes of a software model from most important (1) to least important (9).
Responses for Question 13: Attributes of a modeling tool? (Data for the sub-sample consisting only of developers of real time software)
Attribute / Ability to N Rank % Bottom 2
% Bottom 4
% Top 4 % Top 2
Communicate to others 15 1 20.0 20.0 73.3 46.7Ease and speed to create 15 3 13.3 33.3 60.0 33.3Ability to analyze 15 3 6.7 26.7 60.0 20.0Readability 15 4 20.0 40.0 53.3 40.0Collaborate amongst developers 15 5 13.3 40.0 40.0 20.0Generate code 15 6 40.0 60.0 33.3 20.0Ability to view different aspects of a model 15 7 13.3 73.3 20.0 6.7Information density 15 8 33.3 53.3 26.7 6.7Embed parts of model in documentation 15 9 60.0 86.7 13.3 6.7
Note. The % top 4 represents the percentage of participants that listed the attribute in their top four. Similarly for % bottom four. The same applies for % top2, and % bottom 2.
97

Question 14: For each of the following, how do code-centric development approaches compare to model-centric approaches.
This question asks about code-centric vs. model-centric approaches to software development. In a model-centric approach, the developers look to the model to see the design, and change the model as the first step in performing any design change. Extensive modeling is performed, and the coding is either automated, or at least straightforwardly determined from the model. In a code-centric approach, the code is seen as the main artefact; developers understand the design by understanding the code, and the process of design change is equated with changing the code.
The participant selected one of the following options for each sub-question listed: Much easier in a model-centric approach, Somewhat easier in a model-centric approach, About the same, Somewhat easier in a code centric approach, and Much easier in a code centric approach.
Responses for Question 14: Tasks that are better in a model-centric or code centric approach. (Data for the sub-sample consisting only of developers of real time software)
Available activities N mean s.d. % Much easier in Models (1)
% Somewhat easier in Models (1 + 2)
% Somewhat easier in Code (4 + 5)
% Much easier in Code (5)
Creating efficient software 16 3.9 1.3 6.3 18.8 68.8 43.8Fixing a bug 16 3.8 1.2 6.3 12.5 62.5 31.3Creating a prototype 16 3.3 1.2 6.3 25.0 37.5 18.8Creating a system as quickly as possible 16 3.1 1.5 12.5 43.8 43.8 25.0Creating a usable system for end users 16 2.8 1.0 12.5 31.3 25.0 0.0
Creating a system that most accurately meets requirements
16 2.8 1.2 18.8 43.8 31.3 6.3
Modifying a system when requirements change
16 2.5 1.3 25.0 50.0 12.5 12.5
Creating a re-usable system 16 2.4 1.3 37.5 43.8 18.8 6.3
Creating a new system overall 16 2.4 1.4 37.5 62.5 31.3 6.3
Comprehending a system's behaviour 15 2.1 1.2 40.0 66.7 20.0 0.0
Explaining a system to others 16 1.6 0.8 56.3 81.3 0.0 0.0
Note. Values range from Much easier in a model-centric approach (1), to much easier in a code-centric approach (5).
98

Question 15: Which of the following are potential difficulties with modeling. These may be reasons why you don’t model much, or things you find hard about modeling.
The participant selected one of the following options for each sub-question listed: Not a problem, a slight problem, a moderate problem, a bad problem, and a terrible problem.
Responses for Question 15: Problems with a model-centric approach. (Data for the sub-sample consisting only of developers of real time software)Potential problems N mean s.d. % Not
Problem (1)
% Slight Problem (1 + 2)
% Bad Problem (4 + 5)
% Terrible Problem (5)
Models become out of date and inconsistent with code
16 4.2 1.1 6.3 6.3 81.3 50.0
Models cannot be easily exchanged between tools
16 3.4 1.5 18.8 25.0 56.3 25.0
Modeling tools are 'heavyweight' (install, learn, configure, use)
16 3.3 1.3 12.5 25.0 50.0 18.8
Code generated from a modeling tool not of the kind I would like
15 3.2 1.4 20.0 26.7 46.7 20.0
Organization culture does not like modeling 16 3.1 0.9 6.3 18.8 31.3 0.0
Not enough detail to be implemented in code
16 3.0 1.5 25.0 37.5 43.8 18.8
Modeling tools are too expensive 15 2.8 1.1 13.3 33.3 20.0 6.7
Semantics of models different from prog. language
16 2.8 1.4 18.8 56.3 31.3 18.8
Modeling tools cannot be analyzed as intended
15 2.7 1.3 26.7 40.0 33.3 6.7
Creating and editing a model is slow 16 2.7 1.1 12.5 43.8 18.8 6.3
Modeling tools change, models become obsolete
16 2.7 1.3 25.0 43.8 31.3 6.3
Modeling languages are not expressive enough
15 2.7 1.1 20.0 40.0 26.7 0.0
Modeling tools lack features I need or want 15 2.6 1.1 20.0 40.0 20.0 0.0
Modeling tools hide details (source code fully visible)
16 2.5 1.2 18.8 56.3 18.8 6.3
Do not trust companies will continue to support their tools
15 2.4 1.1 26.7 53.3 20.0 0.0
Modeling language hard to understand 16 2.3 0.9 18.8 68.8 12.5 0.0
Have had bad experiences with modeling 16 2.2 1.3 37.5 68.8 12.5 12.5
Note. Values range from Not a problem (1), to Terrible problem (5).
99

Question 16: Which of the following are potential difficulties with code-centric development (i.e. lacking modeling).
The participant selected one of the following options for each sub-question listed: Not a problem, a slight problem, a moderate problem, a bad problem, and a terrible problem.
Responses for Question 16: Problems with a code-centric approach. (Data for the sub-sample consisting only of developers of real time software)
Potential problems N mean s.d. % Not Problem (1)
% Slight Problem (1 + 2)
% Bad Problem (4 + 5)
% Terrible Problem (5)
Hard to see overall design 17 3.8 1.1 5.9 11.8 64.7 29.4Hard to understand behaviour of system 17 3.5 0.9 0.0 17.6 52.9 11.8
Difficult to change code without adding bugs
16 3.3 1.3 12.5 25.0 50.0 18.8
Too difficult to restructure system when needed
17 3.3 0.9 0.0 23.5 47.1 5.9
Code becomes of poorer quality over time 17 3.1 1.5 17.6 41.2 47.1 23.5
Changing code takes too much time 17 2.4 1.1 29.4 47.1 5.9 5.9
More skill than available to develop high quality code
16 2.2 1.1 31.3 68.8 18.8 0.0
Our prog. language leads to complex code 17 2.1 1.1 35.3 64.7 11.8 0.0
Our prog. language likely to become obsolete
17 1.7 1.1 64.7 76.5 11.8 0.0
Organization culture does not like code-centric
17 1.7 1.2 64.7 82.4 11.8 5.9
Prog. Languages not expressive enough 17 1.6 0.9 64.7 82.4 5.9 0.0
Note. Values range from Not a problem (1) to Terrible problem (5).
100

Additional Sub-sample DataSo far, we have seen the sample data divided into the following categories:
Real Time Developers
Practitioners within Canada / USA
Practitioners outside Canada / USA
Software Developers
Software Modelers
Practitioners that generate source code from models
Practitioners with a lot of experience (> 11 years) in the field
In the accompanying document (TR-2008-08), the data has been further sub-divided into the following categories:
Non Real Time Developers (identified as sometimes or never working with real-time systems)
Non Software Developers (identified as sometimes or never writing or maintaining source code)
Non Software Modelers (identified as sometimes or never modeling software systems)
Practitioners that do not generate source code from models (identified as sometimes or never generate some or all code from models)
Practitioners with little experience (< 5 years) in the field.
Additionally, in the accompanying document (TR-2008-08), we provide further analysis looking at the software developers (very often to always write or maintain code) broken down into the sub-samples above. For example, we considered Software Developers that are also Real Time Developers; or, Software Developers that also generate source code from models. The same analysis was performed for practitioners that are software modelers.
101

Participant Additional CommentsThe intention of the survey was to gather the thoughts of software practitioners on software modeling. In particular, our objective was to determine what makes developers take a model-centric or code-centric approach and to uncover why modeling is not universally practiced. To ensure that the participants could provide a personalized perception of software modeling, the survey concluded with an open ended question that asked for comments about the “the pros and cons of modeling, or your experiences regarding the topic of this survey”.
The following is a sample of the comments provided by the participants in answer to an open ended question
I have taken courses on UML and RUP, but the "culture" here has not yet adopted the concepts. They try to use UML, but merely for analysis, not development. We do not yet have case tools or modeling tools.
In "the real world" it's necessary to cull those models down to the bare basics. Adding too much detail to a model takes too much time, and can potentially confuse developers when it comes to implementation.
Modeling using a tool is good for documenting a model, but otherwise a piece of paper/whiteboard works better and is more flexible.
Modeling should be used to validate and share your design ideas. If your model works, you can build it too; and others can learn it more easily. Anything more is a waste of time, anything less will cost you more time in the long run.
There is a time cost associated with producing the model upfront, but that time is more than gained back during development and, especially, maintenance.
Now if the [modeling] tools were actually developed by modellers they'd be much better! The tools are often too code centric.
Code wins over models every time when it comes to revenue. Working, tested code with business value can be sold. Models don't sell, well, unless you are in a huge defence contracting world.
102