perceptions of english proficiency levels: the unspoken
TRANSCRIPT

Brigham Young University Brigham Young University
BYU ScholarsArchive BYU ScholarsArchive
Theses and Dissertations
2013-07-02
Perceptions of English Proficiency Levels: The Unspoken Perceptions of English Proficiency Levels: The Unspoken
Expectations of Native English Speakers Expectations of Native English Speakers
Alison Divett Roberts Brigham Young University - Provo
Follow this and additional works at: https://scholarsarchive.byu.edu/etd
Part of the Linguistics Commons
BYU ScholarsArchive Citation BYU ScholarsArchive Citation Roberts, Alison Divett, "Perceptions of English Proficiency Levels: The Unspoken Expectations of Native English Speakers" (2013). Theses and Dissertations. 3683. https://scholarsarchive.byu.edu/etd/3683
This Thesis is brought to you for free and open access by BYU ScholarsArchive. It has been accepted for inclusion in Theses and Dissertations by an authorized administrator of BYU ScholarsArchive. For more information, please contact [email protected], [email protected].

Perceptions of English Proficiency Levels:
The Unspoken Expectations of
Native English Speakers
Alison Divett Roberts
A thesis submitted to the faculty of Brigham Young University
in partial fulfillment of the requirements for the degree of
Master of Arts
William G. Eggington, Chair Wendy Baker-Smemoe
Dan P. Dewey
Department of Linguistics and English Language
Brigham Young University
July 2013
Copyright © 2013 Alison Divett Roberts
All Rights Reserved

ii
ABSTRACT
Perceptions of English Proficiency Levels: The Unspoken Expectations of
Native English Speakers
Alison Divett Roberts Department of Linguistics, BYU
Master of Arts
This study investigates the relationship between nonnative English speaker (NNES) proficiency level and native English speaker (NES) level of comfort interacting with NNES. The purpose of this study was to discover at what proficiency level NESs feel comfortable interacting with NNES. This study also looked at how communicative task and NES demographic variables affected the proficiency expectations NNESs have for NESs.
Participants included 120 NESs and 7 NNESs. The NESs listened to sound clips from the 7 NNESs and rated how comfortable they would feel (on a scale of 0-10, 10 indicating very comfortable) interacting with the speaker in a variety of communication tasks. Listeners rated intermediate and advanced level speakers significantly higher than the novice speakers. Additionally, there was not a significant difference between mean ratings for the intermediate and advanced speakers. Communication task was revealed as having a significant main effect on task. Listeners rated that they would feel least comfortable communicating with the speakers over the phone while discussing a customer service issue. They also indicated that they would feel least comfortable interacting with the speakers if they were their boss. Listener demographic variables did not have a significant main effect on overall ratings, but were significant for some tasks when task was analyzed individually. Specifically, age and frequency of interaction with NNES had an effect on some tasks; however the reliability of this result is affected by sample size.
These results suggest a threshold relationship between NES comfort ratings and speaker proficiency level. Additionally, the data suggests that task may be more important than proficiency level in some interactions. A larger sample is needed to better understand the role NES demographic variables may play in level of comfort during NES and NNES interaction.
Keywords: immigrants, English proficiency, interaction, proficiency judgments, proficiency level, NES, NNES, native nonnative speaker communication, nonnative speech

iii
ACKNOWLEDGEMENTS I would like to express my appreciation to my graduate committee. I am very grateful for
the opportunity to have Dr. Eggington as a mentor in this process. I am also very grateful for the
feedback, input, and guidance provided by Dr. Smemoe and Dr. Dewey in all stages of the
completion of this thesis. Additionally, I want to thank Dr. Egget in the statistics department for
his willingness to assist in this research.
I want to express my gratitude to my husband, Mark, for his support during this
experience. I greatly appreciate his desire to help and support me. Furthermore, I am very
appreciative of the support my parents, Suzanne and Donald, have provided throughout my
education. Also, thank you to my cousin, Miranda Divett Gonzalez, for her help in the writing
and editing process. Finally, I would like to acknowledge that this research was funded by the
graduate research fellowship award.

iv
Table of Contents ABSTRACT ........................................................................................................................ ii ACKNOWLEDGEMENTS ............................................................................................... iii Table of Contents ............................................................................................................... iv
Index of Tables ................................................................................................................. vii Index of Figures ............................................................................................................... viii Chapter 1: Introduction ....................................................................................................... 1
Immigration and the US .................................................................................................. 1
Immigrant Language Attainment .................................................................................... 2
Toward a Threshold Proficiency Level ........................................................................... 3
Research Questions ......................................................................................................... 4
Chapter 2: Review of literature ........................................................................................... 6
The Pidginization Hypothesis and Social Distance ........................................................ 6
Role of universal influences........................................................................................ 7
Schumann’s recent updates ......................................................................................... 8
More recent research. .................................................................................................. 9
Social Integration and Interaction ................................................................................. 10
Social integration ...................................................................................................... 10
Social interaction ...................................................................................................... 12
NES Perceptions of NNES Proficiency ........................................................................ 14
Public knowledge about language acquisition and proficiency. ............................... 14
NES judgments of nonnative speech. ....................................................................... 15
Summary ....................................................................................................................... 17
Chapter 3: Research Design .............................................................................................. 19
Participants .................................................................................................................... 19
Listeners. ................................................................................................................... 19
Speakers. ................................................................................................................... 21
Materials ....................................................................................................................... 22
Speech samples. ........................................................................................................ 22
Survey. ...................................................................................................................... 24
Procedure ...................................................................................................................... 27
Data collection. ......................................................................................................... 27
Data Analysis. ........................................................................................................... 28

v
Chapter 4: Results ............................................................................................................. 30
Research Question 1: Effect of speaker proficiency level on listener comfort ratings . 30
Research Question 2: Effect of communication task on mean ratings ......................... 31
Research Question 3: Effect of listener variables on mean ratings .............................. 36
Task 1: Casual conversation for at least 10 minutes ................................................. 37
Task 2: Conversation on a topic that you have a strongly held view on .................. 40
Task 4: Ordering food at a restaurant. ...................................................................... 41
Task 6: Customer service over the phone. ................................................................ 42
Task 7: Boss. ............................................................................................................. 43
Task 8: Coworker ...................................................................................................... 43
Chapter 5: Discussion ....................................................................................................... 44
Research Question 1: Effect of speaker proficiency level on listener comfort ratings . 44
Research Question 2: Effect of communication task on mean ratings ......................... 46
Task 6: Customer service over the phone ................................................................. 46
Task 7: Having this person as your boss ................................................................... 48
Tasks with the highest average ratings ..................................................................... 49
Research Question 3: Effect of listener variables on mean ratings .............................. 49
Age range. ................................................................................................................. 50
Experiences with NNESs .......................................................................................... 50
Implications................................................................................................................... 51
Relationship between NES comfort level and NNES proficiency level. .................. 51
Study abroad students and intensive English schools in the US ............................... 54
Importance of task..................................................................................................... 54
Employers. ................................................................................................................ 55
ESP classes................................................................................................................ 55
Community ESL programs. ...................................................................................... 56
Limitations .................................................................................................................... 56
Sampling ................................................................................................................... 56
Survey instrument ..................................................................................................... 56
Self-Report data. ....................................................................................................... 57
Listener’s attitudes toward NNESs. .......................................................................... 57
Personality and motivation as moderating variables ................................................ 57
Suggestions for Future Research .................................................................................. 58
Conclusion .................................................................................................................... 58

vi
References ......................................................................................................................... 61
Appendix A ....................................................................................................................... 66
Appendix B ....................................................................................................................... 75
Appendix C ....................................................................................................................... 76
Appendix D ....................................................................................................................... 80

vii
Index of Tables
Table 1 Comparison of ACTFL Proficiency Levels and ELC LAT Speaking Scores for the
Speakers ........................................................................................................................................ 23
Table 2 Speaker LAT Proficiency Scores, Group Classification, and Approximate ACTFL
Equivalency................................................................................................................................... 23
Table 3 Communication Tasks .................................................................................................... 26
Table 4 Dependent and Independent Variables ........................................................................... 28
Table 5 Mean Listener Ratings across Proficiency Levels .......................................................... 31
Table 6 Mean Ratings across Task for all Proficiency Levels ..................................................... 32
Table 7 Pairwise Comparison of Post Hoc Tukey Adjusted P-values across Tasks ................... 33
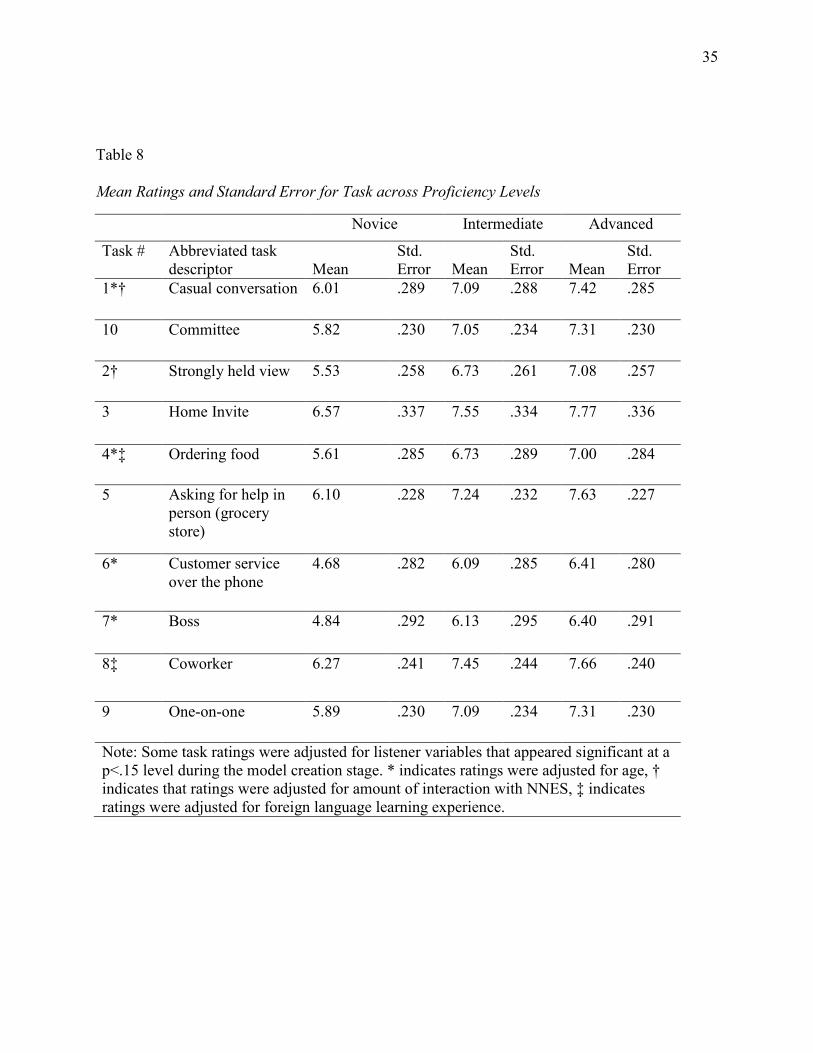
Table 8 Mean Ratings and Standard Error for Task across Proficiency Levels .......................... 35
Table 9 Mean Ratings across Age Ranges for Task One............................................................. 37
Table 10 Pairwise Comparison of Post Hoc Tukey Adjusted P-values across Age Ranges for
Task One ....................................................................................................................................... 38
Table 11 Mean Ratings across NNES Interaction Categories for Task One ............................... 39
Table 12 Pairwise Comparison of Post Hoc Tukey Adjusted P-values across NNES Interaction
Categories for Task one ................................................................................................................ 39
Table 13 Mean Ratings across NNES Interaction Categories for Task Two .............................. 40
Table 14 Pairwise Comparison of Post Hoc Tukey Adjusted P-values across NNES Interaction
Categories for Task two ................................................................................................................ 41
Table 15 Mean Ratings across Age Range for Task Four ........................................................... 42
Table 16 Pairwise Comparison of Post Hoc Tukey Adjusted P-values across Age Ranges for
Task Four ...................................................................................................................................... 42
Table 17 Differences between Average Group Proficiency Scores ............................................ 45
Table 18 Effects of listener variables on mean ratings ................................................................ 80

viii
Index of Figures
Figure 1. Mean Ratings across Tasks and Proficiency Levels...................................................... 36
Figure 2. Representation of Binary Relationship between Speaker Proficiency Level and Listener
Comfort Level ............................................................................................................................... 52
Figure 3. Representation of Direct Linear Relationship between Speaker Proficiency and Listener
Comfort ......................................................................................................................................... 53
Figure 4. Threshold Relationship between Speaker Proficiency and Listener Comfort ............... 54

1
Chapter 1: Introduction
Immigration and the US
Immigration has been an issue in the United States since its foundation, often causing
periodic conflict. Each new group of immigrants interacts with an already assimilated core
population that reacts to the newcomers in various ways. Recent immigrants have met many of
the same negative attitudes as other immigrant groups, including fears about their willingness
and ability to integrate linguistically (Barkan, Kraut, & Diner, 2007). Possibly as a result of
these public fears, politicians are also concerned with the rate and level of English language
attainment of nonnative speaking immigrants. This is evidenced by English proficiency
requirements in even the most “pro-immigrant” and bipartisan legislation (S. 744, 2013). Low
English proficiency levels, or perceived low proficiency levels, can make sections of the
dominant population uneasy and lead to anti-immigrant public opinion, legislation, and language
policy that perpetuate the isolation of this group (Dickers, 2003).
As of 2011, the US was home to more immigrants than any other country in the world
(40.4 million). This number is more than three times higher than that of Russia, the country with
the second largest population of immigrants, at 12 million (“A Nation of Immigrants,” 2013) .
These numbers illustrate the United States’ unique situation as “the world’s leader . . . as a
destination for immigrants” (“A Nation of Immigrants,” 2013, p. 2) and the fact that it cannot
afford to ignore that immigrant English language attainment levels are shaping experiences
between native English speakers (NESs) and nonnative English speakers (NNESs) and
ultimately affecting immigrant social integration (Xue, 2007; Jimenez, 2011; Derwing & Waugh,
2012).

2
Immigrant Language Attainment
NNES immigrants often see gains in their target language proficiency during the first few
years they live in the US. They may quickly develop Basic Interpersonal Communication Skills
(BICS) (Cummins, 1994) such as greetings, asking for directions, small talk, and other frequent
and formulaic social interaction skills. After a few years, the rate at which they acquire the target
language often plateaus (Hamilton, 2001; Dicker, 2003). Error fossilization (long-lasting,
habitual errors) frequently takes place and a “pidginization” (a simplified, low level, linguistic
proficiency) of the target language occurs (Schumann, 1974).
Pidginization is seen as the result of the learner’s social and psychological distance from
speakers of the target language (Schumann, 1976a). According to Schumann’s pidginization
hypothesis, the learner’s community, rather than the learner, has the greatest amount of control
over ultimate language attainment levels. The proficiency level that the learner will acquire is
directly related to the degree that they are integrated into the target language group (Schumann,
1986). This suggests that there is a dependent relationship between language proficiency and
integration and that ultimate language attainment levels may be controlled by the amount of
interaction NESs are willing to have with NNESs.
It is important to note that Schumann’s pidginization hypothesis represents one theory of
adult second language acquisition. There are a number of “universal influences” (social,
educational, environmental, cognitive, psychological, biological and emotional) that affect
language acquisition (Ortega, 2009, p. 9) .
3
Toward a Threshold Proficiency Level
NESs can feel uncomfortable interacting with NNESs who have a low English
proficiency level (Derwing & Munro, 2009). As a result of this feeling of discomfort, it is
possible that unless an immigrant is already at an acceptable level of English proficiency, they
are much less likely to find NESs willing to interact with them. Lack of interaction opportunities
could negatively impact the immigrant’s ability to integrate linguistically into the target language
society, which would reduce opportunities to continue to develop higher levels of English
proficiency and prevent them from experiencing the benefits of integration. The level to which
an immigrant is able to participate in the target language society is dictated by their level of
proficiency in the target language (Masgoret & Gardner, 1999). However, there is little research
that informs on what an acceptable threshold level of proficiency might be.
The American Council on Teaching Foreign Languages (ACTFL) attempts to address
this issue in their Oral Proficiency Interview rubric. A speaker receiving an advanced rating on
their scale should be “understood without difficulty by speakers unaccustomed to dealing with
nonnative speakers” (ACTFL, 2012). Most often, English proficiency is presented as a binary
option; NNES are either able to speak English or they are not. If degrees of proficiency are
brought into the discussion, they are described in vague terms, such as “speaks English well or
somewhat well” (Portes & Rumbaut, 2006, p. 222), “achieves an understanding of English” (S.
744, 2013, p. 103), has a “heavy accent” (Lindemann, 2011, p. 224) , or has a “rudimentary
knowledge of English” (Derwing & Waugh, 2012, p. 4). The ambiguity of these proficiency
descriptors does little to inform on the proficiency expectations of NESs.
In addition, these descriptors also neglect how proficiency expectations may change
depending on communication task. It is probable that NES proficiency expectations differ

4
depending on situation, owing to the fact that even NESs adjust their registers in different
environments. Furthermore, there is also the possibility that NES demographic variables,
including age and gender, affect expectations. As well, NES that habitually interact with NNES
could be more sympathetic and thus have lower proficiency expectations. These variables add
another facet to proficiency expectations that needs to be studied.
Research on this expectations differential is needed to inform both language policy
makers and society on how to avoid situations that prevent NNESs from integrating into the
dominant society and experiencing the accompanying social, educational, and economic benefits.
A more concrete and explicit understanding of NES proficiency expectations for NNES is
necessary to avoid confusion and facilitate interaction.
Research Questions
This study will attempt to discover at what oral proficiency level NESs feel most
comfortable interacting with NNESs. Central questions the study will address include:
1) What proficiency level do NNESs need to achieve in order for NESs to report that
they feel comfortable interacting with them?
2) Do NES proficiency expectations for NNESs change depending on communication
task?
3) Do NES proficiency expectations for NNESs change based on NES demographic
variables?
A closer look at these questions is essential to understand how to better involve NNES
adults in English speaking society, which could in turn allow them to develop English language
skills at a more advanced level and receive the benefits that accompany social integration.

5

6
Chapter 2: Review of literature
This chapter reports on the theories, topics, and studies that provide the basis for the
rationale of this study. This chapter is divided into three main sections. First, Schumann’s
Pidginization Hypothesis and adjacent research will be examined in more detail. Second,
integration and interaction will be defined and discussed within the context of how both topics
interface with language proficiency. Third, current research on how NNES proficiency levels are
perceived by NESs will be outlined.
The Pidginization Hypothesis and Social Distance
Pidginization is the creation of a contact vernacular that arises for the purposes of
simplified and limited communication between two linguistically different groups. In 1976,
Schumann stated that “pidginization is the result of a learner’s social and psychological distance
from the speakers of a target language” (p. 263). This assertion was in part the result of a study
of the language learning experience of a 33-year-old Costa Rican immigrant named Alberto.
Alberto had lived in Boston for more than one year but was unable to improve beyond basic
English skills, even after attending individualized English instruction. Alberto’s linguistic
proficiency had stagnated and pidginized, producing an interlanguage that was simplified and
reduced.
Schumann developed his Pidginization Hypothesis by viewing Alberto’s case study
through the lens of Smith (1972), who described language as ultimately having three functions:
communicative (transmission or referential, denotative information), integrative (language that
marks a speaker as a member of a social group), and expressive (linguistic ability that elevates
them to an admired member of the community, such as an author or poet). While this may be an
overly simplistic view of language utility, a closer look at the communicative and integrative

7
functions can provide information about how and why pidginization occurs. While many
communicative tasks can be completed without linguistic accuracy, integrative communication
requires the use of standard linguistic features in order for the speaker to sound approximately
like a member of the target language group. As such, a NNES who can only use the
communicative function (like Alberto) will produce a pidginized and restricted version of the
target language and will not be accepted as an integrated member of the dominant linguistic
community (Schumann, 1976a). In turn, this distance from the target language community will
further remove the speaker from opportunities to develop language skills. Schumann (1976a)
summarized his findings by stating the following:
Restriction in function can be seen as resulting from social and or psychological distance
between the speaker and the addressee . . . the speech of the second language learner will
be restricted to the communicative function if the learner is socially distant from the
speakers of the target language. (p. 396)
The assumption is that the greater the social distance that exists between the NES and
NNES, the more difficult it will be for the NNES to acquire English. This can become somewhat
of a paradox for NNESs. Their language ability prohibits full integrative communication;
however, interaction with the target language community is needed to develop integrative
communication. High levels of language acquisition are near impossible to achieve while a large
social distance exists (Schumann, 1976b).
Role of universal influences. It is important to note that there are a number of “universal
influences” (social, educational, environmental, cognitive, psychological, biological and
emotional) that affect language acquisition (Ortega, 2009, p. 9) . “Willingness to communicate”

8
(how willing a second language learner is to seek out opportunities to use the L2) on the
immigrant’s part is also a key factor in language acquisition (MacIntyre, 2007) . Additionally,
Schmidt (1983) found that closing the social distance gap is not enough to ensure acquisition if
the learner did not learn to monitor and notice errors. Moreover, the linguistic relationship of the
L1 and target language (how linguistically different the two languages are from each other) plays
a role in rate and ultimate attainment levels (Derwing & Munro, 2009). In addition, Krashen’s
input hypothesis theorized that input must be comprehensible (accessible to the language learner
by not being too far above their current proficiency level) in order for the learner to benefit from
the exposure (Krashen, 1980). The role these influences play in language acquisition cannot be
ignored; however they are not the focus of this study.
Schumann’s recent updates. Schumann has updated and expanded his theories about
language acquisition and social distance over the past 35-40 years. Recently, he connected his
research on the evolutionary neurobiology of language acquisition (language acquisition as a
biological phenomenon) with his theories on social distance. This research is presented in a
coauthored book that discusses a view of language acquisition that takes into account an
evolutionary drive to interact with others, or an “interactional instinct” (Lee, Mikesell, Joaquin,
Mates, & Schumann, 2009, p. 5) . In this book he presents what he calls a “social behavior
feedback loop.” He argues that language is dependent on social bonds and vice versa. “Social
behaviors and social bonds exist in reciprocal relationship. Social behaviors help to form social
bonds, and social bonds often motivate social behaviors. Language is a social behavior” (p. 167).
Even more recently, Schumann addressed how society has attempted to respond to the
difficulties faced by adult second language learners. Schumann (2013) outlines 11 strategies
societies employ to manage these difficulties (developing lingua francas, forming sprachbunds or

9
areal languages, practicing exogenous marriage, undergoing language shift, learning the target
language imperfectly, developing a pidgin or creole, shifting the language burden to young
children, relying on talented learners, developing the art and practice of translation, developing
machine transation, and providing instruction). However, he posits that none of these strategies
have actually solved the “problem” of adult language learners, but instead, society has merely
“coped with it” (p. 191). He concludes with the opinion that “humans are a both monolingual and
multilingual species, and it is the way social contexts interact with motivation/attachment,
ability/aptitude, and opportunity that produces either a monolingual or a bilingual human” (p.
191). This publication highlights the fact that much research is still needed to inform on social
contexts that impede and facilitate adult L2 acquisition.
More recent research. Schumann’s social distance and language acquisition theories
have been applied in more recent linguistic studies, usually within the context of interaction,
social distance, and language proficiency. Masgoret and Gardner (1999) found a positive
correlation between increased contact and interaction with NESs and higher English proficiency
levels among Spanish immigrants in Canada. A 2009 study of Chinese immigrants to Canada
indicated a strong relationship between social closeness with the target language group and
higher English proficiency levels (Jiang, Green, Henley, & Masten, 2009). Research also
indicates that an increased proficiency level correlates with NNES ability to adjust to the target
culture (Kang, 2006) . These studies create a connection between language proficiency, social
distance, and interaction with the target language group that Schumann introduced in his original
hypothesis.

10
Social Integration and Interaction
Schumann’s research provided a rationale for investigating the effect language
proficiency has on social closeness between the language learner and target language group. In
this section, two important aspects of social closeness will be discussed: integration and
interaction.
Social integration. Jimenez (2011) provides a manageable definition of integration:
In effect, integration is a culmination of everyday interactions between and among
immigrant newcomers and host communities. Integration is also an endpoint
reached when individuals only minimally perceive themselves and others in
ethnoracial and national terms, when these attributes have, at most, a negligible
negative impact on opportunities and life chances. (p. 4)
The term “integration” is used in contrast to “assimilation”, a term that usually refers to a
minority group’s loss of language, culture and identity due to pressure from the dominant group
(Berry, 1980; Kraut et al., 2007) . Integration allows for multiculturalism and additive
bilingualism. Integration is usually the preferred form of interaction between dominant and non-
dominant groups because it can help prevent negative attitudes on the side of the non-dominant
group, which attitudes can be detrimental to language acquisition. Also, immigrants who adopt
an integrative view of acculturation (the adoption of the behavior patterns of the surrounding
culture) may have higher overall proficiency levels than learners who adopt an assimilative mode
of acculturation (Masgoret & Gardner, 1999).
Language skills and social integration. In a report titled “Language Skills and the Social
Integration of Canada’s Adult Immigrants,” Derwing & Waugh (2012) cite “racism,

11
ethnocultural residential concentration and institutional barriers in the health care and education
system” (p. 4) as a few of the many factors that can affect the social integration of immigrants.
The authors go on to argue that basic language abilities are the most fundamental skills required
for integration; however, they are not able to define how proficient an immigrant would need to
be:
There is also an underlying assumption that, for an immigrant to be socially integrated in
Canadian society, he or she must be relatively proficient in an official language. The
federal Language Instruction for Newcomers to Canada (LINC) is based on the premise
that at least a rudimentary knowledge of an official language is central to integration. (p.
4)
The assumption that low linguistic proficiency is a barrier to integration is also supported
by Xue (2007) who studied the social integration of 7,700 immigrants to Canada. Xue found
that four years after arriving in Canada, immigrants still reported that the “lack of knowledge of
one of Canada’s official languages was the most serious problem faced by refugees and other
economic immigrants (25% and 22% respectively)” (p. 7).
If immigrants are frustrated by their perceived proficiency levels, as Xue’s study suggests,
then it is possible that native speakers in the country also feel some level of frustration, and these
frustration levels could be affecting integration. The benefits of an immigrant’s ability to
integrate into the dominant society scaffold one another. For example, as linguistic integration
improves, education and socioeconomic opportunities improve. Socioeconomic status correlates
strongly with intermarriage, which provides access to the dominant society and thus more
benefits associated with that connection (Jimenez, 2011).

12
For most immigrant groups, “full integration is taking more than one generation”
(Jimenez, 2011, p. 6). While it is encouraging that integration is possible for second and third
generation immigrants, it highlights the fact that first generation immigrants are not receiving the
same social and economic benefits that their children will. A better understanding of how
integration is affected by language proficiency could decrease the amount of time required to
integrate.
Social interaction. Integration is a “culmination of interaction” (Jimenez, 2011, p. 4),
and like integration, interaction provides many social and economic benefits. In 1973,
Granovetter wrote “The Strength of Weak Ties” which discussed the importance of casual
acquaintances in a social system. “Weak ties”, or acquaintances, have the power to bridge social
networks and provide members of separate communities access to the benefits of another social
group. These benefits can include connections to employment opportunities, accelerated spread
of information, new ideas and perspectives, and increased political involvement. As people are
most likely to create close relationships with those who are most similar to themselves, these
acquaintance bridges, or weak ties, between communities connect people who are significantly
different from one another (Granovetter, 1983).
Language acquisition can be affected by the development of these acquaintance
relationships: “Linguistic change is slow to the extent that the relevant populations are well
established and bound by strong ties, whereas it is rapid to the extent that weak ties exist in the
population” (Milroy & Milroy, 1985, p. 375). It is possible that if weak ties are fostered
between NES and NNES communities through interaction, that language acquisition could be
facilitated.

13
Social interaction and language acquisition. Gareis, Merkin, and Goldman (2011)
studied 127 NNES students studying abroad in the US to discover correlations between the
number and strength of American friendships, the participants willingness to communicate and
their proficiency level. They did not find a significant correlation between willingness to
communicate in English and number of American friendships. This suggests that these learners’
communities had greater control over their opportunities to create friendship and use language
than the learners did. This supports Schumann’s 1976 theory that it is the learner’s community,
rather than the learner, that has the greatest control over ultimate language attainment levels. In
addition, the researchers found a positive relationship between number of American friendships,
strength of American friendships, and English proficiency. This suggests that proficiency may be
a more important variable than willingness to communicate in the development of intercultural
friendships.
Hernandez (2010) studied the effect of interaction on oral proficiency gains in a study
abroad context. He tested the hypothesis that integrative motivation (wanting to acquire the
language in order to interact with members of the target language society) would foster L2
acquisition. Participants were NES university students from the US enrolled in a semester long
study abroad in Spain who had at least four semesters of Spanish instruction and did not speak
Spanish at home. Pre and post simulated oral proficiency interviews (SOPI) were administered.
Using a modified version of the Language Contact Profile created by Freed, Dewey, Segalowitz,
and Halter (2004), students reported their level of interaction with the L2 culture. A regression
analysis showed that “student interaction with L2 culture was a significant factor in language
improvement, accounting for 48% of the variance of pretest to posttest SOPI gains” (p. 606).

14
There are significant differences between study abroad participants and immigrants in the
US, including constraints on time, amount of classroom instruction, and average age. However,
these results provide interesting insight into the possible connection between the amount of time
spent interacting with the target language group and oral proficiency gains. Additionally, these
studies illustrate the important role NESs may play in the interaction opportunities available to
NNES.
NES Perceptions of NNES Proficiency
As with any type of communication, interactions between NESs and NNESs require
cooperation from both parties. In this section, current research on how NES perceive nonnative
speech and the effect this may have on interaction between the two groups is discussed.
Public knowledge about language acquisition and proficiency. As a whole, people in
the United States are generally uninformed or ill-informed about language acquisition processes.
Dicker (2003) suggests that this could be caused by the fact that “Americans rarely need to
acquire proficiency in a second language, [so] they find it difficult to understand why recent
immigrants struggle so much with learning English” (p. 83). As many Americans are generations
removed from their immigrant ancestors, it is easy for someone to imagine their great-
grandparents mastering English quickly and by choice. This belief juxtaposed with the reality of
millions of immigrants learning English in the US today, can make people skeptical about
NNESs’ willingness to learn English and create a feeling of impatience with current NNES
proficiency levels, perhaps even fostering unrealistic expectations for NNESs.
Adding to public unawareness of language acquisition processes and realities is the fact
that despite the large amount of research on the topic, findings are rarely communicated to the

15
general public (Dicker, 2003). Research on language acquisition is not reported in newspapers as
often as research from other fields. When information is communicated to the public, it is often
presented with a bias that is at best caused by a misunderstanding of the complexities of second
language acquisition and at worst used as a means to promote a specific political platform (Santa
Ana, 2002; “The Candidate from Xenophobia,” 2010) .
NES judgments of nonnative speech. In general, listeners are highly sensitive to
nonnative speech in that they can distinguish a nonnative speaker from a native speaker from
only a few seconds of interaction. In fact, Munro, Derwing, and Burgess (2010) found that
NESs could detect nonnative speech from listening to a single word.
Beyond the recognition of nonnative speech, NESs also make judgments about the
speaker. Certain native languages and foreign accents are viewed as less prestigious and are
associated with negative evaluations of proficiency over more prestigious languages (Lindemann,
2005). Research has also showed a connection between low oral proficiency levels and negative
personality judgments (Llurda, 1993 & 2000). It is possible that these negative judgments are
affecting communication experiences between the two groups. In their research on linguistic
stereotyping, Kang and Rubin (2009) stated that “NS judgments of NNS speech are notoriously
biased. NS listeners often hear what they expect to hear rather than accurately perceive NNS
speech. And what they expect to hear is often quite unsatisfactory” (p. 451). It is possible to
assume that these negative associations with NNES could affect interaction between the two
groups.
Effect on interaction. Derwing and Munro (2009) took a closer look at how interaction
in the workplace is affected by perceived comprehensibility on the part of the NES. Qualitative

16
data revealed that NNES immigrants in the workplace were being assigned group tasks with
other NNES immigrants (Immigrants from Russia and China to Canada) rather than to groups
with NES coworkers. The immigrants assumed this happened because of the perceived
proficiency and comprehensibility of the NNES.
Lindemann (2002) conducted a study to discover if NESs negative attitudes toward their
NNES conversation partner negatively affected their ability to understand the NNES. NESs were
put in partnerships with native Korean speakers and asked to complete a task that required
interaction. NESs also completed an attitude measurement task to discover if they held generally
positive or negative attitudes toward Koreans. All interaction between the partners was recorded
and coded. Many of the NESs who reported having negative attitudes toward their NNES partner
showed signs of “problematizing their partner’s utterances” by “delaying or omitting
acknowledgement that they have understood their NNES partner’s contribution” (p. 431).
In the same study, Lindemann also found a direct relationship between NES attitude
toward Korean speakers and the NES perception of how successfully they were able to
accomplish the task as a pair. She found that negative attitudes toward a language group affected
a listener’s ability to comprehend the non-native speaker, regardless of how proficient the NNES
actually was. In the study she states:
Non-linguists typically attribute any difficulties they have in understanding a non-native
speaker to that speaker’s language skills. The listener’s role, while clearly important, is
generally ignored by those who claim that the NNS is unintelligible. The claim that a
given NNS is difficult to understand often rests on the assumption that it is solely the
speaker’s responsibility to get her point across. (p. 419)

17
Derwing, Rossiter, and Munro (2002) questioned this notion by attempting to discover
if it was possible to teach native speakers to listen to and understand foreign-accented speech.
Specifically, they focused on the effect of cross-cultural awareness training and explicit accent
instruction on attitudes toward and comprehension of nonnative speech. Participants completed
listening comprehension passages with Vietnamese-accented speech before and after instruction.
Qualitative data from the study revealed that instruction increased participant’s
confidence in their ability to comprehend Vietnamese-accented speech. Participants reported
actively having used information from the instruction to improve their comprehension. In
addition, they reported an increase in empathy for and willingness to talk to people with accented
speech. The authors propose that these trainings “unlocked existing ability to comprehend
accented speech by reducing their fear” (256). As well, most participants strongly agreed with
the statement that accent instruction could help individuals working with NNESs. The authors
concluded that “students who received the accent instruction came away with a clearer sense of
the immensity of the language learning task faced by L2 newcomers” (256). In sum, they found
that accent instruction and cross-cultural awareness training had a strong positive effect on the
NESs willingness to interact with NNESs. These findings suggest that it may be possible to
relatively quickly teach NES to be more sympathetic listeners while simultaneously improving
willingness to communicate between the two groups.
Summary
This chapter reported on the theories, topics, and studies that provide the basis for the
rationale of this study. This study will attempt to discover the connection between NNES oral
proficiency and NES level of comfort during interaction. The rationale for this study is based on
research that establishes a connection between social closeness and ultimate language attainment

18
levels. Current research on NES perceptions of NNES proficiency were reported to provide
context and reveal a gap in research. Specifically, more research is needed to inform on NES
proficiency expectations for NNES and how these expectations are affecting level of comfort
during interaction. A more concrete and explicit understanding of NES proficiency expectations
for NNES is necessary to avoid confusion and facilitate interaction.

19
Chapter 3: Research Design
As mentioned in Chapter 1, the research questions for this study are three-fold:
1) What proficiency level do NNESs need to achieve in order for NES to feel
comfortable interacting with them?
2) Do NES proficiency expectations for NNESs change depending on communication
task?
3) Do NES proficiency expectations for NNESs change based on NES demographic
variables?
This chapter reports on the methodology employed to address the research questions.
Study participants, instruments, data collection, and data analysis procedures are described in
detail.
Participants
Participants in this study were classified into two groups: listeners and speakers.
Listeners. Listeners in this study consisted of 120 NESs volunteers: 60 were female and
60 were male. All were native English speakers 18 years of age or older. All listeners reported
normal hearing capabilities. This group of participants completed an online survey that included
sound clips from the speakers. They were asked to listen to the sound clips and rate their level of
comfort if they were to interact with the speakers. The survey is described in more detail in the
materials section of this chapter. The complete survey is presented in Appendix A.
Whole group and sampling. Listeners in this study were randomly selected from a panel
of native English speakers living inside the US who were 18 years of age or older and had access
to a computer and internet connection. The population was comprised of people who had signed

20
up to complete surveys through a panel creation company, Survey Sampling International
(www.surveysampling.com). Each person in this group had an equal chance of being sent the
survey link through e-mail.
In order to achieve an equal gender split for data analysis, gender quotas were placed on
the survey (60 male and 60 female complete responses). The survey was closed after 120
complete responses had been gathered. Those who were near a computer and internet connection
at the time the survey was sent were more likely to have completed their response before the
quotas were satisfied. This means that those who were not able to take the quiz at the time the
survey link was e-mailed were much less likely to have had the chance to complete the survey
before the quotas were fulfilled, and thus not be included in the final data set. Consequently, the
selection of survey responses was not completely random.
Survey Sampling International (SSI) dispersed the survey electronically. SSI is the largest
panel creation company in the world and serves more than 3,000 companies and research
institutions worldwide, including Gallup, Inc., (“FAQs,” “Our Company,” 2013). SSI is regularly
audited by independent third party groups, including a yearly audit by Ernst & Young, a
prominent American accounting firm (“Our Company,” 2013).
While SSI does not report how much each listener was paid for completing the survey,
information from their website states that they attract respondents by “providing participants
with customized, motivating incentives” (“Sample,” 2013). The website lists the following as
incentives for signing up to be available to take surveys: “Win up to $10,000 in our quarterly
prize draw; earn prize draw entries every time you participate in a survey, get cash rewards and

21
more!” (“Join Our Panel,” 2013) While these explanations of compensation are not very specific,
they give a general idea into how panel participants might be reimbursed for their time.
SSI has policies and procedures in place to increase the integrity of their sampling
method. They employ a data validation system that cross-checks and confirms key identity data
for participants, including name, address, and date of birth. They attempt to alleviate possible
participant bias by offering rewards that agree with the amount of time and work required to
complete the survey. In order to determine the best ratio between reward and time spent taking
surveys, “SSI conducts continuous research to understand which rewards are most effective in
incenting participants while maintaining research data quality” (“Choosing the Right Mode:
Online,” 2013).
Other specific procedures SSI employs to maintain data integrity include:
• Digital fingerprinting (including validating IP addresses)
• Timestamps to avoid “speeders” (completing the survey quickly and without
thought or attention)
• Checks to identify “straight liners” (choosing the same answer for every question)
• Quality control questions to identify inattention
Despite the actions that SSI has taken to provide a quality sample, validity issues still
exist with this type of sampling technique. Possible problems with this type of sample are
discussed in chapter 5.
Speakers. The speakers in this study were seven English as a Second Language (ESL)
learners who were students at Brigham Young University’s English Language Center (ELC)
during winter semester (January to April) 2012. Speakers were chosen from a group of possible
22
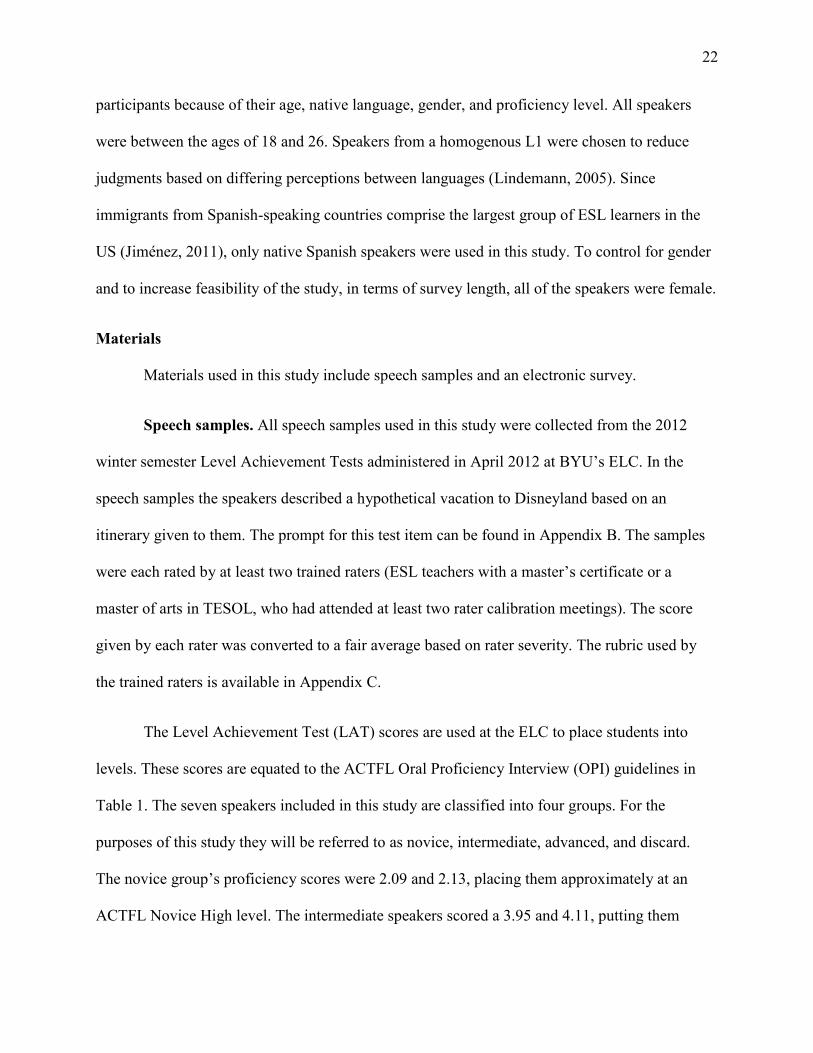
participants because of their age, native language, gender, and proficiency level. All speakers
were between the ages of 18 and 26. Speakers from a homogenous L1 were chosen to reduce
judgments based on differing perceptions between languages (Lindemann, 2005). Since
immigrants from Spanish-speaking countries comprise the largest group of ESL learners in the
US (Jiménez, 2011), only native Spanish speakers were used in this study. To control for gender
and to increase feasibility of the study, in terms of survey length, all of the speakers were female.
Materials
Materials used in this study include speech samples and an electronic survey.
Speech samples. All speech samples used in this study were collected from the 2012
winter semester Level Achievement Tests administered in April 2012 at BYU’s ELC. In the
speech samples the speakers described a hypothetical vacation to Disneyland based on an
itinerary given to them. The prompt for this test item can be found in Appendix B. The samples
were each rated by at least two trained raters (ESL teachers with a master’s certificate or a
master of arts in TESOL, who had attended at least two rater calibration meetings). The score
given by each rater was converted to a fair average based on rater severity. The rubric used by
the trained raters is available in Appendix C.
The Level Achievement Test (LAT) scores are used at the ELC to place students into
levels. These scores are equated to the ACTFL Oral Proficiency Interview (OPI) guidelines in
Table 1. The seven speakers included in this study are classified into four groups. For the
purposes of this study they will be referred to as novice, intermediate, advanced, and discard.
The novice group’s proficiency scores were 2.09 and 2.13, placing them approximately at an
ACTFL Novice High level. The intermediate speakers scored a 3.95 and 4.11, putting them

23
roughly at an Intermediate Low/Intermediate Mid-level. The most advanced speakers received a
5.11 and 5.47 score, placing them at an Intermediate High. Table 2 provides the scores for each
group used in the study.
Table 1 Comparison of ACTFL Proficiency Levels and ELC LAT Speaking Scores for the Speakers
ACTFL Level ELC Speaking LAT Scores Novice Low 0 Novice Mid 1 Novice High 2 Intermediate Low 3 Intermediate Mid 4 Intermediate High 5 Advanced Low 6
Table 2 Speaker LAT Proficiency Scores, Group Classification, and Approximate ACTFL Equivalency
Group Classification ELC speaking LAT Score
Average group score Approximate ACTFL equivalency
Novice 2.09 2.11 Novice High Novice 2.13 Intermediate 3.95 4.03 Intermediate Mid Intermediate 4.11 Advanced 5.11 5.29 Intermediate High Advanced 5.47 Discard 4.39 4.39 Intermediate Mid
The fourth group (discard) includes only one speaker and was used for the purpose of
control. The proficiency level of this speaker was 4.39, or Intermediate Mid. This speaker was
presented first for each listener and was included as a means to control for listener familiarity
with speaker prompt and judgment tasks, issues with volume control, and initial acclimation to

24
nonnative English speech. All ratings for this speaker were discarded before the data analysis.
After rating this initial speaker, listeners rated the remaining six speech samples presented in
random order.
In order to maintain conformity, the proficiency levels used in this study will be referred
to as novice, intermediate, and advanced. However, these labels are for organization purposes
only and are not meant to be interpreted as being equivalent to ACTFL proficiency levels.
ACTFL equivalencies are provided only as a reference. Teachers who rated the speech samples
were not ACTFL certified raters, thus equivalencies are only approximate. It is important to note
that although the highest proficiency group studied is referred to as “advanced”, the speakers in
this group were rated at an Intermediate High level on the ACTFL scale.
Stimulus preparation. In order to control for judgments based on differences in pitch and
intensity (volume) levels, these samples were perceptually analyzed using Audacity (a sound
analysis and editing software). Pitch and intensity levels were adjusted as necessary to achieve
similar levels. To decrease survey length and increase listener participation and survey
practicality, the first 15 seconds of each sound file was used instead of the complete 45 second
file. In order to be compatible with most computer devices, files were converted to both WAV
and MP3 format using Audacity.
Survey. A survey was created through Qualtrics, an electronic survey service
(www.qualtrics.com). A copy of the survey is available in Appendix A. Participants were asked
to listen to each speaker and rate how comfortable they would feel communicating in English
with the speaker in a variety of situations or tasks (presented in Table 3). A scale of 0-10 was
used; a rating of 10 indicated the listener reported that they would be “very comfortable”

25
interacting with the speaker. The tasks included were created by the researcher under the
advisement of the thesis committee. The first three tasks are based on questions in the Montréal
Inventory of Linguistic Integration (Segalowitz & Ryder, 2006). Tasks were chosen to represent
a variety of communication and interaction situations, settings, and relationships.
After listening to each sound clip and rating their comfort level, the listeners were asked
if they had any problems with the sound clip. If participants selected that they could not play the
sound clip, or the sound clip was too quiet, their ratings were discarded.
Demographic information pertinent to the research questions was also collected. This
included the listener’s gender, age-range, highest level of education, frequency of interactions
with NNESs, foreign language study, and time spent living abroad. Although not a variable
mentioned in the research questions, information on state of residency was also collected. This
served two purposes. First, this helped ensure that the survey was being sent out to and answered
by people from a variety of regions in the US. Second, since the survey was dispersed across the
US, data on listener location was gathered in the event that state of residency was a variable that
could be analyzed in a future study.
Open-ended questions were included to gather qualitative data on the research questions.
The two open-response questions are as follows: 1) If you answered that you would feel
uncomfortable (or less comfortable) interacting with one or more of the speakers in certain tasks
or situations, what was it about their speech that made you feel uncomfortable (or less
comfortable)? 2) How are you interactions with non-native English speakers affected by their
language abilities? In-depth analysis of these responses was beyond the scope of the current

26
research. Force validation (requiring the listener to provide a response) was employed on all of
questions, with the exception of the two open-response items.
Table 3 Communication Tasks
Task #
Task in question form as presented in survey
Question stem: please indicate how comfortable or uncomfortable you would feel participating in the following tasks (in English):
1 having a casual conversation in English with this speaker for at least 10 minutes
2 speaking with this person in English for at least 10 minutes about a topic on which you have some strongly held views (such as religion or current events)
3 inviting this person to a social gathering at your home, such as a barbecue or birthday party
4 ordering food from this person at a restaurant
5 asking this person for help at a grocery or department store
6 discussing a customer service issue with this person over the phone (example: a customer service call center)
7 having this person as a boss or supervisor who you had to communicate with on a daily basis
8 talking to this person during your lunch break if they were your coworker
9 working with this person one-on-one to complete a project or task at work
10 working on a committee together that requires you to communicate often (several times a week) with this person
Rationale for communication tasks. Communications tasks in this study were chosen to
represent a variety of possible interactions between NESs and NNESs. The purpose of task one

27
was to represent a casual conversation, however a minimum time limit (10 minutes) was
included to exclude basic greetings and routine and formulaic conversations. Task two
introduced the variables of topic and emotion within the context of a casual conversation. Task
three was chosen to discover if the listener would feel comfortable interacting with speaker while
surrounded by the listener’s own friends and family. Segalowitz & Ryder (2006) found these
three aforementioned communication tasks to be indicative of linguistic integration.
Tasks four through six were aimed at customer service situations, as many immigrants
work in customer service positions. Moreover, the variable of face to face versus over the phone
interaction is addressed in this block of questions. Tasks seven through nine focus specifically on
interaction in the workplace, as this is an area of current interest and research (Derwing & Munro,
2009). Power relationships are explored in task seven. Task eight returns to the topic of casual
conversations, albeit with the added variable of a shared workplace. Task nine was chosen to
investigate how shared responsibilities between NESs and NNESs in a work setting affect
proficiency expectations. Finally, task ten was chosen to inform on expectations for proficiency
level during group or committee work, regardless of setting.
Procedure
Data collection. Data were collected over two days, April 4th – 5th 2013. A soft launch
of the survey took place on April 4th. 11 responses were gathered that day. The purpose of the
soft launch was to bring attention to any unforeseen issues with the survey. The survey fully
launched on April 5th. After all quotas were met, the survey was closed. The survey was
distributed by Survey Sampling International (described in the participants section).

28
Participants were screened out of the study if they did not give their informed consent,
were not a native English speaker, were younger than 18 years of age, did not have normal
hearing capabilities, and/or if they responded that they were not able to play the sound clips.
Data Analysis. This section will outline the procedures used to analyze the quantitative
data obtained from the survey. First, the variables of the study will be defined. Then, the
statistical treatments used to address the research questions will be described.
The variables. Table 4 describes the variables in this study.
Table 4 Dependent and Independent Variables
Variable Name Description
Type
Listener (NES) ratings
Listeners ratings of their level of comfort interacting with speaker (on a scale of 0-10)
Dependent
Speaker (NNES) proficiency level
Speakers approximate proficiency level, based on the ELC’s LAT scores
Independent
Listener (NES) Variables
Listener demographic information, including gender, age range, highest level of education attained, frequency of interaction with NNESs, foreign language study, and time spent living abroad
Independent
Communication tasks
Hypothetical communication and interaction settings that listeners rated their level of comfort participating in with the NNES. These tasks are described in detail in Table 3
Independent
29
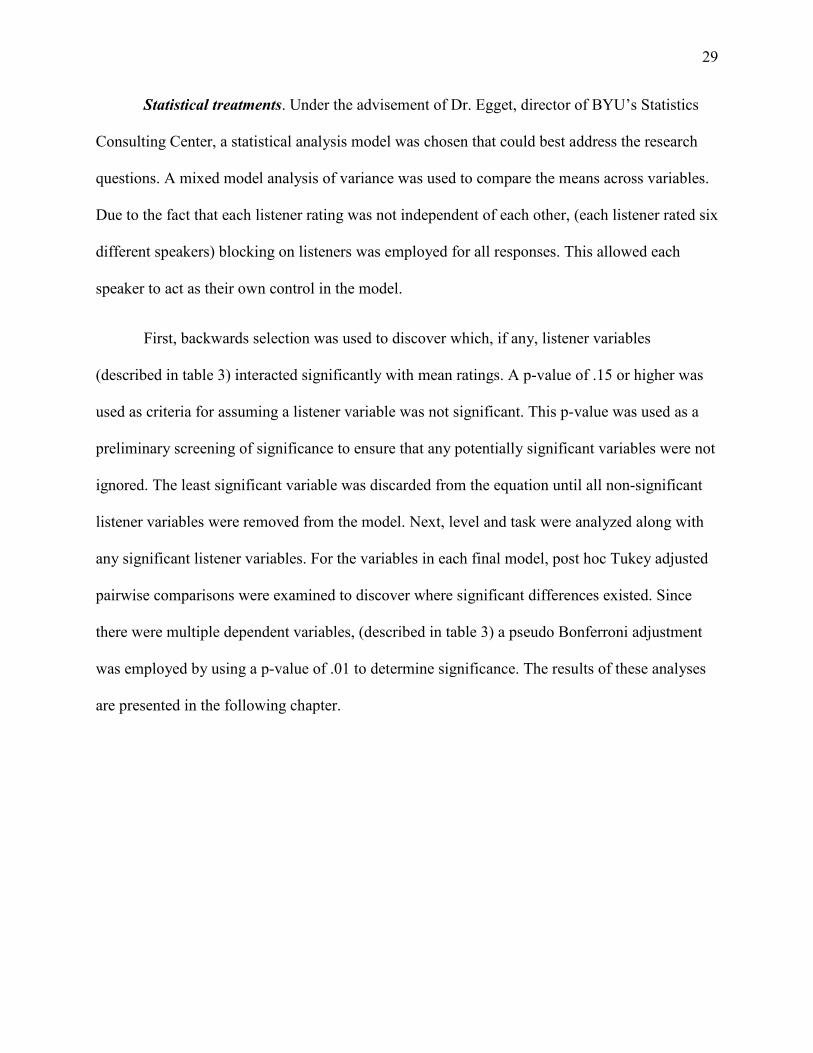
Statistical treatments. Under the advisement of Dr. Egget, director of BYU’s Statistics
Consulting Center, a statistical analysis model was chosen that could best address the research
questions. A mixed model analysis of variance was used to compare the means across variables.
Due to the fact that each listener rating was not independent of each other, (each listener rated six
different speakers) blocking on listeners was employed for all responses. This allowed each
speaker to act as their own control in the model.
First, backwards selection was used to discover which, if any, listener variables
(described in table 3) interacted significantly with mean ratings. A p-value of .15 or higher was
used as criteria for assuming a listener variable was not significant. This p-value was used as a
preliminary screening of significance to ensure that any potentially significant variables were not
ignored. The least significant variable was discarded from the equation until all non-significant
listener variables were removed from the model. Next, level and task were analyzed along with
any significant listener variables. For the variables in each final model, post hoc Tukey adjusted
pairwise comparisons were examined to discover where significant differences existed. Since
there were multiple dependent variables, (described in table 3) a pseudo Bonferroni adjustment
was employed by using a p-value of .01 to determine significance. The results of these analyses
are presented in the following chapter.

30
Chapter 4: Results
This chapter reports the results of the statistical treatment employed to analyze the
quantitative survey responses. The statistical analyses used in this study are described in Chapter
3. A discussion and interpretation of these results is found in Chapter 5.
The results are organized by research question. There were three main research questions
for this study:
1) What proficiency level do NNESs need to achieve in order for NES to feel
comfortable interacting with them?
2) Do NES proficiency expectations for NNESs change depending on communication
task?
3) Do NES proficiency expectations for NNESs change based on NES demographic
variables?
Research Question 1: Effect of speaker proficiency level on listener comfort ratings
1) What proficiency level do NNESs need to achieve in order for NESs to feel
comfortable interacting with them?
The first research question focused on discovering if listeners have a preferred, or
threshold, proficiency level, regardless of communication task. NES listeners rated their comfort
level (ratings were on a scale of 0-10; 0 = very uncomfortable, 10 = very comfortable)
interacting with NNESs in 10 communication tasks. A mixed models analysis of variance was
completed on mean ratings for all tasks to discover if speaker proficiency level was significant.
A statistically significant difference was found between the three proficiency levels, F (2, 3448)
= 114.01, p=<.0001. Post hoc Tukey tests indicated that mean ratings for the novice proficiency

31
group differed significantly from the intermediate (p=<.0001) and advanced proficiency groups
(p=<.0001). There was not a significant difference found between mean ratings for the
intermediate and advanced speakers (p=.02). Table 5 shows the mean ratings (adjusted for task)
and standard error for the three proficiency groups. The data in table 5 suggest that the
intermediate speakers may represent a threshold level.
Table 5 Mean Listener Ratings across Proficiency Levels
Speaker proficiency level group
Mean rating across all tasks
Standard error
Novice 6.00 .073
Intermediate 7.18 .074
Advanced 7.46 .072
Note: Means are adjusted for task
Research Question 2: Effect of communication task on mean ratings
2) Do NES proficiency expectations for NNESs change depending on communication
task?
The second research question was concerned with the effect of communication task on
mean ratings. Mean ratings for each communication task across all proficiency levels were
analyzed to discover if ratings were significantly different between tasks (ratings were adjusted
for proficiency level). Post hoc Tukey tests revealed a statistically significant difference between
tasks, F (9, 2448) = 7.81, p=<.01, indicating that certain tasks had a main effect on mean rating.
Table 6 shows the mean ratings and standard error for the 10 communication tasks. Tasks are
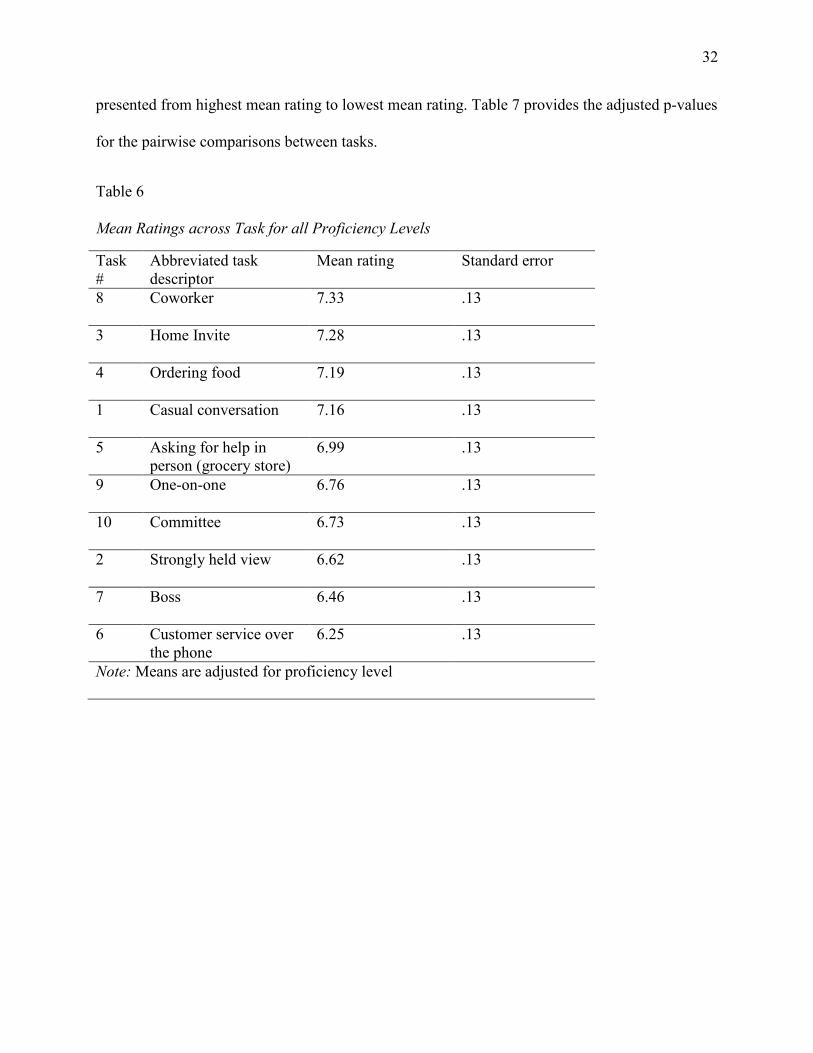
32
presented from highest mean rating to lowest mean rating. Table 7 provides the adjusted p-values
for the pairwise comparisons between tasks.
Table 6 Mean Ratings across Task for all Proficiency Levels
Task #
Abbreviated task descriptor
Mean rating Standard error
8 Coworker 7.33 .13
3 Home Invite 7.28 .13
4 Ordering food 7.19 .13
1 Casual conversation 7.16 .13
5 Asking for help in person (grocery store)
6.99 .13
9 One-on-one 6.76 .13
10 Committee 6.73 .13
2 Strongly held view 6.62 .13
7 Boss 6.46 .13
6 Customer service over the phone
6.25 .13
Note: Means are adjusted for proficiency level

33
Table 7 Pairwise Comparison of Post Hoc Tukey Adjusted P-values across Tasks
Task # Task # Adj. P-values 1 2 0.1172 3 0.9993 4 1.0000 5 0.9967 6* <.0001* 7* 0.0077* 8 0.9953 9 0.5287 10 0.4025 2 3 0.0119 4 0.0754 5 0.6230 6 0.6242 7 0.9975 8* 0.0058* 9 0.9990 10 0.9999 3 4 0.9999 5 0.8315 6* <.0001* 7* 0.0004* 8 1.0000 9 0.1243 10 0.0765 4 5 0.9884 6* <.0001* 7* 0.0041* 8 0.9989 9 0.4143 10 0.3002 5 6* 0.0034* 7 0.1280 8 0.7152 9 0.9719 10 0.9320 6 7 0.9844 8* <.0001* 9 0.1631 10 0.2445
(Table 7 continues)

34
(Table 7 continued) Task # Task # Adj. P-values 7 8* <.0001* 9 0.8374
10 0.9143 8 9 0.0732 10 0.0429 9 10 1.0000 Note: *indicates significance at p<.01 level Means used to discover adjusted p-values were adjusted for proficiency level
There was a significant main effect for proficiency level on mean ratings for task, in that
the advanced and intermediate speakers were rated significantly higher than the novice level
speakers for each task (p<.01). The only exception to this was task three (inviting the speaker to
your home), which showed a significant difference between mean ratings for the advanced and
novice level speakers (p<.0001), but not the intermediate and novice level speakers (p=.011).
Table 8 provides the mean rating and standard error for each task across the three proficiency
levels. Certain task ratings are adjusted for listener variables that showed possible significance at
p<.15 during model creation. Figure 1 is a visual representation of how mean ratings for each
proficiency level changed depending on task.
35
Table 8 Mean Ratings and Standard Error for Task across Proficiency Levels
Novice Intermediate Advanced
Task # Abbreviated task descriptor Mean
Std. Error Mean
Std. Error Mean
Std. Error
1*† Casual conversation 6.01 .289 7.09 .288 7.42 .285
10 Committee 5.82 .230 7.05 .234 7.31 .230
2† Strongly held view 5.53 .258 6.73 .261 7.08 .257
3 Home Invite 6.57 .337 7.55 .334 7.77 .336
4*‡ Ordering food 5.61 .285 6.73 .289 7.00 .284
5 Asking for help in person (grocery store)
6.10 .228 7.24 .232 7.63 .227
6* Customer service over the phone
4.68 .282 6.09 .285 6.41 .280
7* Boss 4.84 .292 6.13 .295 6.40 .291
8‡ Coworker 6.27 .241 7.45 .244 7.66 .240
9 One-on-one 5.89 .230 7.09 .234 7.31 .230
Note: Some task ratings were adjusted for listener variables that appeared significant at a p<.15 level during the model creation stage. * indicates ratings were adjusted for age, † indicates that ratings were adjusted for amount of interaction with NNES, ‡ indicates ratings were adjusted for foreign language learning experience.

36
Figure 1. Mean Ratings across Tasks and Proficiency Levels
Research Question 3: Effect of listener variables on mean ratings
3) Do NES proficiency expectations for NNESs change based on NES variables?
A mixed model analysis of variance revealed that listener variables did not have a
significant effect on overall ratings across proficiency levels when all tasks were averaged (p-
value range .2 - .97). Appendix D provides a table with the degrees of freedom, F-values, and p-
values for the insignificant main effect of listener variables on mean ratings. Some listener
variables had a main effect on mean ratings when task was looked at individually. Specifically,
analysis of mean ratings for tasks 1, 2, 4, 6, 7, and 8 revealed certain listener demographics to be
moderating variables. These results are discussed in order of task.
0
1
2
3
4
5
6
7
8
9
1 2 3 4 5 6 7 8 9 10
Mea
n Li
sten
er C
omfo
rt L
evel
Rat
ings
Communication Task #
Novice
Intermediate
Advanced

37
Task 1: Casual conversation for at least 10 minutes. The listener demographic
variables of age range and frequency of interaction with NNESs had a significant effect on mean
ratings for task one, F (5, 332) = 4.65, p=.0004; F (6, 332) = 5.79, p<.0001.
Age range. Post-hoc Tukey tests revealed that listeners in age range 26-35 rated speakers
significantly higher than speakers in age range 36-45, F (5, 332) = 4.65, p<.0001). Table 9
presents the mean rating and standard of error for each age range for task one. Table 10 provides
the adjusted p-values for the pairwise comparisons between age ranges.
Table 9 Mean Ratings across Age Ranges for Task One
Age Range N Mean rating on task Standard Error 18-25 25 7.03 .297 26-35 39 7.69 .239 36-45 22 5.93 .300 46-55 23 6.99 .314 56-65 9 6.70 .475 66+ 2 6.76 .945

38
Table 10 Pairwise Comparison of Post Hoc Tukey Adjusted P-values across Age Ranges for Task One
Age Range Age Range Adj. P-values 18-25 26-35 0.5250 36-45 0.0505 46-55 1.0000 56-65 0.9888 66 + 0.9997 26-35 36-45* <.0001* 46-55 0.4812 56-56 0.4188 66+ 0.9431 36-45 46-55 0.0914 56-65 0.7328 66+ 0.9597 46-55 56-65 0.9940 66+ 0.9999 56-65 66+ 1.0000 Note: *indicates significance at p<.01 level Means used to discover adjusted p-values were adjusted for proficiency level and communication task
Frequency of interaction with NNESs. Post hoc Tukey tests showed that listeners who
reported interacting with NNESs once a month rated speakers significantly lower than listeners
who reported interacting with NNESs once a week, 2-3 times a week, and daily, F (6, 332) =
12.74, p<.0001, p=.001, p<.0001 respectively). Table 11 reports the mean ratings and standard
error across interaction categories for task one. Table 12 provides the adjusted p-values for the
pairwise comparisons across interaction categories.

39
Table 11 Mean Ratings across NNES Interaction Categories for Task One
Interaction category (How often do you interact with NNESs?)
N Mean rating on task Standard error
Never 2 6.31 .932 Less than Once a Month 21 6.55 .306 Once a Month 12 5.44 .412 2-3 Times a Month 23 6.66 .312 Once a Week 19 7.79 .350 2-3 Times a Week 20 7.40 .344 Daily 23 7.74 .336
Table 12 Pairwise Comparison of Post Hoc Tukey Adjusted P-values across NNES Interaction Categories for Task one
Interaction Category Interaction Category Adj. P-values Never < Once a Month 1.0000 Once a Month 0.9742 2-3 Times a Month 0.9998 Once a Week 0.7272 2-3 Times a Week 0.9171 Daily 0.7520 < Once a Month Once a Month 0.2280 2-3 Times a Month 1.0000 Once a Week 0.0572 2-3 Times a Week 0.3981 Daily 0.0619 Once a Month 2-3 Times a Month 0.1347 Once a Week* <.0001* 2-3 Times a Week* 0.0010* Daily* <.0001* 2-3 Times a Month Once a Week 0.1302 2-3 Times a Week 0.6048 Daily 0.1533 Once a Week 2-3 Times a Week 0.9697 Daily 1.0000 2-3 Times a Week Daily 0.9697 Note: *indicates significance at p<.01 level Means used to discover adjusted p-values were adjusted for proficiency level and communication task

40
Task 2: Conversation on a topic that you have a strongly held view on. The listener
demographic variable of frequency of interaction with NNESs had a significant effect on mean
ratings for task two, F (6, 337) = 4.50, p=.0002
Frequency of interaction with NNESs. Post hoc Tukey tests showed that listeners who
reported interacting with NNESs less than once a month rated speakers significantly lower than
listeners who reported interacting with NNESs once a week and daily, F (6, 337) = 4.50, p=.0058,
p=.0031 respectively). Table 13 reports the mean ratings and standard error across interaction
categories for task two. Table 14 provides the adjusted p-values for the pairwise comparisons
across interaction categories.
Table 13 Mean Ratings across NNES Interaction Categories for Task Two
Interaction category (How often do you interaction with NNESs?)
N Mean rating on task Standard error
Never 2 5.67 .982 Less than Once a Month 21 5.75 .307 Once a Month 12 5.67 .407 2-3 Times a Month 23 6.47 .304 Once a Week 19 7.38 .328 2-3 Times a Week 20 6.82 .315 Daily 23 7.39 .302

41
Table 14 Pairwise Comparison of Post Hoc Tukey Adjusted P-values across NNES Interaction Categories for Task two
Interaction Category Interaction Category Adj. P-values Never < Once a Month 1.0000 Once a Month 1.0000 2-3 Times a Month 0.9867 Once a Week 0.6461 2-3 Times a Week 0.9224 Daily 0.6342 < Once a Month Once a Month 1.0000 2-3 Times a Month 0.6357 Once a Week* 0.0058* 2-3 Times a Week 0.1850 Daily* 0.0031* Once a Month 2-3 Times a Month 0.6968 Once a Week 0.0195 2-3 Times a Week 0.2768 Daily 0.0134 2-3 Times a Month Once a Week 0.3922 2-3 Times a Week 0.9848 Daily 0.3310 Once a Week 2-3 Times a Week 0.8797 Daily 1.0000 2-3 Times a Week Daily 0.8513 Note: *indicates significance at p<.01 level Means used to discover adjusted p-values were adjusted for proficiency level and communication task
Task 4: Ordering food at a restaurant. The listener demographic variable of age range
had a significant main effect on mean ratings for task four, F (5, 337) = 4.74, p=.0003. Foreign
language learning experience was included in this model as it was significant during model
creation at p<.15. However, post hoc Tukey analysis revealed that foreign language learning
experience did not have a significant main effect on ratings, F (1, 337) = 4.91, p=.0273.
Age range. Post hoc Tukey tests revealed that listeners in age range 46-55 rated speakers
significantly higher than listeners in age range 66+, F (5, 337) = 4.74, p=.0057. Table 15 reports

42
the mean ratings and standard error across interaction categories for task four. Table 16 provides
the adjusted p-values for the pairwise comparisons between age ranges.
Table 15 Mean Ratings across Age Range for Task Four
Age Range N Mean rating on task Standard error 18-25 25 6.92 .303 26-35 39 7.32 .242 36-45 22 6.37 .306 46-55 23 7.72 .299 55-65 9 6.27 .468 66+ 2 4.09 .981
Table 16 Pairwise Comparison of Post Hoc Tukey Adjusted P-values across Age Ranges for Task Four
Age Range Age Range Adj. P-values 18-25 26-35 0.8642 36-45 0.7565 46-55 0.3864 56-65 0.8359 66+ 0.0577 26-35 36-45 0.1076 46-55 0.8944 56-56 0.3160 66+ 0.0160 36-45 46-55 0.0189 56-65 1.0000 66+ 0.2170 46-55 56-65 0.0926 66+* 0.0057* 56-65 66+ 0.3248 Note: *indicates significance at p<.01 level Means used to discover adjusted p-values were adjusted for proficiency level and communication task
Task 6: Customer service over the phone. The listener demographic variable of age
had a significant main effect on mean ratings for task 6, when all age ranges were combined, F

43
(5, 338) = 4.31, p=.0008. Post hoc Tukey analyses showed that differences between individual
age ranges were not significant (p-value range .0147 – 1.000).
Task 7: Boss. The listener demographic variable of age had a significant main effect on
mean ratings for task 7, when all age ranges were combined, F (5, 338) = 4.94, p=.0002.
However, post hoc Tukey analysis revealed that differences between individual age ranges were
not significant (p-value range .0101 – 1.00).
Task 8: Coworker. The listener demographic variable of foreign language learning
experience was analyzed for task 8 because it revealed a p-value of <.15 during model creation.
However, post hoc Tukey analysis showed that this variable did not have a significant main
effect on ratings, F (1, 342) = 5.72, p=.0173

44
Chapter 5: Discussion
The results of this study provide a number of insights into how NNES proficiency level,
communication task, and NES variables affect NES level of comfort during interaction.
Discussion of results is organized by research question. Implications, study limitations, and
suggestions for future research are also discussed.
Research Question 1: Effect of speaker proficiency level on listener comfort ratings
1) What proficiency level do NNESs need to achieve in order for NESs to feel
comfortable interacting with them?
Statistical analyses showed that the mean rating (ratings were on a scale of 0-10; 0 = very
uncomfortable, 10 = very comfortable) for the advanced level speakers (M=7.46) and
intermediate level speakers (M=7.18) were significantly different from the mean ratings for the
novice speakers (M=6.00), when ratings for all communication tasks were combined. This does
not necessarily indicate that listeners were completely comfortable interacting with the advanced
level speakers, but that they were significantly more comfortable interacting with the advanced
and intermediate level speakers compared to the novice speakers.
The lack of a significant difference between the intermediate and advanced speakers
might be partially explained by similarity of proficiency levels between the groups. Table 13
shows that the proficiency scores for the intermediate group were closer to the scores for the
advanced group than to the novice group. This occurred due to the limited pool of speakers
available that matched the necessary demographic variables (female, 18-26, native Spanish
speaker, ELC student during winter 2012). However, NES mean comfort ratings increased as

45
proficiency level increased, suggesting that as the speaker’s proficiency increased, the listener’s
comfort level increased as well.
Table 17 Differences between Average Group Proficiency Scores
Speaker group classification Average proficiency score Difference from other groups Novice 2.11 Intermediate:1.92
Advanced: 3.18 Intermediate 4.03 Novice:1.92
Advanced:1.26 Advanced 5.29 Novice: 3.18
Intermediate:1.26
Additionally, the significant difference between ratings for the novice proficiency group
and the intermediate and advanced proficiency groups could be due to the communicative bridge
that is crossed when a speaker progresses from a novice proficiency level to an intermediate
proficiency level (on the ACTFL scale). As a reminder, the novice speakers in this study roughly
correlated with a Novice High proficiency level, the intermediate speakers were approximately
equivalent to the Intermediate Mid proficiency level, and the advanced speakers were similar to
the Intermediate High proficiency level (on the ACTFL scale). According to ACTFL’s 2012
rubric, one major distinction between novice and intermediate level speakers is that intermediate
level speakers have the ability to “create with the language”, while novice speakers use
“formulaic and rote utterances” (ACTFL, 2012, p. 12). It is possible that the higher ratings for
the intermediate and advanced groups were due to listeners perceiving their ability to create
novel utterances.
The survey instrument neglects to discover a connection between reported level of
comfort and willingness to communicate or interact with the speaker and operates under the

46
assumption that the higher level of comfort a NES listener reports, the more willing they would
be to interact with the NNES speaker. Due to this, there is no “goal” or “standard” comfort level
to use as a standard. One listener may feel that a reported comfort level of 6 indicates that they
would be willing to communicate with the speaker. On the other hand, another listener may not
be willing to communicate in any circumstance where there reported comfort level is less than 10.
With this limitation in mind, the data suggests that since there was not a significant difference
between ratings for the intermediate and advanced proficiency groups, that a minimum expected
proficiency level might be at least an Intermediate-Mid level (equivalent to the score for the
intermediate group) on the ACTFL scale. At this level the comfort ratings began to conflate.
However, this conclusion is limited by the aforementioned problems with the survey instrument.
Research Question 2: Effect of communication task on mean ratings
2) Do NES proficiency expectations for NNESs change depending on communication
task?
In this study, communication task had a significant effect on the listener ratings. Several
communications tasks were rated significantly different from each other. Specifically, task 6
(M=6.25) and 7 (M=6.46) were rated significantly lower than other tasks. Additionally, task 3
and 8 received the highest mean ratings. Possible explanations for these ratings are discussed by
task.
Task 6: Customer service over the phone. Listeners rated task 6 (M=6.25, all
proficiency levels combined) significantly lower than tasks 1 (Casual conversation) (M=7.16), 3
(Home invite) (M=7.28), 4 (Ordering food) (M=7.19), 5 (Asking for help) (M=6.99), and 8
(Coworker) (M=7.33). Even the most advanced speakers received a relatively low mean rating

47
(M=6.41, adjusted for the listener variable of age) for this task, suggesting a high proficiency
expectation for this task compared to other tasks in the survey. Interestingly, task 6 was rated
lower than other customer service related tasks (4 & 5) as well. There are several possible
explanations for this lower rating.
First, task 6 was the only task that did not allow for face to face interaction. This would
prevent listeners from relying on facial cues and gestures to aid comprehension. Several listeners
mentioned lack of visual cues and gestures in the open response questions as reasons why they
would feel uncomfortable completing this communication task with the speaker: “If I am trying
to communicate with someone on the phone, it is vital that they pronounce words correctly and
clearly, since I have no visual cues to help give context to the conversation.” Another listener
said, “If the person is at the beginning stages of learning the language, you have to watch for
facial cues and hand gestures to help with understanding their meaning. It is easier for me to
understand a non-native English speaker in person, vs. over the phone.”
Second, customer service issues over the phone can often deal with expensive or high
stakes topics, such as problems with a credit card or insurance claims. Miscommunication in
these situations would have more serious repercussions than miscommunications in other
customer service situations. A communication break-down at a restaurant or at a grocery store
may result in an incorrect order or loss of time, but probably would not have serious
repercussions on the consumer. One participant noted the high stress of this type of customer
service situation as the reason for their lower comfort level rating: “My biggest hurdle would be
remaining comfortable while trying to resolve a customer service issue I may be having. I am
already in a stressful situation and feel as if the company I am calling should have someone on
the other end that can communicate effectively.”

48
Third, past negative experiences with NNES customer service representatives over the
phone could have affected listener’s ratings. Recently, many US corporations have set up
customer service call centers in foreign-speaking countries in order to reduce costs (Forey &
Lockwood, 2007). This would increase the likelihood that a listener would have had interacted
with a NNES in this type of communication task in the past. Several listeners cited previous
experiences as reasons why they would feel uncomfortable interacting with NNES in this
communication task: “When telemarketers call, and I cannot understand them because they do
not speak English well, it is frustrating, because I often must make them repeat something
several times”. Another listener stated that “I couldn’t understand their [the speakers’] accent and
I don’t like dealing with people on the phone who sound like this”. One listener even said they
avoid calling companies that employ NNES customer service representatives at their call centers:
“I avoid calling places when I know that the people do not speak English very well because they
are very difficult to understand.”
It could be argued that this particular communication task is not worth investigating in
this study, since the communication does not take place between two members of the same
community with opportunities for future communication and integration. However, these
negative interaction experiences could affect a NES willingness to communicate with NNESs in
the future, specifically if these negative experiences cause them to associate low proficiency
levels with feelings of frustration.
Task 7: Having this person as your boss: Listeners rated task 7 (M=6.46, all
proficiency levels combined) significantly lower than tasks 1 (Casual conversation) (M=7.16), 3
(Home invite) (M=7.28), 4 (Ordering food) (M=7.19), and 8 (Coworker) (M=7.33). These lower
ratings suggest a higher proficiency expectation for this communication task compared to other
49
tasks. This might be explained by the fact that the repercussions of miscommunication in this
situation are more serious than in the other situations. If an employee is not able to communicate
effectively with their boss, their performance could be affected, which could ultimately have a
negative impact on their livelihood. One listener mentioned concerns about mutual intelligibility
in the open response questions: “I wasn't sure that I would understand their directions if they
were my boss, and I might not be able to make myself understood by them as I was expressing
myself.”
Additionally, ratings for task 8 (interacting with a NNES coworker) were significantly
higher than ratings for task 7. Tasks 6 and 7 had a similar setting (the workplace), but different
power relationships between the two interlocutors. This suggests that power relationship may
have a significant effect on ratings.
Tasks with the highest average ratings. Task 3 (Home invite) (M=7.28) and task 8
(Coworker) (M=7.33) had the highest mean ratings of all tasks (adjusted for proficiency level).
In addition, these tasks also had highest comfort ratings for novice proficiency speakers (M=6.57,
M=6.27, respectively, task 8 was adjusted for the listener variable of foreign language learning
experience). These results indicate an overall lower proficiency expectation for these tasks. This
is worth noting because both tasks (inviting the speaker to your home for a social gathering,
talking with speaker if they were your coworker, respectively) bode well for the creation of
“weak ties” and friendships within a community.
Research Question 3: Effect of listener variables on mean ratings
3) Do NES proficiency expectations for NNESs change based on NES demographic
variables?

50
Statistical analysis revealed that listener variables did not have a significant effect on
overall ratings across proficiency levels when all tasks were looked at together. However, some
listener variables affected mean ratings when a task was looked at individually. Specifically, the
listener demographic variables of age and frequency of interaction with NNES had a significant
main effect on specific ratings.
Age range. The listener demographic variable of age had a significant main effect on
ratings for task 1 (Casual conversation) and 4 (Ordering food). The effect of age was initially
analyzed for tasks 6 (Customer service over the phone) and 7 (Boss) in addition to tasks 1 and 4
because analyses during model creation revealed a p-value of <.15. However, post hoc Tukey
tests revealed that age was not significant for tasks 6 and 7 (p-value range .0147-1.000, .0101 –
1.000, respectively).
Mean ratings for age range 26-34 (M=7.69) were significantly higher than age range 36-
45 (M=5.93) for task 1 (Casual conversation). For task 4 (Ordering food), mean ratings for age
46-55 (M=7.72) were significantly higher than ratings for age range 66+ (M=4.09). Generally,
older listeners had lower ratings than younger raters, suggesting that younger listeners may be
more comfortable interacting with NNES than older listeners. However, the data did not reveal a
quantifiable relationship between age and mean comfort ratings and task. This result could be
due to sampling, as there were not an equal number of listeners across all age ranges.
Experiences with NNESs. The listener demographic variable of experience with NNESs
had a significant main effect on ratings for task 1 (Casual conversation) and 2 (Strongly held
view).

51
Post-hoc Tukey tests showed that listeners who reported interacting with NNESs once a
month rated speakers significantly lower (M=5.44) on task 1 than listeners who reported
interacting with NNESs once a week, 2-3 times a week, and daily, (M=7.79, 7.40, 7.74,
respectively). For task 2, post hoc Tukey tests revealed that listeners who reported interacting
with NNESs less than once a month rated speakers significantly lower (M = 5.75) than listeners
who reported interacting with NNESs once a week and daily, (M= 7.38, 7.39, respectively).
These data suggest that an increase in frequency of interaction with NNESs may correlate with
decreased proficiency expectations for NNESs.
The qualitative data also supports this assumption. Listeners perceived that they were
able to understand speakers better due to previous interactions with NNESs. One listener
responded by saying that “I feel comfortable [communicating with] all since I have many
experiences with people that have broken English.” Another listener discussed their marriage to a
NNES as rationale for their higher ratings, “Since I am married to a nonnative English speaker I
feel I am more likely to listen and try to understand.”
Implications
Relationship between NES comfort level and NNES proficiency level. There are
several ways to view the relationship between listener comfort level and speaker proficiency.
First, the relationship can be viewed as binary. Figure 2 provides a visual representation of this
type of relationship. NES comfort level is very low until a specific proficiency level is reached
by the NNES. At that point, NES comfort level is elevated and the change is immediate. This
represents the assumption by some policy makers that second language proficiency is a binary
judgment; either a speaker is proficient, or they are not proficient, and there is little room for
varying degrees of proficiency (S. 744, 2013).

52
Figure 2. Representation of Binary Relationship between Speaker Proficiency Level and Listener Comfort Level
Another way to view the relationship between these two variables is to assume that they
have a direct linear relationship. This would mean that NES comfort level and NNES proficiency
levels are directly correlated. A visual representation of this relationship is shown in figure 3. As
NNES proficiency level increases, NES comfort level increases at approximately the same rate.
This model does not take into account plateaus for either variable.
NE
S C
omfo
rt L
evel
NNES Proficiency Level (ELC LAT Scores)

53
Figure 3. Representation of Direct Linear Relationship between Speaker Proficiency and Listener Comfort
The results of this study suggest that a threshold relationship may exist between the
variables of NES comfort level and NNES proficiency level. Figure 4 provides a visual
representation of this possible relationship. The three data points in the figure represent the three
proficiency levels studied. Since there was not a significant difference between ratings for the
intermediate and advanced speakers, it is possible that comfort ratings could plateau around this
proficiency level. This could indicate an upper threshold, in that there may exist a “ceiling” for
NES comfort level. Future studies that include more proficiency levels would improve the
understanding of this threshold relationship.
NE
S C
omfo
rt L
evel
NNES Proficiency Level (ACTFL OPI)

54
Figure 4. Threshold Relationship between Speaker Proficiency and Listener Comfort
Study abroad students and intensive English schools in the US. The results of this
study suggest that NNESs in the US would need to achieve an Intermediate-Mid proficiency
level (on ACTFL’s scale) in order for NES to feel comfortable interacting with them. Study
abroad participants cite a desire to develop friendships with members of the target language
community as a motivating factor in their decision to study abroad (Isabelli-Garcia, 2006).
English schools could use this information to help their NNES students set realistic goals and
expectations for interaction with NESs depending on their proficiency level.
Importance of task. A result of this study was that task showed to have a significant
main effect on comfort ratings. Ratings were more varied across tasks than across proficiency
levels, suggesting that task may be a more important variable than proficiency level when trying
to predict NES comfort levels.
0123456789
10
0 2 4 6
NE
S C
omfo
rt L
evel
NNES Proficiency Level (ACTFL OPI)

55
Employers. Increasingly, companies are outsourcing customer service call center jobs to
NNES countries to reduce costs. Task 6 specifically dealt with this type of customer service and
was rated significantly lower than other tasks, including other customer service tasks. This
suggests that NES have especially high proficiency expectations for NNES in these types of
positions. Employers, who recognize this expectation and hire employees according, may be able
to decrease frustration of their employees and customers.
Moreover, these results could inform employers on what to expect in terms of interaction
between their NES and NNES employees. This information is especially important in countries
with declining birthrates such as Canada. It is predicted that the majority of their labor market
growth over the next decade will come from immigration (as cited in Derwing & Munro, 2009).
In their 2009 study on workplace interaction in Canada, Derwing and Munro found that
“Although the recently hired newcomers (immigrants) have superb technical skills, their use of
oral and written language sometimes causes communication breakdowns” (p. 182). An
understanding of the minimum proficiency level these skilled workers will need to succeed in a
mixed language environment could inform employers about the language support, including
instruction, that they may need to provide to these employees.
ESP classes. The curriculum for ESP (English for specific purposes) classes is meant to
prepare learners for specific communication tasks or settings. For example, English classes for
nurses or automobile mechanics prepare students to use English in situations specific to those
occupations. The results of this study could inform ESP curriculum, regarding target proficiency
levels, providing students with a concrete proficiency goal necessary to be able to successfully
complete a job that requires interaction with NESs.

56
Community ESL programs. The goal of most community ESL programs is to help
students improve their English skills and ultimately improve their quality of life by opening
doors to opportunities outside of the classroom. These opportunities could include a better job or
salary, increased involvement in their children’s school, and/or a sense of belonging in the NES
community. A goal for proficiency level that is tailored to specific jobs or communication tasks
could improve motivation by providing a concrete objective for learners.
Limitations
There are many limitations to the validity and reliability of this study.
Sampling. Sampling procedures for both groups of participants, speakers and listeners,
affect the generalizability of this study. The fact that all speakers in this study were female,
native Spanish speakers, and were between the ages of 18-26, prevents results from being
generalizable to all NNESs. Moreover, any validity in the sampling of listeners relies on the
assumption that the survey sampling company (SSI) provided a quality random sample.
Survey instrument. Ratings were not independent of each other, in that listeners’ ratings
for a specific speaker may have been affected by the listener’s perception of another speaker in
the survey. This could have caused the listeners to give higher ratings to the advanced speakers
because they sounded more proficient in comparison to the novice speaker. Randomization of
sound clips was used to attempt to mitigate these effects. However, if the listeners had heard a
speaker in isolation, they may have rated them differently.
Listener processing time was not measured or controlled in the survey. Considerably
more processing time was available to listeners in this survey than in a typical conversation or

57
interaction. There was also no control over how many times a listener played the sound clips.
These facts may negatively affect the authenticity of the instrument.
Self-Report data. All data from listeners in this study was collected through self-report.
This type of data collection is subject to the social acceptability bias and the halo effect. In
addition, self-report data only reveals how the listeners think they would react in a certain
situation, which may or may not be how they would actually perform.
Listener’s attitudes toward NNESs. Lindemann (2002) studied the correlation between
NES attitudes toward a language group and their ability to understand speakers from that
language group. She found that NESs’ perceived ability to understand NNESs correlated with
their attitudes toward the language group of the NNESs, regardless of the NNESs’ proficiency
level. It is probable that attitudes toward the perceived language group of the speaker affected
listener judgments; however, no data was collected on language attitudes in this study.
Personality and motivation as moderating variables. This study did not take into
account the affect that NNES personality and motivation has on NES comfort level during
interaction. Llurda (1993, 2000) found that NES make judgments about NNES personalities
based on proficiency. It is logical that personality judgments could have an effect on NES level
of comfort interacting with NNESs. Moreover, Macyntire, Dornyei, Clement and Noels (1998)
suggest that there are many variables that affect willingness to communicate, including
motivation, personality, intergroup climate/attitudes, desire to communicate with a specific
person, self-confidence, social situation and communicative competence. Of the variables they
mention, this study only looks at two: social situation and communicative competence
(communicative competence is simplified as proficiency level for this study). The current study

58
did not attempt to measure or analyze the effect of these other variables and thus cannot report if
the NES listener comfort ratings are a result of NNES speaker proficiency level and
communication task, or are the result of another, moderating variable.
Suggestions for Future Research
The results and limitations of this study provide ample ideas for future research. Future
studies could address study limitations by including speakers from both genders, different native
languages, and a wider variety of proficiency levels, and by measuring participants’ language
attitudes, personality, and motivation. Future studies could also use a more inclusive testing
measure and/or multiple instruments. This could involve observing and coding actual
conversations between NESs and NNESs and asking the NESs to rate their comfort level after
the interaction. Moreover, a larger sample size could allow for a better understanding of how
NES demographic variables affect NES level of comfort during interaction. In addition, future
studies could study the effect of a wider variety of communication tasks on comfort ratings.
Conclusion
In a recent publication, Schumann stated that “because adult L2 acquisition is not
universal, communicating with individuals who speak another language has continued to be a
challenge for our species” (Schumann, 2013, p. 191). This study investigates one aspect of this
“challenge”: NES proficiency expectations for NNESs. A lack of a clear understanding of these
expectations can lead to frustration between the two groups.
Immigrant English language attainment levels are shaping experiences between NESs
and NNESs and ultimately affecting immigrant social integration (Xue, 2007; Jimenez, 2011;
Derwing & Waugh, 2012). NESs can feel uncomfortable interacting with NNESs who have a

59
low English proficiency level (Derwing & Munro, 2009). As a result of this feeling of discomfort,
it is possible that unless an immigrant is already at an acceptable level of English proficiency,
they are much less likely to find NESs willing to interact with them. Lack of interaction
opportunities could negatively impact the immigrant’s ability to integrate linguistically into the
target language society, which would reduce opportunities to continue to develop higher levels of
English proficiency and prevent them from experiencing the benefits of integration.
In 1976 Schumann theorized that the learner’s community, rather than the learner, has the
greatest amount of control over ultimate language attainment levels. The proficiency level that
the learner will acquire is directly related to the degree that they are integrated into the target
language group (Schumann, 1986). This suggests that there is a dependent relationship between
language proficiency and integration and that ultimate language attainment levels may be
controlled by the amount of interaction NESs are willing to have with NNESs. Often, the level to
which an immigrant is able to participate in the target language society is dictated by their level
of proficiency in the target language (Masgoret & Gardner, 1999). However, there is little
research regarding what an acceptable threshold level of proficiency might be.
This study investigated the relationship between nonnative English speakers’ proficiency
level and native English speakers’ level of comfort interacting with NNESs. The purpose of this
study was to discover at what proficiency level native English speakers feel most comfortable
interacting with non-native English speakers. This study also looked at how communicative task
and NES demographic variables affected the proficiency expectations NNESs have for NESs.
Participants included 120 NESs listened and 7 NNESs. The NESs listened to sound clips
from the NNESs and rated how comfortable they would feel (on a scale of 0-10, 10 indicating

60
very comfortable) interacting with the speaker in a variety of communication tasks. Each listener
rated the same speaker first and the ratings for this speaker were discarded as a means to control
for familiarity with prompt. The remaining six speakers were presented randomly with equal
representation. A mixed models analysis of variance was utilized to analyze the data.
The results indicated that an Intermediate-Mid proficiency level (on ACTFL’s scale)
may be the minimum proficiency level NNES need to achieve in order for NES to feel
comfortable interacting with them. However, more proficiency levels need to be studied to
confirm this hypothesis. Communication task was revealed as having a significant main effect on
task. Listeners rated that they would feel least comfortable communicating with the speakers
over the phone while discussing a customer service issue. They also indicated that they would
feel least comfortable interacting with the speakers if they were their boss. Listener demographic
variables did not have a significant main effect on overall ratings, but were significant for some
tasks when task was analyzed individually. Specifically, age and frequency of interaction with
NNES had an effect on some tasks; however, the reliability of this result is affected by sample
size.
These results suggest a possible threshold relationship between NES comfort ratings and
speaker proficiency level. Additionally, the data suggest that task may be more important than
proficiency level in some interactions. Future studies could address limitations by including
speakers from both genders and different native languages, wider variety of proficiency levels,
and measuring participants’ language attitudes, personality, and motivation.
.

61
References
ACTFL Proficiency Guidelines. (2012). from http://actflproficiencyguidelines2012.org/
Barkan, E. R. , Kraut, A. M., & Diner, H. R. (2007). From arrival to incorporation : Migrants to
the U.S. in a global era. New York City: NYU Press.
Berry, J.W. (1980). Acculturation as varieties of adaptation In A. M. Padilla (Ed.), Acculturation:
Theory, Models, and Some New Findings (pp. 9-25). Boulder, CO.
Border security, economic opportunity & immigration modernization act of 2013, S. 744, 113th
Congress.
The candidate from xenophobia. (2010, 4/29/2010). Article, New York Times, p. 30. Retrieved
from https://www.lib.byu.edu/cgi-
bin/remoteauth.pl?url=http://search.ebscohost.com/login.aspx?direct=true&db=aph&AN
=49766096&site=ehost-live&scope=site
Cummins, J. (1994). The Acquisition of english as a second language. In K. Spangenberg-
Urbschat & R. Pritchard (Eds.), Kids come in all langauges: Reading instruction for ESL
students (pp. 36-62). Newark, DE: International Reading Association.
Derwing, T. M., & Munro, M. J. (2009). Comprehensibility as a factor in listener interaction
preferences: Implications for the workplace. The Canadian Modern Language Review/La
Revue canadienne des langues vivantes, 66(2), 181-202.
Derwing, T. M., Rossiter, M. J., & Munro, M. J. (2002). Teaching native speakers to listen to
foreign-accented speech. Journal of Multilingual and Multicultural Development, 23(4),
245-259.
Derwing, T. M., & Waugh, E. (2012). Language skills and the social integration of Canada’s
adult immigrants (Vol. Study 31). Montreal: Institute for Research on Public Policy.

62
Dicker, S. J. (2003). Languages in America: a Pluralist view (2nd ed.). Tonawanda, NY:
Multilingual Matters Ltd.
Forey, G., & Lockwood, J. (2007). “I’d love to put someone in jail for this”: An initial
investigation of English in the business processing outsourcing (BPO) industry. English
for Specific Purposes, 26(3), 308-326. doi: 10.1016/j.esp.2006.09.005
Freed, B. F., Dewey, D. P., Segalowitz, N., & Halter, R. (2004). The Language Contact Profile.
Studies in Second Language Acquisition, 26(2), 349-356.
Gareis, E., Merkin, R., & Goldman, J. (2011). Intercultural friendship: Linking communication
variables and friendship success. Journal of Intercultural Communication Research,
40(2), 153-153.
Granovetter, M. (1973). The Strength of weak ties. The American Journal of Sociology, 78(6),
1360-1380.
Granovetter, M. (1983). The Strength of weak ties: A Network theory revisited. Sociological
Theory, 201.
Hamilton, R. P. (2001). The Insignificance of learners' errors: A Philosophical investigation of
the interlanguage hypothesis. Language and Communication, 21(1), 73-88.
Hernandez, T. A. (2010). The Relationship among motivation, interaction, and the development
of second language oral proficiency in a study-abroad context. Modern Language Journal,
94(4), 600-617. doi: 10.1111/j.1540-4781.2010.01053x
Isabelli-Garcia, C. (2006). Study abroad social networks, motivation and attitudes: implications
for second language acquisition. . In M. DuFon & E. Churchill (Eds.), Language learners
in study abroad contexts (pp. 231-258). Buffalo: Multilingual Matters Ltd.

63
Jiang, M., Green, R. J., Henley, T. B., & Masten, W. G. (2009). Acculturation in relation to the
acquisition of a second language. Journal of Multilingual and Multicultural Development,
30(6), 481-492.
Jimenez, T. R. (2011). Immigrants in the United States: How well are they integrating into
society? Washington, DC: Migration Policy Institute.
Kang, O., & Rubin, D. L. (2009). Reverse linguistic stereotyping: Measuring the effect of
listener expectations on speech evaluation. Journal of Language and Social Psychology,
28(4), 441-456.
Kang, S. (2006). Measurement of acculturation, scale formats, and language competence: Their
implications for adjustment. Journal of Cross-Cultural Psychology, 37(6), 669-693.
Krashen, Stephen. (1980). The input hypothesis. Georgetown University Round Table on
Languages and Linguistics.
Lee, N., Mikesell, L., Joaquin, A. D. , Mates, A. W., & Schumann, J. H. (2009). The
interactional instict. New York: Oxford University Press.
Lindemann, S. (2002). Listening with an attitude: A model of native-speaker comprehension of
non-native speakers in the United States. Language in Society, 31(3), 419-441.
Lindemann, S. (2005). Who speaks "broken english"? US undergraduates' perceptions of non-
native english. International Journal of Applied Linguistics, 15(2), 187-212.
Lindemann, S. (2011). Who's "unintelligible"? The perceiver's role. Issues in Applied Linguistics,
18(2), 223-232.
Llurda, E. (1993). Language proficiency and social acceptance. Sintagma, 5, 71-79.
Llurda, E. (2000). Effects of intelligibility and speaking rate on judgements of non-native
speakers' personalities. IRAL, 38(3-4), 289-299.

64
MacIntyre, P. D. (2007). Willingness to communicate in the second language: Understanding the
decision to speak as a volitional process. The Modern Language Journal, 91(4), 564-576.
MacIntyre, P. D., Dornyei, Z., Clement, R., & Noels, K. A. (1998). Conceptualizing wlingness to
communicate in a L2: A stuational model of L2 confidence and affiliation. The Modern
Language Journal, 82(4), 545-562.
Masgoret, A., & Gardner, R. C. (1999). A causal model of spanish immigrant adaptation in
canada. Journal of Multilingual and Multicultural Development, 20(3), 216-236.
Milroy, J., & Milroy, L. (1985). Linguistic change, social network and speaker innovation.
Journal of Linguistics, 21(2), 339-384.
Munro, M. J., Derwing, T. M., & Burgess, C. S. (2010). Detection of nonnative speaker status
from content-masked speech. Speech Communication, 52(7-8), 626-637.
A nation of immigrants: a portrait of the 40 million, including 11 million unauthorized. (2013).
Retrieved 04/01/2013, from http://www.pewhispanic.org/2013/01/29/a-nation-of-
immigrants/
Ortega, L. (2009). Understanding second langauge acquistion. London: Hoddern Education.
Portes, A., & Rumbaut, R. G. (2006). Immigrant America: A portrait (3 ed.). Los Angelese:
University of California Press.
Santa Ana, O. (2002). Brown tide rising: Metaphors of latinos in contemporary american public
discourse. Austin: University of Texas Press.
Schmidt, R. W. (1983). Interaction, acculturation, and the acquistion of communicative
competence: A case study of an adult: Rowley, MA: Newbury House Publishers, Inc.
Schumann, J. H. (1974). The implications of interlanguage, pidginization and creolization for the
study of adult second language acquisition. TESOL Quarterly, 8(2), 145-152.

65
Schumann, J. H. (1976a). Second language acquisition: The pidginization hypothesis. Language
Learning, 26(2), 391-408.
Schumann, J. H. (1976b). Social distance as a factor in second language acquisition. Language
Learning, 26(1), 135-143.
Schumann, J. H. (1986). Research on the acculturation model for second language acquisition.
Journal of Multilingual and Multicultural Development, 7(5), 379-392.
Schumann, J. H. (2013). Societal responses to adult difficulties in L2 acquisition: Toward an
evolutionary perspective on language acquisition. Language Learning, 63, 190-209. doi:
10.1111/j.1467-9922.2012.00744.x
Segalowitz, N., & Ryder, A. (2006). Montreal Index of Linguistic Integration (MILI).
Unpublished questionnaire,. Unpublished questionnaire. Concordia University. Montreal,
Quebec, Canada.
Smith, D. M. (1972). Some implications for the social status of pidgin lanaguages
Sociolinguistics in Cross-Cultural Analysis: Georgetown University.
Survey sampling international. (2013). Retrieved 04/01/2013, from http://surveysampling.com
Xue, L. (2007). Portrait of an immigrant process: Difficulties encountered and resource relied
on for newcomers in their first 4 years in canada; Evidence from three waves of the
longitudinal survey of immigrants to canada. Ottawa: Citizenship and Immigration.

66
Appendix A
Survey Instrument
Informed Consent
I am a graduate student at Brigham Young University and I am conducting this research
under the supervision of Professor Eggington, from the Department of Linguistics. You are being
invited to participate in this research study because you are a native English speaker. This
research will focus on interaction between native and non-native English speakers. Your
participation in this study will require the completion of this electronic survey. This should take
approximately 10-15 minutes of your time. Your participation will be anonymous and you will
not be contacted again in the future.
This survey involves minimal risk to you. The benefits, however, may impact society by
helping increase knowledge about interaction between native and non-native English speakers.
You do not have to be in this study if you do not want to be. You do not have to answer any
question that you do not want to answer for any reason. We will be happy to answer any
questions you have about this study. If you have further questions about this project or if you
have a research-related problem you may contact me, Alison Roberts at
[email protected], or my advisor, Bill Eggington at [email protected].
If you have any questions about your rights as a research participant you may contact
the IRB Administrator at A-285 ASB, Brigham Young University, Provo, UT 84602;
[email protected]; (801) 422-1461. The IRB is a group of people who review research studies to
protect the rights and welfare of research participants. The completion of this survey implies
your consent to participate. If you choose to participate, please continue to the next page and

67
begin the survey. I greatly appreciate the time you are taking to complete this survey. Thank
you!

68
Q1 I have read and understand the above consent form and desire of my own free will to
participate in this study.
Yes No
Q2 Are you a native English speaker?
Yes No
Q3 What is your gender?
Female Male
Q4 What is your age range?
17 and under 18-25 26-35 36-45 46-55 56-65 66 +
Q5 What is your highest level of education?
Some high school or less High school graduate Some college College graduate Postgraduate/professional
Q6 Please select the state in which you currently reside:
Alabama (AL) Alaska (AK) Arizona (AZ)

69
Arkansas (AR) California (CA) Colorado (CO) Connecticut (CT) Delaware (DE) Florida (FL) Georgia (GA) Hawaii (HI) Idaho (ID) Illinois (IL) Indiana (IN) Iowa (IA) Kansas (KS) Kentucky (KY) Louisiana (LA) Maine (ME) Maryland (MD) Massachusetts (MA) Michigan (MI) Minnesota (MN) Mississippi (MS) Missouri (MO) Montana (MT) Nebraska (NE) Nevada (NV) New Hampshire (NH) New Jersey (NJ) New Mexico (NM) New York (NY) North Carolina (NC) North Dakota (ND) Ohio (OH) Oklahoma (OK) Oregon (OR) Pennsylvania (PA) Rhode Island (RI) South Carolina (SC) South Dakota (SD) Tennessee (TN) Texas (TX)

70
Utah (UT) Vermont (VT) Virginia (VA) Washington (WA) West Virginia (WV) Wisconsin (WI) Wyoming (WY)
Q8 You will listen to a total of 7 sound clips. Each clip is 15 seconds long. In each sound clip the speaker is describing a trip the speaker will take to Disneyland. This is the first sound clip. Listen to the sound clip and answer the questions below. (The sound clip is presented in two formats, MP3 and WAV, in order to be compatible with most computers. You only need to listen to one of the options)
Use the slider to indicate how comfortable or uncomfortable you would feel participating in the following tasks (in English):
Very Uncomfortable Very Comfortable
0 1 2 3 4 5 6 7 8 9 10
having a casual conversation in English with this speaker for at least 10 minutes
speaking with this person in English for at least 10 minutes about a topic on which you have some strongly held views (such as religion or current events)
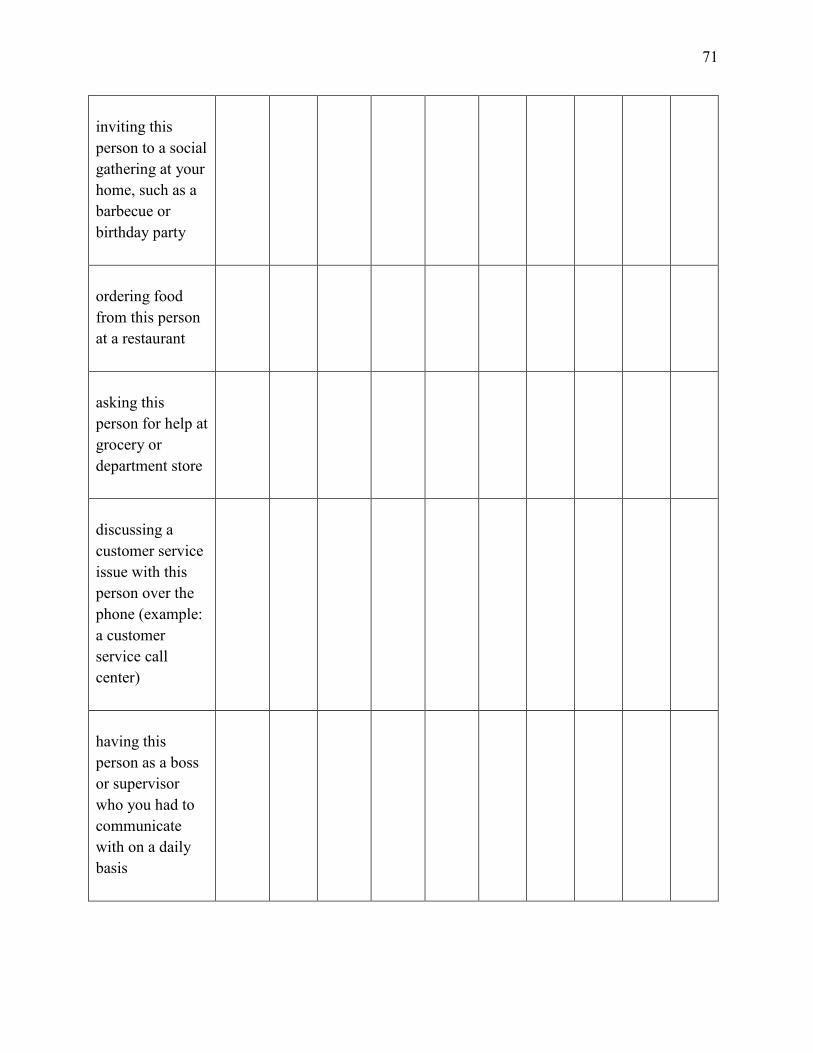
71
inviting this person to a social gathering at your home, such as a barbecue or birthday party
ordering food from this person at a restaurant
asking this person for help at grocery or department store
discussing a customer service issue with this person over the phone (example: a customer service call center)
having this person as a boss or supervisor who you had to communicate with on a daily basis

72
talking to this person during your lunch break if they were your co-worker
working with this person one-on-one to complete a project or task at work
working on a committee together that requires you to communicate often (several times a week) with this person
Q9: Did you have any problems with the sound file? (Select all that apply)
Sound clip did not play Sound clip was too quiet I had no problems with the sound clip
Q10 – Q21: These questions have the same format and wording as Q8 and Q9 (for each respective sound clip).
Q22: If you answered that you would feel uncomfortable (or less comfortable) interacting with one or more of the speakers in certain tasks or situations, what was it about their speech that made you feel uncomfortable (or less comfortable)?

73
Q23: How are your interactions with non-native English speakers affected by their language abilities?
Q24: How often do you interact with non-native English speakers?
Never Less than Once a Month Once a Month 2-3 Times a Month Once a Week 2-3 Times a Week Daily
Q25: How many close friends or family members do you have that are non-native English
speakers?
None 1-3 4-6 7-9 10 +
Q26: Have you ever lived outside the US?
Yes No
Q27: Please write the countries and check the amount of time you lived in each country:
Less than 6 months
6 months to 11 months
1 - 3 years 4 + years
Name of country: _________ Name of country: _________ Name of country: _________ Name of country: _________ Name of country: _________

74
Q28: Have you ever studied any foreign languages? (example: Spanish, Chinese, Arabic,
etc.)
Yes No
Q29: What language(s) have you studied?
Have you studied any
of these languages? Check all that apply
How would you describe your proficiency level?
No ability Conversational (basic) Intermediate Advanced Near-
native French Spanish German Chinese Portuguese Japanese Korean Other (Please specify)

75
Appendix B
Speaking Prompt
You and a friend are planning a vacation to Disneyland. Your mother calls and wants to
know about your upcoming trip. Prepare by reading through your itinerary, then in your response
use complete sentences to discuss some of the activities.
You have 45 SECONDS to prepare your answer and 45 SECONDS to speak.

76
Appendix C
ELC Speaking Rubric
Available at (http://elc.byu.edu/teacher/skill_areas/LS/index.php)
Level Text Type Content Accuracy • Fluency
• Development • Organization
• Functional Ability with the Language (Abstract vs. Concrete or Self-centric Language)
• Vocabulary
• Grammar & Verb Tense
• Communication Strategies
• Native-like Comprehensibility
7—ready for university courses (Advanced Mid)
Exemplified speaking on a paragraph level rather than isolated phrases or strings of sentences. Highly organized argument (transitions, conclusion, etc.). Speaker explains the outline of topic and follows it through.
• Discusses some topics abstractly (areas of interest or specific field of study);
• Better with a variety of concrete topics;
• Appropriate use of a variety in academic and non-academic vocabulary;
• Grammar errors are extremely rare, if they occur at all; wide range of structures in all time frames;
• Able to compensate for deficiencies by use of communicative strategies—paraphrasing, circumlocution, illustration—such that deficiencies are unnoticeable;
• Readily understood by native speakers unaccustomed to non-native speakers;
6—ready for Academic C (Advanced
Fairly organized paragraph-like speech with appropriate discourse markers (transitions, conclusion, etc.) Will not be as organized as level 7,
• Can speak comfortably with concrete topics, and discuss a few topics abstractly;
• Academic
• Grammar errors are infrequent and do not affect comprehension; no apparent sign of grammatical avoidance;

77
Low) but meaning is clear. vocabulary often used appropriately in speech;
• Able to speak in all major time frames, but lacks complete control of aspect;
• Often able to successfully use compensation strategies to convey meaning;
• Easy to understand by native speakers unaccustomed to non-native speakers
5—ready for Academic B (Intermediate High)
Simple paragraph length discourse with sustained, though possibly formulaic, discourse markers that help maintain some organization.
• Able to comfortably handle all uncomplicated tasks relating to routine or daily events and personal interests and experiences;
• Some hesitation may occur when dealing with more complicated tasks;
• Uses a moderate amount of academic vocabulary;
• Uses a variety of time frames and structures; however, speaker may avoid more complex structures;
• Error patterns may be evident, but errors do not distort meaning;
• Exhibits break-down with more advanced tasks—i.e. failure to use circumlocution, significant hesitation, etc.
• Understood by native speakers unaccustomed to dealing with non-natives, but 1st language is evident;
4—ready for Academic A
Uses moderate-length sentences with simple transitions to connect ideas. Sentences may be
• Able to handle a variety of uncomplicated tasks with
• Strong command of basic structures; error patterns with complex grammar;

78
(Intermediate Mid)
strung together, but may not work together as cohesive paragraphs.
concrete meaning;
• Expresses meaning by creating and/or combining concrete and predictable elements of the language;
• Uses sparse academic vocabulary appropriately;
• Frequent use of compensation strategies with varied success;
• Generally understood by sympathetic speakers accustomed to speaking with non-natives;
3—ready for Foundations C (Intermediate Low)
Able to express personal meaning by using simple, but complete, sentences they know or hear from native speakers.
• Able to successfully handle a limited number of uncomplicated tasks;
• Concrete exchanges and predictable topics necessary for everyday life without unexpected complications;
• Highly varied general vocabulary;
• Errors are not uncommon and sometimes obscure meaning;
• Limited range of sentence structure;
• Characterized by ineffective reformulations and self-corrections;
• Generally understood by speakers used to dealing with non-natives, but requires more effort;
2—ready for Foundations B (Novice High)
Short and sometimes incomplete sentences.
• Restricted to a few of the predictable topics necessary for survival (basic personal information, basic objects, preferences, and immediate needs)
• Relies heavily on learned phrases
• Attempt to create simple sentences, but errors predominate and distort meaning;
• Avoids using complex structures.
• Speaker’s 1st language strongly influences syntax;
• Generally understood by

79
or recombination of phrases and what they hear from interlocutor;
• Limited general vocabulary
sympathetic speakers used to non-natives with repetition and rephrasing;
1—ready for Foundations A (Novice Mid)
Isolated words and memorized phrases.
• Relies almost solely on formulaic/memorized language;
• Two or three word answers in responding to questions;
• Very limited context for vocabulary;
• Communicate minimally and with difficulty;
• Frequent pausing, recycling their own or interlocutor’s words;
• Resort to repetition, words from their native language, or silence if task is too difficult;
• Understood with great difficulty even by those used to dealing with non-natives
0—ready for Foundations prep (Novice Low)
Isolated words. • No real functional ability;
• Given enough time and familiar cues, may be able to exchange greetings, give their identity and name a number of familiar objects from their immediate environment;
• Cannot participate in true conversational exchange;
• Length of speaking sample may be insufficient to assess accuracy;
• Nearly incomprehensible even by those used to dealing with non-natives

80
Appendix D
Effect of listener variables on mean ratings
Table 18 Effects of listener variables on mean ratings
Effect Num DF Den DF F Value Pr > F
Gender 1 95 1.37 .24
Age range 5 95 1.31 .27
Education level 4 95 0.14 .97
Habitual interaction with NNESs
6 95 1.47 .20
Amount of NNES friends and family
4 95 0.50 .73
Lived outside the US 1 95 0.08 .78
Studied a foreign language 1 95 0.63 .43