perception of visual variables on tiled wall-sized
TRANSCRIPT

HAL Id: hal-00719203https://hal.inria.fr/hal-00719203
Submitted on 19 Jul 2012
HAL is a multi-disciplinary open accessarchive for the deposit and dissemination of sci-entific research documents, whether they are pub-lished or not. The documents may come fromteaching and research institutions in France orabroad, or from public or private research centers.
L’archive ouverte pluridisciplinaire HAL, estdestinée au dépôt et à la diffusion de documentsscientifiques de niveau recherche, publiés ou non,émanant des établissements d’enseignement et derecherche français ou étrangers, des laboratoirespublics ou privés.
Perception of Visual Variables on Tiled Wall-SizedDisplays for Information Visualization Applications
Anastasia Bezerianos, Petra Isenberg
To cite this version:Anastasia Bezerianos, Petra Isenberg. Perception of Visual Variables on Tiled Wall-Sized Displays forInformation Visualization Applications. IEEE Transactions on Visualization and Computer Graphics,Institute of Electrical and Electronics Engineers, 2012, Proceedings Scientific Visualization / Informa-tion Visualization, 18 (12), pp.2516-2525. �hal-00719203�

Perception of Visual Variables on Tiled Wall-Sized Displays forInformation Visualization Applications
Anastasia Bezerianos and Petra Isenberg
Fig. 1. Two viewers analyzing data visualizations from different viewpoints in front of a large high-resolution wall display (a). Aparticipant conducting a trial during our first experiment (b).
Abstract—We present the results of two user studies on the perception of visual variables on tiled high-resolution wall-sized displays.We contribute an understanding of, and indicators predicting how, large variations in viewing distances and viewing angles affect theaccurate perception of angles, areas, and lengths. Our work, thus, helps visualization researchers with design considerations on howto create effective visualizations for these spaces. The first study showed that perception accuracy was impacted most when viewerswere close to the wall but differently for each variable (Angle, Area, Length). Our second study examined the effect of perception whenparticipants could move freely compared to when they had a static viewpoint. We found that a far but static viewpoint was as accuratebut less time consuming than one that included free motion. Based on our findings, we recommend encouraging viewers to standfurther back from the display when conducting perception estimation tasks. If tasks need to be conducted close to the wall display,important information should be placed directly in front of the viewer or above, and viewers should be provided with an estimation ofthe distortion effects predicted by our work—or encouraged to physically navigate the wall in specific ways to reduce judgement error.
Index Terms—Information Visualization, Perception, Wall Displays
F
1 INTRODUCTION
Mega- and Giga-pixel wall-sized displays (henceforth referred to aswall-sized displays) offer the opportunity to engulf viewers in verylarge high-resolution information spaces. They form intriguing newenvironments for data analysis and information visualization due toseveral inherent benefits: physical rather than virtual navigation af-fords a natural pan-and-zoom in the information space, an enlargedphysical space in front of the display enables collaborative viewingand data analysis, and millions of pixels support viewing tremendousamounts of data in one shared environment [6, 16]. To fully lever-age wall-sized displays for data analysis, however, we need to designwall-sized visualizations and workspaces based on a sound understand-ing of how human’s perceptual and cognitive capabilities are affectedby this new work environment. At the most basic level, visualiza-tion workspaces for wall displays have to incorporate what we already
• Anastasia Bezerianos is with Univ Paris-Sud & CNRS (LRI) and INRIAE-mail: [email protected].
• Petra Isenberg is with INRIA, E-mail: [email protected].
Manuscript received 31 March 2012; accepted 1 August 2012; posted online14 October 2012; mailed on 5 October 2012.For information on obtaining reprints of this article, please sende-mail to: [email protected].
know about the design of information visualizations for desktop-sizeddisplays. Beyond this knowledge, wall-specific design recommenda-tions have to be developed. One important criterion for the develop-ment of information visualization techniques for wall-sized displays istheir immense physical size. It is not uncommon to see wall displaysof over 5m (16’) × 2m (6.5’) in width and height [7, 16]. Even com-plete rooms covered on all sides by high-resolution displays are beingconstructed for visualization research and applications [35].
With physically large display-walls, physical navigation becomesan important means of accessing an information visualization [6, 16,41]. Viewers choose close or far viewpoints to zoom in and out, andpan physically by moving left and right to see different parts of the dis-play. This type of movement may involve a physical relocation as wellas a change of head orientation, as depicted in Fig. 1. Thus, viewersfluidly and frequently switch viewing distances and angles which maylead to systematic discrepancies between the actual appearance of dis-played information in physical space (as can be measured by rulers)and its psychophysical appearance in a person’s visual space.
Understanding discrepancies and where and when they occur is im-portant for information visualization design, as fundamental data anal-ysis tasks involve the correct assessment and comparison of elemen-tary visual variables such as areas, angles, positions, slopes, or lengths[12]. To read a bubble chart, for example, one has to compare the sizesof circles to one another and to a legend, as well as relate positions in a

(a) The viewpoints of two observers. (b) Wall as seen by the left observer. (c) Wall as seen by the right observer.
Fig. 2. Two observers looking at the same angles, lengths, and circles displayed across a large wall display.
2D coordinate space. Fig. 2 gives an example of how the appearance ofthree visual variables is affected when seen from different viewpointsand viewing angles. The question arises whether comparisons suchas these are affected by the oblique viewing angles which occur whenviewing data from different positions in front of a wall-sized display.
To-date many high-resolution wall-sized displays, including ours,are assembled from multiple LCD monitors [7, 16, 35]. These setupsinclude clear visible bezels which form part of our study context. Theresearch we report on in this paper, thus, takes a first step towardsassessing the implications of changes in viewpoint on the assessmentof data representations on tiled wall-sized displays with visible bezels.
Our research is motivated by three main questions:• Are all areas of a wall equally effective for close scrutiny and
comparison of data items?• What is the effect of viewing distance and angle on the perception
of visual variables in large viewing spaces?• What are the benefits of walking in comparison tasks?
We began addressing these questions by studying how perceptionof elementary visual variables (Angle, Area, Length) was affected byvarying viewing distances and angles. We contribute two studies: thefirst assessed static viewing conditions and identified different param-eters that can help predict the perceived magnitude of the tested visualvariables. The second contributes an understanding of the influence ofallowing participants to move in front of the display. Our final contri-bution is a set of design implications about placement of data items onwall displays and the characteristics of effective physical navigation.
2 RELATED WORK
We can draw from a variety of past research for the design of our ex-periments. A large chunk of the literature comes from the field ofpsychophysics. We report on the related background in this field sepa-rately in the following section as we lead into the study design. In thissection, we concentrate on the related literature on large displays andperception of graphical elements in HCI and information visualization.
2.1 Viewpoints and Interaction with Large DisplaysThe problems of viewing and interacting with information on physi-cally large displays has been investigated in HCI, focusing on severaldifferent questions: how to acquire targets across large distances [33],how to view far areas up-close [8], how to maintain awareness [10, 25],how large displays influence performance in spatial orientation tasks[36], or how a larger field of view influences user performance [15]. Incontrast to these questions we want to learn how varying viewing dis-tances and angles affect the accurate perception of a virtual object’sproperties such as its area, length, or angles. We know of no large-display literature that asks this question but the problem has alreadybeen recognized [3]. Several researchers have instead considered theinfluence of varying viewpoints on other large-display tasks:
Jota et al. [24] studied the impact of viewing angles on pointing per-formance on a 3m × 1m wall. Several studies in the tabletop literatureassessed the relationship of view position and 2D object rotation oncoordination, comprehension, and collaboration [27, 28]. Viewpointshave also been studied for viewing 3D objects on tabletops [21]. In
multi-display environments, Nacenta et al. [30] showed that dynami-cally correcting perspective based on a viewer’s viewpoint improvedperformance for tasks such as targeting, steering, aligning, pattern-matching, and reading. These studies relate to ours in that they corrob-orate the importance of view positions and angles to task performance.
2.2 Information Visualization and Large DisplaysSeveral researchers have considered the influence of a viewer’s posi-tion in front of a large display on information visualization tasks. Fortabletops, Wigdor et al. [39] studied how varying screen orientationfrom a horizontal to up-right position influenced the accurate percep-tion of elementary graphical elements. They found perception to beleast accurate in the horizontal position. This study resembles oursin that elementary elements were tested using study techniques frompsychophysics [20]. We relate some of their findings more closelyto ours in our Discussion Section. Alallah et al. [2] tested how theperception of simple charts was impacted by varying viewing anglesaround a horizontal screen. They found that reading charts right-sideup was fastest and least error-prone, and proposed a new chart designto alleviate orientation problems.
For wall-sized displays several studies explore how changes in aviewer’s position affect how visualizations are read. Endert et al. [16]discuss how a viewer’s distance from a large display influences thevisual aggregation of displayed information. They found encodingsbased on a color ramp to visually aggregate particularly well acrossviewing distances for a visual search task. Yost and North [41] testedseveral data visualizations for their ability to effectively display largeamounts of data on large displays. They found their visualizations toscale well for the tasks of finding detailed and overview informationand note that spatial encoding of information was particularly impor-tant on large displays. In a follow-up experiment Yost et al. [40] stud-ied how scaling visualizations beyond visual acuity affected user per-formance. For almost all tested tasks they found performance improve-ments and argue for design guidelines that take visual aggregation andphysical navigation into account. Ball and North [5] compared thebenefits of added peripheral vision vs. physical navigation for large dis-plays, and found that physical navigation influenced task performancewhile added peripheral vision did not. The authors further stress theimportance of physical navigation for visualization tasks. The streamof research on physical navigation relates to ours as a strong motiva-tion for studying the influence of changing viewpoints and angles onaccurate perception of data representations.
3 BACKGROUND IN PSYCHOPHYSICS
Psychophysics is a sub-discipline of psychology that is concerned withmeasuring the relationships between perceived and actual properties ofa visual object [20, 37]. Much research in psychophysics is concernedwith the study of spatial perception and the comparison of physicaland visual space. Unfortunately no one model exists which clearlydescribes visual space and would allow us to predict how elementarygraphical elements will be perceived in a variety of viewing conditions[37]. While it has been proposed to model visual space using hyper-bolic, euclidean, or other geometries, no single geometry has beenshown to work under all viewing conditions. Instead, researchers have

attempted to mathematically describe the differences between physi-cal and perceived magnitude of objects as collected from user studies.One popular function describing this difference is Stevens’ [34] powerlaw: J = λDα , with J = judged magnitude, D = actual magnitude,α = exponent, λ = scaling constant. It has been tested under varyingconditions, and several values for α have been proposed for judgingelementary graphical elements (visual variables) such as length, area,or position. Wagner [37] gives a recent meta-analysis of 104 articlesreporting 530 values for α collected under different conditions. Nocombination of conditions matched those of viewing elements on wall-sized displays. The reported exponents can, thus, help us hypothesizebut not predict how reading elementary graphical variables may be af-fected in our work environment. As no previous study matches ourviewing conditions, we conducted our own experiments under condi-tions close to how one would work in front of a wall-sized display. Ourconditions involved: binocular vision, eye movement, changing headpositions and viewing distances, and a back-lit viewing surface.
Psychophysics has developed several methods to help assess aviewer’s visual perception of an object and to, thus, compare its mag-nitude (e. g., size) in the physical space to its subjectively experi-enced magnitude in a person’s perceived visual space. Methods in-clude numeric estimation, magnitude production, and sensitivity mea-sures [37]. There is a debate as to which method is the best to mea-sure the perceived magnitude of a given object. The methods of nu-meric estimation have been used in many experiments in the past (e. g.,[14, 20, 23, 37, 39]). In our experiment we chose to use a magnitudeproduction methodology. Here observers are asked to match two typesof perceptions. Participants are shown a “standard” modulus objectand are asked to change the intensity of a second object (the stimu-lus) until it is perceived to be equivalent to the modulus. We chosea magnitude production methodology for our experiment as the com-parison judgements it requires are extremely frequent in informationvisualization [19]. We give additional justification in Section 4.
It is known that no exponent for Steven’s law holds under all view-ing conditions [38]. Given the large number of varying factors, nonethat matched our study setup in its entirety, we have to use averageexponents for forming study hypotheses. Wagner [37] reports the fol-lowing average exponents for studies on perception tasks: 1.02 forposition and length, 0.84 for area, and 0.76 for angle. These statethat generally people’s judgement for position and length is consistentwith actual positions and lengths, while angles and areas are underesti-mated compared to their real sizes. It has further been investigated howthe visual angle—the angle a viewed object creates on the retina—andviewing distance influences the perception of visual variables [18, 29].In order to derive hypotheses from articles suggesting an influence,we calculated viewer-object distances and visual angles for distinct re-gions on our wall size display as can be seen in Fig. 3.
4 STUDY MOTIVATION
Given previous work we expect that locations with smallest visual an-gles (resulting from object size, position, and viewing distance) willresult in larger visual distortion of the perceived visual variables. Tounderstand the effect of different display locations and viewing dis-tances in detail we conducted two magnitude production experiments.
In Experiment 1, our goal was to determine how different objectpositions and sizes affect perception, by asking participants to interac-tively decrease the magnitude of an object’s visual variable to matchthe magnitude of another object’s visual variable at another area in thedisplay. This is motivated by the following scenario: People positionthemselves in front of information of interest to facilitate their tasks[6, 16]. When assessing information of interest, the data elements of-ten have to be placed within their larger context, to determine howthey compare to others (e. g., compared to a legend). Although view-ers could walk to get a closer look at data and walk back, this type ofinteraction comes at a cost of efficiency, especially when data needsto be quickly compared. Furthermore, collaborative settings may re-quire viewers to quickly achieve common ground by comparing whatsomeone else is viewing. For these data analysis scenarios, it is un-clear how the perception of informations is affected by different static
d
θ
y
Peye
Pobjx P’obj
b
Q
heyes
s
β
α
a
x’
q v
Peye(x′,heye,0) Q(x′,y,d);
a =∥∥Pob jPeye
∥∥ b =∥∥∥P′ob jPeye
∥∥∥q =
∥∥PeyeQ∥∥
α = arctan( xq ) β = arctan( x+s
q )
θ = α−β
(a) Calculations for visual angle θ .47°78
60°60
51°73
36°106
29°10430°91
30°10026°126
13°15811°15012°15614°174
6°2215°2156°2198°232
4°2863°2824°2855°295
3°3532°3492°3523°360
2°4201°4172°4192°426
1°4881°4851°4872°493
(b) θ , v for d = 60cm and heye =160cm on our wall.
12°32412°32012°32312°332
12°33112°32712°33011°339
10°35210°34810°35110°359
9°3849°3819°3839°391
7°4257°4227°4247°431
6°4736°4706°4726°478
5°5255°5225°5245°530
4°5804°5784°5804°585
(c) θ , v for d = 320cm and heye =160cm on our wall.
1-8 8-16 16-23 23-30 30-38 38-45 45-53 53-60
(d) Heatmap legend for visual angle in Fig. 3(b) and 3(c).
Fig. 3. Calculations of visual angles θ and viewer-object distance v (incm) on our wall display. We tested screens with red borders in our study.
viewer placements around the wall. In Experiment 1 we, thus, com-pare distortion across three visual variables (Angle, Area, Length) andtry to determine if it is predictable. We attempt to characterize thiseffect and determine when quick comparisons from a stationary view-point, by turning one’s head, are acceptable, and when the potentialdistortion errors are such that they require physical navigation or addi-tional interface widgets to bring remote information closer. The goalof Experiment 2 was to investigate free movement as an alternativeto static viewer placement. In contrast to Experiment 1, participantswere allowed to move freely in front of the wall display. We were in-terested in the movement choices and strategies participants followedwhen allowed to walk, as well as time vs. accuracy trade-offs.
5 HYPOTHESES
From an assessment of the psychophysics and information visualiza-tion literature we derived a number of hypotheses for our experiments:H1: Accuracy results for visual variables follow those of previous
work with lowest absolute error for Length, followed by Area,and Angle (upright) [39].
H2: The nature of judgement errors will differ between different vi-sual variables. Based on our visual angle calculations (Fig. 3)distant objects look smaller and the only depth cues available toviewers are bezels. We thus expect areas to be underestimated onaverage. Angles oriented towards the biggest axis of distortion(Fig. 2) will be overestimated: their line segments look smallerand they will seem more obtuse. As in previous studies [37]lengths will correspond approximately to their actual sizes.
H3: Accuracy decreases with growing distance between viewer andremote object. H3 contrasts H6 in Wigdor et al.’s study [39] thatfound no such effect, as we test much larger left-right distances.
H4: Performance (accuracy and task time) decreases for close view-points as differences in visual angles are more extreme followingH2 and the visual angle calculations in Fig. 3 that show smallervisual angles for remote objects.
H5: The accuracy and nature of judgments of different visual vari-ables is impacted differently for increasing object distances andviewing distances from the wall, but in a predictable way.
H6: Accuracy increases when free movement is allowed, at a cost oftemporal efficiency.

60cm
320cm
Avg.ViewingHeight
A1
A3
A4 E4 H4
E3 H3
E1 H1
5.5m
1.8m
(Viewing Distance: Close)
(Viewing Distance: Far)
Fig. 4. The physical experiment setup showing the dimensions of ourwall and modulus locations using chess notation (stimulus always in A3).
6 EXPERIMENT 1: STATIC COMPARISONS
Participants were placed at two fixed positions left-most in front ofthe wall. We chose left-most positions instead of centered ones as weexpect results to be symmetric left and right and because we couldtest the most extreme distances. At each position participants were re-quested to engage in magnitude production tasks and interactively ad-just the magnitude of an object’s visual variable close to their location,to match the magnitude of the same variable on a remote modulus ob-ject. As a control condition, the two objects were occasionally drawnon the same screen. The works of Cleveland and McGill [12] andWigdor et al. [39] differ slightly to ours as they used a magnitude es-timation methodology. We followed this approach in an original pilotof 16 participants, but found that they tended to round their results tothe closest 10%. This produced very noisy data and as a consequenceresults that were not accurate enough when attempting to predict per-spective distortion. Thus, we decided on a magnitude production ex-periment that bypasses the mental conversion of a size to a number.
6.1 ApparatusWe used a 5.5m(18′)×1.8m(5.9′), tiled wall-sized display consistingof 32 LCD screens of 2560×1600 resolution each. Screens are ar-ranged as seen in Fig. 4 resulting in an effective resolution of 20480 x6400 pixels, and are driven by a 18 workstation cluster. Software waswritten using the ZVTM toolkit with cluster extension [31]. Lightsinside the experiment room were dimmed to reduce glare effects.
6.2 FactorsOur study included three main factors: visual variable, viewing dis-tance from the wall, and modulus location and size.
6.2.1 Visual VariableWe used a subset of Cleveland’s [12] elementary graphical perceptiontasks, namely assessing Length, Angle and Area as they are amongthe most highly ranked by Cleveland [12] and because we hypothe-sized them to be impacted by perspective changes. We did not testposition, slope, and color for the following reasons. In our pilot studywe tested position and found it to be largely unaffected by distortion.Furthermore, testing position is highly impacted by the presence ofbezels, as positions can be easily compared within one single screenfrom a bezel onward. We thus decided not to include it in our finalstudy to reduce time constraints on participants. Slope was not consid-ered as previous work suggests a close relationship to angle judgments[14]. Finally, similar to Wigdor et al. [39], color was not investigated,as color consistency across the wall is hard to achieve under differingviewing angles, creating a likely confound. This is especially true inour setup, as color perception is heavily influenced by the viewing an-gles of particular LCD models [22, 26], and some viewing angles caneven invert color perception.
The interactive object and the remote modulus were drawn with adistinct color of ∼ 81% intensity (#7FFFD4, #FFB6C1). The arms ofthe angles were of different length for modulus and stimulus in order
Fig. 5. Example screens showing the large interactive stimulus (green)the viewers adjusted to match the remote modulus (red) for Length, Areaand Angle. The stimulus was always close to the participant’s location.
to avoid participants making vertical length judgements on the angle’sopen side. Participants were informed about this choice. To minimizepossible influences due to the presence of bezels [4, 11], objects weredrawn fully within a wall tile on a black background. For Length, ob-jects were oriented horizontally. Angle judgements are known to beaffected by angle orientation [37] so we chose to keep a consistentAngle orientation that follows the axis of biggest distortion (the anglebisector was horizontal). In results reported by Wigdor et al. [39] this“upright” angle orientation lead to larger errors than an orientation ro-tated by 90º. Fig. 5 shows examples of how the interactive object andmodulus were drawn if sharing the same screen.
6.2.2 Viewing DistanceParticipants performed tasks at two distances from the wall: Distance-Close = 60cm(∼ 24′′) and DistanceFar= 320cm(∼ 126′′). Distance-Close is within the recommended range for desktop monitor viewing[17]. We chose it because it affords viewing objects in great detail atregular monitor distance, as well as direct-touch interaction. Given aconservative number of 60º for the human visual field outward fromthe nose for each eye, DistanceFar was chosen so that viewers had theentire wall in view when looking straight at it. Fig. 4 gives an overviewof the two viewing distances.
6.2.3 Modulus locations and sizesWe used 9 modulus locations, described in chess notation (Fig. 4).From the left we used columns A, E, and H and rows 1, 3, and 4 fromthe bottom. Given the height of our wall and the average height of ourparticipants, location A3 was always parallel to the viewer’s frontalplane and had the shortest viewing distance in both DistanceClose andDistanceFar (Fig. 3). We refer to A3 as the frontal screen.
For each visual variable, participants were presented with 6 modu-lus sizes (intensities/magnitudes) to produce. These were 10%, 20%,30%, 40%, 60% and 70% of the initial size of the interactive stimulusfor each visual variable. These initial stimulus sizes were always 180o
for Angle, 2560 pixels for Length (a single screen width), and 1280 pix-els for the diameter of Area (half the screen width) respectively. Weensured that these initial sizes allowed the modulus to be visible in thesmallest increments, while still be able to fit on the same screen as theinteractive stimulus for the A3 frontal screen location condition. Dur-ing each trial, the interactive stimulus had to be interactively reducedin size until it perceptually matched the remote modulus.
6.3 Participants and ProcedureFifteen participants (5 female) took part in the study, recruited fromour research institute. They were not paid for their involvement. Par-ticipants ranged from 24–33 years in age (mean & median age 29), 7were students and 8 non-students with technical occupations. All par-ticipants reported normal or corrected-to-normal vision. Twelve par-ticipants reported experience with wall-sized displays in work tasks orgames; the remaining 3 participants reported no previous experience.
Visual variable presentation order was randomized using a latinsquare. Presentation of modulus locations and sizes was also random-ized, and their exact position within their screen location was variedbetween trials. Participants adjusted the size of the interactive objectusing the UP and DOWN arrow keys of a wireless keyboard on a standin front of them. When the desired size was achieved they hit ENTERto terminate the trial. Before each trial started, the screens containingthe stimulus and modulus were highlighted to ensure participants did
Viewing Distance
Mea
n T
ime
(ms)
12500
10000
7500
5000
2500
0
AreaAngle
Close Far
Length
(a) Time.M
ean
Abs
Err
(%
)
30
20
10
Error Bars: 95% CI
Viewing DistanceClose Far
AreaAngle
Length
0
(b) Absolute Error.
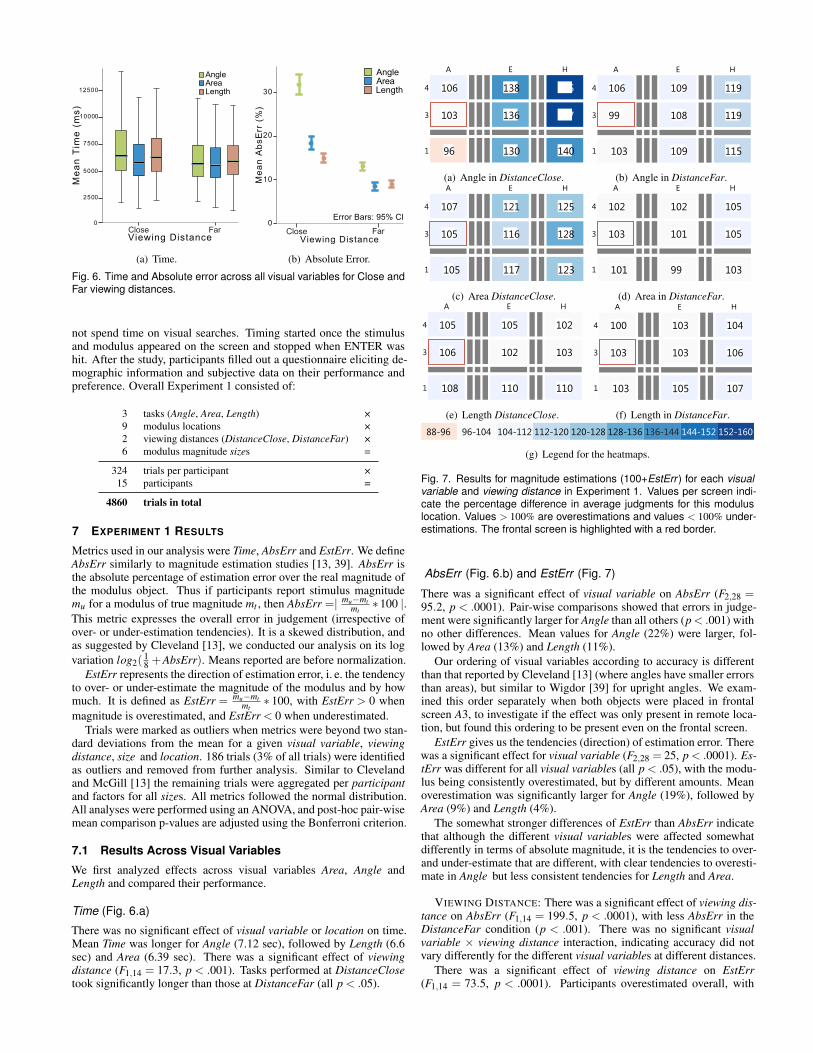
Fig. 6. Time and Absolute error across all visual variables for Close andFar viewing distances.
not spend time on visual searches. Timing started once the stimulusand modulus appeared on the screen and stopped when ENTER washit. After the study, participants filled out a questionnaire eliciting de-mographic information and subjective data on their performance andpreference. Overall Experiment 1 consisted of:
3 tasks (Angle, Area, Length) ×9 modulus locations ×2 viewing distances (DistanceClose, DistanceFar) ×6 modulus magnitude sizes =
324 trials per participant ×15 participants =
4860 trials in total
7 EXPERIMENT 1 RESULTS
Metrics used in our analysis were Time, AbsErr and EstErr. We defineAbsErr similarly to magnitude estimation studies [13, 39]. AbsErr isthe absolute percentage of estimation error over the real magnitude ofthe modulus object. Thus if participants report stimulus magnitudemu for a modulus of true magnitude mt , then AbsErr =| mu−mt
mt∗100 |.
This metric expresses the overall error in judgement (irrespective ofover- or under-estimation tendencies). It is a skewed distribution, andas suggested by Cleveland [13], we conducted our analysis on its logvariation log2(
18 +AbsErr). Means reported are before normalization.
EstErr represents the direction of estimation error, i. e. the tendencyto over- or under-estimate the magnitude of the modulus and by howmuch. It is defined as EstErr = mu−mt
mt∗ 100, with EstErr > 0 when
magnitude is overestimated, and EstErr < 0 when underestimated.Trials were marked as outliers when metrics were beyond two stan-
dard deviations from the mean for a given visual variable, viewingdistance, size and location. 186 trials (3% of all trials) were identifiedas outliers and removed from further analysis. Similar to Clevelandand McGill [13] the remaining trials were aggregated per participantand factors for all sizes. All metrics followed the normal distribution.All analyses were performed using an ANOVA, and post-hoc pair-wisemean comparison p-values are adjusted using the Bonferroni criterion.
7.1 Results Across Visual Variables
We first analyzed effects across visual variables Area, Angle andLength and compared their performance.
Time (Fig. 6.a)
There was no significant effect of visual variable or location on time.Mean Time was longer for Angle (7.12 sec), followed by Length (6.6sec) and Area (6.39 sec). There was a significant effect of viewingdistance (F1,14 = 17.3, p < .001). Tasks performed at DistanceClosetook significantly longer than those at DistanceFar (all p < .05).
A E H
4
3
1
106
103
96
138
136
130
155
157
140
(a) Angle in DistanceClose.
A E H
4
3
1
106
99
103
109
108
109
119
119
115
(b) Angle in DistanceFar.A E H
4
3
1
107
105
105
121
116
117
125
128
123
(c) Area DistanceClose.
A E H
4
3
1
102
103
101
102
101
99
105
105
103
(d) Area in DistanceFar.A E H
4
3
1
105
106
108
105
102
110
102
103
110
(e) Length DistanceClose.
A E H
4
3
1
100
103
103
103
103
105
104
106
107
(f) Length in DistanceFar.
88-96 96-104 104-112 112-120 120-128 128-136 136-144 144-152 152-160
(g) Legend for the heatmaps.
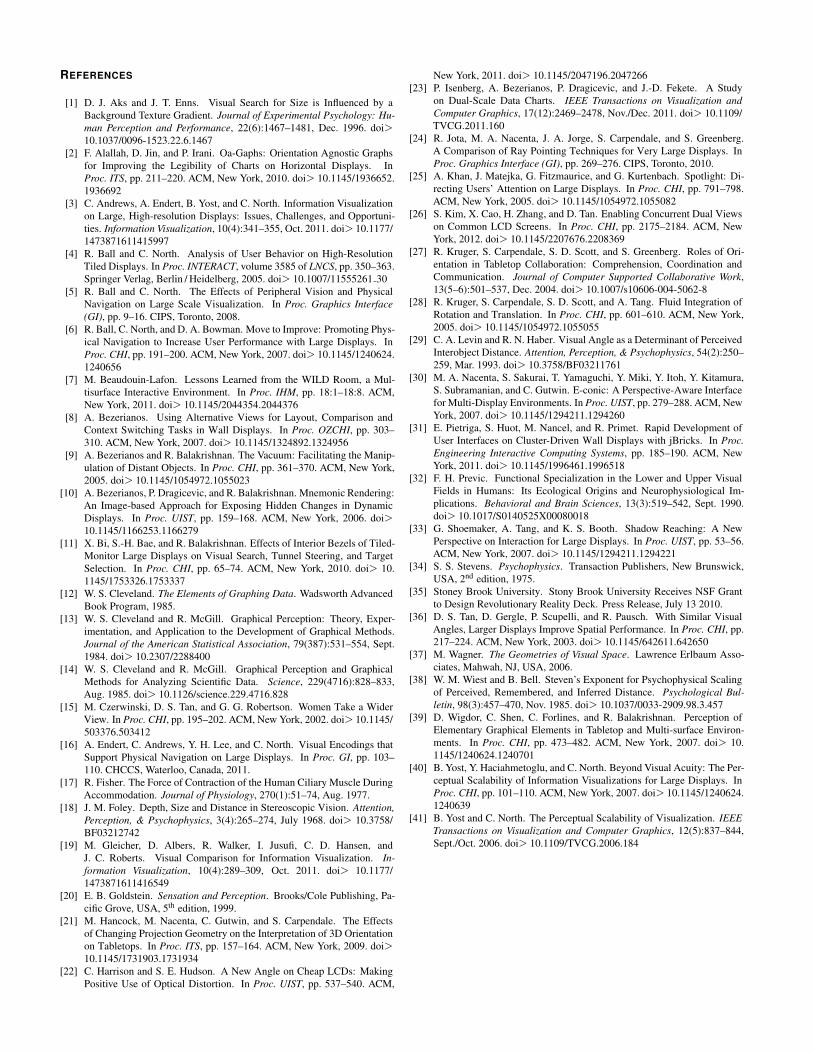
Fig. 7. Results for magnitude estimations (100+EstErr ) for each visualvariable and viewing distance in Experiment 1. Values per screen indi-cate the percentage difference in average judgments for this moduluslocation. Values > 100% are overestimations and values < 100% under-estimations. The frontal screen is highlighted with a red border.
AbsErr (Fig. 6.b) and EstErr (Fig. 7)
There was a significant effect of visual variable on AbsErr (F2,28 =95.2, p < .0001). Pair-wise comparisons showed that errors in judge-ment were significantly larger for Angle than all others (p< .001) withno other differences. Mean values for Angle (22%) were larger, fol-lowed by Area (13%) and Length (11%).
Our ordering of visual variables according to accuracy is differentthan that reported by Cleveland [13] (where angles have smaller errorsthan areas), but similar to Wigdor [39] for upright angles. We exam-ined this order separately when both objects were placed in frontalscreen A3, to investigate if the effect was only present in remote loca-tion, but found this ordering to be present even on the frontal screen.
EstErr gives us the tendencies (direction) of estimation error. Therewas a significant effect for visual variable (F2,28 = 25, p < .0001). Es-tErr was different for all visual variables (all p < .05), with the modu-lus being consistently overestimated, but by different amounts. Meanoverestimation was significantly larger for Angle (19%), followed byArea (9%) and Length (4%).
The somewhat stronger differences of EstErr than AbsErr indicatethat although the different visual variables were affected somewhatdifferently in terms of absolute magnitude, it is the tendencies to over-and under-estimate that are different, with clear tendencies to overesti-mate in Angle but less consistent tendencies for Length and Area.
VIEWING DISTANCE: There was a significant effect of viewing dis-tance on AbsErr (F1,14 = 199.5, p < .0001), with less AbsErr in theDistanceFar condition (p < .001). There was no significant visualvariable × viewing distance interaction, indicating accuracy did notvary differently for the different visual variables at different distances.
There was a significant effect of viewing distance on EstErr(F1,14 = 73.5, p < .0001). Participants overestimated overall, with

larger overestimations in DistanceClose than DistanceFar (p < .001).A significant viewing distance × visual variable interaction (F2,28 =34.5, p < .0001) indicates that the direction of error was affected dif-ferently by viewing distance for each of the visual variables. Pair-wisecomparisons showed all visual variables to be different for Distance-Close (all p< .05) following the global trends described before. In Dis-tanceFar there was no difference between Length and Area, indicatingAngle was overestimated significantly more even in the DistanceFar.
LOCATION: There was a significant effect of screen location onAbsErr (F8,112 = 54.8, p < .0001). AbsErr increased with column dis-tance (all reported effects p < .01): A1,A3,A4 had significant less Ab-sErr than all others, with no difference between screens in that column.Similarly AbsErr in the medium column E1,E3,E4 was significantlyhigher than the screens in A, and lower than remote screens in H. Fi-nally the remote screens H1,H3,H4 had the largest AbsErr. There is,thus, a clear screen grouping across columns in terms of AbsErr.
The effects of direction of estimation are similar, with significanteffect of screen location on EstErr (F8,112 = 26.3, p < .0001). Overallparticipants overestimated, and overestimation increased with columndistance A< E <H (Fig. 7). Overestimation on the column A1,A3,A4was significantly less than all others, screens in the middle E1,E3,E4had significantly larger EstErr than the first column, and significantlysmaller EstErr than the two upper screens in the last column (all p <.05). We also observed a tendency (p< .1) for row 1 (lower screens) tohave a lower average EstErr than the other screens in the same column.
Visual variabless were affected differently by location. There was asignificant location× visual variable interaction on AbsErr (F16,224 =1.9, p < .01). Pair-wise comparisons (all p < .05) showed no differ-ence between techniques in column A. Nevertheless the overall errorof Angle increased compared to the others in the middle E and far col-umn H. In E Angle has significantly larger AbsErr than Length, and inH larger than Area as well. No significant difference between Area andLength was found, nor significant effects depending on screen height.
The direction of error had clearer effects. There was a signifi-cant location × visual variable interaction on EstErr (F16,224 = 30.2,p < .0001). Pair-wise comparisons (all p < .05) showed that Anglewas overestimated more compared to other visual variables in mostlocations, but that this is not the case in screen A1 (lower screen closeto the participant). In this location the estimation of Angle was sig-nificantly less than in all other screens for all visual variables (theinverse trend from all other locations). Moreover, Length which tendsto have a small overestimation, had one of the largest overestimationsin screen A1. In the middle column E, we found no difference be-tween visual variable at the lower screen E1, although for the 2 higherscreens Angle was significantly overestimated. In the far column H,all techniques were different at H3,H4. But again for the lower screenH1 effects were less pronounced, with only Angle being different fromthe others. The effects stem mainly from the DistanceClose condition(all p < .05), but similar trends appear in DistanceFar (p < .1).
In summary, the effects of the screen height seen in EstErr were notas strong in AbsErr, indicating that it was the tendencies to over- andunder-estimate that changed with screen height, not the absolute error.
SIZE: As in previous work [13, 39] we aggregated the results ofdifferent modulus sizes for the main analysis above. In a separate anal-ysis, we also tested for effects of size (a separate factor of 6 possiblevalues). We found a significant effect of size on AbsErr (F5,70 = 12.1,p < .0001). Overall AbsErr decreased with the increase of object size,although only the two larger targets had significantly less AbsErr thanother target sizes (p < .05).
A significant size × visual variable interaction (F10,140 = 39.2,p < .0001) was also present. When looking at the effect of size onthe different visual variables we found that for the four smaller sizesAngle had significantly larger AbsErr than all others, with no differ-ence between visual variables for the 2 large sizes. Fig. 8 shows that(especially in DistanceClose) the AbsErr drops for larger sizes, witha difference in the amount of decrease between visual variables untilthere is little difference on larger object sizes.
10
60
50
40
30
20
10
0
Error Bars: 95% CIViewing Distance: Close
AreaAngle
Length
Mea
n A
bsE
rr (
%)
Modulus Size (%)20 30 40 50 60 70
(a) Size for DistanceClose.
Error Bars: 95% CIViewing Distance: Far60
50
40
30
20
10
0
Mea
n A
bsE
rr (
%)
10Modulus Size (%)
20 30 40 50 60 70
AreaAngle
Length
(b) Size for DistanceFar.
Fig. 8. Absolute error across all visual variables for the 6 modulus (tar-get) sizes tested, for Close and Far viewing distances.
7.1.1 Summary
Our analysis showed no significant difference between visual vari-ables for task Time, but a difference for the two error metrics.
The absolute error follows the ordering reported by Wigdor et al.[39], with Angle being the most error-prone and Length the least. Ab-sErr tends to increase when viewers are close to the screen, and whenthe distance to the remote object increases, with Angle being mostaffected. This last finding merits further discussion. An effect ofstimulus-modulus distance was also reported by Cleveland [13], butWigdor et al. [39] suggested that it may have been due to a possibleconfound in the original study. We discuss these findings in Section 9.We also found that the absolute estimation error decreased with theincrease of object size. The rate of decrease was more steep for Angle(and somewhat less for Area), until errors were similar across visualvariables for the largest object sizes.
The nature of over- or under- estimation was different per visualvariable: Angle was consistently overestimated, except on screen A1,whereas Length and Area were less consistent in their tendencies (es-pecially Length). The generally observed nature of overestimation wasless pronounced in lower screens. Nevertheless, as we move upwardson the wall the overestimation becomes more pronounced for Anglefollowed by Area. Looking at the estimation averages for Angle andto a lesser degree Area (Fig. 7) the amount of overestimation is lowestin the lowest screens of the same column, whereas Length tended tobe overestimated by a larger degree at lower screens, thus balancingEstErr across visual variables in these locations. This indicates thatlower screens are perceived differently. Looking at horizontal screenlocation, Angle was affected the most, and Length the least, with esti-mates going up faster with horizontal distance.
7.2 Predicting Visual VariablesIn the previous section we compared the visual variables. We nowexamine each visual variable in an attempt to predict their observedbehavior for our study setup. More specifically we examine the effectof the different factors related to perceived magnitude PerMag (that isthe participant’s answer mu) given the true magnitude mt . In our previ-ous findings, effects were similar across rows or columns of the wall,thus we express screen location as a combination of column A,E,H(horizontal displacement), and row 1,3,4 (vertical displacement).
7.2.1 Results for Visual Variable: Angle
We found a significant effect of viewing distance (F1,14 = 89.7, p <.0001), column (F2,28 = 96.8, p < .0001) and row (F2,28 = 65.5, p <.0001) on PerMag, as well as a significant viewing distance × column(F2,28 = 81.5, p < .0001) and viewing distance × row (F2,28 = 19.8,p < .0001) interaction. Pair-wise comparisons (all p < .05) showedthat overestimation of Angle was significantly different between thethree different columns, increasing with column distance. This effectwas present both in DistanceClose and DistanceFar, although less pro-nounced in DistanceFar (all p < .05). For rows, the lower screens(row 1) always had significantly less overestimation, with no otherdifferences. This effect was only present in DistanceClose, with no

difference due to screen row in DistanceFar. There was also an effectof size on PerMag (F5,70 = 1895.3, p < .0001), with all sizes beingperceived differently (all p < .0001).
ANGLE PREDICTION Based on the above, we expect that the per-ceived Angle increases with the increase of the factors size, columnand row, and decreases with the factor viewing distance. Indeed, wefound a positive Pearson correlation between the dependent variablePerMag, the true object size (r = 0.943, n = 1620, p < .0001) andscreen column (r = 0.161, n = 1620, p < .0001), and a negative cor-relation with viewing distance (r =−0.12, n = 1620, p < .0001). Wefound no significant correlation with row, but there was a clear trend(p = .07). No correlations were found between the predictor variables,indicating they are mutually independent. Thus we feel these factorsare enough to predict the perceived angles. To verify this hypothesisfor our setup, we ran a multiple linear regression analysis using theabove factors. We obtained a very good fit for predicting the reportedangles (R2 = .93, Adjusted R2 = .93). In our regression analysis weexpressed viewing distance, column and row in cm, and the predictedand actual angles in angle degrees. Table 1 summarizes the coefficientsthat predict Angle in our setup.
7.2.2 Results for Visual Variable: AreaA significant effect of viewing distance (F1,14 = 60.3, p < .0001), col-umn (F2,28 = 9.2, p < .01) and row (F2,28 = 5.4, p < .01) on PerMagwas present, and a significant viewing distance× column (F2,28 = 28.4,p < .0001) interaction. Overestimation of Area was significantly dif-ferent between the three different columns, increasing with column dis-tance. The effect was due to the DistanceClose condition (all p < .05).For screen row, the lower screens (row 1) had significantly less overes-timation than the higher ones, with no other differences (all p < .05).There was also an effect of size on PerMag (F5,70 = 3847.4, p< .0001),with all sizes being perceived differently (all p < .0001).
AREA PREDICTION We expected that perceived Area will increasewith increasing factors size, column and row and decrease whenincreasing viewing distance. Indeed, we found a positive Pearsoncorrelation between the dependent variable PerMag, the actual size(r = 0.969, n = 1620, p < .0001) and column (r = 0.05, n = 1620,p< .05), and a negative correlation with viewing distance (r =−0.096,n = 1620, p < .0001). We found no significant correlation with rowand no correlations between the predictor variables. Thus, these fac-tors (excluding row) are enough to predict the perception of areas. Toverify this hypothesis, we ran a multiple linear regression analysis us-ing the above factors. We obtained a very good fit (R2 = .925, Ad-justed R2 = .925), although column had a very small influence. In ouranalysis we expressed viewing distance and column in cm, and the pre-dicted and actual areas in cm2. Table 1 summarizes the coefficientsthat predict Area in our setup.
7.2.3 Results for Visual Variable: LengthWe found a significant effect of viewing distance (F1,14 = 8.3, p < .05)and of row (F2,28 = 6.7, p < .01) on PerMag. Results show that par-ticipants overestimated to a larger extend in DistanceClose. Moreover,objects in the lower screens (Row 1) were significantly overestimatedcompared to the other two rows (all p < .05). There was also a sig-nificant effect of size on PerMag (F5,70 = 3953.6, p < .0001) with allsizes being significantly different.
LENGTH PREDICTION Given these results, we expect that the per-ceived Length increases with increasing size, and decreases with the in-crease of factors row and viewing distance. Nevertheless, a correlationanalysis (over all factors), only shows a significant positive Pearsoncorrelation between the dependent variable PerMag and the actual size(r = 0.971, n= 1620, p< .0001). Thus factor size should be enough topredict perceived lengths. To verify this hypothesis for our setup, weran a linear regression analysis using size only as a factor. We obtaineda very good fit (R2 = .939, Adjusted R2 = .939) for predicting the re-ported lengths. For our analysis we expressed the predicted and actualsize in cm. We summarize the coefficients of the linear relationshipthat predicts lengths in our setup in Table 1.
Perceived Size Magnitude Coefficients
Angle (degrees) Area (cm2) Length (cm)
Constant 4.286* (0.931) 0.022* (0.003) -3.124* (0.167)
True Magnitude mt 0.977* (0.007) 1.027* (0.007) 0.944* (0.006)
Viewing Distance (cm) -0.35* (0.002) -0.11* (0.001)
Screen X (cm) 0.32* (0.001) 3.768·10−5∗ (0.000)
Screen Y (cm) 0.3* (0.004)
R-square 0.932 0.925 0.939Adjuster R-square 0.932 0.925 0.939Number of observations 1620 1620 1620Standard errors are reported in parentheses.* indicates significance at the 99% level.
Table 1. Regression analysis coefficients C. For our setup the perceivedsize can be predicted using the following equation PerMag =Constant +Cmt ∗mt +CDistance ∗Distance+CscreenX ∗ScreenX +CscreenY ∗ScreenY .
7.2.4 Discussion on PredictionWe note that in our setup a linear relationship between size and theother factors is enough to provide a very accurate model of the per-ceived magnitudes. Even though perception of magnitude of visualvariables follows a power low relationship with their true magnitude[37], an initial curve fitting (per visual variables, and viewing distance)showed an almost linear relationship (α very close to 1). We believethis is due to the fairly small amount of sizes tested (6) comparedto other perception studies. We expect that with an increase of sizestested we will be able to observe such a power law behavior and furtherimprove our model.
Although not reported, we tested visual angle and viewer-object dis-tance (Fig. 3) as predictors of perceived magnitude. An inverse corre-lation was present (smaller visual angles lead to larger overestimation,larger viewer-object distances to smaller overestimation), but their in-fluence is different at the two user distances. For example, Column Eand H have similar visual angles at DistanceClose and DistanceFar,and Column H and E similar viewer-object distances (Fig. 3) but mag-nitude estimations were quite different (Fig. 7). Thus we feel the re-ported models are better predictors.
7.3 QuestionnaireWe were further interested in the influence of the bezels. As we couldnot measure their influence directly, we asked participants for theirstrategies in solving the tasks and if they involved bezels. Thirteenparticipants reported to have used bezels, most of them for the Lengthtask, but some noticed that bezels were only useful as landmarks forthe larger sizes. It would be interesting to study the influence of bezelsfurther in a dedicated experiment with the use of an eye-tracker.
8 EXPERIMENT 2: STATIC VS. MOVING
In Experiment 1 our goal was to understand and predict the effect ofvisual distortion while viewers stand at close and far locations in frontof the wall display. We motivated this choice by scenarios in whichviewers stand in specific locations conducting detailed tasks, and wantto occasionally make quick visual comparisons with objects at distantlocations (such as a comparison to a legend placed elsewhere). Nev-ertheless, we acknowledge that if the main task of the viewer is thecomparison itself, they may decide to move in front of the wall togain a better perspective of the information to compare. We, thus, con-ducted a follow-up study where participants were able to move freely,tracked using a Vicon motion capturing system (www.vicon.com).
Nine participants of the original study (3 female) took part in thesecond study a week later. Given that the stronger effects observedin our first study were in the farthest column, we only tested theselocations (and the frontal screen A3) - 4 locations overall. Participantsstarted each trial close to the screen (as in DistanceClose) and werethen able to move freely to perform their task. We analyzed theseresults with the results for DistanceClose and DistanceFar of our firststudy for the specific modulus locations.

Overview Strategy Step-Back StrategyTarget Strategy
WallStimulus Modulus
Fig. 9. Three participants’ actual motion paths showing the three differ-ent types of moving strategies. We also illustrate possible modulus andstimulus locations and participants’ viewing angles.
Overall Experiment 2 had:
3 tasks (Angle, Area, Length) ×4 modulus locations (including A3) ×3 viewing distances (DistanceClose, DistanceFar, ViewerMove) ×6 modulus magnitude sizes =
216 trials per participant ×9 participants =
1944 trials in total
8.1 Results8.1.1 Moving StrategyThree moving strategies emerged during our experiment. Four partici-pants adopted an overview strategy, walking to the center of the displayat a far distance (∼ 3m), to observe both stimulus and modulus under acomparable visual angle in each direction. Three participants adopteda move to target strategy, walking until they arrived almost in front ofthe remote modulus. Finally, two participants performed a step-backstrategy, moving slightly backwards from their original position (∼1m) to look at the remote modulus. Sample strategy profiles can beseen in Fig. 9. Participants tended to be consistent in their strategiesthroughout the experiment. We observed changes only in the targetstrategy, where towards the end of the experiment participants tendedto stop partway (∼ 1m) before completely reaching the target. All par-ticipants performed tasks by first making an approximate judgementand then used walking to verify or adjust their initial judgement. Allparticipants moved only once per trial.
AbsErr means were larger with the step-back strategy (20.4%), fol-lowed by the target strategy (11.1%), and with overview being themost accurate (9.5%). A Kruscal Wallis non-parametric test showeda significant effect of strategy on AbsErr (Chi− square(2) = 13.1,p < .01). Pair-wise comparisons showed that step-back was signifi-cantly more error phone than the others (all p < .001).
We also looked for learning effects between trials for each strat-egy, to see if participants’ accuracy increased over time. Although wefound no significant learning effect, when asked, five out of nine partic-ipants mentioned that after the end of the walking experiment they feltthey could more accurately make estimations (even without walking).This leads us to believe that viewers can learn to self correct for visualdistortion, a topic we plan to explore further in the future.
8.1.2 Static vs. Moving (Fig. 10)
ABSERR: There was a significant effect of viewing distance (F2,16 =18.2, p < .0001) and visual variable (F2,16 = 9.2, p < .0001) onAbsErr, as well as a visual variable × viewing distance interaction(F4,32 = 3.3, p < .05). Pair-wise comparisons (all p < .05) showedthat AbsErr was significantly higher in DistanceClose (25%), withno difference between DistanceFar (12.6%) and ViewerMove(12.4%).Again, AbsErr was significantly higher for Angle (23%), followed byArea (14.5%), and Length (12.5%). This difference between visualvariables was due to DistanceClose mainly, with no difference be-tween visual variables in DistanceFar and ViewerMove (all p < .05).
TIME: There was a significant effect of viewing distance (F2,16 =10.3, p < .0001) on Time. Pair-wise comparisons (all p < .05) showedmean times to be significantly different between all viewing distancesfor the tested locations. DistanceFar was faster (6 sec), followed byDistanceClose (6.7 sec), and was almost double for ViewerMove (13.1
40
30
20
10
0
Mea
n A
bsE
rr (
%) Error Bars: 95% CI
Close Far MovingViewing Distance
AngleAreaLength
(a) AbsErr
30000
20000
10000
0
AreaAngle
Length
Close Far MovingViewing Distance
Mea
n T
ime
(ms)
(b) Time
Fig. 10. Absolute Errors and Times for visual variables in Experiment 2.
sec). Thus, the accuracy benefits for ViewerMove come with a timecost, while DistanceFar is both faster and has similar accuracy.
9 DISCUSSION
Our studies showed several interesting results in regards to our ini-tial hypotheses. In H1 we had hypothesized that results would followprevious work [39] and rank visual variables with increasing absoluteerror for length, area and angle (upright). Since we chose an angleorientation that is proven to be very error prone [39], our findings alsofollow this order, with angle being the most error prone visual variable(in all screens, including the frontal screen A3).
Based on previous work of Wagner who had conjectured that vi-sual space was compressed in the in-depth dimension leading to angleoverestimation [37], we had hypothesized (H2) that angles would beoverestimated. This was indeed the case. We had also hypothesizedthat areas would be underestimated. This was contrary to our findings,with areas being overestimated. A possible explanation comes fromrelated work. Aks and Enns [1] found that the addition of a grid to ascene of objects placed in 3D lead viewers to make object size correc-tions, hinting at a possibility that bezels may be used similarly. Oneof our participants accordingly stated “I compensated for my perspec-tive.” It is possible that our participants in an attempt to self-correctfor perspective distortion did in fact self-correct too much. This effectwas not as pronounced in length estimations and perhaps participantsused bezels more successfully to estimate lengths than areas. Givenparticipants’ comments it is likely that results on length estimationmay differ for a similar study on a seamless wall without bezels. Nev-ertheless results on angles and areas will most likely hold.
In H3 we hypothesized that the effects of H2 would increase withdistance between stimulus and modulus. This was the case when par-ticipants were close to the wall, while the effect was less visible whenthey were far. The effect was present for both Angle and Area, and toa lesser extend for Length, confirming H3. In the work of Clevelandet al. [13] such an effect was observed as well, but not by Wigdor etal. [39], where it was shown that left-right distances did not lead to in-creasing error. We showed that the effect exists, and it was most likelynot observed in [39] because they tested much smaller left-right dis-tances and, thus, differences in visual angles, than our Experiment 1.
We partially confirmed H4. Participants were slower when standingclose to the wall, but not significantly so. For accuracy, we confirmedan increase in absolute error when standing close to the wall for allvisual variables. In the questionnaire, all participants also reportedthat the tasks were easier to accomplish when standing far away.
In H5 we hypothesized that visual variables would be independentlyimpacted by changes in viewing angle and distance but were less sureabout the nature of the impact. Indeed we found very different behav-ior across visual variables. In general Angle was most impacted withhighest inaccuracy. Although Angle judgments had a consistent overes-timation tendency, estimations were smaller in the lower screens com-pared to other screens in the same column. Area had similar effects ofincreasing overestimation with left-right distance and a tendency forsmaller estimations at lower screens, although the effects were mainly

pronounced in DistanceClose. The judgements for Length were alsoaffected by screen height, but in the inverse way. Length estimationsthat were on average closer to the real object values were overesti-mated in lower screens (an effect most visible in DistanceClose). Pre-vious work in the physiology literature found a difference for visualactivities in the upper- and lower visual fields [32], pointing to an in-teresting venue for further investigation for wall-sized displays.
Finally, in Experiment 2 we tested H6 related to walking, focus-ing on extreme distance and distortion conditions (last column on thewall). As expected, accuracy for estimations from a static positionclose to the wall was worse than when participants were allowed tomove. However, we found no difference in perception accuracy be-tween moving and standing on a static position far from the wall.Moreover, the task completion time was more than twice as long inthe moving condition and participants complained about fatigue.
10 IMPLICATIONS FOR DESIGN
The results of our experiments apply to explicit comparison tasks thatinvolve a quantitative comparison component [19] such as finding sim-ilarities, differences and trends, spotting outliers, or acquiring a quickoverview. One of the goals of our experiments was to derive designconsiderations for visualizations for wall-sized displays that requirethese tasks. Our main questions in regards to workspace design were:
Are all areas of a wall equally effective for close scrutiny and com-parison of data items?Our analysis showed that indeed it is not recommended to comparedata in certain screen locations as the error introduced reached as faras 157%/128%/110% overestimation for the three visual variables. Wealso found that lower screens tend to be somewhat unpredictable intheir perception trends. We suggest that task-relevant data representa-tions should not be placed at the lower positions on the wall. This is ofimportance to visualization designers, given that traditionally visuallegends are placed at the bottom of visualizations and these legendsoften require visual comparisons (e. g., in a bubble chart the quantitiesrepresented by bubble sizes). Lower screens should be dedicated towidgets or contextual data that does not need to be reliably compared,such as visualization titles or numeric information about the data.
Should we redesign visualizations for walls for better comparison?When viewers were close to the wall, we found that judgement accu-racy for Angle, and to a lesser degree Area, started to drop for targetsplaced as far way as half the wall width (∼ 3m). Length was leastaffected by screen position and distances. When magnitude compari-son tasks are expected to be performed regularly close the wall (e. g.,comparing pie or sector charts) we recommend not to design visualiza-tions such that they require comparison across large distances (morethan 3m), especially for Angle. Given the fairly predictable behaviorof visual variables we were able to identify factors affecting them andto provide approximation models for their perceived sizes that fit ourobserved data very accurately. These models can be used by visual-ization designers to predict visual variable distortion and decide onacceptable distortion effects in their visualizations.
In our experiments we did not test every possible visual variable (fortime reasons). The use of color intensity was previously recommendedas being particularly stable across viewing distances for a visual searchtask [16]. Its effect for comparison tasks, however, will have to befurther investigated. Yet, given the high influence of LCD screens’viewing angles on color perception [22, 26] results may be difficult togeneralize for other large wall setups.
How can we support data comparison at close viewing distanceswithout visualization redesign?We generally found comparisons across long distances when standingclose to the wall most error-prone. If physical movement in front ofthe wall is not possible (e. g., while interacting using direct-touch ormultiple viewers are occupying the area in front of the wall) specificwidgets could be designed to bring far information up-close [9], en-abling accurate comparisons with remote locations. Moreover, design-ers should provide additional aids to help viewers make judgements(e. g. use of tick marks, or value labels inside the visualization), that
can act as guides much as the bezels did in our study. Alternatively, de-signers can use our prediction models to infer perceptual differences,and add additional meta-data on their visualizations about these calcu-lations. At the very least viewers should be warned about distortioneffects if designers deem comparison tasks important in their visual-izations. For example a simple small text field could be added with awarning that “remote angles may appear twice as large” (similar to carmirror warnings for remote objects). Due to visual acuity these textfields could be made small to be only visible when needed, i. e. whenviewers are close to the wall.
Should we encourage walking for comparison tasks?Using interactive widgets in comparison tasks comes with an interac-tion cost. An alternative is physical navigation, which is flexible andnatural to viewers, but in turn comes with a time cost, as our findingsindicate. More surprising was that the mean accuracy was not betterwhen participants could walk compared to a static viewpoint far fromthe wall. Participants’ walking strategies may offer an explanation: aswalking is tiring, some participants walked minimally and were thusstill affected by visual distortion, resulting in higher error rates. Thus,recommendations for walking need to be more specific. Viewers needto either move far from the wall (∼ 3m back), place themselves inthe middle of the two objects to compare, or approach both objectsto compare. Our models can be used to give viewers an approximateunderstanding of the distortion magnitude across the wall to help themdecide when to make quick judgements turning their head, when to useinteraction mediators to bring remote content closer to their focus ofattention, or physically navigate. However, our discussion of walkingguidelines is specific to quantitative comparison tasks. Physical navi-gation has been shown to be beneficial to other tasks such as zooming-in and -out to visually aggregate information [40]). The tradeoffs withthese benefits need to be further investigated.
11 CONCLUSIONS
We conducted two studies to understand distortion effects for informa-tion visualizations placed on large high-resolution wall-sized displays.In the first, we tested two static locations in front of the display andfound that viewing distance from the wall, as well as horizontal andvertical placement, affected errors. Participants performed tasks betterwhen the information was in full view, despite the fact that they stoodfurther away from the display and the objects to compare were visuallysmaller. We tested three visual variables and found that length was rela-tively unaffected by changes in viewing distance and placement on thewall—but area and angle judgments were significantly affected. More-over, performance on the lower locations of the display was foundnot to be consistent with other locations. Finally we proposed predic-tion indicators of how large variations in viewing distances and objectplacement affect the accurate perception of these visual variables.
In the second study, we examined the trade-offs involved when al-lowing viewers to walk. We found that—although moving was asaccurate as static comparisons from afar—it took twice as long andviewers occasionally chose non-optimal moving strategies. Based onthese findings we derived design considerations which recommend toencourage viewers to stand further back from the display when con-ducting quantitative comparison tasks. As such, we support previousrecommendations for different data analysis tasks for wall-sized dis-plays [3] that promoted physical navigation.
If tasks need to be conducted close to the wall display, however,viewers should either be encouraged to physically navigate the wallin specific ways to reduce judgement error, or important informationshould be placed directly in front of the viewer or above, and viewersshould be provided with an estimation of the distortion effects pre-dicted by our work.
12 ACKNOWLEDGEMENTS
We’d like to thank Jean-Daniel Fekete for his comments on an earlierdraft of the paper, our reviewers and our study participants.
REFERENCES
[1] D. J. Aks and J. T. Enns. Visual Search for Size is Influenced by aBackground Texture Gradient. Journal of Experimental Psychology: Hu-man Perception and Performance, 22(6):1467–1481, Dec. 1996. doi>10.1037/0096-1523.22.6.1467
[2] F. Alallah, D. Jin, and P. Irani. Oa-Gaphs: Orientation Agnostic Graphsfor Improving the Legibility of Charts on Horizontal Displays. InProc. ITS, pp. 211–220. ACM, New York, 2010. doi> 10.1145/1936652.1936692
[3] C. Andrews, A. Endert, B. Yost, and C. North. Information Visualizationon Large, High-resolution Displays: Issues, Challenges, and Opportuni-ties. Information Visualization, 10(4):341–355, Oct. 2011. doi> 10.1177/1473871611415997
[4] R. Ball and C. North. Analysis of User Behavior on High-ResolutionTiled Displays. In Proc. INTERACT, volume 3585 of LNCS, pp. 350–363.Springer Verlag, Berlin / Heidelberg, 2005. doi> 10.1007/11555261 30
[5] R. Ball and C. North. The Effects of Peripheral Vision and PhysicalNavigation on Large Scale Visualization. In Proc. Graphics Interface(GI), pp. 9–16. CIPS, Toronto, 2008.
[6] R. Ball, C. North, and D. A. Bowman. Move to Improve: Promoting Phys-ical Navigation to Increase User Performance with Large Displays. InProc. CHI, pp. 191–200. ACM, New York, 2007. doi> 10.1145/1240624.1240656
[7] M. Beaudouin-Lafon. Lessons Learned from the WILD Room, a Mul-tisurface Interactive Environment. In Proc. IHM, pp. 18:1–18:8. ACM,New York, 2011. doi> 10.1145/2044354.2044376
[8] A. Bezerianos. Using Alternative Views for Layout, Comparison andContext Switching Tasks in Wall Displays. In Proc. OZCHI, pp. 303–310. ACM, New York, 2007. doi> 10.1145/1324892.1324956
[9] A. Bezerianos and R. Balakrishnan. The Vacuum: Facilitating the Manip-ulation of Distant Objects. In Proc. CHI, pp. 361–370. ACM, New York,2005. doi> 10.1145/1054972.1055023
[10] A. Bezerianos, P. Dragicevic, and R. Balakrishnan. Mnemonic Rendering:An Image-based Approach for Exposing Hidden Changes in DynamicDisplays. In Proc. UIST, pp. 159–168. ACM, New York, 2006. doi>10.1145/1166253.1166279
[11] X. Bi, S.-H. Bae, and R. Balakrishnan. Effects of Interior Bezels of Tiled-Monitor Large Displays on Visual Search, Tunnel Steering, and TargetSelection. In Proc. CHI, pp. 65–74. ACM, New York, 2010. doi> 10.1145/1753326.1753337
[12] W. S. Cleveland. The Elements of Graphing Data. Wadsworth AdvancedBook Program, 1985.
[13] W. S. Cleveland and R. McGill. Graphical Perception: Theory, Exper-imentation, and Application to the Development of Graphical Methods.Journal of the American Statistical Association, 79(387):531–554, Sept.1984. doi> 10.2307/2288400
[14] W. S. Cleveland and R. McGill. Graphical Perception and GraphicalMethods for Analyzing Scientific Data. Science, 229(4716):828–833,Aug. 1985. doi> 10.1126/science.229.4716.828
[15] M. Czerwinski, D. S. Tan, and G. G. Robertson. Women Take a WiderView. In Proc. CHI, pp. 195–202. ACM, New York, 2002. doi> 10.1145/503376.503412
[16] A. Endert, C. Andrews, Y. H. Lee, and C. North. Visual Encodings thatSupport Physical Navigation on Large Displays. In Proc. GI, pp. 103–110. CHCCS, Waterloo, Canada, 2011.
[17] R. Fisher. The Force of Contraction of the Human Ciliary Muscle DuringAccommodation. Journal of Physiology, 270(1):51–74, Aug. 1977.
[18] J. M. Foley. Depth, Size and Distance in Stereoscopic Vision. Attention,Perception, & Psychophysics, 3(4):265–274, July 1968. doi> 10.3758/BF03212742
[19] M. Gleicher, D. Albers, R. Walker, I. Jusufi, C. D. Hansen, andJ. C. Roberts. Visual Comparison for Information Visualization. In-formation Visualization, 10(4):289–309, Oct. 2011. doi> 10.1177/1473871611416549
[20] E. B. Goldstein. Sensation and Perception. Brooks/Cole Publishing, Pa-cific Grove, USA, 5th edition, 1999.
[21] M. Hancock, M. Nacenta, C. Gutwin, and S. Carpendale. The Effectsof Changing Projection Geometry on the Interpretation of 3D Orientationon Tabletops. In Proc. ITS, pp. 157–164. ACM, New York, 2009. doi>10.1145/1731903.1731934
[22] C. Harrison and S. E. Hudson. A New Angle on Cheap LCDs: MakingPositive Use of Optical Distortion. In Proc. UIST, pp. 537–540. ACM,
New York, 2011. doi> 10.1145/2047196.2047266[23] P. Isenberg, A. Bezerianos, P. Dragicevic, and J.-D. Fekete. A Study
on Dual-Scale Data Charts. IEEE Transactions on Visualization andComputer Graphics, 17(12):2469–2478, Nov./Dec. 2011. doi> 10.1109/TVCG.2011.160
[24] R. Jota, M. A. Nacenta, J. A. Jorge, S. Carpendale, and S. Greenberg.A Comparison of Ray Pointing Techniques for Very Large Displays. InProc. Graphics Interface (GI), pp. 269–276. CIPS, Toronto, 2010.
[25] A. Khan, J. Matejka, G. Fitzmaurice, and G. Kurtenbach. Spotlight: Di-recting Users’ Attention on Large Displays. In Proc. CHI, pp. 791–798.ACM, New York, 2005. doi> 10.1145/1054972.1055082
[26] S. Kim, X. Cao, H. Zhang, and D. Tan. Enabling Concurrent Dual Viewson Common LCD Screens. In Proc. CHI, pp. 2175–2184. ACM, NewYork, 2012. doi> 10.1145/2207676.2208369
[27] R. Kruger, S. Carpendale, S. D. Scott, and S. Greenberg. Roles of Ori-entation in Tabletop Collaboration: Comprehension, Coordination andCommunication. Journal of Computer Supported Collaborative Work,13(5–6):501–537, Dec. 2004. doi> 10.1007/s10606-004-5062-8
[28] R. Kruger, S. Carpendale, S. D. Scott, and A. Tang. Fluid Integration ofRotation and Translation. In Proc. CHI, pp. 601–610. ACM, New York,2005. doi> 10.1145/1054972.1055055
[29] C. A. Levin and R. N. Haber. Visual Angle as a Determinant of PerceivedInterobject Distance. Attention, Perception, & Psychophysics, 54(2):250–259, Mar. 1993. doi> 10.3758/BF03211761
[30] M. A. Nacenta, S. Sakurai, T. Yamaguchi, Y. Miki, Y. Itoh, Y. Kitamura,S. Subramanian, and C. Gutwin. E-conic: A Perspective-Aware Interfacefor Multi-Display Environments. In Proc. UIST, pp. 279–288. ACM, NewYork, 2007. doi> 10.1145/1294211.1294260
[31] E. Pietriga, S. Huot, M. Nancel, and R. Primet. Rapid Development ofUser Interfaces on Cluster-Driven Wall Displays with jBricks. In Proc.Engineering Interactive Computing Systems, pp. 185–190. ACM, NewYork, 2011. doi> 10.1145/1996461.1996518
[32] F. H. Previc. Functional Specialization in the Lower and Upper VisualFields in Humans: Its Ecological Origins and Neurophysiological Im-plications. Behavioral and Brain Sciences, 13(3):519–542, Sept. 1990.doi> 10.1017/S0140525X00080018
[33] G. Shoemaker, A. Tang, and K. S. Booth. Shadow Reaching: A NewPerspective on Interaction for Large Displays. In Proc. UIST, pp. 53–56.ACM, New York, 2007. doi> 10.1145/1294211.1294221
[34] S. S. Stevens. Psychophysics. Transaction Publishers, New Brunswick,USA, 2nd edition, 1975.
[35] Stoney Brook University. Stony Brook University Receives NSF Grantto Design Revolutionary Reality Deck. Press Release, July 13 2010.
[36] D. S. Tan, D. Gergle, P. Scupelli, and R. Pausch. With Similar VisualAngles, Larger Displays Improve Spatial Performance. In Proc. CHI, pp.217–224. ACM, New York, 2003. doi> 10.1145/642611.642650
[37] M. Wagner. The Geometries of Visual Space. Lawrence Erlbaum Asso-ciates, Mahwah, NJ, USA, 2006.
[38] W. M. Wiest and B. Bell. Steven’s Exponent for Psychophysical Scalingof Perceived, Remembered, and Inferred Distance. Psychological Bul-letin, 98(3):457–470, Nov. 1985. doi> 10.1037/0033-2909.98.3.457
[39] D. Wigdor, C. Shen, C. Forlines, and R. Balakrishnan. Perception ofElementary Graphical Elements in Tabletop and Multi-surface Environ-ments. In Proc. CHI, pp. 473–482. ACM, New York, 2007. doi> 10.1145/1240624.1240701
[40] B. Yost, Y. Haciahmetoglu, and C. North. Beyond Visual Acuity: The Per-ceptual Scalability of Information Visualizations for Large Displays. InProc. CHI, pp. 101–110. ACM, New York, 2007. doi> 10.1145/1240624.1240639
[41] B. Yost and C. North. The Perceptual Scalability of Visualization. IEEETransactions on Visualization and Computer Graphics, 12(5):837–844,Sept./Oct. 2006. doi> 10.1109/TVCG.2006.184