percepcion remota
DESCRIPTION
percepcion remota y algunas apliacionesTRANSCRIPT

Nat. Hazards Earth .Syst. Sei., 10, 89-95, 2010www.nat-hazards-earth-syst-sci.net/I0/89/20I0/© Author{s) 2010. This work is distributed underthe Creative Commons Attribution 3.0 License.
Natural Hazardsand Earth
System Sciences
Atmospheric correction for satellite remotely sensed data intendedfor agricultural applications: impact on vegetation indices
D. G. Hadjimitsis', G. Papadavid' ^, A. Agapiou', K. Themtstocleous', M. G. Hadjimitsis', A. Retalis^,S. Michaelides*, N. Chrysoulakis^, L. Toulios\ and C. R. I. Clayton''
'Cyprus University of Technology, Department of Civil Engineering and Geotnatics-Remote Sensing Laboratory,Lemesos. Cyprus-Institute for Environmental Research and Sustainable Development, National Observatory of Athens, Athens, Greece'Meteorological Service. Nicosia. Cyprus^Foundation for Research and Technology - Hellas, Institute of Applied and Computational Mathematics, Heraklion,Crete, GreeceNational Agricultural Research Foundation, Larissa, Greece
''School of Civil Engineering and the Environment. University of Southampton, Southampton, UK^Agricultural Research Institute of Cyprus, 1516, Athalassa, Nicosia, Cyprus
Received: 14 April 2009-Revised: 16 December 2009-Accepted: 18 December 2009 - Published: 14 January 2010
.Abstract. Solar radiation reflected by the Earth's surface tosatellite sensors is modified by its interaction with the at-mosphere. The objective of applying an atmospheric cor-rection is to determine true surface reflectance values andto retrieve physical parameters of the Earth's surface, in-cluding surface reflectance, by removing atmospheric effectsfrom satellite images. Atmospheric correction is arguablythe most important part of the pre-processing of satellite re-motely sensed data. Such a correction is especially importantin cases where multi-temporal images are to be comparedand analyzed. For agricultural applications, in which sev-eral vegetation indices are applied for monitoring purposes,multi-temporal images are used. The integration of vegeta-tion indices from remotely sensed images with other hydro-meteorological data is widely used for monitoring naturalhazards such as droughts. Indeed, the most important taskis to retrieve the true values of the vegetation status from thesatellile-remotely sensed data. Any omission of consideringthe effects of the atmosphere when vegetation indices fromsatellite images are used, may lead to major discrepanciesin the final outcomes. This paper highlights the importanceof considering atmospheric etïects when vegetation indices,such as DVI, NDVI. SAVI. MSAVl and SARVI. are used{or considered) and presents the results obtained by apply-ing the darkest-pixel atmospheric correction method on tenLandsat TM/ETM+ images of Cyprus acquired from Julylo December 2008. Finally, in this analysis, an attempt is
Correspondence to: D. G. Hadjimitsis([email protected])
made to determine evapotranspiration and to examine its de-pendence on the consideration of atmospheric effects whenmulti-temporal image data are used. It was found that, with-out applying any atmospheric correction, the real daily evap-otranspiration was less than the one found after applying thedarkest pixel atmospheric correction method.
1 Introduction
Radiation from the Earth's surface undergoes significant in-teraction with the atmosphere before it reaches the satellitesensor. This interaction with the atmosphere is stronger whenthe target surfaces consist of non-bright objects, such as wa-ter bodies or vegetation. This problem is especially signifi-cant when using multi-spectral satellite data for monitoringpurposes, such as agricultural or land use studies. Hence, itis essential to consider the effects of the atmosphere by ap-plying a reliable and efficient atmospheric correction duringpre-processing of digital data. A considerable investigationon the effects of the atmosphere on dark targets has been al-ready performed {Hadjimitsis et al.. 20{)4a. b. 2{)08. 2{X)9a);however, the impact of atmospheric correction on vegetationindices intended for agricultural applications has not beenfully examined yet. Remote sensing data in the lonn of veg-etation indices are widely used for agricultural and land usemonitoring purposes (Hadjimitsis et al.. 2009b; Liang el al.,2008). The effects of the atmosphere at spectral signaturesand vegetation indices have been highlighted by Duggin andPiwinski {1984). Errors occurred by atmospheric elïecis in-fluence the quality of the information extracted from remote
Published by Copernicus Publications on behalf of the European Geosciences Union.

90 D. G. Hadjimitsis et al.: Atmospheric correction for agricultural applications
measurements, such as vegetation indices (Courault et al.,2003). and have been shown to increase the uncertainty up to10%. depending on the spectral band (Che and Price, 1992).
Variations in the composition and distribution of vegeta-tion can arise in response to natural hazard (drought, wind,floods, rain erosion) and anthropic stress (industry, overgraz-ing, fires, land abandonment) and represents one of the mainsource of systematic change on local, regional, or global.scale (Telesca and Lasaponara. 2006).
Regular monitoring of the vegetation status (application ofderived NDVI data) along with the other parameters such asclimate, soil type, and hydrology is needed to delineate theareas that are drought vulnerable. Assessment of DroughtImpact on Agricultural Crops using NDVI by comparingNDVI values for humid and dry period of times can be made(Caparrini and Manzella, 2009).
Vegetation indices (Vis) have been widely used for as-sessing vegetation condition, cover, phenology, and pro-cesses such as evapotranspiration (ET), climate- and land-use-change detection and drought monitoring. Vis are robustsatellite data producís computed the same way across all pix-els in time and space, regardless of surface conditions. Asratios, they can be easily cross-calibrated across sensor sys-tems, ensuring continuity of data sets for long-term monitor-ing of the land surface and climate-related processes (Glennetal.. 2008).
The ability to compare pixel values this way would be use-ful for interpretation through the historical record and be-tween different vegetation cover, assuming that seasonal ef-fects are considered and data were atmospherically corrected.This paper highlights the importance of considering atmo-spheric effects when vegetation indices are used (or con-sidered) and presents the results obtained hy applying thedarkest-pixel atmospheric correction method on ten LandsatTM/ETM+ images of Cyprus acquired from July to Decem-ber 2008.
2 Atmospheric correction
Any sensor that records electromagnetic radiation from theEarth's surface using visible or near-visible radiation willtypically register a mixture of two kinds of energy. Thevalue recorded at any pixel location on a remotely sensedimage does not represent the tme ground-leaving radiance atthat point. Part of the brightness is due to the reflectanceof the target of interest and the remainder is derived fromthe brightness of the atmosphere itself. The separation ofcontributions is not known a priori, so the objective of at-mospheric correction is to quantify these two components:in this respect, the analysis can be based on the corrected tar-get reflectance or radiance values. Many atmospheric correc-tion methods have been proposed for use with multi-spectralsatellite imagery (Hadjimitsis et al.. 2004a). Such meth-ods consist of image-hased methods, methods that use at-mospheric modeling and, finally, methods that use ground
data during the satellite overpass. The Darkest Pixel (DP)atmospheric correction method, also known as the histogramminimum method (Hadjimitsis et al., 2(X)4a), was applied tothe current study. The simplest. DP correction method pro-vided a reasonable correction, at least for cloud-free skies(Hadjimitsis et al.. 2004a). The principle of the DP approachstated that most of the signal reaching a satellite sensor froma dark object was contributed by the atmosphere at visiblewavelengths. Therefore, the pixels from dark targets wereindicators of the amount of upwelling path radiance in thisband. The atmospheric path radiance was added to the sur-face radiance of the dark target, thus giving the target radi-ance at the sensor The surface radiance of the dark target wasapproximated as having zero surface radiance or reflectance(Hadjimitsis et al.. 2004b).
Song et al. (2001} evaluated the effectiveness of seven ab-solute atmospheric correction algorithms ba.sed upon the DPprinciple and one relative atmospheric correction, the mul-titempora! normalization method hy using stable features inthe scene. They made this evaluation based on classificationand change detection accuracies applied on a multitemporaldataset of seven Landsat-5 TM images. They found that thebest overall results with respect to their impacts on imageclassification and change detection accuracies were achievedby using the simpler DP method, rather than the more com-plex atmospheric corrections that combine both atmosphericmodels and the dark object concept. They concluded thatfor applications where surface reflectance is not required,simple atmospheric correction algorithms are recommended.Hadjimitsis et al. (2004a) evaluated also the effectivenessover Landsat TM images of water treatment reservoirs, ofimage-based atmospheric correction algorithms and other al-gorithms that make use of atmospheric modeling. Theyfound that the DP algorithm was the most efficient in theLandsat TM bands hlue. green and red (1, 2 and 3. respec-tively). Chrysoulakis et al. (2010) compared several atmo-spheric correction methods for the area of Crete and inves-tigated the effects of atmospheric correction on land coverclassification and change detection. Four atmospheric cor-rection methods were applied to a time series of ASTERimages and compared. The baseline for this comparison isthe spatial distribution of surface reflectance. The emittedradiance and brightness temperature as derived by ASTERHigher Level Products were used. The comparison showedthat the DP method provided satisfactory results for visible,near infrared and short-wave infrared spectral areas; there-fore it can be used in local level applications related to landcover and vegetation.
3 Vegetation Indices
More than fifty different remote sensing vegetation indiceshave been used in the literature so far (Bannari ct al.. 1995).For agricultural and land use applications, the most widely
Nat. Hazards Earth Syst. Sei., 10. 89-95, 2010 www.nat-hazards-eanh-s y st-sci.net/10/89/2010/

D. G. Hadjimitsis et al.: Atmospheric correction for agricultural applications 91
used vegetation indices are briefly reviewed and presentedbelow.
3.1 Difference Vegetation Index (DVI)
The DVI is a simple index, which is sensitive to the amountof the vegetation, DVI has the ability to distinguish the soiland vegetation hut not in shaded areas. Hence. DVI doesnot give proper information when the reflected wavelengthsare being affected due to topography, atmosphere or shadows(Akkartal et al., 2004). DVI is calculated hy the followingrelationship:
(I)
where R^ is the reflectance at the given wavelength (nm).
3.2 Nurmalizcd DifTerence Vegetation Index (NDVI)
The NDVI is the most common and known vegetation indexand has been proposed by Rouse et al. ( 1974). It is computedas:
NDVI = - ^670)/(/?800 +/?670) •
The sensitivity of the NDVI on atmospheric effects has gen-erated an increasing interest in the development of new vege-tation indices which are less sensitive to atmospheric effects,such as the soil-adjusted vegetation index (SAVI).
3.3 Soil-Adjusted Vegetation Index (SAVI)
The SAVI index has been proposed by Huete (1988) and isgiven by:
where £- is a canopy adjustment factor.This simple model adequately descrihes the soil-
vegetation system. This index includes a canopy backgroundadjustment factor L, which is a function of vegetation den-sity and it requires a prior knowledge of vegetation amounts(Haboudane et al., 2004). To improve the sensitivity ofSAVI to vegetation and to increase its potential to discrim-inating bare soil, Qi et al. (1994) proposed a modified ver-sion, namely, MSAVI (see Eq. 4). Recently. Broge andLeblanc (2000) showed that the MSAVI is the best estima-tor of the Leaf Area Index (LAI) in terms of sensitivity tocanopy effects since it was less affected by variations incanopy parameters and soil spectral properties (Haboudaneet al., 2004). MSAVI is given by:
(4)
in order to further minimize the atmospheric effects on theNDVI index, Kaufman and Tanré (1992) proposed the SoilAtmospherically Resistant Vegetation Index (SARVI). by en-gaging the red-blue channel instead of the red one. The index
Fig. 1, Landsat TM of Cyprus. The iwo study areas are shown;Yeroskipou (left) and Akrotid-Zakaki (right).
is written as:
(2) where ¿ i s a canopy adjustment factor and
(5)
(6)
where R^ are reflectance values with prior correction formolecular scattering and ozone absorption and y is a con-stant used to stabilize the index to variations in aerosol con-tent.
4 Resources and Methodology
4.1 The study area
Two study areas have been selected for use in this research.The first agricultural area is located at Yeroskipou area inPaphos district (the south-west area of Cyprus), consisting ofPapilionaceae (Fabaceae) crop; the second area is located atAkrotiri-Zakaki urea of Limassol district (the south area ofCyprus), consisting of citrus fruit trees as shown in Fig. 1.
4.2 Satellite and field data
Landsat TM/ËTM+ images, taken at 20 and 28 July 2008. 13and 29 August 2008. 14 and 30 September 21)08. 16 Octo-ber 2008, I and 17 November 2008. and 19 December 2008were used. The ERDAS Imagine 9.3 software has been usedfor the processing of the available satellite images. Also,a GERI5(K) tield spectro-radiometer was used to retrievethe true reflectance value of target areas consisting of Pa-pilionaceae (Fabaceae) crops. Spectro-radiometric readingsquantised the amount of atmospheric effects at different tar-gets, thus allowing comparisons to be made with satellite re-trieved reflectance.
www.nat-hazards-earth-syst-sci.net/! 0/89/2010/ Nat. Hazards Earth Syst. Sei.. 10, 89-95, 2010

92 D. G. Hadjimitsis et al.: Atmospberic correction for agricultural applications
4.3 The Methodology
Tbe overall methodology of tbis study is briefly presentedbelow:
(a) Geometric correction of satellite images involves mod-eling tbe relationsbip between ihe image and groundcoordinate systems. Geometric correction and geo-reference of each image at tbe World Geodetic Sys-tem'84 (WGS 84/UTM) projection system was carriedout by selecting an appropriate number of well recog-nized ground control points (i.e. road intersections). Asecond order polynomial transformation was used, inan effort to keep the Root Mean Square Error (RMSE)lower than 1 pixel (see Mather, 2(X)4).
(b) Radiometrie correction of remotely sensed data nor-mally involves ibe processing of digital image to re-duce the influence of errors or inconsistencies (usuallyreferred to as "noise") in image brigbtness values tbatmay limit one's ability to interpret or quantitatively pro-cess and analyze digital remotely sensed images. Tbistask is essential wben bandling multi-temporal images.At first, digital numbers (DN) values were converted tounits of radiance by using standard calibration values.Tben. tbe darkest pixel (DP) atmospheric correctionmethod (also termed as histogram minimum method)was applied to the multi-series satellite images, as de-scribed in Sect. 2. A suitable dark target, sucb as a waterdam has been selected in tbe area under investigation.Tben an average radiance value of tbe dark target hasbeen subtracted from each at-satellite radiance values ineach spectral band.
(c) Calculation of Vegetation Indices and investigation ofthe influence of atmospberic effects by comparing thevalues prior and after atmospberic correction.
(d) Examination of tbe magnitude ofatmospberic effects bycomparing the satellite reflectance values and tbe in situreflectance values acquired during the satellite overpassfor a target area consisting of uniform seasonal crops.
(e) Tbe calculation of real daily evapotranspiration wasused as a tool for assessing the importance of apply-ing an atmospheric correction. Tbe Carlson and Buffummethod (Carlson and Buffum, 1989) calculates dailyevapotranspiration from the daily surface energy budgetusing the following equation:
(7)
where ET is the daily evapotranspiration (cm d ' ), R,, isthe daily net radiation {cmd~^), AT^/At is the averagerate of temperature rise during tbe morning ("Cb"'); Band n are constants depending on wind speed, surface
roughness, vegetation, and reference beigbt. estimatedeitber by representative values or by cbarts.
5 Results
First, ail Landsat images were undergone geometric and ra-diometric corrections. This section provides a detailed de-scription of the impact of atmospheric effects on (.a) the cal-culation of vegetation indices; (b) comparison between at-satellite reflectance and spectro-radiometric values; and (c)the calculation of real daily evapolranspiration.
5.1 Vegetation indices
Tbe mean values of the vegetation indices DVI, NDVI, SAVI,MSAVI and SARVI were calculated, for Akroliri-Zakakiarea consisting of citrus fruit trees, before and after the at-mospheric correction and are presented in Figs. 2-6. A meandifference of 18% for tbe NDVI was recorded before and af-ter tbe darkest pixel method was applied. The MSAVI and es-pecially tbe SARVI vegetation indices seem to be quite accu-rate before and after tbe atmospberic correction. For SARVI,the maximum difference observed was less than 4%, while¡or MSAVI it was 12%. For DVI, a mean difference of 1.8 ofthe index was recorded.
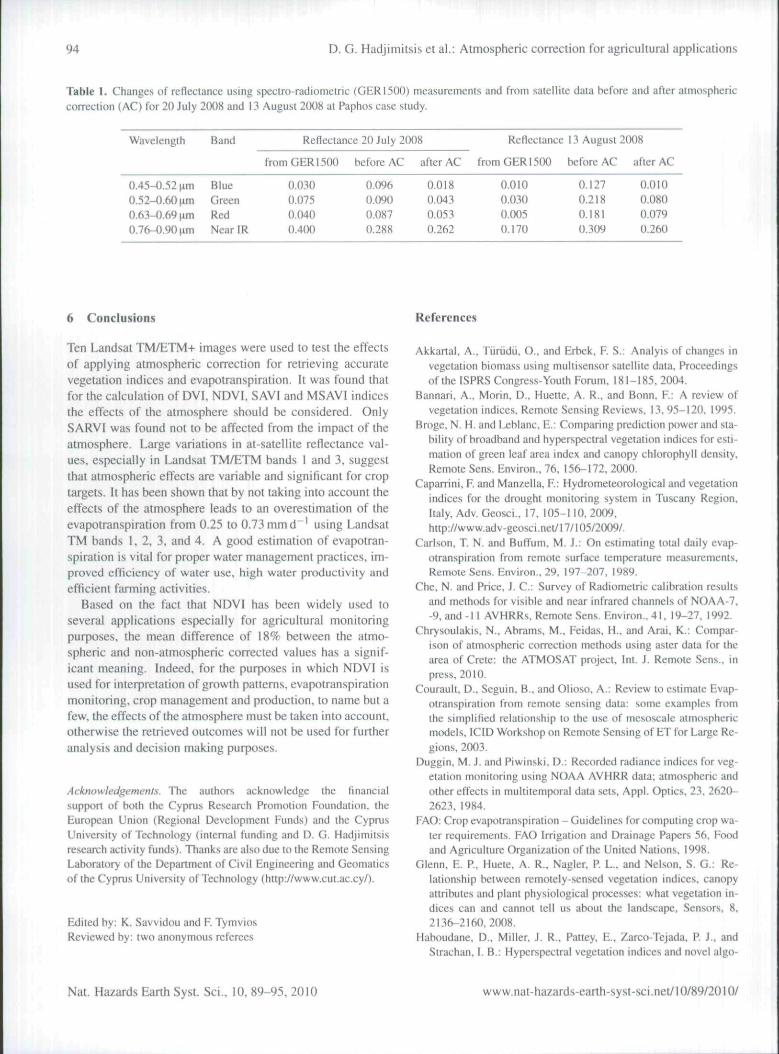
5.2 Compahson between at-satellite reflectance andspectro-radiometric values
Using the ground measurements acquired from tbe GER1500field spectro-radiomcter at Yeroskipou, a direct compari-son was made between the satellite reflectance values andtbe associated ground reflectance values for Papilionaceae(Fabaceae) crop (see Table 1 ). From tbe two Land.sat imagesfor wbicb corresponding ground measurements have been ac-quired during the satellite overpass, tbe average values of thesatellite reflectance were calculated. Indeed, the percentagedifferences between the satellite and ground reflectance val-ues ranged fnim 39% lo 97%. The large variations foundin tbe satellite reflectance values, especially in TM band 1(wbere tbe reflectance ranged from 69% to 92%) and TMband 3 (wbere tbe reflectance ranged from 54% to 97%),suggest that atmospheric effects were both variable and sig-nificant. Especially on tbe 13 August 2008 overpass, atmo-spheric correction showed thai atmospberic sucb a correctionwas necessary (see hand I) and the algorithm was verifiedfrom the in-situ spectroradiometric measurements.
5.3 Calculation of real daily evapotranspiration
Using meteorological data (i.e., atmospheric pressure, max-imum and minimum temperatures, wind velocity), tbe realdaily evapotranspiration was calculated for the first casestudy (Yeroskipou area), using the Carslon-Buffum method(Carlson and Buffum, 1989). Actual evapotranspiration was
Nat. Hazards Earth Syst. Sei., 10, 89-95, 2010 www.nat-hazards-earth-syst-sci.net/10/89/201 ()/

D. G. Hadjimitsis et al.: Atmospheric correction for agricultural applications 93
•.M
r.N
I.M
I.N
Fig. 2. DVI hefore {dashed line) and after (solid line) atmospheriecorrection.
US
•.If
1,13
•.H
«11
t.it
o.u
».M
•««I
Fig. 4. SAVl before (dashed line) and after (solid line) atmosphericcorrection.
0.»
Fig. 3. NDVI before (dashed line) and after (solid line) atmosphericcorrection.
Fig. 5. MSAVI before (dashed line) and after (solid line) atmo-spheric correction.
cross-checked with other models or algorithms, such as FAOPetiman-Monteith method íFAO. 1998) and Jensen Haisetneth[)d (Jenseti and Haise, 1963), which show similar re-sults for the daily evapotranspiration. It was found thatthe real daily evapotranspiration without performing atmo-spheric correction was less by 0.25-0.73 mmd~', comparedto that obtained alter the application of the darkest pixelmethod. The results show that up to 10% less evapotranspira-tion can he ignored if atmospheric correction is not applied.Tliis can be increased up to 40%, when daily evapotranspira-tion is lower than 1.5 mm d"'.
5 «.»
t.t»
A«
4,11
Fig. 6. SARVI before (dashed line) and after (solid line) atmo-spheric correction.
www.nat-hazards-earth-syst-sci.net/10/89/2010/ Nat. Hazards Earth Syst. Sei., 10, 89-95. 2010
94 D. G. Hadjimitsis et al.: Atmospheric correction for agricultural applications
Table I. Changes of reflectance using spectro-radiometric {GER1500) measurements and from satellite data before and after atmosphericcorrection {AC) for 20 July 2008 and 13 August 2008 at Paphos case study.
Wavelength
0.45-0.52 (im0.52-0.60 (im0.63-0.69 (im0.76-0.90(101
Band
BlueGreenRedNear IR
Reflectance 20 July 20{)íí
from GER 1500
0.0300.0750.0400.400
before AC
0.0960.0900.0870.288
after AC
0.0180.0430.0530.262
Reflectance
from GER1500
0.0100.0300.0050.170
13 August 2008
before AC
0.1270,2180,1810,309
after AC
0.0100.0800.0790.260
6 Conclusions
Ten Landsat TM/ETM-i- images were used to test the effectsof applying atmospheric correction for retrieving accuratevegetation indices and evapotranspiration. It was found thatfor the calculation of DVI, NDVI. SAVI and MSAVI indicesthe effects of the atmosphere should be considered. OnlySARVI was found not to be affected from the impact of theatmosphere. Large variations in at-satellite reflectance val-ues, especially in Landsat TM/ETM bands I and 3, suggestthat atmospheric effects are variable and significant for croptargets. It has been shown that by not taking into account theeffects of the atmosphere leads to an overestimation of theevapotranspiration from 0.23 to 0.73 mmd"' using LandsatTM bands I. 2, 3, and 4. A good estimation of evapotran-spiration is vital for proper water management practices, im-proved efiiciency of water use. high water productivity andefficient farming activities.
Based on the fact that NDVI has been widely used toseveral applications especially for agricultural monitoringpurposes, the mean difference of 18% between the atmo-spheric and non-atmospheric corrected values has a signif-icant meaning. Indeed, for the purposes in which NDVI isused for inlerpretation of growth patterns, evapotranspirationmonitoring, crop management and production, to name but afew. the effects of the atmosphere must be taken into account,otherwise the retrieved outcomes will not be used for furtheranalysis and decision making purposes.
Acknowledgements. The authors acknowledge the financialsuppon of boih the Cyprus Research Promotion Foundation, [heEuropean Union {Regional Development Funds) and ihe CyprusUniversity of Technology {internal funding and D. G. HadjimiLsisresearch activity funds). Thanks are also due to the Remote SensingLaboratory of the Department of Civil Engineering and Geomaticsof the Cyprus University of Technology {htlp://www.cut.ac.cy/).
Edited by: K. Savvidou and F. TymviosRevi;ewed by: two anonymous referees
References
Akkartal. A,. Türüdü. O., and Erbek. F. S.: Analyis of changes invegetation biomass using muliiscnsor satellite data. Proceedingsof the ISPRS Congress-Youth Forum, 181-185, 2004.
Bannari. A.. Morin. D.. Huette. A. R., and Bonn. F.: A review ofvegetation indices. Remote Sensing Reviews. 13.95-120. 1995.
Broge. N. H, and Leblanc. E.: Comparing prediction power and sta-bility of broadband and hyperspectral vegetation indices for esti-mation of green leaf area index and canopy chlorophyll density.Remote Sens. Environ., 76. 156-172. 200{).
Caparrini. F. and Man/ella. F.: Hydrometeorological and vegetationindices for the drought monitoring system in Tu.scany Region,Italy, Adv. Geo.sci., 17, 105-110, 2009.http://www.adv-geosci.net/17/l05/2009/.
Carlson. T. N. and Buffum, M. J.: On estimating total daily evap-otranspiration from remote surface temperature measurements.Remote Sens. Environ.. 29. 197-207, 1989.
Che, N. and Price, J. C: Survey of Radiometrie calibration resultsand methods for visible and near infrared channels of NOAA-7.-9, and -1 I AVHRRs. Remote Sens. Environ., 41.19-27. 1992.
Chrysoulakis. N.. Abrams, M.. Feidas. H.. and Arai. K.: Compar-ison of atmospheric correction methods using aster data for thearea of Creie: the ATMOSAT projeet. Int, J. Remote Sens., inpress. 2010.
Courault. D., Seguin. B., and Olioso, A.: Review to estimate Evap-otranspiration from remote sensing data: some examples fromthe simplified relationship to the use of mesoscale atmosphericmodels. lClD Workshop on Remote Sensing of ET for Large Re-gions. 2003.
Duggin. M. J. and Piwinski. D.: Recorded radiance indices for veg-etation monitoring using NOAA AVHRR data; atmospheric andother effects in multitemporal data sets. AppI, Optics, 23. 2620-2623. 1984.
FAO: Crop evapotranspiration - Guidelines for computing crop wa-ter requirements, FAO Irrigation and Drainage Papers 56, Foodand Agriculture Organization of the United Nations. 1998.
Glenn. E. P.. Huete. A. R,. Nagler. P L., and Nel.son. S. G.: Re-lationship between remotely-sensed vegetation indices, canopyattributes and plant physiological processes: what vegetation in-dices can and cannot tell us about tbe landscape. Sensors. 8.2136-216{). 2008.
Haboudane. D., Miller, J. R.. PaUey. E,. Zarco-Tejada. P, J.. andStracban, I. B.: Hyperspectral vegetation indices and novel algo-
NaL Hazards Earth Syst. Sei.. 10, 89-95. 2010 www.nat-hazards-earth-syst-sci.net/10/89/2010/

D, G. Hadjimitsis et al.: Atmospheric correction for agricultural applications 95
rithms for predicting green LAI of crop canopies: Modeling andvalidation in the context of precision agricultural. Remote Sens.Environ., 90. 337-352, 2004.
Hudjimiisis. D. G.: Description of a new tnethod for retrieving theaerosol optical thickness from satellite remotely sensed imageryusing the maximum contrast value principle and the darkest pixelapproach. Transactions in GIS, 12, 633-644, 2008.
Hadjimil.sis. D. G., Clayton. C. R. I., and Hope, V. S.: An assess-ment of" the effectiveness of atmospheric conection algorithmsthrough the remote sensing of some reservoirs. Int. J. RemoteSens., 25, 3651-3674. 2004a.
Hadjimit.sis, D. G., Clayton. C. R. I., and Retalis. A.: Darkest pixelatmospheric correction algorithm: a revised procedure for envi-ronmental applifations of satellite remotely sensed imagery, in:Proeeedings lOth lntematkitial Symposium on Remote Sensing.Proc. SPIH 5239. 464 pp. 2[XMb.
Hadjimitsis, D. G.. Clayton, C. R. !.. and Retalis. A.: The useof selected pseudo-invariant targets for the application of atmo-spheric correction in multi-temporal studies using satellite re-motely sensed imagery. Int. J. Appl. Earth Obs.. 11. 192-200.
Hadjimitsis. D. G., Themistoeleous, K.. Agapioti, A., and Clayton.C: Monitoring Archaeological Site Latidscapes in Cyprus us-ing Multi-tL'mpt)ral Atmosphetie Correeted Image Data, Interna-tional Journal oí Architectural Computing, 7. 121-138. 2009b.
Huele, A. R.: A soil-adjusted vegetation index (SAVl). RemoteSens. Environ., 25, 295-.309. 19S8.
Jensen, M. E. and Haise, H. R.: Estimating evapotranspiration fromsolarradialion.J. In-. Drain. Div.-ASCE, 89. 15^1 , 1963.
Kaufman. Y. J. and Tanré, D.: Atmospherically resistant vegetationindex (ARVI), IEEE Geosci. Remote S.. 30, 261-270. 1992.
Liang, Z-, Bing-fang, WU, Yue-min, Z., Ji-hua, M.. and Ning. Z.iA study of fa.st estimation of vegetation fraction in Three Gorgesemigration area by using SPOT5 imagery, in: The IniemaiionalArchives of the Photogrammetry. Remoit.' Sensmg and SpatialInformation Sciences. Vol. XXXVII. Pan B8. Beijing. 987-992,2008.
Maiher, P. M.: Computer prtKessing of remotely-sen,sed images. Anlnu-oduetion. Wiley. Chichestcr. ISBN 0 471 98550 3. 2(K)4.
Qi, J-, Chehbouni, A., Huete, A. R., Kcrr. Y. H., and Sorroshian.S.: A Modified Soil Adjusted Vegetation Index. Remote Sens.Environ.. 47, 1-25, 1994.
Rouse. J. W., Haas. R. H., Schell. J. A.. Deering. D. W., and Har-lan. J. C: Monitoring the vemal advaneemcnls and rétrograda-tion (greenwave eftcct) of nature vegetation, NASA/GSFC FinalRepon, Grecnbclt. 1974.
Song. C, Woodcock. C. E.. Seto. K. C . Lenney, M- P.. and Ma-eomber. S. A.: Classification and change detection using Land.satTM data: when and how to correct atmospheric effects?. RemoteSens. Environ.. 75. 23tV-244. 2(X)1.
Telesca, L, and Lasaponara. R.: Quantifying intra-annual persis-tent behaviour in SPiTT-VEGETATiON NDVI daia for Mediter-ranean ecosystems of southem Italy. Remote Sens. Environ., 101,95-103, 2006.
www.nat-hazards-earth-syst-sci.net/10/89/2010/ Nat. Hazards Earth Syst. Sei.. 10. 89-95, 2010

Copyright of Natural Hazards & Earth System Sciences is the property of Copernicus Gesellschaft mbH and its
content may not be copied or emailed to multiple sites or posted to a listserv without the copyright holder's
express written permission. However, users may print, download, or email articles for individual use.