perceiving the intensity of light -...
TRANSCRIPT
Perceiving the Intensity of Light
Dale Purves, S. Mark Williams, Surajit Nundy, and R. Beau LottoDuke University
The relationship between luminance (i.e., the photometric intensity of light) and its perception (i.e., sensationsof lightness or brightness) has long been a puzzle. In addition to the mystery of why these perceptual qualitiesdo not scale with luminance in any simple way, “illusions” such as simultaneous brightness contrast, Machbands, Craik–O’Brien–Cornsweet edge effects, and the Chubb–Sperling–Solomon illusion have all generatedmuch interest but no generally accepted explanation. The authors review evidence that the full range of thisperceptual phenomenology can be rationalized in terms of an empirical theory of vision. The implication ofthese observations is that perceptions of lightness and brightness are generated according to the probabilitydistributions of the possible sources of luminance values in stimuli that are inevitably ambiguous.
A fundamental problem in vision (and perception generally) wasrecognized at the beginning of the 18th century by George Berkeley(1709/1975), who pointed out that the sources underlying visualstimuli are unknowable in any direct sense. The light that falls on theeye from any region of a scene conflates the contributions of reflec-tance, illumination, and transmittance (as well as a host of subsidiaryfactors that affect these parameters). As a result, the physical prove-nance of light reaching the eye—and therefore the significance of thestimulus for visually guided behavior—is profoundly uncertain. Thisfundamental fact presents a biological quandary. Successful behaviorin a complex and potentially hostile environment clearly depends onresponding appropriately to the physical sources of visual stimulirather than to the stimuli as such. If, however, the retinal imagesgenerated by light cannot uniquely define the underlying reality theobserver must deal with, how then does the visual system producebehavior that is generally successful?
The purpose of this review is thus to consider evidence, muchof it derived from our own experiments over the last few years,about the way the uncertain relationship between the physicalworld and the perceptual world is resolved by the nervoussystem (see Purves & Lotto, 2003). The gist of this body ofwork is that what one sees at any moment appears to be fullydetermined by the probability distributions of the possiblesources of the stimulus rather than the physical qualities of thestimulus (which are ambiguous) or the properties of the objectsand conditions that generated the stimulus (which cannot beknown directly). Although this framework has several impor-tant precedents (see below), it differs from most mainstreamneurobiological thinking in recent decades and suggests otherways of conceptualizing the purposes served by the knownphysiology of visual system circuitry. The context here for
exploring the merits of this conception of vision is sensations oflightness and brightness, which are arguably the most funda-mental qualities of human visual experience.
Luminance, Brightness, and Lightness
Luminance is an objective measurement of the overall intensity ofa stimulus expressed in candelas/m2 (photometers used for this pur-pose measure radiant energy with a filter that mimics the sensitivity ofthe average human observer, thus specifically measuring light). Theresulting sensations are called lightness and brightness. Like all sen-sations, lightness and brightness are not subject to direct measurementand can only be evaluated by asking an observer to report the appear-ance of one stimulus relative to that of another. Although in ordinaryusage the term brightness often refers inclusively to sensations of lightintensity, in visual psychophysics brightness indicates the extent towhich the apparent intensity of light coming from a given portion ofa scene is attributable to the region in question being a primary sourceof light. Lightness, conversely, refers to the apparent intensity as aconsequence of surface reflectance: that is, the extent to which anobject appears as it does because it reflects more (or less) light to theeye than other surfaces in the scene.
Enigma of Simultaneous Brightness Contrast
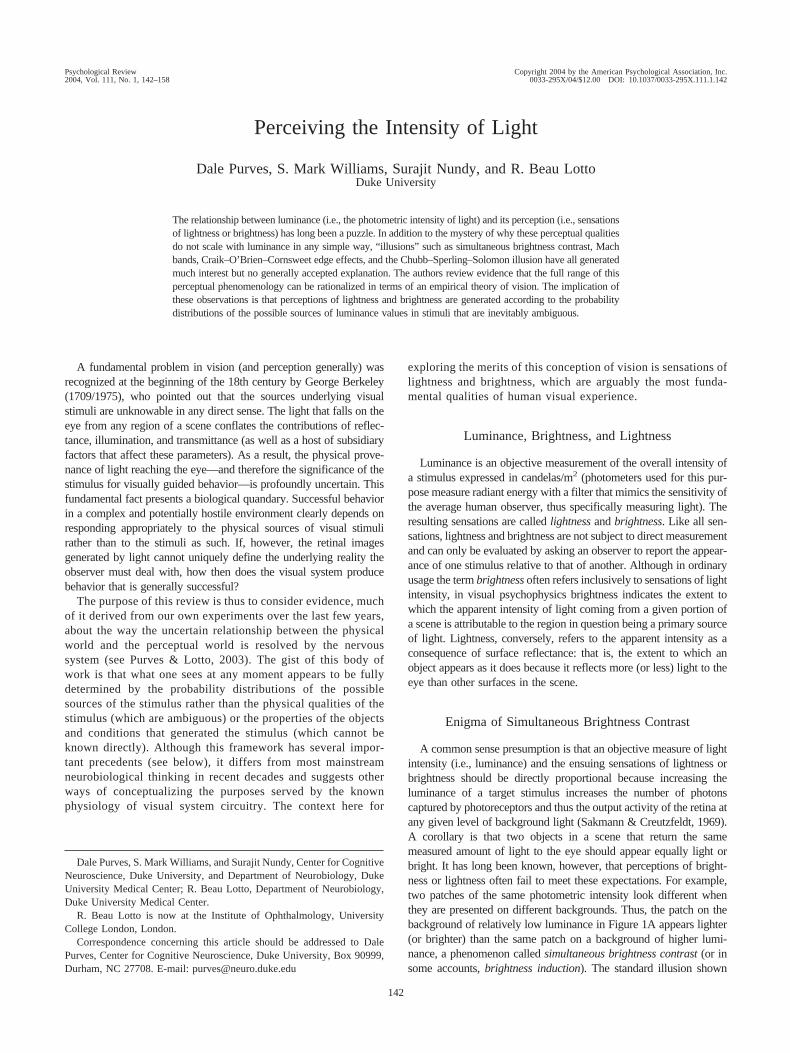
A common sense presumption is that an objective measure of lightintensity (i.e., luminance) and the ensuing sensations of lightness orbrightness should be directly proportional because increasing theluminance of a target stimulus increases the number of photonscaptured by photoreceptors and thus the output activity of the retina atany given level of background light (Sakmann & Creutzfeldt, 1969).A corollary is that two objects in a scene that return the samemeasured amount of light to the eye should appear equally light orbright. It has long been known, however, that perceptions of bright-ness or lightness often fail to meet these expectations. For example,two patches of the same photometric intensity look different whenthey are presented on different backgrounds. Thus, the patch on thebackground of relatively low luminance in Figure 1A appears lighter(or brighter) than the same patch on a background of higher lumi-nance, a phenomenon called simultaneous brightness contrast (or insome accounts, brightness induction). The standard illusion shown
Dale Purves, S. Mark Williams, and Surajit Nundy, Center for CognitiveNeuroscience, Duke University, and Department of Neurobiology, DukeUniversity Medical Center; R. Beau Lotto, Department of Neurobiology,Duke University Medical Center.
R. Beau Lotto is now at the Institute of Ophthalmology, UniversityCollege London, London.
Correspondence concerning this article should be addressed to DalePurves, Center for Cognitive Neuroscience, Duke University, Box 90999,Durham, NC 27708. E-mail: [email protected]
Psychological Review Copyright 2004 by the American Psychological Association, Inc.2004, Vol. 111, No. 1, 142–158 0033-295X/04/$12.00 DOI: 10.1037/0033-295X.111.1.142
142
here is actually a relatively weak example of this general phenomenoncompared with some of those we show below or with other morecomplex stimuli in the literature, for reasons that will become appar-ent as the argument here develops.
The explanation of this effect most often offered is based on theproperties of neurons at the input level of the visual system (e.g.,neurons in the retina) and the lateral interactions among them,which are clearly an important aspect of retinal function. Thefoundation of such models is evidence that, presumably as a means
of enhancing the detection of contrasting luminance boundaries(edges), the central region of the receptive fields of lower ordervisual neurons has a surround of opposite polarity (Hartline, 1940;Hartline & Graham, 1932; Kuffler, 1953, 1973; Wiesel & Hubel,1966). The firing rate of neurons whose receptive fields intersecta contrast boundary will therefore differ from the activity ofneurons whose receptive fields fall entirely on one side of theboundary or the other (see Figure 1B). Thus, neurons whosereceptive field centers are excited by light and that lie just withinthe diamond on the dark background in Figure 1A will fire at ahigher rate than the neurons whose receptive field centers lie justwithin the diamond on the light background (because the formerare less inhibited by their oppositely disposed receptive fieldsurrounds than the latter; see Figure 1B). As a result, so theargument goes, the patch on the dark background looks lighter orbrighter than the patch on the lighter background.
Reasons for Doubting This Conventional Explanation
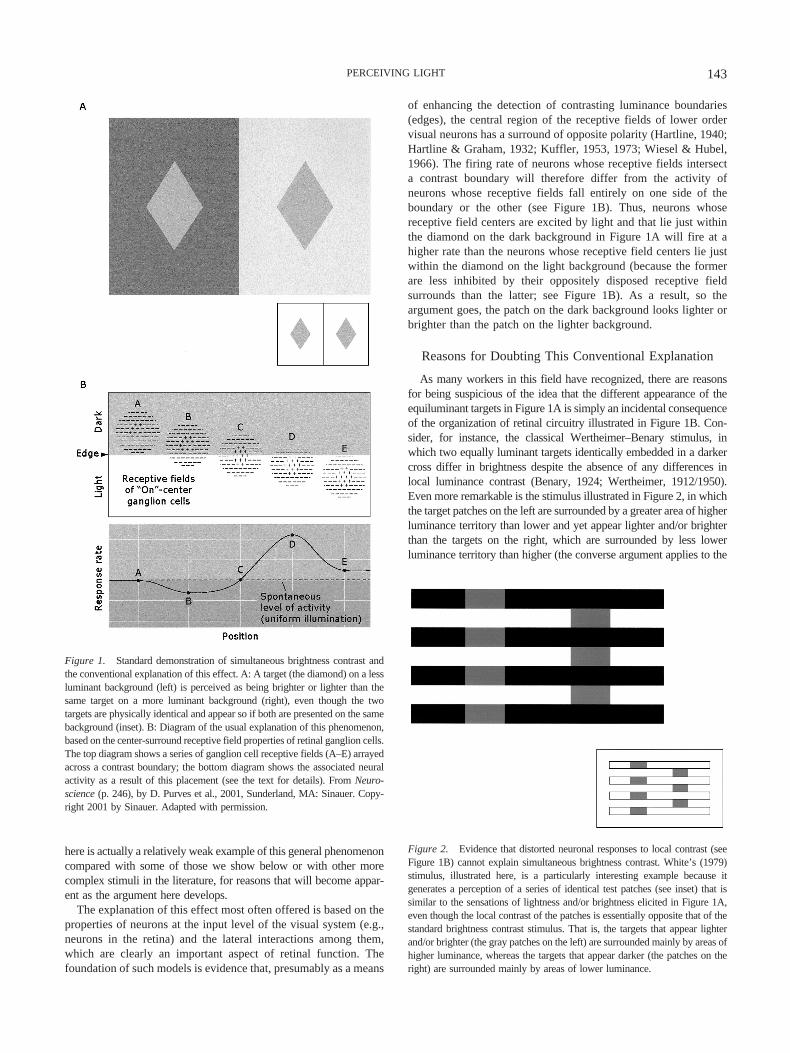
As many workers in this field have recognized, there are reasonsfor being suspicious of the idea that the different appearance of theequiluminant targets in Figure 1A is simply an incidental consequenceof the organization of retinal circuitry illustrated in Figure 1B. Con-sider, for instance, the classical Wertheimer–Benary stimulus, inwhich two equally luminant targets identically embedded in a darkercross differ in brightness despite the absence of any differences inlocal luminance contrast (Benary, 1924; Wertheimer, 1912/1950).Even more remarkable is the stimulus illustrated in Figure 2, in whichthe target patches on the left are surrounded by a greater area of higherluminance territory than lower and yet appear lighter and/or brighterthan the targets on the right, which are surrounded by less lowerluminance territory than higher (the converse argument applies to the
Figure 1. Standard demonstration of simultaneous brightness contrast andthe conventional explanation of this effect. A: A target (the diamond) on a lessluminant background (left) is perceived as being brighter or lighter than thesame target on a more luminant background (right), even though the twotargets are physically identical and appear so if both are presented on the samebackground (inset). B: Diagram of the usual explanation of this phenomenon,based on the center-surround receptive field properties of retinal ganglion cells.The top diagram shows a series of ganglion cell receptive fields (A–E) arrayedacross a contrast boundary; the bottom diagram shows the associated neuralactivity as a result of this placement (see the text for details). From Neuro-science (p. 246), by D. Purves et al., 2001, Sunderland, MA: Sinauer. Copy-right 2001 by Sinauer. Adapted with permission.
Figure 2. Evidence that distorted neuronal responses to local contrast (seeFigure 1B) cannot explain simultaneous brightness contrast. White’s (1979)stimulus, illustrated here, is a particularly interesting example because itgenerates a perception of a series of identical test patches (see inset) that issimilar to the sensations of lightness and/or brightness elicited in Figure 1A,even though the local contrast of the patches is essentially opposite that of thestandard brightness contrast stimulus. That is, the targets that appear lighterand/or brighter (the gray patches on the left) are surrounded mainly by areas ofhigher luminance, whereas the targets that appear darker (the patches on theright) are surrounded mainly by areas of lower luminance.
143PERCEIVING LIGHT

patches on the right; White, 1979). Although the disposition of thesurrounds in White’s (1979) stimulus is effectively opposite that inFigure 1A, the apparent lightness and/or brightness difference be-tween the left and right targets is about the same as that elicited by thestandard simultaneous brightness contrast stimulus.
Indeed, many stimuli have been constructed over the years that aredifficult to explain in terms of the conventional ideas about brightnesscontrast effects illustrated in Figure 1B (e.g., Adelson, 1993; Corn-sweet, 1970; Gilchrist, 1977, 1994; Knill & Kersten, 1991; Land,1986; Lotto & Purves, 1999, 2001; O’Brien, 1959; Purves & Lotto,2003; Purves, Shimpi, & Lotto, 1999; Todorovic, 1997; Williams,McCoy, & Purves, 1998a, 1998b). Although the creators of some ofthese stimuli have persisted in the idea that the related perceptualeffects are epiphenomena of the input or midlevel stages of visualprocessing (e.g., Blakeslee & McCourt, 1997, 1999, 2001; Cornsweet,1970; Todorovic, 1997), others have argued that this sort of rational-ization is inadequate (e.g., Adelson, 1993, 2000; Gilchrist, 1977;Lotto & Purves, 1999, 2001; Purves & Lotto, 2003; Purves et al.,1999; Williams et al., 1998a, 1998b).
Evidence That Lightness and Brightness Correspond tothe Empirical Significance of Stimulus Luminances
If the receptive field properties of input level neurons fail toaccount for the subjective experiences of lightness and brightnesselicited by stimuli such as those in Figures 1 and 2, how are these
phenomena to be understood? The key to rationalizing the perceivedintensity of light is the inherent ambiguity of these—and indeedall—visual stimuli. As already noted, the perceptual significance ofthe intensity of the light returned to the eye from any part of the sceneis uncertain. This conclusion follows from the fact that luminance isdetermined by at least three fundamental aspects of the physicalworld: the illumination of objects, the reflectance of object surfaces,and the transmittance of the space between objects and observer (along list of other factors are influential but are for the most partsubsidiary to these three; see Figure 3). Changing any of thesereal-world variables will necessarily change the relative intensity ofthe light reaching the eye. As a result of this conflation (an infinitenumber of different combinations of illumination, reflectance, andtransmittance can give rise to the same luminance), there is no definiterelationship between a given stimulus element and its sources. Ac-cordingly, there is no way for the visual system to directly determinehow these factors have been combined to generate the pattern ofluminance values in a retinal image. Because appropriate behaviorrequires responses that accord with the provenance of the stimulusrather than the parameters of the stimulus per se, percepts determinedby luminance values as such would be a poor guide to behavior.
Given the inherent ambiguity of any luminance value in a scene, amore effective visual strategy would be to generate percepts accord-ing to the behavioral success or failure experienced when observersrespond to stimuli generated by different combinations of illumina-
Figure 3. Conflation of illumination, reflectance, and transmittance, the primary factors that determine theluminance of any portion of a visual stimulus. See the text for further explanation.
144 PURVES, WILLIAMS, NUNDY, AND LOTTO
tion, reflectance, and transmittance. If vision indeed operates in thisway, then perceptions of relative lightness or brightness should varypredictably according to the degree to which a given luminance valuein a visual stimulus is more (or less) consistent with the possiblecombinations of illumination, reflectance, and transmittance that havegiven rise to the same or a similar stimulus in the past.
Some Simple Tests of This Prediction
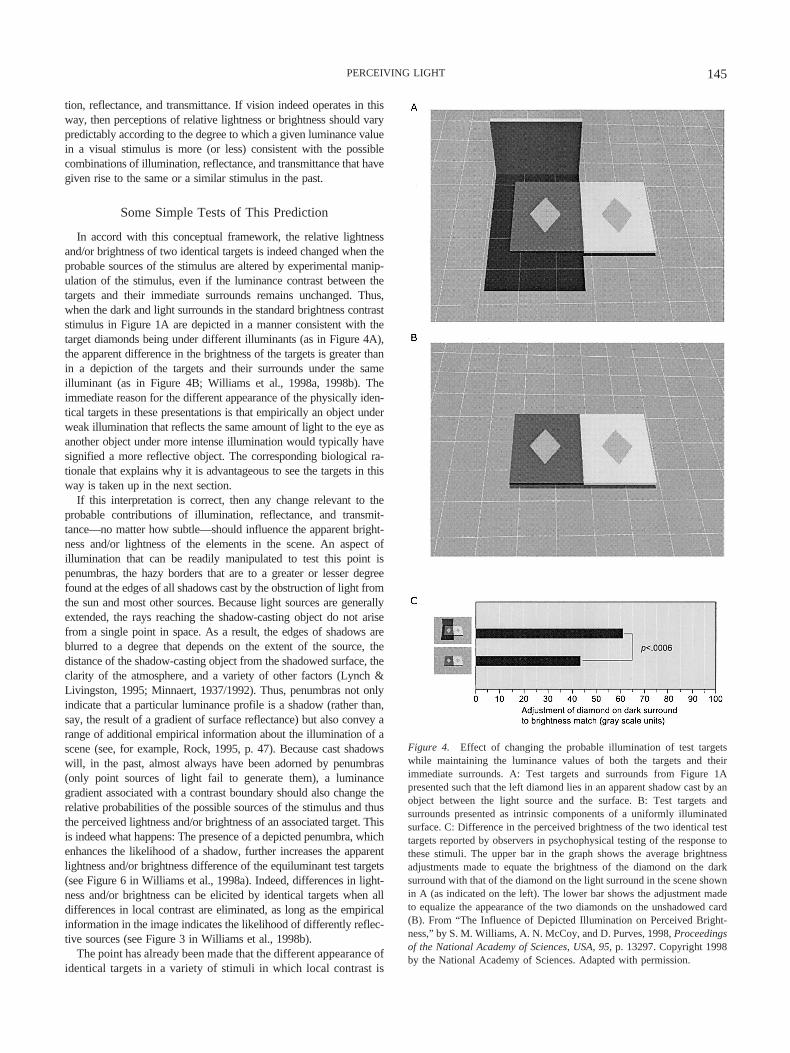
In accord with this conceptual framework, the relative lightnessand/or brightness of two identical targets is indeed changed when theprobable sources of the stimulus are altered by experimental manip-ulation of the stimulus, even if the luminance contrast between thetargets and their immediate surrounds remains unchanged. Thus,when the dark and light surrounds in the standard brightness contraststimulus in Figure 1A are depicted in a manner consistent with thetarget diamonds being under different illuminants (as in Figure 4A),the apparent difference in the brightness of the targets is greater thanin a depiction of the targets and their surrounds under the sameilluminant (as in Figure 4B; Williams et al., 1998a, 1998b). Theimmediate reason for the different appearance of the physically iden-tical targets in these presentations is that empirically an object underweak illumination that reflects the same amount of light to the eye asanother object under more intense illumination would typically havesignified a more reflective object. The corresponding biological ra-tionale that explains why it is advantageous to see the targets in thisway is taken up in the next section.
If this interpretation is correct, then any change relevant to theprobable contributions of illumination, reflectance, and transmit-tance—no matter how subtle—should influence the apparent bright-ness and/or lightness of the elements in the scene. An aspect ofillumination that can be readily manipulated to test this point ispenumbras, the hazy borders that are to a greater or lesser degreefound at the edges of all shadows cast by the obstruction of light fromthe sun and most other sources. Because light sources are generallyextended, the rays reaching the shadow-casting object do not arisefrom a single point in space. As a result, the edges of shadows areblurred to a degree that depends on the extent of the source, thedistance of the shadow-casting object from the shadowed surface, theclarity of the atmosphere, and a variety of other factors (Lynch &Livingston, 1995; Minnaert, 1937/1992). Thus, penumbras not onlyindicate that a particular luminance profile is a shadow (rather than,say, the result of a gradient of surface reflectance) but also convey arange of additional empirical information about the illumination of ascene (see, for example, Rock, 1995, p. 47). Because cast shadowswill, in the past, almost always have been adorned by penumbras(only point sources of light fail to generate them), a luminancegradient associated with a contrast boundary should also change therelative probabilities of the possible sources of the stimulus and thusthe perceived lightness and/or brightness of an associated target. Thisis indeed what happens: The presence of a depicted penumbra, whichenhances the likelihood of a shadow, further increases the apparentlightness and/or brightness difference of the equiluminant test targets(see Figure 6 in Williams et al., 1998a). Indeed, differences in light-ness and/or brightness can be elicited by identical targets when alldifferences in local contrast are eliminated, as long as the empiricalinformation in the image indicates the likelihood of differently reflec-tive sources (see Figure 3 in Williams et al., 1998b).
The point has already been made that the different appearance ofidentical targets in a variety of stimuli in which local contrast is
Figure 4. Effect of changing the probable illumination of test targetswhile maintaining the luminance values of both the targets and theirimmediate surrounds. A: Test targets and surrounds from Figure 1Apresented such that the left diamond lies in an apparent shadow cast by anobject between the light source and the surface. B: Test targets andsurrounds presented as intrinsic components of a uniformly illuminatedsurface. C: Difference in the perceived brightness of the two identical testtargets reported by observers in psychophysical testing of the response tothese stimuli. The upper bar in the graph shows the average brightnessadjustments made to equate the brightness of the diamond on the darksurround with that of the diamond on the light surround in the scene shownin A (as indicated on the left). The lower bar shows the adjustment madeto equalize the appearance of the two diamonds on the unshadowed card(B). From “The Influence of Depicted Illumination on Perceived Bright-ness,” by S. M. Williams, A. N. McCoy, and D. Purves, 1998, Proceedingsof the National Academy of Sciences, USA, 95, p. 13297. Copyright 1998by the National Academy of Sciences. Adapted with permission.
145PERCEIVING LIGHT
much the same makes it difficult or impossible to rationalizesimultaneous brightness contrast effects in terms of the opposingcenter-surround organization of the receptive fields of retinal,thalamic, or primary visual cortical neurons (see above). Thesefurther demonstrations, as others in the literature (see, e.g., Adel-son, 1993; Benary, 1924; Gilchrist, 1977; Schirillo, 1999a, 1999b;Wertheimer, 1912/1950), suggest that the apparent lightness orbrightness of any given target is actually determined by the prob-able contributions of illumination, reflectance, and transmittanceto the same or a similar stimulus experienced in the past.
Biological Rationale for Simultaneous Brightness Contrastin These Terms
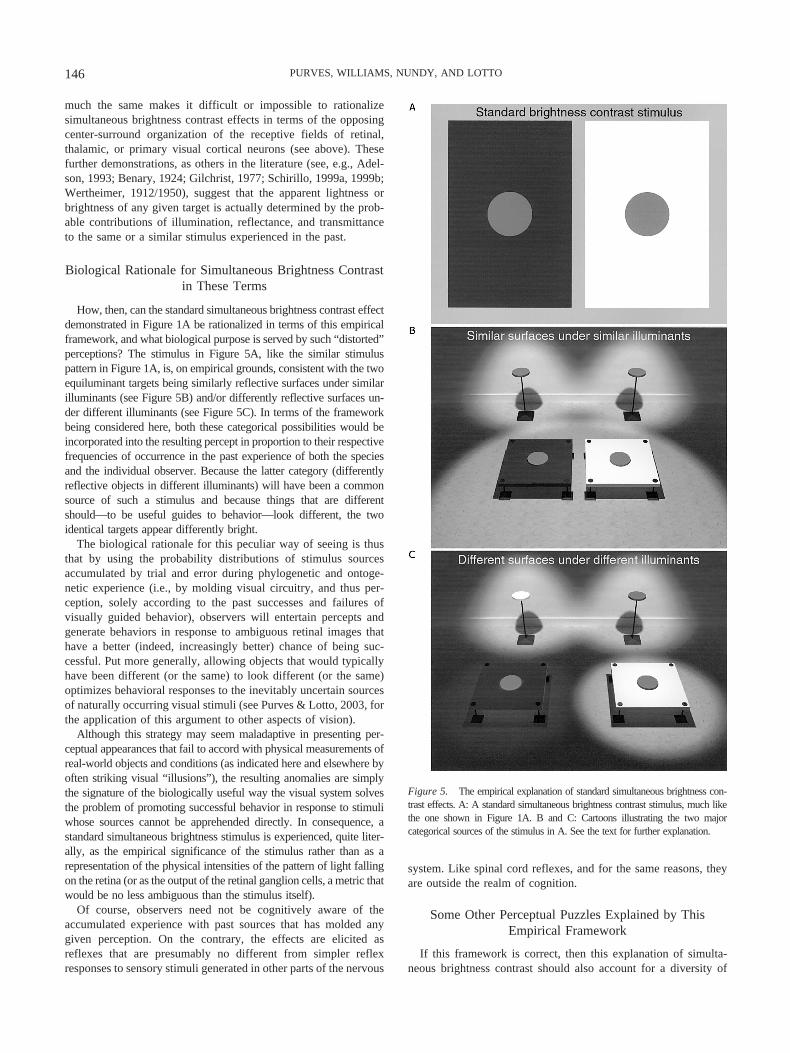
How, then, can the standard simultaneous brightness contrast effectdemonstrated in Figure 1A be rationalized in terms of this empiricalframework, and what biological purpose is served by such “distorted”perceptions? The stimulus in Figure 5A, like the similar stimuluspattern in Figure 1A, is, on empirical grounds, consistent with the twoequiluminant targets being similarly reflective surfaces under similarilluminants (see Figure 5B) and/or differently reflective surfaces un-der different illuminants (see Figure 5C). In terms of the frameworkbeing considered here, both these categorical possibilities would beincorporated into the resulting percept in proportion to their respectivefrequencies of occurrence in the past experience of both the speciesand the individual observer. Because the latter category (differentlyreflective objects in different illuminants) will have been a commonsource of such a stimulus and because things that are differentshould—to be useful guides to behavior—look different, the twoidentical targets appear differently bright.
The biological rationale for this peculiar way of seeing is thusthat by using the probability distributions of stimulus sourcesaccumulated by trial and error during phylogenetic and ontoge-netic experience (i.e., by molding visual circuitry, and thus per-ception, solely according to the past successes and failures ofvisually guided behavior), observers will entertain percepts andgenerate behaviors in response to ambiguous retinal images thathave a better (indeed, increasingly better) chance of being suc-cessful. Put more generally, allowing objects that would typicallyhave been different (or the same) to look different (or the same)optimizes behavioral responses to the inevitably uncertain sourcesof naturally occurring visual stimuli (see Purves & Lotto, 2003, forthe application of this argument to other aspects of vision).
Although this strategy may seem maladaptive in presenting per-ceptual appearances that fail to accord with physical measurements ofreal-world objects and conditions (as indicated here and elsewhere byoften striking visual “illusions”), the resulting anomalies are simplythe signature of the biologically useful way the visual system solvesthe problem of promoting successful behavior in response to stimuliwhose sources cannot be apprehended directly. In consequence, astandard simultaneous brightness stimulus is experienced, quite liter-ally, as the empirical significance of the stimulus rather than as arepresentation of the physical intensities of the pattern of light fallingon the retina (or as the output of the retinal ganglion cells, a metric thatwould be no less ambiguous than the stimulus itself).
Of course, observers need not be cognitively aware of theaccumulated experience with past sources that has molded anygiven perception. On the contrary, the effects are elicited asreflexes that are presumably no different from simpler reflexresponses to sensory stimuli generated in other parts of the nervous
system. Like spinal cord reflexes, and for the same reasons, theyare outside the realm of cognition.
Some Other Perceptual Puzzles Explained by ThisEmpirical Framework
If this framework is correct, then this explanation of simulta-neous brightness contrast should also account for a diversity of
Figure 5. The empirical explanation of standard simultaneous brightness con-trast effects. A: A standard simultaneous brightness contrast stimulus, much likethe one shown in Figure 1A. B and C: Cartoons illustrating the two majorcategorical sources of the stimulus in A. See the text for further explanation.
146 PURVES, WILLIAMS, NUNDY, AND LOTTO

other well-known perceptual enigmas that entail discrepanciesbetween luminance and perceptions of lightness and/or brightness.There are many such puzzles of this sort in vision science, oftendating back to the 19th century. Here, we examine three suchchallenges: the Cornsweet edge effect, the perception of Machbands, and the Chubb–Sperling–Solomon illusion. The purpose isto consider the evidence that the effects of each of these quitedifferent stimuli can also be explained in wholly empirical terms.
Cornsweet Edge Effect
The perceptual response to the Cornsweet stimulus is an instance ofa broad class of edge effects first described by Kenneth Craik in the1940s (Craik, 1948/1966; see also O’Brien, 1959). Like the stimuliused to elicit simultaneous brightness contrast, the Cornsweet edgegenerates sensations of lightness and/or brightness that fail to tallywith photometric measurements; it is, however, quite different instructure from standard brightness contrast stimuli.
In the usual presentation shown in Figures 6A and 6B, the territorythat adjoins the step edge and the light gradient appears brighter thanthe territory adjoining the dark gradient (see Figure 6C; note that thisstimulus again belies explanations based on distorted retinal outputarising from local contrast because the territory that looks darker isnext to the darker gradient and vice versa; cf. Figure 1A). The basisof the effect is clearly the nature of the step edge and gradients thatseparate the two territories that look differently bright because block-ing this portion of the stimulus abolishes the striking perceptualdifference between the flanking regions (see Figure 6D). There is nogenerally accepted explanation of this phenomenon.
The explanation originally suggested by Cornsweet (1970) wasbased on filtering effects generated by lateral interactions amongvisual input neurons. A simpler possibility is that the Cornsweeteffect, like the standard simultaneous brightness contrast effects de-scribed in the previous section, arises as a consequence of experiencewith what such stimuli have turned out to be in the past (Purves et al.,1999). Like the more conventional stimuli already considered, theCornsweet edge is ambiguous; that is, there are different possiblesources of the step and gradients separating the two adjacent targets.Luminance gradients are generated in one of two general ways: (a)from changes in the reflectance properties of surfaces (see Figure 7,top) or (b) from changes in the illumination of surfaces (see Figure 7,bottom). Whatever the specific sources of such stimuli, a luminancegradient arising from illumination generally signifies a variation in theamount of light reaching the eye from the object in question: The
Figure 6 (opposite). The Cornsweet edge effect. A: Diagram of the spinningdisk used by Cornsweet (1970) to show that when two equiluminant regionsare separated by an edge associated with a pair of oppositely disposed lumi-nance gradients, the adjoining territories elicit different perceptions of lightnessand/or brightness. B: Standard presentation of the Cornsweet stimulus, shownhere as a blowup of a portion of the rotating disk. C: Comparison of thephotometric and perceptual profiles of the stimulus in B. Despite the equalluminances of the territories adjoining the two gradients, the territory (1) to theleft of the dark gradient (2) looks darker than the territory (4) to the right of thelight gradient (3). D: This effect is abolished by covering up the step edge andthe opposing luminance gradients, as indicated by the inset. From “An Em-pirical Explanation of the Cornsweet Effect” by D. Purves, A. Shimpi, andR. B. Lotto, 1999, Journal of Neuroscience, 19, p. 8544. Copyright 1999 bythe Society for Neuroscience. Adapted with permission.
147PERCEIVING LIGHT
148 PURVES, WILLIAMS, NUNDY, AND LOTTO

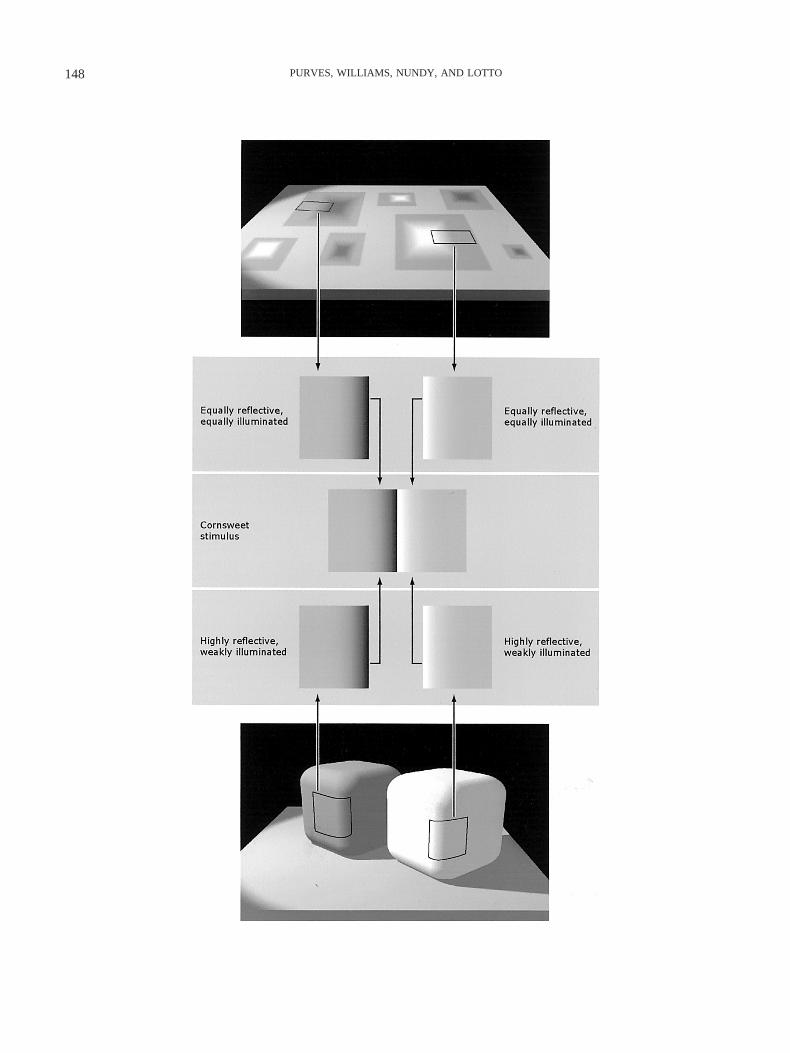
adjacent territories at the beginning and the end of the gradient will bedifferently illuminated. As a result, when two territories adjoining agradient return the same amount of light to the eye, the territory(target) flanking the lighter edge of the luminance gradient would, inpast experience, typically have been under stronger illumination (andtherefore have been a less reflective surface) than the equiluminantterritory flanking the darker edge. A luminance gradient arising fromthe reflectance properties of an object, conversely, does not imply thisdifference in illumination or the corresponding differences in thereflectance properties of the adjoining territories. In consequence, theluminances of the territories adjoining a gradient based on illumina-tion usually have a different empirical significance than the territoriesadjoining a luminance gradient based on reflectances. With respect tothe Cornsweet stimulus (or stimuli like it), the pattern of light that fallson the eye is therefore consistent with either of these major categoriesof experience with luminance gradients (see Figure 7).
If perceptions of brightness indeed correspond to the empiricalsignificance of the stimulus in question, then it should be possible topredict the consequences of any change in the presentation of theCornsweet edge according to how it affects the probable source of theambiguous stimulus. For instance, if the elements in the surroundingscene are made more consistent with the Cornsweet gradients arisingfrom changes in reflectance (see the upper panel in Figure 7), thusincreasing the probability that the flanking regions are uniformlyilluminated, then the perceived difference in brightness of the equi-luminant regions should decrease. The diminishment occurs becausethe equiluminance of the adjoining territories will, in past experience,usually have arisen from two surfaces with the same material prop-erties under more or less the same amount of light. This prediction canbe evaluated by embedding the standard Cornsweet stimulus in asurround identical in luminance to the surfaces adjoining the gradients(see Figure 8). Manipulating the presentation in this way increases theprobability that the elements of the stimulus are in the same plane, acircumstance consistent with the gradients arising from a transition inreflectance. As a result, observers indeed find the Cornsweet effectgreatly reduced or abolished, even though the luminance relationshipsin the stimulus itself remain the same (see Figure 8B; the psycho-physical results obtained in this and other manipulations outlined inthe following paragraphs are fully described in Purves et al., 1999).
It is equally possible to generate the opposite effect. Thus, if theinformation in the scene makes the Cornsweet stimulus moreconsistent with changes in illumination than reflectance, the per-ceived difference in lightness and/or brightness of the adjoiningterritories should increase. In empirical terms, the increase occurs
because equiluminant territories adjoining the gradients in thiscase more frequently have signified differently reflective surfacesunder different illuminants. For example, increasing the probabil-ity that the source of the opposing gradients is a doubly curvedsurface and that the flanking regions therefore lie in differentplanes increases the likelihood that the two territories are a lessreflective surface in light and a more reflective surface in shadow(see Figure 6 in Purves et al., 1999); this altered probability causesan increase in the perceived difference in the target territoriescompared with the effect of the standard presentation.
Combining the effects of several empirical manipulations such thatall the information in a scene is mutually consistent with the source ofthe stimulus being differently reflective surfaces in different illumi-nants should enhance the Cornsweet edge even more. An example ofsuch mutually supportive empirical information is shown in Figure 9.The perceived lightness and/or brightness difference between theterritories adjoining the Cornsweet edge is much greater than in thestandard presentation in Figure 6 and is increased well beyond the
Figure 8. Diminishing the Cornsweet effect by removing the backgroundcontrast. A: The standard Cornsweet stimulus (see dotted outline in B)presented such that the equiluminant territories adjoining the gradients nowextend around the Cornsweet stimulus as such. When the stimulus isembedded in this way, observers see the territories adjoining the Cornsweetedge as having about the same lightness and/or brightness. C: Perspectiveview to indicate the source made more likely by this presentation of thestimulus (i.e., a largely or wholly flat surface with the territories adjoiningthe Cornsweet edge receiving the same amount of illumination). From “AnEmpirical Explanation of the Cornsweet Effect” by D. Purves, A. Shimpi,and R. B. Lotto, 1999, Journal of Neuroscience, 19, p. 8546. Copyright1999 by the Society for Neuroscience. Adapted with permission.
Figure 7 (opposite). Possible sources of the Cornsweet stimulus. The luminance gradients in the standardCornsweet stimulus (middle) could arise from gradual changes in surface reflectance located adjacent to territorieshaving the same reflectance properties, all under the same illuminant (top), or from gradual changes in the illuminationof two surfaces that have different reflectance properties and are under different illuminants (bottom). (Although theilluminated side of the darker cube and the shadowed side of the lighter one in the bottom panel look differently bright,they are actually equiluminant; the effects under discussion here cannot be avoided in an illustration like this!) Theempirical significance of these different possible sources of the Cornsweet stimulus is that equiluminant territoriesadjoining gradients of reflectance will typically have been similarly reflective surfaces under the same illuminant,whereas territories adjoining gradients of illumination will typically have been differently reflective surfaces underdifferent amounts of illumination. Finally, note that this didactic cartoon is not intended to imply that spatially separatepatches are somehow “put together” in the normal course of gleaning the relevant empirical information that hasshaped the perceptual responses to the Cornsweet stimulus. From “An Empirical Explanation of the Cornsweet Effect”by D. Purves, A. Shimpi, and R. B. Lotto, 1999, Journal of Neuroscience, 19, p. 8546. Copyright 1999 by the Societyfor Neuroscience. Adapted with permission.
149PERCEIVING LIGHT

changes induced by manipulations of orientation, direction of illumi-nation, and perspective alone (see www.purveslab.net for an interac-tive demonstration).
All these observations suggest that the Cornsweet edge effect isbased wholly on statistical information gleaned from pastexperience.
Mach Bands
An especially intriguing challenge to any theory of the way humansperceive light intensity is the illusory bands of increased darkness orlightness induced by linear luminance gradients. The original stimulusused by Ernst Mach, who first reported these phenomena in 1865, wasa disk with black and white sectors that, when spun, generated a lineargradient linking a uniformly lighter region occupying the center of thedisk with a uniformly darker region occupying the periphery (seeFigure 10). In response to this presentation, observers perceive anillusory band of maximum lightness at the initiation of the gradientand a band of maximum darkness at its termination. Explaining thesebands has long been a touchstone of attempts to rationalize percep-tions of brightness (reviewed in Ratliff, 1965).
Mach (1865) proposed that the perception of these illusory bands isa direct consequence of physiological interactions in the retina andelaborated a detailed mathematical model of this process based onreciprocal inhibition between neighboring retinal points, a theory thathe continued to modify and improve over several decades (Mach,
1866, 1868, 1914/1959). Despite a great deal of additional workduring the subsequent century, Mach’s reasoning, at least in generalterms, has remained the conventional explanation of this strikingeffect (e.g., Arend & Goldstein, 1987; Coren, Porac, & Ward, 1999,p. 110; Cornsweet, 1970, 1985; Goldstein, 2002, p. 66; Grossberg,1987; Ratliff, 1965). Could it be, however, that Mach bands arisebecause a stimulus such as that in Figure 10 triggers a perceptualresponse determined by past experience with further subtleties thatcharacterize the sources of luminance gradients?
In considering this possibility, recall that there are two generalsources of luminance gradients: transitions in reflectance and tran-sitions in illumination (see Figure 7). Mach bands, like the Corn-sweet effect, appear to arise as a result of experience with a subsetof these luminance gradients, namely with the characteristics ofgradients generated by the illumination of curved surfaces (seeFigure 11). Whereas a flat surface with uniform properties reflectsa constant proportion of the light falling on it, a curved surfacegives rise to a luminance gradient: Whatever the angle of inci-dence, a diminishing amount of light reaches each unit area of thesurface as it curves away from the source of illumination (seeFigure 11A). The resulting gradient, however, does not fullyrepresent the stimulus that is typically generated by a curvedsurface. Because the surfaces of most natural objects are in varyingdegrees specular, meaning that the intensity of reflected light isgreatest at the angle of incidence, a maximum in the luminance
Figure 9. Enhancement of the Cornsweet effect by combining concordant stimulus information that greatlyincreases the probability that the source of the stimulus is two differently reflective surfaces under different amountsof illumination (the dotted outline in the inset again indicates the standard Cornsweet stimulus embedded in the scene).By combining a variety of mutually reinforcing information in a complex scene, the Cornsweet effect can be enhancedmore than tenfold over the usual presentation in Figure 7. (As implied by the inset, the areas surrounding the twosurfaces, i.e., the “sky” and “ground,” have the same average luminance.) From “An Empirical Explanation of theCornsweet Effect” by D. Purves, A. Shimpi, and R. B. Lotto, 1999, Journal of Neuroscience, 19, p. 8549. Copyright1999 by the Society for Neuroscience. Adapted with permission.
150 PURVES, WILLIAMS, NUNDY, AND LOTTO
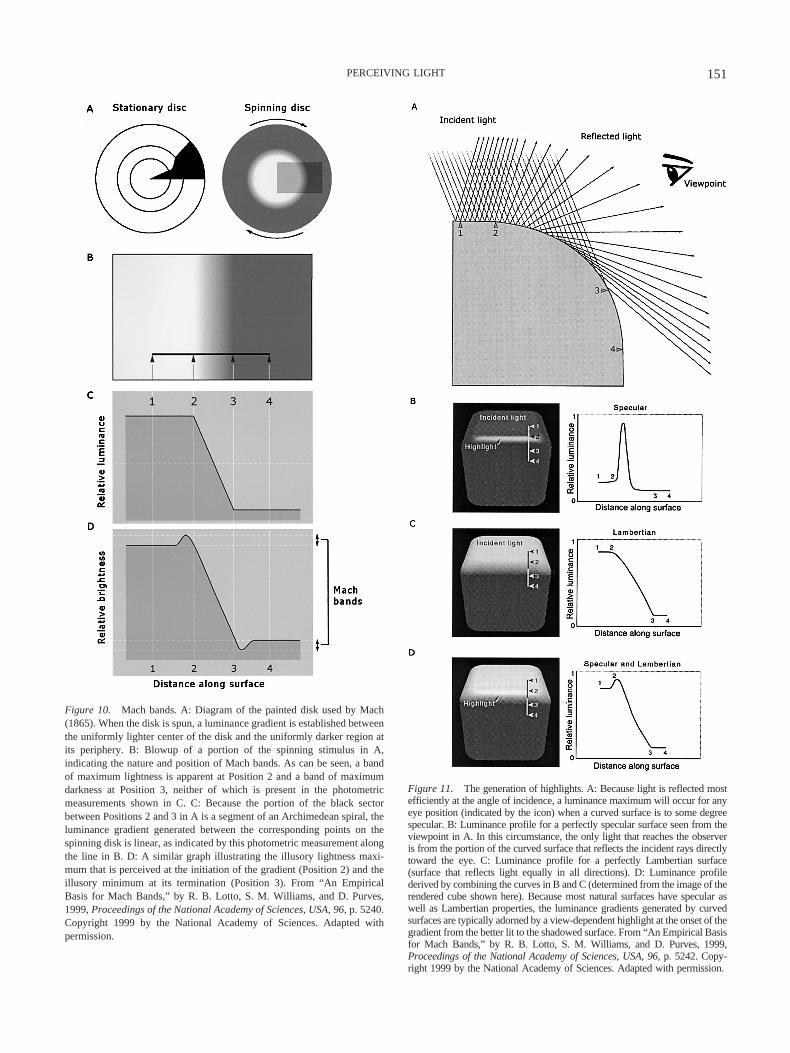
Figure 11. The generation of highlights. A: Because light is reflected mostefficiently at the angle of incidence, a luminance maximum will occur for anyeye position (indicated by the icon) when a curved surface is to some degreespecular. B: Luminance profile for a perfectly specular surface seen from theviewpoint in A. In this circumstance, the only light that reaches the observeris from the portion of the curved surface that reflects the incident rays directlytoward the eye. C: Luminance profile for a perfectly Lambertian surface(surface that reflects light equally in all directions). D: Luminance profilederived by combining the curves in B and C (determined from the image of therendered cube shown here). Because most natural surfaces have specular aswell as Lambertian properties, the luminance gradients generated by curvedsurfaces are typically adorned by a view-dependent highlight at the onset of thegradient from the better lit to the shadowed surface. From “An Empirical Basisfor Mach Bands,” by R. B. Lotto, S. M. Williams, and D. Purves, 1999,Proceedings of the National Academy of Sciences, USA, 96, p. 5242. Copy-right 1999 by the National Academy of Sciences. Adapted with permission.
Figure 10. Mach bands. A: Diagram of the painted disk used by Mach(1865). When the disk is spun, a luminance gradient is established betweenthe uniformly lighter center of the disk and the uniformly darker region atits periphery. B: Blowup of a portion of the spinning stimulus in A,indicating the nature and position of Mach bands. As can be seen, a bandof maximum lightness is apparent at Position 2 and a band of maximumdarkness at Position 3, neither of which is present in the photometricmeasurements shown in C. C: Because the portion of the black sectorbetween Positions 2 and 3 in A is a segment of an Archimedean spiral, theluminance gradient generated between the corresponding points on thespinning disk is linear, as indicated by this photometric measurement alongthe line in B. D: A similar graph illustrating the illusory lightness maxi-mum that is perceived at the initiation of the gradient (Position 2) and theillusory minimum at its termination (Position 3). From “An EmpiricalBasis for Mach Bands,” by R. B. Lotto, S. M. Williams, and D. Purves,1999, Proceedings of the National Academy of Sciences, USA, 96, p. 5240.Copyright 1999 by the National Academy of Sciences. Adapted withpermission.
151PERCEIVING LIGHT
profile occurs at or near the onset of the gradient (see Figure11B–11D). These so-called highlights occur so routinely that peo-ple take them for granted.
Gradients of illumination on curved surface will also exhibit alowlight. Lowlights arise because natural objects are typically illumi-nated by indirect light (e.g., sunlight reflected from the atmosphere orobjects on the surface of the earth) in addition to light coming directlyfrom the sun. The major source of indirect light from the sun isskylight, which, because of the physical properties of the atmosphere,is approximately isotropic. Light reflected from objects on the surfaceof the earth, however, is anisotropic—most such light being oppositein direction to the primary source (because surfaces orthogonal to thedirection of the primary light source will be most strongly illuminatedand therefore the source of most directionally specific reflected light).The result of these typical conditions of illumination in natural visualenvironments (or most artificially lit environments for that matter) isa region of minimum light reflected from a curved surface near thetermination of the luminance gradient generated by the direct light(see Lotto, Williams, & Purves, 1999b, for a more detailed explana-tion). As a consequence of these fundamental properties of light andits interaction with objects, luminance gradients generated by curvedsurfaces (either convex or concave) are typically adorned with aphotometric highlight at the onset of the gradient and a lowlight at itstermination (see Figure 12).
How, then, can these facts about naturally occurring luminancegradients explain Mach bands? When presented with any luminancegradient in a stimulus, observers will have experienced a variety ofdifferent sources: curved surfaces, penumbras (which of course do nothave highlights and lowlights), and gradients generated by surfacereflectance properties (e.g., the Mach stimulus in Figure 10A). Thus,the source of a Mach stimulus, like the sources of simultaneousbrightness contrast stimuli and the Cornsweet edge, is ambiguous.Although the gradient in the Mach stimulus lacks a highlight andlowlight, it is nonetheless similar to stimuli that normally have theseadornments. If the visual system has evolved to see luminance rela-tionships wholly on the basis of past experience, as we have arguedhere, then the perceptual association elicited in response to the Machstimulus should incorporate all past experience with the sources of
similar stimuli. As a result, the Mach stimulus triggers a percept thatincludes highlights and lowlights in proportion to their statisticalconjunction in the past with the stimulus confronting the observer(which is presumably why Mach bands are much weaker than therelated perceptions generated by stimuli that actually present high-lights and lowlights, as the curved surface in Figure 12). Note that thisinterpretation of Mach bands is simply another example of the per-ceptual generation of the lightness values assigned to equiluminanttargets in response to a standard simultaneous brightness contraststimulus or the Cornsweet stimulus. The values assigned by the visualsystem are in each case the result of the probability distributions of thepossible stimulus sources.
A variety of further observations are consistent with this explana-tion of Mach bands (Lotto, Williams, & Purves, 1999a). First, thelocation of naturally occurring highlights and lowlights preciselycorresponds to the location of Mach bands (compare, e.g., Figures 10and 12). Second, the salience of Mach bands is increased when theluminance gradient in the stimulus is made more consistent with agradient arising from a curved surface (which routinely has highlightsand lowlights) and diminished when the stimulus is made moreconsistent with penumbral gradients (which lack highlights and low-lights). Third, the salience of the bands in response to a given lumi-nance gradient is changed by ancillary cues that indicate whether thegradient pertains to a curved or a flat surface.
Thus Mach bands, rather than being an incidental manifestationof lateral interactions among the retinal ganglion cells or otherlower order visual neurons as often proposed, provide furtherevidence for a fundamentally empirical strategy of vision.
Chubb–Sperling–Solomon Illusion
A final challenge considered here is the Chubb–Sperling–Solomonillusion (Chubb, Sperling, & Solomon, 1989). In this phenomenon, thedifferential brightness of randomly arranged elements is reduced whenthe target is embedded in a pattern of the same spatial frequency buthigher luminance contrast (see Figure 13). Although the effect is notparticularly strong, the apparent contrast between the elements of thecircular target in Figure 13A is appreciably lower than that in Figure 13B.
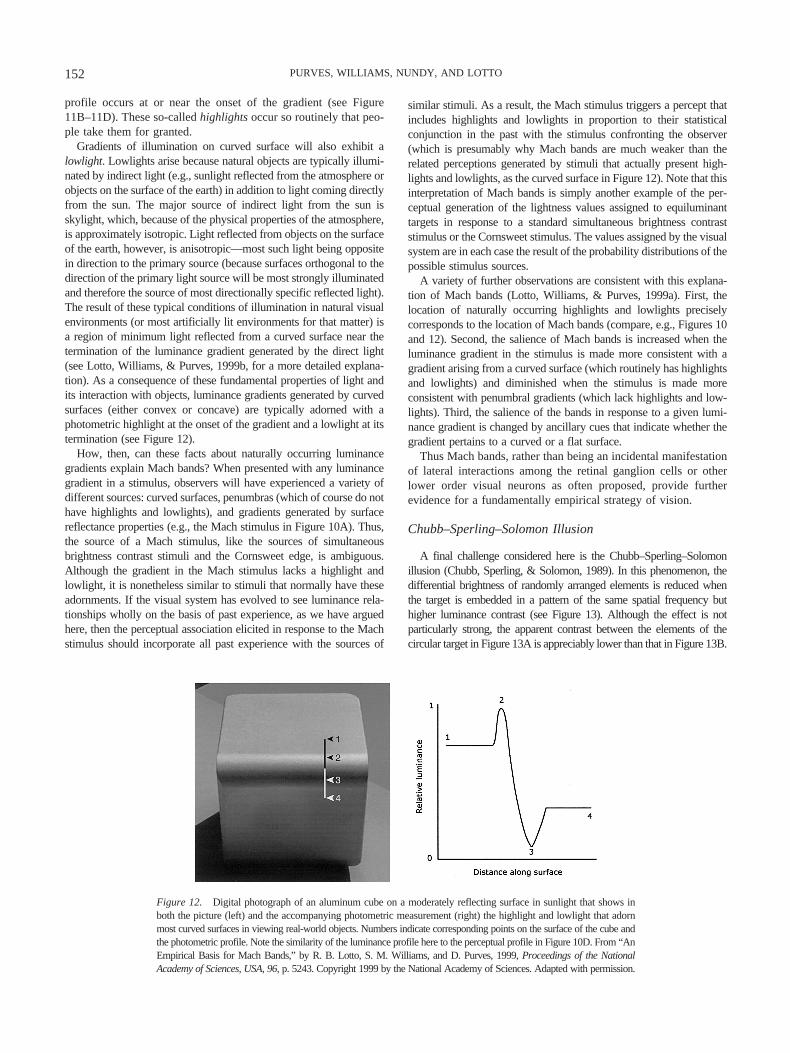
Figure 12. Digital photograph of an aluminum cube on a moderately reflecting surface in sunlight that shows inboth the picture (left) and the accompanying photometric measurement (right) the highlight and lowlight that adornmost curved surfaces in viewing real-world objects. Numbers indicate corresponding points on the surface of the cube andthe photometric profile. Note the similarity of the luminance profile here to the perceptual profile in Figure 10D. From “AnEmpirical Basis for Mach Bands,” by R. B. Lotto, S. M. Williams, and D. Purves, 1999, Proceedings of the NationalAcademy of Sciences, USA, 96, p. 5243. Copyright 1999 by the National Academy of Sciences. Adapted with permission.
152 PURVES, WILLIAMS, NUNDY, AND LOTTO

The original interpretation of this effect was based on the idea ofinhibitory interactions between cortical neurons tuned to similar spa-tial frequencies (Chubb et al., 1989; see also Olzak & Laurinen,1999). Thus, the response of neurons to the contrasting target ele-ments in Figure 13A is taken to be diminished with respect to theappearance of the target in Figure 13B because the high-contrastelements in the surround in Figure 13A more vigorously activateinhibitory connections between the relevant neurons than the uniformsurround in Figure 13B. If it is assumed that perceptions of contrastare a more or less direct manifestation of the relative activity of spatialcontrast frequency detectors in the visual cortex, then the contrastbetween the elements of the target in Figure 13A should be less thanthe contrast in Figure 13B, as is the case.
As with the Cornsweet edge and Mach band stimuli, however, anempirical explanation of the Chubb–Sperling–Solomon illusion ismore consistent with the perceptual phenomenology elicited by thissort of stimulus. In this case, the pertinent empirical facts concerntransmittance, which is defined as the ratio of the amount of light thatreaches a detector compared with the amount of light actually re-flected from an object surface. All scenes viewed at the surface of theearth are seen through media that to a greater or lesser degree affectthe amount of light that reaches the eye from objects. Although therelative clarity of the atmosphere minimizes the effects of transmit-tance in most circumstances, viewing objects at a distance, viewingnearby objects in fog or smog, and viewing objects through semi-transparent liquids or solids (e.g., water or glass) are all frequent—andconsequential—factors in determining the quality of the light thatultimately falls on the retina and initiates perception.
The physical effects of imperfect transmittance on the light thatreaches the eye are straightforward. If, for example, two target sur-faces reflect, respectively, 80% and 30% of the incident light, thereturn from the more reflective surface in perfectly transmitting con-ditions will be greater than the return from the less reflective surfacein the ratio of 8:3. If, however, the same surfaces are viewed throughan imperfectly transmitting medium, this ratio is typically reduced.Although the interposition of such a medium reduces the overall
amount of light reaching the eye from the surfaces in question, lightis added to the luminances attributable to the surfaces because thetransmitting medium also reflects light to the eye. Because this re-flected light is added equally to any return from a surface viewedthrough the medium, the relative luminance attributable to the lessreflective target surface will always be increased to a greater degreethan the luminance associated with the more reflective surface. As aresult, the difference in the luminance of the two target surfaces isreduced, in this example from a ratio of 8:3 in perfect transmittance toabout 7:5 (see also Metelli, 1970, 1974; Metelli, da Pos, & Cavedon,1985). Thus, an imperfectly transmitting medium, irrespective of itsparticular properties, typically reduces the differences in the amountof light returned from differently reflective surfaces seen through it.
An empirical explanation of the Chubb–Sperling–Solomon effectrests on these facts about imperfectly transmitting media (Lotto &Purves, 2001). The stimulus in Figure 13A is consistent with acontribution of transmittance to the light returned from the target fortwo empirical reasons: (a) The borders between the patterned ele-ments of the surround are continuous with the borders within thetarget and are thus consistent with occlusion of the central area by animperfectly transmitting medium, and (b) the luminances of the targetelements accord with values that would have arisen if the pattern ofthe surround were occluded in this way. The uniform background inFigure 13B is, by comparison, inconsistent (or less consistent) withthis stimulus source. As a result, the perception elicited by the targetin Figure 13A should, if the empirical theory of perception advocatedhere is correct, manifest the consequences of imperfect transmittanceto a greater degree than the perception elicited by Figure 13B (simplybecause the stimulus is more likely to signify a contribution ofimperfect transmittance to the amount of light reaching the eye fromthe different parts of the stimulus). It follows that the elements of thetarget in Figure 13A should appear more similar in brightness and/orlightness than the target elements in Figure 13B, as they do.
In keeping with this explanation, when the Chubb–Sperling–Solomon stimulus is made less consistent with the experience ofviewing textures through imperfectly transmitting media, the effect isreduced (see Lotto & Purves, 2001). One way this can be achieved isto slowly and continuously rotate the textured surround of the Chubb–Sperling–Solomon stimulus in Figure 13A (see www.purveslab.netfor a demonstration of this effect). Although this manipulation changesneither the luminance nor the spatial frequency of the stimulus, themotion of the target with respect to the surround makes it much lesslikely that the central target is being viewed through an imperfectlytransmitting medium that is not applied to the surround. Although thiseffect has no obvious explanation in terms of lateral interactionsamong cortical neurons similarly tuned to spatial frequency (seeabove), it is predicted by the different empirical significance of themoving and stationary components of the modified stimulus. Anothersimple way to make the Chubb–Sperling–Solomon stimulus lessconsistent with the experience of viewing a textured surface throughan imperfectly transmitting medium is changing the luminance rela-tionships between target and surround (see Figure 4 in Lotto & Purves,2001). Although the outcome of such manipulations is again predictedon empirical grounds, it is difficult to rationalize in other terms.
These several observations contradict explanations of the Chubb–Sperling–Solomon effect based on the anomalous activation of inhib-itory connections between neurons similarly tuned to spatial contrastfrequencies in the stimulus. The common denominator of the waythese stimuli behave is simply a probabilistic incorporation into per-ception of the empirical consequences of imperfect transmittance.
Figure 13. The Chubb–Sperling–Solomon illusion. A target pattern em-bedded in a surround of higher luminance contrast (A) appears to have lesscontrast than when the same pattern is placed in a uniform surround of thesame average luminance (B). The inset below shows that the contrastbetween the patterned elements of the two identical targets appears thesame when presented without their respective surrounds.
153PERCEIVING LIGHT
General Framework for Understanding the Relationship ofLuminance and Lightness and/or Brightness in Empirical Terms
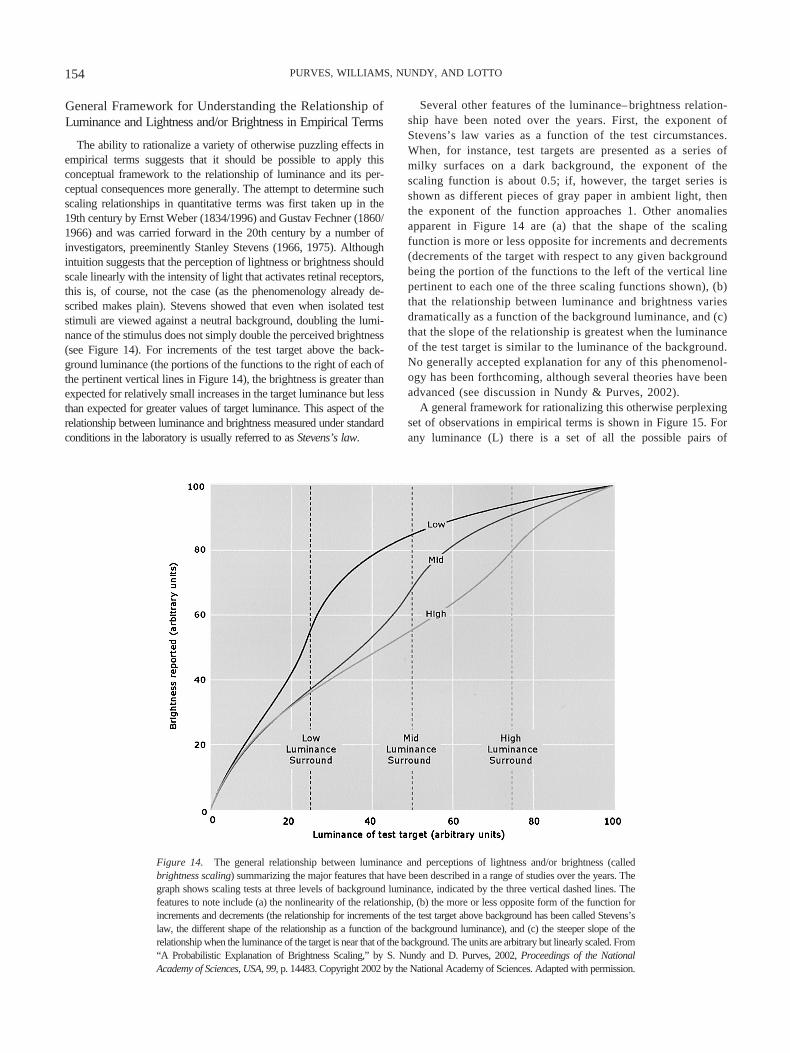
The ability to rationalize a variety of otherwise puzzling effects inempirical terms suggests that it should be possible to apply thisconceptual framework to the relationship of luminance and its per-ceptual consequences more generally. The attempt to determine suchscaling relationships in quantitative terms was first taken up in the19th century by Ernst Weber (1834/1996) and Gustav Fechner (1860/1966) and was carried forward in the 20th century by a number ofinvestigators, preeminently Stanley Stevens (1966, 1975). Althoughintuition suggests that the perception of lightness or brightness shouldscale linearly with the intensity of light that activates retinal receptors,this is, of course, not the case (as the phenomenology already de-scribed makes plain). Stevens showed that even when isolated teststimuli are viewed against a neutral background, doubling the lumi-nance of the stimulus does not simply double the perceived brightness(see Figure 14). For increments of the test target above the back-ground luminance (the portions of the functions to the right of each ofthe pertinent vertical lines in Figure 14), the brightness is greater thanexpected for relatively small increases in the target luminance but lessthan expected for greater values of target luminance. This aspect of therelationship between luminance and brightness measured under standardconditions in the laboratory is usually referred to as Stevens’s law.
Several other features of the luminance– brightness relation-ship have been noted over the years. First, the exponent ofStevens’s law varies as a function of the test circumstances.When, for instance, test targets are presented as a series ofmilky surfaces on a dark background, the exponent of thescaling function is about 0.5; if, however, the target series isshown as different pieces of gray paper in ambient light, thenthe exponent of the function approaches 1. Other anomaliesapparent in Figure 14 are (a) that the shape of the scalingfunction is more or less opposite for increments and decrements(decrements of the target with respect to any given backgroundbeing the portion of the functions to the left of the vertical linepertinent to each one of the three scaling functions shown), (b)that the relationship between luminance and brightness variesdramatically as a function of the background luminance, and (c)that the slope of the relationship is greatest when the luminanceof the test target is similar to the luminance of the background.No generally accepted explanation for any of this phenomenol-ogy has been forthcoming, although several theories have beenadvanced (see discussion in Nundy & Purves, 2002).
A general framework for rationalizing this otherwise perplexingset of observations in empirical terms is shown in Figure 15. Forany luminance (L) there is a set of all the possible pairs of
Figure 14. The general relationship between luminance and perceptions of lightness and/or brightness (calledbrightness scaling) summarizing the major features that have been described in a range of studies over the years. Thegraph shows scaling tests at three levels of background luminance, indicated by the three vertical dashed lines. Thefeatures to note include (a) the nonlinearity of the relationship, (b) the more or less opposite form of the function forincrements and decrements (the relationship for increments of the test target above background has been called Stevens’slaw, the different shape of the relationship as a function of the background luminance), and (c) the steeper slope of therelationship when the luminance of the target is near that of the background. The units are arbitrary but linearly scaled. From“A Probabilistic Explanation of Brightness Scaling,” by S. Nundy and D. Purves, 2002, Proceedings of the NationalAcademy of Sciences, USA, 99, p. 14483. Copyright 2002 by the National Academy of Sciences. Adapted with permission.
154 PURVES, WILLIAMS, NUNDY, AND LOTTO
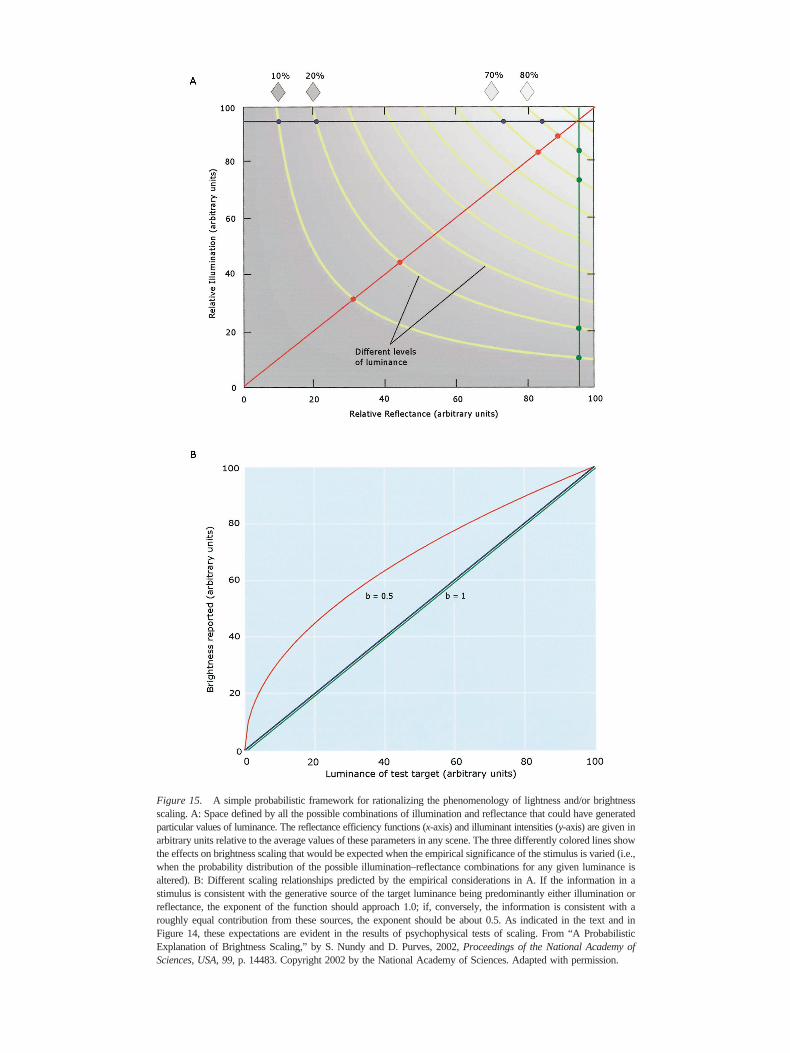
Figure 15. A simple probabilistic framework for rationalizing the phenomenology of lightness and/or brightnessscaling. A: Space defined by all the possible combinations of illumination and reflectance that could have generatedparticular values of luminance. The reflectance efficiency functions (x-axis) and illuminant intensities (y-axis) are given inarbitrary units relative to the average values of these parameters in any scene. The three differently colored lines showthe effects on brightness scaling that would be expected when the empirical significance of the stimulus is varied (i.e.,when the probability distribution of the possible illumination–reflectance combinations for any given luminance isaltered). B: Different scaling relationships predicted by the empirical considerations in A. If the information in astimulus is consistent with the generative source of the target luminance being predominantly either illumination orreflectance, the exponent of the function should approach 1.0; if, conversely, the information is consistent with aroughly equal contribution from these sources, the exponent should be about 0.5. As indicated in the text and inFigure 14, these expectations are evident in the results of psychophysical tests of scaling. From “A ProbabilisticExplanation of Brightness Scaling,” by S. Nundy and D. Purves, 2002, Proceedings of the National Academy ofSciences, USA, 99, p. 14483. Copyright 2002 by the National Academy of Sciences. Adapted with permission.

illumination (I) and reflectance (R) values that could have givenrise to the stimulus in question (for the sake of simplicity, thecontribution of transmittance and other factors here is assumed tobe negligible). Figure 15A shows the possible I and R values thatgive rise to luminances that are 10%, 20%, . . ., 100% as intense asthe maximum possible luminance. The distribution of the possibleI–R combinations that could have given rise to any particular valueof luminance (which can be thought of as a third dimension of thisspace) thus describes, to a first approximation, human experiencewith the relative contributions of these underlying factors toluminance.
The “space” illustrated in Figure 15 thus provides a simpledidactic scheme in which to explore how the luminance/lightness–brightness relationship would be expected to change in any cir-cumstances as a function of its possible sources. For example, ifthe conditions for a given test of brightness scaling were to changethe probable contribution of illumination and/or reflectance to theluminance values presented, then the probability distribution of thepossible I and R values along any isoluminance line would alsochange. More specifically, if in any scene the change in experi-mental conditions increased the probability that the changes intarget luminance derived predominantly from changes in reflec-tance, then the central tendency (e.g., the mean) of the probabilitydistribution of the possible I–R combinations that could have givenrise to a particular target luminance would shift toward the blueline in Figure 15A. By the same token, if the experimental condi-tions increased the probability that the changes in luminancevalues in the scene derived predominantly from changes in surfaceillumination, then the central tendency of probability distributionsof the I and R values would shift toward the green line. Con-versely, if the experimental conditions provided little or no infor-mation about the generative sources of the luminances in the scene(or if the information was consistent with the contributions ofillumination and reflectance being about equal), then the distribu-tion of the possible I–R combinations underlying the luminancevalues would be more centrally located along any particular isolu-minance line, as indicated by the red line.
Notice that the distance between physically proportional lumi-nances in this space varies according to these several generalcircumstances. For instance, the distance between the 10% line andthe 20% isoluminance line is the same as the distance between the70% and 80% lines when distances are measured along a lineparallel to either the reflectance or illumination axis (see dotsalong the blue and green lines in Figure 15A). If, however, thedistance between isoluminance lines is measured along a lineequidistant from the axes of reflectance and illumination, then thedistance between the 10% and 20% isoluminance lines is greaterthan the distance between the 70% and 80% lines (see dots alongthe red line). As a result, if the information in a scene was to biasthe probable sources of the luminance values in the retinal imagetoward either the illumination or the reflectance axis—and if therelative sensations elicited by any two luminance values were aconsequence of the distances between the probable I and R sourcesin this empirical space—then differences in the perceived bright-ness of the targets in a scene should vary according to the distancealong a line running more nearly parallel to the axes of illumina-tion or reflectance (i.e., nearer to the blue or green lines in Figure15A). If, conversely, the information in the scene biased the central
tendency of the probability distributions of the possible sources ofluminance values toward I–R combinations in the middle of thisspace, then the brightness difference elicited by different lumi-nances should be proportional to the distance along the red line inFigure 15A. The scaling relationships expected on this basis fortargets shown as increments above background are illustrated inFigure 15B.
One way to test these predictions is to ask subjects to adjustthe luminances of a series of test patches such that brightness ofadjacent patches increases in perceptually equal steps whenthere is only a minimum of information about the relativecontribution of illumination and/or reflectance to the stimulus.These conditions are thus similar to a standard scaling test.Subjects can then be asked to perform the same task, but withthe test patches presented in a scene rich in empirical infor-mation consistent with the patches signifying different reflec-tances under the same illuminant. The point of the compari-son is to determine if the scaling relationship changes inthe manner predicted by the empirical framework illustratedin Figure 15. If the information in a scene makes it morelikely that the source of the target luminances in the testseries is predominantly due to either changes in surface reflec-tance or the illumination, the possible I–R combinations givingrise to that luminance will necessarily fall closer to one axis orthe other of this empirical space. Perceptual responses to theluminance values presented should therefore track along a linethat is closer to the relevant axis (e.g., the blue line or the greenline). Conversely, if the stimulus makes it less likely that thegenerative I–R combination is dominated by changes in eithersurface reflectance or illumination, then the perceptual re-sponses to the presented luminances should track more centrallyin this space (i.e., along the red line). The results obtained bypsychophysical testing are in accord with these expectations(Nundy & Purves, 2002).
These observations support the conclusion that the peculiaritiesof lightness and/or brightness scaling that have been reported overthe years (see Figure 14) are also explainable in wholly empiricalterms: the parameters of the scaling function changing predictablyin a manner dictated by the influence of all the information in thescene on the probability distribution of all the possible sources ofa particular value of target luminance. Understood in this way, thediscrepancies between luminance and lightness and/or brightness,whether in tests of scaling or any other circumstance, are simplythe signature of the empirical strategy of vision.
Conclusion
A variety of perceptual phenomena pertinent to the way humansperceive the physical intensity of light stimuli, including standardillusions of simultaneous brightness contrast, Craik–O’Brien–Cornsweet edge effects, Mach bands, the Chubb–Sperling–Solomon illusion, and brightness scaling, can all be explained interms of a visual strategy that generates perceptions of luminance(i.e., the sensations of lightness and brightness) as reflex responsesdetermined by the relative probabilities of the possible sources ofinevitably ambiguous stimuli. The ability of this empirical frame-work to explain a wide range of perceptual phenomenology sup-ports this novel way of understanding what people actually see. Ifcorrect, the functional role of the neural circuitry underlying light-
156 PURVES, WILLIAMS, NUNDY, AND LOTTO

ness and/or brightness percepts will also need to be understood inthese terms.
References
Adelson, E. H. (1993, December 24). Perceptual organization and thejudgment of brightness. Science, 262, 2042–2044.
Adelson, E. H. (2000). Light perception and lightness illusions. In M. S.Gazzaniga (Ed.), The new cognitive neurosciences (2nd ed., pp. 339–351). Cambridge, MA: MIT Press.
Arend, L. E., & Goldstein, R. (1987). Lightness models, gradient illusions,and curl. Perception & Psychophysics, 42, 65–80.
Benary, W. (1924). Beobachtungen zu einem Experiment uber Helligkeits-kontrast [Observations of an experiment about contrasts in brightness].Psychologische Forschung, 5, 131–142.
Berkeley, G. (1975). Philosophical works including the works on vision(M. R. Ayers, Ed.). London: J. M. Dent & Sons. (Original work pub-lished 1709)
Blakeslee, B., & McCourt, M. E. (1997). Similar mechanisms underliesimultaneous brightness contrast and grating induction. Vision Research,37, 2849–2869.
Blakeslee, B., & McCourt, M. E. (1999). A multiscale spatial filteringaccount of the White effect, simultaneous brightness contrast and gratinginduction. Vision Research, 39, 4361–4377.
Blakeslee, B., & McCourt, M. E. (2001). Multiscale spatial filteringaccount of the Wertheimer–Benary effect and the corrugated Mondrian.Vision Research, 41, 2487–2502.
Chubb, C., Sperling, G., & Solomon, J. A. (1989). Texture interactionsdetermine perceived contrast. Proceedings of the National Academy ofSciences, USA, 86, 9631–9635.
Coren, S., Porac, C., & Ward, L. M. (1999). Sensation and perception (5thed.). New York: Harcourt Brace.
Cornsweet, T. N. (1970). Visual perception. New York: Academic Press.Cornsweet, T. N. (1985). Prentice Award Lecture: A simple retinal mech-
anism that has complex and profound effects on perception. AmericanJournal of Optometry and Physiological Optics, 62, 427–438.
Craik, K. J. W. (1966). The nature of psychology: A selection of papers,essays and other writings (S. L. Sherwood, Ed.). Cambridge, England:Cambridge University Press. (Original work published 1948)
Fechner, G. T. (1966). Elements of psychophysics (H. E. Adler, Trans.).New York: Holt, Rinehart & Winston. (Original work published 1860)
Gilchrist, A. L. (1977, January 14). Perceived lightness depends on per-ceived spatial arrangement. Science, 195, 185–187.
Gilchrist, A. L. (Ed.). (1994). Lightness, brightness and transparency.Hillsdale, NJ: Erlbaum.
Goldstein, E. B. (2002). Sensation and perception. Pacific Grove, CA:Wadsworth.
Grossberg, S. (1987). Cortical dynamics of three-dimensional form, color,and brightness perception: I. Monocular theory. Perception & Psycho-physics, 41, 87–116.
Hartline, H. K. (1940). The receptive fields of optic nerve fibers. AmericanJournal of Physiology, 130, 690–699.
Hartline, H. K., & Graham, C. H. (1932). Nerve impulses from singlereceptors in the eye. Journal of Cellular Comparative Physiology, 1,277–295.
Knill, D. C., & Kersten, D. (1991, May 16). Apparent surface curvatureaffects lightness perception. Nature, 351, 228–230.
Kuffler, S. W. (1953). Discharge patterns and functional organization ofmammalian retina. Journal of Neurophysiology, 16, 37–68.
Kuffler, S. W. (1973). The single-cell approach in the visual system and thestudy of receptive fields. Investigative Ophthalmology, 12, 794–813.
Land, E. H. (1986). Recent advances in Retinex theory. Vision Research,26, 7–21.
Lotto, R. B., & Purves, D. (1999). The effects of color on brightness.Nature Neuroscience, 2, 1010–1014.
Lotto, R. B., & Purves, D. (2001). An empirical explanation of theChubb–Sperling–Solomon illusion. Journal of Cognitive Neuroscience,13, 1–9.
Lotto, R. B., Williams, S. M., & Purves, D. (1999a). An empirical basis forMach bands. Proceedings of the National Academy of Sciences, USA,96, 5239–5244.
Lotto, R. B., Williams, S. M., & Purves, D. (1999b). Mach bands asempirically derived associations. Proceedings of the National Academyof Sciences, USA, 96, 5245–5250.
Lynch, D. K., & Livingston, W. C. (1995). Color and light in nature.Cambridge, MA: Cambridge University Press.
Mach, E. (1865). Uber die Wirkung der raumlichen Verthelung des Licht-reizes auf die Netzhaut. I. Sber. math. -nat [On the physiological effectof spatially distributed luminance stimuli]. Classe kaiserlichen Akad-emie der Wissenschaften, 52, 303–322.
Mach, E. (1866). Uber den physiologischen Effect raumlich vertheilterLichtreize. II. Sber. math. -nat [On the physiological effect of spatiallydistributed luminance stimuli]. Classe kaiserlichen Akademie der Wis-senschaften, 54, 131–144.
Mach, E. (1868). Uber die physiologische Wirkung raumlich vertheilterLichtreize. IV. Sber. math. -nat [On the physiological effect of spatiallydistributed luminance stimuli]. Classe kaiserlichen Akademie der Wis-senschaften, 57, 11–19.
Mach, E. (1959). The analysis of sensations and the relation of the physicalto the psychical (1st ed.; C. M. Williams, Trans.). New York: Dover.(Original work published 1914)
Metelli, F. (1970). An algebraic development of the theory of perceptualtransparency. Ergonomics, 13, 59–66.
Metelli, F. (1974). Achromatic color conditions in the perception of transpar-ency. In R. B. MacLeod & H. L. Pick (Eds.), Perception: Essays in honorof James J. Gibson (pp. 95–116). Ithaca, NY: Cornell University Press.
Metelli, F., da Pos, O., & Cavedon, A. (1985). Balanced and unbalanced,complete and partial transparency. Perception of Psychophysics, 38,354–366.
Minnaert, M. G. J. (1992). Light and color in the outdoors. New York:Springer. (Original work published 1937)
Nundy, S., & Purves, D. (2002). A probabilistic explanation of brightnessscaling. Proceedings of the National Academy of Sciences, USA, 99,14482–14487.
O’Brien, V. (1959). Contrast by contour-enhancement. American Journalof Psychology, 72, 299–300.
Olzak, L. A., & Laurinen, P. I. (1999). Multiple gain control processes incontrast–contrast phenomena. Vision Research, 39, 3983–3987.
Purves, D., Augustine, G. J, Fitzpatrick, D., Katz, L. C., LaMantia, A.-S.,McNamara, J. O., & Williams, S. W. (2001). Neuroscience (2nd ed.).Sunderland, MA: Sinauer.
Purves, D., & Lotto, R. B. (2003). Why we see what we do: An empiricaltheory of vision. Sunderland, MA: Sinauer.
Purves, D., Shimpi, A., & Lotto, R. B. (1999). An empirical explanation ofthe Cornsweet effect. Journal of Neuroscience, 19, 8542–8551.
Ratliff, F. (1965). Mach bands: Quantitative studies on neural networks inthe retina. San Francisco, CA: Holden-Day.
Rock, I. (1995). Perception. New York: Scientific American Library.Sakmann, B., & Creutzfeldt, O. D. (1969). Scotopic and mesopic light
adaption in the cat’s retina. Pflugers Archive, 313, 168–185.Schirillo, J. (1999a). Surround articulation. I. Brightness judgments. Jour-
nal of the Optical Society of America A, 16, 793–803.Schirillo, J. (1999b). Surround articulation. II. Lightness judgments. Jour-
nal of the Optical Society of America A, 16, 804–811.Stevens, S. S. (1966). Concerning the measurement of brightness. Journal
of the Optical Society of America, 56, 1135–1136.Stevens, S. S. (1975). Psychophysics. New York: Wiley.Todorovic, D. (1997). Lightness and junctions. Perception, 26, 379–394.
157PERCEIVING LIGHT

Weber, E. H. (1996). E. H. Weber on the tactile senses (2nd ed.; H. E. Ross& D. J. Murray, Eds.). Hove, England: Erlbaum. (Original work pub-lished 1834)
Wertheimer, M. (1950). Laws of organization in perceptual forms. InW. D. Ellis (Trans. and Ed.), A sourcebook of Gestalt psychology (pp.71–88). New York: Humanities Press. (Original work published 1912)
White, M. (1979). A new effect of pattern on perceived lightness. Percep-tion, 8, 413–416.
Wiesel, T. N., & Hubel, D. H. (1966). Spatial and chromatic interactions inthe lateral geniculate body of the rhesus monkey. Journal of Neurophys-iology, 29, 1115–1156.
Williams, S. M., McCoy, A. N., & Purves, D. (1998a). The influence ofdepicted illumination on perceived brightness. Proceedings of the Na-tional Academy of Sciences, USA, 95, 13296–13300.
Williams, S. M., McCoy, A. N., & Purves, D. (1998b). An empiricalexplanation of brightness. Proceedings of the National Academy ofSciences, USA, 95, 13301–13306.
Received November 5, 2001Revision received March 4, 2003
Accepted May 27, 2003 �
158 PURVES, WILLIAMS, NUNDY, AND LOTTO