perceived threats to privacy online: the internet in britain · the oxford internet surveys . the...
TRANSCRIPT

Grant Blank and William H. Duttonwith assistance from Julia Lefkowitz
Perceived Threats to Privacy Online:The Internet in Britain
Oxford Internet Survey 2019

Acknowledgements
The authors wish to thank the entire OII team for their support of OxIS research. We also wish to acknowledge Mark Malbas and Sara Spinks for administrative support. For research assistance we are indebted to Julia Lefkowitz. Lucy Walters designed the cover. For their early involvement with OxIS we would like to thank Dr Ellen J. Helsper, Professor Richard Rose, Dr Adrian Shepherd and Dr Corinna di Gennaro. All have helped shape the evolution of this research. We are particularly grateful for the financial support of OxIS 2019 by the Department for Digital, Media, Culture and Sport (DCMS), BT and Google. Our colleagues from these sponsoring organisations offered useful suggestions and valuable comments, helping to ensure that OxIS continues to address issues of policy and practice.
Contact OxIS
Oxford Internet Institute University of Oxford 1 St Giles Oxford OX1 3JS United Kingdom Telephone: +44 (0) 1865 287210 Email: [email protected] Web: http://oxis.oii.ox.ac.uk/ The full report and the questionnaire are available at the OxIS website. Please cite the source of text and data excerpts as: Blank, G and Dutton, W.H., with Lefkowitz, J. (2019) Perceived Threats to Privacy Online:
The Internet in Britain. Oxford Internet Survey 2019. Oxford Internet Institute, University of Oxford.
© The University of Oxford for the Oxford Internet Institute 2019. This work may be copied
freely for non-commercial research and study. If you wish to undertake any of the other acts restricted by the copyright you should apply in writing to the Director of the Institute at 1 St Giles, Oxford OX1 3JS, United Kingdom.

Perceived Threats to Privacy Online: The Internet in Britain
by
Grant Blank and William H. Dutton with assistance from Julia Lefkowitz
Oxford Internet Survey 2019 Summary
Oxford Internet Institute University of Oxford
1 St Giles Oxford OX1 3JS United Kingdom
http://oxis.oii.ox.ac.uk/
Sponsored by

Oxford Internet Survey Summary, 2019 page 2
Executive Summary
Key findings of the 2019 Oxford Internet Survey include:
• After many years of rapid change, parts of the Internet are stabilising • Internet users have rapidly increased banking, commercial and entertainment activity • Generally, there are small or no increases in content-production activities like posting
pictures, commenting, reviewing, maintaining a personal website, or blogging • Access to the Internet has increased but only incrementally • Almost everyone under the age of 50 uses the Internet • There remain higher proportions of non-users below the median income (£28,400/year
in 2018) • There are also disproportionate percentages of non-users among less-educated groups
Key findings on harmful experiences include:
• Harmful experiences on the Internet, like viruses or theft of credit card details, have been stable—they have not increased
• Most users are not strongly concerned about the possibility of being a victim as a result
of their Internet activity • The overwhelming majority of users do not like the corporate use of the Internet for
targeted advertising • Most non-users are not interested in going online—they are non-users by choice • A small group of non-users (10%) say that the most important reason they are not online
is because they are worried about their privacy

Oxford Internet Survey Summary, 2019 page 3
Introduction
The Oxford Internet Surveys The Oxford Internet Surveys (OxIS) are a core research project of the Oxford Internet Institute (OII), a leading world centre for the multidisciplinary study of the Internet and society. A department within the Social Sciences Division of the University of Oxford, the OII focuses its research and teaching on the social shaping and implications of the Internet, and on informing related policy and practice. Launched by the Oxford Internet Institute in 2003, OxIS has become an authoritative source of information about Internet access, use and attitudes—and the difference these make for everyday life—in Britain. Areas covered by OxIS include digital and social inclusion and exclusion; regulation and governance of the Internet; privacy, trust and risks; and uses of the Internet, including entertainment, commerce, content creation and learning. The OxIS 2019 survey is the seventh in a series, with previous surveys conducted in 2003, 2005, 2007, 2009, 2011 and 2013. Each has used a multi-stage national probability sample of about 2000 people in Britain, enabling us to project estimates to Britain as a whole. Sampling details are in a separate technical report on the OxIS website: https://oxis.oii.ox.ac.uk
The UK in a Global Collaboration
OxIS provides the UK’s contribution to the World Internet Project (WIP), an international, collaborative project that joins over two dozen nations in studies of the social, economic and political implications of the Internet. More information about WIP can be found at: http://www.worldinternetproject.net/
The Internet’s Context in Britain –– 2019
During the 1980s and 1990s many early users saw the Internet through a strongly positive, even utopian lens. In 2019 we are in a very different place. Critics see the empowerment of the public to be an illusion. Instead of cooperation and community promised in the early years, reporting on the Internet emphasises dangers to children, potential financial losses and privacy breaches. Instead of democracy we hear about Russian interference in elections. One summary of 2018 says “Malware authors continue to innovate, find new infection vectors and better obfuscate their wares. Heading into 2019, you can bet that cybercriminals will do everything in their power to become even more effective and virulent.” (O’Donnell 2019). Reporting often emphasises the rise in problems (Malwarebytes Labs 2019). In 2019 there is a widespread narrative arguing that the Internet is a dangerous place. This perspective emphasises the risks and the potential for significant harm. Britain is at the forefront of this narrative. In February the British government published a report called Disinformation and “Fake News”’ (House of Commons 2019) and in April an ‘Online Harms’ White Paper (Ofcom 2019). These reports emphasise a need to address online harms.

Oxford Internet Survey Summary, 2019 page 4
For example, the ‘Online Harms’ White Paper briefly acknowledges the value of the Internet, and then goes on to say “there is growing evidence of the scale of harmful content and activity that people experience online. Online services can be used to spread terrorist propaganda and child abuse content, they can be a tool for abuse and bullying and they can be used to undermine civil discourse.” (Ofcom 2019:12) In this context, we believe it is important to look at the Internet through the views and behaviour of Internet users in Britain. We bring OxIS data to bear on the state of the Internet in Britain in 2019, with a special emphasis on the effects of harmful content and activity. The perspective in this paper is that of Internet users. With systematic comparisons to the last wave of OxIS in 2013 we answer questions like: What evidence suggests widespread threats? What are the major trends in online threats when viewed from the perspective of Internet users in Britain? The paper is divided into three parts. First, we describe the basic social aspects of the Internet in Britain in 2019 using demographic information. Then we look at the experience of users with respect to harms and threats. To what extent have users experienced problems online, and have their experiences influenced their behavior? Finally, we compare users and non-users. Does the narrative about harms seem to influence non-users as well as users?

Oxford Internet Survey Summary, 2019 page 5
7869
27
9895
47
0
20
40
60
80
100
% w
ho u
se th
e In
tern
et
18-24 25-34 35-44 45-54 55-64 65+
2005 2007 2009 2011 2013 2019
2005 N=2,185; 2007 N=2,350; 2009 N=2,013; 2011 N=2,057; 2013 N=2,657; 2019 N=1,818
Use by Age
II. Change and Stability in Internet Use in Britain
There is stability in many areas of the Internet but change persists in some parts. Here we outline the major areas where use and activity have remained stable, and where online activity continues to change. Internet use has stabilised at very close to 100 percent for almost everyone below the age of 50, and at over 90 percent for everyone with an income of at least £20,000 per year. The effect of educational qualifications has changed little since 2013. Over 90 percent of respondents who have Further Education or Higher Education qualifications are online. The primary location of use remains the home, but work use, library use and mobile use have all increased. Use of free wifi is very common, and it has become the third most common way to go online, away from home or work. Gender differences in access have largely disappeared, but income, education and age remain important factors sorting those who do from those who do not go online. The range of Internet skills across different groups of people has not changed since 2009. Internet users have intensified and extended their commercial and entertainment activities online. In particular, banking, commerce and entertainment have increased sharply. On the other hand, content-production activity—like posting or re-posting pictures, commenting on others' posts, or maintaining a personal website—show little increase, while selling products and blogging have declined since 2013, given a shift to social media such as Facebook and Instagram. We begin with basic demographics: age, income, education, gender and lifestage. Then we examine online commercial and entertainment use, followed by content production.
Internet use has expanded in all age groups, although the increase is small over the past 6 years. The notable pattern is that almost everyone is online up to about the age of 50. After 50 there is a sharp decline in Internet use of about 2 percentage points per year.
Oxford Internet Survey Summary, 2019 page 6
29
58
70
83 84
6067
9098 93
0
20
40
60
80
100
% w
ho u
se th
e In
tern
et
Less than£12,500
£12,500to £20,000
£20,000to £30,000
£30,000to £40,000
Over£40,000
2005 2007 2009 2011 2013 2019
OxIS current users: 2005 N=1,309; 2007 N=1,578; 2009 N=1,401; 2011 N=1,498; 2013 N=2,083; 2019 N=1,484Note: The income scale changed in 2009.
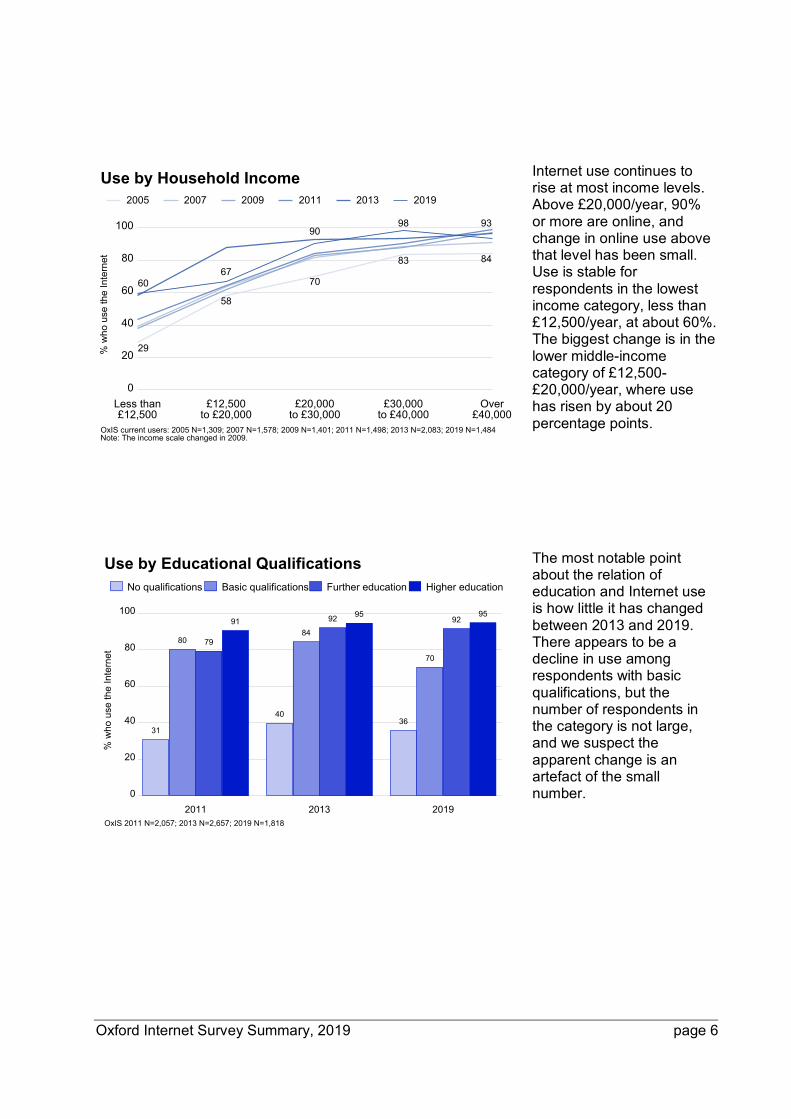
Use by Household Income
31
80 79
91
40
84
92 95
36
70
9295
0
20
40
60
80
100
% w
ho u
se th
e In
tern
et
2011 2013 2019 OxIS 2011 N=2,057; 2013 N=2,657; 2019 N=1,818
Use by Educational QualificationsNo qualifications Basic qualifications Further education Higher education
Internet use continues to rise at most income levels. Above £20,000/year, 90% or more are online, and change in online use above that level has been small. Use is stable for respondents in the lowest income category, less than £12,500/year, at about 60%. The biggest change is in the lower middle-income category of £12,500-£20,000/year, where use has risen by about 20 percentage points.
The most notable point about the relation of education and Internet use is how little it has changed between 2013 and 2019. There appears to be a decline in use among respondents with basic qualifications, but the number of respondents in the category is not large, and we suspect the apparent change is an artefact of the small number.

Oxford Internet Survey Summary, 2019 page 7
848789899192
565861
6871
63
40454748
44
69
18
27
43
61
13
22
52
32
19
0
20
40
60
80
100
% o
f peo
ple
who
hav
e
Mobilephone
Cable orsatellite TV
Gamesconsole*
Tablet** orReader*
TV withInternet*
Streamingvideo*
Voiceassistant*
OxIS 2005 N=2,185; 2007 N=2,350; 2009 N=2,013; 2011 N=2,057; 2013 N=2,657; 2019 N=1,818*Note: Question not asked in all years.**Note: Called a 'PDA' prior to 2011.
ICTs in the Household by Year2005 2007 2009 2011 2013 2019
94 93 95 97 98 99
19
40
56
7268
42 43 46 4440
60
10 11 12 1510
19
0
20
40
60
80
100
% o
f cur
rent
use
rs
At home Mobile* Free wifiout of home
School or work Library OxIS current users: 2005 N=1,309; 2007 N=1,578; 2009 N=1,401; 2011 N=1,498; 2013 N=2,083; 2019 N=1,484**Note: Question not asked in 2005 & 2007.
Locations of Use by Year 2005 2007 2009 2011 2013 2019
Household use remains ubiquitous at 99% in 2019. Following from the intensification of use, in all other locations use has increased. Mobile use has reached 72%, and free wifi is only slightly less at 68%. Free wifi use now exceeds school or work use. Notably, library use is up somewhat, to 19%.
Mobile phones are the most common ICTs in each household, now in 92% of households. There have been big increases in access to tablets and readers, and the use of streaming video. TVs with an Internet connection have increased by 30 percentage points. In just a few years, voice assistants have reached 19% of British households. In contrast, cable or satellite TV and games consoles have declined slightly.

Oxford Internet Survey Summary, 2019 page 8
6461
71 6973 71 72 70
95
77
44
0
20
40
60
80
100
% o
f use
rs w
ith g
ood
or e
xcel
lent
ski
lls
2005
2007
2009
2011
2013
2019 Men
Women
Studen
ts
Employe
d
Retired
OxIS current users: 2005 N=1,309; 2007 N=1,578; 2009 N=1,401; 2011 N=1,498; 2013 N=2,083; 2019 N=1,484
Self-Rated Ability by Year, Gender and Lifestage
8792
59
83
64
76
49
72
44
66
21
44
3542
0
20
40
60
80
100
Perc
ent o
f cur
rent
use
rs
Buyproducts
Pay bills Listento music
Watchmovies
Followcelebrities
Post videos Buygroceries
OxIS current users: 2019 N=1,484
Commercial & Entertainment Activity Online, 2013-192013 2019
Self-rated ability has been stable since 2009 at just over 70%. There are no differences in ability by gender. Students rate their ability almost 20 percentage points higher than employed respondents: 77% vs. 95%. These differences are similar to 2013.
The plot of commercial and entertainment activities illustrates what intensification of activity means. All forms of commerce have increased sharply from 2013 to 2019. Activities like posting videos online, watching movies and following celebrities increased by more than 20 percentage points

Oxford Internet Survey Summary, 2019 page 9
71
79
6369
5559
42 41
2014
1823
1013
0
20
40
60
80
Perc
ent o
f cur
rent
use
rs
Comment onsocial media
Post ownpictures
Repostpictures
Sellproducts
Writea blog
Maintaina website
Comment onother user
OxIS current users: 2019 N=1,484
Content Production Online, 2013-20192013 2019
On the other hand, the use of the Internet for various forms of content production has been more stable. Activities like posting your own pictures and maintaining a personal website are up by only 5 percentage points, but remain high. Selling products online is stable at just over 40%. Some production activities have declined. Writing a blog has declined 6 percentage points, while commenting on social media has increased.
Entertainment and consumer use of the Internet has increased rapidly, while content production is increasing more slowly; for some activities it is declining, or shifting to social media use.

Oxford Internet Survey Summary, 2019 page 10
63
5
1518
0
20
40
60
Perc
ent o
f res
pond
ents
Computer+mobile Computer-only Mobile-only Non-user OxIS 2019 N=1,818
Mode of Access
II. Mobile Smartphone Use
We began the 2019 wave of data collection with the idea that the biggest recent development was the apparently unstoppable rise of smartphone use of the Internet. Mobile use has had a major impact on mobile-first website design, and on which companies and products are profitable online. Although these are important issues for companies that produce web products, they tell us little about users. What about users? Our particular interest in mobile users is due to several questions. Do the small screens and limited input capability of smartphones constrain their users? Perhaps mobile-only respondents use the Internet primarily for entertainment. A mobile contract is often easier to manage than fixed-line computer access to the Internet. Could mobile-only users represent a new digital divide? Who, in short, are mobile-only users? We began by dividing our data into 4 groups: non-users, mobile-only users, computer-only users, and computer+mobile users. “Mobile” means respondents who use a smartphone, and “mobile-only” means a user goes online only via a phone, not a computer or a tablet.
The vast majority of users have both a computer plus a smartphone, about 63%. Mobile-only users comprise about 15% of the British population. Computer-only users are the smallest category at 5%.

Oxford Internet Survey Summary, 2019 page 11
42
51
8781
48
1 0
1420
129
40
21
1
10
0
30
60
90
Perc
ent o
f res
pond
ents
Computer+mobile Computer-only Mobile-only Non-user OxIS 2019 N=1,818
Yearly Income by Mode of Access<=£12,500 >£12,500-£30,000 >£30,000-£50,000 Over £50,000
88
64
76
83
44
66
83
46
83
73
31
61
33
18
3
0
30
60
90
Perc
ent o
f cur
rent
use
rs
Onlinebanking
Post onlinecomments
Post onsocial media
Postpictures
Post ownwriting
OxIS current users: 2019 N=1,484
Activities by Mode of AccessComputer+mobile Computer-only Mobile-only
The largest proportion of mobile-only users is in the £12,500-30,000/year income category, which includes the median income (about £28,400 in 2018), not at the lowest income level. Additionally, 9% of respondents earning over £50,000/year are mobile- only users. Mobile-only users tend toward lower-income categories but they exist in all income groups.
An almost identical story can be told about education and mobile use. Mobile-only users are not distinguished by education.
How restrictive are the small screens and limited input on smartphones? Looking at what they do on the Internet, mobile-only users are a lot like computer+mobile users. They are less like computer-only users. You can see this by comparing the percentage point difference between computer+mobile and mobile-only users to the difference between computer-only and mobile-only users. Computer-only users are usually the least active online. Computer+mobile users are the most active Internet users with mobile-only users in between.
Generally, mobile-only users are not very distinctive. They are not distinctive in terms of content creation. They are not restricted to entertainment-only uses. In their activities they are almost always in the middle between computer-only and computer+mobile users. An exception is blogs where they are the least likely to write a blog, although they may tweet and use social media heavily.

Oxford Internet Survey Summary, 2019 page 12
90 91
76
33
69
52
0
20
40
60
80
100
Perc
ent w
ho a
gree
or a
gree
stro
ngly
Should protectcredit card details
Taken action toprevent virus
Concerned may receivemalware or virus
OxIS current users: 2019 N=1,484
Perceptions of Risk Online, 2013-20192013 2019
III. Online Risks?
The mass media report frequent privacy problems, but what are the experiences of actual users? Are online threats increasing? The perhaps surprising answer is ‘no’. Respondents report virtually identical rates of bad experiences online in 2019 as they did in 2013. Experiences with viruses have declined to less than half of what they were. This may mean that commercial anti-virus software and security updates have become more effective. In line with their experiences, respondents are less concerned with threats in 2019 than they were in 2013. Corporations that track users around the Internet for the purpose of sending targeted advertisements is one of the biggest privacy-related issues. Here the verdict from respondents is clear: over 70% of respondents say they are not comfortable being tracked. There are no large differences by any demographic variables. The largest differences are age, where the percentages of ‘not comfortable’ respondents are: 65% for ages 18-24, 65% for ages 55-64, and 79% for ages 75-84. In all cases, large majorities of respondents are not comfortable with the use of targeted advertisements.
Do the repeated reports of data breaches, reports of Russian interference, or reports of spying influence individuals? The questions we asked relating to perception of risks show that respondents believe risks are stable or declining. Concern with malware and viruses has declined by 17 percentage points. The proportion who have taken action to prevent a virus has declined by a surprising 43 percentage points. Anti-virus software is often installed by default; it may be good enough so that most users forget that it is there.

Oxford Internet Survey Summary, 2019 page 13
30
12 12 11 11 11
6 6
0
10
20
30
40
Perc
ent o
f cur
rent
use
rs
Receivedmalware or virus
Product wasmisrepresented
Received obsceneor abusive emails
Credit carddetails stolen
OxIS current users: 2019 N=1,484
Bad Experiences Online, 2013-20192013 2019
4752
39
3127 27 26
0
20
40
60
Perc
ent w
ho a
gree
or t
aken
act
ion
AgreeInternet
threatens privacy
KeepContactdetailsprivate
KeepMedicalissuesprivate
KeepMaritalstatusprivate
KeepAge
private
KeepShopping orpurchases
private OxIS current users: 2019 N=1,484
Concern with Privacy Online: 2013-20192013 2019
If respondents’ perceptions haven't changed, is there an empirical basis for their perception? In actual fact, users’ bad experiences have been surprisingly stable over the past six years. Actual experiences have not changed since 2013. In some cases negative experiences have declined, like receiving malware or a virus, which declined by 18 percentage points.
Much recent concern has been specifically about privacy. When we ask directly, concern about privacy threats is largely stable, increasing by only 4 percentage points. In 2019 we also asked whether people have taken action to protect their privacy in five areas: contact details, medical issues, marital status, age, and online purchases. In all cases, somewhere between a quarter (for purchases, marital status and age) and about 40% (for contact details), have taken some sort of action.
If action indicates concern then the fact that most people have not taken any actions to protect their privacy suggests a lack of concern or awareness.
Oxford Internet Survey Summary, 2019 page 14
30
38
29
3
0
10
20
30
40
Perc
ent o
f Int
erne
t use
rs
Not comfortableat all
Notcomfortable
Fairlycomfortable
Verycomfortable
OxIS current users: 2019 N=1,484
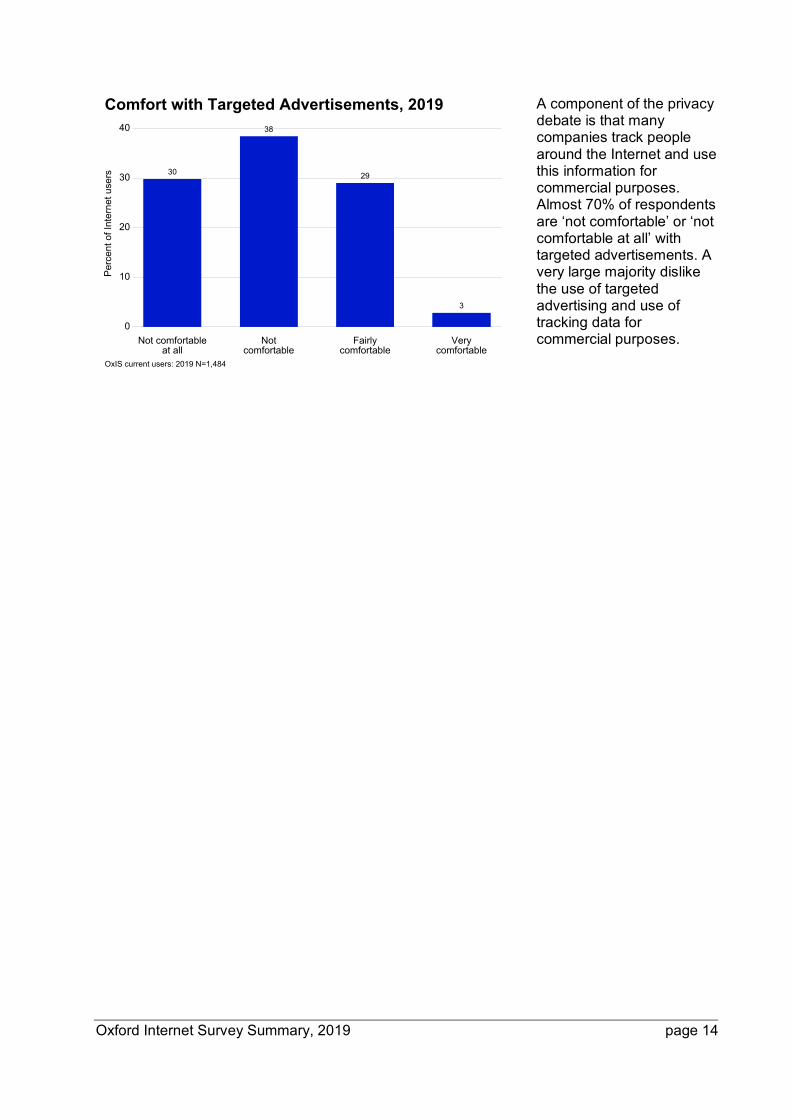
Comfort with Targeted Advertisements, 2019
A component of the privacy debate is that many companies track people around the Internet and use this information for commercial purposes. Almost 70% of respondents are ‘not comfortable’ or ‘not comfortable at all’ with targeted advertisements. A very large majority dislike the use of targeted advertising and use of tracking data for commercial purposes.

Oxford Internet Survey Summary, 2019 page 15
52
72
0
20
40
60
80
Perc
ent w
ho a
gree
or a
gree
stro
ngly
Current user Non-user OxIS 2019 N=1,818
Internet Threatens Privacy: Users vs Non-users
IV. Bad experiences and the Digital Divide
Previous plots are mostly about users. We have seen that most respondents have not experienced or perceived any change in their online risks. Their concerns with privacy also remain unchanged. We suspect that dislike of targeted advertising has not changed either, even though we have no data from earlier years. But can these problems influence non-users? Since they are not online, do the problems of users affect them at all? For non-users, the central question revolves around why they are not online. Because they are not online they have no personal experience on which to base their opinions. They depend on media reports much more heavily than users. Could the constant drumbeat of negative stories leave them afraid to go online? In other words, could the negative media reports contribute to the digital divide?
One way to address this question is to compare the level of privacy concerns of users to non-users. We find that non-users are 20 percentage points more concerned with the dangers of the Internet than users. This is a partial answer to our digital divide question.

Oxford Internet Survey Summary, 2019 page 16
79
29
38
72
0
30
60
90
Perc
ent w
ho a
gree
or a
gree
stro
ngly
Technology ismaking things better
It is often easier to dothings without technology
OxIS 2019 N=1,818
Technology Attitudes of Users and Non-usersUsers Non-users
82
69
8
18
1
103 2
50
0
30
60
90
Perc
ent o
f non
-use
rs
Just notinterested
Do not knowhow to use it
Privacyworries
Computernot available
Tooexpensive
Non-users: OxIS 2013 N=483; 2019 N=290
Reasons Non-users are not Online, 2013-20192013 2019
Similarly, Internet attitudes toward technology may reflect, in part, privacy concerns. Users are more likely to believe that technology is making things better by an astonishing 50 percentage points. Asking a similar question from the opposite direction, users are 34 percentage points less likely to agree that it is often easier to do things without technology. Users are much more positive.
Finally, we can look at the most important reason non-users do not go online. Lack of interest dominates the reasons, as it has for the past decade. However, privacy worries have risen from 1% to 10% since 2013. This suggests that reports of privacy issues might be having an impact on whether non-users go online. They are discouraging access, and in this way reinforcing the digital divide.
These plots underscore what we have seen in previous waves. Most non-users are offline by choice. Without personal experience, non-users find it hard to see the benefits of going online. The plots call attention to the value of support for non-users to experience the Internet. These plots also call attention to something new. Non-users are increasingly worried that going online might threaten their privacy. We suggest that the steady drumbeat of stories about privacy violations, theft of credit card credentials, and malware serve to raise the fears of offline respondents more than those with experience online, and make them more reluctant to go online. In this way the negative stories contribute to the continued existence of the digital divide, and they frustrate efforts to close it.

Oxford Internet Survey Summary, 2019 page 17
In sum, users have intensified their engagement with online activities, especially entertainment and online commerce. At the same time, the diffusion of the Internet has plateaued. This leveling off of Internet use is a pattern we are seeing in Scandinavian countries and elsewhere in Northwest Europe. This leads to a widening separation between users who do more online, and non-users who resolutely avoid the Internet. The benefits of the Internet, like saving time and money, access to health information, and easier access to job listings, are accruing to one social group. But they don’t benefit another social group. We see an apparently stable divide in the UK separating Internet users from non-users. Most people do not report concerns about protecting their privacy. This may stem in part from the fact that there has been little change in bad experiences of users over the past six years. Non-users listen to the narrative about online harms, and they are more concerned than users about privacy violations on the Internet. The narrative is having an effect; some non-users say it is the most important reason keeping them offline.
Oxford Internet Survey Summary, 2019 page 18
References House of Commons. 2019. Disinformation and ‘fake news’: Final report. Downloaded from
https://publications.parliament.uk/pa/cm201719/cmselect/cmcumeds/1791/1791.pdf on 2019-08-01.
ITU. 2018. "ITU releases 2018 global and regional ICT estimates”. International
Telecommunication Union (ITU). https://www.itu.int/en/mediacentre/Pages/2018-PR40.aspx on 2019-08-01.
Malwarebytes Labs. 2019. 2019 State of malware. Downloaded from
https://resources.malwarebytes.com/files/2019/01/Malwarebytes-Labs-2019-State-of-Malware-Report-2.pdf on 2019-08-02.
O’Donnell, L. 2019. Malware trends to watch. Downloaded from https://threatpost.com/2019-
malware-trends-to-watch/140344/ on 2019-08-02. Ofcom. 2019. Online Harms White Paper. Downloaded from
www.gov.uk/government/publications. on 2019-08-01.

Oxford Internet Survey Summary, 2019 page 19
Author Biographies Grant Blank (Ph.D. University of Chicago) is the Survey Research Fellow at the Oxford Internet Institute and Senior Research Fellow of Harris Manchester College, both part of University of Oxford, United Kingdom. He is a sociologist specializing in the social and cultural impact of the Internet, the digital divide, statistical and qualitative methods, and cultural sociology. He is currently working on analyses of British Internet use based on the 2019 wave of the Oxford Internet Survey (OxIS). In 2015 he was awarded the Lifetime Achievement Award from the Communication, Information Technology and Media Sociology section of the American Sociological Association. He can be reached at [email protected]; see http://www.linkedin.com/in/grantblank/. William H. Dutton is an Oxford Martin Fellow, supporting the Global Cyber Security Capacity Centre of the Department of Computer Science, and a Senior Fellow at the Oxford Internet Institute, at the University of Oxford. He is also a Visiting Professor in Media and Communication at the University of Leeds. Until 2018, Bill was the Quello Professor of Media and Information Policy at Michigan State University, where he was Director of the Quello Center. Prior to that, he was the OII’s Founding Director, a Fellow of Balliol College and the first Professor of Internet Studies at Oxford University. Before coming to Oxford in 2002, he was a Professor in the Annenberg School for Communication at the University of Southern California, where he remains an Emeritus Professor. Julia Lefkowitz is a research assistant and DPhil candidate at the Oxford Internet Institute, University of Oxford. Her doctoral thesis examines putative shifts in British journalism in the context of the Internet's ascendance. She has published research on the topic of ‘tabloidization,’ and on cross-national media scandals as reported through U.S. and French ‘quality’ newspapers. At Oxford, she has also worked as a Teaching Assistant on the Internet Institute’s Statistics core course. Julia has a wide range of interests including media, branding, sociology, and film.

Oxford Internet Survey Summary, 2019 page 20
About the Oxford Internet Institute (OII) The Oxford Internet Institute (OII) is a multidisciplinary research and teaching department of the University of Oxford, dedicated to the social science of the Internet. Drawing from many different disciplines, the OII works to understand how individual and collective behaviour online shapes our social, economic and political world. Since its founding in 2001, research from the OII has had a significant impact on policy debate, formulation and implementation around the globe, as well as a secondary impact on people’s wellbeing, safety and understanding. Drawing on many different disciplines, the OII takes a combined approach to tackling society’s big questions, with the aim of positively shaping the development of the digital world for the public good. https://www.oii.ox.ac.uk/ [Wednesday, September 04, 2019; 7:25 AM]
