perceived fairness and willingness to pay for sustainable
TRANSCRIPT

Perceived Fairness and
Willingness To Pay for Sustainable
Products in Pay What You Want
Pricing
Tessa Simone de Leede | 10016341 | Words: 11,666
Supervisor: dr. A. el Haji
Second reader: dr. J.J. Ebbers
June 21th, 2016
Final version
MSc. in Business Administration | Entrepreneurship and Management in the Creative Industries | ABS, UvA
This document is written by Student Tessa de Leede who declares to take full responsibility for the contents of
this document. I declare that the text and the work presented in this document is original and that no sources
other than those mentioned in the text and its references have been used in creating it. The Faculty of Economics
and Business is responsible solely for the supervision of completion of the work, not for the contents.

2
Abstract
Ethical consumerism is a rising movement. Among consumers there is a growing trend of
interest in ethical aspects associated with product consumption. As a result, today an
increased demand to legitimate its practices to society is experienced in every industry.
However, an intension-behavior gap still exists. Even though consumers want to buy in an
ethical manner, they often do not practice what they preach. They are expected to pay
premium prices while they experience a lack of information about these products. In previous
literature Pay-What-You-Want (PWYW) was presented as a mechanism to overcome this
problem. Some research argues that consumers perceive PWYW as more fair compared to
fixed prices. It was found that although consumers have the option to pay nothing, most of
them pay above zero. In this study, a field experiment was conducted at a Dutch sustainability
platform. The manipulation was designed according to a 2x2 design. It was found that a
perceived fairness of PWYW positively affected WTP. Contrary to what was expected, there
was no effect of underscoring the fairness of PWYW on the perceived fairness of PWYW. An
exception was the youngest group of participants, they were negatively influenced. Also,
participants in the charity treatment actually had a lower WTP, compared to other treatments.
This could partly be explained by the credibility of the product, brand, and pricing
mechanism. As expected, brand credibility had a positive effect on WTP. Some additional
effects were found and discussed.

3
Table of Contents
1. Introduction 4
2. Literature Review 6
2.1 Ethical consumerism 6
2.1.1 Corporate Social Responsibility
2.1.2 Ethical consumption intention-behavior gap
2.2 Pay what you want
2.2.1 Willingness to pay in PWYW
2.2.2 Perceived fairness of PWYW
2.2.3 Cause-related marketing
2.2.4 Brand credibility
6
7
8
9
10
11
13
3. Methodology 15
3.1 Data collection 14
3.2 Research design 16
3.3 Sample 17
4. Results 19
4.1 Descriptive statistics
4.2. Hypothesis testing
4.2.1 Hypothesis 1 – Perceived fairness
4.2.2 Hypothesis 2 – Underscoring fairness
4.2.3 Hypothesis 3 – Donation to charity
4.2.4 Hypothesis 4 – Brand credibility
4.3 Other effects
4.3.1 Controlling effects of perceived fairness of PWYW
4.3.2 Regression analysis for perceived fairness of PWYW
4.3.3 Interest and sustainability
4.3.4 Perceived fairness of price
4.3.5 Alternative explanations effect charity on WTP
4.3.5 Gender
4.3.6 Age
4.3.7 Regression analysis for WTP
19
21
21
23
24
25
26
26
28
30
31
32
33
34
35
5. Discussion 37
5.1 WTP in PWYW
5.2 Perceived fairness
5.3 WTP for charity in PWYW
5.4 Credibility in PWYW
5.5 Limitations and implications
37
38
39
40
41
References 45
Appendices 49
Appendix 1: newsletter Goodclub
Appendix 2: survey flow
Appendix 3: treatments
49
52
59

4
1. Introduction
Interest in ethical products is becoming more prevalent. Nowadays, some consumers are not
only seeking for quality and esthetics while purchasing a product. They explicitly look for
products with social or environmental elements (Pelsmacker, Driesen & Rayp, 2006).
Retailers are aware that customers increasingly evaluate them according to their socially
responsible behavior and acknowledge their intermediary role in the marketing channel
(Schramm, Morschett & Swoboda, 2015). At the same time, there is evidence that suggests
that consumers are not willing to pay a premium price for these social or environmental
elements (Pelsmacker et al., 2006). This seems paradoxical since for example the high prices
for Fair Trade products are directly related to guaranteeing producers a fair wage (Araque-
Padilla, Montero-Simó, & Aragón-Gutiérrez, 2015). According to Nicolls (2002) this
unwillingness might partly be due to skepticism about the organization’s motives. To inform
consumers, organizations should therefore communicate about their ethical elements in such a
way that it is perceived as credible.
Moreover, Mendoza-Abarca & Mellema (2015) argue that organizations with a social
aim need to implement mechanisms that simultaneously can create social value and an
appropriate amount of economic value. They expect Pay What-You-Want (PWYW) to be a
promising mechanism. With PWYW, consumers themselves decide what price to pay for a
product (Kim, Natter & Spann, 2009). Because the consumer has full control over the price,
PWYW could be perceived as more fair than fixed prices (Kim et al., 2009; Mendoza-Abarca
& Mellema, 2015). However, the effect of the perceived fairness of PWYW on willingness to
pay (WTP) has not been measured yet.
This study measures to what extent the perceived (relative) fairness of PWYW could
be manipulated. Moreover, it examines the effect of these manipulations on WTP. Lastly, the

5
study measures the influence of brand credibility on WTP. First, participants are explicitly
told why the organization thinks the pricing mechanism is fair. They might therefore feel
socially pressured to pay a fair amount of money (Gneezy, Gneezy, Riener & Nelson, 2012).
Second, participants are promised that a donation to charity is given. Consumers seem to be
willing to pay more for products when the seller promises to donate to charity (Gneezy et al.,
2012). However, it is not clear if this is still the case when the offered product itself has an
ethical element. Implementing PWYW for ethical products or social organizations has
received little attention in the literature. Gneezy et al. (2012) examined the effect of charity on
WTP at PWYW. In this study a combination is examined, i.e. the effect of perceived fairness
of the pricing mechanism and donating to charity for ethical products in PWYW. This leads to
the following research question: What is the effect of donating to charity and underscoring the
fairness of Pay-What-You-Want Pricing on the willingness to pay for ethical products under
Pay-What-You-Want Pricing?
By examining its potential in The Netherlands, the organization of this study – and
potentially others as well - might get motivated to implement PWYW. It is examined to what
extent consumers pay a higher price when a donation to charity is done and fairness is
underscored. Moreover, this experiment shows whether the credibility of the seller influences
the WTP. Therefore, this study provides implications in the PWYW field as well as in the
field of business ethics. Results might give organizations that consider to invest in business
ethics more insight about how to implement it.
This study is structured as follows. In the next section, previous research in ethical
consumerism and PWYW is outlined. Based on this literature, three hypotheses are
formulated. These hypotheses present potential conditions influencing the WTP in PWYW.
Then, the method and data collection of the online field experiment are described. The results
are outlined and discussed. Finally, a conclusion is presented.

6
2. Literature review
2.1 Ethical consumerism
Ethical consumerism is defined as “the conscious and deliberate choice to make certain
consumption choices due to personal and moral beliefs” . More business oriented it means
that individual consumers can promote ethical corporate practices through their daily purchase
decisions (Auger & Devinney, 2007, p.362). With ethical consumerism both environmental,
business practices, and social justice are incorporated (Chatzidakis, Kastanakis &
Stathopoulou, 2016). Among consumers there is a growing trend of interest in ethical aspects
associated with product acquisition and consumption (Araque-Padilla et al., 2015). These
'ethical consumers', are concerned for both the product itself and for the possible effects of its
consumption. They feel responsible toward society and express these feelings with their
purchasing behavior, i.e. by buying products for their positive qualities or boycotting products
for their negative qualities (Pelsmacker et al., 2006). Shopping in alignment with their ethical
consumption values provides these consumers a sense of connection with who they are and
where they come from (Carrington, Neville and Whitwell, 2014).
Products with ethical attributes refer to those with explicit social elements (e.g.
protecting human rights, questioning world trade rules, or the promotion of social enterprises)
or environmental elements (e.g. reducing humans’ ecological impact, combating
environmental pollution, objecting genetically modified food, fostering animal welfare or
biodiversity). Two typical examples are Fair Trade and organic products (Araque-Padilla et
al., 2015).
2.1.1 Corporate Social Responsibility
Sustainability had been defined as "meeting the needs of the present without compromising
the ability of future generations to meet their needs" (WCED, 1987, p.43). Today there is
virtually no industry that has not experienced increasing demands to legitimate its practices to

7
society at large. Companies have responded to this agenda by advocating Corporate Social
Responsibility (CSR) (Crane et al., 2013), in which context-specific organizational actions
and policies take into account stakeholders’ expectations and the triple bottom line
performance (i.e. economic, social, and environmental) (Aguinis & Glaves, 2012).
Also retailers are aware that their customers are increasingly evaluating them
according to their socially responsible behavior (Schramm-Klein et al., 2015). They are not
only held responsible for their own CSR activities. They also have to guarantee the
responsible behavior of all parties in the supply chain towards their consumers. Therefore, the
retailer acts as an intermediary in the marketing channel (Schramm-Klein et al., 2015). Biong,
Nygaard and Silkoset (2010) describe retailing as a ballot box for ethical decisions, in which
consumers ‘vote’ with their shopping carts. Moreover, customers may rely on the retailers
reputation to confirm that a product is ethical, since they do not have the resources to examine
this themselves. Hence, the credibility of the retailer is important in the marketing of ethical
products (Pearson & Henryks, 2008).
2.1.2 Ethical consumption intention-behavior gap
Despite the ethical consumerism movement, ethically-minded consumers rarely purchase
ethically (Carrington et al., 2014). Consumers’ buying behavior is not consistent with their
positive attitude toward ethical products (Pelsmacker et al., 2006). Carrington et al. (2014)
call this the 'intention-behavior gap', a misalignment between ethical intentions and actual
behavior. They identified the following obstacles: (1) alternative personal values, (2) extant
habits, (3) inability to form plans, (4) unwillingness to sacrifice, (5) lack of available
information and an unwillingness to conduct effortful searches for information, and (6) the
distraction of the situational environment in effortful and spontaneous shopping modes.

8
According to the fourth reason, one of the major sacrifices consumers have to make is
financially. They are required to pay a premium price to contribute to what is supposed to be a
valuable social cause. It assumes that their purchase is more due to a desire to make socially
responsible choices than for price reasons (Araque-Padilla et al., 2015). Pelsmacker et al.
(2006) found in their experiment in Belgium that a mere 10% of participants is prepared to
pay a price premium for Fair Trade coffee. In addition, Schmeltz, Bishop, and Gruen (2014)
found in their experimental auction that 30% of participants bid significantly more for pro-
environmental wine (i.e. high premium price group), compared to regular wine. More
interestingly, 28% bid significantly less for the pro-environmental wine, compared to regular
wine. Those participants saw low social or emotional benefit in the pro-environmental
product. Araque-Padilla et al. (2015) found in their study that that the perceived value of a
product decreased as the price increased. In order of importance, the perceived ethics, quality,
and healthiness of the product attenuates this relationship.
This highlights the importance of informing consumers about ethical (as well as
quality and health) aspects of the product, in line with the fifth reason of the intention-
behavior gap. Araque-Padilla et al. (2015) argue that due to lack of information, skepticism
and a lack of perceived utility of ethical products exists. Nicolls (2002) state that
communication of the human element of sustainability should allow the individual consumer
to give them the feeling that they make a difference. Consumers then make the commitment
of regular purchase behavior and develop brand loyalty.
2.2 Pay what you want
Pay-What-You-Want (PWYW) simply means that the buyer decides on the price of an offered
product. Regardless of the amount paid (even zero), the seller accepts the buyer's price and
the transaction automatically proceeds (Kim et al., 2009). Long-existing examples where
PWYW has been used are street music (Jang & Chu, 2012), museums and charity. Nowadays,

9
the pricing mechanism is being used in several other industries (i.e. new music albums online,
lunches, theatre, and amusement parks) (Schmidt, Spann & Zeithammer, 2014).
Schmidt et al. (2014) name three main reasons why PWYW could be an attractive
pricing strategy. First, PWYW is a means of endogenous price discrimination (i.e. different
consumers pay different prices for the same products). Second, PWYW is suitable for
organizations seeking to maximize unit sales (e.g. to sell a complementary product, enter new
markets, realize experience curve gains, or achieve network effect). Lastly, PWYW can be
used as a competitive strategy (e.g. undercutting competition using posted prices by not
competing on price). Additionally, Kim et al. (2009) mention that because of its novelty
PWYW may be used as a marketing instrument for new businesses. It may increase the
chance of word of mouth and build a positive price image among consumers.
2.2.1 Willingness to pay in PWYW
Although consumers are allowed to pay nothing, recent studies on PWYW (in different
industries) repeatedly show that the price paid is significantly higher than zero (Kim,
Kaufmann & Stegemann, 2014). Gneezy et al. (2012) explain that people choose to pay
because they feel it is the right thing to do. The payment depends on social norms. In face-to-
face situations, paying in PWYW signals the morality of the person to others. Moreover, the
payment serves to maintain their positive self-image. According to the self-signaling model,
people feel uncertain about their true identity and use their actions to recall their beliefs. As a
result, people would rather avoid a situation in which they violate the norm by choosing not to
buy the product. If they do choose to purchase, they often choose to pay a fair price that does
not have a negative effect on their self-image (Gneezy e al., 2012). In addition, Kunter (2015)
found that in his empirical studies that guilt has a stronger effect on PWYW prices than
shame.

10
Kunter (2015) was the first to study the impact of simple textual cues on PWYW
payments. He found that participants who saw statements about satisfying the seller and
wanting to be fair towards the seller paid the highest amount of money on average. However,
most textual cues did not change PWYW payments. Contrary, Pruckner and Sausgruber
(2008) found that implementing the sign “Thank you for being honest” induces higher
payments. Yet, it did not decrease the number of zero-payments. Kunter (2015) acknowledged
that the effects of other cues might have overwhelmed the textual cue, because the field
experiments took place in a zoo. In online field experiments, participants should be less
overwhelmed with cues. Besides, the effect of text cues on the perceived fairness of PWYW
has not been researched yet.
2.2.2 Perceived fairness of PWYW
Price fairness refers to the perceived fairness judgment of a buyer about a seller’s prices. It is
part of a broader judgment of the overall merits from the transaction (Haws & Bearden,
2006). Consumers may prefer PWYW because of the level of control that is offered. When
playing a role in the price-setting, consumers have greater fairness perceptions (Kim et al.
2009). This assumption is based on the finding that prices set through bidding were perceived
as more fair than posted prices. However, bidding is quite different from PWYW, since you
do not have the guarantee that you will own the product after bidding. At PWYW the product
is yours for any price you offer. This indicates that PWYW would even be perceived as fair
when a consumer receives the product for a price below cost price.
For ethical products, PWYW could be perceived as more fair compared to fixed
prices, because of the high initial pricing of these products. Social organizations aim to realize
their social mission by selling products. This makes them financially dependent. Pricing too
low could therefore threaten the social organization’s ability to sustain its operations. Besides,
high prices are largely related to guaranteeing producers a fair price for ethical products.

11
Nevertheless, most consumers are unwilling to pay a premium price for them (Araque-Padilla
et al., 2015). A price that is perceived as too high may signal to customers that the
organization is merely using the social mission as a device to maximize its own profits.
Therefore, social organizations need to implement mechanisms that can create social value
and an appropriate amount of economic value simultaneously. PWYW gives consumers the
opportunity to decide for themselves how much they want to contribute to the social mission
(Mendoza-Abarca & Mellema, 2015).
In this study it is examined whether underscoring the fairness of PWYW affects the
perceived fairness of the pricing mechanism, and whether this perceived fairness has an effect
on the WTP.
H1: Consumers are willing to pay more for ethical products in PWYW when they perceive the
pricing mechanism as more fair.
H2: Consumers perceive PWYW as a more fair pricing mechanism when this fairness is
underscored, rather than when it is not underscored.
2.2.3 Cause-related marketing
Cause-related marketing implies that linking product sales to a charitable cause can serve as a
marketing tool (Koppel & Schulze, 2013). Previous studies found that consumers who
perceive products to be highly related to a social cause also extract more benefits from the
transaction (Mendoza-Abarca & Mellema, 2015). Likewise, charity auctions in which a
percentage of the price is donated to charity increase positive feelings from supporting the
mission for altruistic consumers. Additionally, it made them willing to place higher bids
(Elfenbein & McManus, 2010). According to Gneezy et al. (2012), this also seems to be the
case for PWYW. They found that people’s WTP is higher when half of their payment goes to

12
charity. At the same time, consumers are more likely to make small donations linked to the
purchase of a product rather than independently to a donation box (Koppel & Schulze, 2013).
By purchasing a product that is linked with a social cause, the customer implicitly donates
money to the cause. This is in line with ethical consumerism, where the more ethical products
you buy, the more ‘good’ you do for planet, people and profit (Low & Davenport, 2006).
It has not yet been examined if a donation to charity still provides a higher WTP if the
product has a social element as well. Purchasing an ethical product with an additional
donation to charity might increase the positive feelings from supporting the mission.
However, it could also be the case that consumer who buy an ethical product may already
perceive its purchase as a way of supporting the mission, e.g. a fair wage for everyone or
carbon free consumption. Moreover, an additional donation to charity may even signal to
customers that the seller is using the social mission as a device to maximize its own profits.
Besides, in the study of Gneezy et al. (2012) fewerparticipants chose to buy the
product when they promised a donation to charity. As Jang and Chu (2012) explain,
consumers are willing to increase the fairness of a transaction with some additional cost (i.e.
by paying an appropriate amount of money). However, they tend to give up when they
perceive this cost as too high, as already explained by the average unwillingness to pay a
premium price. Consumers would rather not receive the product than risk paying too little and
damage their positive self-image.
Therefore, the perceived fairness seems to be even more important when consumers
buy a PWYW product that is linked to a social cause. Some researchers examined the effect
of cause-related marketing in PWYW (e.g. Gneezy et al., 2012). No studies have been found
which focused on PWYW for ethical products. In this study the WTP for ethical products in

13
PWYW is measured. Moreover, it is examined to what extent a donation to charity affects this
WTP.
H3: Consumers are willing to pay more for ethical products in PWYW when a donation to
charity is made, rather than when it is not made.
2.2.4 Brand credibility
A broad definition of credibility is “the believability of an entity’s intentions at a particular
time”. It consists of trustworthiness and expertise. Brand credibility refers to “the believability
of the product position information contained in a brand”. Trustworthiness of a brand has a
positive effect on the likeability of preferring the brand. (Erdem & Swait, 2004, p. 192).
This perceived trustworthiness makes organizations scared to communicate about
CSR, due to a skeptical society. When consumers are skeptical about the credibility of the
information, a negative effect may occur. When consumers have reasons to doubt the
organization’s motives for CSR, they evaluate the organization more negatively than when it
does not engage in CSR (Castaldo, Perrini, Misani, & Tencati, 2009). When consumers hear
about CSR from the organization itself and perceive that the organization obtains high
benefits from it, this backfire effect is most likely (Yoon, Gürhan-Canli & Schwarz, 2006).
At the same time, prior research suggests that there is still lack of information of
ethical products. For organizations to differentiate themselves with social attributes,
consumers must be fully aware of them. If consumers are not aware of the social attributes of
a product, they might purchase a similar product without these aspects (McWilliams & Siegel,
2001). McWilliams and Siegel (2001) state that organizations not only should do good (i.e.
actually implementing CSR), but also talk about doing good. Therefore, they state that
advertising plays an important role for ethical consumers. The rise of the Internet gives

14
markets the chance to reduce the information asymmetry by using advertisement (Granados &
Gupta, 2013). Eventually, it is the perceived trust that accounts for the success (or the failure)
of a socially oriented company (Castaldo et al., 2009).
In Schmidt et al.’s (2014) experiment a significant fraction of PWYW participants
paid for the strategic reason to keep the seller in business. They assume that an effortful,
friendly seller may induce a buyer to pay more. Additionally, as mentioned above, ethical
consumers want to support retailers who act in an ethical manner. It could therefore be
expected that more participants want to keep the seller in business when they perceive them as
ethical. This is in line with Kunter’s (2015) expectation that the effect of pro-social cues on
WTP is moderated by the reputation of the seller. Therefore, in this study brand credibility is
taken into account. This leads to the following hypothesis.
H4: Consumers are willing to pay more for ethical products in PWYW when they perceive the
brand as credible, rather than not credible.
15
3. Method
3.1 Data collection
In this study a field experiment was conducted to measure the WTP for an ethical product
under PWYW. Contrary to laboratory experiments, in field experiments control is more
challenging. However, it gives a researcher the opportunity to observe its effect in practice,
and is therefore more realistic. Because of this realism, field experiments provide a lot of
practical implications (Saunders, Lewis & Lewis, 2012).
The platform adopted for this study was Goodclub. It is a Dutch platform for people
with a sustainable mindset. Goodclub sells products with social as well as environmental
elements. Although it would be relevant to find out the difference between them, in this study
different measures are done for one specific ethical product with environmental elements. It
was expected that due to the seller’s sustainable emphasis and participants’ interest in this
topic unethical behavior (i.e. paying an unfair price) was less likely. The ethical product was a
sustainable water bottle from the brand ‘MiZu’. The data were collected through a Qualtrics
survey, which was assigned for this experiment. It was conducted through the weekly
newsletter of Goodclub. The newsletter was send to approximately 45.000 participants on
March 4th
, 2016 07:00 p.m. The water bottles were sold out after twenty hours, and therefore
the survey was closed on March 5th
, 2016 01:00 p.m.
The experiment proceeded as follows. First, after reading a short introduction about
the experiment, members of the newsletter could participate in the experiment by clicking on
the invitation link (Appendix 1). Second, participants received an explanation about the
procedure of the experiment (Appendix 2) Third, participants were randomly allocated into
one of the four treatments. They were shown the product and some additional information
about the sustainable element of the product. Depending on which treatment they were in,
participants also saw an announcement about a donation to charity or a text box that

16
underscored the fairness of PWYW according to Goodclub. This is further explained in the
part below, as well as shown in Appendix 3. Fourth, participants were asked which color they
preferred, what price (zero was possible) they thought was appropriate with shipping costs
included, and if they would actually purchase the water bottle for that price. Fifth, seven or
eight statements were shown, depending on the treatment. The statements contained the
perceived interest in the product, sustainability of the product, fairness of the price, fairness of
PWYW, relative fairness of PWYW compared to fixed prices, trustworthiness of Goodclub,
and (if assigned to charity treatment) additional value of charity. Participants were asked to
indicate to what extent they agreed with the statements. A five-point Likert Scale was used
(i.e. strongly agree – strongly disagree). Sixth, those participants that wanted to purchase the
product were asked to enter their personal information. They were also asked if they could
name their motivation to buy the product. The survey ended for them with a thank you note
and a confirmation that the product would be sent within ten working days. Thereafter, they
were automatically sent to the webpage of Goodclub, i.e. www.goodclub.nl. Participants who
did not want to purchase the product were only asked about their gender and age. The survey
ended for them with a thank you note, after which they were automatically sent to the
webpage of Goodclub. Thus, the survey slightly differed between participants that did (not)
purchase the product. See Appendix 2 for the whole survey.
3.2 Research design
The field experiment had a 2 x 2 design containing four different treatments. The participants
were randomly divided among the four treatments (Table 1, Appendix 3).

17
Underscoring fairness
No Yes
Charity
No T1 T2
Yes T3 T4
Table 1: Experimental Design
In the charity condition the price paid by the subject went to charity, i.e.
‘Milieudefensie’. Since 1971 Milieudefensie has been working toward a more sustainable and
fair country. The association now contains 84,000 members and donors. This price was paid
in ‘Goodcoins’, an imaginary currency that can be converted into real money. Members
receive a Goodcoin as a reward for ‘doing good’, in this case buying a product from one of
Goodclub’s partners. Every Goodcoin equals one euro in the Goodclub shop. They can be
saved, traded for new ‘good’ products, or donated to charity. Participants were familiar with
Goodcoin, as Goodclub has been using this currency for years. For the underscored fairness,
the content that was communicated was written by the researcher and approved by an
employee the Goodclub.
3.3 Sample
The sample size (N) was 559. Some participants were filtered out. First, 213 participants had
missing data on the first statement. Since the statements were mandatory to fill out, missing
values meant incomplete surveys. There was no significant difference between the different
treatments for the incomplete surveys (p= .309), i.e. treatment 1: 23.4%, treatment 2: 30.1%,
treatment 3: 24.6%, and treatment 4: 23.1%. Second, from the participants who wanted to
purchase the product, some did not fill out their personal information (N= 68).

18
Gender and age
The answers about gender from participants that purchased and did not purchase the product
were merged together into one dummy variable. The sample consisted of 61.4% females.
Participants were asked in which year they were born. The answers on this question from
participants that purchased and did not purchase the product were also merged together. Since
the experiment took place in the first week of March 2016, age was determined by subtracting
the year of birth from 2015. Therefore, only participants born in January or February are
shown as one year younger than in reality. The unlikely ages of 108, 114 and 115 and all
unanswered values were categorized as missing variables (N= 5). Without these missing
values, the mean age was 48 years with 13 years as youngest and 85 years as oldest
participant (SD= 13.33). When ages are categorized (i.e. <20, 20-40, 40-65, 65-80, 80+), the
category 40-65 consisted 61.9% of the sample (N= 346). As the youngest (N= 11) and the
oldest (N= 7) categories consisted of too few people, ages are redistributed with an interval of
24 years, i.e. <37 (N= 132), 37- 61 (N= 331), 61+ (N=96).

19
4. Results
4.1 Descriptive statistics
Willingness to Pay
In Table 2 the descriptive statistics are outlined. The average price participants indicated to be
appropriate (WTP) for the water bottle was 11.35 euro, with a minimum of zero euros and a
maximum of 35 euro (SD= 5.06). Only 1.6% of participants were willing to pay zero euro.
When the price of zero euro was omitted, the average price was 11.53 euro (SD= 4.89) with a
minimum of 1.00 euro. The average WTP in the four treatments ended between 10.81 and
11.67 euros.
Purchase
Only 37.9% of the participants wanted to purchase the product for the chosen price.
Participants who purchased the water bottle, had a significant lower WTP than participants
who did not purchase the water bottle. This effect size was moderate and significant (F
(1,557) = 55.651, p < .000, η² = .09). The costs of the product for Goodclub were 14.52 euros
(i.e. 8.57 euros for production and 5.95 euros for sending). Therefore, on average one product
had a loss of 5.12 euros. As 81.6% of participants offered less than the costs of the product,
this experiment resulted in a loss. Moreover, the product is usually sold for 26.98 euros,
including sending. No purchasing participant offered this amount of money or more. For
purchasing participants, the average WTP in the four treatment was between 8.63 and 10.41
euros.

20
Participants N % WTP (€) SD Minimum (€) Maximum (€)
All 559 100 11.35 5.06 0.00 35.00
No zero euro 550 98.4 11.53 4.89 1.00 35.00
Purchasing 212 37.9 9.40 5.05 0.00 25.00
Not purchasing 347 62.1 12.54 4.69 0.00 25.00
Base treatment 142 25.4 11.83 5.18 1.00 35.00
Charity treatment 133 23.8 11.05 4.99 0.00 25.00
Fairness treatment 143 25.6 11.67 5.00 0.00 29.00
Charity and fairness treatment 141 25.2 10.81 5.07 0.00 25.00
Table 2: descriptive statistics of WTP
Statements
Table 3 and Table 4 outline the results of the extent to which participants agreed with the
seven statements (1: Strongly agree – 5: Strongly disagree).
Statement Mean SD Purchasing participants SD
Trustworthiness Goodclub 2.03 .71 1.94 .71
Fairness price 2.17 .79 2.33 .90
Sustainability water bottle 2.06 .78 1.89 .70
Fairness pricing mechanism 2.76 .86 2.68 .87
Relative fairness pricing mechanism 2.93 .91 2.88 1.00
Familiarity with pricing mechanism 3.29 1.14 3.40 1.34
Interest product 2.72 1.16 1.79 .62
Table 3: descriptive statistics of statements
Statement T1 SD T2 SD T3 SD T4 SD
Trustworthiness Goodclub 2.00 .74 2.05 .66 2.06 .75 2.02 .68
Fairness price 2.12 .73 2.21 .69 2.22 .84 2.15 .89
Sustainability water bottle 2.10 .85 2.13 .71 2.01 .73 1.99 .80
Fairness pricing mechanism 2.68 .87 2.74 .85 2.78 .88 2.84 .84
Relative fairness pricing mechanism 2.85 .95 2.93 .90 2.96 .86 2.99 .93
Familiarity with pricing mechanism 3.30 1.32 3.41 1.24 3.27 1.40 3.17 1.93
Interest product 2.84 1.25 2.73 1.10 2.69 1.16 2.62 1.11
Table 4: descriptive statistics of statements per treatment

21
4.2 Hypotheses testing
4.2.1 Hypothesis 1 – Perceived fairness
H1: Consumers are willing to pay more for ethical products in PWYW when they perceive the
pricing mechanism as more fair.
Perceived fairness PWYW
Participants were asked whether they thought the pricing system was fair (fairness PWYW)
and more fair than fixed prices (relative fairness PWYW). The two statements have a strong,
positive correlation (r=.63, N=559, p<.001). The alpha coefficient is .772 and corrected item –
total correlation is .629. This suggests that the statements have an acceptable internal
consistency. Scale variance increases for both variables if an item is deleted. The items are not
taken together as a factor for the fairness of the system. Yet, the statements both seem to
measure the perceived fairness of the system.
Nearly half (42.2%) of the participants neither agreed nor disagreed with fairness
PWYW (M= 2.76; SD= .859). Likely, 45.4% of participants neither agreed nor disagreed with
relative fairness PWYW (M= 2.93; SD=.907). When the third value (i.e. Neither agree nor
disagree) was named as missing value, the sample size became 323. Of those participants
67.8% thought the pricing system was fair, 53.8% thought the pricing system was more fair
than fixed prices.
Effect of perceived fairness PWYW on WTP
There was a weak significant effect of fairness PWYW on WTP (F(4,554) = 4.885, p= .001,
η² = .03). Tukey post-hoc test revealed that this effect was only significant between the two
highest and lowest prices (.004 < p < .025). For relative fairness PWYW this effect is weak
and significant as well (F(4, 554) 5.203, p< .001, η² = .04), and was only significant between
the lowest price and the three highest (.001 < p < .033). Participants that neither agreed nor

22
disagreed with relative fairness PWYW paid the highest amount (M=12.09; SD= 5.00) and
participants that strongly disagreed the lowest (M= 7.44; SD= 7.75), see Figure 1.
Figure 1: perceived (relative) fairness PWYW and WTP
When only purchasing participants were taken into account, the size effect became
moderate for both fairness PWYW (F(4, 207) 5.353, p< .001, η² = .09) and relative fairness
PWYW (F(4, 207) 3.507, p= .009, η² = .06), see Figure 2. For both statements, the effect is
only significant between participants that strongly disagreed, compared to the other levels
(.002 < p < .030). Only for perceived fairness of PWYW, the difference between participants
that disagreed and strongly disagreed was not significant for WTP either (p= .081). Thus, H1
is adopted.
Figure 2: perceived (relative) fairness PWYW and WTP for purchasing participants
€ 6.00
€ 7.00
€ 8.00
€ 9.00
€ 10.00
€ 11.00
€ 12.00
Fairness PWYW Relative fairness PWYW
Strongly agree
Agree
Neither agree nor disagree
Disagree
Strongly disagree
€ 0
€ 2
€ 4
€ 6
€ 8
€ 10
€ 12
Fairness PWYW Relative fairness PWYW
Strongly agree
Agree
Neither agree nor disagree
Disagree
Strongly disagree

23
4.2.2 Hypothesis 2 – Underscoring fairness
H2: Consumers perceive PWYW as a more fair pricing mechanism when this fairness is
underscored, rather than when it is not underscored.
Underscoring fairness
An additional text box which explained the fairness of PWYW (underscoring fairness) was
implemented in two treatments, i.e. only underscoring fair (N= 143) and charity plus
underscoring fairness (N= 141), see appendix 3. There is no effect of underscoring fairness on
fairness PWYW (F(1, 557) 1.791, p=.181, η² = .00) nor relative fairness PWYW (F(1, 557)
1.213, p=.271, η² < .01). This effect is also no significant effect if only purchasing
participants are taken into account (p= .115). Moreover, there is neither a direct effect of
underscoring fairness on trustworthiness Goodclub (p= .181), nor fairness price (p= .771).
Thus, H2 is rejected.
Interaction effects underscoring fairness on fairness PWYW
The interaction effect of gender on the effect of underscoring fairness on fairness PWYW was
not significant (p= .343). The interaction effect of age on the effect of underscoring fairness
on fairness PWYW was significant (b= -.013, t(550) -2.132, p=.034), but only for the
youngest third of participants (b= .107, t(550) = 2.55, p= .011). One way ANOVA showed
that participants younger than 42 years who were not in the underscoring fairness treatments
significantly stronger agreed with fairness PWYW (M= 2.70; SD= .890) than who were in the
underscoring fairness treatments (M= 3.03; SD= .835), see Figure 3.
Figure 3: amount of participants < 42 years with extend of agreement on fairness PWYW
10
20
30
40
(Strongly) agree Neither agree nor disagree (Strongly) disagree
No fairness claim
Fairness claim

24
There were no interaction effects of interest (p= .465) nor sustainability (p= .078).
Neither were there interaction effects of trustworthiness Goodclub (p= .778), fairness price
(p= .771), nor interest (p= .184) for the effect of underscoring fairness on fairness PWYW.
For relative fairness PWYW, no interaction effects were found for the above mentioned
variables, i.e. gender (p= .111), age (p= .289), interest (p= .137), sustainability (p= .248),
trustworthiness Goodclub (p= .778), and fairness price (p= .771).
There was no direct effect of underscoring fairness of PWYW on WTP (p= .617)
neither for participants younger than 42 years (p= .487). There was also no interaction effect
of the perceived (relative) fairness of PWYW on the effect of underscoring the fairness of
PWYW on WTP (p= .069), neither for participants younger than 42 years (p= .111)
4.2.3 Hypothesis 3 – Donation to charity
H3: Consumers are willing to pay more for ethical products in PWYW when a donation to
charity is made, rather than when it is not made.
Donation to charity
A donation to charity was implemented in two treatments, i.e. only charity (N= 133) and
charity plus underscoring fairness (N= 141). Participants in the charity treatments paid less
(M= 10.93; SD= 5.02) than participants in the treatments without charity (M= 11.75;
SD=5.08). However, the effect of charity on the willingness to pay was only significant on a
90% confidence interval (F(1, 557) 3.713, p= .055, η² = .01). When purchasing participants
alone are taken into account, there is a small effect for WTP (F(1,210) 4.738, p= .031, η² =
.02). Purchasing participants in the charity treatment paid a significant lower price (M= 8.66;
SD= 5.04), compared to the other treatments (M= 10.16; SD = 4.96), see Figure 4. Therefore,
H3 is rejected. More importantly, the results show that there is evidence of an opposite effect.
Consumers seem to pay a lower price for ethical products in PWYW when a promise to

25
donate to charity is added, rather than when it is not added. The results of H4 might explain
this paradoxical effect.
Figure 4: WTP for treatments with (no) charity
There was no interaction effect on the effect of charity on WTP for age (p= .527), nor
gender (p= .615), neither when only looking at purchasing participants (age: p= .570; gender:
p= .246).
4.2.4 Hypothesis 4 – Brand credibility
H4: Consumers are willing to pay more for ethical products in PWYW when they perceive the
brand as credible, rather than not credible.
Brand credibility
Participants were asked whether they thought Goodclub is trustworthy. There is a weak
significant effect of the perceived trustworthiness of Goodclub on WTP (F(4, 554) 5.605, p<
.001, η² = .04). Participants that strongly agreed paid a higher price (M= 12.58; SD= 5.67),
than participants that neither agreed nor disagreed (M=9.71; SD=5.06) and strongly disagreed
(M= 10.50; SD= 2.12). Purchase had a significant interaction effect on the effect of
trustworthiness Goodclub on WTP (b= -.127, t(555) -2.018, p= .044), see Figure 5. Thus, the
effect of trustworthiness Goodclub on WTP was stronger for purchasing participants
(F(2,209) 13.164, p < .001, η² = .11) than for participants that did not purchase the product
10.93
8.66
11.75
10.16
€ 8.00
€ 9.00
€ 10.00
€ 11.00
€ 12.00
Participants Purchasing participants
WTP Charity
WTP No charity

26
(F(4, 342) 2.345, p= .054, η² = .03). For participants that did not purchase the product, this
effect was only significant on a 90% confidence interval. Thus, H4 is adopted.
Figure 5: difference in WTP between relative difference in trustworthiness Goodclub.
Purchasing participants that strongly agreed paid a higher amount (M= 11.30; SD=
5.65) than participants that neither agreed nor disagreed (M= 6.54; SD= 4.93). There were no
purchasing participants that (strongly) disagreed with trustworthiness Goodclub. Therefore,
Figure 5 only displays the relative high and low trust in Goodclub.
4.3 Other effects
Some additional effects were found and are discussed in the following section.
4.3.1 Controlling effects of perceived fairness of PWYW
Familiarity PWYW
Participants were asked whether they agreed that they were already familiar with the pricing
system (familiarity PWYW). Of all participants, 36.5% (strongly) agreed they were already
familiar with PWYW. There was a very weak statistically significant effect of familiarity
PWYW on variable fairness PWYW (F(4,554) 3.532, p= .007, η² = .03). Tukey post-hoc tests
revealed that the amount to which the participants agreed with fairness PWYW to be
significantly stronger in the group that strongly agreed with familiarity PWYW (M=2.40;
N=52; SD=1.07), compared to those who disagreed (M= 2.83; N= 151; SD= .80; p= .015)
and strongly disagreed (M= 2.88; N= 133; SD= .90; p= .006).
13.36
12.59
11.83
10.85
9.19
7.53 € 7.00
€ 8.00
€ 9.00
€ 10.00
€ 11.00
€ 12.00
€ 13.00
€ 14.00
High trust Average trust Low trust
No purchase
Purchase
27
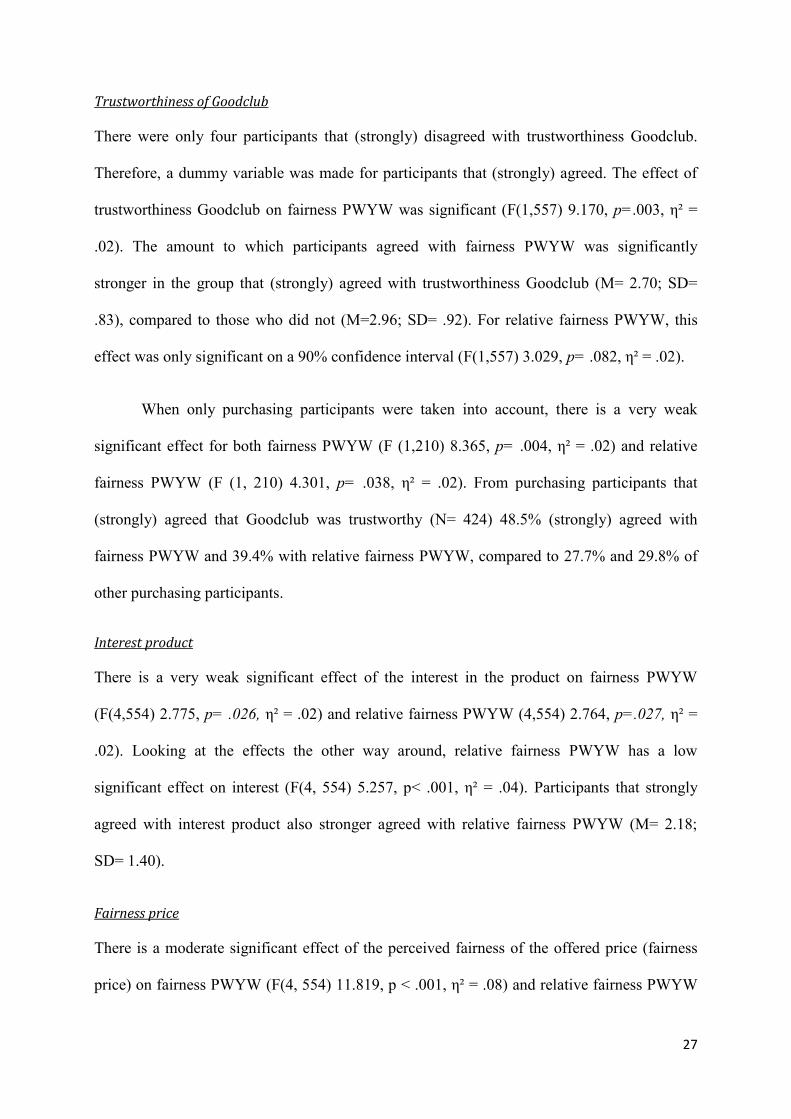
Trustworthiness of Goodclub
There were only four participants that (strongly) disagreed with trustworthiness Goodclub.
Therefore, a dummy variable was made for participants that (strongly) agreed. The effect of
trustworthiness Goodclub on fairness PWYW was significant (F(1,557) 9.170, p=.003, η² =
.02). The amount to which participants agreed with fairness PWYW was significantly
stronger in the group that (strongly) agreed with trustworthiness Goodclub (M= 2.70; SD=
.83), compared to those who did not (M=2.96; SD= .92). For relative fairness PWYW, this
effect was only significant on a 90% confidence interval (F(1,557) 3.029, p= .082, η² = .02).
When only purchasing participants were taken into account, there is a very weak
significant effect for both fairness PWYW (F (1,210) 8.365, p= .004, η² = .02) and relative
fairness PWYW (F (1, 210) 4.301, p= .038, η² = .02). From purchasing participants that
(strongly) agreed that Goodclub was trustworthy (N= 424) 48.5% (strongly) agreed with
fairness PWYW and 39.4% with relative fairness PWYW, compared to 27.7% and 29.8% of
other purchasing participants.
Interest product
There is a very weak significant effect of the interest in the product on fairness PWYW
(F(4,554) 2.775, p= .026, η² = .02) and relative fairness PWYW (4,554) 2.764, p=.027, η² =
.02). Looking at the effects the other way around, relative fairness PWYW has a low
significant effect on interest (F(4, 554) 5.257, p< .001, η² = .04). Participants that strongly
agreed with interest product also stronger agreed with relative fairness PWYW (M= 2.18;
SD= 1.40).
Fairness price
There is a moderate significant effect of the perceived fairness of the offered price (fairness
price) on fairness PWYW (F(4, 554) 11.819, p < .001, η² = .08) and relative fairness PWYW

28
(F (4,554) 12.121, p < .001, η² = .08). Participants that (strongly) agreed also stronger agreed
with fairness PWYW and relative fairness PWYW, and the other way around.
When only purchasing participants are taken into account, there is a high effect size
for both fairness PWYW (F (4, 207) 8.718, p < .001, η² = .14) and relative fairness PWYW (F
(4, 207) 12.452, p < .001, η² = .19). From purchasing participants that strongly agreed with
fairness price 65.4% (strongly) agreed with fairness PWYW and 53.8% with relative fairness
PWYW, compared to 14.3% and 0.0% of purchasing participants that strongly disagreed.
Sustainability product
There is a very weak significant effect of the perceived sustainability of the product
(sustainability product) on fairness PWYW (F(4, 554) 4.330, p= .002, η² = .03) and relative
fairness PWYW (F (4,554) 4.161, p= .002, η² = .03). From participants who strongly agreed
with the sustainability of the product 44.0% (strongly) agreed with fairness PWYW and
29.6% with relative fairness PWYW, compared to 20.0% and 0.0% of participants who
strongly disagreed.
4.3.2 Regression analysis for perceived fairness PWYW
The predictors in Model 1 explained for 12.3% the total variance in the perceived fairness of
PWYW (p < .001). Only the statement about the trustworthiness of Goodclub did not have
significant Beta value (p=.639). After entering gender and age, Model 2 was significant as
well (p < .001) and explained 13.6% of total variance. However, gender did not have a
significant Beta value (p=.146). Therefore, both trustworthiness Goodclub and gender were
omitted from the model. The final model explained 13.1% of the total variance in fairness
PWYW. All five predictor variables (i.e. familiarity PWYW, trustworthiness Goodclub,
fairness price, interest product, and sustainability product) were statistically significant (<.001

29
< p < .031), see table 5. The more participants agreed with the statements, the more they
agreed with the fairness of PWYW.
Model 1 Model 2 Model 3
Familiarity PWYW .076 (.026)*** .081 (.026)*** .086 (.026)***
Trustworthiness Goodclub .024 (.052) .063 (.053) .
Fairness price .294 (.045)*** .267 (.045)*** .280 (.044)***
Interest product .086 (.031)*** .094 (.032)*** .099 (.031)***
Sustainability product .114 (.048)** .118 (.048)** .131 (.047)***
Gender . .104 (.071) .
Age . -.006 (.003)** .006 (.003)**
R2 .123*** .136*** .131***
dF 5 7 5
F 15.503 12.286 16.554
*p < 0.1, **p < 0.05, ***p < 0.01
Table 5: hierarchical multiple regression for fairness PWYW
Likewise, the same predictors were entered in a hierarchical multiple regression for
relative fairness PWYW. Model 1 explained for 10.0% of the total variance and was
statistically significant (p < .001). Both trustworthiness Goodclub (p= .331) and familiarity
PWYW (p= .614) did not have significant Beta value. After entering gender and age, the
model was still significant (p < .001) and explained 12.7% of total variance. Both
trustworthiness Goodclub (p=.769) and awareness (p=.340) still did not have significant Beta
value and were omitted from the model. The final model explained 12.6% of the total
variance for the extent to which participants agreed that PWYW is more fair than fixed prices.
Three out of four predictor variables (i.e. fairness price, interest product, age, and gender)
were statistically significant. Only sustainability product was not significant (p=.105). The
more participants agreed with the statements, the more they agreed with the fairness of
PWYW. Moreover, of all males 34.7% (strongly) agreed with the relative fairness of PWYW,
compared to 25.9% of females. Older participants stronger agreed as well. Tukey post-hoc

30
tests revealed the youngest group of participants significantly less strong agreed (M= 3.16;
SD= .93), compared to the middle group (M= 2.89; SD= .818; p= .010), and the oldest group
(M= 2.78; SD= 1.10; p= .005). See table 6.
Model 1 Model 2 Model 3
Familiarity PWYW .014 (.028) .026 (.028) .
Trustworthiness Goodclub -.054 (.056) -.017 (.057) .
Fairness price .328 (.048)*** .294 (.048)*** .295 (.047)***
Interest product .099 (.033)*** .121 (.034)*** .118 (.033)***
Sustainability product .087 (.052)*** .087 (.051)*** .080 (.049)
Gender . -.140 (.076)*** -.148 (.074)**
Age . .010 (.003)*** .009 (.003)***
R2 .100 .127 .126
dF 5 7 5
F 12.283 11.371 15.758
*p < 0.1, **p < 0.05, ***p < 0.01
Table 6: hierarchical multiple regression for relative fairness PWYW
4.3.3 Interest and sustainability
Of all participants 76.2% (strongly) agreed with that the product was sustainable. There was a
moderate significant effect of sustainability on interest product (F(4, 554) 12.969, p < .001, η²
= .09). The more participants agreed with sustainability the more they agreed to be interested
in the product (strongly agree: M= 2.29; SD= 1.31, strongly disagree: M= 4.40; SD= .89). Not
surprisingly, there was a weak significant effect of interest in the product on WTP (F(4, 554)
4.354, p= .002, η² = .03). Of purchasing participants 91.5% (strongly) agreed with interest in
the product, compared to 23.4% of participants who did not purchase. Moreover, there was a
significant weak effect of perceived sustainability on purchase (F(4, 554) 4.254, p= .002, η² =
.03). Of purchasing participants, 84.4% (strongly) agreed with sustainability. The effect of the
perceived sustainability of the product on WTP was weak and significant as well (F(4,554)
4.092, p= .003, η² = .03). Participants paid a higher price when they strongly agreed with

31
12.73 13.42 12.01
9.86 9.95
8.51
7.08
5
1.38
0 € 0
€ 2
€ 4
€ 6
€ 8
€ 10
€ 12
€ 14
Participants Purchasing participants
Strongly Agree
Agree
Neither agree nor disagree
Disagree
Strongly disagree
sustainability (M=12.34; SD=5.74), compared to those who strongly disagreed (M=6.60;
SD=3.65). This effect was of moderate size for purchasing participant (F(4, 207) 3.593, p=
.007, η² = .07).
4.3.4 Perceived fairness of price
Participants were asked whether they thought they had offered a fair price for the product
(fairness price). WTP and the perceived fairness of the price were moderately correlated (r= -
.322; N= 559; p< .001). The higher the WTP was for the product, the stronger they agreed to
have offered a fair price. Moreover, there was a weak significant effect of the perceived price
fairness on purchase (F(4,554) 4.471, p= .001, η² = .03). The more participants agreed to have
paid a fair price, the less they actually bought the product.
Additionally, for purchasing participants, this correlation was stronger yet still
moderate (r= -.460; N= 212; p< .001). Purchasing participants that strongly agreed with
fairness price also had a higher WTP (M=13.42; SD= 6.04), compared to participants that
strongly disagreed (M= 1.57; SD= 1.62). Nevertheless, 17.9% of participants that (strongly)
agreed to have paid a fair price purchased the product for five euros or less. This price is far
below cost price. For ten euros or less this is even 57.9%. This is illustrated in Figure 6.
Figure 6: Perceived fairness of the offered price

32
4.3.5 Alternative explanations charity effect on WTP
It is remarkable that participants want to pay less in the charity conditions. When asked
whether the charity component added value for them 78.2% of participants agreed or even
strongly agreed (M= 2.05, SD=.928). Participants that strongly agreed had a higher WTP (M=
12.17; SD=5.03), compared to those that strongly disagreed (M= 8.40; SD=7.09). However,
the effect of the perceived value of charity on WTP was not significant (F(4,128)= 1.194, p=
.317). This might be due to the fact that there were not enough participants for the neutral (N=
21) or (strongly) disagree value (N= 8). For purchasing participants this effect was of
moderate size, yet only significant on a 90% confidence interval (F(1,51) 2.989, p= .090, η² =
.06). It was not possible to measure interaction effects for this variable due to the relatively
large number of participants (strongly) agreed with the statement.
There was no interaction effect of sustainability on the effect of charity treatments on
WTP (b= .08, t(555) .13, p= .895), neither for trustworthiness Goodclub (p= .179), fairness
PWYW (p= .333), nor relative fairness PWYW (p= .403).
However, since the effect of charity was only significant for purchasing participants,
the mediating effect of fairness PWYW was measured only for purchasing participants. First,
the bias-corrected and accelerated confidence interval (BCA95= [-.804, -.021] excluded zero,
indicating that fairness PWYW mediated the effect of charity on WTP. The total indirect
effect of fairness PWYW on WTP was found to be significant (b= -1.127, p= .004) whereas
charity did not statistically predict WTP (b= -1.225, p= .074). Thus, fairness PWYW
mediated the effect of charity on WTP for purchasing participants. The direct effect of charity
on fairness PWYW was weak and significant for purchasing participants (F(1, 210) 3.979, p=
.047 η² = .02). Participants in the charity conditions less strongly agreed and more strongly
disagreed with fairness PWYW (M= 2.80, SD= .925), than those in other conditions (M=
2.56, SD= .810). Consequently, participants paid a lower price. Moreover, the difference

33
between the treatments with and without charity was bigger when participants (strongly)
agreed or disagreed, compared to when they neither agreed nor disagreed. This is shown in
Figure 7.
Figure 7: Mediating effect of fairness PWYW on effect of charity on WTP for purchasing participants.
Nevertheless, for all values of fairness PWYW the WTP is lower in the charity
treatments. There were no other interaction effects for age (p= .838), gender (p= .262),
relative fairness PWYW (p= .357), sustainability (p= .590), nor trustworthiness Goodclub
(p= .321).
4.3.6 Gender
It has already been mentioned that males were more likely to agree with the statement that
PWYW is more fair than fixed prices, compared to females.
Moreover, there was a very weak effect of gender on purchase (F (1,557) = 8.383, p=
.004, η² = .03). From all male participants 45.4% purchased the water bottle, against 33.2% of
female participants. More interestingly, there was a significant interaction effect of gender on
the effect of fairness PWYW on WTP (b= 1.0377, t(555) 2.049, p= .041). For males, there is
€11.62
€10.13 €10.28
€9.50
€1.00
€9.58
€9.30 €9.81
€6.36
€0.67
0
5
10
15
20
25
30
35
40
45
50
Strongly agree Agree Neiter agree nor
disagree
Disagree Strongly disagree
No charity
Charity

34
a moderate effect of fairness PWYW on the WTP (F(4, 211) 7.052, p< .001, η² = .12), as
shown in Figure 8.
Figure 8: difference fairness PWYW for gender
For males there was an inverted U-shape effect of relative fairness PWYW on WTP
(F(4, 211)= 4.900, p= .001), as shown in Figure 9. For females, this effect is not significant
(p= .445).
Figure 9: difference relative fairness PWYW for gender
4.5.7 Age
As mentioned earlier, the youngest group of participants (< 42 years old) less strongly agreed
with the statement that PWYW is more fair than fixed prices. When the fairness of PWYW
was underscored, this group agreed less with the statement that PWYW is fair.
11.27
10.17
9.08
12.24 12.03 11.83
€ 8.50
€ 9.00
€ 9.50
€ 10.00
€ 10.50
€ 11.00
€ 11.50
€ 12.00
€ 12.50
High fairness Average fairness Low fairness
Male
Female
€ 9.68 € 10.40
€ 11.49
€ 9.06
€ 4.60
€ 10.36
€ 11.68 € 12.42
€ 11.93
€ 10.61
€ 3
€ 4
€ 5
€ 6
€ 7
€ 8
€ 9
€ 10
€ 11
€ 12
€ 13
Strongly agree Agree Neither agree nor
disagree
Disagree Strongly disagree
Males Females

35
Moreover, there is a very weak effect of age on the purchase of the product (F (1,552)
= 11.370, p < .001, η² = .02). Participants that purchased the product were statistically
younger (M= 45.57; SD= 14.04) than participants that did not buy the product (M= 49.47;
SD=12.68). Additionally, purchase had an interaction effect of moderate size on the effect of
age on WTP (b= .156, t(550) 4.595, p< .001), see Figure 10. The difference in WTP for
participants that purchased and did not purchase the product was significantly bigger for
young participants, compared to old participants. All other measured (interaction) effects of
age were not significant.
Figure 10: interaction effect of purchase on effect of age on WTP
4.5.8 Regression analysis for WTP
All statements had been reversed in value order, i.e. value 1 as “Strongly agree” was now
value 5 and the other way around. This was important for the interpretation of the b-value.
Thus, the higher the value of the statement the stronger the participant agreed with the
statement.
The predictors in significant Model 1 explained for 22.2% the variance in WTP (p <
.001). Statements about the interest in the product (p= .063) and the fairness of PWYW (p=
.110) did not have a significant Beta Value. After entering gender and age, Model 2 was
significant as well (p < .009) and explained 23.5% of total variance in WTP. Age did not have
8.44
9.65
10.86
13.51
12.65
11.78
8
9
10
11
12
13
14
Young Average Old
Purchase
No purchase

36
a significant Beta value (p= .865), neither did interest in product (p= .074) and fairness
PWYW (p= .073). As the statements for interest in product and fairness PWYW were
significant on a 90% confidence interval, only age was omitted from the model. The final
model explained 23.5% of the total variance in WTP (p < .001). Six of eight predictor
variables were statistically significant on a 95% confidence interval, the other two on a 90%
confidence interval, see table 7. The more participants agreed with the statements, the more
they were willing to pay. The exception is the perceived relative fairness of PWYW. This
statement has a negative effect on WTP. Participants that neither agreed nor disagreed had the
higher WTP. Moreover, females had a higher WTP (M= 12.03; SD= 4.75) compared to males
(M= 10.27; SD= 5.36). As mentioned before, participants that did not purchase the product
had a higher WTP as well.
Model 1 Model 2 Model 3
Fairness PWYW .466 (.291) .524 (.291)* .486 (.289)*
Relative fairness PWYW -.592 (.274)** -.585 (.277)** -.546 (.272)**
Trustworthiness Goodclub .836 (.289)*** .636 (.298)** .705 (.290)**
Fairness price 1.60 (.263)*** 1.668 (.265)*** 1.640 (.261)***
Interest product .408 (.219) .396 (.221)* .359 (.218)*
Sustainability product .794 (.269)*** .793 (.269)*** .788 (.267)***
Purchase product -3.690 (.508)*** -3.486 (.514)*** -3.445 (.511)***
Gender . 1.235 (.403)*** 1.210 (.399)***
Age . .003 (.514) .
R2 .222*** .235*** .235***
dF 7 9 8
F 22.502 18.534 21.134
*p < 0.1, **p < 0.05, ***p < 0.01
Table 7: hierarchical multiple regression for WTP

37
5. Discussion
Consumers seem to increasingly care about social and environmental issues correlated to the
products they buy. However, for these ethical products a premium price is asked, which most
consumers are not willing to pay. Mendoza-Abarca & Mellema (2015) argue that
organizations with a social aim need to implement mechanisms that simultaneously create
social value and an appropriate amount of economic value. Herefore, they expect Pay What-
You-Want (PWYW) to be a promising mechanism.
5.1 WTP in PWYW
In line with previous literature on PWYW (e.g. Kim et al., 2009), prices paid in this
experiment significantly differed from zero. Of all participants, 98.4% paid above zero euros.
However, 77.8% of the participants that thought zero euros was an appropriate price,
purchased the product. Contrary to previous literature (Schmidt et al., 2014), 81.6% of
purchasing participants offered less than the costs of the product. Pelsmacker et al. (2006)
outline that 10% was willing to pay a price premium. In this study, no participant was willing
to purchase the product for the selling price. Although participants were not aware of these
prices, 26.9% of purchasing participants paid five euros or less, which is not a realistic price.
This assumes that these participants did not mind violating the norm, contrary to what Gneezy
et al. (2012) found. Since the perceived fairness of the paid price was correlated with the
WTP, purchasing participants that paid a very low price were fully aware of their unethical
behavior. Potentially, these participants just wanted to get great bargains and therefore paid a
very low price (Jang & Chu, 2012).
Nonetheless, the majority of participants did not purchase the product even though
someof them were interested in the product. The mean WTP of participants that did not buy
the product was significantly higher, compared to purchasing participants. This could be

38
explained with two theories from the literature. First, purchasing participants wanted to get
great bargains and offered a low price (Jang & Chu, 2012). Second, participants might have
considered what they thought was a fair price. Thereafter, they decided this price was too high
for them and did not purchase it. Indeed, participants that agreed to have paid a fair price paid
a higher price. The stronger participants agreed with the fairness of the price and the higher
their WTP, the lower the number of participants who purchased the product. This is in line
with Gneezy et al.’s (2012) argument that consumers give up when they perceive the costs of
increasing fairness as too high. Nevertheless, some participants that agreed with fairness price
and purchased the product, still paid prices far below cost price.
5.2 Perceived fairness
Because the consumer has full control over the price, PWYW could be perceived as more fair
than fixed prices (Kim et al., 2009; Mendoza-Abarca & Mellema, 2015). As this assumption
was based on an experiment in auctions, this study was the first to measure the perceived
fairness of PWYW. It was found that nearly half of participants neither agreed nor disagreed
with the statements that PWYW was fair and that PWYW was more fair than fixed prices.
The perceived (relative) fairness of PWYW had an effect on WTP.
Surprisingly, for both fairness of PWYW and relative fairness of PWYW the highest WTP
was for participants that neither agreed nor disagreed. Thus, when participants were not sure
if they thought PWYW was (more) fair, they paid a higher amount of money.
Underscoring the fairness of PWYW did not have an effect on the perceived fairness
of PWYW nor on the perceived relative fairness of PWYW. This is in line with Kunter (2015)
who did not find effects on textual cues about fairness either. Only for purchasing participants
younger than 42 years there was a significant negative effect of underscoring the fairness of
PWYW on the perceived fairness of PWYW. This effect showed exactly the opposite as what
39
was expected in the hypothesis. However, the effect is in line with the negative effect of CSR,
mentioned by Castaldo et al. (2009). It highlights the importance of the credibility of
information about CSR. If the information is perceived as not credible, a backfire effect might
occur.
Besides underscoring the fairness of PWYW, some interaction effects occurred for
perceived fairness of PWYW. First, the effect of familiarity on the perceived fairness of
PWYW highlights the importance of informing consumers about PWYW. At the same, since
the familiarity did not have an effect on the perceived relative fairness of PWYW, making
them aware does not make them perceive the pricing system as more fair than fixed prices.
Second, the effect of the trustworthiness of the seller (i.e. Goodclub) is in line with Pearson
and Henryks (2008). They argue that consumers rely on the retailer’s reputation to confirm
ethics. It also assumes that for organizations of which customers have low trust it might not be
good to implement PWYW. Third, for relative fairness of PWYW, the effect with interest was
two-sided. Thus, participants who thought that PWYW was more fair than fixed prices were
also more interested in the product. This highlights the marketing aspect of PWYW, named
by Kim et al. (2009). Lastly, sustainability had a very weak effect on both statements as well.
This assumes that PWYW is more suitable for sustainable products. However, since this
experiment took place at a platform for sustainability, this is not remarkable.
5.3 WTP for charity in PWYW
Both Elfenbein and McManus (2010) and Gneezy et al. (2012) showed in their experiments
that consumers are willing to pay more when a part of the revenue is donated to charity.
Contrarily, the results of this study showed that participants in the charity treatments paid a
lower price for the product, compared to those in the other treatments. This effect was only

40
significant for purchasing participants. There was no moderating effect of age nor gender,
neither after separating purchasing participants.
Of the participants in the charity treatments, 78.2% agreed that the donation to charity
added value for them. Participants that disagreed indeed paid a lower price, yet this effect was
not significant. More interestingly, for purchasing participants fairness of PWYW mediated
the effect of charity on WTP. A donation to charity thus leads to less agreement about fairness
PWYW. Koppel & Schultze (2013) mentioned that ethical consumers seemed to be
supporting the mission of the social organization by purchasing its products. However, in this
study participants might have felt manipulated, since they knew the offer was part of a
research. Moreover, Milieudefensie is a partner of Goodclub. Participants might have
perceived the donation as high benefit for Goodclub, as mentioned by Yoon et al. (2006).
Besides, the difference in WTP between the treatments with and without charity was bigger
when participants agreed or disagreed with fairness PWYW, compared to when they neither
agreed nor disagreed. Apparently when participants in the charity treatments were not sure if
they thought PWYW was (more) fair, they paid a higher amount of money.
5.4 Credibility in PWYW
Schmidt et al. (2014) outlined the importance of the reputation of the seller for PWYW. They
assumed that an effortful, friendly seller may induce a buyer to pay more. Moreover, CSR of
an organization should be communicated to consumers, otherwise they will not be aware of it
(McWilliams & Siegel, 2001). Nevertheless, when consumers are skeptical about the
credibility of the information, a negative effect might occur (Castaldo et al., 2009).
In this study the effect of the trust in the seller was measured. As expected,
participants that strongly agreed paid a higher price than participants that neither agreed nor
disagreed and strongly disagreed. Thus, consumers are indeed willing to invest financially to

41
support retailers who act in an ethical manner, as mentioned by Memery et al. (2012). In
alignment with Castaldo et al. (2009), trust can account for the success or failure of a
company with a social orientation. However, consumers only seem to invest relatively more
than consumers who do not perceive this ethical behavior. On average, participants that
(strongly) agreed with trustworthiness Goodclub, still paid a price below cost price.
Also, there was a weak significant effect of sustainability on WTP. The stronger
participants disagreed, the lower price they paid. This effect was moderate for purchasing
participants. In this research the aim was to examine the effect of PWYW in a group that
could be seen as ethical consumers (i.e. newsletter of Goodclub). It could have been expected
that this group was therefore willing to pay a higher price when they perceived the product as
sustainable. Therefore, participants were comparable to the high premium price group in
Barber et al.’s (2014) research. Nevertheless, purchasing participants that (strongly) agreed
with sustainability still paid a price below cost price.
Although the credibility of the sustainability of the product, the perceived fairness of
PWYW and the trustworthiness of Goodclub lead to a higher WTP, these participants on
average still paid a price below cost price. In addition, purchasing participants still paid a
lower price, compared to participants that did not purchase the product. Moreover, purchasing
participants in the charity treatments still paid a lower price, compared to those in the other
treatments. Yet, this effect was not significant any more.
5.5 Limitations and implications
PWYW is increasingly implemented in several industries. More research should indicate
conditions in which PWYW is most profitable to the seller. In The Netherlands this pricing
mechanism is only implemented in exceptional cases. This experiment took place at a Dutch
platform endorsing sustainability (i.e. Goodclub). After examining its potential in this

42
country, this organization – and potentially others as well - might be motivated to implement
PWYW. This study provides implications in the PWYW field as well as in the field of
business ethics. Retailers are not only held responsible for their own behavior, they are
imposed to oversee ethical behavior in the whole supply chain (Schramm-Klein et al., 2015).
The market share of ethical products varies a lot between countries and most research is done
in the United States. For example, the market share for sustainable coffee in the Netherlands
developed from less than 1% in 1985 to 45% in 2010 (Ingenbleek & Reinders, 2013). This
experiment has implications for Dutch organizations which (consider to) invest in ethical
consumerism or corporate social responsibility.
This study highlights the importance of credibility in PWYW. Therefore,
organizations that consider using PWYW should try to increase credibility for both the brand,
as well as the product and the pricing mechanism. To increase the credibility of the product,
additional product information should be added to the advertisement. In this study, some
participants noted afterwards that the information was incomplete and where therefore willing
to pay less for the product. This is in line with the mentioned negative effect of lack of
information, mentioned by Araque-Padilla et al. (2015). Participants who thought PWYW
was (more) fair, were also willing to pay a higher price. However, those who neither agreed
nor disagreed with the statement had the higher WTP. Therefore, organizations who are
implementing PWYW should avoid that consumers perceive PWYW as unfair. Yet, they
could let them have a doubt. Not surprisingly, organizations should be perceived as
trustworthy. Schmidt et al. (2014) already mentioned the importance of the seller in PWYW.
Underscoring the fairness of PWYW did not have a positive effect on the perceived
fairness of PWYW, except for participants younger than 42 years. Yet, there were no effects
on WTP. Participants might not be vulnerable for this kind of information. Although nearly
no effects were found for underscoring the fairness of PWYW, this does not mean there are

43
none. It could be that the wrong content was chosen or that participants were already
influenced by the introduction about PWYW in the newsletter of Goodclub, see Appendix 1.
However, participants that neither agreed nor disagreed with the statements about the
(relative) fairness of PWYW had the highest WTP. A way to convince consumers of this
fairness might therefore not be desirable.
More research should specifically focus on the effect of perceived fairness of PWYW
on WTP for different conditions. In this study it was found that PWYW was not perceived as
(more) fair on average. When only looking at participants that either agreed or disagreed, two-
thirds agreed with the fairness of PWYW and a small majority agreed with PWYW being
more fair than fixed prices. However, perceived fairness of PWYW was only measured based
on two statements. In future research, this fairness should be measured based on a scale with a
high validity and reliability. Moreover, there should be a comparison between fixed pricing
and PWYW to measure the relative fairness of PWYW.
Based on the results of this study, it is not recommended for social organizations to
implement a donation to charity. However, since it is not sure why participants paid
significantly lower prices, it could be that the charity organization was not suitable. Also, an
imaginary currency was used. Previous research found positive effects of the donation to
charity on WTP. Therefore, organizations should not feel discouraged. Yet, a good
consideration about charity organization and the communication content should be made. This
was the first time that a social retailer was selling an ethical product through PWYW for
which a donation to charity is promised. Future research could explore if this result is
generalizable over different social organizations, ethical products, and charities.
Moreover, the product chosen in this experiment seemed to be too expensive. Kim et
al. (2014) found in their experiment that product between five and ten euros had a relatively

44
higher WTP, compared to those product for more than ten euros. As this experiment took
place online, there was no face-to-face interaction with the seller. Schmidt et al. (2014) argue
that this does not have to be a problem as long as the buyer wants to keep the seller in
business. However, apart from this online experiment, an offline experiment at the sister
organization of Goodclub was done. Although the gains were less than on average base, the
experiment was profitable, contrary to this online experiment.
Lastly, some authors (e.g. Kim et al., 2009) have argued that PWYW is a valid
measurement for WTP. In this study, almost for every variable a significant difference existed
between purchasing and not purchasing participants. It can be argued that the ‘true WTP’ is
what consumers are actually paying for a product. However, when they have the opportunity
to get a product for nothing and some will. This does not mean that they were not willing to
pay more when they had to.
45
References
Auger, P., & Devinney, T. M. (2007). Do what consumers say matter? The misalignment of
preferences with unconstrained ethical intentions. Journal of Business Ethics, 76(4), 361-383.
Aguinis, H., & Glavas, A. (2012). What we know and don’t know about corporate social
responsibility a review and research agenda. Journal of management, 38(4), 932-968.
Araque-Padilla, R. A., Montero-Simó, M. J., Rivera-Torres, P., & Aragón-Gutiérrez, C.
(2015). Moderating the Relationship Between Price and Perceived Value of Ethical Products.
Journal of Agricultural and Environmental Ethics, 28(2), 217-230.
Barber, N. A., Bishop, M., & Gruen, T. (2014). Who pays more (or less) for pro-
environmental consumer goods? Using the auction method to assess actual willingness-to-
pay. Journal of Environmental Psychology, 40, 218-227.
Biong, H., Nygaard, A., & Silkoset, R. (2010). The influence of retail management’s use of
social power on corporate ethical values, employee commitment, and performance. Journal of
Business Ethics, 97(3), 341-363.
Carrington, M. J., Neville, B. A., & Whitwell, G. J. (2014). Lost in translation: Exploring the
ethical consumer intention–behavior gap. Journal of Business Research, 67(1), 2759-2767.
Castaldo, S., Perrini, F., Misani, N., & Tencati, A. (2009). The missing link between
corporate social responsibility and consumer trust: The case of fair trade products. Journal of
business ethics, 84(1), 1-15.
Chatzidakis, A., Kastanakis, M., & Stathopoulou, A. (2016). Socio-cognitive determinants of
consumers’ support for the fair trade movement. Journal of Business Ethics, 133(1), 95-109.

46
Crane, A., Matten, D., & Spence, L. J. (2013). Corporate social responsibility in a global
context. Chapter in: Crane, A., Matten, D., and Spence, LJ,'Corporate Social Responsibility:
Readings and Cases in a Global Context, 2, 3-26.
Elfenbein, D. W., & McManus, B. (2010). A greater price for a greater good? Evidence that
consumers pay more for charity-linked products. American Economic Journal: Economic
Policy, 2(2), 28-60.
Erdem, T., & Swait, J. (2004). Brand credibility, brand consideration, and choice. Journal of
consumer research, 31(1), 191-198.
Gneezy, A., Gneezy, U., Riener, G., & Nelson, L. D. (2012). Pay-what-you-want, identity,
and self-signaling in markets. Proceedings of the National Academy of Sciences, 109(19),
7236-7240.
Granados, N., & Gupta, A. (2013). Transparency strategy: competing with information in a
digital world. Mis Quarterly, 37(2).
Ingenbleek, P. T., & Reinders, M. J. (2013). The development of a market for sustainable
coffee in The Netherlands: Rethinking the contribution of fair trade.Journal of business
ethics, 113(3), 461-474.
Haws, K. L., & Bearden, W. O. (2006). Dynamic pricing and consumer fairness
perceptions. Journal of Consumer Research, 33(3), 304-311.
Jang, H. & Chu, W. (2012). Are Consumers Acting Fairly Toward Companies?: An
Examination of Pay-What-You-Want Pricing. Journal of Macromarketing 32(4), pp.348-360.
Kim, J. Y., Kaufmann, K., & Stegemann, M. (2014). The impact of buyer–seller relationships
and reference prices on the effectiveness of the pay what you want pricing
mechanism. Marketing Letters, 25(4), 409-423.
Kim, J. Y., Natter, M., & Spann, M. (2009). Pay what you want: A new participative pricing
mechanism. Journal of Marketing, 73(1), 44-58.

47
Koppel, H., & Schulze, G. G. (2013). The Importance of the Indirect Transfer Mechanism for
Consumer Willingness to Pay for Fair Trade Products—Evidence from a Natural Field
Experiment. Journal of Consumer Policy, 36(4), 369-387.
Kunter, M. (2015). Exploring the pay-what-you-want payment motivation. Journal of
Business Research, 68(11), 2347-2357.
Low, W., & Davenport, E. (2006). Mainstreaming fair trade: adoption, assimilation,
appropriation. Journal of strategic marketing, 14(4), 315-327.
McWilliams, A., & Siegel, D. (2001). Corporate social responsibility: A theory of the firm
perspective. Academy of management review, 26(1), 117-127.
Memery, J., Megicks, P., Angell, R., & Williams, J. (2012). Understanding ethical grocery
shoppers. Journal of Business Research, 65(9), 1283-1289.
Mendoza-Abarca, K. I., & Mellema, H. N. (2015). Aligning economic and social value
creation through pay-what-you-want pricing. Journal of Social Entrepreneurship, (ahead-of-
print), 1-25.
Nicholls, A. J. (2002). Strategic options in fair trade retailing. International Journal of Retail
& Distribution Management, 30(1), 6-17.
Pearson, D., & Henryks, J. (2008). Marketing organic products: Exploring some of the
pervasive issues. Journal of Food Products Marketing, 14(4), 95-108.
Pelsmacker, P. D., Driesen, L., & Rayp, G. (2005). Do Consumers Care about Ethics?
Willingness to Pay for Fair-Trade Coffee. Journal of Consumer Affairs, 39(2), 363-385.
Porter, M. E., & Kramer, M. R. (2006). Strategy and society: the link between corporate
social responsibility and competitive advantage. Harvard business review, 84(12), 78-92.

48
Pruckner, G. J., & Sausgruber, R. (2013). Honesty on the streets: A field study on newspaper
purchasing. Journal of the European Economic Association, 11(3), 661-679.
Saunders, M., Lewis, P., & Lewis, P. (2012). Doing research in business and management:
An essential guide to planning your project. Harlow, UK: Financial Times Prentice Hall.
Schmeltz, L. (2012). Consumer-oriented CSR communication: focusing on ability or
morality?. Corporate Communications: An International Journal, 17(1), 29-49.
Schmidt, K. M., Spann, M., & Zeithammer, R. (2014). Pay what you want as a marketing
strategy in monopolistic and competitive markets. Management Science, 61(6), 1217-1236.
Schramm-Klein, H., Morschett, D., & Swoboda, B. (2015). Retailer corporate social
responsibility: shedding light on CSR’s impact on profit of intermediaries in marketing
channels. International Journal of Retail & Distribution Management, 43(4/5)
WCED. (1987). Our common future: report of the world commission on environment and
development. Oxford University Press, Oxford, England.
Yoon, Y., Gürhan-Canli, Z., & Schwarz, N. (2006). The effect of corporate social
responsibility (CSR) activities on companies with bad reputations.Journal of Consumer
Psychology, 16(4), 377-390.

49
Appendixes
Appendix 1: newsletter Goodclub

50

51

52
Appendix 2: survey flow
Screen 1

53
Screen 2. NB: for other treatments see appendix 2.

54
Screen 3
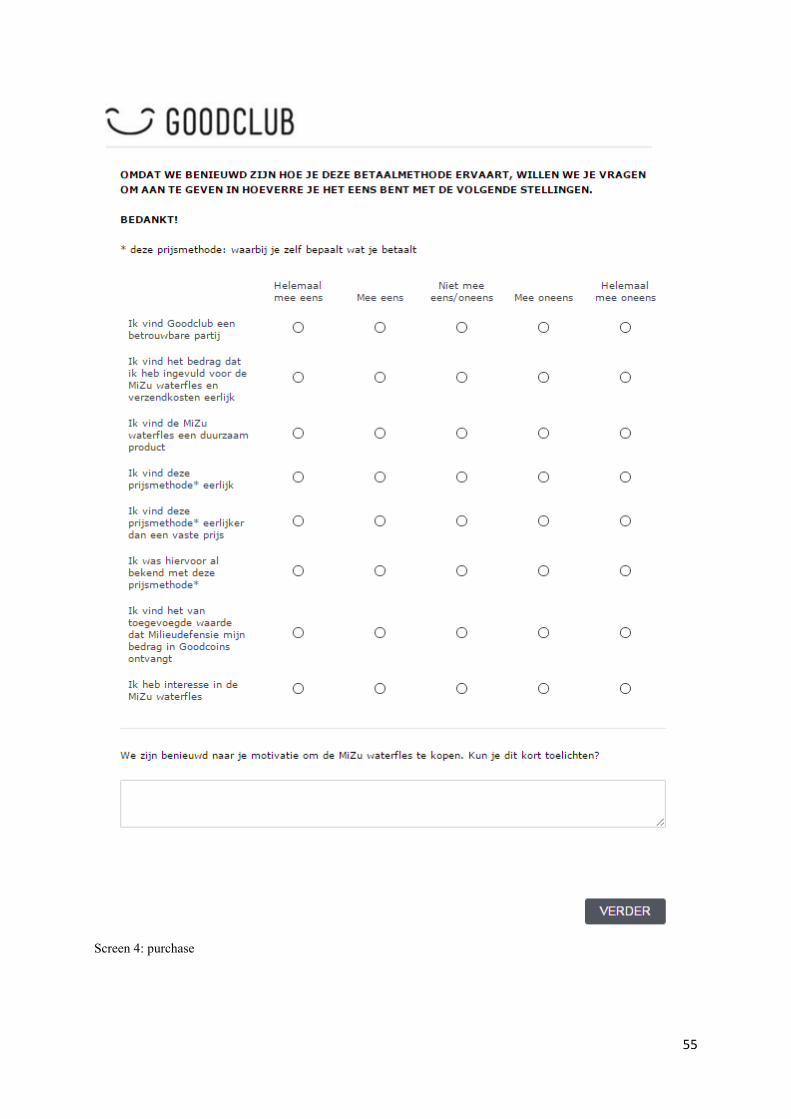
55
Screen 4: purchase

56
Screen 4: no purchase, no charity

57
Screen 5: purchase

58
Screen 5: no purchase
Screen 6: purchase

59
Appendix 3: treatments
Treatment 1: baseline

60
Treatment 2: charity

61
Treatment 3: underscoring fairness

62
Treatment 4: charity and underscoring fairness