perceived buyer satisfaction and selling pressure versus pricing policy: a comparative study of...
TRANSCRIPT

Perceived Buyer Satisfaction and Selling Pressure Versus Pricing Policy: A Comparative Study of Retailers in Ten Developing Countries
Laurence Jacobs, Regmald Worthley , Charles Keown ,
Umversrty of Hawau
Observatton of retail pracnces m ten developrng countrtes m Asra, Ajkca and South Amertca explored the relattonshrp between percerved buyer sattsfactlon and sellmg pressure as they relate to prtcmg poltcy The studyfound that price bargatnrng appears more prevalent m Asia than m South America. and buyer satrsfactlon was lower for retailers that bargain than for retailers usrng a fired-price polrcy Selling pressure was higher among retatlers that bargam than retailers usrng a one-price-for-allpolrcy There were, however, several tnteresttng mtercountry differences
Pnce bargamng by storekeepers has long been an Integral part of retadmg m many countries, and yet from a customer’s pomt of view 011s bargamng process may differ greatly from one nahon to the next
The pnmary purpose of this study was to explore the effect of bar- gamng on perceived buyer satisfaction and perceived sellmg pressure for retaders located m ten selected countnes
While the field of marketing 1s replete with textbooks, studies, and articles m the area of mtematlonal marketing, few deal with realmg and fewer still consider retadmg on a comparatjve basis Hollander [8], of course, &d his classic 1970 study which gave a comprehensive review of retadmg around the world The intent of his study was to show the degree of internationalization of reta&ng
Most of the literature since 1970 has concentrated upon strategic declslon- makmg m multmational firms [ 1,2, 121, some aspects of which deal with retadmg There also have been a few studies of retimg In specific countnes [7, IO] Finally, several textbooks In the field of international marketing devote space to retadmg [6, 1 I]
Ths study IS apparently one of the first large, data-based mvestlga-
Address correspondence to Laurence Jacobs, Umverslty of Hawan, College of BUSI ness Admtnntration, 2404 MalIe Way, Honolulu, HI 96822
Journal of Bustness Research l&63-74 (1984)
@ Elsevter Sctence Pubhshtng Co , Inc 1984
52 Vanderbdt Ave , New York, NY 10017
63
0148.2%3/84/$3 00

64 L Jacobs et al
tlons of comparative retadmg Thus paper reports on the results of more than 1500 observations of retaders’ pracuces m ten countnes m Asia, Africa, and South Amenca The data show differences 111 perceptions of buyer sattsfactlon and sellmg pressure as they relate to retaders’ pncmg
pobc Y
Methodology
Design In order to compare differences m pncmg policies and per- ceptions among countries, data collection procedures should ensure the use of a common set of operational measures This poses the obvious problem of dealmg with the influence of culture on the data collectors’ perceptions For example, a data collector from Singapore presumably would have different perceptions of buyer safisfactlon than would a data collector from Brazil On the other hand, if nationals were used as data collectors m each country, then perceptional data would be biased by national cultural differences In this study, data collectors were a group of U S student researchers who agreed to work under the dlrectlon of the prmclpal researcher Thus, data were collected by the same group of researchers m each country This procedure ensured consistency m data collection procedures, but obviously louts the perceptual data to rep- resenting a U S viewpoint However, the relutzve differences among countnes should have validity for this emplncally based, comparative study Sample Retad outlets were selected by the researchers wlthm spec- ified categones to ensure that a broad cross-section of stores was in- cluded m the sample Therefore, there was no expenmental control over the number surveyed, and the resulting sample consisted of 1,550 real estabbshments A breakdown by country and by type of store IS given ln Table 1 Most of the stores surveyed were located m the respective capitals of commerce m each country Consequently, this hnuts the generallzablhty of the study to large city retaders Because of time hmltatlons, only 29 stores were surveyed m The People’s Republic of China (PRC) However, the findings are included because of the in- herent interest m tlus country Data Collection Procedures Data were collected by sixty student researchers who shopped m the reta outlets m the tencountnes included m tins study These researchers were tramed to be participant-observers, and were mstructed m the proper classlficahon of outlets as well as m the common anchor points m the perceptual ratmg scales After the data had been collected for each country, group discussions and evaluations were
Buyer Sattsfactlon 65
conducted by the p~clpal researcher to ensure that these anchor pomts remamed constant among the researchers, as well as among counties surveyed
The researchers were instructed to observe the buymg-se&g sltua- tlon pnor to engagmg in the process themselves Specifically, they were instructed to observe behavior patterns of several buyers (both national and foreign), based on such clues as whether or not purchases were made, facial expressions (smdes versus frowns), and overt feelings (happy and satisfied versus angry and frustrated) Researchers then recorded their perceptions on the five-point ratmg scale rangmg from “very satisfied” to “very dissatisfied ” Smularly, researchers observed the behavior patterns of store personnel toward several customers, based on the degree of aggressiveness versus indifference, and recorded their perception on the five-point ratmg scale, “high pressure sellmg” to “low pressure selling ’ ’
Next, the researchers were mstructed to engage m the buying process and confirm theu mltlal perceptions If their perceptions were mcon- slstent, then researchers recorded slgmficant detals of their transaction and theu- pnor observations Such mconslstencles were then resolved m postsurvey meetings of all researchers with the pnnclpai researcher, after each country had been surveyed
In many countries, researchers were accompamed by fnends who were nationals m the countnes being surveyed Although this was not a cntenon for this study, it did result In assisting researchers 111 under- standing the language and customs of the country In postsurvey meet- mgs, there was general consensus among the researchers that knowledge of the local language did not Increase their ablhty to assess the degree of buyer satisfaction and the degree of sellmg pressure used by store personnel Measures Two descnptors were considered to be Independent van- ables, they were ( 1) the countries, and (2) the types of stores (Table I)
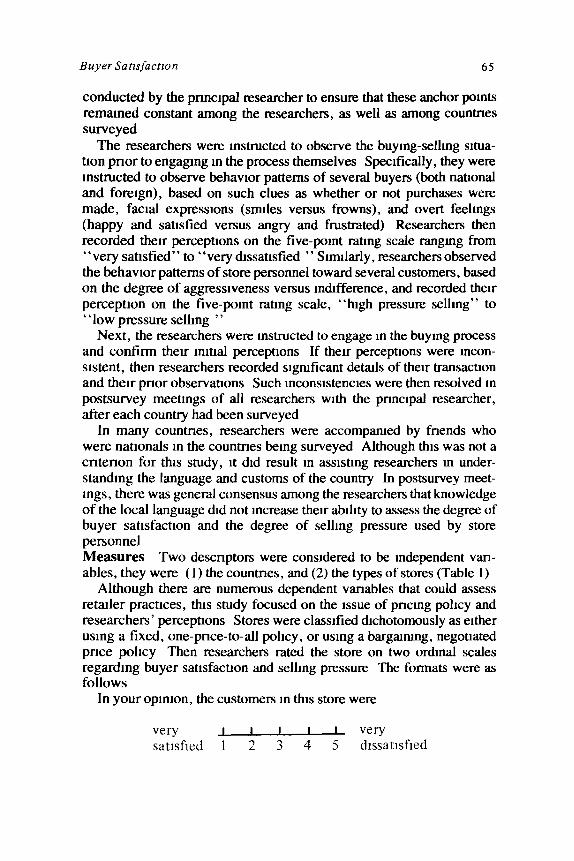
Although there are numerous dependent vanables that could assess retader practices, this study focused on the issue of pncmg pohcy and researchers’ perceptions Stores were classdied dichotomously as either using a fixed, one-price-to-all pohcy, or usmg a bargwnmg, negotiated pnce pohcy Then researchers rated the store on two ordinal scales regarding buyer satisfaction and sellmg pressure The formats were as follows
In your opinion, the customers III tl~s store were
very I I I 1 very satlsfled 1 2 J 4 5 dlssatlsfled
66 L Jacobs et al
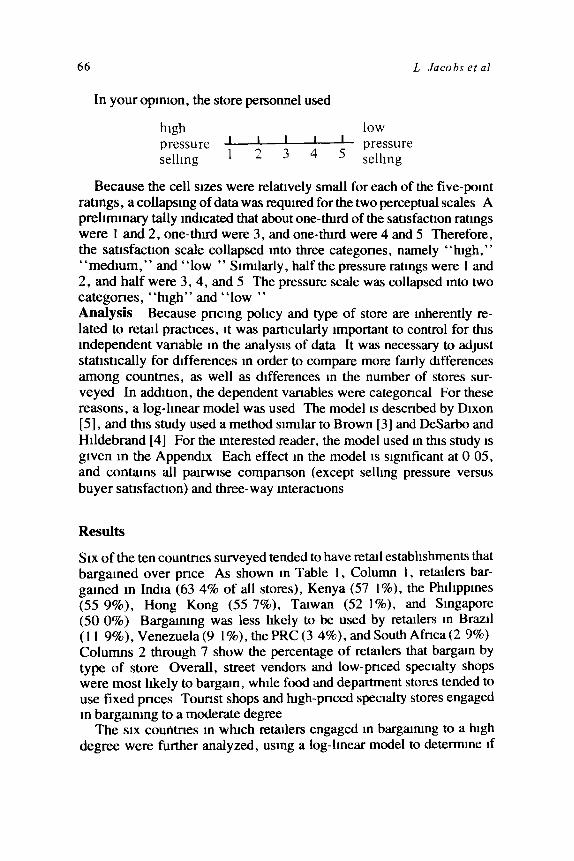
In your oplmon, the store personnel used
high low pressure 1 pressure selling 1 * 3 4 5 selling
Because the cell sizes were relatively small for each of the five-pomt ratmgs, a collapsmg of data was required for the two perceptual scales A prehnunary tally indicated that about one-durd of the satisfaction ratmgs were 1 and 2, one-thu-d were 3, and one-third were 4 and 5 Therefore, the satlsfacuon scale collapsed mto three categories, namely “high,” “medmm,” and “low ” Smularly, half the pressure ratmgs were 1 and 2, and half were 3, 4, and 5 The pressure scale was collapsed mto two categories, “hgh” and “low ” Analysis Because pncmg pohcy and type of store are Inherently re- lated to retal practices, It was particularly Important to control for this independent vanable m the analysts of data It was necessary to adjust statistically for differences m order to compare more farly differences among countries, as well as differences m the number of stores sur- veyed In addition, the dependent vanables were categorical For these reasons, a log-linear model was used The model 1s described by Dixon [5], and thus study used a method sumlar to Brown [3] and DeSarbo and Hlldebrand [4] For the interested reader, the model used m this study 1s given m the Appendix Each effect m the model IS slgmficant at 0 05, and contams all pan-wise comparison (except selling pressure versus buyer satisfaction) and three-way interactions
Results
SIX of the ten countnes surveyed tended to have retad estabhshments that bargamed over pnce As shown m Table 1, Column I, retaders bar- gamed m India (63 4% of all stores), Kenya (57 I%), the Phdlppmes (55 9%), Hong Kong (55 7%), Tawan (52 l%), and Singapore (50 0%) Bargamng was less hkely to be used by remlers m Brazil ( 11 9%), Venezuela (9 I%), the PRC (3 4%), and South Afnca (2 9%) Columns 2 through 7 show the percentage of retaders that bargam by type of store Overall, street vendors and low-priced specialty shops were most hkely to bargam, whde food and department stores tended to use fixed prices Tounst shops and lugh-priced spec&y stores engaged m bargammg to a moderate degree
The six countnes m which retailers engaged m bargammg to a high degree were further analyzed, using a log-lmear model to determme if

B s 2 2 z 3
Tab
le 1
Pe
rcen
t of
Sto
res
that
B
arga
m,
by C
ount
ry
and
Typ
e of
Sto
re
0 G+
Cou
ntry
A
ll St
ores
Stre
et
Low
-Pm
ed
Ven
dors
Sp
ecia
lty
(n =
286
) (n
= 1
9s)
Typ
e of
Sto
re
Hig
h-P
med
T
ouns
t Sp
ecia
lty
(n =
363
) (n
= 3
40)
Dep
artm
ent
(n =
166
)
J
Foo
d an
d D
rug@
(n
= 2
00)
fndl
a K
enya
Phlll
ppm
es
Hon
g K
ong
Tai
wan
SJl
l@lO
If?
Bra
zil
Vet
WX
ela
PR
C
Sout
h A
fric
a
All
Cou
ntri
es
(n =
164
) 63
4
(n =
240
) 57
1
0 =
118)
55
9
(n =
106
) 5.
5 I
(n =
261
) 52
1
(n =
162
) 50
0 (n
= 2
01)
119
(12 =
55)
91
(n
= 2
9)
34
tn
= 20
8)
29
-~
-.,-
(n =
155
0 40
1
91
96
88
83
87
57
25
38 0 8
_- 75
2
64
50
56
65
71
70
19 0 0 6 50
2
62
55
36
0
44
46
40
5
59
SO
20
8
68
62
9 11
53
41
s 16
37
73
13
21
12
14
0 0
13
0 0
0
0 0
6 0
6 1
3 0
--
--
--
-
38
0 32
9
78
40
a 1
oad
and
drug
st
ores
w
ere
Lom
bmed
be
caus
e of
th
eir
mdl
vldu
al
smal
l sa
mpl
e sz
es

68 L Jacobs et al
Table 2 Perceived Buyer Satlsfactlon
Percentage of “Low” Satmfactlon Stores _ ~__
Pnclng Pohcy
Country
Phlhppmes
India
Taiwan
Kenya Hong Kong
Singapore
All counmes
AU Stores FIxed (n = 472) Negotiated (n = 583)
(n = 119) 38 29 45
(n = 163) 36 24 43
(n = 263) 30 18 41
(n=241) 30 17 40
(n = 107)
:6’
13 20
(n=162) 12 20 -_ -
(n = 1055) 28 18 31
there were slgmlkant differences m shoppers’ perceptlons of the re- talers’ selling-pressure tactics and differences m shoppers’ satlsfactlon with the buying process Because these perceptions are related strongly to pncmg pohcy (fixed pnce or bargammg), to type of store, and to the country involved, the log-lmear model was used for analysis The model indicated that perceptions of buyer satlsfactlon and sellmg pressure were related to pncmg pohcy, type of store, and country These perceptions also had country by pncmg pohcy mteractlons and type of store by pncmg pohcy mteractlons These slgruficant relationships are indicated by reference marks followmg the lambda values as shown m Tables 2,3, 4,and5
The analysis relatmg buyer satlsfactlon to pncmg policy 1s shown 111 Table 2 Thirty-seven percent of the stores that bargamed were perceived as low m satisfacuon compared with 18% of the stores that used fixed pnces, while 28% of all 1,055 stores were perceived to be low m satlsfacfion In general, Flhpmo stores were perceived to have more dissatisfied buyers (38%) than Singapore stores (16%) The relative rank ordenng of buyer satisfaction by country remams unchanged when the countnes are dlchotonuzed mto fvted versus bargammg pohcles
Whde data are not shown for type of store m Table 2, the analysis indicated that street vendors had the highest percentage of dissatisfied buyer ratings (53%), whde department and high-priced specialty stores had the lowest percentage of &ssat&ed buyers (7% and 15%, respec- tively) There were no slgmficant departures from the norm for low- priced spcc&y , tounst, food, or drug stores
Table 3 provides lambda estunates from the log-linear model to test

Buyer Satlsfactlon 69
Table 3 Lambda Estimates for Buyer Satlsfactlon from Log-Linear Model
Country Low Medmm High
Phlhppmes 0 285b -0 145 -0 140 lndla 0 2510 -0 040 -0 2120 Taiwan 0 059 -0 099 0 041 Kenya 0 013 0 108 -0 121 Hong Kong -0 2996 -0 042 o 3416 Smgapore -0 3086 0 2llQ 0 091
Pncmg Policy ~__
lked Negotiated
-0 1150
0 1150 -0 045 0 1606 0 045 -0 16Ob
a Lambda estimate more than 2 standard errors from zero
b Lambda estimate more than 3 standard errors from zero
Table 4 Perceived Sellmg Pressure
Percentage of “High” Sellmg Pressure Stores
Pncmg Policy _
Country All Stores Fyted (n = 472) Negotiated (n = 583)
India 60 47 66
Phlllpprnes 55 27 16
Hong Kong 52 23 16
Taiwan 51 37 64
Kenya 43 10 69
Singapore 42 19 65
All countries 50 26 68

70 L Jacobs et al
Table 5 Estimates for Selling Pressure from Log-Linear Model High Selling Pressure
By Country Low High
Hong Kong
Pluhppmes
India
Tdlwan
Singapore
Kenya
-0 124 0 124
-0 116 0 116
-0 103 0 103
-0 072 0 072
+O 078 -0 078
+O 338b -0 3386
By Country and Pncmg Pohcy Flxed Bargammg
Taiwan 0 2640 -0 2640
Hong Kong -0 1830 0 183a
Phlllppmes -0 022 0 022
Smgdpore -0 100 0 100
Indid 0 2950 -0 295a
Kenyd -0 2540 0 254a
By Store and Pncmg Pohcy Fixed Bargammg
Street Vendors
Low Priced Specialty High Priced Specialty
Tourist
Department
rood and Drug
-0 166 0 166
0 168 -0 168 0 246a 0 2460
0 088 -0 088
0 214a -0 2140
-0 5506 o 55ob
0 Lambda estimate more than 2 standard errors from zero b Lambda estimate more than 3 standard errors from zero
significant two-way mteractlons between country and buyer satlsfactlon when statlstlcally controllmg type of store Buyers m Flhpmo and Indian stores were perceived to have relatively less satlsfactlon, while buyers m Hong Kong and Singapore were more satisfied There were no slgmf- lcant deviations from the norm for stores m Tailwan and Kenya When controlling for country as well as type of store, buyers that shopped m fixed-pnce stores generally tended to be more satisfied than buyers m bargammg situations Further analysis mdlcated that there were no statistically sigmfkant three-way Interactions (country by pncmg pohcy by satlsfactlon and type of store by pncmg policy by satlsfactlon)
Sumlarly, the relationstip between selling-pressure tactics and pncmg policy was explored in Table 4 Sixty-eight percent of the stores that bargamed were perceived to use high-pressure tactics compared

Buyer Satzsfactzon 71
with 26% of the stores that used fixed pnces, while 50% of all stores were perceived to use high selhng pressure Overall, more Indian stores were percerved to use high pressure selhng (60%), wlule fewer Singapore stores were perceived to do so (42%) The relative rank ordenng of selling pressure by country changes substantially when country data IS dlchotonuzed by pncmg pohcy
Table 5 provides lambda estimates from the log-lmear model When type of store was statistically controlled m the model, only retaders m Kenya exhibited slgmficantly lower use of high-pressure selhng tacucs (note lambda value of -0 338) While not shown m Table 4,low-priced specialty rekulers were perceived to use more hgh pressure tactics than the norm, and food and drug retaders used relatively less selling pressure than the norm
The model indicated two slgmficant three-way mteractlons Selling pressure was Influenced by country and pncmg pohcy Rekulers in Taiwan and India were seen as using high pressure sellmg wltb fixed prices more than the norm, while fixed-pnce retaders m Kenya and Hong Kong used high-pressure selling less than the norm Selhng pressure was also Influenced by type of store and pncmg pohcy High- priced specialty and department stores usmg fixed prices were perceived as using above average high-pressure selling, whde food and drug store usmg fixed prices were vlewed as lower than average
Summary
The results of this study indicate relative differences among retaders m a hrmted number of countnes The sample, although large, IS not random, smce researchers chose the various retad establishments located m the major capitals of commerce of each country Although the presence or absence of bargammg was essentially an observable measure, percep- tlons of buyer satisfaction and selling pressure obviously were mflu- enced by the culture of the U S researchers Despite these caveats, thus study has several mterestmg findmgs
Fust, bargammg appears more prevalent m Asia than m South America, yet even m India over one-thud of the reta outlets surveyed used a fixed-pnce pohcy As one would expect, pncmg pohcy vaned w1t.h type of store Bargamng was more commonly used by street vendors and low-priced specialty stores, whde fixed prices were used by department and food stores
Second, perceived buyer satisfaction was lower for rekulers that bargamed than for realers usmg a fmed-pnce pohcy There were mtercountry differences, however, stores 111 Phlhppmes and India were

72 L Jacobs et al
perceived to be sqquficantly lower m buyer satisfaction than expected (1 e , controllmg for the type of store), whde stores m Hong Kong and Singapore were slgmficantly higher m buyer satisfaction than the norm
Thnd, perceived selling pressure was higher among retaders that bargamed than retaders usmg a one-price-for-all pohcy Kenyan re- tatlers used less selling pressure than expected when contmllmg for the type of store There were also several mtercountry hfferences when the data was categorized by type of pncmg pohcy For example, more store personnel m Taiwan and India were viewed as using high selhng pres- sure, whde fewer sales people m Kenya and Hong Kong were perceived as using high pressure
Fmally , the mfluence of a bargamng pohcy was much more pro- nounced on selling pressure tactics than on buyer satlsfactlon The range of percentages was 37% bargamng to 18% fixed, or 19 percentage points difference for buyer safisfactlon, wlule the range was 68% bar- gamng to 26% fixed, or 42 percentage points difference for sellmg pressure The rank correlation for buyer satisfaction by country and by pnce pohcy was kgh (r = 1 0), and there were two slgmficant two-way interactions when data was analyzed by pncmg pohcy These relevant interactions were country by pnce pohcy and type of store by pnce policy There were no significant three-way interactions In contrast, rank order for sellmg pressure by country changed substantially (r = -0 2) when country data was analyzed by pnce pohcy, and there were two mteractlons, country by pnce pohcy and type of store by pnce pol- icy There were also two three-way mteractlons, namely country by pnce pohcy by selling pressure and type of store by pnce pohcy by sell- mg pressure Thus, retaders that bargam are hkely to be perceived as having lower buyer satlsfactron, and even more hkely to use hlgh-pres- sure sellmg tactics
Append= Log-Linear Model of Perceived Buyer Satlsfactlon and Selling Pressure by Country, by Type of Store, and by Pncmg Pohcy
Varlable A Country (6 countries, the 4 countries that do httle bargammg were omltted)
Variable B Store Type (6 types)
Variable C Prlcmg Pohcy (fixed or bargammg)
Variable D Buyer Satlsfactlon (high, medium, low) Variable E Selhng Pressure (high, low)
Model ECB, CCA, CBA, ED, DC, DB, DA Dl- LR CHISQ PROB
312 330 0 2315
PEARSON CHISQ PROB
302 06 0 6463

Buyer Satlsfactzon 73
The followmg models are Included m or include the above model and differ from It by addmg or deletmg one effect
Effect DF LR CHISQ Prob
Add EDC 2 2 92 0 2317
EDB 10 6 26 0 7926
EDA 10 7 83 0 6455
EBA 25 32 29 0 1499
DCB 10 6 14 0 8032
DCA 10 861 0 5695
DBA 50 6070 0 1429
Delete ECB 5 23 29 0 0003
CCA 5 32 07 0 0000
CBA 25 53 69 0 0007
ED 2 1268 0 0018
DC 2 9 76 0 0076
DB 10 83 07 0 0000
DA 10 24 16 0 0072
References
Ayal, Igal, and Zif, Jehlel, Competltlve Market Choice StidtegeS m Multmatlonal
Marketmg, Columbza J World Bus (Tall 1978) 72-8 1
- Market Expansion Strategies m Multmatlonal Marketmg,J Murkefzng (Sprmg 1979) 84-96
Brown, M D , Screenmg Effects m Multidlmenslonal Contingency Tables, Appl Statzs (Apnl 1976) 27-46
DeSarbo, W S , and Hlldelrand, D K , A Marketer’s Guide to Log-Linear Models
for Quahtltatlve Data Analysis, J Murkefzng (Summer 1980) 40-S 1
Dixon, W H , ed, Bzomedzcal Computer Programs UCLA Press, Los Angeles,
1979
Fayerweather, John, Internatzonal Marketzng Prentice-Hall, Englewood Cliffs,
NJ , 1965
Groke, Paul, How Japanese Department Stores Are Meeting the Challenge of a
Rapidly Changmg Environment, J Retazlzng (Fall 1972) 72-80
Hollander, Stanley, Multznotzonal Retazhng Michigan State University, East
Lansing, MI, 1970
Sands, Saul, Can You Standardize International Marketing Strategy, J Acad Marketzng Scz (Winter, Spnng 1979) 117-134

74 L Jacobs et al
10 Szuprow~cz, Bohdan, and Szuprowicz, Marla, Domg Busmess wrfh the People’s Repubhc of Chwta Industries and Markets John Wiley and Sons, New York,
1978
11 Terpstra, Vern, InternatIonal Marketmg, 2nd ed , Dryden Press, Hmsdale, IL, 1978
12 Wind, Yoram, Douglas, Susan, and Perlmutler, Howard, Guldelmes for Develop-
mg International Marketing Strategies, J Marketmg (Apnl 1973) 14-23