perceived brand globalness- impact on women …ijssm.org/vol_5/khurana_5.1.pdfbasically to...
TRANSCRIPT

K. Khurana (2018) Int. J. Soc. Sc. Manage. Vol. 5, Issue-1: 18-30
DOI: 10.3126/ijssm.v5i1.19005
Full text of this paper can be downloaded online at www.ijssm.org/ &http://nepjol.info/index.php/IJSSM/issue/archive
Perceived Brand Globalness- Impact on Women Consumer Response
in Indian Fashion and Lifestyle Market
Karan Khurana1*
EiTEX, Bahir Dar University, Ethiopia.
Abstract This study aims to investigate the effects of perceived brand globalness (PBG) on consumer affective and behavioral responses
to brand failures and for how consumer perceives global and local brands and their responses in the event of failure present or
absent related to brand performance and brand familiarity, brand presence and prestige, brand equity, product country match,
country ethnocentrism.
This research is conducted in regards to women consumers in two cities in North India related to global and local brands with
impact of perceived brand globalness to brand failures present or absent scenario based on consumer responses. The research
explored into four main factors as dependent variables on which PBG effects are examined and observed in failure present as
well as failure absent scenario. This research consists of mainly two studies and two preliminary tests. Study 1 is executed
basically to investigate and to test consumer responses towards brand failures of fictitious brands. Study 2 is designed to
examine consumer responses to brand failures of established brands.
The study found that PBG effects are more positive on Global brands as compared to the local brands and concluded that
consumer is less negative and less impulsive to the global brands when they met failure scenario. The study could not find any
significance and examined that customer ethnocentrism does not interrupt with buying behavior. This research was able to test
whether global brands are still perceived superior to local brands in the context of Indian consumer and also test whether the
effects of PBG on consumer responses to brand failures will be mediated by consumer attribution as blaming or fault
accountable in the event of encountering.
Keywords: Consumer Behavior; Perceived Brand Globalness (PBG); Brand Failures, Consumer Ethnocentrism
(CET); Indian Market.
Introduction
Globalization has become a development trend of the
business world with no doubts. The advantages of building
global brands are well recognized in literature. Although the
advantages of global brands to brand value are well
Cite this article as:
K. Khurana (2018) Int. J. Soc. Sc. Manage. Vol. 5, Issue-1: 18-30. DOI: 10.3126/ijssm.v5i1.19005
1*Corresponding author
Karan Khurana,
EiTEX, Bahir Dar University, Ethiopia
Email: [email protected]
Peer reviewed under authority of IJSSM
© 2018 International Journal of Social Sciences and Management
This is an open access article & it is licensed under a Creative Commons Attribution 4.0 International License
(https://creativecommons.org/licenses/by/4.0/)
supported by literature, the effects of global brands in brand
failure context are not yet tested. Brand failures as common
cases happen to our lives every day. Even big companies
cannot guarantee their brands never ever fail their
customers. Haig (2005) wrote a book listing up the most
Research Article
K. Khurana (2018) Int. J. Soc. Sc. Manage. Vol. 5, Issue-1: 18-30
Full text of this paper can be downloaded online at www.ijssm.org/ &http://nepjol.info/index.php/IJSSM/issue/archive
famous 100 brand failures happened to brands such as Dell,
Toyota, Sony, McDonald’s, Maggi Noodles recently etc.
Haig’s book described the severe consequences caused by
these brand failures. It is really important and necessary to
investigate the proper actions to take after brand failures to
fix the negative influences.
The concerned study is an attempt to conceptually identify
and empirically test the interrelations between perceived
brand globalness and its impact on Consumer satisfaction,
consumer quality perception, consumers’ purchase
intention, and word of mouth mediated by consumer
attribution and moderated by consumer ethnocentrism.
Many literatures test the positive effects of global branding
on product evaluations (Keller, 2008; Keller and Aaker,
1992). This research study will focus on the impacts of
global branding on consumer responses in brand failure
context.
Whether a brand is a global brand or not can be measured
from various aspects, for instance, the distributional
geographical areas of the brands or the marketing strategies
of the brands in different countries. Steenkamp et al. (2003)
proposed that the perceived brand globalness (PBG) by
consumers would create brand value. They measured
whether a brand is global in perspectives of consumers.
Their study found that PBG positively influenced the
perceived brand quality and brand prestige and then through
the two pathways positively influenced the purchase
likelihood. It is important to investigate the effects of global
brands from the perspectives of consumers, since whether
the brand is successfully positioned as a global brand is
finally evaluated by the consumers.
Aim of the Research
This research will test whether global brands are
still perceived superior to local brands in the
context of brand failures. The research
hypothesizes that PBG is positively related to
consumer behavioral and attitudinal intentions
after brand failures happened. The effects of the
PBG on consumer responses to brand failures are
explained by attribution theory. Folkes and Kotsos
(1986) found that the discrepancies in buyer-seller
attribution of product failure were due to how
commonly they believed the product failure
happened. If the failure is believed to happen
commonly, the failure will be more likely
attributed to the fault of the product. Because of
the high-quality perception of global brands,
consumers may believe the failure of global brand
as not commonly happened cases. Consumers will
attribute the failures of global brands happening to
them being experienced by few people. Compared
with local brands consumers may attribute the
failure of the global brands to an accident but not
the fault of the global brand. Therefore, in the same
failure context, consumer behavioral and
attitudinal responses to global brands are less
negatively than local brands.
This research will probe into consumers’
considering process when facing to brand failures.
Attribution theory will be adopted to explain
consumer different reactions to the same failures
happen to high PBG and low PBG brands
respectively.
Third, it will test the moderating role of consumer
ethnocentrism (CET) on Indian consumers under
the context of brand failures. Regarding the
moderating effect of CET on the relationship
between PBG and consumer responses, there are
inconsistent findings in literature.
Finally, it will explore the facts and shall test
whether the effects of PBG on consumer responses
to brand failures will be mediated by consumer
attribution as blaming or fault accountable in the
event of encountering.
Literature Review
Global Vs Local Brands
“It’s commonly agreed that global brands are the one that
consumers can find under the same name in multiple
countries with generally similar and centrally coordinated
marketing strategies” (Yip, 1995); whereas the local brand
are developed for a specific national market. What makes
local brands strong is “their being local; these are often
more than brands, they are institutions” (Kapferer, 1997).
The advantages of building global brands are well
recognized in literature. First of all, the economies of scale
save the cost of manufacturing, distribution (Keller, 2008),
RandD, and marketing communications (Yip, 1995).
Second, global brands are globally accepted and available.
The broad scope of the global brands is perceived by
consumers as the indications of global brands’ expertise and
superior to local brands (Kapferer, 1997; Keller, 2008;
Shocker et al., 1994). Third, the consistency of brand image
and marketing strategies of global brands allow less time
consuming in local modification and better control of the
quality (Keller, 2008; Neff, 1999). This makes global
management more efficient and less cost consuming.
High PBG Vs Low PBG Brands
In this research study the brand which is perceived more
available globally and is available all across the world is a
global brand more a brand is perceived global by a
consumer, it has high PBG, therefore in the concerned
research study the global brands are represented as High
PBG brands and local brands are represented as Low PBG
brands those which are not available across the world but
K. Khurana (2018) Int. J. Soc. Sc. Manage. Vol. 5, Issue-1: 18-30
Full text of this paper can be downloaded online at www.ijssm.org/ &http://nepjol.info/index.php/IJSSM/issue/archive
they have their presence at domestic or national level in one
country or region.
The Emergence of PBG
Regarding the definition and measurement of global brands,
there are two main schools in literature. The first school
defines global brands as the brands can be found under the
same name in multiple countries with similar and
coordinated marketing strategies (Branch, 2001; Levitt,
1983; Yip, 1995). In these studies, global brands refer to the
extent to which brands adopt t the standardized marketing
strategies in various geographical areas.
Recently another school of research in global brands
emerged and defined the global brands as the extent to
which brands are perceived to be globally available and
accepted by consumers (Alden et al.2006; Batra et al.2000;
Steenkamp et al.2003). These studies measure global
brands in the perspectives of consumers.
Steenkamp et al. (2003) as the representatives of the second
school, for the first time proposed the term of perceived
brand globalness (PBG), which means the extent to which
consumers perceive a brand to be global. For example, if a
brand is highly perceived by consumers to be available in
other countries outside of their own, the brand has high
PBG.
No matter which research stream, one of the most important
features of global brand is its global availability and
acceptance (Kapferer, 1997; Keller, 2008). The
distinctiveness between the two schools is the point of view
from which the brands are measured to be global.
This research will focus on the consumer responses and
feelings. Therefore, I will follow the second stream and
measure the brands from consumer views. Literature
suggests that the brands with global image are perceived
with higher brand value and better quality than local brands,
even the objective features are not superior (Kapferer,1997;
Shocker et al.1994). Batra et al. (2000) tested consumer
attitudes toward local and non-local brands in India. In their
study, non-local brands refer to the brands which are not
only consumed by local customers but also by customers
abroad. In other words, the non-local brands are available in
multiple markets. Furthermore, Batra et al. (2000) found
that consumers in developing country have more positive
attitudes toward non-local brands than local brands for the
scarcity of the non-local brands. This is explained by the
relatively less affluent sources in developing countries,
where owning a global brand is a sign of high social status.
However, the effects of global brands on consumer attitudes
do not only exist in developing countries. Consumers
believe the high brand quality as an essential feature for a
brand being accepted globally. Steenkamp et al. (2003)
tested the effects of PBG in consumers from Korea and US.
They proposed the pathways through which PBG creates
brand value. Their study found that PBG positively
influences the perceived brand quality and brand prestige
and then through the two pathways positively influence the
purchase likelihood. The effects of PBG exist in both
Korean and US consumers.
High Involvement Vs Low Involvement Products
As seen, many factors influence a consumer’s behavior.
Depending on a consumer’s experience and knowledge,
some consumers may be able to make quick purchase
decisions and other consumers may need to get information
and be more involved in the decision process before making
a purchase. The level of involvement reflects how
personally important or interested you are in consuming a
product and how much information you need to make a
decision. The level of involvement in buying decisions may
be considered a continuum from decisions that are fairly
routine (consumers are not very involved) to decisions that
require extensive thought and a high level of involvement.
Whether a decision is low, high, or limited, involvement
varies by consumer, not by product, although some products
such as purchasing a house typically require a high-
involvement for all consumers. Consumers with no
experience purchasing a product may have more
involvement than someone who is replacing a product.
Consumers often engage in routine response behavior when
they make low-involvement decisions—that is, they make
automatic purchase decisions based on limited information
or information they have gathered in the past. Consumers
buy either products or services. While making such
purchases, consumers display high or low involvement.
High-involvement products are those that represents the
consumer’s personality, status and justifying lifestyle; for
example, buying a home theatre, premium watches, jewelry
(diamond and gold), branded apparel, hair color
(L’Oréal/Revlon) and sportswear apparel. In contrast, low-
involvement products are those that reflect routine purchase
decisions; for example, buying a candy or an ice cream, hair
comb, bathing soap, body deo/spray.
The Moderating Role of CET
On the contrary of global product preference, consumer
ethnocentrism (CET) is a bias of home country product
preference (Shimp and Sharma, 1987). Although CET bias
is confused with Country of origin (COO) bias, they are
distinct and independent concepts. Herche (1992)
conducted a study to explain the difference between CET
bias and COO bias. For example, a US customer may prefer
the French wine because of the COO bias and still not buy
it due to the CET bias. Therefore, CET is a kind of general
tendency of home country made products preference.
Previous research has documented the enhanced appeal of
global brands among certain segments, such as teenagers
and businesspeople (Hassan and Katsanis, 1994; Walker,
1996). In this study, I examine the moderating role of CET.

K. Khurana (2018) Int. J. Soc. Sc. Manage. Vol. 5, Issue-1: 18-30
Full text of this paper can be downloaded online at www.ijssm.org/ &http://nepjol.info/index.php/IJSSM/issue/archive
CET is defined as 'the beliefs held by consumers about the
appropriateness, indeed morality, of purchasing foreign-
made products' (Shimp and Sharma, 1987). Ethnocentric
consumers take pride in their country's brands, symbols, and
culture. They are less open to foreign cultures, and are less
cosmopolitan. CET is closely linked to economic
nationalism (Baughn and Yaprak, 1996). In the thinking
underlying economic national-ism, local brands provide a
link between the national economy and individual well-
being. Global brands may be viewed suspiciously as a threat
to national economic prosperity. In the mind of ethnocentric
consumers, global brands pose not only an economic but
also a cultural threat. Lower levels of cosmopolitanism and
openness to foreign cultures further contribute to negative
evaluations of global brands by more ethnocentric
consumers. Ethnocentric consumers may even be willing to
sacrifice 'objective' gain (higher quality, lower price, etc.)
to enjoy the psychological benefit of avoiding contact with
the out-group (i.e., the global culture) by purchasing local
brands (Baughn and Yaprak, 1996). On the other hand,
consumers low on CET are more cosmopolitan in outlook
and have a higher degree of cultural openness (Baughn and
Yaprak, 1996).
Furthermore, the CET is heavily related to the economic
development status of the country. For instance, studies
found that people in developed countries always have
stronger preference of the home country made products than
people from developing countries. Therefore, literature
reported different results regarding the moderating role of
CET on product evaluations. Batra et al. (2000) reported no
moderating effect of CET was found in the relationship
between brand non localness and brand attitude. Steenkmap
et al. (2003) found that CET will moderate the effects of the
PBG on brand purchase likelihood. These studies were
conducted in different countries. Batra’s study tested the
effects of CET in Indian consumers. However, Steenkamp
et al.’s study was conducted in consumers from US and
Korea, which are much more developed than India. The
difference between the consumers from developed and
developing countries per se may cause the different findings
in the moderating role of CET. In this thesis, Indian
consumer responses will be tested. Since India is a
developing country, the moderating role of CET in the
relationship between brand failure and consumer responses
may be not supported.
Steenkamp et al. modified the original CETSCALE to a four
items scale which was found have the as high reliability as
the original one. Since this research is also mainly testing
the effects of PBG on consumer responses to brand failures,
which is quite similar concept to what was tested in
Steenkamp’s study, the four items are adopted in the
CETSCALE to be used in this research as well.
Hypothesis
In view of the fact that global brands are perceived better
and superior to local brands, the failure happens to the
global brand is more likely to be thought as accidental or
incidental or something beyond the control of the company
management. Accordingly, it is proposed that, when a brand
which is highly perceived as a global one encounters a
failure accidently, consumers should be more likely to
attribute the failure to other external reasons rather than the
brand itself because of the high perceived quality and
prestige of global brand. The consumer treats the failure as
occasionally happened incident to a brand which is
perceived as a high PBG brand and vice-versa to a low PBG
brand. Considering this Hypothesis 1 (H1) is proposed as
below:
H1: Considering consumer response towards brand
failures, Consumers are less dissatisfied with the
brands with high PBG Vs low PBG brands.
The brand presence all over the world outlets are global
brands. Global brands are known as globally available
which is attributed by the consumers to be the indication of
its high quality (Kapferer, 1997; Keller, 2008). Empirical
test supports the positive relationship between PBG and
perceived brand quality (Steenkamp et al.2003). Literature
suggests that consumer preference for brands with global
image over local ones is on higher preference even when the
real quality of the global brands is not objectively superior
(Kapferer, 1997; Shocker et al.1994). For this reason, when
there is a brand failure the high PBG will serve as a buffer
to moderate the decline of the perceived brand quality. The
perceived brand quality of the high PBG brands is higher
than low PBG brands after brand failures take place or
ensued. Considering the aforementioned facts hypothesis 2
(H2) is proposed as below:
H2: Considering consumer response towards brand
failures, Consumers have higher perception for the
quality of brands with high PBG Vs Low PBG brands.
In a brand failure context, dissatisfied consumers are very
likely to engage in further behavioral intentions. In
literature, the commonly agreed behavioral intentions are
negative word of mouth (WOM) and exit (in purchase
context should be not to purchase again) (Cronin et al.,
2000; Singh, 1988; Zeithaml et al., 1996). All these
complaint behavioral intentions are positively related to
dissatisfaction and negatively related to consumer quality
perception. It is not hard to understand that the more a
customer dissatisfied with the brand, the lower quality
perception they hold on it and the more likely they are to
transmit the negative WOM or decide to not purchase the
brand again. WOM transmitting and purchase decision
making are both the behavioral intentions following the
attitudinal intentions, customer satisfaction and quality
perception. Therefore, If the above two hypotheses are

K. Khurana (2018) Int. J. Soc. Sc. Manage. Vol. 5, Issue-1: 18-30
Full text of this paper can be downloaded online at www.ijssm.org/ &http://nepjol.info/index.php/IJSSM/issue/archive
supported, for the brands with higher level of PBG
consumers are less likely to transmit negative WOM and
less likely to not purchase it again. Considering this fact
hypothesis 3 is proposed:
H3: Considering consumer response towards brand
failures, Consumers are restraint to convey negative
word of mouth (WOM) for brands with High PBG than
low PBG brands.
H4: Considering consumer response towards brand
failures, Consumers repurchase intentions are higher
for brands with high PBG than low PBG brands.
As found in Steenkamp et al.’s study that the effects of PBG
will be moderated by CET. The more ethnocentric
consumers the less they prefer the high PBG brand to low
PBG brand. When encountering failures, the ethnocentric
consumers will blame the high PBG brand more severely.
This is consistent with their prior belief that buying high
PBG brand is a threat to home country’s economy. In this
case, the more ethnocentric consumers will respond more
negatively to the brand failures. Considering this
Hypothesis -H5 is proposed, stating that the effects of the
PBG on consumer responses to brand failures will be
moderated by CET.
H5: Considering consumer response towards brand
failures the impact of PBG will be weaker for more
ethnocentric consumers.
People have tendency to attribute the failures differently
when happening in case of global and local brands
perceived as High PBG and Low PBG brands respectively.
If the failure happens to a brand with higher perceived
prestige, which seldom frustrates users, consumers may be
more likely to attribute the failure to some other reasons out
of control of the brand per se. Because of the perceived
usually high quality or good performance of the global
brands, the cause of the failure being the accidental case is
more rational than the cause of the failure being the poor
quality of the brand. If the quality of the high PBG brand if
poor, there should be no reason for customers all over the
world to accept and buy the product.
When consumers experience the brand failures, they firstly
attribute the reason of the failure then take different
reactions based on the attributed results. Compared with
low PBG brand, consumers are more likely to believe the
reason of the failure happening to the high PBG as
accidental, out of control and not very likely to happen
again. Once the cause of the failure is believed to be an
external reason, the brand per se will be blamed less.
Therefore, based on the attribution results, consumer
responses to brand failures of high PBG brand is less
negatively than low PBG brand. On the ground of the above
logic, it is proposed that consumer responses to brand
failures will be partially mediated by consumer attribution
results.
H6: Considering consumer response towards brand
failures the impact of PBG will be partially mediated
by consumer attribution results of the failure.
Research Methodology
A structured questionnaire was prepared and presented to
the respondents and related questions were asked.
Questionnaires mainly contained close-ended questions and
a few open-ended questions, to identify the reasons for
customer satisfaction and their dissatisfaction.
Under the secondary data, the company’s annual reports,
brochures, pamphlets, newspapers, journals and internet
were taken into consideration. Women of age group 25-40
years from north Indian cities of New Delhi and Jaipur were
targeted in this research study as they form the most
important consumer segment of fashion and lifestyle
products.
Research Design
The concerned research consists of mainly two studies and
two preliminary tests. In the research, Study 1 is executed
basically to investigate and to test consumer responses
towards brand failures of fictitious brands (untrue brands).
Since there are many original differences between the real
brands, such as brand familiarity and brand equity, the
effects of Perceived Brand Globalness on consumer
responses to brand failures of fictitious brands in an
assumed scenario presented to respondents (consumers) are
easier to test without interruption or presence of those
confounding variables. Therefore, the purpose of Study 1 is
to test the existence of the consequences of PBG effects on
consumer responses and ensure that the effects are not
caused by other variables. To generalize the research results
to the real market and the real brands actually present in the
market, Study 2 is designed to examine consumer responses
to brand failures of established brands. In Study 2, all
Confounding variables will be carefully controlled to ensure
the validity of the experimental results.
Pretest 1 is conducted to verify and validate the general
direction of the hypotheses as proposed; it confirms the
appropriate product categories to test in later studies and
finds out the problems in the construct of the questionnaires
for more refinement and improvisation. Pretest 2 asks
respondents to evaluate several selected brands and finds
out the target established brands with similar attributes and
characteristics. The established brands of the real market
that share common attributes found in Pretest 2 are then be
used as the target brands in Study 2. The purpose of Pretest
2 is to control the possible cofounding variables for the real
established brands of the market, such as brand familiarity
and brand equity.

K. Khurana (2018) Int. J. Soc. Sc. Manage. Vol. 5, Issue-1: 18-30
Full text of this paper can be downloaded online at www.ijssm.org/ &http://nepjol.info/index.php/IJSSM/issue/archive
Fig.1: Theoretical Model, Source: Author.
Instrument
The instrument used is a questionnaire construct with
maximum 22 items to be evaluated on a 7 point Likert scale
for each statement (Table 1).
Measurement Scales
All scales used in this study are well developed in literature
and have high reliability and validity. Only some minor
changes were conducted to the scales to better suit the
research topic and respondents of this study.
The scales adopted in the research include:
1. Brand familiarity scale (Steenkamp et al., 2003).
2. Brand Equity scale (Keller and Aaker, 1992).
3. Brand quality perception scale (Steenkamp et al.,
2003).
4. Perceived brand globalness scale (Batra et al.,
2000; Steenkamp et al., 2003).
5. Customer dissatisfaction scale (Oliver, 1997
Oliver, 1999; Roem and Brady, 2007).
6. Negative WOM scale (Chan and Wan ,2008),
7. Customer purchase intention scale (Dodds et al.,
1991; Steenkamp et al., 2003).
8. CETSCALE (Shimp and Sharma, 1987;
Steenkamp et al., 2003).
Questionnaire Development
The questionnaire has been developed in such a way so as
to serve the purpose and objectives of the study. The
questionnaire for the consumers has been divided into two
sections- Technical Data (i.e. subject related data) and
Demographical Data. The questionnaire construct of
technical questions in the survey questionnaire are
structured, with multiple-choice questions, all items framed
by using Likert 7-point scale.
Reliability and Internal Consistency of Questionnaire
The consumer survey questionnaire has been evaluated
through testing of reliability and internal consistency, using
SPSS. Cronbach’s Alpha is used as a measure of internal
consistency, i.e. do all the items within the instrument
measure the same thing. The closer the Alpha value is
towards 1.00, the greater the internal consistency of items
in the instruments being assessed. The formula for
determining Alpha makes use of the number of items in the
scale (k) and the average correlation between pairs of items.
The Cronbach’s Alpha for the questionnaire worked out to
0.85, which is very close to 1. Hence, the questionnaire is
reliable and internally consistent.
The questionnaire from the consumer’s point of view
consisted of 31 questions, out of which 4 questions are
related to CET, and 5 questions are related to
Demographical aspects. The balance 22 questions are
technical questions, using the Likert 7 point scale and
dichotomous scales. The questions are framed in such a
manner so as to address the research objectives.
Sample Selection, Survey and Data Collection
In this research study, the total sample size taken is N=200,
with differing size in both the pretests and study 1 and study
2, which is at 95% Confidence Level, at 5% margin of error
and 50% response distribution, to make the sample as
representative as possible. As stimuli, the present study has
considered twelve well-known brands those who have
extended to various products. The twelve well-known
brands have been selected from the category of Women –
lifestyle and fashion, that includes Maybelline lip balm and
Himalaya lip balm; Titan and Rado watch; D’dmas and
Tanishq jewelry; Zara and Allen Solly (apparel); VLCC and
Lakme beauty and wellness services; L’Oreal and Streax
hair color. Out of twelve target brands one pair of apparel
brand Zara and Allen Solly has been selected as global and
local brands as final target brands to be evaluated in the final
study 2.
Survey includes questionnaire, which is online
questionnaire and hard copy distribution at various public
places like restaurants, malls and cinema halls, Food courts
and public parks.
Table 1: 7 point Likert scale used for evaluation.
Disagree strongly Disagree Disagree slightly Neutral Agree slightly Agree Agree strongly
1 2 3 4 5 6 7
K. Khurana (2018) Int. J. Soc. Sc. Manage. Vol. 5, Issue-1: 18-30
Full text of this paper can be downloaded online at www.ijssm.org/ &http://nepjol.info/index.php/IJSSM/issue/archive
Covariates
Three sets of covariates were identified initially. First,
brand familiarity was identified as a covariate since we
started from pretest 1 and pretest 2 that included a focus
group interview to control the factor Brand Familiarity; i.e.
brand is familiar to customer to what extent. Brand
familiarity is included because previous research suggests
that it may have an important impact on perceived brand
quality, brand prestige, WOM and re-purchase likelihood,
whether or not a brand is perceived as global (Keller, 2008).
Second, Brand Equity in pretest 2 did selected one target
brand to be evaluated in the final study 2 out of the four
pairs of global and local brands. Pretest 2 measures similar
Brand Equity for apparel brand ZARA (Global) and Allen
Solly (Local) that shared almost similar brand equity and In
final study 2 Brand Equity as a covariate is included to
control for the possibility that a certain global brand may
attain higher satisfaction, prestige, quality, and/or purchase
likelihood because it comes from a particular foreign
country, rather than because it is global. Finally, we created
and add brand dummies for global and local brands which
were created to the analyses to control for unobserved,
brand-specific effects Controlling for all these variables
provides a stronger test of our hypotheses.
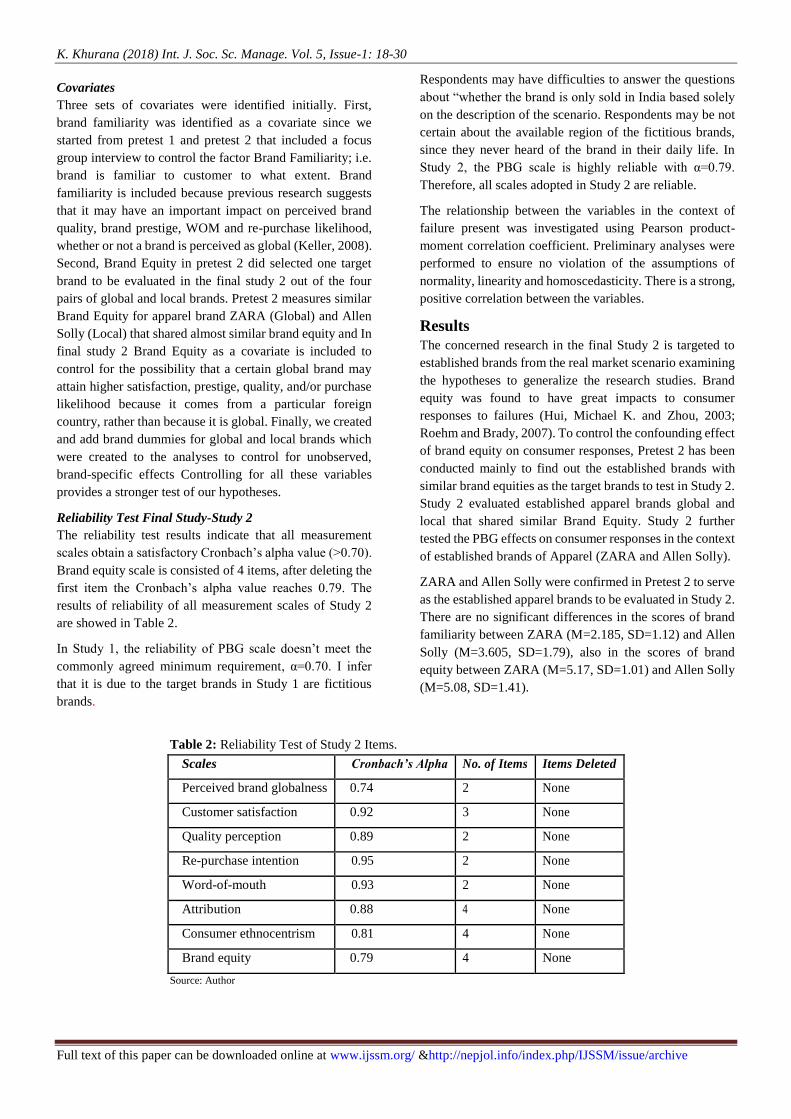
Reliability Test Final Study-Study 2
The reliability test results indicate that all measurement
scales obtain a satisfactory Cronbach’s alpha value (>0.70).
Brand equity scale is consisted of 4 items, after deleting the
first item the Cronbach’s alpha value reaches 0.79. The
results of reliability of all measurement scales of Study 2
are showed in Table 2.
In Study 1, the reliability of PBG scale doesn’t meet the
commonly agreed minimum requirement, α=0.70. I infer
that it is due to the target brands in Study 1 are fictitious
brands.
Respondents may have difficulties to answer the questions
about “whether the brand is only sold in India based solely
on the description of the scenario. Respondents may be not
certain about the available region of the fictitious brands,
since they never heard of the brand in their daily life. In
Study 2, the PBG scale is highly reliable with α=0.79.
Therefore, all scales adopted in Study 2 are reliable.
The relationship between the variables in the context of
failure present was investigated using Pearson product-
moment correlation coefficient. Preliminary analyses were
performed to ensure no violation of the assumptions of
normality, linearity and homoscedasticity. There is a strong,
positive correlation between the variables.
Results
The concerned research in the final Study 2 is targeted to
established brands from the real market scenario examining
the hypotheses to generalize the research studies. Brand
equity was found to have great impacts to consumer
responses to failures (Hui, Michael K. and Zhou, 2003;
Roehm and Brady, 2007). To control the confounding effect
of brand equity on consumer responses, Pretest 2 has been
conducted mainly to find out the established brands with
similar brand equities as the target brands to test in Study 2.
Study 2 evaluated established apparel brands global and
local that shared similar Brand Equity. Study 2 further
tested the PBG effects on consumer responses in the context
of established brands of Apparel (ZARA and Allen Solly).
ZARA and Allen Solly were confirmed in Pretest 2 to serve
as the established apparel brands to be evaluated in Study 2.
There are no significant differences in the scores of brand
familiarity between ZARA (M=2.185, SD=1.12) and Allen
Solly (M=3.605, SD=1.79), also in the scores of brand
equity between ZARA (M=5.17, SD=1.01) and Allen Solly
(M=5.08, SD=1.41).
Table 2: Reliability Test of Study 2 Items.
Scales Cronbach’s Alpha No. of Items Items Deleted
Perceived brand globalness 0.74 2 None
Customer satisfaction 0.92 3 None
Quality perception 0.89 2 None
Re-purchase intention 0.95 2 None
Word-of-mouth 0.93 2 None
Attribution 0.88 4 None
Consumer ethnocentrism 0.81 4 None
Brand equity 0.79 4 None
Source: Author
K. Khurana (2018) Int. J. Soc. Sc. Manage. Vol. 5, Issue-1: 18-30
Full text of this paper can be downloaded online at www.ijssm.org/ &http://nepjol.info/index.php/IJSSM/issue/archive
An independent samples T-test was conducted to compare
the means of PBG between global and local brands. The
means of failure present and failure absent were also
compared with the same method. For PBG manipulation,
there is significant difference in scores for global brand
(M=4.00, SD=0.5180) and local brand [M=2.25, SD=0.62;
t (120) =10.99, p<0.001]. For brand failure manipulation,
significant difference in scores for Failure present (M=3.59,
SD=1.02) and failure absent [M=5.01, SD=0.77; t (120) =-
9.15, p<0.001] scenarios is also found.
Test of Hypothesis
A commonly well-established procedure is combining the
construct items on Likert-scales into summated ratings or
average summated scores. The new transformed composite
variable is comparable in scaling to the original scale (Hair
et al., 2007). This approach, typically leads to precise
structural estimates, provided the measures are
unidimensional (Bandalos, 2002) as is the case in this study
of brand failures and consumer responses. To validate the
hypotheses and estimate the structural relations between the
constructs the items were averaged for each scale to obtain
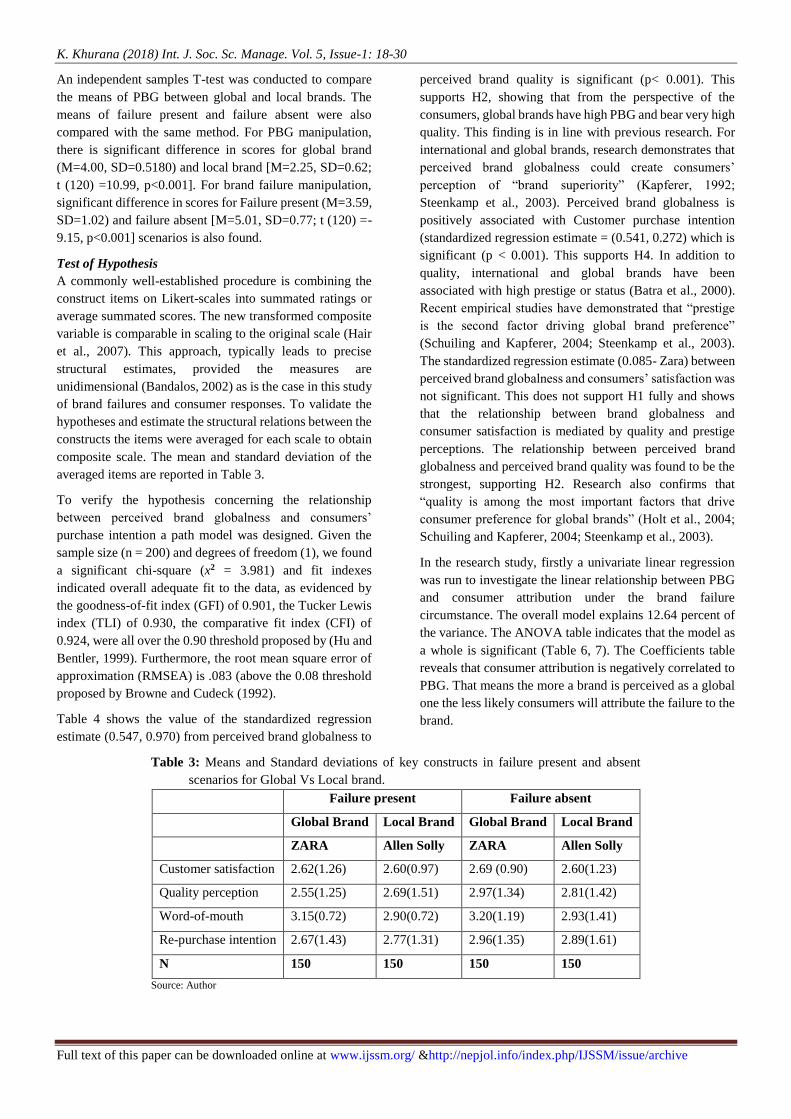
composite scale. The mean and standard deviation of the
averaged items are reported in Table 3.
To verify the hypothesis concerning the relationship
between perceived brand globalness and consumers’
purchase intention a path model was designed. Given the
sample size (n = 200) and degrees of freedom (1), we found
a significant chi-square (x2 = 3.981) and fit indexes
indicated overall adequate fit to the data, as evidenced by
the goodness-of-fit index (GFI) of 0.901, the Tucker Lewis
index (TLI) of 0.930, the comparative fit index (CFI) of
0.924, were all over the 0.90 threshold proposed by (Hu and
Bentler, 1999). Furthermore, the root mean square error of
approximation (RMSEA) is .083 (above the 0.08 threshold
proposed by Browne and Cudeck (1992).
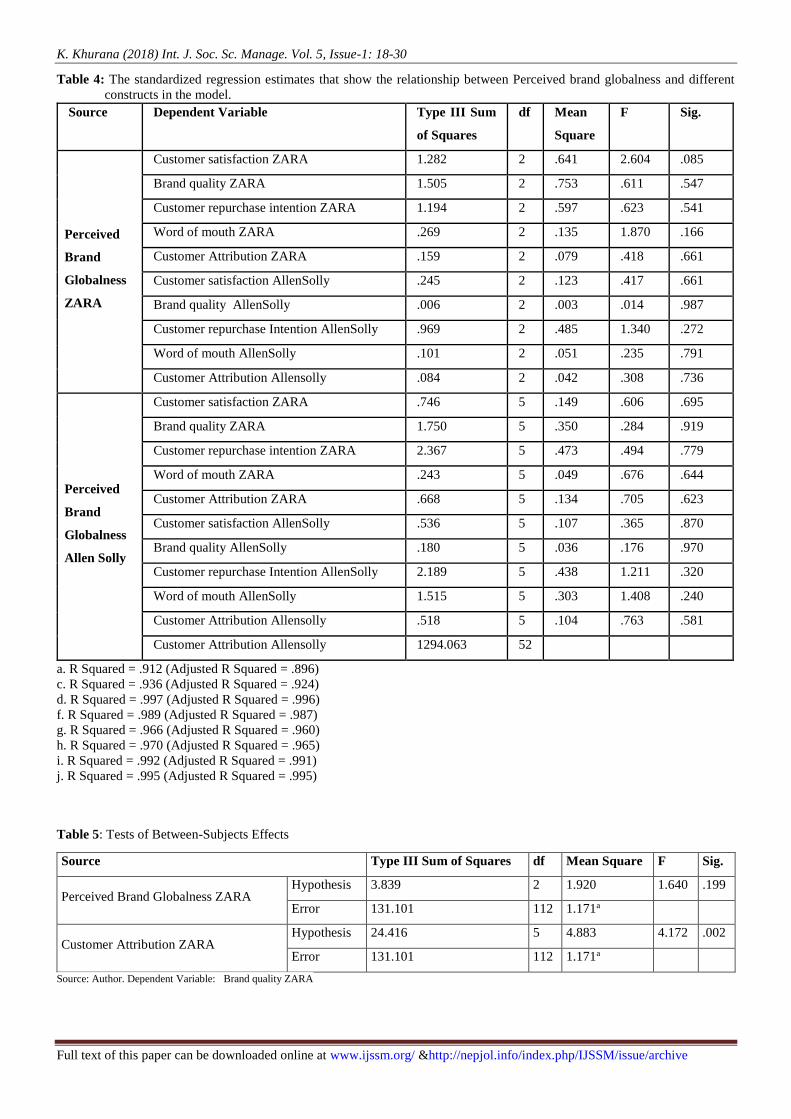
Table 4 shows the value of the standardized regression
estimate (0.547, 0.970) from perceived brand globalness to
perceived brand quality is significant (p< 0.001). This
supports H2, showing that from the perspective of the
consumers, global brands have high PBG and bear very high
quality. This finding is in line with previous research. For
international and global brands, research demonstrates that
perceived brand globalness could create consumers’
perception of “brand superiority” (Kapferer, 1992;
Steenkamp et al., 2003). Perceived brand globalness is
positively associated with Customer purchase intention
(standardized regression estimate = (0.541, 0.272) which is
significant (p < 0.001). This supports H4. In addition to
quality, international and global brands have been
associated with high prestige or status (Batra et al., 2000).
Recent empirical studies have demonstrated that “prestige
is the second factor driving global brand preference”
(Schuiling and Kapferer, 2004; Steenkamp et al., 2003).
The standardized regression estimate (0.085- Zara) between
perceived brand globalness and consumers’ satisfaction was
not significant. This does not support H1 fully and shows
that the relationship between brand globalness and
consumer satisfaction is mediated by quality and prestige
perceptions. The relationship between perceived brand
globalness and perceived brand quality was found to be the
strongest, supporting H2. Research also confirms that
“quality is among the most important factors that drive
consumer preference for global brands” (Holt et al., 2004;
Schuiling and Kapferer, 2004; Steenkamp et al., 2003).
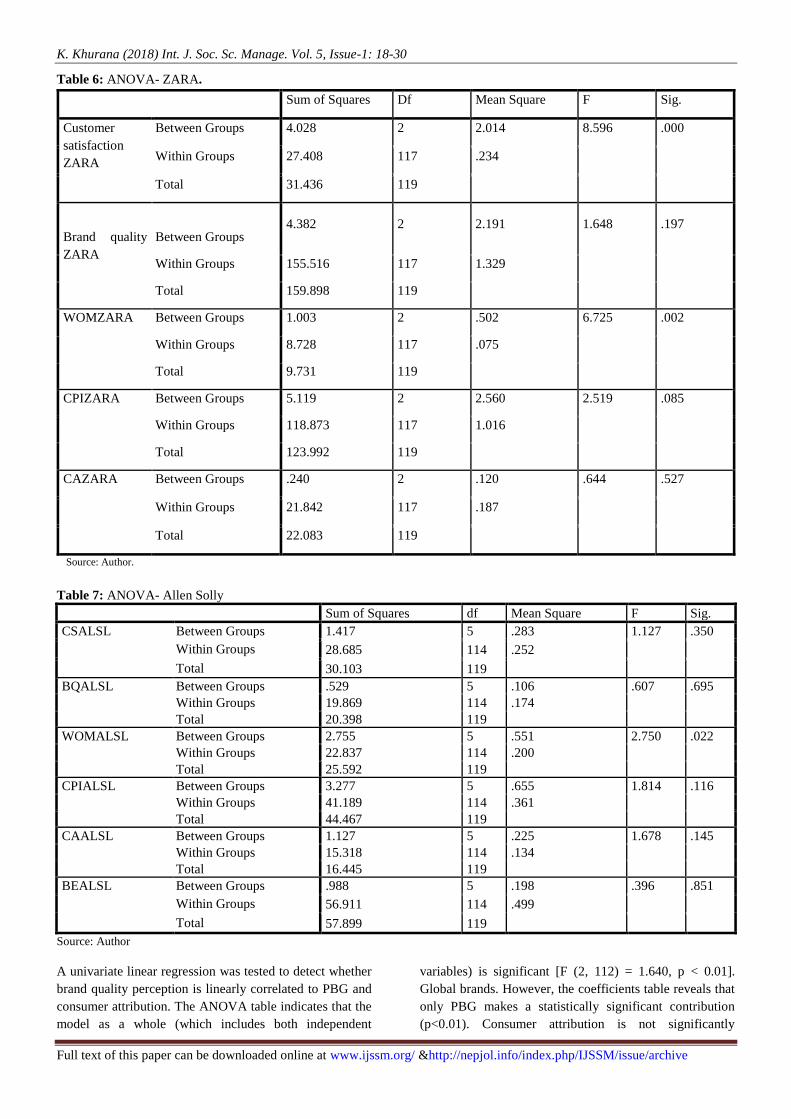
In the research study, firstly a univariate linear regression
was run to investigate the linear relationship between PBG
and consumer attribution under the brand failure
circumstance. The overall model explains 12.64 percent of
the variance. The ANOVA table indicates that the model as
a whole is significant (Table 6, 7). The Coefficients table
reveals that consumer attribution is negatively correlated to
PBG. That means the more a brand is perceived as a global
one the less likely consumers will attribute the failure to the
brand.
Table 3: Means and Standard deviations of key constructs in failure present and absent
scenarios for Global Vs Local brand.
Failure present Failure absent
Global Brand Local Brand Global Brand Local Brand
ZARA Allen Solly ZARA Allen Solly
Customer satisfaction 2.62(1.26) 2.60(0.97) 2.69 (0.90) 2.60(1.23)
Quality perception 2.55(1.25) 2.69(1.51) 2.97(1.34) 2.81(1.42)
Word-of-mouth 3.15(0.72) 2.90(0.72) 3.20(1.19) 2.93(1.41)
Re-purchase intention 2.67(1.43) 2.77(1.31) 2.96(1.35) 2.89(1.61)
N 150 150 150 150
Source: Author
K. Khurana (2018) Int. J. Soc. Sc. Manage. Vol. 5, Issue-1: 18-30
Full text of this paper can be downloaded online at www.ijssm.org/ &http://nepjol.info/index.php/IJSSM/issue/archive
Table 4: The standardized regression estimates that show the relationship between Perceived brand globalness and different
constructs in the model.
a. R Squared = .912 (Adjusted R Squared = .896)
c. R Squared = .936 (Adjusted R Squared = .924)
d. R Squared = .997 (Adjusted R Squared = .996)
f. R Squared = .989 (Adjusted R Squared = .987)
g. R Squared = .966 (Adjusted R Squared = .960)
h. R Squared = .970 (Adjusted R Squared = .965)
i. R Squared = .992 (Adjusted R Squared = .991)
j. R Squared = .995 (Adjusted R Squared = .995)
Table 5: Tests of Between-Subjects Effects
Source Type III Sum of Squares df Mean Square F Sig.
Perceived Brand Globalness ZARA Hypothesis 3.839 2 1.920 1.640 .199
Error 131.101 112 1.171a
Customer Attribution ZARA Hypothesis 24.416 5 4.883 4.172 .002
Error 131.101 112 1.171a
Source: Author. Dependent Variable: Brand quality ZARA
Source Dependent Variable Type III Sum
of Squares
df Mean
Square
F Sig.
Perceived
Brand
Globalness
ZARA
Customer satisfaction ZARA 1.282 2 .641 2.604 .085
Brand quality ZARA 1.505 2 .753 .611 .547
Customer repurchase intention ZARA 1.194 2 .597 .623 .541
Word of mouth ZARA .269 2 .135 1.870 .166
Customer Attribution ZARA .159 2 .079 .418 .661
Customer satisfaction AllenSolly .245 2 .123 .417 .661
Brand quality AllenSolly .006 2 .003 .014 .987
Customer repurchase Intention AllenSolly .969 2 .485 1.340 .272
Word of mouth AllenSolly .101 2 .051 .235 .791
Customer Attribution Allensolly .084 2 .042 .308 .736
Perceived
Brand
Globalness
Allen Solly
Customer satisfaction ZARA .746 5 .149 .606 .695
Brand quality ZARA 1.750 5 .350 .284 .919
Customer repurchase intention ZARA 2.367 5 .473 .494 .779
Word of mouth ZARA .243 5 .049 .676 .644
Customer Attribution ZARA .668 5 .134 .705 .623
Customer satisfaction AllenSolly .536 5 .107 .365 .870
Brand quality AllenSolly .180 5 .036 .176 .970
Customer repurchase Intention AllenSolly 2.189 5 .438 1.211 .320
Word of mouth AllenSolly 1.515 5 .303 1.408 .240
Customer Attribution Allensolly .518 5 .104 .763 .581
Customer Attribution Allensolly 1294.063 52
K. Khurana (2018) Int. J. Soc. Sc. Manage. Vol. 5, Issue-1: 18-30
Full text of this paper can be downloaded online at www.ijssm.org/ &http://nepjol.info/index.php/IJSSM/issue/archive
Table 6: ANOVA- ZARA.
Sum of Squares Df Mean Square F Sig.
Customer
satisfaction
ZARA
Between Groups 4.028 2 2.014 8.596 .000
Within Groups 27.408 117 .234
Total 31.436 119
Brand quality
ZARA
Between Groups 4.382 2 2.191 1.648 .197
Within Groups 155.516 117 1.329
Total 159.898 119
WOMZARA Between Groups 1.003 2 .502 6.725 .002
Within Groups 8.728 117 .075
Total 9.731 119
CPIZARA Between Groups 5.119 2 2.560 2.519 .085
Within Groups 118.873 117 1.016
Total 123.992 119
CAZARA Between Groups .240 2 .120 .644 .527
Within Groups 21.842 117 .187
Total 22.083 119
Source: Author.
Table 7: ANOVA- Allen Solly
Sum of Squares df Mean Square F Sig.
CSALSL Between Groups 1.417 5 .283 1.127 .350
Within Groups 28.685 114 .252
Total 30.103 119
BQALSL Between Groups .529 5 .106 .607 .695
Within Groups 19.869 114 .174
Total 20.398 119
WOMALSL Between Groups 2.755 5 .551 2.750 .022
Within Groups 22.837 114 .200
Total 25.592 119
CPIALSL Between Groups 3.277 5 .655 1.814 .116
Within Groups 41.189 114 .361
Total 44.467 119
CAALSL Between Groups 1.127 5 .225 1.678 .145
Within Groups 15.318 114 .134
Total 16.445 119
BEALSL Between Groups .988 5 .198 .396 .851
Within Groups 56.911 114 .499
Total 57.899 119
Source: Author
A univariate linear regression was tested to detect whether
brand quality perception is linearly correlated to PBG and
consumer attribution. The ANOVA table indicates that the
model as a whole (which includes both independent
variables) is significant [F (2, 112) = 1.640, p < 0.01].
Global brands. However, the coefficients table reveals that
only PBG makes a statistically significant contribution
(p<0.01). Consumer attribution is not significantly

K. Khurana (2018) Int. J. Soc. Sc. Manage. Vol. 5, Issue-1: 18-30
Full text of this paper can be downloaded online at www.ijssm.org/ &http://nepjol.info/index.php/IJSSM/issue/archive
correlated to quality perception. Same results are got from
the test between consumers re-purchase intention and PBG
and consumer attribution. The model as a whole (which
includes both independent variables) is significant [F (2,
112) = 4.78, p < 0.01]. However, consumer Attribution does
not make a significant contribution to the variance of
consumers re-purchases intention after brand failures.
Same method was used to investigate the mediating role of
consumer attribution in the relationship between PBG and
customer satisfaction, as well as the relationship between
PBG and WOM.
Results indicate that consumer attribution has a significant
contribution to both customer satisfaction [F (5, 119) =
1.27, P<0.01] and WOM [F (1, 119) = 2.750, P<0.01].
Before controlling the effect of attribution, PBG was found
to significantly influence consumer responses in all four
attitudinal and behavioral aspects. However, after
controlling the effect of attribution, the significant level of
PBG effect on customer satisfaction and word-of-mouth is
obviously decreased figures can be checked from the above
table (customer satisfaction, word-of-mouth). This indicates
that the effect of PBG on customer satisfaction and word-
of-mouth is partially mediated by attribution. Besides the
change in p values the non-standardized beta coefficients
values drop sharply for customer satisfaction and word–of-
mouth. The above statistics reveal the partial mediation
effect of attribution on the relationship between PBG and
customer satisfaction as well as the word-of-mouth from the
decrease in both values of p and non-standardized beta
coefficients.
Although the significant level of PBG effect on re-purchase
intention slightly drops after controlling the effect of
attribution, the 0.01 difference between p values does not
actually mean the statistical change. The decrease of the
non-standardized beta coefficients values for the two
dependent variables are too slightly to indicate any
mediation effects.
Attribution does not make a significant contribution to the
variance of consumer’s re-purchase intention after brand
failures. Same method was used to investigate the mediating
role of consumer attribution in the relationship between
PBG and customer satisfaction, as well as the relationship
between PBG and WOM. Results indicate that consumer
attribution has a significant contribution to both customer
satisfaction [F (5, 119) = 1.27, P<0.01] and WOM [F (1,
119) = 2.750, P<0.01].
Before controlling the effect of attribution, PBG was found
to significantly influence consumer responses in all four
attitudinal and behavioral aspects. However, after
controlling the effect of attribution, the significant level of
PBG effect on customer satisfaction and word-of-mouth is
obviously decreased figures can be checked from the above
table (customer satisfaction, word-of-mouth). This indicates
that the effect of PBG on customer satisfaction and word-
of-mouth is partially mediated by attribution. Besides the
change in p values the non-standardized beta coefficients
values drop sharply for customer satisfaction and word–of-
mouth. The above statistics reveal the partial mediation
effect of attribution on the relationship between PBG and
customer satisfaction as well as the word-of-mouth from the
decrease in both values of p and non-standardized beta
coefficients.
Although the significant level of PBG effect on re-purchase
intention slightly drops after controlling the effect of
attribution, the 0.01 difference between p values does not
actually mean the statistical change. The decrease of the
non-standardized beta coefficients values for the two
dependent variables are too slightly to indicate any
mediation effects.
The results listed in Table 4-6 reveal all the figures for the
partial mediating effect of attribution on the relationship
between PBG and customer satisfaction as well as the
relationship between PBG and word-of-mouth. No
mediating effects of attribution were found on the
relationship between PBG and quality perception or the
relationship between PBG and re-purchase intention.
Detailed reasons will be discussed in the conclusion part of
Study 2. H6 is partially supported.
Research Limitations and Directions for Future
Research
Although the research study contributes to both the
literature and business from several aspects, there are still
some limitations.
Customer Ethnocentrism
CET: The main limitation of sample selection in the
research lies in the low level of CET of the respondents.
There is no significant difference in the level of CET
between the respondents. In addition, the highly educated
respondents generally hold open attitude to foreign
product/brand. Therefore, the research could not conclude
for CET that does not have effects on all Indian consumer
respondents based on the results. From the futuristic point
of view, researchers can test the moderating effect of CET
in the samples with more age and cultural varieties and
diversity of population as a sample to get a deeper view into
Indian consumer attitudes to global brands.
Second, although the mediating role of consumer attribution
is supported in some cases, the reason for why consumers
are more likely to attribute the failures happened to low
PBG brands as the fault of the brands is worth interesting
and further investigation. Future research could probe into
the process of attribution and find out the reason behind the
cause inference results. Attribution is a more complex
response and change behavior and complicated process, and

K. Khurana (2018) Int. J. Soc. Sc. Manage. Vol. 5, Issue-1: 18-30
Full text of this paper can be downloaded online at www.ijssm.org/ &http://nepjol.info/index.php/IJSSM/issue/archive
will be influence by many internal and external factors.
Literature suggests a number of biases existing in the
process of attribution. All these are interesting points worth
considering and testing in the future research.
Third, only two product types (pretest 1), three fictitious
(Study 1) and two established brands were evaluated (Study
2) in the concerned research study. Apparel as tangible
product and Beauty and Wellness services as intangible
product were evaluated in the study. Product high and low
involvement product may have moderating effects on the
relationship between PBG and consumer responses. Pretest
1 did not find the significant effects of PBG on consumer
responses to the failures of Lip balm. Consumers pay less
attention to the brand of a low involvement product Lip
balm than Watch. Evaluations on the lip balm, which is a
low involvement product, do not differ much between
global and local brand when there is a failure. There could
be variety of brands category and researchers may test more
types of products with different levels of product
involvement in the future study to find out the difference
between consumer reactions to global and local brand.
Finally, the respondents were more responsive and only
reacted to one failure scenario. The severity of the failure
could have moderating role in the relationship between
consumer responses and brand failures. In addition, the
frequencies of failure should be another point worth of
considering. For example, generally as a common
perception global brand is superior to local brand even in
the context of failure. According to expectation theory, the
higher expectation consumers have toward the brand the
more dissatisfied they feel about the failure. In the research
study, the failure scenario was described with medium
severity and not commonly happened. However, if the
failures are more general and happened commonly, will
consumer have the same reaction and responses when the
failure happened once, twice or even more times? Future
researchers may test consumer responses to different
severity of failures. In addition, it is worth investigating the
threshold of failure happening frequencies to consumers
still respond less negatively to global brands than local
brands.
References Alden DL, Steenkamp JB, Batra R (2006) Consumer attitudes
toward marketplace globalization: Structure, antecedents
and consequences. International Journal of Research in
Marketing 23(3): 227-239.
Bandalos DL (2002) The effects of item parceling on goodness-
of-fit and parameter estimate bias in structural equation
modeling. Structural equation modeling 9(1): 78-102.
Batra R, Ramaswamy V, Alden DL, Steenkamp JB, Ramachander
S (2000) Effects of brand local and nonlocal origin on
consumer attitudes in developing countries. Journal of
consumer psychology 9(2): 83-95.
Batra R, Ramaswamy V, Alden DL, Steenkamp JBE and
Ramachander S (2000) Effects of brand local and nonlocal
origin on consumer attitudes in developing
countries. Journal of consumer psychology 9(2): 83-95.
Baughn CC and Yaprak A (1996) Economic nationalism:
Conceptual and empirical development. Political
Psychology 759-778.
Branch S (2001) AC Nielsen gives 43 brands global status. Wall
Street Journal 31: B8.
Browne MW and Cudeck R (1993). Alternative ways of assessing
model fit. Sage focus editions 154: 136-136.
Chan H and Wan LC (2008) Consumer responses to service
failures: a resource preference model of cultural
influences. Journal of International Marketing 16(1): 72-
97.
Cronin JJ, Brady MK and Hult GTM (2000) Assessing the effects
of quality, value, and customer satisfaction on consumer
behavioral intentions in service environments. Journal of
retailing 76(2): 193-218.
Dodds WB, Monroe KB and Grewal D (1991) Effects of price,
brand, and store information on buyers' product
evaluations. Journal of marketing research 307-319.
Folkes VS and Kotsos B (1986) Buyers' and sellers' explanations
for product failure: who done it? The Journal of Marketing
74-80.
Folkes VS (1984) Consumer reactions to product failure: An
attributional approach. Journal of consumer research
10(4): 398-409.
Haig M (2005) Brand failures: the truth about the 100 biggest
branding mistakes of all time. Kogan Page Publishers.
Hair JF, Money A, Samouel P and Page M (2007) Research
Methods for Business, Wiley, Chichester.
Hassan SS and Katsanis LP (1994) Global market segmentation
strategies and trends (pp. 47-62). New York: International
Business Press.
Herche J (1992) A note on the predictive validity of the
CETSCALE. Journal of the Academy of Marketing
Science 20(3): 261-264.
Holt DB, Quelch JA and Taylor EL (2004) How global brands
compete? Harvard Business Review 82(9): 68‐75.
Hu LT and Bentler PM (1998) Fit indices in covariance structure
modeling: Sensitivity to under parameterized model
misspecification. Psychological methods 3(4): 424.
Hui MK and Zhou L (2003) Country-of-manufacture effects for
known brands. European journal of marketing 37(1/2):
133-153.
Kapferer JN (1997) Strategic brand management: creating and
sustaining brand equity long term, 2. Auflage, London.
Keller KL and Aaker DA (1992) The effects of sequential
introduction of brand extensions. Journal of marketing
research 35-50.
Keller KL (2008) Strategic brand management: Building,
measuring, and managing brand equity. Upper Saddle
River, NJ: Pearson/Prentice Hall.
Levitt T (1983) The Globalization of Markets. Harvard Business
Review 61(3): 91-102.
Oliver RL (1997) Emotional expression in the satisfaction
response. Satisfaction: A behavioral perspective on the
consumer 291-325.
Oliver RL (1999) Whence consumer loyalty?.The Journal of
Marketing, 33-44.
Roehm ML and Brady MK (2007) Consumer responses to
K. Khurana (2018) Int. J. Soc. Sc. Manage. Vol. 5, Issue-1: 18-30
Full text of this paper can be downloaded online at www.ijssm.org/ &http://nepjol.info/index.php/IJSSM/issue/archive
performance failures by high-equity brands. Journal of
Consumer Research 34(4): 537-545.
Schuiling I and Kapferer JN (2004) Executive insights: real
differences between local and international brands:
strategic implications for international marketers. Journal
of International Marketing 12(4): 97-112.
Shimp TA and Sharma S (1987) Consumer ethnocentrism:
construction and validation of the CETSCALE. Journal of
marketing research 280-289.
Shocker AD, Srivastava RK and Ruekert RW (1994) Challenges
and opportunities facing brand management: An
introduction to the special issue. Journal of marketing
research 31(2): 149-158.
Singh J (1988) Consumer complaint intentions and behavior:
definitional and taxonomical issues. The journal of
Marketing 93-107.
Steenkamp JBE, Batra R and Alden DL (2003) How perceived
brand globalness creates brand value. Journal of
International Business Studies 34(1): 53-65.
Yip GS (1995) Instructor's Manual: Total Global Strategy:
Managing for Worldwide Competitive Advantage.
Prentice Hall.
Zeithaml VA, Berry LL and Parasuraman A (1996) The behavioral
consequences of service quality. The Journal of Marketing
31-46.