perceived benefits and risks towards the intention to …
TRANSCRIPT

PERCEIVED BENEFITS AND RISKS TOWARDS THE INTENTION TO USE FINTECH
CHONG JIA BAO
MASTER OF BUSINESS ADMINISTRATION
UNIVERSITI TUNKU ABDUL RAHMAN
FACULTY OF ACCOUNTANCY AND MANAGEMENT
APRIL 2019

Perceived Benefits and Risks towards the
Intention to use Fintech
Chong Jia Bao
A research project submitted in partial fulfilment of the
requirement for the degree of
Master of Business Administration
Universiti Tunku Abdul Rahman
Faculty of Accountancy and Management
April 2019

Perceived Benefits and Risks towards the
Intention to use Fintech
By
Chong Jia Bao
This research project is supervised by:
Dr. Ooi Chee Keong
Assistant Professor
Department of International Business
Faculty of Accountancy and Management

i
Copyright @ 2019
ALL RIGHTS RESERVED. No part of this paper may be reproduced, stored in a
retrieval system, or transmitted in any form or by any means, graphic, electronic,
mechanical, photocopying, recording, scanning, or otherwise, without the prior
consent of the authors.

ii
DECLARATION
I hereby declare that:
(1) This Research Project is the end result of my own work and that due
acknowledgement has been given in the references to all sources of information
be they printed, electronic, or personal.
(2) No portion of this research project has been submitted in support of any
application for any other degree or qualification of this or any other university,
or other institutes of learning.
(3) The word count of this research report is 15, 522 words.
Name of Student: Chong Jia Bao
Student ID: 18UKM04813
Signature:
Date: 19 April 2019

iii
ACKNOWLEDGEMENT
It has been a tough and adventurous journey to me in writing this dissertation. However,
this dissertation is completed with the excellent guidance and assistance of several
individuals who contributed their knowledge and expertise. I would like to take this
opportunity to express my great appreciation to all of them.
First and foremost, I would like to express my deepest gratitude to Dr Ooi Chee Keong
for his guidance and mentorship throughout this dissertation. It is my life-long honor to
work with him and he helped me a lot whenever I came across difficulties in this research
study. His tolerance and expertise also helped me and supported me all the way through
proposing initial ideas to the completion of this research study.
I would also like to thank the members of Faculty of Accountancy and Management and
Institute Postgraduate Studies and Research, for their assistance during the program.
Last but not least, I would like to thank my family who have been supporting me
throughout my program and motivating me to move forward. Without their constant
support, I would not be able to successfully complete this dissertation.
Thank you

iv
DEDICATION
The research project is dedicated to those who had fully supported me throughout my
study life. I am glad and would like to dedicate this research project to my parents who
had given their support with encouragement throughout the years. I also dedication to my
siblings and friends for their continuous help and support without reciprocate.
v
TABLE OF CONTENTS
Copyright Page…………………………………………………………………………..i
Declaration………………………………………………………………………………ii
Acknowledgements……………………………………………………………………..iii
Dedication……………………………………………………………………………….iv
Table of Contents………………………………………………………………………..v
List of Tables……………………………………………………………………………ix
List of Figures…………………………………………………………………………....x
Abstract………………………………………………………………………………….xi
CHAPTER 1 ............................................................................................................................. 1
INTRODUCTION .................................................................................................................... 1
1.1 Introduction ..................................................................................................................... 1
1.2 Research Background ..................................................................................................... 1
1.3 Problem Statement .......................................................................................................... 2
1.4 Research Objective ......................................................................................................... 3
1.4.1 Specific Objective .................................................................................................... 4
1.5 Research Questions ......................................................................................................... 4
1.6 Hypothesis....................................................................................................................... 4
1.7 Significant of the study ................................................................................................... 5
1.8 Chapter Layout................................................................................................................ 5
1.9 Conclusion ...................................................................................................................... 6
CHAPTER 2 ............................................................................................................................. 7
LITERATURE REVIEW ......................................................................................................... 7
2.1 Introduction ..................................................................................................................... 7
2.2 Review of Literature ....................................................................................................... 7
2.2.1 Fintech...................................................................................................................... 7
vi
2.2.2 Benefit-risk framework ............................................................................................ 9
2.3 Review of Relevant Theoretical Framework ................................................................ 10
2.4 Proposed Conceptual Framework ................................................................................. 13
2.5 Hypothesis Development .............................................................................................. 14
2.6 Conclusion .................................................................................................................... 20
CHAPTER 3 ........................................................................................................................... 21
METHODOLOGY ................................................................................................................. 21
3.1 Introduction ................................................................................................................... 21
3.2 Research Design............................................................................................................ 21
3.3 Data collection methods ................................................................................................ 21
3.3.1 Primary Data .......................................................................................................... 22
3.4 Sampling Design ........................................................................................................... 23
3.4.1 Target Population ................................................................................................... 23
3.4.2 Sampling Frame and Sampling Location ............................................................... 23
3.4.3 Sampling Elements ................................................................................................ 24
3.4.4 Sampling Technique .............................................................................................. 24
3.4.5 Sampling Size ........................................................................................................ 24
3.5 Research Instrument...................................................................................................... 25
3.5.1 Purpose of Using Questionnaire ............................................................................ 25
3.5.2 Questionnaire Design ............................................................................................. 25
3.6 Construct Measurement ................................................................................................ 26
3.6.1 Origin of Construct ................................................................................................ 26
3.6.2 Data Scale Measurement ........................................................................................ 29
3.7 Data Analysis Techniques ............................................................................................. 30
3.7.1 Reliability Test ....................................................................................................... 31
3.7.2 Descriptive Analysis .............................................................................................. 31
3.7.3 Pearson Correlation ................................................................................................ 32
vii
3.7.4 Multicollinearity Analysis ..................................................................................... 33
3.7.5 Multiple Linear Regression Analysis..................................................................... 33
3.8 Conclusion .................................................................................................................... 34
CHAPTER 4 ........................................................................................................................... 35
RESEARCH RESULTS AND INTERPRETATION OF RESULTS .................................... 35
4.1 Introduction ................................................................................................................... 35
4.2 Descriptive Analysis ..................................................................................................... 35
4.3 Pearson Correlation ....................................................................................................... 38
4.3.1 Correlation of Economic Benefit and Perceived Benefit; Seamless Transaction
and Perceived Benefit; Convenience and Perceived Benefit .......................................... 39
4.3.2 Correlation of Financial Risk and Perceived Risk; Legal Risk and Perceived
Risk; Security Risk and Perceived Risk; Operational Risk and Perceived Risk ............ 40
4.3.3 Correlation of Perceived Benefit and Intention to use Fintech; Perceived Risk
and Intention to use Fintech ............................................................................................ 41
4.4 Multicollinearity Analysis ............................................................................................ 42
4.5 Reliability Test .............................................................................................................. 43
4.6 Multiple Linear Regression Analysis............................................................................ 44
4.7 Conclusion .................................................................................................................... 51
CHAPTER 5 ........................................................................................................................... 52
RECOMMENDATION AND CONCLUSION ...................................................................... 52
5.1 Introduction ................................................................................................................... 52
5.2 Discussion of Major Findings ....................................................................................... 52
5.2.1 Findings on the Hypothesis Three (H3) ................................................................. 53
5.2.2 Findings on the Hypothesis Four (H4) .................................................................. 53
5.2.3 Findings on the Hypothesis Five (H5) ................................................................... 54
5.2.4 Findings on the Hypothesis Six (H6) ..................................................................... 54
5.2.5 Findings on the Hypothesis Seven (H7) ................................................................ 55
5.2.6 Findings on the Hypothesis Eight (H8) ................................................................. 56

viii
5.2.7 Findings on the Hypothesis Nine (H9) .................................................................. 57
5.2.8 Findings on the Hypothesis One (H1) ................................................................... 58
5.2.9 Findings on the Hypothesis Two (H2) ................................................................... 58
5.3 Implications to the research study................................................................................. 59
5.4 Limitations and Future Research Recommendations ................................................... 60
5.5 Conclusion .................................................................................................................... 61
References ........................................................................................................................... 63
Appendices .......................................................................................................................... 70

ix
List of Table
Table 1: Benefit-risk Framework used by past researcher .................................... 12
Table 2: Construct measurement of past studies ................................................... 29
Table 3: Scale Measurement .................................................................................. 30
Table 4: Cronbach's Alpha Measurement .............................................................. 31
Table 5: Measurement of Pearson Correlation ...................................................... 33
Table 6: Descriptive Analysis ................................................................................ 36
Table 7 Descriptive Analysis (Central Tendency) ................................................. 36
Table 8: Correlations for Perceived Benefit Model ............................................... 38
Table 9: Correlations for Perceived Risk Model ................................................... 40
Table 10: Correlations for Intention to use Fintech Model ................................... 41
Table 11: Multicollinearity analysis for Perceived Benefit Model ........................ 42
Table 12: Multicollinearity analysis for Perceived Risk Model ............................ 42
Table 13: Multicollinearity analysis for Intention to use Fintech Model .............. 42
Table 14: Reliability test for Perceived Benefit Model ......................................... 43
Table 15: Reliability test for Perceived Risk Model.............................................. 43
Table 16: Reliability test for Intention to use Fintech Model ................................ 44
Table 17: Result of Path Coefficients and Hypotheses Testing for Perceived
Benefit Model ........................................................................................................ 46
Table 18: Result of Path Coefficients and Hypotheses Testing for Perceived Risk
Model ..................................................................................................................... 48
Table 19: Result of Path Coefficients and Hypotheses Testing for Intention to use
Fintech Model ........................................................................................................ 50

x
List of Figure
Figure 1: Theoretical and Conceptual Framework ................................................ 14
Figure 2: Results of the Structural Model Framework .......................................... 45

xi
ABSTRACT
Revolutions in information technology (IT) lead to the speedy growth of
innovative and modern financial services, regularly named as Financial
Technology (Fintech). The purpose of the research study is to find out how
perceived benefits and risks (consider of both positive factors and negative factors)
mutually influence the intention of customer to use Fintech. In this research,
Perceived benefit factors will be economic benefit, seamless transaction and
convenience, while for the Perceived risk factors will be financial risk, legal risk,
security risk as well as operational risk. The perceived benefit and risk factors will
be use to determine the customer intention to use Fintech. In this research,
primary data collection method is used and the total number respondents were 302
participants which provide very useful information to the research. The
respondent’s answer was collected through Google form. All the perceived benefit
and risk factors have the significant result that either positively or negatively
effect to the intention to use Fintech. Lastly, this research will contribute to the
basic understanding of the perceived benefit and risk factors impact to the
intention to use Fintech.

1
CHAPTER 1
INTRODUCTION
1.1 Introduction
The starter chapter renders the very first taste of whole ideology of the research
study. As usual, background makes the story. Therefore, the first thing to start is
research background. The next thing is problem statement. After that, the research
objective will be discussed and the question in regard to the research will be
posted out. Then it is time to dig down and discuss about the hypothesis of the
study supported by the significant of study and last but not least, the chapter
layout will also be discussed.
1.2 Research Background
Recently, revolutions in information technology (IT) lead to speedy growth of
innovative and modern financial services, regularly named as Financial
Technology (Fintech). It is an arise of new potential field which draw a huge sum
of awareness in the market. Fintech is a combination of the words “financial” and
“technology”. Worldwide investment in Fintech companies has started to increase
significantly from USD4.05 billion (2013) to USD12.2 billion (2014) (Skan,
Dickerson, & Masood, 2015). In Malaysia, Fintech had growth significantly
compare to last year 2017. This is based on the statistic from Bank Negara
Malaysia (BNM), it show that online banking still the dominant channel for
Malaysians to perform transaction with a show of 85.1% online banking
penetration with the transactions volume of 743million. However, mobile and e-
money is the micropayments king because of the considerably large volume in
transaction. Statistic shows us that mobile banking and e-money have 1.02billion
transaction and 1.8billion transactions respectively even though only show a 40%
2
of mobile banking penetration (Fong, 2018). Besides that, Fintech offer new
potential opportunities which allow people have access to amplify transparent
environment, minimize expenses, eliminate intermediate, as well as make
financial information easy to get to (Zavolokina, Dolata, & Schwabe, 2016).
Fintech companies are currently growing their company range far away from the
internet platform to the cell phone platform (For example: mobile payment, P2P
lending and crowd-funding). This is because the conventional E-banking system
offered by conventional financial institutions is now also transform in becoming
innovation and distinguish financial services which similarly offered with the
current modern financial providers.
1.3 Problem Statement
While Fintech has attracted a huge amount of awareness, the intention to use of
Fintech is still considered shaky and uncertain. Customers are hesitant of intention
to use Fintech mainly due to considerable amount of risks. To be more specific, “a
research was carried out in May (2016) on Lending Club. It is known as the most
well-known Peer to Peer lending business around the world. The research
disclosed the company’s executives sold out USD22 million loans to the investors,
even the executives aware about those transactions had not met the investor’s
requirement. As a result, Lending Club’s creator and Chief Executive Officer
were resigned and then the Lending Club’s stock price drop significantly by 35%”
(Imbert & Marino, 2016). The breaking news lifts up doubts in regard to the Peer
to Peer Lending business model. Those unforeseen Fintech utilization risk could
negative the influence of customer feedback and block them the intention to use.
If Fintech companies cannot attract customers and smooth the growth of intention
use, then customers cannot get recovered those expenses and attain long term
strategies or success.
For that reason, customers would like to find out the anticipated importance of
Fintech utilization, taking into consideration both benefits as well as risks.
Consumers only tend to make use of the Fintech’s services if only the advantages
are higher than the uncertainty. As a result, Fintech institutions are challenging to
3
alteration the possible advantages of Fintech utilization; at the same time reduce
its possible uncertainty or hazards (Chan, 2015). Therefore, these situations lead
to compulsory to study possible element which influence the intentions of
customers to use Fintech.
Based on past researcher reports, past researchers report had figured out what is
the most important driving force which causing people’s behavior intentions in
Information System (IS) literary study (Liang & Yeh, 2011; Chiang, 2013; Zhou,
2013; Kim, Mirusmonov, & Lee, 2010). On the other hand, there is amount of
studies has at the same time include both advantages and uncertainty in Fintech
environment. In addition, it is an essential to identify people level behavioral and
try to fill up the possible breach in the people level investigate in Fintech. In order
to overcome the research study breach the main objective of this research study is
to find out how perceived benefits and risks (consider of both positive factors and
negative factors) mutually affect the intention to use of Fintech. This research
study will be use based on Theory of Reasoned Action (TRA) to create a
framework (Ajzen & Fishbein, 1977). Theory of reasoned action (TRA) explains
that individual behavior is driven by behavioral intentions where behavioral
intentions are determinants of an individual’s attitude toward the behavior. In
short, a person who strongly believes that positive outcomes will result will have a
positive attitude about the behavior, while a person who strongly believes in
negative outcomes will have a negative attitude about the behavior (Ajzen &
Fishbein, 1977). In this research, the research gap is to identify how customer’s
perceived benefits and risks towards the intention to use Fintech. It is important to
know what are the perceived benefits and risks factor that affect the customer’s
intention to use Fintech
1.4 Research Objective
The main objective of the research study is to find out how perceived benefits and
risks (consider of both positive factors and negative factors) mutually influence
the intention of customer to use Fintech. To complete this research, a framework
will be created based on the Theory of Reasoned Action (TRA).

4
1.4.1 Specific Objective
a) To study the relationship between positive factors and perceived
benefits.
b) To study the relationship between negative factors and perceived
risks.
c) To study the significant impact of perceived benefits and risks
toward the intention to use Fintech.
1.5 Research Questions
The following research questions in this research are:
Research question 1: Does customers’ perception of benefits and risks will
significantly affect the intention to use Fintech?
Research question 2: What is the possible specific benefit and risk factors affect
the intention to use Fintech?
1.6 Hypothesis
Hypothesis 1: Perceived benefit has significant relationship to the Fintech
intention to use.
Hypothesis 2: Perceived risk has significant relationship to the Fintech intention to
use.
Hypothesis 3: Economic benefit has significant relationship to perceived benefit.
Hypothesis 4: Seamless transaction has significant relationship to perceived
benefit.
Hypothesis 5: Convenience has significant relationship to perceived benefit.
Hypothesis 6: Financial risk has significant relationship with perceived risk.
Hypothesis 7: Legal risk has significant relationship with perceived risk.
Hypothesis 8: Security risk has significant relationship with perceived risk.
Hypothesis 9: Operational risk has significant relationship with perceived risk.

5
1.7 Significant of the study
This investigate objective is to provide the next contributions into literature. First
of all, the research tries to increase the environment of the intention use of Fintech
decision to clearly consist both perceived benefits and risks (consider of both
positive factors and negative factors) at the same time. Besides that, with the help
of framework which created by using TRA, the research can possibly assist
practitioners to better realize how the benefits as well as risks conceptualization
which possible to produce benefit improving products and risk reduction services
plan of action to inspire the customer intention to utilization of Fintech. Last but
not least, the research results can give suggestion to the Fintech institution with
precious content and info regards what is the element should consider to be put
first or prevent during offer Fintech products and services to their customers.
1.8 Chapter Layout
The whole research study will involve five chapters to discuss:
In the Chapter 1, the research study overview that acts as the summaries of
Chapter 2, 3, 4, and 5. Besides this, research background, problem statement as
well as the research objectives, research questionnaire, hypothesis and significant
of the study will be further discussed.
In the Chapter 2, there will have the discussed on the introduction and review of
the relevant literature. Furthermore, the critical review of the applicable
theoretical framework is required also the proposed conceptual research
framework will be suggested for further research study. Hence, applicable
hypothesis will be formed and then finally is the conclusion of Chapter 2.
In the Chapter 3, the research study design will be identify. Additionally, the
discussion on the data collection methods, sampling design and research
measurement will be carry on. Next, construct measurement and data analysis
techniques will also be discussed as well as follow by conclusion of chapter 3.
6
In the Chapter 4, a number of statistical tests will be performed by using SPSS.
All the results and finding will then be summarized and critically evaluated.
In the Chapter 5, it will justify the whole statistical result from the analysis,
findings also the results of hypotheses examination found in the chapter 4. Then,
chapter 5 will also criticism the implication and also figured out the constraint of
the research. In addition, recommendations of future research will also be further
discussed. Lastly, it leads to the construction of the conclusion of this research.
1.9 Conclusion
The first chapter serves as an introduction to the study including the background,
problem statement, research objectives, research questions, and hypotheses of the
research study. It also provides important definitions to the study. Next, literature
review will be discussed in Chapter two.
7
CHAPTER 2
LITERATURE REVIEW
2.1 Introduction
In chapter 2, the discussion will first follow with literature review and then review
of relevant theoretical model and lastly proposed conceptual research framework.
2.2 Review of Literature
2.2.1 Fintech
Fintech is a combination of data file which combining financial and
Information Technology (IT). Fintech was not only limited to particular
services (For example: provide financing) either business model (For
instance: Peer to Peer lending and crowd sourcing). As an alternative, it
includes the whole range of traditional financial institution services and
products (Arner, Barberis, & Buckley, 2015). Fintech make on extremely
innovation and disruptive services technology as products and services in
modern non financial institutions (Sweeney, 2017; Chuen & Teo, 2015).
Next, Freedman (2006) represented that Fintech is a building systems
which value, model, as well as process financial products such as debts,
shares, contracts, and monetary system. Besides that, Ernst and Young
characterized that Fintech as creativity in the financial services with
current technology to set as the significant enabler (crucial element that
supplies the means, knowledge, or opportunity that allows for the success
of an assigned task or mission). There is a past researcher delineated
Fintech is a form of business organization using software and hardware
application to offer financial products and services. Arner et al. (2015)
8
delimited that Fintech is a technology enabled which provides financial
method. Besides that, Lee and Kim (2015) described Fintech is one of the
technical procedure resulting by develop and establish the latest financial
software that can expected to influence the whole traditional financial
institution system. As a result, Fintech could possible to significantly
affect the financial service’s performance and also lead to grow of
financial services into mobile apps environment.
Even though the connection of financial and Information Technology
services is not new, Fintech still differ from current electrical financial
products and services in especially the risk, opportunity, and law
implication. Present-day, the anxieties of industry and policy makers were
not due to the technology changing. They were worry with the question on
who are going to work together (For example: Information Technology
organization) in try for apply the finance technology also offering new
financial products and services to consumers (Arner, Barberis, & Buckley,
2015). Besides that, the growing and strengthening the role of Information
Technology is an important characteristic in the Fintech. Arner et al. (2015)
described that improvement of traditional E-financial services had lead to
the evolving with Fintech just as an innovative plan of action to render
financial products and services. Ernst and Young make clear of that the
dissimilarity between the conventional electrical finances (For instance:
Online banking) and the Fintech. Especially, they mention out that the
fresh role of Information Technology in Fintech. The function of
Information Technology in Fintech is not only act like a facilitator or
enabler to efficaciously bring financial services. However, as the innovator
of new market that interrupts the current value chain which kicking out the
existing channels. Fintech institution should openly offer their consumers
with similar or custom-made financial services to disrupt and also
substitute the present conventional channel.
For this research, Fintech is delimited as innovation and disruption of
financial services by non financial companies, which Information
Technology is the main key element. With the help of Fintech, customer
9
could involve into a diversity of mobile environment services. For
example: make payment, transfer money or currency, make loans
application, buy insurance policy, organization assets and management,
and make investments on shares (Barberis, 2014). In this research, Fintech
are cover up all the Fintech products and services such as mobile payments,
insurtech, Peer to Peer lending, crowd funding, crypto currency and others.
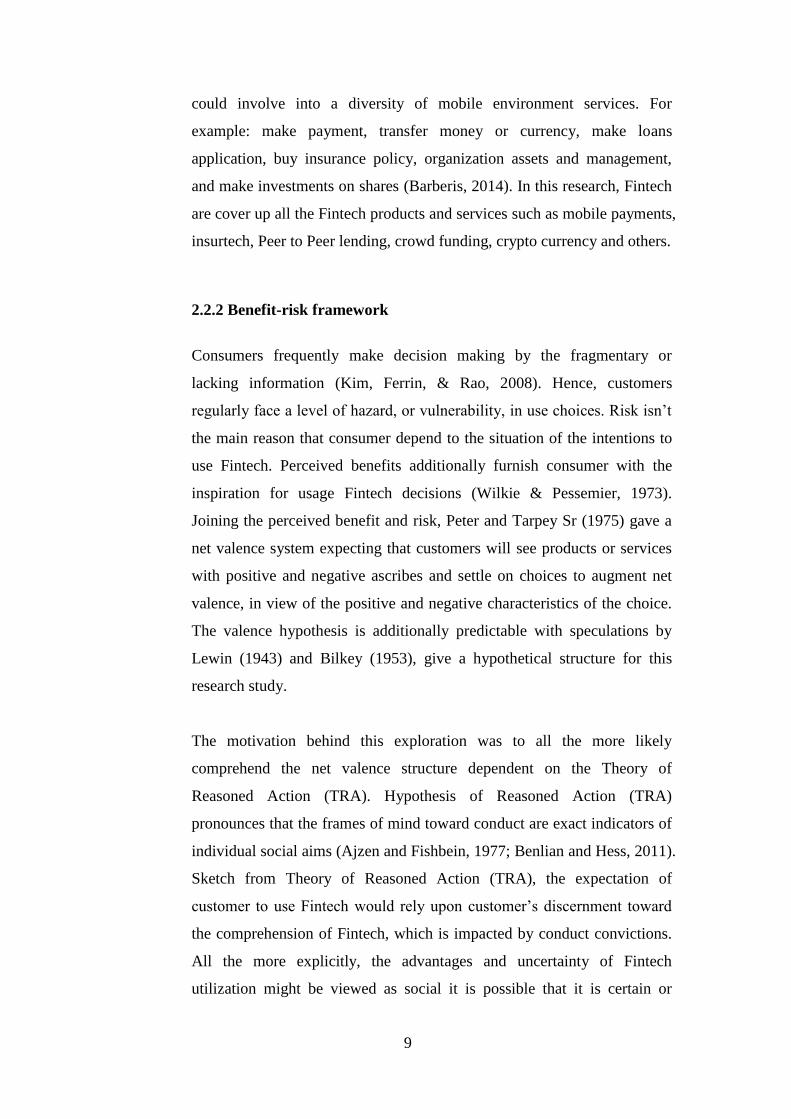
2.2.2 Benefit-risk framework
Consumers frequently make decision making by the fragmentary or
lacking information (Kim, Ferrin, & Rao, 2008). Hence, customers
regularly face a level of hazard, or vulnerability, in use choices. Risk isn’t
the main reason that consumer depend to the situation of the intentions to
use Fintech. Perceived benefits additionally furnish consumer with the
inspiration for usage Fintech decisions (Wilkie & Pessemier, 1973).
Joining the perceived benefit and risk, Peter and Tarpey Sr (1975) gave a
net valence system expecting that customers will see products or services
with positive and negative ascribes and settle on choices to augment net
valence, in view of the positive and negative characteristics of the choice.
The valence hypothesis is additionally predictable with speculations by
Lewin (1943) and Bilkey (1953), give a hypothetical structure for this
research study.
The motivation behind this exploration was to all the more likely
comprehend the net valence structure dependent on the Theory of
Reasoned Action (TRA). Hypothesis of Reasoned Action (TRA)
pronounces that the frames of mind toward conduct are exact indicators of
individual social aims (Ajzen and Fishbein, 1977; Benlian and Hess, 2011).
Sketch from Theory of Reasoned Action (TRA), the expectation of
customer to use Fintech would rely upon customer’s discernment toward
the comprehension of Fintech, which is impacted by conduct convictions.
All the more explicitly, the advantages and uncertainty of Fintech
utilization might be viewed as social it is possible that it is certain or

10
negative convictions that choose frames of mind and following conduct
expectations and activities (Jurison, 1995). Thus, the positive convictions
of Fintech use will expand the perceived advantages, while the negative
convictions will result in perceived uncertainty. As indicated by this
hypothesis, this examination sees whether purchasers would decide
explicit advantage and uncertainty factors that may prompt their goal to
utilize Fintech. The outcome would be an in general attitudinal assessment
of Fintech utilization (For instance: by and large seen advantage and
uncertainty), prompting the expectation of client to utilize Fintech.
2.3 Review of Relevant Theoretical Framework
Sources Research
environment
Research
complacent
Main
component of
benefits
Main
component of
risk
(Kim,
Ferrin, &
Rao, 2008)
Electronic-
commerce
Examine the past
history of trust
and uncertainty
based on the
benefits risks
framework
Single
dimension
Single
dimension
(Lee M. C.,
2009)
E-banking Explained the
intention to
adopt online
banking
combining
perceived
benefits and
risks
Financial
benefit
Information
Transaction
speed
transparency
Security risk
or privacy risk
Social risk
Financial risk
Performance
risk
(Benlian &
Hess, 2011)
Software as
a service
(Saas)
Assessed the
major
opportunities
and risks
Cost advantage
Strategic
flexibility
Focus on core
Performance
risk
Economic risk
Strategic risk
11
associated with
the intention to
adopt Saas
competences
Access to
specialized
resources
Quality
improvement
Security risk
Managerial
risk
(Liu, Yang,
& Li, 2012)
Mobile
payment
Investigated the
mobile adoption
based on the
risk-benefits
analysis
Single
dimension
Financial risk
Privacy risk
Psychological
risk
(Tingchi
Liu, Brock,
Cheng Shi,
Chu, &
Tseng,
2013)
Online
group
shopping
Investigated
perceived
benefits, risk,
and trust
Price benefits
Convenience
benefits
Recreational
benefits
Financial risk
Psychological
risk
Product risk
Time risk
(Lee, Park,
& Kim,
2013)
Social
network
service
(SNS)
Investigated
benefit and risk
factors
influencing
intention to
share
information in
SNS
Self-
clarification
Social
validation
Relationship
development
Social control
Self-
presentation
Security risk
Stigma risk
Face risk
Relational risk
Role risk
(Farivar &
Yuan,
2014)
Social
commerce
Analyzed users’
social network
usage using
benefits, risk and
trust
Social benefit
Commerce
benefit
Social risk
Commerce
risk
(Abramova
& Böhme,
Bitcoin Explained
drivers and
Transaction
process
Financial
losses

12
2016) inhibitors of
Bitcoin use
Security and
control
Decentralization
Legal risk
Operational
risk
Adoption risk
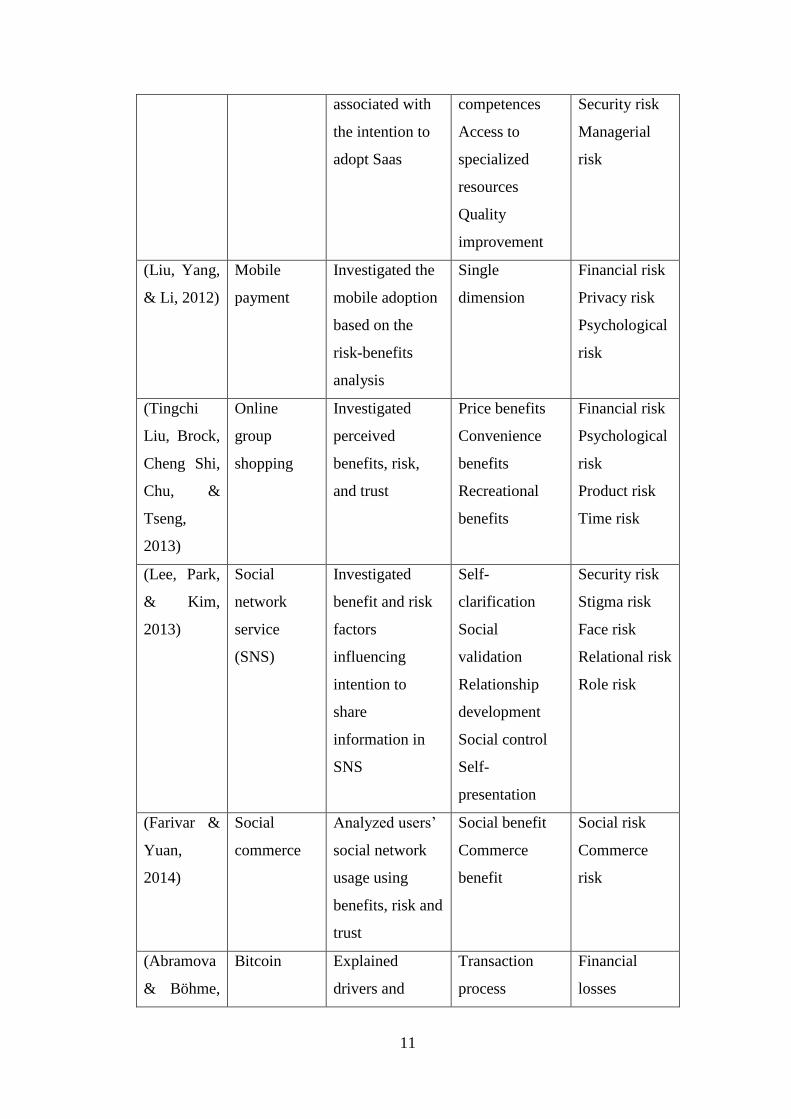
Table 1: Benefit-risk Framework used by past researcher
Table 1 show that significant written report had examined the benefits risks
structure influencing the decision making procedure to receive or aim use
Information Technology (IT) administrations (Lee, Park, & Kim, 2013; Lee M.C.,
2009; Abramova & Bohme, 2016; Benlian & Hess, 2011; Farivar & Yuan, 2014;
Kim, Ferrin, & Rao, 2008; Lee, Chae, & Cho, 2013). Most of these examinations
have estimated the perceived benefit and risks through a multi dimensional idea
that ordinarily contain various advantage and uncertainty types. There is an
examination suggested that a decision making model about internet business
acquiring aims. In the examination, they thought that perceived advantages and
uncertainty in a solitary measurement, not a multi-measurement (Kim, Ferrin, &
Rao, 2008). A research recommended that a hypothetical model to clear up
customer’s expectation to utilize web based banking. In this examination,
perceived risks was comprehended in a multi-dimensional way (Includes of
security or privacy, financial, social, time or convenience, performance risks),
however perceived advantage was viewed as single build(Lee M. C., 2009). An
exploration of research opportunities and dangers associated with receiving
software as a service (SaaS), Perceived by Information Technology (IT) officials
from adopter and non-adopter firms. In this investigation, they recommended five
kinds of advantages (cost advantage, strategic flexibility, focus on core
competencies, access to specialized resources, and quality improvements)
alongside five sorts of uncertainty (performance, economic, strategic, security,
and managerial risks) associated with SaaS appropriation (Benlian & Hess, 2011).
An explored the advantage and uncertainty elements that impact the aim to share
data on an informal community administration just as discovered that customer's
conduct would expand their advantages and limit their risk in the training. This
investigation proposed five kinds of benefits (self-clarification, social control,

13
social validation, relationship development, and self-presentation) likewise five
sorts of risks (security risk, relational risk, stigma risk, face risk, and role risk)
identified with setting data sharing (Lee, Park, & Kim, 2013). A proposed of
hypothetical model to investigate customer's informal organization appropriation
conduct, thinking about the perceived benefits, perceived risks, with trust from the
advantage risk structure. They received two positive components (social and
commerce benefits) as perceived benefits notwithstanding two negative elements
(social and commerce risks) as perceived risks (Farivar & Yuan, 2014). An
examination investigated the drivers and inhibitors of Bitcoin use. They proposed
an advantage chance system incorporated with an innovation acknowledgment
model to give clarification on the utilization of Bitcoin. There are 3 variables of
perceived benefits (seamless transaction, security and control, and decentralization)
and 4 variables of perceived risks (financial losses, legal risk, operational risk, and
adoption risk) were incorporated into their examination (Abramova & Böhme,
2016).
2.4 Proposed Conceptual Framework
This exploration contemplate proposed a system of advantage as well as risk by
set up together the positive (perceived benefit) and negative (perceived risk)
factors identified with the intention to use Fintech. Past investigations connected
the multi-social conviction develops to confirm the by and large perceived benefit
and risk, just as the expectation of customer to utilize Fintech. Three main
considerations of perceived benefit will be examine in these explores which are
economic benefit, seamless transaction, and convenience. Four main
considerations of perceived risk will be examine in these explores which are
financial risk, legal risk, security risk, and operational risk. As a result, this
examination accepted that positive and negative elements impact the in general
perceived benefits and risk, which will give noteworthy impact to the Fintech
intention to use. The proposed model is summarized in Figure 1.
The Theory of Reasoned Action (TRA) is an all around investigated intention
hypothesis theory that claims that guarantees that mentalities toward a conduct are

14
exact indicators of individual expectations (Ajzen & Fishbein, 1977; Benlian &
Hess, 2011). The Fintech’s intention is controlled by Fintech users’ generally
speaking attitudinal thought of Fintech use by applying the Theory of Reasoned
Action (TRA) to the Fintech setting. It is perceived that user think about
accessible services in addition to pick services, with the best esteem (Kim, Ferrin,
& Rao, 2008). At the point when user settles on a hazardous choice, they are eager
to go for broke to acquire gains or advantages.
2.5 Hypothesis Development
Perceived benefits have been commonly utilized as an immediate determinant of
specific Information System intentions (Kim, Ferrin, & Rao, 2008; Lee, Park, &
Kim, 2013; Tingchi Liu, Brock, Cheng Shi, Chu, & Tseng, 2013). Perceived
benefit is characterized as “a users’ view of the potential that Fintech aim to
utilize will result in a positive result" in this examination. Past examinations have
call attention to that perceived benefits have the capacity to decidedly impact user
aim to utilize Information Technology (IT) services for various applications
(Abramova & Bohme, 2016; Benlian & Hess, 2011; Farivar & Yuan, 2014; Lee,
Perceived benefit
Perceived risk
Intention to use
Fintech
H1
H2
Economic
benefit
Seamless
Transaction
Convenience
Financial risk
Legal risk
Security risk
Operational
risk
H7
H6
H5
H4
H3
H8
H9
Figure 1: Theoretical and Conceptual Framework

15
Park, & Kim, 2013; Lee M.C., 2009; Lee, Chae, & Cho, 2013). A handphone
payment study discovered that perceived benefits can essentially influence mobile
payment usage (Liu, Yang, & Li, 2012). Similarly, Abramova and Bohme (2016)
showed that perceived advantages affect Bitcoin use.
Perceived risks related with products or services have picked up importance in the
user and innovative investigation. A perceived risk is a boundary for users while
considering Fintech utilization. This exploration defined that the perceived risk as
“a users’ impression of the vulnerability and the conceivable negative outcomes
with respect to the Fintech aim to use." In the Information System writing,
perceived risks contrarily influence the aims to utilize Information Technology (IT)
services (Abramova & Bohme, 2016; Benlian & Hess, 2011; Farivar & Yuan,
2014; Lee, Park, & Kim, 2013; Lee M.C., 2009; Lee, Chae, & Cho, 2013). Just as
Abramova and Bohme (2016) found that multi-faceted perceived risk can
altogether and adversely impact Bitcoin use.
According to the hypothetical establishments plus exact proof of the literature
review, this research assume that customer’s perceived benefit as well as risk play
a critical jobs in the shaping of the expectation to utilize Fintech. The perceived
benefit has a positive relationship to the Fintech intention to use, while the
perceived risk has a negative relationship to the Fintech intention to use.
Therefore, the following hypotheses are created:
Hypothesis 1: Perceived benefit is positive relationship to the Fintech intention to
use.
Hypothesis 2: Perceived risk is negative relationship to the Fintech intention to
use.
Factors of perceived benefit for the intention of customer to use Fintech:
Users’ inspirations have been sorted as extrinsic and intrinsic factors from the
psychological assessment hypothesis (Davis, Bagozzi, & Warshaw, 1992).
Extrinsic motivation refers to the execution of a movement to achieve a specific
objective (For example: prizes, bonus, and commission), at the same time as

16
intrinsic motivation refers to the execution of an action for no undeniable support
other than the act of playing out the action without anyone else (Davis, Bagozzi,
& Warshaw, 1989). Two of the extrinsic also intrinsic elements have been
observed to be impact the perceived benefits with behavioral aims in the
Information System writing. This exploration concentrated on the extrinsic
motivation factors, because Fintech users intention to use Fintech for their useful
benefits, not for their enjoy benefits. Hence, this examination proposed three
extrinsic motivations as the benefit elements of the in general perceived benefit
which are economic benefit, seamless transaction, and convenience.
Economic benefit is the most widely recognized and dependable extrinsic
inspiration for Fintech (Chuen & Teo, 2015). With regards to Fintech, the
economic benefit comprises of cost decreases and monetary profits from Fintech
exchanges. Several Fintech applications such as cell phone remittance or Peer to
Peer lending perhaps will propose lower exchange expenses to customer contrast
with the conventional budgetary specialist organizations through legitimately
giving institutionalized administrations on a versatile channel without
intermediary (Mackenzie, 2015). Other Fintech applications, for example, P2P
loaning or crowdfunding, that for the most part offer administrations on the web
or through a mobile platform, possibly will also give higher returns to lenders, and
lower loan fees to borrowers, than the conventional financial institutions through
utilizing a match-making platform with a lower overhead expense (Gerber, Hui, &
Kuo, 2012; Lee & Lee, 2012).
A seamless transaction alludes to the exchange related advantage of utilizing
Fintech (For instance: buy, money transfer, lend, and invest). Seamless transaction
practice is a critical normal for Fintech exchanges with the point of wipe out
conventional financial institutions. For example, banks through the finance
procedure. It let user to oversee exchanges on savvy stages, bringing about
straightforward and expedient budgetary exchanges (Chishti, 2016; Zavolokina,
Dolata, & Schwabe, 2016). In addition, modern financial providers such as
Information Technology (IT) institution have the capacity to construct and offer
new, inventive and customer benevolent budgetary products and services to
customer since they legitimately offer their products and services through the

17
seamless transaction. The seamless transaction empowers that Fintech
organizations can grow new and creative budgetary products and services to
contend with customary monetary establishments and get by in the fund showcase.
Along these lines, these Fintech organizations are rebuilding the business
biological systems of the budgetary services industry.
Convenience is another one of the extrinsic inspirations of Fintech, which is
controlled by versatility and moment openness (Chuen & Teo, 2015; Sharma &
Gutierrez, 2010). Convenience alludes to adaptability in time and area (Okazaki &
Mendez, 2013); the most essential factor in the accomplishment of on the web and
portable services (Kim, Mirusmonov, & Lee, 2010). Users could encounter first-
time comfort and effectiveness through cell phones without heading out to money
related organizations. Next, convenience possibly will be helpful as a substantial
indicator of the utilization of portable financial frameworks (Shen, Huang, Chu, &
Hsu, 2010). Since cell phones are imperative directs in Fintech, when contrasted
with conventional financial service providers, convenience over the course of
mobile platforms is an objective motivation to decide the perceived benefit of the
intention to use Fintech.
Economic benefit, seamless transaction, and convenience may influence the
generally perceived benefit of Fintech, consequently influencing the goal to utilize
Fintech. By itself, this research has the following hypotheses are created:
Hypothesis 3: Economic benefit is positive relationship to perceived benefit.
Hypothesis 4: Seamless transaction is positive relationship to perceived benefit.
Hypothesis 5: Convenience is positive relationship to perceived benefit.
Factors of perceived risk for the intention of customer to use Fintech:
Besides than the perceived benefits, advancement normally attach together with
risks (Schierz, Schilke, & Wirtz, 2010). As Fintech is a developing and one of the
special services, Fintech users are in threat to sweeping dangers. For Fintech, the
danger of the shot of inadequate or fizzled tasks is extremely tricky for the goal of
client to utilize Fintech. Past researcher utilized the perceived risk structure

18
created by Cunningham (1967) to build up the individual risks factors impacting
the by and large perceived risk of Fintech (Cunningham, 1967). Perceived risk
order into six measurements which are performance, financial consideration,
opportunity or time, safety, social factors, and psychological factors (Cunningham,
1967). After exchanging the Cunningham (1967) structure to the Fintech setting,
this examination study built up the supporting by 4 kind of risks as above 6
dimensions perceived risk component which are security risk, financial risk, legal
risk, and operational risk. These four types of perceived risk factors able to
identify clearly about the Fintech context and appropriate provide useful
information which are not cover in the six dimensions.
Financial risk in other way refers to the likely or possibility of financial loss
immerses in the financial transactions of using financial technology (Forsythe, Liu,
Shannon, & Gardner, 2006). Past multiple research studies involving Information
System literature had revealed that perceived financial risk is the most dependable
indicator of on the web and cell phone user behavior (Abramova & Bohme, 2016;
Benlian & Hess, 2011; Tingchi Liu, Brock, Cheng Shi, Chu, & Tseng, 2013). The
financial losses of Fintech, brought about by the breakdown of the budgetary
exchange framework, monetary misrepresentation, moral danger, and extra
exchange expenses connected with the first selection value (Jesse McWaters, 2015;
Zavolokina, Dolata, & Schwabe, 2016), are negative relationship to the intention
to use Fintech. Hence, it shows a positive relationship in perceived risk of Fintech.
Legal risk alludes to a vague lawful status and the absence of all inclusive
guidelines for Fintech. For instance, Malaysia’s Bank Negara Malaysia (BNM)
have come a framework to enables the experimentation of Fintech solutions in a
live environment before it is rolled out for the market. The elements in the
framework include of proactive stance (protect data security and privacy), and
safeguards (protect the financial system of the country). As Fintech is first time
occur in the this potential market, the absence of guidelines in regards to the
money related misfortune and security issues of Fintech has brought about user
fear, doubt, and uneasiness. Therefore, legal risk shows an increase in the
perceived risk of Fintech.

19
Security risk is characterized as the potential misfortune in light of extortion or a
hacking that bargains the security system of the financial deal of Fintech. With
regards to e-services, security risk is conceptualized as the likelihood of a
protection assault; this is a basic concern encompassed by consumers (Lwin,
Wirtz, & Williams, 2007). Fraud and programmer intrusion can prompt user
financial related misfortune just as disregard user’s security, which is a
noteworthy worry of numerous on the web and cell phone users (Lee M. C.,
2009). The utilization of Fintech is joined with a generally high misfortune
potential such as secrecy, individual information, transactions (Schierz, Schilke, &
Wirtz, 2010); this likewise builds the perceived risk of financial technology.
Operational risk is a basic worry for user, as because many major operational
misfortunes have hit vast financial organization, prompting the extreme monetary
unsettling influence or breakdown of these establishments (For example: Lending
Club). Operational risk alludes to the potential misfortune because of deficient or
fizzled interior procedures, workers and frameworks (Barakat & Hussainey, 2013).
On the off chance that the hazard shot of Fintech institution financial systems and
operations is high, user would not aim to utilization Fintech. Other than that,
absence of operational abilities and quick reactions, the breakdown of frameworks,
and lacking interior procedures will result in user's doubt and disappointment,
prompting the obstruction to use Fintech.
Because of the perceived risks (financial misfortune, security issues, the unclear
of regulations), users will settle on utilization choices dependent on the great
notoriety of Fintech organizations as far as operational skills and advance
frameworks. In this way, the four kinds of risks may essentially influence the in
general perceived risk of Fintech, along these lines adversely impacting the
expectation of utilization Fintech. Therefore, this examination proposes the
following hypotheses are created:
Hypothesis 6: Financial risk is positive relationship with perceived risk.
Hypothesis 7: Legal risk is positive relationship with perceived risk.
Hypothesis 8: Security risk is positive relationship with perceived risk.
Hypothesis 9: Operational risk is positive relationship with perceived risk.

20
2.6 Conclusion
In chapter 2, the relationships between dependent variable and independent
variables are clearly defined in the hypotheses form. Besides that, the relevant
theoretical frameworks have been review as well and lead to the hypothesis
development. In next chapter, the whole hypotheses will be tested by using
suitable quantitative research method such as data collection, sampling design,
research instrument, construct measurement, and techniques used for data analysis.

21
CHAPTER 3
METHODOLOGY
3.1 Introduction
This chapter begins with research design, follows by methods of data collection,
following by sampling design, and then research instrument and constructs
measurement. Lastly will be the techniques used for data analysis.
3.2 Research Design
This research used quantitative data which can quantify and measurable, while the
data will obtain from primary data which through questionnaires. There are
including perceived benefits (Economic benefit, Seamless Transaction, and
Convenience) and perceived risks (Security risk, Financial risk, Legal risk, and
Operational risk) to the use of testing the intention of customer to use Fintech. In
order to estimate and run necessary outputs and tests, SPSS software had been
used to identify the impacts of perceived benefit as well as risk as the independent
variables to the intention to use Fintech.
3.3 Data collection methods
As stated in a report by Fellegi (2003), data collection is defined as “the process of
gathering the necessary information for each selected element in the survey”. Data
collection is an important part for every research study because the quality of
input data may influence the results of a research. Accuracy, reliability and
validity of research findings can be improved by using proper data collection
techniques (Sagor, 2000). Data can be classified as primary and secondary,
depending on the source of data (Giri & Bannerjee, 2001). For these research

22
studies, primary sources are tools to answer those hypotheses and research
question.
3.3.1 Primary Data
Primary data is collected directly from the field of investigation for the
desired purpose and these data are original in nature (Giri & Bannerjee,
2001). In other words, primary data is the original data collected for a
particular research goal (Hox & Boeije, 2005). According to Sandahl,
Powers and Kavmark (2012), primary data is created accordingly to the
purpose of a research study; therefore the data collected has a direct
relationship to the investigation at hand. Primary research is frequently
conducted by using surveys, interviews, observations, and statistical
analysis to understand people, societies, and cultures better (Driscoll,
2011).
Questionnaire is used to collect primary data for this research study
because it is the most frequent method of primary data collection. It is a
self-administrated paper based data collection instrument that is filled by
respondents. Permission and consent are obtained from the participants
before they fill up the questionnaire of this research study. All collected
statistical information will be processed to analyze by using the statistical
method analysis technique to come out the results in the Chapter 4. As
stated in the book written by Burns and Bush (2005), questionnaires serve
five key functions:
1) Translate the research objectives into specific questions
2) Standardize questions with the intention that respondents respond to
the same stimuli
3) Foster cooperation and make sure respondents stay motivated
4) Permanent records for the research
5) Accelerate the process of data analysis

23
In this research, sample size of 302 questionnaires were dispense to the
whole Malaysia including Sabah and Sarawak. The questionnaires will be
set with a well structure organizing format to let respondents have a clear
and time saving during answering the questions. By using questionnaires
method in this research, it will be able provide the most accurate and most
up-to-date information based on the opinion given from the respondents.
3.4 Sampling Design
3.4.1 Target Population
It points to a gather of the objects or some elements which connected to
this research (Bajpai, 2011). The particular research purpose is to
investigate and also to understand those interviewee’s responses regarding
the causes that affect customer intention to use Fintech in whole Malaysia
(include Sabah and Sarawak). Therefore, this research focuses on target
populations who are Malaysian and reside in Malaysia. The ages are
targeting to above 18years old and have individual account of bank in
order to enjoy benefit and feature of Fintech. The reason of age
requirements set at 18years old and above due to the legal age with
contractual capacity. There will be no any restraints about gender, race,
religion as well as ethnic.
3.4.2 Sampling Frame and Sampling Location
It also relates to the all population, where sample was taken, meanwhile
the sampling locations is the location where the population stay (Zikmund
W. G., Babin, Carr, & Griffin, 2013). The survey related instrument will
be dispersed to that interviewee from different places in whole Malaysia.
Therefore, the particular sampling frame is for people that are Malaysian
and live in country of Malaysia as well as at the same time the sampling
places is all within whole Malaysia.

24
3.4.3 Sampling Elements
This particular research study will be distributed in whole Malaysia with
an internet survey (For example: Google form). The target respondents can
be pupils, on the job adults as well as relevant people. This population is
chosen. This is because of they can be future user who uses Fintech
because now Fintech in Malaysia still less people use it and fresh. By
focusing them, intention to use Fintech will be understand well on what
make them use it (perceived benefit and risk factors).
3.4.4 Sampling Technique
Probability as well as non probability was two usually in use sampling
techniques utilized by past researchers for their research (Zikmund W. G.,
Babin, Carr, & Griffin, 2013). For this research, non probability method
has been applied. This is because it is low-priced, broadly used as well as
doesn’t involve huge population size. For sure, it assists to cut down the
expenditure of sampling. The quota sampling method is also classified as
non probability sampling method to make sure the different small amount
of groups in population will be classified on relevant features in proportion
to the interviewer’s required elements (Zikmund W. G., Babin, Carr, &
Griffin, 2013). Therefore, quota sampling method is chosen in these
studies as it is expedient, speedy and low in expenditure (Hair Jr,
Wolfinbarger, Money, Samouel, & Page, 2015).
3.4.5 Sampling Size
Identify proper amount of sample size is a catchy and also a problematic
work. Roscoe’s rules of thumb, to examine samples, for more than thirty
as well as less than five hundreds are consider suitable for most of the
research (Roscoe, 1975). At the same time as Comrey and Lee (2013)
stated that the subsequent measurement of the sample size: fifty consider
as very poor, one hundred consider as poor, two hundred consider as fair,
three hundred consider as good, five hundred consider as very good, and

25
also more than one thousand is consider as superior. Those sample sizes
for past researcher’s research (Yang & Mao, 2014; Rahman, Khan, &
Islam, 2013; Lim & Ting, 2014; Pi, Liao, Liu, & Lee, 2011) are around
two hundred to four hundred. Therefore, the proposed target area sample
size of the research is also targeted for three hundred respondents.
3.5 Research Instrument
The questionnaire is regard as a technique of how the data has been collected from
respondents which they are requested to provide answer of the same series of the
questions in the predetermined sequences (Vaus, 2002). For the research, all
questionnaires will be dispersed to obtain first hand data from the respondents
regrading intention to use Fintech. Those self administered based questionnaire
has been utilized in this particular study that is the interviewee has the
responsibility to study and response to the provided questions set via online
method (Zikmund W. G., Babin, Carr, & Griffin, 2013). Obviously, the cost is
low-budget to do, obtain speedier response answers and with no geographic
restriction.
3.5.1 Purpose of Using Questionnaire
The questionnaire method can help to capture respondent’s cognitive
content and also has feeling about several problems (Celsi, Money,
Samouel, & Page, 2011). In addition, Zikmund W. G., Babin, Carr, and
Griffin (2013) indicate that questionnaire assists investigator to allocate
the recent business issue by gathering all useful information by conducting
a research question. Furthermore, the particular questionnaire was
undoubtedly necessary because the data is superior as the questions asked.
3.5.2 Questionnaire Design
A structured questionnaire was utilized as the survey in this examination.
The survey was arranged and dispersed on the website (Google Form). The

26
hyperlink to the study site (Google Form) was spread to respondents
through email or other internet based life. Respondents are mentioned to
browse the choices or pick a fitting scale point gave in the overview
instrument. For this research study, the particular survey instrument is
classified into many segment, it will be asking about perceived benefit and
risk, factors of perceived benefit and risk, and intention to use Fintech as
well as the respondent’s profile. In the respondent’s profiles, the questions
will be asked are gender, age, monthly income and education level. Based
the respondent’s profile, it might be able to provide appropriate answer to
this study. To improve the credibility as well as dependability of the data
information collected, all respondents did not be asked willingness to
answer the questionnaires.
3.6 Construct Measurement
There are many information sources that researchers can search for and consider
when deciding upon the constructs that a study will measure. These information
sources comprise of literature review from previous studies that addressed similar
topics, inputs from peers and experts, and client-commissioned studies (Roller &
Lavrakas, 2015).
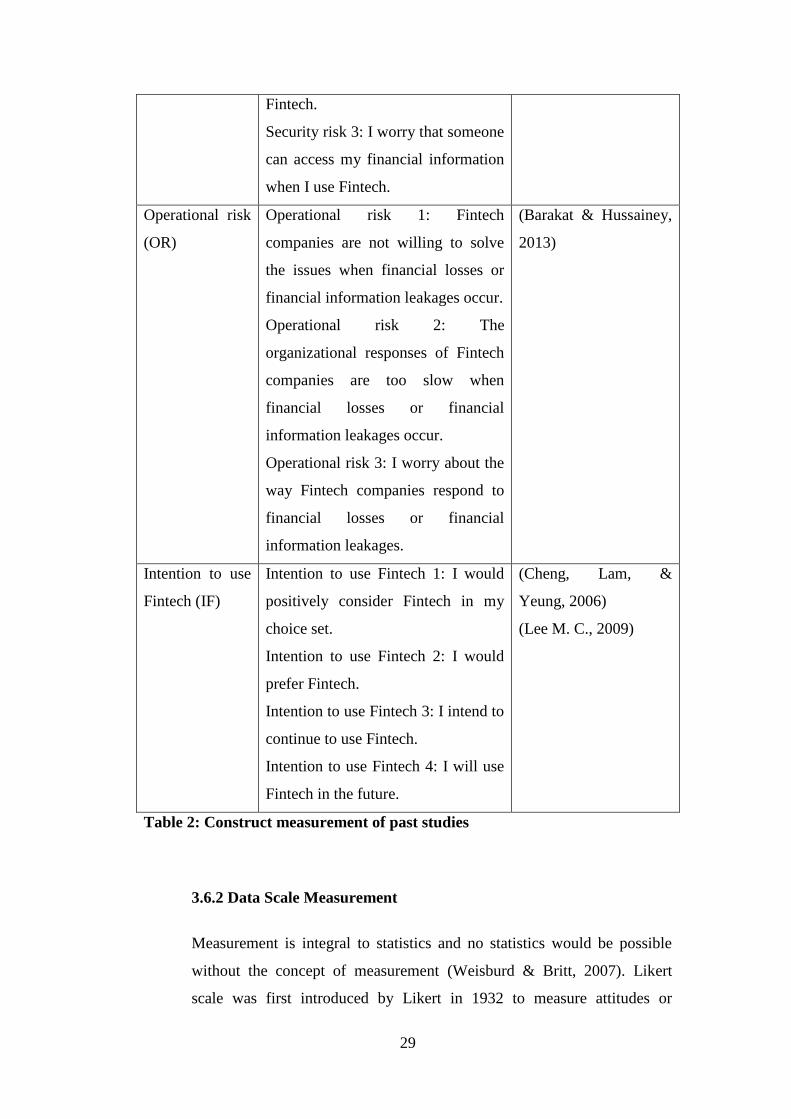
3.6.1 Origin of Construct
The sources of the construct measurement used in this research study are
adapted from the past studies.
Constructs Survey Authors
Perceived
benefit (PB)
Perceived benefit 1: Using Fintech
has many advantages.
Perceived benefit 2: I can easily and
quickly use Fintech.
(Kim, Ferrin, & Rao,
2008)
(Benlian & Hess, 2011)

27
Perceived benefit 3: Using Fintech is
useful for me.
Perceived benefit 4: Using Fintech
yields a more superior outcome
quality than traditional financial
services.
Perceived risk
(PR)
Perceived risk 1: Using Fintech is
associated with a high level of risk.
Perceived risk 2: There is a high
level of uncertainty using Fintech.
Perceived risk 3: Overall, I think that
there is little benefit to use Fintech
compared to traditional financial
services.
(Kim, Ferrin, & Rao,
2008)
(Benlian & Hess, 2011)
Economic
benefit (EB)
Economic benefit 1: Using Fintech is
cheaper than using traditional
financial services.
Economic benefit 2: I can save
money when I use Fintech.
Economic benefit 3: I can use
various financial services with a low
cost when I use Fintech.
(Featherman & Pavlou,
2003)
(Lee M. C., 2009)
Seamless
transaction (ST)
Seamless transaction 1: I can control
my money without the middleman
when I use Fintech.
Seamless transaction 2: I can use
various financial services at the same
time (e.g. one stop processing) when
I use Fintech.
Seamless transaction 3: I can have
the peer-to-peer transactions
between providers and users without
middle man when I use Fintech.
(Chishti, 2016)

28
Convenience
(CV)
Convenience 1: I can use financial
services very quickly when I use
Fintech.
Convenience 2: I can use financial
services anytime anywhere when I
use Fintech.
Convenience 3: I can use financial
services easily when I use Fintech.
(Okazaki & Mendez,
2013)
Financial risk
(FR)
Financial risk 1: Financial losses are
likely when I use Fintech.
Financial risk 2: Financial fraud or
payment frauds are likely when I use
Fintech.
Financial risk 3: Financial losses due
to the lack of the interoperability
with other services are likely when I
use Fintech.
(Featherman & Pavlou,
2003)
(Lee M. C., 2009)
Legal risk (LR) Legal risk 1: My use of Fintech is
uncertain due to many regulations.
Legal risk 2: It is not easy to use
Fintech due to the government
regulation.
Legal risk 3: There is a legal
uncertainty for Fintech users.
Legal risk 4: It is difficult to use
various Fintech applications due to
the government regulation.
(Barakat & Hussainey,
2013)
(Abramova & Böhme,
2016)
Security risk
(SR)
Security risk 1: I worry about the
abuse of my financial information
(e.g. transaction and private
information) when I use Fintech.
Security risk 2: My financial
information is not secure when I use
(Featherman & Pavlou,
2003)
(Lee M. C., 2009)
29
Fintech.
Security risk 3: I worry that someone
can access my financial information
when I use Fintech.
Operational risk
(OR)
Operational risk 1: Fintech
companies are not willing to solve
the issues when financial losses or
financial information leakages occur.
Operational risk 2: The
organizational responses of Fintech
companies are too slow when
financial losses or financial
information leakages occur.
Operational risk 3: I worry about the
way Fintech companies respond to
financial losses or financial
information leakages.
(Barakat & Hussainey,
2013)
Intention to use
Fintech (IF)
Intention to use Fintech 1: I would
positively consider Fintech in my
choice set.
Intention to use Fintech 2: I would
prefer Fintech.
Intention to use Fintech 3: I intend to
continue to use Fintech.
Intention to use Fintech 4: I will use
Fintech in the future.
(Cheng, Lam, &
Yeung, 2006)
(Lee M. C., 2009)
Table 2: Construct measurement of past studies
3.6.2 Data Scale Measurement
Measurement is integral to statistics and no statistics would be possible
without the concept of measurement (Weisburd & Britt, 2007). Likert
scale was first introduced by Likert in 1932 to measure attitudes or

30
opinions of respondents (Brown, 2011). The original scale used a series of
questions with five response alternative: (i) strongly approve (ii) approve
(iii) undecided (iv) disapprove and (v) strongly disapprove (Boone &
Boone, 2012). In this research study, a five-point Likert scale was used.
The scale used for this research is ranging from 1(Extreme low) to 5
(Extreme high).
Variables Likert Scale
Dependent Variable
Intention to use Fintech
Independent Variable
Perceived benefits
Economic benefit
Seamless transaction
Convenience
Perceived risks
Financial risk
Legal risk
Security risk
Operational risk
1=Extreme low
2=Low
3=Neutral
4=High
5=Extreme High
Table 3: Scale Measurement
3.7 Data Analysis Techniques
As mentioned in a report by University (2011), SPSS is the acronym of Statistical
Package for Social Sciences that have been in development for more than thirty
years. It is a powerful, user-friendly software package for data manipulation and
statistical data analysis (Landau, 2004). In this research study, IBM SPSS
Statistics 20 software is used to analyze the data collected.
31
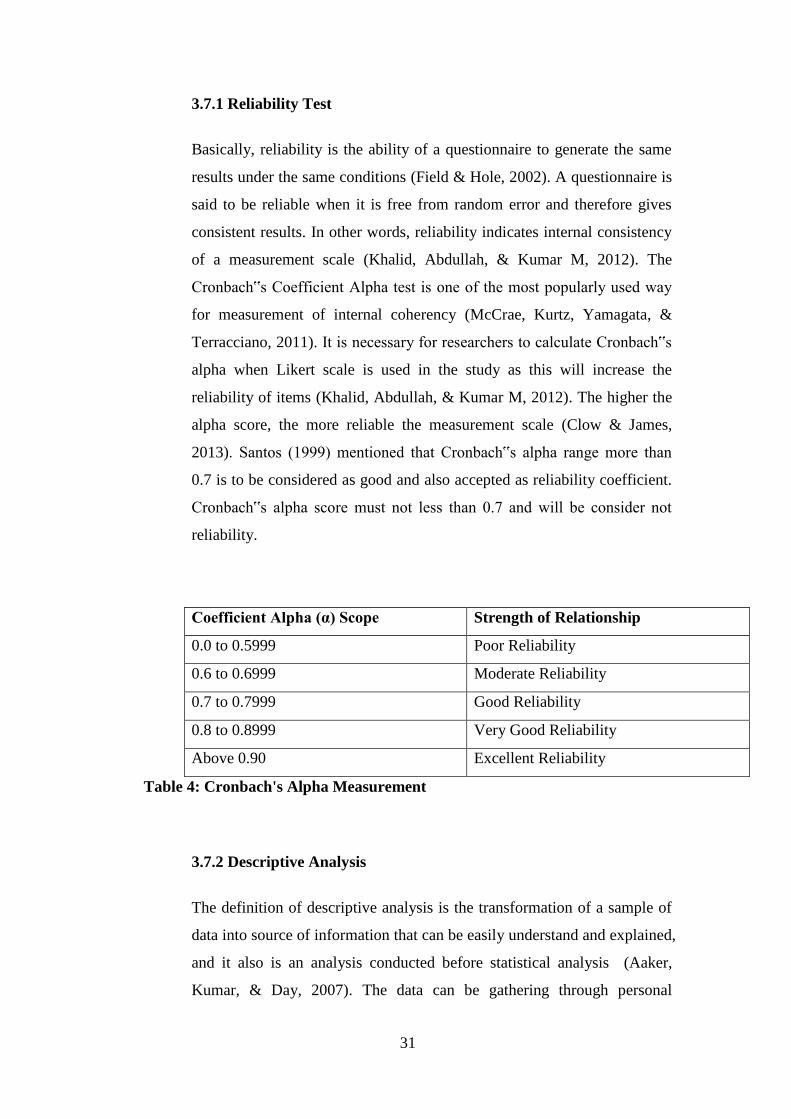
3.7.1 Reliability Test
Basically, reliability is the ability of a questionnaire to generate the same
results under the same conditions (Field & Hole, 2002). A questionnaire is
said to be reliable when it is free from random error and therefore gives
consistent results. In other words, reliability indicates internal consistency
of a measurement scale (Khalid, Abdullah, & Kumar M, 2012). The
Cronbach‟s Coefficient Alpha test is one of the most popularly used way
for measurement of internal coherency (McCrae, Kurtz, Yamagata, &
Terracciano, 2011). It is necessary for researchers to calculate Cronbach‟s
alpha when Likert scale is used in the study as this will increase the
reliability of items (Khalid, Abdullah, & Kumar M, 2012). The higher the
alpha score, the more reliable the measurement scale (Clow & James,
2013). Santos (1999) mentioned that Cronbach‟s alpha range more than
0.7 is to be considered as good and also accepted as reliability coefficient.
Cronbach‟s alpha score must not less than 0.7 and will be consider not
reliability.
Coefficient Alpha (α) Scope Strength of Relationship
0.0 to 0.5999 Poor Reliability
0.6 to 0.6999 Moderate Reliability
0.7 to 0.7999 Good Reliability
0.8 to 0.8999 Very Good Reliability
Above 0.90 Excellent Reliability
Table 4: Cronbach's Alpha Measurement
3.7.2 Descriptive Analysis
The definition of descriptive analysis is the transformation of a sample of
data into source of information that can be easily understand and explained,
and it also is an analysis conducted before statistical analysis (Aaker,
Kumar, & Day, 2007). The data can be gathering through personal

32
interview, survey questionnaires and others method. In this analysis, mean,
mode, and standard deviation will be discussed. Therefore, median, mean,
mode, as well as standard deviation are consider as the most powerful
descriptive statistics for examiner to interpret the data.
3.7.3 Pearson Correlation
Pearson’s correlation coefficient or (r) can be defined as is a degree of the
strength on how the dependent and independent variables relate to each
other. -1 to +1 is the range of the coefficient. -1 indicates a perfectly
negative relationship while +1 indicates a perfectly positive relationship,
and thus 0 indicates no linear relationship. In conclusion, of the nearer
values are to -1 or +1, the stronger the linear correlation can be (Zikmund
W., Babin, Carr, & Griffin, 2010). When Pearson correlation coefficient
among two variables are high (>0.80), then the multicollinearity problem
is occur (Kumari, 2008). Furthermore, these researches, Pearson
Correlation Coefficient is utilizing to explore correlation among predictor
variable (Economic benefit, seamless transaction, and convenience) and
dependent variable (Perceived benefit). Besides that, also analyze the
correlation between independent variable (Financial risk, Security risk,
Legal risk, and Operational risk) and dependent variable (Perceived risk).
Lastly, Pearson correlation Coefficient will analyze the correlation
between independent variable (Perceived benefit, and Perceived risk) and
dependent variable (Intention to use Fintech). If r is positive, the
dependent variable is directly related to the independent variable where if
the r is negative, then vice versa correlated.
Size of Correlation Interpretation
0.90 to 1.00 (-0.90 to -1.00) Very high positive (negative) correlation
0.70 to 0.90 (-0.70 to -0.90) High positive (negative) correlation
0.50 to 0.70 (-0.50 to -0.70) Moderate positive (negative) correlation

33
0.30 to 0.50 (-0.30 to -0.50) Low positive (negative) correlation
0.00 to 0.30 (-0.00 to -0.30) Little if any correlation
Table 5: Measurement of Pearson Correlation
3.7.4 Multicollinearity Analysis
The higher of collinearity, the higher probability that a good sign of the
result will turned out insignificant and get rejected from model (Hair,
Babin, Money, & Samuel, 2003). Collinearity analysis is a good indicator
to check the significance of a model as when the value is high; it carries
the insignificance of the model (Hair, Babin, Money, & Samuel, 2003).
Thus, multicollinearity problem can be discovered by collinearity in the
terms of Tolerance and Variance Inflation Factor (VIF). Referring to Hair
et al. (2003), the maximum value of VIF is 5.0, so if VIF value is higher
than 5.0, it would shows a multicollinearity problem. Besides that, a
tolerance value of 0.10 or lower, multicollinearity problem is occurred
(Hair, Babin, Money, & Samuel, 2003).
3.7.5 Multiple Linear Regression Analysis
Multiple linear regression (MLR) model can be defined as an evolvement
of simple linear regression which contains only one independent variables,
X, into more than one independent variables, which are applied to forecast
a single dependent variable, Y (Stockburger, 2001). It is used in this
research study to measure the significance of relationship between
dependent and independent variables. The general multiples linear
regression model for a research study can be written as follows (Fagbemi,
Ajibolade, Arowomole, & Ayadi, 2011):
y = β0 + β1χ1 + β2χ2 + β3χ3 + … + β k χ k + ε
Where, y= Dependent variable
β0 β1 β2 β3 βk = Regression coefficients

34
χ 1 χ2 χ3 χk = Independent variables
ε = Error term
3.8 Conclusion
This chapter describes research design, methods of information collected, and then
the sampling design continue with the research instrument also the construct
measurement, as well as data analysis techniques which applied to analyze
information. Chapter 3 provides a linkage to Chapter 4 and these two chapters are
interrelated. The following chapter will illustrate the patterns and analyze the
findings that are related back to this research questions along with hypotheses.
35
CHAPTER 4
RESEARCH RESULTS AND INTERPRETATION OF
RESULTS
4.1 Introduction
This chapter will present the result and analysis of 302 respondents gathered for
this research study. Every part of results is obtained from the output of IBM SPSS
statistics version 20. This chapter consists of descriptive analysis, reliability test,
multicollinearity analysis, pearson correlation, and multiple linear regression
analysis. There are few tests will be explained by using three model which are
Perceived Benefit Model, Perceived Risk Model, and Intention to use Fintech
Model. The reason to separate become three model instead of one model is mainly
because of this research framework. This research framework are forming
together by three multiple linear regression model so by explaining it clearly and
understanding, three separate model is the best way to interpret it .
4.2 Descriptive Analysis
The definition of descriptive analysis is the transformation of a sample of data into
source of information that can be easily understand and explained, and it also is a
analysis conducted before statistical analysis (Aaker, Kumar, & Day, 2007). Total
302 sets of data are received from the web-based questionnaire. The purpose of
descriptive analysis is to study the overall statistic of the respondents’
demographic background.

36
Frequency Percent Cumulative
Percent
Gender Female
Male
147
155
48.7
51.3
48.7
100
Age
18-24
25-34
35-44
Above 45
84
101
62
55
27.8
33.4
20.5
18.2
27.8
61.3
81.8
100
Monthly
Income
Less than RM2,500
RM2, 501-RM3,500
RM3, 501-RM4,500
RM4, 501-RM5,500
Above RM5, 500
76
69
64
42
51
25.2
22.8
21.2
13.9
16.9
25.2
48.0
69.2
83.1
100
Education
Level
Primary/ Secondary
school
Undergraduates
Masters
PhD
71
181
44
6
23.5
59.9
14.6
2.0
23.5
83.4
98.0
100
Table 6: Descriptive Analysis
Gender Age Monthly Income Education
Level
Mean 1.5132 2.2914 2.7450 1.9503
Mode 2.00 2.00 1.00 2.00
Median 2.0000 2.0000 3.0000 2.0000
Standard
Deviation
0.5006 1.0633
1.4111 0.6777
Min
Max
1
2
1
4
1
5
1
4
Table 7 Descriptive Analysis (Central Tendency)
Based on the above Table 6, a total of 302 respondents are constructed by 147
males (48.7%) and 155 females (51.3%). Moreover, from the table 6 above, there
are total of four range of age group, the majority groups of respondents are under
37
the range from 25-34 years old, which is 101respondents (33.4%), then follow by
the range from 18-24 is 84 respondents (27.8%), and the remains will be divided
by the range from 35-44 and above 45 years old are 62 respondents (20.5%) and
55 respondents (18.2%) respectively. In terms of monthly income, it has been
ranged into five income groups. Most of the respondents had their income less
than RM 2,500 with 76 respondents (25.2%). It follows by the income group
ranged from RM 2,501 – RM 3,500 and RM 3,501 – RM 4,500, which is 69
respondents (22.8%) and 64 respondents (21.2%) respectively. At last, the income
group of RM 4,501 – RM 5,500 and above RM 5,500, with 42 respondents
(13.9%) and 51 respondents (16.9%) respectively. Lastly, in term of education
level, it is formed by four levels, and most of the respondents are undergraduates,
with 181 (59.9%) of respondents. It follows by 71 (23.5%) of respondents, which
are from primary / secondary school. The least will be the group of PhDs, which
only 6 (2%) of respondents. The remaining respondents are from the Master, with
44 respondents (14.6 %).
Based on the above Table 7, Mean (average) for the gender, age, monthly income
and education level are 1.5132, 2.2914 (average age is between 25-34 and 35-44),
2.7450 (average monthly income is between RM2, 501-RM3, 500 and RM3, 501-
RM4, 500), and 1.9503 (average education level is between primary/secondary
school and undergraduate) respectively. Next, the mode (most frequently
occurring) for the gender, age, monthly income and education level are 2.000
(Male), 2.000 (25-34 age), 1.000 (Less than RM 2,500), and 2.000
(Undergraduates) respectively. In addition, the median for the gender, age,
monthly income and education level are 2.0000, 2.0000 (median age is at around
25-34), 3.0000 (median monthly income is at around RM3, 501-RM4, 500), and
2.0000 (median education level is at around undergraduates level) respectively.
Besides that, the standard deviation for the gender, age, monthly income and
education level are 0.5006, 1.0633, 1.4111, and 0.6777 respectively. A
low standard deviation indicates that the data points tend to be very close to the
mean while a high standard deviation indicates that the data points are spread out
over a large range of values.

38
4.3 Pearson Correlation
Pearson’s correlation coefficient or (r) can be defined as is a degree of the strength
on how the dependent and independent variables relate to each other. -1 to +1 is
the range of the coefficient. -1 indicates a perfectly negative relationship while +1
indicates a perfectly positive relationship, and thus 0 indicates no linear
relationship. In conclusion, of the nearer values are to -1 or +1, the stronger the
linear correlation can be (Zikmund W. , Babin, Carr, & Griffin, 2010). If the
correlation coefficient between two variables is high (>0.80), then
multicollinearity problem is occur (Kumari, 2008) The following pearson
correlation test will be explain using three model which are Perceived Benefit
Model, Perceived Risk Model, and Intention to use Fintech Model.
Correlations
PB EB ST CV
PB
Pearson Correlation 1 .694**
.620**
.675**
Sig. (2-tailed) .000 .000 .000
N 302 302 302 302
EB
Pearson Correlation .694**
1 .667**
.606**
Sig. (2-tailed) .000 .000 .000
N 302 302 302 302
ST
Pearson Correlation .620**
.667**
1 .586**
Sig. (2-tailed) .000 .000 .000
N 302 302 302 302
CV
Pearson Correlation .675**
.606**
.586**
1
Sig. (2-tailed) .000 .000 .000
N 302 302 302 302
**. The correlation is significant at 0.01 level (2-tailed).
Table 8: Correlations for Perceived Benefit Model
Based on the Table 8 above, PB is Perceived Benefit; EB is Economic
Benefit; ST is Seamless Transaction; and CV is Convenience.
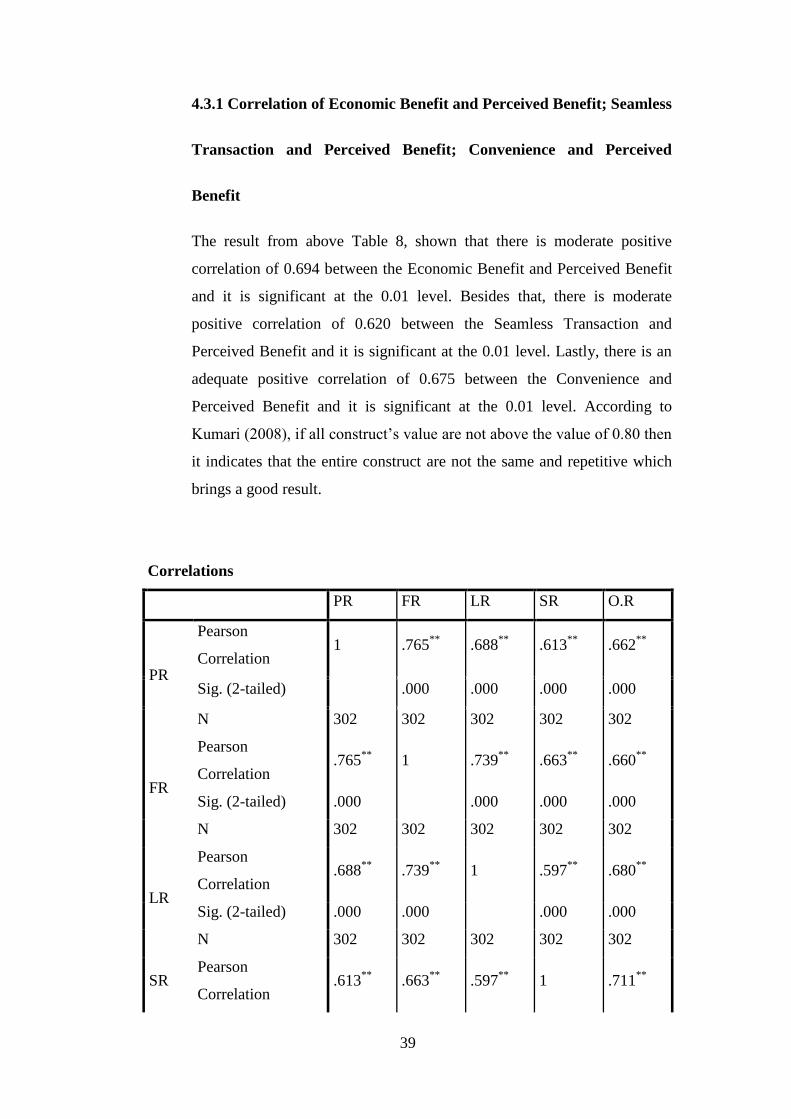
39
4.3.1 Correlation of Economic Benefit and Perceived Benefit; Seamless
Transaction and Perceived Benefit; Convenience and Perceived
Benefit
The result from above Table 8, shown that there is moderate positive
correlation of 0.694 between the Economic Benefit and Perceived Benefit
and it is significant at the 0.01 level. Besides that, there is moderate
positive correlation of 0.620 between the Seamless Transaction and
Perceived Benefit and it is significant at the 0.01 level. Lastly, there is an
adequate positive correlation of 0.675 between the Convenience and
Perceived Benefit and it is significant at the 0.01 level. According to
Kumari (2008), if all construct’s value are not above the value of 0.80 then
it indicates that the entire construct are not the same and repetitive which
brings a good result.
Correlations
PR FR LR SR O.R
PR
Pearson
Correlation 1 .765
** .688
** .613
** .662
**
Sig. (2-tailed) .000 .000 .000 .000
N 302 302 302 302 302
FR
Pearson
Correlation .765
** 1 .739
** .663
** .660
**
Sig. (2-tailed) .000 .000 .000 .000
N 302 302 302 302 302
LR
Pearson
Correlation .688
** .739
** 1 .597
** .680
**
Sig. (2-tailed) .000 .000 .000 .000
N 302 302 302 302 302
SR Pearson
Correlation .613
** .663
** .597
** 1 .711
**
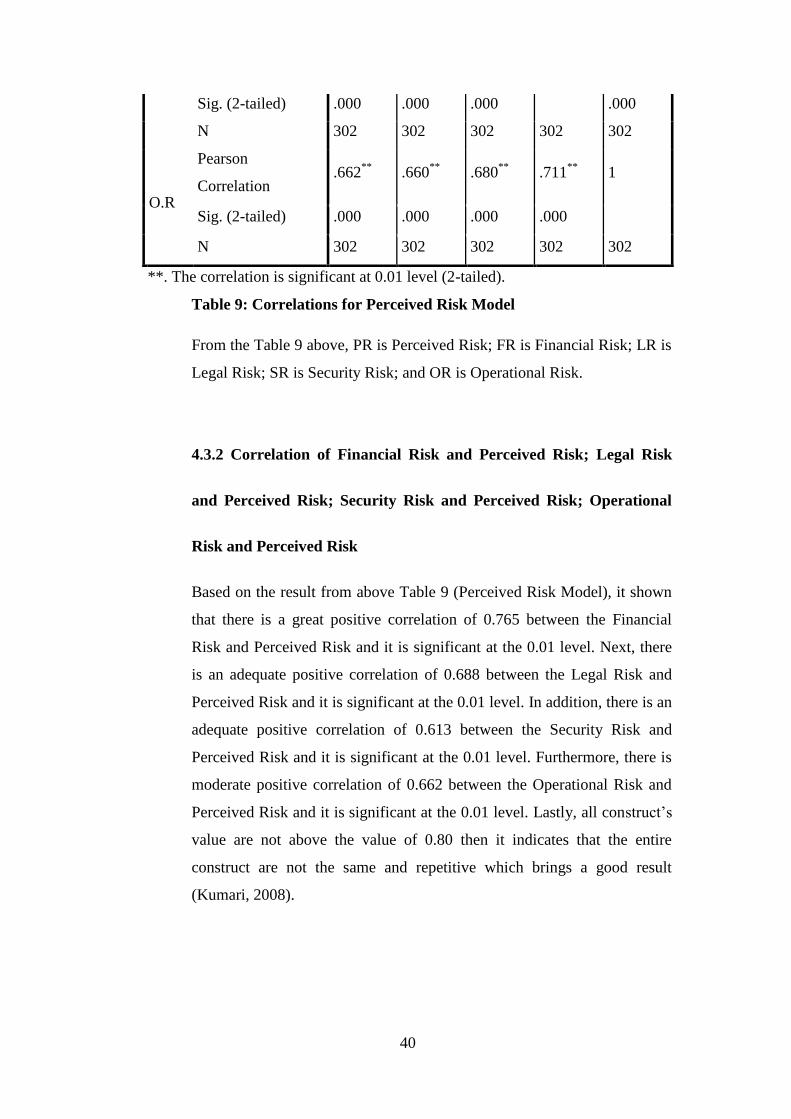
40
Sig. (2-tailed) .000 .000 .000 .000
N 302 302 302 302 302
O.R
Pearson
Correlation .662
** .660
** .680
** .711
** 1
Sig. (2-tailed) .000 .000 .000 .000
N 302 302 302 302 302
**. The correlation is significant at 0.01 level (2-tailed).
Table 9: Correlations for Perceived Risk Model
From the Table 9 above, PR is Perceived Risk; FR is Financial Risk; LR is
Legal Risk; SR is Security Risk; and OR is Operational Risk.
4.3.2 Correlation of Financial Risk and Perceived Risk; Legal Risk
and Perceived Risk; Security Risk and Perceived Risk; Operational
Risk and Perceived Risk
Based on the result from above Table 9 (Perceived Risk Model), it shown
that there is a great positive correlation of 0.765 between the Financial
Risk and Perceived Risk and it is significant at the 0.01 level. Next, there
is an adequate positive correlation of 0.688 between the Legal Risk and
Perceived Risk and it is significant at the 0.01 level. In addition, there is an
adequate positive correlation of 0.613 between the Security Risk and
Perceived Risk and it is significant at the 0.01 level. Furthermore, there is
moderate positive correlation of 0.662 between the Operational Risk and
Perceived Risk and it is significant at the 0.01 level. Lastly, all construct’s
value are not above the value of 0.80 then it indicates that the entire
construct are not the same and repetitive which brings a good result
(Kumari, 2008).

41
Correlations
PB PR IF
PB
Pearson Correlation 1 .451**
.666**
Sig. (2-tailed) .000 .000
N 302 302 302
PR
Pearson Correlation .451**
1 .463**
Sig. (2-tailed) .000 .000
N 302 302 302
IF
Pearson Correlation .666**
.463**
1
Sig. (2-tailed) .000 .000
N 302 302 302
**. The correlation is significant at the 0.01 level (2 tailed).
Table 10: Correlations for Intention to use Fintech Model
From the Table 10 above, PB is Perceived Benefit; PR is Perceived Risk;
and IF is Intention to use Fintech.
4.3.3 Correlation of Perceived Benefit and Intention to use Fintech;
Perceived Risk and Intention to use Fintech
From the result above Table 10 (Intention to use Fintech Model), it
indicates a low positive correlation of 0.451 between the Perceived Benefit
and Intention to use Fintech and it is significant at the 0.01 level. Lastly,
the result showed an adequate positive correlation of 0.666 between the
Perceived Risk and Intention to use Fintech and it is significant at the same
level. This shows all construct’s value are not above the value of 0.80 then
it indicates that the entire construct are not the same and repetitive which
brings a good result (Kumari, 2008).

42
4.4 Multicollinearity Analysis
The higher of collinearity, the higher probability that a good sign of the result will
turned out insignificant and get rejected from model (Hair, Babin, Money, &
Samuel, 2003). Collinearity analysis is a good indicator to check the significance
of a model as when the value is high, it carries the insignificance of the model
(Hair, Babin, Money, & Samuel, 2003). Thus, multicollinearity problem can be
discovered by collinearity in the terms of Tolerance and Variance Inflation Factor
(VIF). Referring to Hair et al. (2003), the maximum value of VIF is 5.0, so if VIF
value is higher than 5.0, it would shows a multicollinearity problem. Besides that,
a tolerance value of 0.10 or lower, multicollinearity problem is occurred (Hair,
Babin, Money, & Samuel, 2003). The following multicollinearity analysis will be
explain using three model which are Perceived Benefit Model, Perceived Risk
Model, and Intention to use Fintech Model.
Construct Tolerance VIF
Economic benefit (EB) 0.484 2.0661
Seamless transaction
(ST)
0.503 1.9881
Convenience (CV) 0.573 1.7452
Table 11: Multicollinearity analysis for Perceived Benefit Model
Construct Tolerance VIF
Financial risk (FR) 0.371 2.6954
Legal risk (LR) 0.388 2.5773
Security risk (SR) 0.427 2.3419
Operational risk (OR) 0.386 2.5906
Table 12: Multicollinearity analysis for Perceived Risk Model
Construct Tolerance VIF
Perceived benefit (PB) 0.797 1.2547
Table 13: Multicollinearity analysis for Intention to use Fintech Model

43
Based on the above Table 11, 12, and 13, the Variance Inflation Factor (VIF) for
all the models were less than 5.0. Besides that, the Tolerance Value for all three
Models was ranging between 0.371 and 0.797. The result revealed that the
multicollinearity problem was not significant in this study.
4.5 Reliability Test
The Cronbach‟s Alpha Coefficient is applied as the reliability test for the
variables in this research study. As mentioned, reliability is the ability of a
questionnaire to generate the same results under the same conditions (Field &
Hole, 2002) and a questionnaire is reliable when it is free from random error. The
following reliability test will be explain using three model which are Perceived
Benefit Model, Perceived Risk Model, and Intention to use Fintech Model.
Variables No. of Items Cronbach‟s alpha
Coefficient
Economic Benefit (IV) 3 0.842
Seamless Transaction (IV) 3 0.837
Convenience (IV) 3 0.852
Perceived Benefit (DV) 4 0.891
Table 14: Reliability test for Perceived Benefit Model
Variables No. of Items Cronbach‟s alpha
Coefficient
Financial Risk (IV) 3 0.885
Legal Risk (IV) 4 0.897
Security Risk (IV) 3 0.841
Operational Risk (IV) 3 0.881
Perceived Risk (DV) 3 0.806
Table 15: Reliability test for Perceived Risk Model
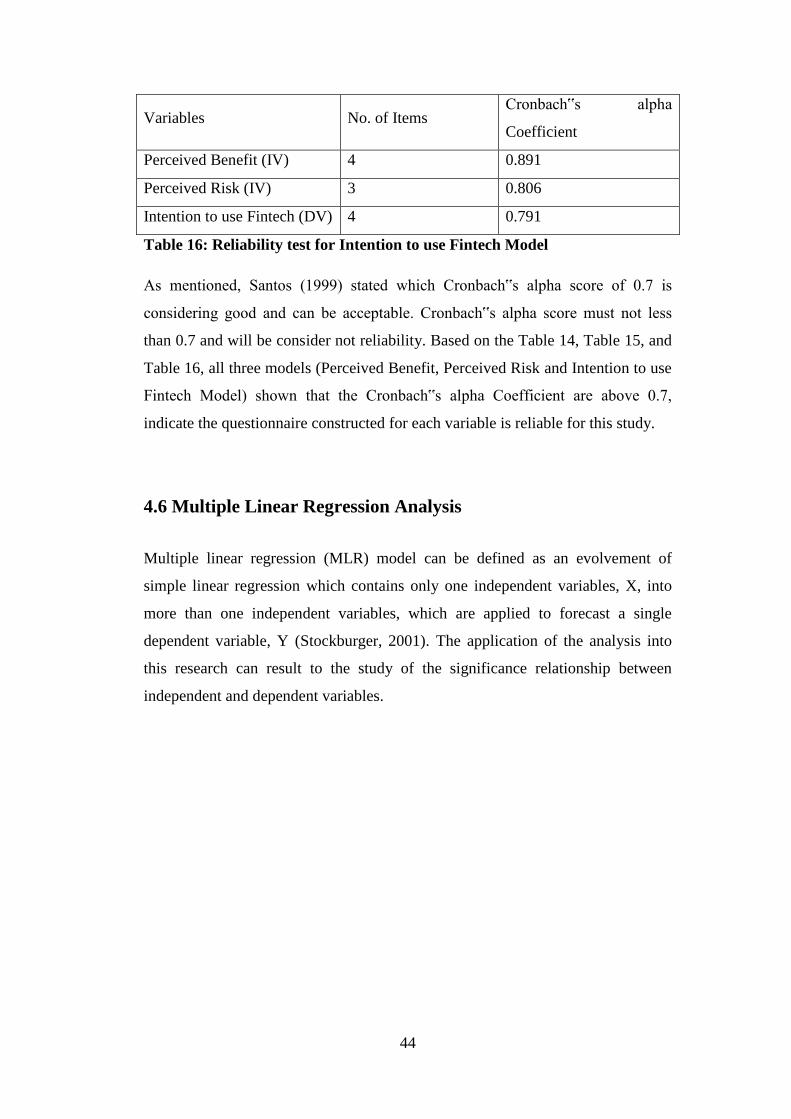
44
Variables No. of Items Cronbach‟s alpha
Coefficient
Perceived Benefit (IV) 4 0.891
Perceived Risk (IV) 3 0.806
Intention to use Fintech (DV) 4 0.791
Table 16: Reliability test for Intention to use Fintech Model
As mentioned, Santos (1999) stated which Cronbach‟s alpha score of 0.7 is
considering good and can be acceptable. Cronbach‟s alpha score must not less
than 0.7 and will be consider not reliability. Based on the Table 14, Table 15, and
Table 16, all three models (Perceived Benefit, Perceived Risk and Intention to use
Fintech Model) shown that the Cronbach‟s alpha Coefficient are above 0.7,
indicate the questionnaire constructed for each variable is reliable for this study.
4.6 Multiple Linear Regression Analysis
Multiple linear regression (MLR) model can be defined as an evolvement of
simple linear regression which contains only one independent variables, X, into
more than one independent variables, which are applied to forecast a single
dependent variable, Y (Stockburger, 2001). The application of the analysis into
this research can result to the study of the significance relationship between
independent and dependent variables.

45
Economic
Benefit 0.353***
Seamless
Transaction
0.166*** Perceived
Benefit
0.575
Convenience 0.363***
R2
=
0.594
Intention
to use
Fintech
Financial Risk 0.435*** R2
= 0.477
0.184
Legal Risk 0.164*** Perceived
Risk
Security Risk 0.067
R2
=
0.638
Operational
Risk 0.186***
Figure 2: Results of the Structural Model Framework
Note: Significance Level: * Sig at 0.100, **Sig at 0.05, ***at 0.01.
Based on the Figure 2, it explains the outcomes of the structural model. The
structural model consisted of 3 different models, which are Perceived Benefit
Model, Perceived Risk Model and Intention to use Fintech Model. The R2 for the
Perceived Benefit Model is 0.594, it show that the model is 59.40% fit between
the perceived benefit factors (Economic benefit, Seamless transaction, and
Convenience) and the Perceived Benefit. Besides that, for the Perceived Risk
Model, the R2 is 0.638, it show 63.80% the model is fit between the perceived risk
factors (Financial risk, Legal risk, Security risk, and Operational risk) and the
Perceived Risk. Lastly, for the Intention to Use Fintech Model, the R2 is 0.477. It
shows that only 47.60% the model is fit between the independent variable
(Perceived Benefit and Perceived Risk) and the dependent variable (Intention to
use Fintech). All the hypotheses were been proved for significance except H8.
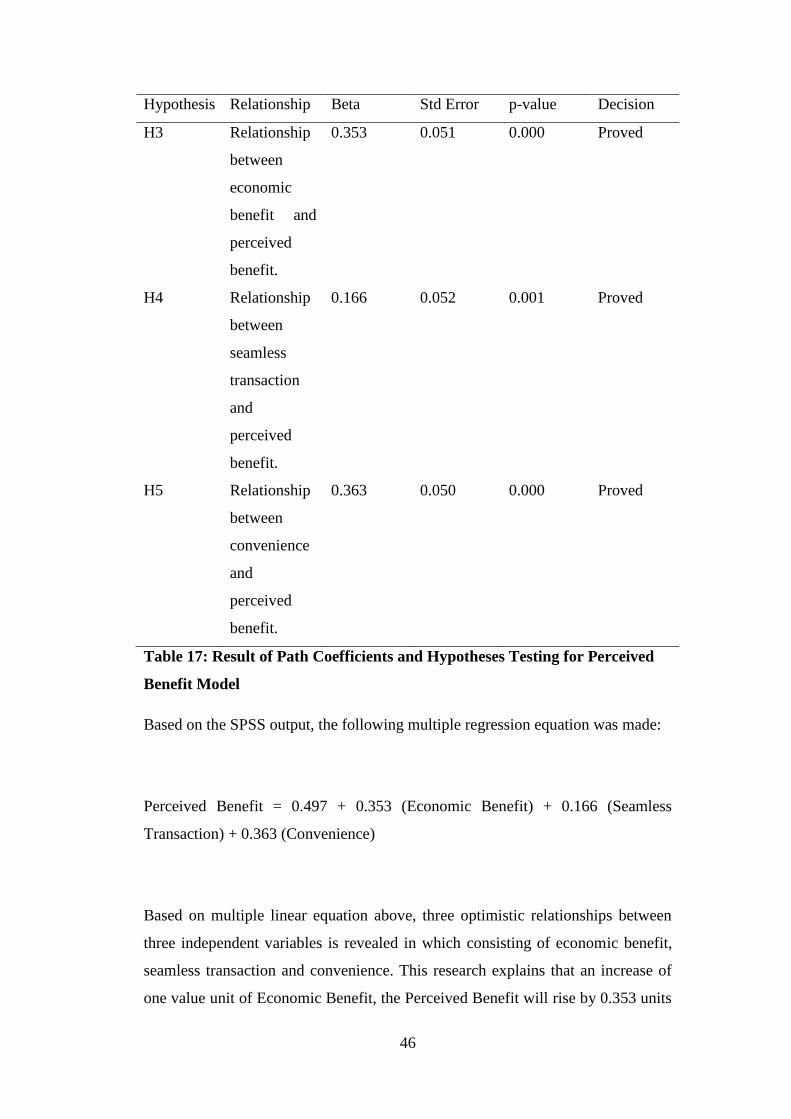
46
Hypothesis Relationship Beta Std Error p-value Decision
H3 Relationship
between
economic
benefit and
perceived
benefit.
0.353 0.051 0.000 Proved
H4 Relationship
between
seamless
transaction
and
perceived
benefit.
0.166 0.052 0.001 Proved
H5 Relationship
between
convenience
and
perceived
benefit.
0.363 0.050 0.000 Proved
Table 17: Result of Path Coefficients and Hypotheses Testing for Perceived
Benefit Model
Based on the SPSS output, the following multiple regression equation was made:
Perceived Benefit = 0.497 + 0.353 (Economic Benefit) + 0.166 (Seamless
Transaction) + 0.363 (Convenience)
Based on multiple linear equation above, three optimistic relationships between
three independent variables is revealed in which consisting of economic benefit,
seamless transaction and convenience. This research explains that an increase of
one value unit of Economic Benefit, the Perceived Benefit will rise by 0.353 units

47
while other independent variables stay constant. Besides that, an increase of one
value unit of Seamless Transaction, the Perceived Benefit will rise by 0.166 units
while other independent variables stay constant. In addition, an increase of one
value unit of Convenience, the Perceived Benefit will increase by 0.353 units
while other independent variables stay constant.
H3: Economic benefit is positive relationship to perceived benefit.
Based on the Table 17, the independent variable, economic benefit (EB) is valued
a p-value of 0.000, which is less than the 0.05 significance level. This resulted
having a significant relationship with the perceived benefit and the beta
coefficient is positive, which is meeting the hypothesis established.
H4: Seamless transaction is positive relationship to perceived benefit.
Based on the Table 17, the independent variable, seamless transaction (ST) is
valued a p-value of 0.001, which is less than the 0.05 significance level. This
resulted having a significant relationship with the perceived benefit and the beta
coefficient is positive, which is meeting the hypothesis established.
H5: Convenience is positive relationship to perceived benefit.
Based on the Table 17, the independent variable, convenience (CV) is valued a p-
value of 0.000, which is less than the 0.05 significance level. This resulted having
a significant relationship with the perceived benefits and the beta coefficient is
positive, which is meeting the hypothesis established.

48
Hypothesis Relationship Beta Std Error p-value Decision
H6 Relationship
between
financial risk
and
perceived
risk.
0.435 0.053 0.000 Proved
H7 Relationship
between
legal risk and
perceived
risk.
0.164 0.051 0.002 Proved
H8 Relationship
between
security risk
and
perceived
risk.
0.067 0.057 0.238 Not Proved
H9 Relationship
between
operational
risk and
perceived
risk.
0.186 0.055 0.001 Proved
Table 18: Result of Path Coefficients and Hypotheses Testing for Perceived
Risk Model
Based on the SPSS output, the following multiple regression equation was made:
Perceived Risk = 0.636 + 0.435 (Financial Risk) + 0.164 (Legal Risk) + 0.067
(Security Risk) + 0.186 (Operational Risk)
49
Based on the multiple linear equation above, four relationships between four
independent variables is revealed in which consisting of financial risk, legal risk,
security risk, and operational risk. The research explained that an increase of one
value unit of Financial Risk, the Perceived Risk will rise by 0.435 units while
other independent variables stay constant. Besides that, an increase of one value
unit of Legal Risk, the Perceived Risk will rise by 0.164 units while other
independent variables stay constant. In addition, an increase of one value unit of
Security Risk, the Perceived Risk will increase by 0.067 units while other
independent variables stay constant. Lastly, an increase of one value unit of
Operational Risk, the Perceived Risk will increase by 0.186 units while other
independent variables stay constant.
H6: Financial risk is positive relationship with perceived risk.
Based on the Table 18, the independent variable, financial risk (FR) is valued a p-
value of 0.000, which is less than the 0.05 significance level. This resulted having
a significant relationship with the perceived risk and the beta coefficient is
positive, which is meeting the hypothesis established.
H7: Legal risk is positive relationship with perceived risk.
Based on the Table 18, the independent variable, legal risk (LR) is valued a p-
value of 0.000, which is less than the 0.05 significance level. This resulted having
a significant relationship with the perceived risk, and the beta coefficient is
positive, which is meeting the hypothesis established.
H8: Security risk is positive relationship with perceived risk.
Based on the Table 18, the independent variable, security risk (SR) is valued a p-
value of 0.238, which is greater than then 0.1 significance level. This resulted the
SR does not have a significant relationship with the perceived risk, however, the
beta coefficient is positive, hence, it does not meet the hypothesis established.

50
H9: Operational risk is positive relationship with perceived risk.
Based on the Table 18, the independent variable, operational risk (OR) is valued a
p-value of 0.001, which is less than the 0.05 significance level. This resulted
having a significant relationship with the perceived risk, and the beta coefficient is
positive, which is meeting the hypothesis established.
Hypothesis Relationship Beta Std Error p-value Decision
H1 Relationship
between
perceived
benefit and
intention to
use Fintech.
0.575 0.047 0.000 Proved
H2 Relationship
between
perceived
risk and
intention to
use Fintech.
0.184 0.042 0.000 Proved
Table 19: Result of Path Coefficients and Hypotheses Testing for Intention to
use Fintech Model
Based on the SPSS output, the following multiple regression equation was made:
Intention to use Fintech = 0.932 + 0.575 (Perceived Benefit) + 0.184 (Perceived
Risk)
From the last multiple linear equation above, this is the last model which explain
the main objective of the research study. Only two optimistic relationships
between two independent variables is revealed in which consisting of perceived
benefit and perceived risk. This research explains that an increase of one value

51
unit of perceived benefit, the intention to use Fintech will rise by 0.575 units while
other independent variables stay constant. Besides that, an increase of one value
unit of perceived risk, the intention to use Fintech will rise by 0.184 units while
other independent variables stay constant.
H1: Perceived benefit is positive relationship to the Fintech intention to use.
Based on the Table 19, the independent variable, perceived benefit (PB) is valued
a p-value of 0.000, which is less than the 0.05 significance level. This resulted
having a significant relationship with the perceived risk, and the beta coefficient is
positive, which is meeting the hypothesis established.
H2: Perceived risk is negative relationship to the Fintech intention to use.
Based on the Table 19, the independent variable, perceived risk (PR) is valued a
p-value of 0.000, which is less than the 0.05 significance level. This resulted
having a significant relationship with the perceived risk; however, the beta
coefficient is positive, hence, it does not meet the hypothesis established.
4.7 Conclusion
This chapter presents the detailed interpretation of all the quantitative analysis.
For example, interpretation of the descriptive analysis, reliability test,
multicollinearity analysis, pearson correlation, as well as the multiple linear
regression analysis. These results findings will carried forward into the following
Chapter 5 for future discussing.

52
CHAPTER 5
RECOMMENDATION AND CONCLUSION
5.1 Introduction
The summary of statistical analysis, main findings and the outcomes of hypothesis
testing found in earlier chapters can be found in this chapter. It also can be known
as discussion of major findings. It follows with reviewing the implication to this
research study. Next, the limitation of the research study will be stated out and
given some recommendations for future research. Finally, it leads to the
construction of the conclusion of this research.
5.2 Discussion of Major Findings
The aim of these research studies is to study the perceived benefits and risks
towards the intention to use Fintech. The perceived benefits which are included
economic benefits, seamless transaction and convenience. In addition, the research
applied financial risk, security risk, legal risk, and operational risk.
Recently, as the technology getting more advanced, there are many people
actually already adopting Fintech in their daily life. Therefore, most of them did
not take perceived risks into the account as they knew the Fintech can bring much
more benefits than drawbacks to them. For example, the convenience of using
Fintech is a huge attraction for them as they no need to go physically to the bank
to do any bank transactions. What they need is only an electronic device and a
stable internet connection and that’s it. They can access into their banking account
anytime and anywhere. In the overall, despite of everything, they will continue to
use Fintech in their future.
53
5.2.1 Findings on the Hypothesis Three (H3)
H3: Economic benefit has significant positive relationship to perceived
benefit.
Economic benefits is one of the major benefits that people consider when
they using Fintech. This is because economic benefit explains that how
much they can save (in term of cost reductions and financial gains) when
they using Fintech when compared to traditional way. The research found
out that economic benefit has a positive significant effect to the intention
to use Fintech. This showed a similar result when compared to the past
study as the reason why they use Fintech is because of the economic
benefit (Chuen & Teo, 2015; Ryu, 2018; Lee & Lee, 2012; Gerber, Hui, &
Kuo, 2012). They can save much money when they use Fintech to do any
bank related services. The cost of transportation can be very crucial when
the nearby bank is very far from their home. Besides, most of the
traditional banking services required service charges therefore they can
skip from paying extra when they start to use Fintech. They also can use
many financial services in one time so that they can save more fees and
charges.
5.2.2 Findings on the Hypothesis Four (H4)
H4: Seamless transaction has significant positive relationship to perceived
benefit.
Seamless transaction refers to the how much counterparty that needed be
involved in any banking services. It is one of the major concerns of people
in using Fintech as they sure want the things to become more simple and
easy. In easy words, they treat it as one of the benefits of using Fintech as
the Fintech may eliminates the participations of third party. The research
found out that seamless transaction has a positive significant effect to the
intention to use Fintech. This showed a similar result when compared to
the past study as the reason why they use Fintech is because of the

54
seamless transaction (Chishti, 2016; Zavolokina, Dolata, & Schwabe, 2016;
Ryu, 2018). When comes to peer-to-peer transaction, they can save costs
when it involved middleman in order to facilitate the banking services.
Furthermore, without middleman interference, they can take control on
their own fund.
5.2.3 Findings on the Hypothesis Five (H5)
H5: Convenience has significant positive relationship to perceived benefit.
Convenience for sure, is one of the most concerned benefits after people
using Fintech. In terms of convenience, people can think of time and
difficulty of using Fintech. However, what convenience can gives to the
people is the flexibility and efficiency of doing any banking services.
Therefore, as long as Fintech gives convenience to the people who used it,
then they basically will continue to use it in future. The research found out
that convenience has a positive significant effect to the intention to use
Fintech. This showed a similar result when compared to the past study as
the reason why they use Fintech is because of the convenience that they
can be enjoyed (Ryu, 2018; Forsythe et al., 2006; Terblanche & Taljaard,
2018; Chuen & Teo, 2015; Okazaki & Mendez, 2013). Banking services
can be very fast when they using Fintech as all can be done via online.
They also can do it anytime and anywhere as long as they have electronic
devices that can be accessed to internet connection and also a stable
internet connection. The most important point is the Fintech is easy to be
used so that they so preferred to use it to carry on any banking services
that available in Fintech.
5.2.4 Findings on the Hypothesis Six (H6)
H6: Financial risk has significant positive relationship with perceived risk.

55
The financial risk is one of the greatest significant risks among the
perceived risk in using and adopting Fintech. In terms of the financial risk,
people are facing risks of losing their money in the process of the usage of
the Fintech. The loss is not included additional charges or transaction fees
of the using Fintech but the available cash balance in their banking account.
Apart from that, by looking on the other perspectives of some people, if
we taking into account the additional charges or transaction fees that
involved in Fintech, the possibility of using Fintech can be lowered as
some banking services may charge a quite amount of service fees or
transaction costs. For example, if went into the banks using the services
provided by the counter then will be an additional transaction service fee
be charge while if using Fintech technology such as mobile payments or
online banking or ATM to do transaction then will eliminate the additional
transaction fee because it is zero transaction fee. Thus, financial risk
occupied a portion of the perceived risk in using financial risk. The
research found out that the financial risk has a positive significant effect to
the perceived risk. This showed a similar result when compared to the past
study as the reason why they use Fintech (Ryu, 2018; McWaters, 2015;
Zavolokina, Dolata, & Schwabe, 2016; Liu, Yang, & Li, 2012). This
further proved that the financial risk is one of the risks that people will
consider before they are trying to use Fintech to avoid possibility of
breakdown of the financial operation system, financial scam, moral hazard,
as well as additional transaction charges linked to the original adoption
value.
5.2.5 Findings on the Hypothesis Seven (H7)
H7: Legal risk has significant positive relationship with perceived risk.
When comes to legal risk, it actually involves PDPA (Personal Data
Protection Act) in which relates to customers’ personal data and privacy.
This is been a huge concern among the people who using Fintech as it may
compromises the whole stability in financial system. As if the legal risks

56
occurred, it may arise tons of security issues and regulation problems in
Fintech. In conclusion, when it relates to the risks that arise from using
Fintech, legal risk is one of the risks that cannot be ignored by people. In
the research, the legal risk has also positive relationship to the perceived
risk. This showed a similar result when compared to the past study as the
reason why they use Fintech (Jesse McWaters, 2015; Zavolokina, Dolata,
& Schwabe, 2016; Ryu, 2018; Chu, & Tseng, 2013). Although, this
statement seems inconsistent with the explanation above as people should
worry about legal risk and stop using Fintech. Instead, they still continue
to use Fintech is because there are implementations that had been done by
regulators in Malaysia such as Bank Negara Malaysia in order to prevent
any incident that relates to legal issues happens. As legal risk getting
bigger, people more tend to use Fintech as in their point of view, when the
problem getting serious, the relevant regulators and authority will do
something to handle it. Thus, it will leads to higher usage of Fintech
among people in Malaysia.
5.2.6 Findings on the Hypothesis Eight (H8)
H8: Security risk has significant positive relationship with perceived risk.
When security risk is mentioned, it actually is quite similar with legal risk
as both relates to the breach of data protection and security problem.
However, security risk is more on the possibility of violation of data
privacy because of cyber security attack instead of rules and regulations
that had been set by the regulators. In the other words, although we do
have rules and regulations that protect our data privacy, our data privacy
still can be compromised due to external issues such as hacking which
involves cyber security attack. Consequently, security risk of course is one
of the perceived risk that people concern when they adopting Fintech.
Based on the research, the security risk has insignificant positive
relationship to the perceived risk. This showed a similar result when
compared to the past study as the reason why they use Fintech (Schierz,

57
Schilke, & Wirtz, 2010; Ryu 2018; Lee M. C., 2009); only the result is not
significant. The occurrence of security risk leads to the leak of customers’
private and financial information to any party who interested with it. Thus,
it may get exposure of uncertainty of using Fintech. The insignificance of
the result reflects that people are more concern about security risk when
they using Fintech. In their point of views, those cyber security attacks are
hardly to be prevented and solved as it comes with uncertainty. We won’t
know when it comes and how serious the attack will caused to the Fintech
system. In conclusion, the security risk may give negative effect to the
intention of using Fintech.
5.2.7 Findings on the Hypothesis Nine (H9)
H9: Operational risk has significant positive relationship with perceived
risk.
Operational risk is the possible internal problem will happens when people
using Fintech. For example, when people using Fintech to do bank
transactions, they maybe will face the risk of transaction error due to
system error, thus will not complete the transaction in due time. After that,
people will looking on the effectiveness and efficiency of relevant
financial services companies or banks who offer the Fintech facilities to
tackle the problem and makes things back to the normal track. This is what
people is concern about as once problems occur, the reasons are not
always the concern but the solutions are the one. Therefore, operational
risk is the risk the people may concern about when they are using Fintech.
In the research, operational risk has positive significant relationship to the
perceived risk. This showed a similar result when compared to the past
study as the reason why they use Fintech (Barakat & Hussainey, 2013;
Ryu, 2018). Operation risk can be avoid by improving the internal
processes, employees and systems to overcome the lack of operational
skills, the systems’ break down, and insufficiency of internal processes
58
will lead to users’ distrust and dissatisfaction which possible happens this
in the organizational.
5.2.8 Findings on the Hypothesis One (H1)
H1: Perceived benefit has significant positive relationship to the Fintech
intention to use.
Perceived benefit is the awareness advantages of using Fintech when
compared to traditional banking services. As Fintech getting more
common in financial services industry, the people start to use Fintech as it
really brings many benefits such as convenience, seamless transaction and
economic benefit. As above mentions, this further proved that people tends
to use Fintech in their daily life and replacing traditional banking services.
Therefore, based on the research, the perceived benefit has positive
significant effect to the intention to use the Fintech. This is consistent with
the result that’s deal with respective benefits in the perceived benefit in
which also showed significant positive relationship (Ryu, 2018; Abramova
& Bohme, 2016; Benlian & Hess, 2011; Farivar & Yuan, 2014; Lee, Park,
& Kim, 2013; Lee M.C., 2009; Lee, Chae, & Cho, 2013).
5.2.9 Findings on the Hypothesis Two (H2)
H2: Perceived risk has significant negative relationship to the Fintech
intention to use.
Perceived risk is the awareness disadvantages of using Fintech when
compared to traditional banking services. Although the usage of Fintech
may occurs many unexpected risks that may causes losses, at the end they
still prefer to use Fintech. There are two main reasons that we can
concluded from the research. The first one is the benefits that people can
enjoy when they using Fintech. They mostly believe that benefits that
bring to them are far more beyond that the losses that they may bear of.

59
Second reason is the same explanation in the operation risk earlier. In their
perspective, as long as the problems getting serious, the relevant parties
only take it more serious and will take actions to solve it. As the risk
getting serious and rises the attention to the public, they make assumption
that the whole Fintech system will get improved if only the system found
something wrong. Something that seems too perfect is not good though as
we won’t know when the thing will go to south once something bad
happens. Therefore, based on the research, the perceived risk has positive
significant effect to the intention to use the Fintech. This showed a
dissimilar result when compared to the past study as the reason why they
use Fintech which suppose is negative relationship (Ryu, 2018; Abramova
& Bohme, 2016; Benlian & Hess, 2011; Lee, Chae, & Cho, 2013).
5.3 Implications to the research study
First of all, this research gives implication to the reader regarding the intention to
use Fintech decision. This research study observes perceived benefit as well as
risk towards the intention to use Fintech. This study also focuses on the specific
benefit and risk factors that mutually affect the intention to use Fintech. This study
discloses the formation of the intention to use Fintech which contributes by
specific benefits and risks. Furthermore, this research study give better
understanding of the benefit and risk factors which can lead to the decision choice
making process, thus the intention to use Fintech becomes more transparent and
traceable.
Besides that, practitioners can have better understanding on the benefit and risk
awareness so that the customer intention to use of Fintech can be motivated by
developing benefit-increasing and risk-reducing strategies. Practitioners can do
more development on risk-reducing strategies that might help in stimulating
higher confidence level in users to use Fintech. Besides that, this research study be
able to give practitioners valuable suggestion on what factors they should focus on
or prevent when promoting Fintech to customer. The findings discovered that the

60
four risk factors and three benefits give significant effect to the behavioral
intention to use Fintech except the security risk is not significant.
Lastly, Fintech companies can know more on what factors should be put first or
prevented when offering or introduce Fintech to their customers. It provides
Fintech companies to construct a risk-free transaction environment and it benefits
customers to construct long term strategies to develop Fintech businesses. The
efficiency of financial transactions and economic benefits also can be provided at
the same time with higher effort by those Fintech companies. Fintech companies
also able to deliver services effectively by recognizing the characteristics of each
Fintech user and, while customer expectations as well as demands can be matched,
therefore the services can be enhanced. Lastly, this research will provide a huge
help on Fintech companies to invest in the development of Fintech with an
appropriate amount of money, time and effort.
5.4 Limitations and Future Research Recommendations
During the research process, several limitations have been discovered, and the
limitations may serve as the opportunities for future researchers when they want to
conduct research in this field. The first limitation is discovered when this study is
conducted, which is this study is concentrating on specific sets of perceived
benefits and risk that is reflected from past studies. Hence, it is recommended for
future researchers to include other additional variables or specific variables to
study the Fintech such as quality improvement and recreational benefits, since the
perception of people is changing from time to time, there is no eternal answer for
this area.
The second limitation is that this study only study on the intention of people to use
Fintech, it does not include the actual behavior of people; the result may show that
a person has the intention to use Fintech, and the study ceased at here, there is no
further investigation and examination on whether the person really use the Fintech.
Therefore, future researchers are recommended that further the study by examine
the whether the respondents truly use the Fintech by enquiry the date of
respondents committed to use the Fintech. For example, at the commitment date,

61
examine whether the respondent used the Fintech, if not used, researchers can
seek for the reason from respondents.
The third limitation is this research study covering the all types of Fintech
(Payments, Wallets, Crowdfunding, Remittance, Lending, Insurtech and so on), it
does not specific which types of Fintech is studied; therefore, this study could
only present an overall finding on the intention of people to use Fintech. Hence,
for future study purpose, the researchers can specific what types of Fintech is
targeted, so that a deep understanding and insight on the intention to use a specific
Fintech will be acquired. Not every types of Fintech serving the same nature or
function, hence, the perception on the benefits and risk for each should be
different, and this will resulting a different intention on the use of Fintech.
Finally, the application for this study is limited, because this study is studying the
perception of the respondents stay in Malaysia, which mean, this study only
studies the behavior of the people staying in Malaysia, although foreigners stay in
Malaysia are may be one of the respondents, their respond may be altered, since
they are staying in Malaysia, their perception may be influenced by the lifestyle in
Malaysia. Therefore, the social media has enhanced the interaction of the human
population, people from all around the world are enabled to connect to each other
through social media platform, future researchers are recommended to expand the
sample size (try to exceed current 302 respondents), gather the perception of the
people from other countries through social media, so that, an overall finding on
the intention of the people in the world toward the use of Fintech. In a nut shell,
the overall population size are big, in order to has the deep insight and
understanding on the behavioral intention toward the use of Fintech of the human
population, continuous study on this field is necessary, nevertheless, the Fintech
will be evolved from time to time, the risk and benefits associated also will be
different as well.
5.5 Conclusion
This research focuses on the perceived benefit and risk toward the intention to use
Fintech. The major discussion of the findings determined that all the hypotheses
were verified with previous researcher’s hypotheses except the hypothesis two

62
(Perceived Risk) which suppose show a negative relationship to the intention to
use Fintech. Besides that, this chapter also provides the implications of the study
to relevant parties involve such as (i) reader to understanding better what is
Fintech, what is perceived benefit and risk factor which affect their decision to use
Fintech, (ii) practitioners can have better understanding on the benefit and risk
awareness so that the customer intention to use of Fintech can be motivated by
developing benefit-increasing and risk-reducing strategies, (iii) Fintech companies
able to know what factors should be put first or prevented when proposing Fintech
to their customers. Lastly, this chapter ends up with the limitations of the study
and gives suggestions to the future researcher when they intend to conducting this
research topic. In the conclusion, the purpose of this research had been attained by
figured out how perceived benefits (positive factors) and perceived risks (negative
factors) mutually influence the intention of customer to use Fintech.

63
REFERENCES
Aaker, D., Kumar, V., & Day, G. (2007). Marketing Research. Vol. 9 .
Abramova, S., & Böhme, R. (2016). Perceived benefit and risk as
multidimensional determinants of bitcoin use: a quantitative exploratory
study. Thirty Seventh International Conference on Information Systems,
Dublin 2016, 1-20.
Ajzen, I., & Fishbein, M. (1977). Attitude-behavior relations: a theoretical
analysis and review of empirical research. Psychological Bulletin, Vol. 84
Issue 5, pp. 888-918.
Arner, D. W., Barberis, J., & Buckley, R. P. (2015). The evolution of fintech: A
new post-crisis paradigm? Creative Commons AttributionNonCommercial-
NoDerivatives 4.0 International License, 1-45. Retrieved from
https://hub.hku.hk/bitstream/10722/221450/1/Content.pdf?accept=1
Bajpai, N. (2011). Business research methods. Pearson Education India.
Barakat, A., & Hussainey, K. (2013). Bank governance, regulation, supervision,
and risk reporting: Evidence from operational risk disclosures in European
banks. International Review of Financial Analysis, 30, 254-273.
Barberis, J. (2014, November 9). The rise of Fintech getting Hong Kong to lead
the digital financial transition in APAC. Retrieved from
https://www.slideshare.net/FinTechHk/fintech-hong-kong-report
Benlian, A., & Hess, T. (2011). Opportunities and risks of software-as-a-service:
Findings from a survey of IT executives. Decision Support Systems, 52(1),
232-246.
Bilkey, W. J. (1953). A psychological approach to consumer behavior analysis.
Journal of Marketing, 18(1), 18-25.
Boone, H. N., & Boone, D. A. (2012). Analyzing likert data. Journal of Extension,
50(2), 1-5.
Brown, J. D. (2011). Likert items and scales of measurement. Statistics, 15(1), 10-
14.
Burns, A. C., & Bush, R. F. (2005). Marketing Research: online research
applications. Person.
Celsi, M. W., Money, A. H., Samouel, P., & Page, M. (2011). Essentials of
business research methods. New York: ME Sharpe.

64
Chan, R. (2015, September 4). Asian regulators seek fintech balance. Retrieved
from financeasia: https://www.financeasia.com/News/401588,asian-
regulators-seek-fintech-balance.aspx
Cheng, T. E., Lam, D. Y., & Yeung, A. C. (2006). Adoption of internet banking:
an empirical study in Hong Kong. Decision Support Systems, 42(3), 1558-
1572.
Chiang, H.-S. (2013). Continuous usage of social networking sites: The effect of
innovation and gratification attributes. Online Information Review, Vol. 37
Issue 6, pp.851-871. doi: 10.1108/OIR-08-2012-0133
Chishti, S. (2016). How peer to peer lending and crowdfunding drive the fintech
revolution in the UK. In Banking Beyond Banks and Money, 55-68.
Chuen, D. L., & Teo, E. G. (2015). Emergence of FinTech and the LASIC
principles. The Journal of Financial Perspectives, 24-36. Retrieved from
https://www.ey.com/Publication/vwLUAssets/ey-financial-perspective-
fintech/%24FILE/ey-financial-perspective-fintech.pdf#page=24
Clow, K. E., & James, K. E. (2013). Essentials of marketing research: Putting
research into practice. Sage.
Comrey, A. L., & Lee, H. B. (2013). A first course in factor analysis. New York:
Psychology Press.
Cunningham, M. S. (1967). The major dimensions of perceived risk. Risk Taking
and Information Handling in Consumer Behavior.
Davis, F. D., Bagozzi, R. P., & Warshaw, P. R. (1989). User acceptance of
computer technology: A comparison of two theoretical models.
Management Science, 35(8), 982-1003.
Davis, F. D., Bagozzi, R. P., & Warshaw, P. R. (1992). Extrinsic and intrinsic
motivation to use computers in the workplace . Journal of Applied Social
Psychology, 22(14), 1111-1132.
Driscoll, D. L. (2011). Introduction to primary research: Observations, surveys,
and interviews. Writing Spaces: Readings on Writing, 2, 153-174.
Fagbemi, T. O., Ajibolade, S. O., Arowomole, S. S., & Ayadi, M. F. (2011).
Repositioning the Nigerian tax system for sustainable development.
Annual International Academy of African Business and Development, 42-
50.
Farivar, S., & Yuan, Y. (2014). The dual perspective of social commerce adoption.
Proceeding in SIGHCI, 1-6.

65
Featherman, M. S., & Pavlou, P. A. (2003). Predicting e-services adoption: A
perceived risk facets perspective. International Journal of Human-
computer Studies, 59(4), 451-474.
Fellegi, I. P. (2003). Survey methods and practices. Statistics Canada, 1-408.
Field, A., & Hole, G. (2002). How to design and report experiments. Sage.
Fong, V. (2018, July 18). Fintech Malaysia Report 2018 – The State of Play for
Fintech Malaysia. Retrieved from fintechnews:
https://fintechnews.my/17922/editors-pick/fintech-malaysia-report-2018/
Forsythe, S., Liu, C., Shannon, D., & Gardner, L. C. (2006). Development of a
scale to measure the perceived benefits and risks of online shopping.
Journal of Interactive Marketing, 20(2), 55-75.
Freedman, R. S. (2006). Introduction to financial technology. New York:
Academic Press.
Gerber, E. M., Hui, J. S., & Kuo, P. Y. (2012). Crowdfunding: Why people are
motivated to post and fund projects on crowdfunding platforms. In
Proceedings of the International Workshop on Design, Influence, and
Social Technologies: Techniques, Impacts and Ethics, Vol. 2, No. 11.
Giri, P. K., & Bannerjee, J. (2001). Introduction to statistics. Academic Publishers.
Hair Jr, J. F., Wolfinbarger, M., Money, A. H., Samouel, P., & Page, M. J. (2015).
Essentials of business research methods. Routledge.
Hair, J. F., Babin, B., Money, A. H., & Samuel, P. (2003). Essential of business.
United States of America: John Wiley & Sons.
Hox, J. J., & Boeije, H. R. (2005). Data collection, primary versus secondary.
Imbert, F., & Marino, J. (2016, May). LendingClub shares tumble after CEO
resigns. Retrieved from cnbc: https://www.cnbc.com/2016/05/09/lending-
club-shares-tumble-after-ceo-resigns.html
Jesse McWaters, F. (2015). The future of financial services: How disruptive
innovations are reshaping the way financial services are structured,
provisioned and consumed. In World Economic Forum.
Jurison, J. (1995). The role of risk and return in information technology
outsourcing decisions. Journal of Information Technology, 10(4), 239-247.
Khalid, K., Abdullah, H. H., & Kumar M, D. (2012). Get along with quantitative
research process. International Journal of Research in Management, 15-29.
Retrieved from https://rspublication.com/ijrm/march%2012/2.pdf
66
Kim, C., Mirusmonov, M., & Lee, I. (2010). An empirical examination of factors
influencing the intention to use mobile payment. Computers in Human
Behavior, Vol. 26, pp.310-322. doi:10.1016/j.chb.2009.10.013
Kim, D. J., Ferrin, D. L., & Rao, H. R. (2008). A trust-based consumer decision-
making model in electronic commerce: The role of trust, perceived risk,
and their antecedents. Decision Support Systems, 44(2), 544-564.
Kumari, S. (2008). Multicollinearity: Estimation and elimination. Journal of
Contemporary Research in Management, 87-95.
Landau, S. (2004). A handbook of statistical analyses using SPSS. CRC.
Lee, E., & Lee, B. (2012). Herding behavior in online P2P lending: An empirical
investigation. Electronic Commerce Research and Applications, 11(5),
495-503.
Lee, H., Park, H., & Kim, J. (2013). Why do people share their context
information on Social Network Services? A qualitative study and an
experimental study on users' behavior of balancing perceived benefit and
risk. International Journal of Human-Computer Studies, 71(9), 862-877.
Lee, M. C. (2009). Factors influencing the adoption of internet banking: An
integration of TAM and TPB with perceived risk and perceived benefit.
Electronic Commerce Research and Applications, 8(3), 130-141.
Lee, S. G., Chae, S. H., & Cho, K. M. (2013). Drivers and inhibitors of SaaS
adoption in Korea. International Journal of Information Management,
33(3), 429-440.
Lee, T. H., & Kim, H. W. (2015). An exploratory study on fintech industry in
Korea: Crowdfunding case. International Conference on Innovative
Engineering Technologies, 58-64. Retrieved from
http://iieng.org/images/proceedings_pdf/7333E0815045.pdf
Lewin, K. (1943). Forces behind food habits and methods of change. Bulletin of
the national Research Council, 108(1043), 35-65. Retrieved from
https://www.nap.edu/read/9566/chapter/2
Liang, T.-P., & Yeh, Y.-H. (2011). Effect of use contexts on the continuous use of
mobile services: the case of mobile games. Personal and Ubiquitous
Computing, Vol. 15 Issue 2, pp. 187-196. doi:10.1007/s00779-010-0300-1
Lim, W. M., & Ting, D. H. (2014). Consumer acceptance and continuance of
online group buying. Journal of Computer Information Systems, 54(3), 87-
96.

67
Liu, Y., Yang, Y., & Li, H. (2012). A Unified Risk-Benefit Analysis Framework
for Investigating Mobile Payment Adoption. In ICMB, p. 20.
Lwin, M., Wirtz, J., & Williams, J. D. (2007). Consumer online privacy concerns
and responses: a power–responsibility equilibrium perspective. Journal of
the Academy of Marketing Science, 35(4), 572-585.
Mackenzie, A. (2015). The fintech revolution. London Business School Review,
26(3), 50-53.
McCrae, R. R., Kurtz, J. E., Yamagata, S., & Terracciano, A. (2011). Internal
consistency, retest reliability, and their implications for personality scale
validity. Personality and Social Psychology Review, 15(1), 28-50.
Okazaki, S., & Mendez, F. (2013). Exploring convenience in mobile commerce:
Moderating effects of gender. Computers in Human Behavior, 29(3),
1234-1242.
Peter, J. P., & Tarpey Sr, L. X. (1975). A comparative analysis of three consumer
decision strategies. Journal of Consumer Research, 2(1), 29-37.
Pi, S. M., Liao, H. L., Liu, S. H., & Lee, I. S. (2011). Factors influencing the
behavior of online group-buying in Taiwan. African Journal of Business
Management, 5(16), 7120-7129.
Polit, D. F., Beck, C. T., & Hungler, B. P. (2006). Essentials of nursing research.
Methods, appraisal and utilization. 6.
Rahman, M. S., Khan, A. H., & Islam, N. (2013). An empirical study on revealing
the factors influencing online shopping intention among Malaysian
consumers. Journal of Human and Social Science Research, 9-18.
Roller, M. R., & Lavrakas, P. J. (2015). Applied qualitative research design: A
total quality framework approach. Guilford Publications.
Roscoe, J. T. (1975). Fundamental research statistics for the behavioral sciences.
Ryu, H.-S. (2018). What makes users willing or hesitant to use Fintech?: the
moderating eefect of user type. Industrial Management & Data Systmes,
Vol. 118 Issue: 3, pp.541-569. doi:https://doi.org/10.1108/IMDS-07-2017-
0325
Sagor, R. (2000). Guiding school improvement with action research. ASCD.
Sandahl, S., Powers, C., & Kavmark, E. (2012). Influences behind the success or
failure of private label goods: A study of four private label products. 1-73.
Retrieved from http://www.diva-
portal.org/smash/get/diva2:537533/FULLTEXT01.pdf

68
Santos, J. R. (1999). Cronbach’s alpha: A tool for assessing the reliability of
scales. Journal of Extension, 37(2), 1-5.
Schierz, P. G., Schilke, O., & Wirtz, B. W. (2010). Understanding consumer
acceptance of mobile payment services: An empirical analysis. Electronic
Commerce Research and Applications, 9(3), 209-216.
Sekaran, U., & Bougie, R. (2016). Research methods for business: A skill building
approach. John Wiley & Sons.
Sharma, S., & Gutiérrez, J. A. (2010). An evaluation framework for viable
business models for m-commerce in the information technology sector.
Electronic Markets, 20(1), 33-52.
Shen, Y. C., Huang, C. Y., Chu, C. H., & Hsu, C. T. (2010). A benefit–cost
perspective of the consumer adoption of the mobile banking system.
Behaviour & Information Technology, 29(5), 497-511.
Skan, J., Dickerson, J., & Masood, S. (2015). The future of fintech and
banking:digitally disrupted or reimagined? Retrieved from
https://www.accenture.com/de-de/_acnmedia/PDF-8/Accenture-Future-
Fintech-Banking-ASG.pdf
Stockburger, D. W. (2001). Multivariate statistics: Concepts, models, and.
Springfield: Missouri State University. Retrieved from
http://psychstat3.missouristate.edu/Documents/MultiBook3/mbk.htm
Sweeney, D. (2017, February 22). What is FinTech and What Does it Mean for
Small Businesses? Retrieved from Business :
https://www.business.com/articles/what-is-fintech-and-what-does-it-mean-
for-small-businesses/
Teijlingen, V., R., E., & Hundley, V. (2001). The importance of pilot studies.
Retrieved from
http://aura.abdn.ac.uk/bitstream/handle/2164/157/SRU35%20pilot%20stud
ies.pdf?sequence=1&isAllowed=y
Tingchi Liu, M., Brock, J. L., Cheng Shi, G., Chu, R., & Tseng, T. H. (2013).
Perceived benefits, perceived risk, and trust: Influences on consumers'
group buying behaviour. Asia Pacific Journal of Marketing and Logistics,
25(2), 225-248.
University, A. (2011). Statistical package for social science (SPSS).
Cairo:American University.
Vaus, D. D. (2002). Surveys in social research. New South Wales: Allen & Unwin.
69
Weisburd, D., & Britt, C. (2007). Statistics in criminal justice. Springer Science &
Business Media.
Wilkie, W., & Pessemier, E. (1973). Issues in marketing's use of multi-attribute
attitude models. Journal of Marketing Research, 428-441.
Yang, L., & Mao, M. (2014). Antecendents of online group buying behavior: from
price leverage and crowd effect perspectives. In PACIS, 89.
Zavolokina, L., Dolata, M., & Schwabe, G. (2016). Fintech – what’s in a name?
International Conference on Information Systems, 1-19. Retrieved from
http://www.zora.uzh.ch/id/eprint/126806/1/FinTech_Research_Paper_revi
sed.pdf
Zhou, T. (2013). An empirical examination of continuance intention of mobile
payment services. Decision Support Systems, Vol. 54 pp. 1085–1091.
doi:10.1016/j.dss.2012.10.034
Zikmund, W. G., Babin, B. J., Carr, J. C., & Griffin, M. (2013). Business research
methods. Cengage Learning. Retrieved from
http://aglow.edu.pk/documents/BusinessResearchMethodsbywilliam.pdf
Zikmund, W., Babin, B., Carr, J., & Griffin, M. (2010). Business research
methods (8th ed.) . Mason, HO: Cengage Learning.

70
APPENDICES

71

72

73

74

75

76
Statistics
Gender Age Monthly income Education level
N Valid 302 302 302 302
Missing 0 0 0 0
Mean 1.5132 2.2914 2.7450 1.9503
Median 2.0000 2.0000 3.0000 2.0000
Mode 2.00 2.00 1.00 2.00
Std. Deviation .50065 1.06337 1.41112 .67773
Skewness -.053 .314 .281 .447
Std. Error of Skewness .140 .140 .140 .140
Kurtosis -2.011 -1.125 -1.193 .459
Std. Error of Kurtosis .280 .280 .280 .280
Gender
Frequency Percent Valid Percent Cumulative
Percent
Valid
1.00 147 48.7 48.7 48.7
2.00 155 51.3 51.3 100.0
Total 302 100.0 100.0
Female = 1 Male = 2

77
Age
Frequency Percent Valid Percent Cumulative
Percent
Valid
1.00 84 27.8 27.8 27.8
2.00 101 33.4 33.4 61.3
3.00 62 20.5 20.5 81.8
4.00 55 18.2 18.2 100.0
Total 302 100.0 100.0
18-24 = 1 25-34 = 2 35-44 = 3 Above 45 = 4

78
Monthlyincome
Frequency Percent Valid Percent Cumulative
Percent
Valid
1.00 76 25.2 25.2 25.2
2.00 69 22.8 22.8 48.0
3.00 64 21.2 21.2 69.2
4.00 42 13.9 13.9 83.1
5.00 51 16.9 16.9 100.0
Total 302 100.0 100.0
Less than RM 2, 500 = 1
RM 2 , 501 - RM 3, 500 = 2
RM 3 , 501 - RM 4, 500 = 3
RM 4 , 501 - RM 5, 500 = 4
Above RM 5, 501 = 5

79
Educationlevel
Frequency Percent Valid Percent Cumulative
Percent
Valid
1.00 71 23.5 23.5 23.5
2.00 181 59.9 59.9 83.4
3.00 44 14.6 14.6 98.0
4.00 6 2.0 2.0 100.0
Total 302 100.0 100.0
Primary / secondary school = 1 Undergraduates = 2 Masters = 3 PhD = 4

80
Reliability Analysis
PB
Reliability Statistics
Cronbach's
Alpha
N of
Items
.891 4
EB
Reliability Statistics
Cronbach's
Alpha
N of
Items
.842 3
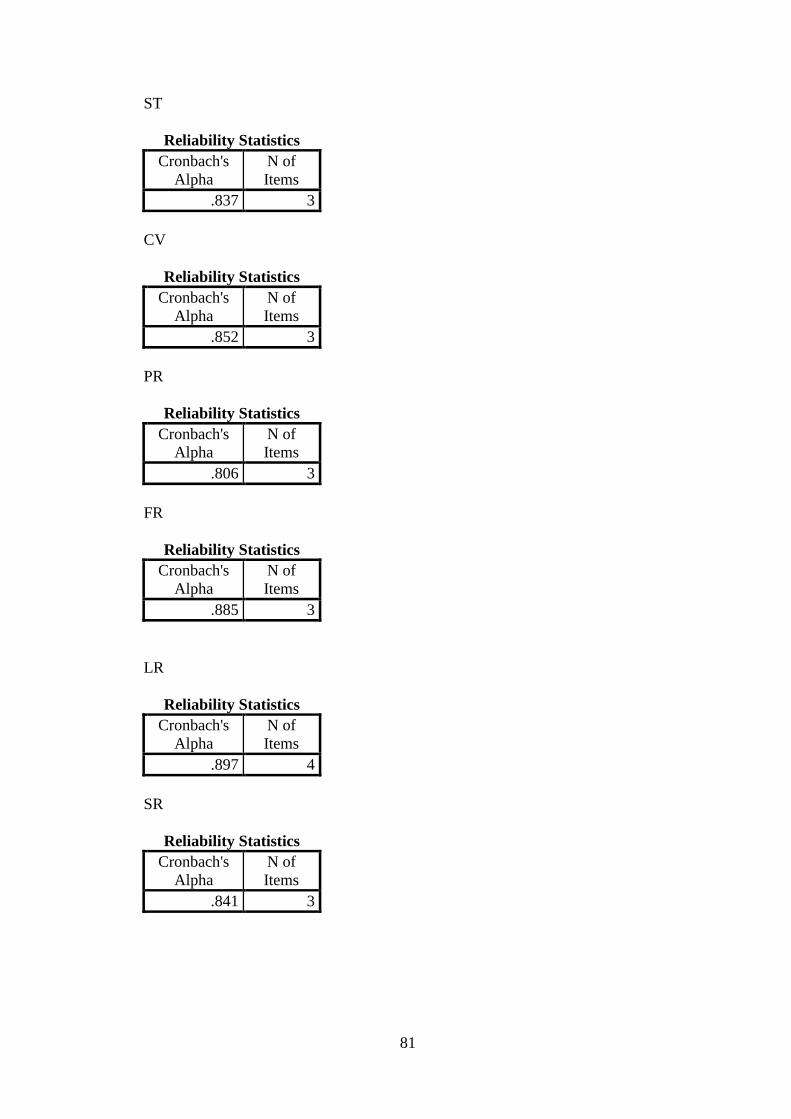
81
ST
Reliability Statistics
Cronbach's
Alpha
N of
Items
.837 3
CV
Reliability Statistics
Cronbach's
Alpha
N of
Items
.852 3
PR
Reliability Statistics
Cronbach's
Alpha
N of
Items
.806 3
FR
Reliability Statistics
Cronbach's
Alpha
N of
Items
.885 3
LR
Reliability Statistics
Cronbach's
Alpha
N of
Items
.897 4
SR
Reliability Statistics
Cronbach's
Alpha
N of
Items
.841 3

82
OR
Reliability Statistics
Cronbach's
Alpha
N of
Items
.881 3
IF
Reliability Statistics
Cronbach's
Alpha
N of
Items
.791 4
Pearson Correlation
Correlations
PB EB ST CV PR FR LR SR O.R IF
PB Pearson
Correlat
ion
1 .694
**
.620
**
.675
**
.451
**
.411
**
.343
**
.371
**
.375
**
.666
**
Sig. (2-
tailed)
.000 .000 .000 .000 .000 .000 .000 .000 .000
N 302 302 302 302 302 302 302 302 302 302
E
B
Pearson
Correlat
ion
.694
**
1 .667
**
.606
**
.520
**
.502
**
.461
**
.368
**
.453
**
.646
**
Sig. (2-
tailed)
.000 .000 .000 .000 .000 .000 .000 .000 .000
N 302 302 302 302 302 302 302 302 302 302
ST Pearson
Correlat
ion
.620
**
.667
**
1 .586
**
.422
**
.385
**
.378
**
.285
**
.357
**
.625
**
Sig. (2-
tailed)
.000 .000 .000 .000 .000 .000 .000 .000 .000
N 302 302 302 302 302 302 302 302 302 302

83
C
V
Pearson
Correlat
ion
.675
**
.606
**
.586
**
1 .383
**
.311
**
.252
**
.284
**
.322
**
.667
**
Sig. (2-
tailed)
.000 .000 .000 .000 .000 .000 .000 .000 .000
N 302 302 302 302 302 302 302 302 302 302
PR Pearson
Correlat
ion
.451
**
.520
**
.422
**
.383
**
1 .765
**
.688
**
.613
**
.662
**
.463
**
Sig. (2-
tailed)
.000 .000 .000 .000 .000 .000 .000 .000 .000
N 302 302 302 302 302 302 302 302 302 302
FR Pearson
Correlat
ion
.411
**
.502
**
.385
**
.311
**
.765
**
1 .739
**
.663
**
.660
**
.452
**
Sig. (2-
tailed)
.000 .000 .000 .000 .000 .000 .000 .000 .000
N 302 302 302 302 302 302 302 302 302 302
L
R
Pearson
Correlat
ion
.343
**
.461
**
.378
**
.252
**
.688
**
.739
**
1 .597
**
.680
**
.448
**
Sig. (2-
tailed)
.000 .000 .000 .000 .000 .000 .000 .000 .000
N 302 302 302 302 302 302 302 302 302 302
SR Pearson
Correlat
ion
.371
**
.368
**
.285
**
.284
**
.613
**
.663
**
.597
**
1 .711
**
.389
**
Sig. (2-
tailed)
.000 .000 .000 .000 .000 .000 .000 .000 .000
N 302 302 302 302 302 302 302 302 302 302
O.
R
Pearson
Correlat
ion
.375
**
.453
**
.357
**
.322
**
.662
**
.660
**
.680
**
.711
**
1 .451
**
Sig. (2- .000 .000 .000 .000 .000 .000 .000 .000 .000

84
tailed)
N 302 302 302 302 302 302 302 302 302 302
IF Pearson
Correlat
ion
.666
**
.646
**
.625
**
.667
**
.463
**
.452
**
.448
**
.389
**
.451
**
1
Sig. (2-
tailed)
.000 .000 .000 .000 .000 .000 .000 .000 .000
N 302 302 302 302 302 302 302 302 302 302
**. Correlation is significant at the 0.01 level (2-tailed).
Correlations
PB PR IF
PB
Pearson Correlation 1 .451** .666
**
Sig. (2-tailed) .000 .000
N 302 302 302
PR
Pearson Correlation .451** 1 .463
**
Sig. (2-tailed) .000 .000
N 302 302 302
IF
Pearson Correlation .666** .463
** 1
Sig. (2-tailed) .000 .000
N 302 302 302
**. Correlation is significant at the 0.01 level (2-tailed).
Person Correlation Analysis
Correlations
PB EB ST CV
PB
Pearson Correlation 1 .694** .620
** .675
**
Sig. (2-tailed) .000 .000 .000
N 302 302 302 302
EB
Pearson Correlation .694** 1 .667
** .606
**
Sig. (2-tailed) .000 .000 .000
N 302 302 302 302
ST
Pearson Correlation .620** .667
** 1 .586
**
Sig. (2-tailed) .000 .000 .000
N 302 302 302 302
CV
Pearson Correlation .675** .606
** .586
** 1
Sig. (2-tailed) .000 .000 .000
N 302 302 302 302
**. Correlation is significant at the 0.01 level (2-tailed).

85
Correlations
PR FR LR SR O.R
PR
Pearson Correlation 1 .765** .688
** .613
** .662
**
Sig. (2-tailed) .000 .000 .000 .000
N 302 302 302 302 302
FR
Pearson Correlation .765** 1 .739
** .663
** .660
**
Sig. (2-tailed) .000 .000 .000 .000
N 302 302 302 302 302
LR
Pearson Correlation .688** .739
** 1 .597
** .680
**
Sig. (2-tailed) .000 .000 .000 .000
N 302 302 302 302 302
SR
Pearson Correlation .613** .663
** .597
** 1 .711
**
Sig. (2-tailed) .000 .000 .000 .000
N 302 302 302 302 302
O.R
Pearson Correlation .662** .660
** .680
** .711
** 1
Sig. (2-tailed) .000 .000 .000 .000
N 302 302 302 302 302
**. Correlation is significant at the 0.01 level (2-tailed).
Multiple regression models
DV= PB, IV= EB,ST,CV
Model Summaryb
Model R R
Square
Adjusted
R Square
Std. Error
of the
Estimate
Change Statistics
R Square
Change
F
Change
df1 df2 Sig. F
Change
1 .773a .598 .594 .46220 .598 147.639 3 298 .000
a. Predictors: (Constant), CV, ST, EB
b. Dependent Variable: PB
ANOVAa
Model Sum of Squares df Mean Square F Sig.
1
Regression 94.622 3 31.541 147.639 .000b
Residual 63.663 298 .214
Total 158.284 301
a. Dependent Variable: PB
b. Predictors: (Constant), CV, ST, EB

86
Coefficientsa
Model Unstandardized
Coefficients
Standardized
Coefficients
t Sig. 95.0%
Confidence
Interval for B
Collinearity
Statistics
B Std.
Error
Beta Lower
Bound
Upper
Bound
Tolerance VIF
1
(Constant) .497 .175 2.840 .005 .153 .841
EB .353 .051 .368 6.962 .000 .253 .453 .484 2.065
ST .166 .052 .167 3.218 .001 .064 .267 .503 1.988
CV .363 .050 .355 7.310 .000 .265 .461 .573 1.745
a. Dependent Variable: PB
Collinearity Diagnosticsa
Model Dimension Eigenvalue Condition
Index
Variance Proportions
(Constant) EB ST CV
1
1 3.958 1.000 .00 .00 .00 .00
2 .019 14.612 .83 .20 .10 .00
3 .012 17.967 .13 .03 .25 .95
4 .011 19.115 .04 .77 .65 .05
a. Dependent Variable: PB
Residuals Statisticsa
Minimum Maximum Mean Std. Deviation N
Predicted Value 2.2607 4.9067 4.0820 .56068 302
Std. Predicted Value -3.248 1.471 .000 1.000 302
Standard Error of Predicted
Value .027 .165 .050 .018 302
Adjusted Predicted Value 2.2508 4.9165 4.0805 .56248 302
Residual -1.15250 1.37830 .00000 .45990 302
Std. Residual -2.493 2.982 .000 .995 302
Stud. Residual -2.521 3.192 .002 1.006 302
Deleted Residual -1.17853 1.57907 .00148 .47015 302
Stud. Deleted Residual -2.545 3.242 .002 1.009 302
Mahal. Distance .062 37.275 2.990 3.777 302
Cook's Distance .000 .371 .006 .024 302
Centered Leverage Value .000 .124 .010 .013 302
a. Dependent Variable: PB

87
DV=PR, IV= OR, FR, SR, LR
Model Summaryb
Model R R
Square
Adjusted
R Square
Std. Error
of the
Estimate
Change Statistics
R Square
Change
F
Change
df1 df2 Sig. F
Change
1 .802a .643 .638 .48709 .643 133.858 4 297 .000
a. Predictors: (Constant), O.R, FR, SR, LR
b. Dependent Variable: PR
ANOVAa
Model Sum of Squares df Mean Square F Sig.
1
Regression 127.037 4 31.759 133.858 .000b
Residual 70.466 297 .237
Total 197.503 301
a. Dependent Variable: PR
b. Predictors: (Constant), O.R, FR, SR, LR

88
Coefficientsa
Model Unstandardized
Coefficients
Standardized
Coefficients
t Sig. 95.0%
Confidence
Interval for B
Collinearity
Statistics
B Std. Error Beta Lower
Bound
Upper
Bound
Tolerance VIF
1
(Constant) .636 .162 3.930 .000 .317 .954
FR .435 .053 .469 8.241 .000 .331 .539 .371 2.698
LR .164 .051 .177 3.182 .002 .062 .265 .388 2.577
SR .067 .057 .063 1.181 .238 -.045 .180 .427 2.340
O.R .186 .055 .187 3.355 .001 .077 .294 .386 2.593
a. Dependent Variable: PR
Collinearity Diagnosticsa
Model Dimension Eigenvalue Condition
Index
Variance Proportions
(Constant) FR LR SR O.R
1
1 4.932 1.000 .00 .00 .00 .00 .00
2 .029 13.140 .67 .08 .13 .01 .01
3 .016 17.329 .25 .07 .24 .20 .34
4 .013 19.190 .01 .61 .39 .10 .19
5 .009 23.003 .06 .24 .24 .70 .47
a. Dependent Variable: PR
Residuals Statisticsa
Minimum Maximum Mean Std. Deviation N
Predicted Value 1.4879 4.8964 3.9868 .64965 302
Std. Predicted Value -3.846 1.400 .000 1.000 302
Standard Error of Predicted
Value .029 .139 .059 .020 302
Adjusted Predicted Value 1.5210 4.8988 3.9860 .65129 302
Residual -2.11164 1.67290 .00000 .48385 302
Std. Residual -4.335 3.434 .000 .993 302
Stud. Residual -4.366 3.541 .001 1.004 302
Deleted Residual -2.14406 1.77853 .00080 .49439 302
Stud. Deleted Residual -4.506 3.612 .000 1.012 302
Mahal. Distance .086 23.464 3.987 3.868 302
Cook's Distance .000 .158 .004 .014 302
Centered Leverage Value .000 .078 .013 .013 302
a. Dependent Variable: PR

89
DV= IF IV= PB,PR
Model Summaryb
Model R R
Square
Adjusted
R Square
Std. Error
of the
Estimate
Change Statistics
R Square
Change
F
Change
df1 df2 Sig. F
Change
1 .690a .477 .473 .52768 .477 136.164 2 299 .000
a. Predictors: (Constant), PR, PB
b. Dependent Variable: IF
ANOVAa
Model Sum of Squares df Mean Square F Sig.
1
Regression 75.829 2 37.914 136.164 .000b
Residual 83.256 299 .278
Total 159.084 301
a. Dependent Variable: IF
b. Predictors: (Constant), PR, PB

90
Coefficientsa
Model Unstandardized
Coefficients
Standardized
Coefficients
t Sig. 95.0%
Confidence
Interval for B
Collinearity
Statistics
B Std.
Error
Beta Lower
Bound
Upper
Bound
Tolerance VIF
1
(Const
ant) .932 .192
4.85
9 .000 .555 1.310
PB .575 .047 .573 12.2
34 .000 .482 .667 .797 1.255
PR .184 .042 .205 4.36
7 .000 .101 .266 .797 1.255
a. Dependent Variable: IF
Collinearity Diagnosticsa
Model Dimension Eigenvalue Condition Index Variance Proportions
(Constant) PB PR
1
1 2.964 1.000 .00 .00 .00
2 .021 11.848 .24 .15 .99
3 .015 13.897 .76 .84 .00
a. Dependent Variable: IF
Residuals Statisticsa
Minimum Maximum Mean Std. Deviation N
Predicted Value 2.4284 4.7255 4.0116 .50192 302
Std. Predicted Value -3.154 1.422 .000 1.000 302
Standard Error of Predicted
Value .031 .153 .050 .016 302
Adjusted Predicted Value 2.4158 4.7466 4.0113 .50168 302
Residual -1.97554 1.73049 .00000 .52592 302
Std. Residual -3.744 3.279 .000 .997 302
Stud. Residual -3.764 3.297 .000 1.003 302
Deleted Residual -1.99663 1.74935 .00034 .53271 302
Stud. Deleted Residual -3.850 3.353 .000 1.008 302
Mahal. Distance .018 24.365 1.993 2.526 302
Cook's Distance .000 .123 .004 .012 302
Centered Leverage Value .000 .081 .007 .008 302
a. Dependent Variable: IF

91
Multicolinearity
DV=EB, IV= CV, ST
Model Summary
Model R R Square Adjusted R
Square
Std. Error of the
Estimate
1 .718a .516 .512 .52729
a. Predictors: (Constant), CV, ST
DV=ST, IV= CV, EB
Model Summary
Model R R Square Adjusted R
Square
Std. Error of the
Estimate
1 .705a .497 .494 .51821
a. Predictors: (Constant), CV, EB
DV=CV, IV= ST, EB
Model Summary
Model R R Square Adjusted R
Square
Std. Error of the
Estimate
1 .653a .427 .423 .53811
a. Predictors: (Constant), ST, EB
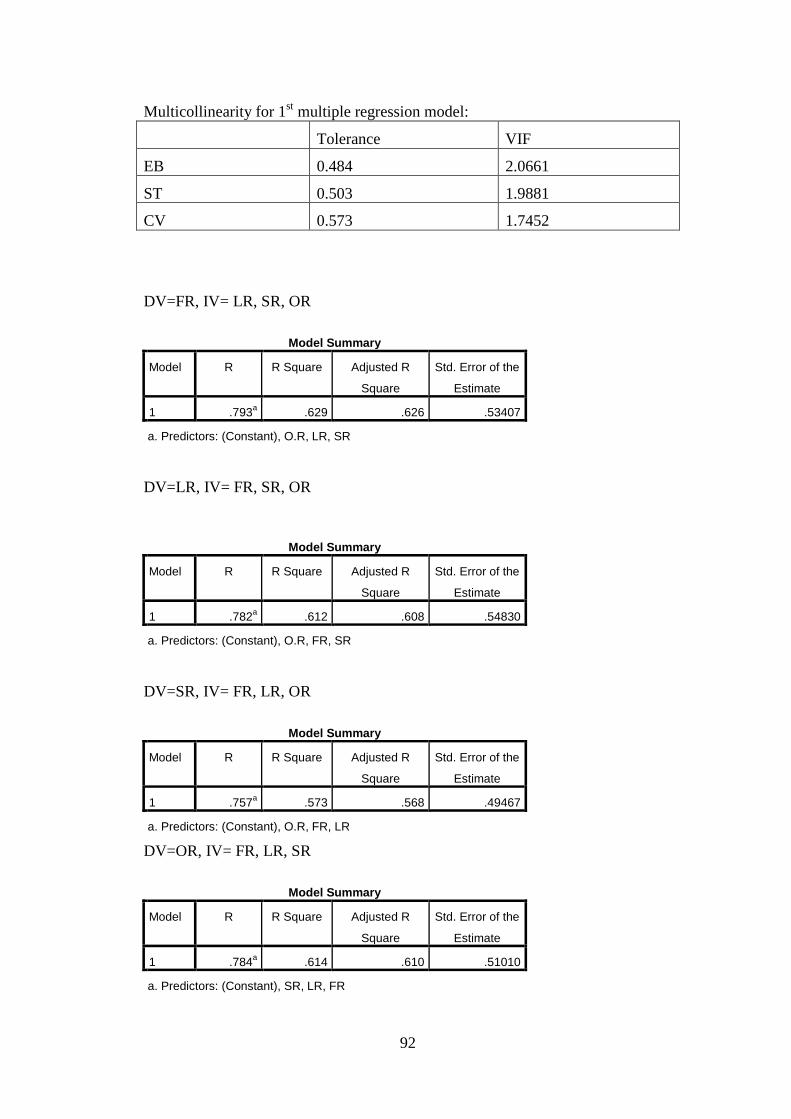
92
Multicollinearity for 1st multiple regression model:
Tolerance VIF
EB 0.484 2.0661
ST 0.503 1.9881
CV 0.573 1.7452
DV=FR, IV= LR, SR, OR
Model Summary
Model R R Square Adjusted R
Square
Std. Error of the
Estimate
1 .793a .629 .626 .53407
a. Predictors: (Constant), O.R, LR, SR
DV=LR, IV= FR, SR, OR
Model Summary
Model R R Square Adjusted R
Square
Std. Error of the
Estimate
1 .782a .612 .608 .54830
a. Predictors: (Constant), O.R, FR, SR
DV=SR, IV= FR, LR, OR
Model Summary
Model R R Square Adjusted R
Square
Std. Error of the
Estimate
1 .757a .573 .568 .49467
a. Predictors: (Constant), O.R, FR, LR
DV=OR, IV= FR, LR, SR
Model Summary
Model R R Square Adjusted R
Square
Std. Error of the
Estimate
1 .784a .614 .610 .51010
a. Predictors: (Constant), SR, LR, FR

93
Multicollinearity for 2nd
multiple regression model:
Tolerance VIF
FR 0.371 2.6954
LR 0.388 2.5773
SR 0.427 2.3419
OR 0.386 2.5906
DV=PB, IV= PR
Model Summary
Model R R Square Adjusted R
Square
Std. Error of the
Estimate
1 .451a .203 .201 .64830
a. Predictors: (Constant), PR
Multicollinearity for 3th multiple regression model:
Tolerance VIF
PB 0.797 1.2547

94