pepsico - palakaad · pepsico - palakkad water conservation pepsico - palakkad water conservation...
TRANSCRIPT
1
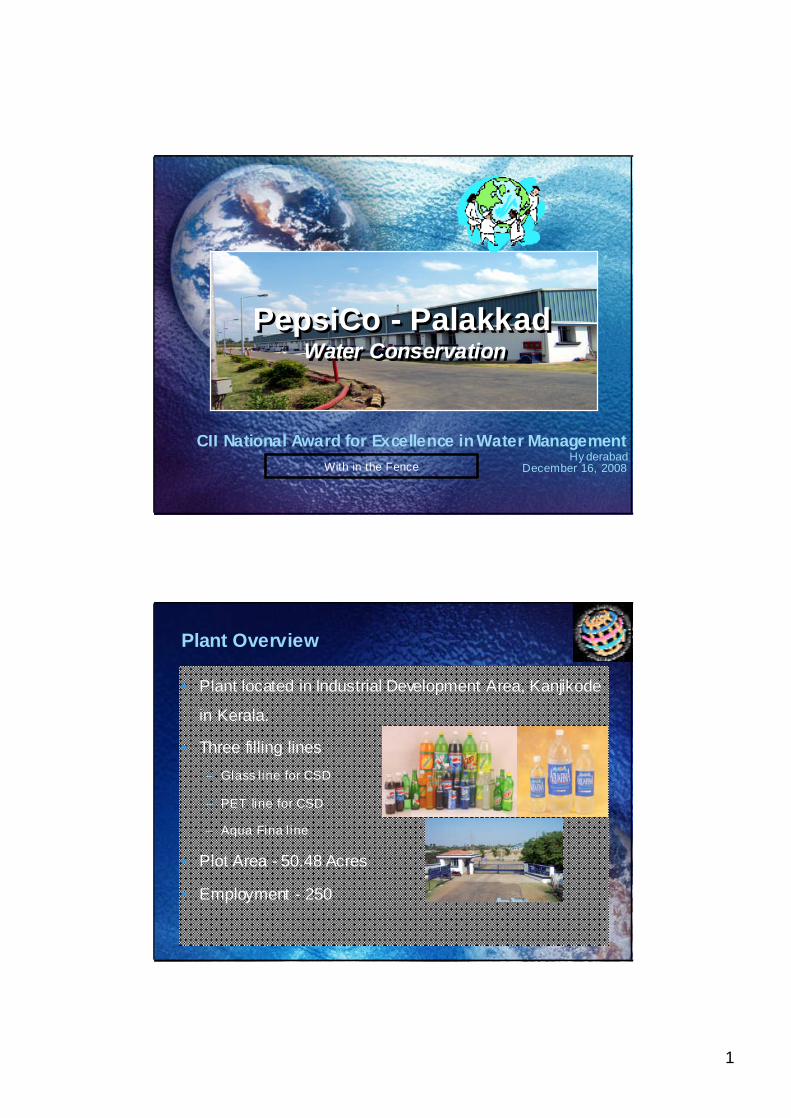
PepsiCo - PalakkadWater Conservation
PepsiCo - PalakkadWater Conservation
CII National Award for Excellence in Water Management Hy derabad
December 16, 2008With in the Fence
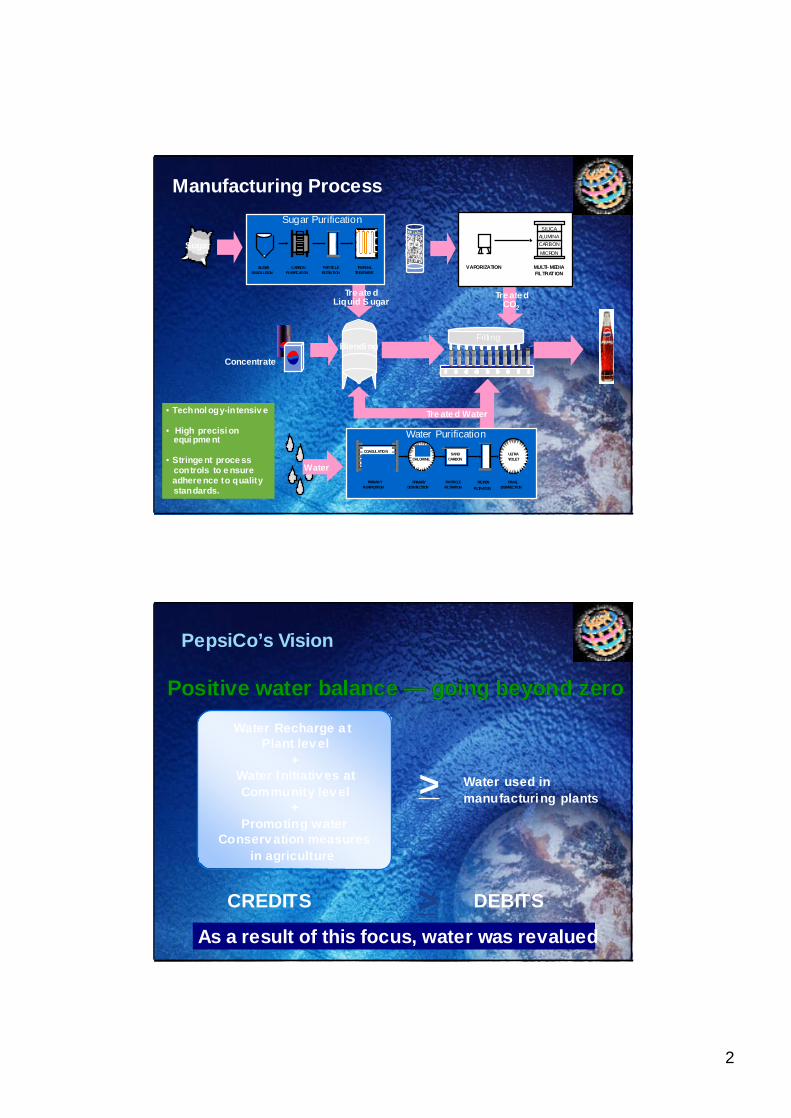
Plant Overview
• Plant located in Industrial Development Area, Kanjikode
in Kerala.
• Three filling lines– Glass line for CSD
– PET line for CSD
– Aqua Fina line
• Plot Area - 50.48 Acres
• Employment - 250
2
PRIMARYPURIFICATION
PRIMARYDISINFECTION
PARTICLEFILTRATION
FINALDISINFECTION
COAGULATIONREVERSE OSMOSIS
ION-EXCHANGE
SANDCARBON
MICRONFILTRATION
OZONECHLORINE
ULTRAVIOLET
THERMALTREATMENT
SUGARDISSOLUTION
CARBONPURIFICATION
PARTICLEFILTRATION
Tre ate dCO2
Tre ate dLiquid S ugar
Sugar CO2
Tre ate d Water
Blendi ngConcentrate
Sugar Purification
Filling
VAPORIZATION MULTI- MEDIAFILTRATION
SILICAALUMINACARBON
MICRON
Water Purification
• Technol ogy-intensiv e
• High precisi on equi pme nt
• Stringe nt proce sscontrols to e nsure adhere nce to qualitystandards.
CO2 Purification
Manufacturing Process
Water
Water Recharge a t Plant lev el
+Water Initiativ es atCommunity lev el
+Promoting water
Conserv ation measuresin agriculture
> Water used in manufacturing plants
CREDITS DEBITS>As a result of this focus, water was revalued
PepsiCo’s Vision
Positive water balance Positive water balance —— going beyond zerogoing beyond zero
3
What we’ve accomplished on “debit” side of the equation
SCORECARD 2008
• 60% water u sage reduction in 2008 over 2004 (4.41 to 1.77 L/L)
• 77% reduction in effluent over 2001(3.41 to 0.77 L/L)
• The journey continues…
2008 vs. 2004: > 250 Million L saved2008: We could save another 16 Million liters
2008 vs. 2004: > 250 Million L saved2008 vs. 2004: > 250 Million L saved2008: We could save another 16 Million liters2008: We could save another 16 Million liters
NowNow……what about the credits?what about the credits?
0
0.5
1
1.5
2
2.5
3
3.5
4
4.5
2004-05
2005-06
2006-07
2007-08
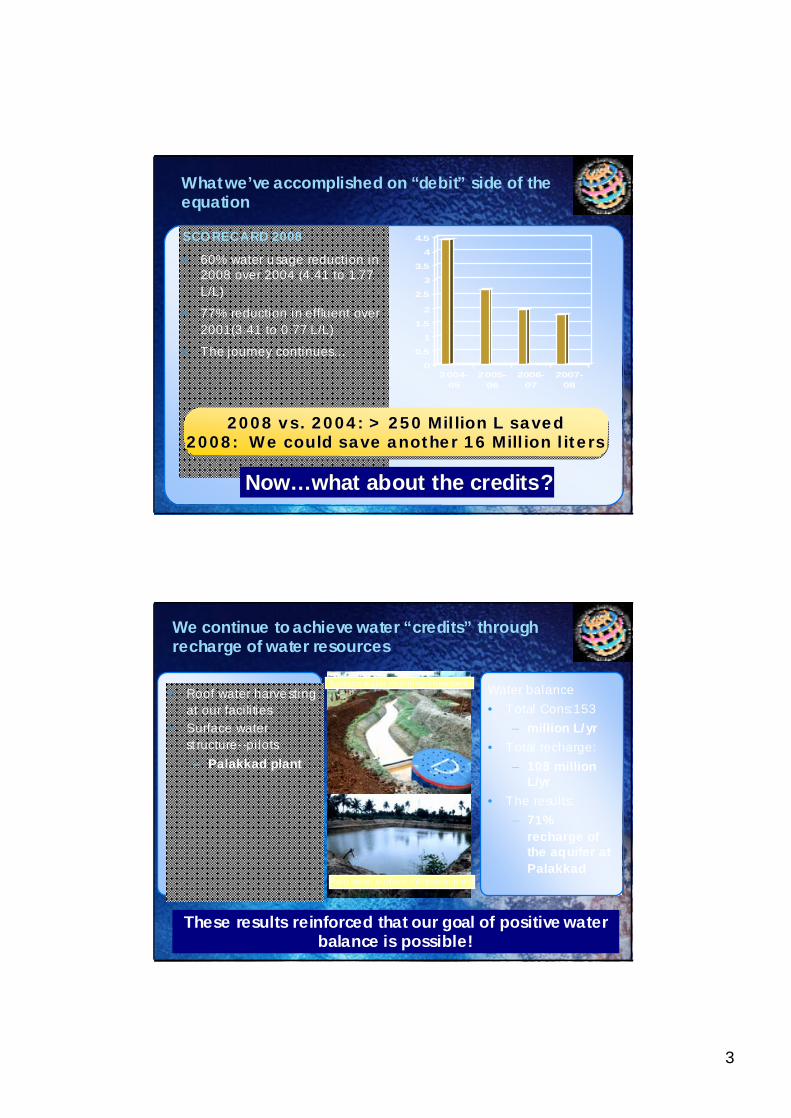
We continue to achieve water “credits” through recharge of water resources
• Roof water harve sting at our facilities
• Surface water st ructure--pilots– Palakkad plant
These results reinforced that our goal of positive water balance is possible!
Rain water su rface infiltration pond
Surface water desilting chambers Water balance• Total Cons:153
– million L/yr• Total recharge:
– 108 million L/yr
• The results:– 71%
recharge of the aquifer at Palakkad

4
Palakkad Water Strategy
Conserve Source
(Recharge)
InProcess
AtDischarge
In TheCommunity
Water Strategy
4R
RWH
ZER
O
CSR
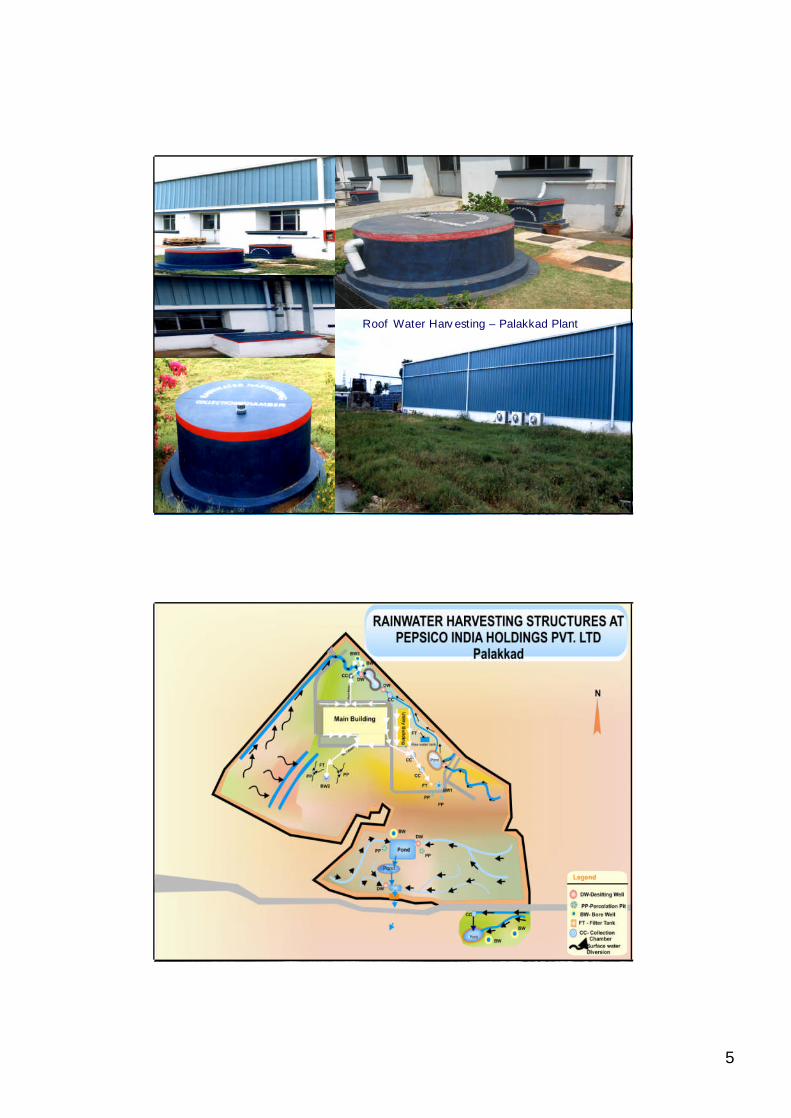
Rain Water Harvesting
De silting chamber for pond De silting chamber for pond
Surf ace Water Harv esting – Palakkad Plant
5
Roof Water Harv esting – Palakkad Plant

6
22.5
1.6
6.1
5.24.7
1.7
0
1
2
3
4
5
6
7
CSD CSD w/Ref illable
Containers
Spring Water Beer - SmallBrewery
Beer - MediumBrewery
Beer - LargeBrewery
Dairy
Water
Use
Rati
oGlobal Best in Class WUR in Beveragesfrom Benchmarking Survey
Palakkad
0.8 L/L Better
Source: WBCSD Report
Zero based targeting
Roadmap for reduction• Define specifications of water to be used at each step
in the process
• Determine quantity and quality of discharge at each stage
• Identify opportunities for recycling, treatment and technology to be deployed
• Discard as effluent after establishing that it is unfit for recycling
7
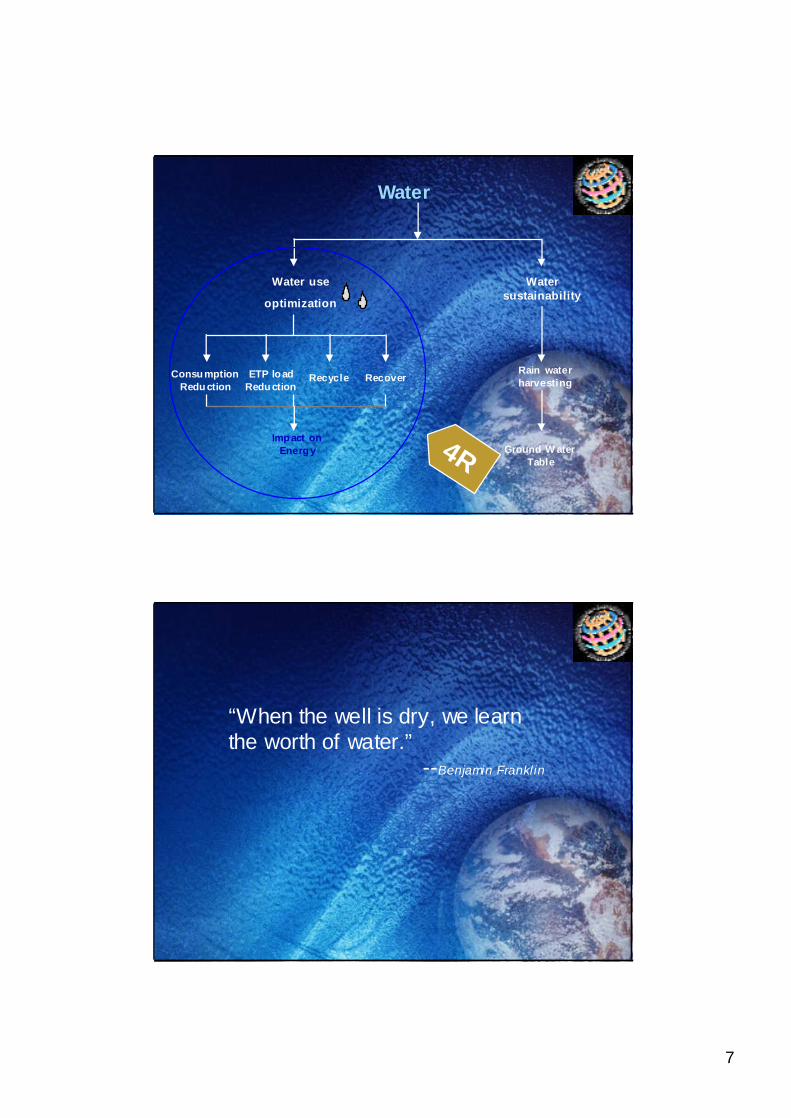
Consu mption Redu ction
ETP load Redu ction
Recover
Imp act on Energy
Water
Water use
optimization
Water sustainability
Rain water harvesting
Ground W ater Table
4R
Recycle
“When the well is dry, we learn the worth of water.”
--Benjamin Franklin
8
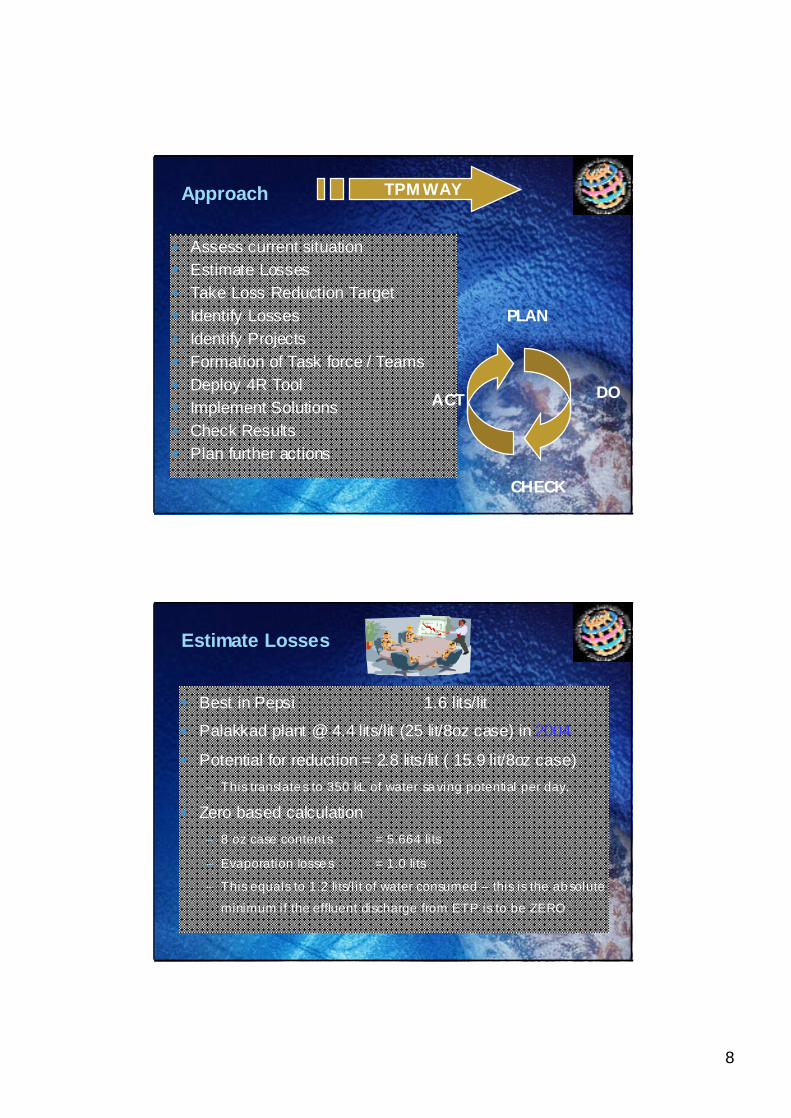
• Assess current situation• Estimate Losses• Take Loss Reduction Target• Identify Losses• Identify Projects• Formation of Task force / Teams• Deploy 4R Tool• Implement Solutions• Check Results• Plan further actions
TPM WAY
PLAN
DO
CHECK
ACT
Approach
Estimate Losses
• Best in Pepsi 1.6 lits/lit
• Palakkad plant @ 4.4 lits/lit (25 lit/8oz case) in 2004
• Potential for reduction = 2.8 lits/lit ( 15.9 lit/8oz case)– This translate s to 350 kL of water sa ving potential per day.
• Zero based calculation– 8 oz case contents = 5.664 lits
– Evaporation losse s = 1.0 lits
– This equals to 1.2 lits/lit of water consumed – this is the ab solute
minimum if the effluent discharge from ETP is to be ZERO
9
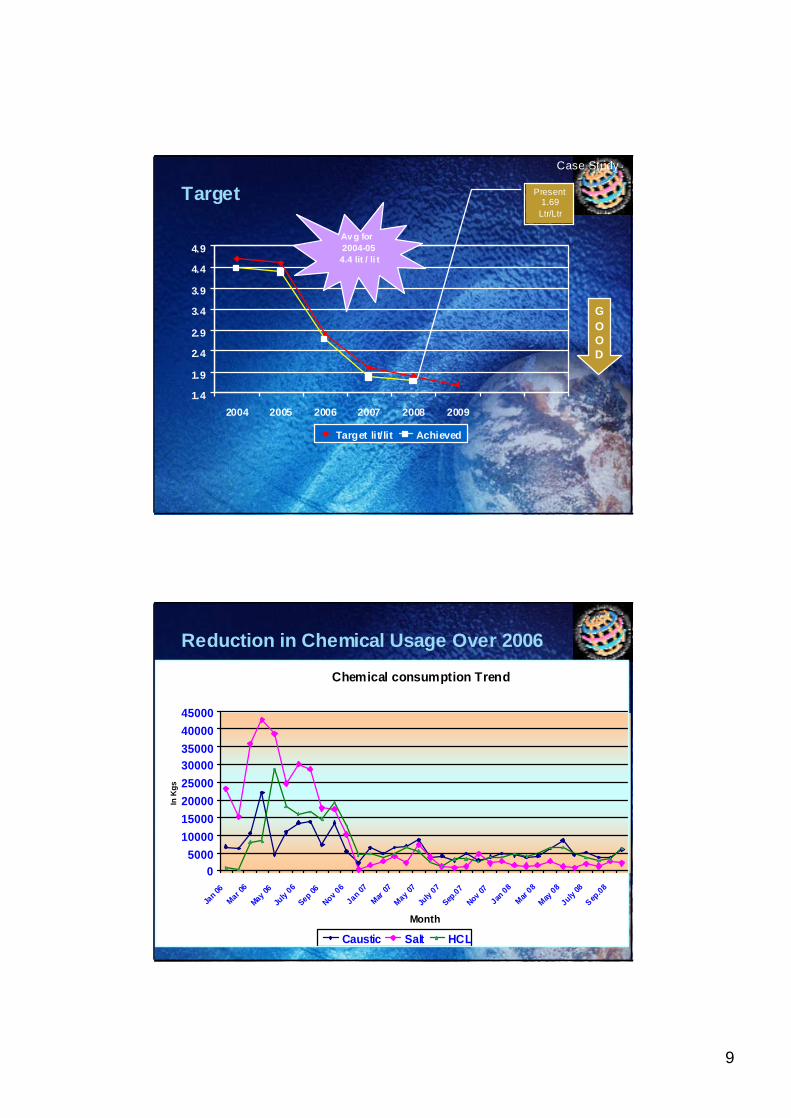
Target
1.4
1.9
2.4
2.9
3.4
3.9
4.4
4.9
2004 2005 2006 2007 2008 2009
Target lit/lit Achieved
Case Study
GOOD
Av g for 2004-05
4.4 lit / li t
Present 1.69
Ltr/Ltr
Reduction in Chemical Usage Over 2006
Chemical consumption Trend
05000
1000015000200002500030000350004000045000
Jan 06
Mar 06
May 06
July 06
Sep 06
Nov 06
Jan 07
Mar 07
May 07
July 07
Sep.07
Nov 07
Jan 08
Mar 08
May 08
July 08
Sep.08
Month
In K
gs
Caustic Salt HCL
10
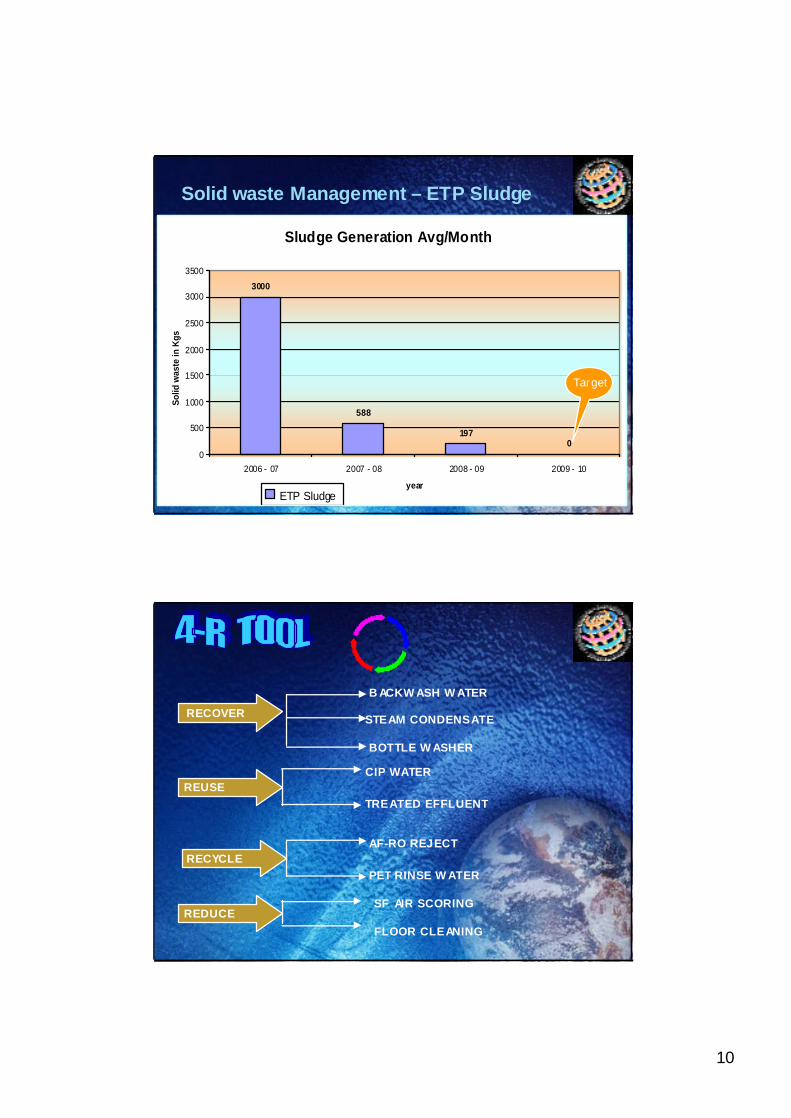
Solid waste Management – ETP Sludge
Sludge Generation Avg/Month
3000
588
1970
0
500
1000
1500
2000
2500
3000
3500
2006 - 07 2007 - 08 2008 - 09 2009 - 10
year
Solid
was
te in
Kgs
ETP Sludge
Target
RECOVER
REUSE
RECYCLE
REDUCE
B ACKW ASH W ATER
BOTTLE W ASHER
TREATED EFFLUENT
CIP WATER
PET RINSE W ATER
AF-RO REJECT
STEAM CONDENSATE
SF AIR SCORING
FLOOR CLEANING
11
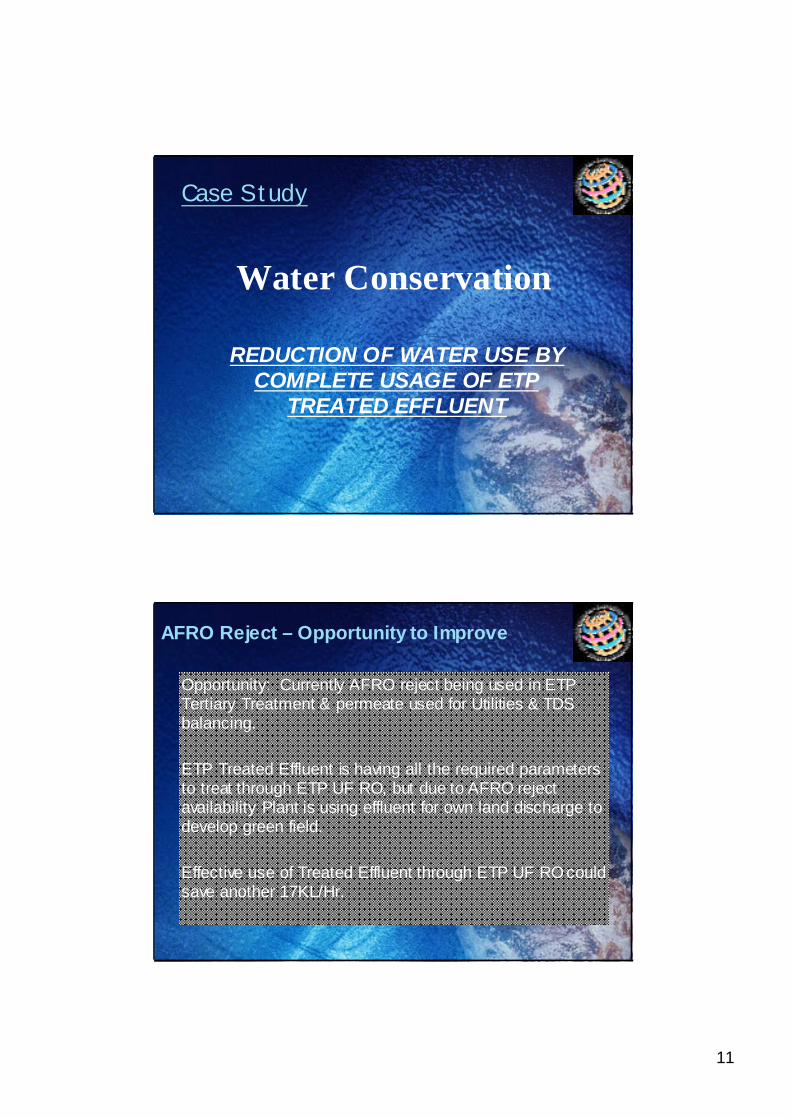
Case StudyCase Study
Water Conservation
REDUCTION OF WATER USE BY COMPLETE USAGE OF ETP
TREATED EFFLUENT
AFRO Reject – Opportunity to Improve
Opportunity: Currently AFRO reject being used in ETP Tertiary Treatment & permeate used for Utilities & TDS balancing.
ETP Treated Effluent is having all the required parameters to treat through ETP UF RO, but due to AFRO reject availability Plant is using effluent for own land discharge to develop green field.
Effective use of Treated Effluent through ETP UF RO could save another 17KL/Hr.
12
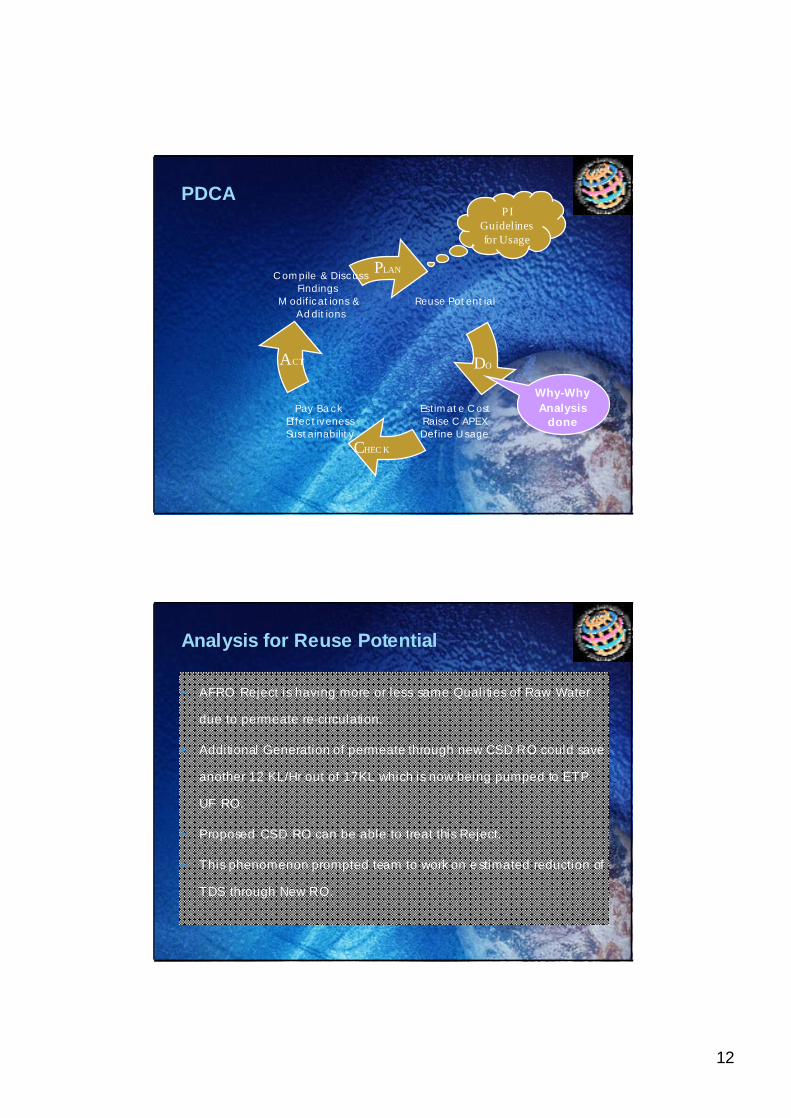
PDCA
Reuse Pot ent ial
Pay BackEffect ivenessSust ainabilit y
Compile & DiscussFindings
M odificat ions &Addit ions
Estimat e CostRaise C APEXDefine U sage
PI Guidelines for Usage
PLAN
ACT
CHEC K
DO
Why-WhyAnalysis
done
Analysis for Reuse Potential
• AFRO Reject is having more or less same Qualities of Raw Water
due to permeate re-circulation.
• Additional Generation of permeate through new CSD RO could save
another 12 KL/Hr out of 17KL which is now being pumped to ETP
UF RO.
• Proposed CSD RO can be able to treat this Reject.
• This phenomenon prompted team to work on e stimated reduction of
TDS through New RO.
13
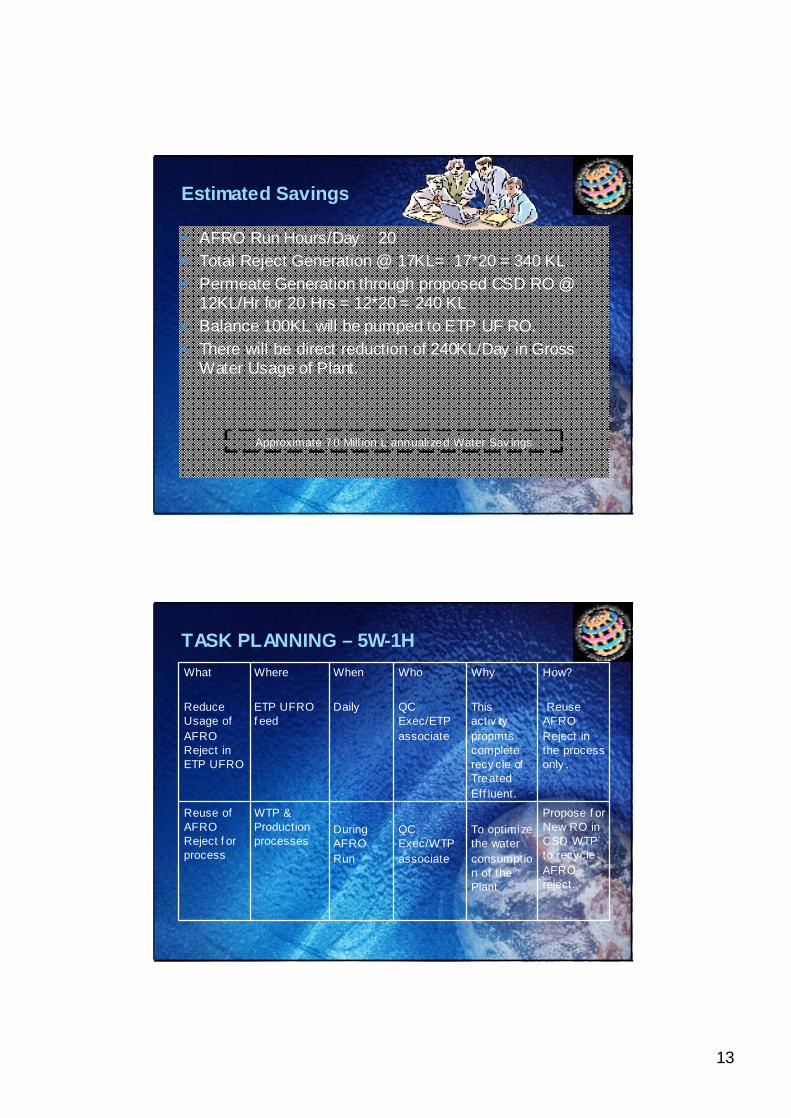
Estimated Savings
• AFRO Run Hours/Day: 20• Total Reject Generation @ 17KL= 17*20 = 340 KL• Permeate Generation through proposed CSD RO @
12KL/Hr for 20 Hrs = 12*20 = 240 KL• Balance 100KL will be pumped to ETP UF RO.• There will be direct reduction of 240KL/Day in Gross
Water Usage of Plant.
Approximate 70 Mill ion L annualized Water Sav ings
TASK PLANNING – 5W-1H
Propose f or New RO in CSD WTP to recycle AFRO reject.
To optimize the water consumption of the Plant
QC Exec/WTP associate
During AFRO Run
WTP & Production processes
Reuse of AFRO Reject f or process
How?
Reuse AFRO Reject in the process only .
Why
This activ ity propmtscomplete recy cle of Treated Eff luent.
Who
QC Exec/ETP associate
When
Daily
Where
ETP UFRO f eed
What
Reduce Usage of AFRO Reject in ETP UFRO
14
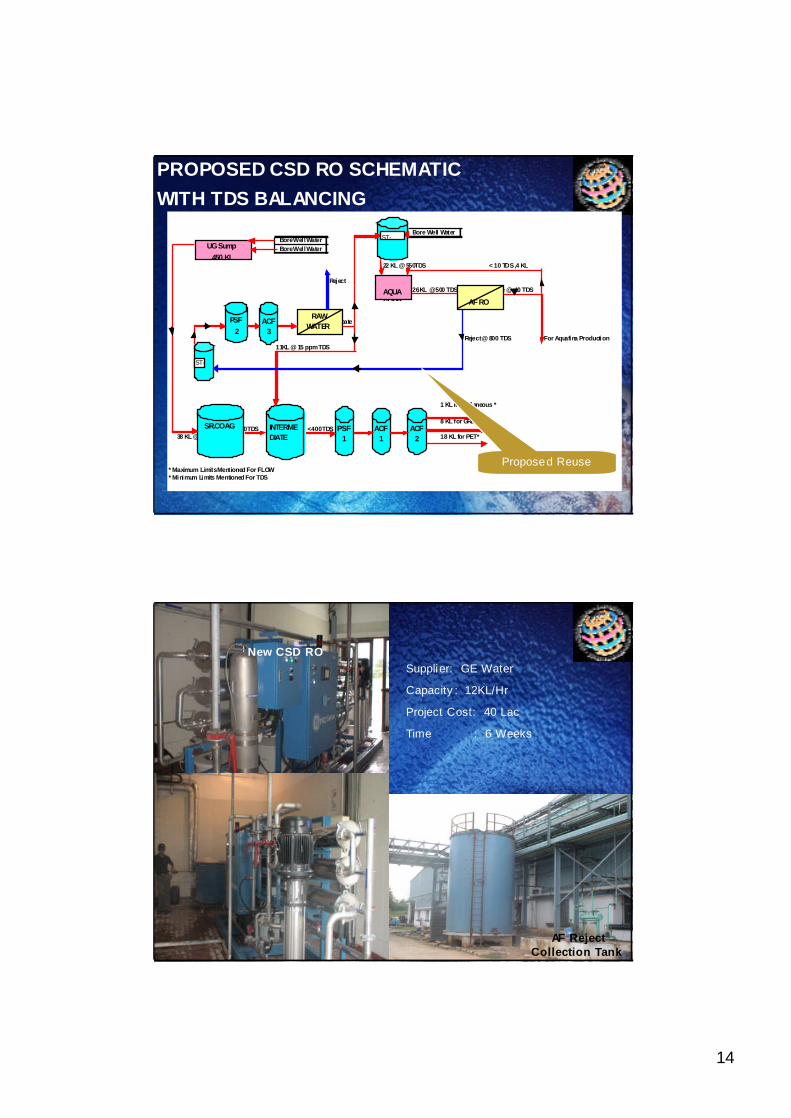
PROPOSED CSD RO SCHEMATICWITH TDS BALANCING
22 KL @ 550TDS < 10 TDS ,4 KL
Reject 26 KL @ 500 TDS Permeate @<10 TDS
Permeate
Reject @ 800 TDS For Aquafina Production11KL @ 15 ppm TDS
1 KL Miscellaneous *
8 KL for GRB * < 400 TDS
38 KL @ 800 Tds 18 KL for PET*
* Maximum Limits Mentioned For FLOW* Minimum Limits Mentioned For TDS
Bore Well Water
620 TDS
Bore Well WaterBore Well WaterUG Sump
450 KL
PSF 2
RAW WATER
RO
ACF 3
SR.COAG INTERMEDIATE
PSF 1
ACF 1
ACF 2
AQUA SUMP
AF RO
ST-
ST-
Proposed Reuse
New CSD RO
AF Reject Collection Tank
Supplier: GE Water
Capacity : 12KL/Hr
Project Cost: 40 Lac
Time : 6 Weeks
15
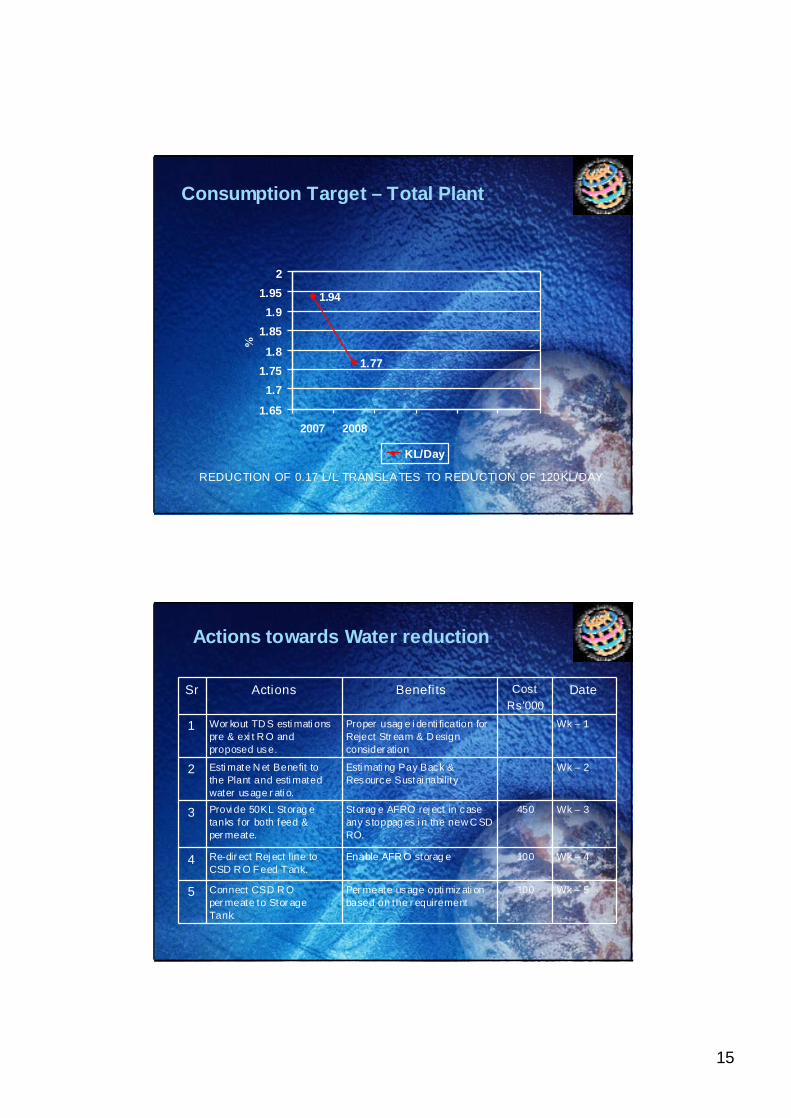
1.94
1.77
1.65
1.71.751.8
1.851.9
1.952
2007 2008
%
KL/Day
Consumption Target – Total Plant
REDUCTION OF 0.17 L/L TRANSLATES TO REDUCTION OF 120KL/DAY
Actions towards Water reduction
Wk – 5 100Per meate usage opti mizati on based on the r equirement
Connect CSD R O per meate to Stor age Tank.
5
Wk – 1Proper usag e i denti fication for Reject Str eam & D esign consider ation
Wor kout TD S esti mati ons pre & exi t R O and proposed use.
1
Wk – 4 100Enable AFR O storag eRe-dir ect Rej ect line to CSD R O F eed T ank.
4
Wk – 3 450Storag e AFRO rej ect in case any s toppag es i n the new C SD RO.
Provi de 50KL Storag e tanks for both feed & per meate.
3
Wk – 2Esti mati ng Pay Back & Resource Sustai nability
Esti mate N et Benefit to the Plant and esti mated water usage r ati o.
2
DateCostRs’000
BenefitsActionsSr
16
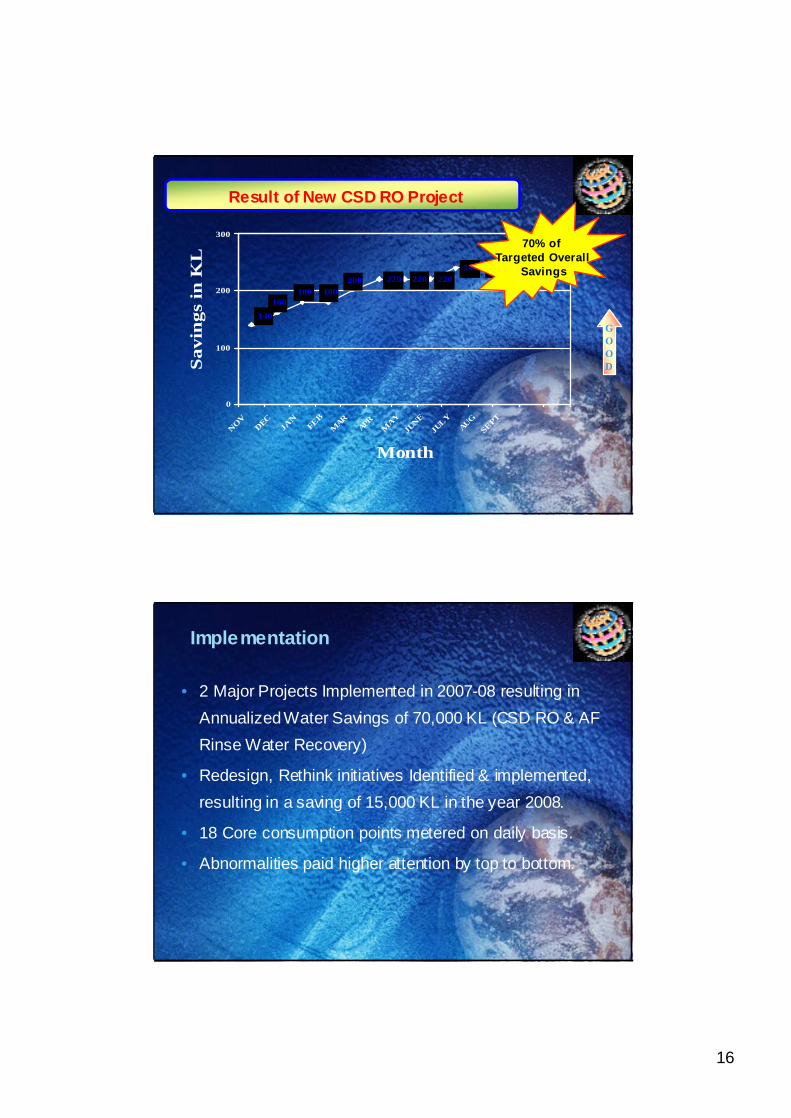
Result of New CSD RO Project
220 220 220240 240 240
200180180
160
140
0
100
200
300
NOVDEC
JAN
FEBM
ARAPR M
AYJU
NEJU
LYAUG
SEPT
Month
Savi
ngs
in K
L
GOOD
70% ofTargeted Overall
Savings
Implementation
• 2 Major Projects Implemented in 2007-08 resulting in Annualized Water Savings of 70,000 KL (CSD RO & AF Rinse Water Recovery)
• Redesign, Rethink initiatives Identified & implemented, resulting in a saving of 15,000 KL in the year 2008.
• 18 Core consumption points metered on daily basis.
• Abnormalities paid higher attention by top to bottom.
17
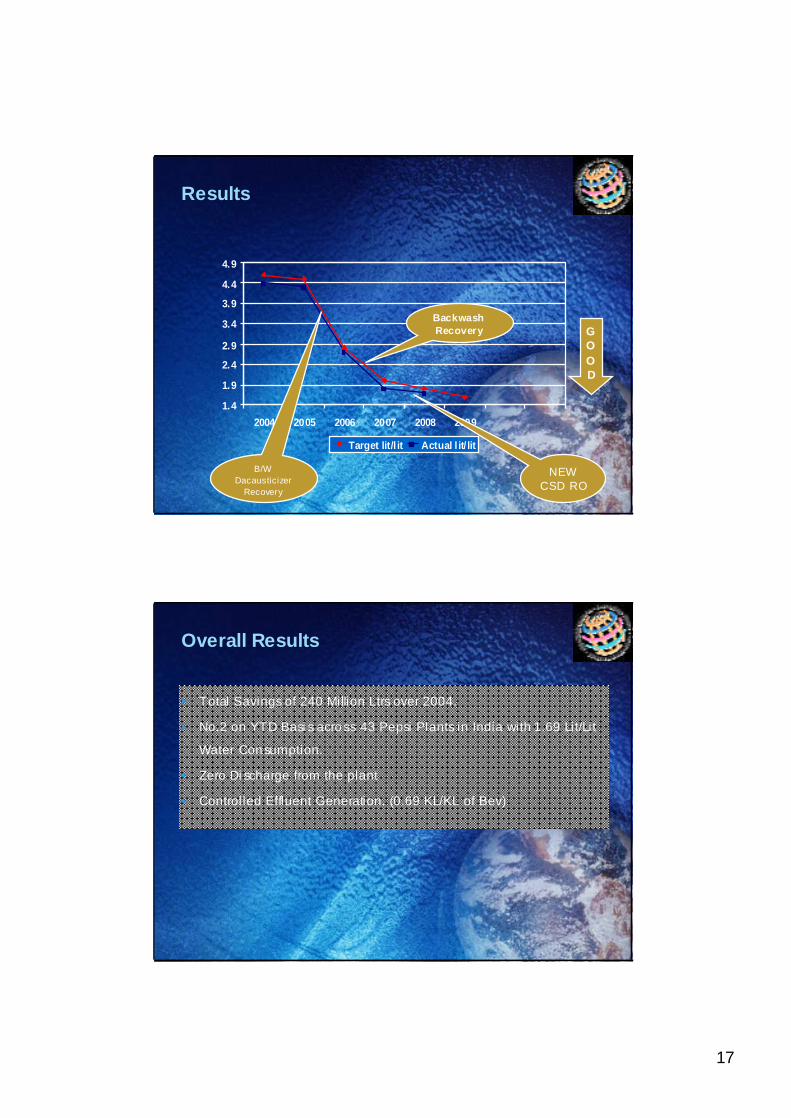
Results
1.4
1.9
2.4
2.9
3.4
3.9
4.4
4.9
2004 2005 2006 2007 2008 2009
Target lit/l it Actual l it/ lit
GOOD
Backwash Recovery
B/W Dacausticizer
Recovery
NEW CSD RO
Overall Results
• Total Savings of 240 Million Ltrs over 2004.
• No.2 on YTD Basi s acro ss 43 Pepsi Plants in India with 1.69 Lit/Lit
Water Con sumption.
• Zero Di scharge from the plant
• Controlled Effluent Generation. (0.69 KL/KL of Bev)
18
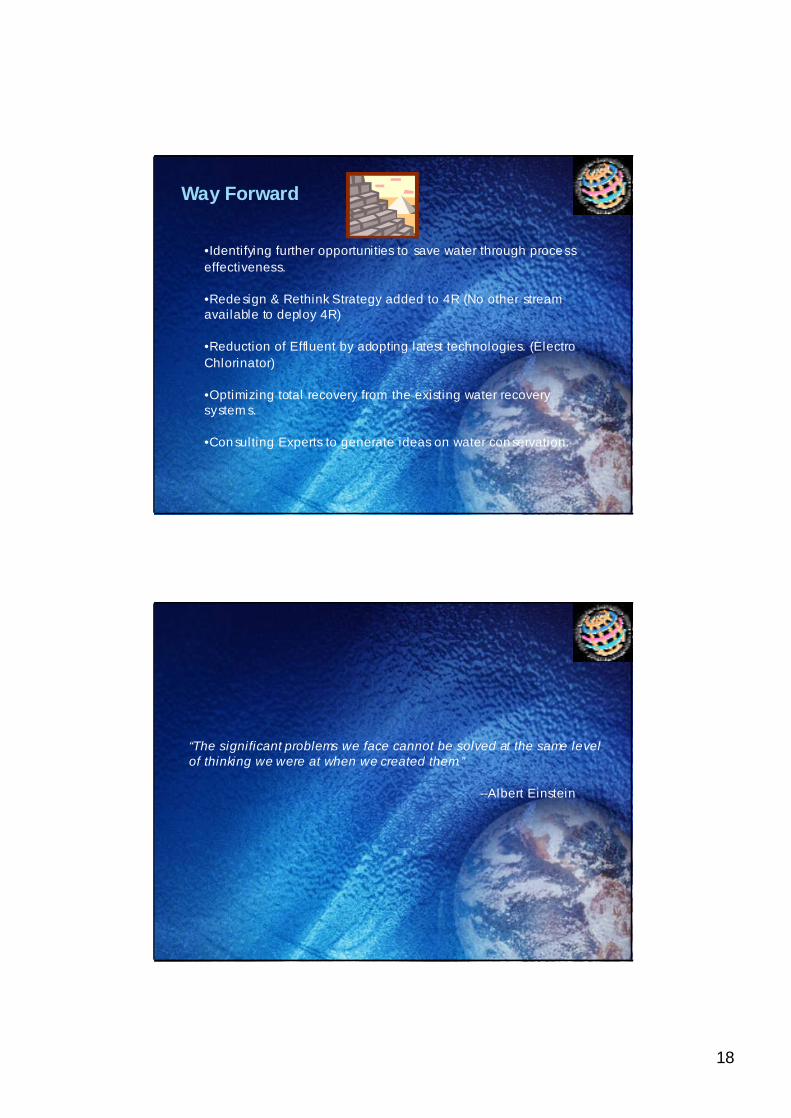
Way Forward
•Identifying further opportunities to save water through proce ss effectiveness.
•Rede sign & Rethink Strategy added to 4R (No other stream available to deploy 4R)
•Reduction of Effluent by adopting latest technologies. (Electro Chlorinator)
•Optimizing total recovery from the existing water recovery system s.
•Con sulting Experts to generate ideas on water con servation.
“The significant problems we face cannot be solved at the same level of thinking we were at when we created them.”
--Albert Einstein
19
THANK YOU!