pepfar: increasing program impact - world bankpubdocs.worldbank.org/pubdocs/publicdoc/2016/2/... ·...
TRANSCRIPT
PEPFAR: Increasing program impact
and efficiency through data analysis
AMB Deborah Birx, MD
US Global AIDS Coordinator
World Bank
February 2016

…………………………………………………………………………………………………………...…...
DEFINING AN EFFICIENT, SUSTAINABLE
RESPONSE
And the steps needed to achieve epidemic control
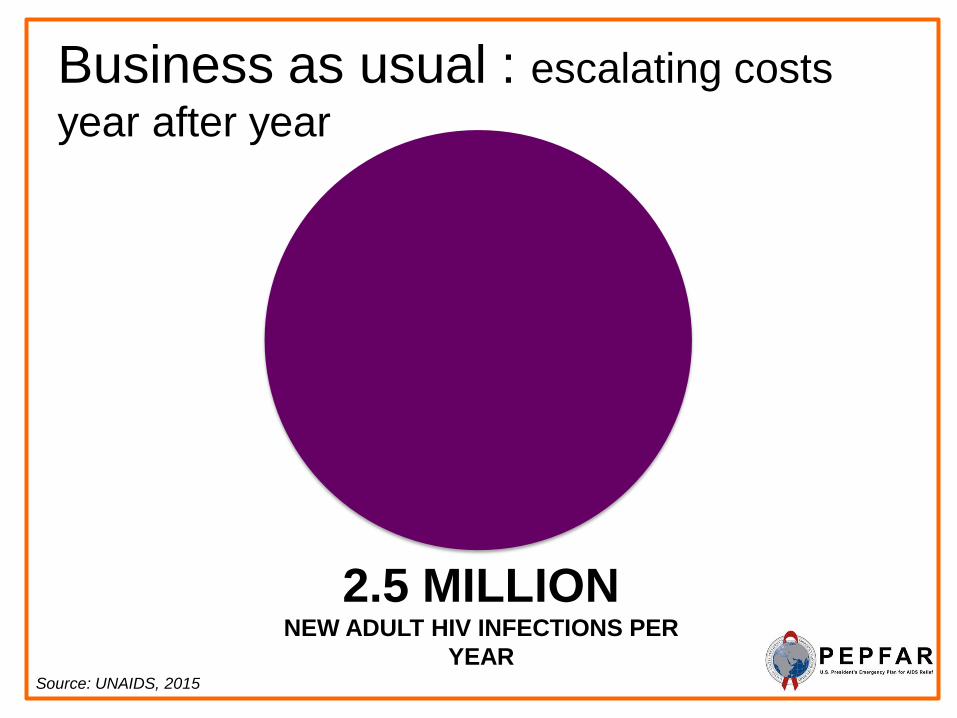
Business as usual : escalating costs
year after year
Source: UNAIDS, 2015
2.5 MILLION NEW ADULT HIV INFECTIONS PER
YEAR

Fast Track Strategy: Program costs
decline in out years
Source: UNAIDS 2015
0.2 MILLION NEW ADULT HIV INFECTIONS PER
YEAR

Source: UNAIDS 2015
We have a 5-YEAR
WINDOW
Business
as usual
Fast
Track
Strategy

Global HIV Funding Has Plateaued
and is projected to remain flat
1,6 2
3,6
4,3
5,6
6,6
8,7 8,7 8,7 8,8 8,3 8,1
1,2 1,6
2,8
3,5 3,9
4,9
7,7 7,7
6,9
7,6 7,9
8,5
2002 2003 2004 2005 2006 2007 2008 2009 2010 2011 2012 2013
Committed Disbursed
Values in USD, Billions
Source: Kaiser Family Foundation and UNAIDS, 2015

Defining “A Sustainable HIV
Response” Sustainability is not only about funding.
A sustainable response can only be achieved when the epidemic is under control and no longer expanding
How can we achieve epidemic control?
Right things
Right places
Right now
Right way

The Right Things to achieve
epidemic control • Expand access to ART: test and start for everyone
– Find & treat men living with HIV
– Pregnant & breastfeeding women
– Children & adolescents
– MSM & transgender people, sex workers, people who inject drugs
• Develop alternative service delivery models
• Supply chain management: improve tendering & costs
• Prevent new infections in young women (15-24): DREAMS
• Prevent new infections in men (30-45): VMMC & treatment

The Right Places for epidemic
control
• Focusing limited resources on the highest
burden areas
– Strategic scale-up
– Refine approach to targeting interventions
– Collect & use facility-level data
– Use programmatic data for continuous
evaluation of investments

Right Now: Urgent need to
control epidemic
• Achieving a sustainable response requires immediate action and focus
• We have a limited window to recalibrate response – Use of granular ‘real-time’ data to direct
investments
– Open sharing of data & transparency needed
Do we have the collective will to focus, and to make difficult choices together to achieve epidemic control?
…………………………………………………………………………………………………………...…... FRAMING THE EPIDEMIC TODAY
Where we’re at today, and where we need to be

Dramatic reductions in HIV Incidence Rates Maintaining momentum is key to achieving epidemic control
Source: UNAIDS, 2015
0
0,1
0,2
0,3
0,4
0,5
0,6
0,7
0,8
0,9
1
1990 1992 1994 1996 1998 2000 2002 2004 2006 2008 2010 2012
HIV
In
cid
en
ce R
ate
(%
)
Trends in HIV Incidence Rates, 1990-2013 Caribbean
Asia & the Pacific
Eastern Europe &Central AsiaLatin America
Middle East & NorthAfricaSub-Saharan Africa

Dramatic Impact of PEPFAR & Global
HIV Response
Source: World Bank, 2014
40
45
50
55
60
65
70
75
Life Expectancy at Birth (in years), 1960-2013; Select Countries
Botswana
Kenya
Lesotho
Swaziland
Uganda
World
South Africa
Zimbabwe
PEPFAR/
GF/Host
Country
HIV/AIDS
Epidemic

-60%
-40%
-20%
0%
20%
40%
60%
80%Source: UNAIDS,
2015
% Change in New HIV Infections
(2004-2014)

% Change in New Pediatric HIV
Infections (2000-2014)
0%
20%
40%
60%
80%
100%
120%
Nig
eri
a
DR
C
Zam
bia
CI
Les
oth
o
Ca
mero
on
Gh
an
a
Ug
an
da
Mo
z
Ma
law
i
Ke
ny
a
Zim
Tan
zan
ia
Na
mib
ia
RS
A
Sw
azi
Bo
tsw
an
a
Rw
an
da
Source: UNAIDS, 2015

% Change In Adult New HIV/AIDS Infections
(2000-2014)
-100%
-80%
-60%
-40%
-20%
0%
20%
40%
60%
80%
Ug
an
da
Ke
ny
a
Ca
mero
on
Les
oth
o
Zam
bia
Mo
z
DR
C
Nig
eri
a
Sw
azi
RS
A
Rw
an
da
Na
mib
ia
Bo
tsw
an
a
CI
Zim
Tan
zan
ia
Gh
an
a
Ma
law
i
Source: UNAIDS, 2015

New PEPFAR Targets for 2017
12.9 million women, men, and children on ART
40% reduction in new HIV infections in young women in 10 countries
Total of 13 million voluntary medical male circumcisions
Source: pepfar.gov

8.9 Million Voluntary Medical Male
Circumcisions
PEPFAR Results for 2015

…………………………………………………………………………………………………………...…... TEST & START: EXPANDING TREATMENT
Translation of the science into guidelines and adaptation

68.2 Million People were tested & counseled for
HIV
PEPFAR Results for 2015

9.5 Million Men, Women, & Children on
Treatment
PEPFAR Results for 2015

New WHO ART & PrEP Guidelines
• Treat ALL (at any CD4) – all people living with HIV
across all ages
• The sickest remain a priority (symptomatic disease and
CD4<350)
• New age band for adolescents (ages 10-19)
• Option B not taken forward; Option B+ as new standard
• PrEP as an additional prevention choice for all people at
substantial risk of HIV infection (>3% incidence)

We can support 2 ART clients for the price of 1 Smart policy and service delivery choices yield tremendous cost savings
Source: Stover, 2015

Reconfiguring Service Delivery Approaches to
Achieve Greater Efficiency and Reduce Costs Current Status of Service Delivery
COP 16 Target Approach
Initiating ART: multiple visits to determine eligibility, delays and
losses in ART Initiation. Multiple CD4 measurements pre-ART.
Initiating ART:
-Adopt Test and START to simplify eligibility
-Same day ART initiation for all who are ready
-Optional CD4 at baseline
-TB screening and pregnancy test at baseline
Stable on ART:
-No strategy to differentiate stable patients
Clinic visits: Frequent visits for stable patients result in high costs
to the health system and patient. Limited pilots of community-
based models.
ARV Pharmacy pick-up: Monthly or more frequent drug pick up
results in high costs to the health system and patient. Limited
pilots of community-based models or innovation.
Stable on ART:
-Define stable patients as those with undetectable viral load or based on
simple clinical criteria
Clinic visits: Goal to move to clinic visits every 6-12 months for stable
patients. Standardization and scale up of community-based models. Use
of non-physician clinicians preferred.
ARV pharmacy pick-up: Goal to move to pharmacy pick up every 3-6
months. Standardization and scale up of community-based models and
innovations (e.g. use of private pharmacies)
Laboratory testing: Variability in laboratory testing and frequent
lab monitoring that is not evidence-based, including CD4,
hematology, chemistry, LFTS, and other testing.
Laboratory testing: Annual viral load testing and elimination of CD4
testing for routine monitoring. Annual Creatinine is desirable for patients
on tenofovir. Annual Hemoglobin is desirable for patients on zidovudine.
Eliminate other non-routine labs that are not evidence based. PEPFAR
teams need to ensure lab results reach patients and clinicians for
decision-making and repeat testing is not done simply because test
results do not reach patient charts.
Other cost drivers: Inefficient procurement practices, poor
coordination with other donors, missed opportunities.
Other cost drivers: National quantification and coordination for ARV and
other procurement (e.g. lab commodities).

Innovative Service Delivery Models
for ART are Urgently Needed
• To decentralize services & decongest crowded clinics
• To engage communities & improve retention
• To improve access for key populations such as PWID, MSM, TG, and sex workers
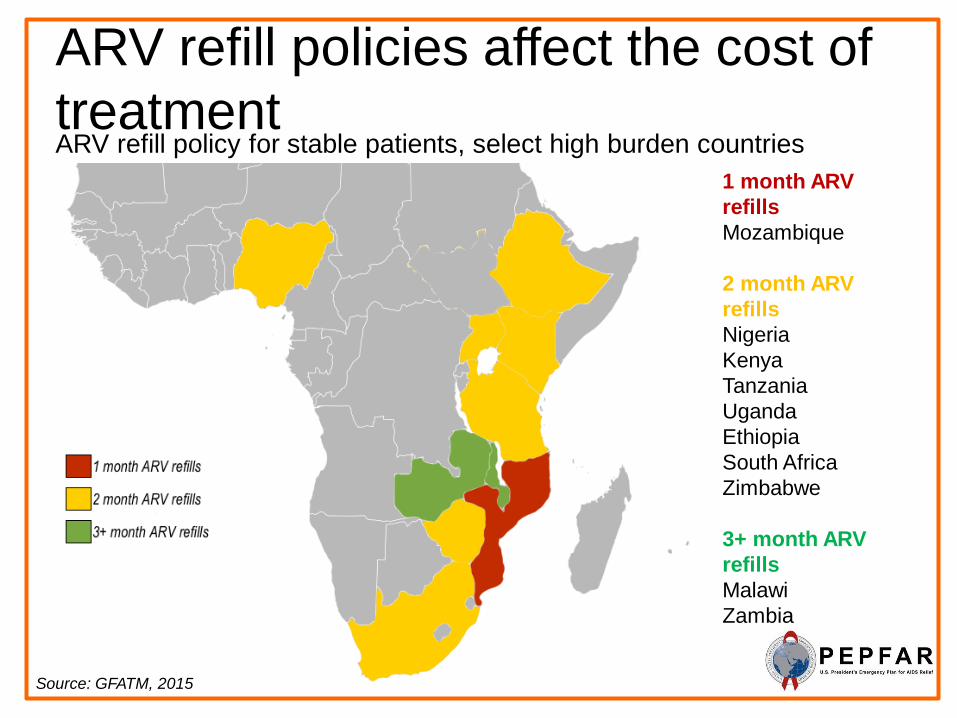
ARV refill policies affect the cost of
treatment ARV refill policy for stable patients, select high burden countries
Source: GFATM, 2015
1 month ARV
refills
Mozambique
2 month ARV
refills
Nigeria
Kenya
Tanzania
Uganda
Ethiopia
South Africa
Zimbabwe
3+ month ARV
refills
Malawi
Zambia

Decentralizing ART services Countries with policies to decentralize ART offer more cost
effective services
Source: GFATM, 2015
No Community-
based ART service
Ethiopia
Nigeria
Tanzania
Some community-
based ART services
Kenya
Malawi
Mozambique
South Africa
Uganda
Zimbabwe

Shared Responsibility
• Is not about money but about the policy changes that
are essential to the elimination of HIV as a public
health threat
• Country leadership on policies and adoption of WHO
guidelines must be within weeks and months and not
years
• Nearly 2/3rd of the cost of treatment is service delivery,
not the cost of drugs
• Change in policy to every 6 month appointments and
tendering to 3-6 month supply of drugs will allow each
treatment site to add 75% more clients on treatment
with the same facility personnel and cost

What if we could
double the number of people
on lifesaving
treatment over the next 5 years?

We can have : Treatment for All
If …
• The world prioritizes and fast-tracks treatment
• Countries adopt key policy changes and service delivery models
• Together we provide high-quality implementation
…then we can collectively aim to support
28 million men, women, and children on treatment by 2020 —
nearly twice as many as today.

We can prevent >50% of
new HIV infections
and reduce the number of
AIDS deaths by
nearly 50%.
This is bold. This is extraordinary.
And it is possible.

Treatment for All: 28M on ART by 2020
Source: Stover, 2015
0
500 000
1 000 000
1 500 000
2 000 000
2 500 000
3 000 000
2010
2011
2012
2013
2014
2015
2016
2017
2018
2019
2020
2021
2022
2023
2024
2025
2026
2027
2028
2029
2030
New HIV Infections and AIDS Deaths
New Infections AIDS Deaths
5-year
window:
2015 - 2020

…………………………………………………………………………………………………………...…...
ENDING MTCT AND TREATING CHILDREN
Virtual elimination of new pediatric infections & accelerating children’s treatment (ACT)

14.7 Million Pregnant women tested for HIV
831,500 HIV+ pregnant women started ART
to protect their babies & improve
maternal health
PEPFAR Results for 2015

333681
173797
33368
0
400000
2009 2010 2011 2012 2013 2014 2015
Nu
mb
er
of
ne
w p
ed
iatr
ic H
IV in
fec
tio
ns
Number of new pediatric HIV infections,
2009-2014
Remaining gap to virtual elimination of MTCT: ~ 140,000 annual new pediatric HIV infections
Source: UNAIDS Estimate, 21 Countries, 2015
Achieved to date (6 years):
~160,000 fewer new pediatric HIV infections annually

0 5 10 15 20 25 30 35 40
Botswana
South Africa
Namibia
Uganda
Swaziland
Zimbabwe
Zambia
Lesotho
21 Countries
Malawi
Kenya
Ethiopia
Ghana
Cote d'Ivoire
Burundi
Cameroon
Angola
Nigeria
DRC
Chad
Mother to child transmission rate (%)
6-week transmissionrate
Global Plan Target: <5% final
Mother-to-Child Transmission Rates at 6 weeks
and final status
Source: UNAIDS Estimate, 21 Countries, 2015
Majority of vertical transmission now occurs
during breastfeeding – need for better
retention strategies for new mothers on ART

Without lifesaving
antiretroviral therapy
for
HIV-infected children,
50% will die before
their 2nd birthday.
80% will die
before age 5.

Pediatric Treatment: Percent of children
<15 years living with HIV on lifelong ART
by country, 2014
8% 11% 12% 14% 15% 16%
17% 22% 22%
29% 30% 31% 37% 37% 38%
41% 42% 43%
49% 53%
66%
0
100
C
ha
d
C
am
ero
on
N
ige
ria
A
ngo
la
D
RC
C
ote
d'Ivoir
e
B
uru
nd
i
E
thio
pia
G
ha
na
L
esoth
o
M
ala
wi
21
Co
un
trie
s
M
ozam
biq
ue
U
ga
nd
a
Z
imba
bw
e
K
enya
Z
am
bia
S
wazila
nd
S
outh
Afr
ica
B
ots
wa
na
N
am
ibia
AR
T c
overa
ge a
mo
ng
ch
ild
ren
(%
)
Source: UNAIDS Estimate, 21 Countries, 2015

Partnering to save children PEPFAR & Children’s Investment Fund Foundation (CIFF)
Accelerating Children’s HIV/AIDS Treatment (ACT)
– $200M partnership
– Doubling the number of children receiving life saving ART
– FY 2017 Target: 600,000 on treatment
– Interim FY 2016 Target: 500,000 on treatment
– Countries : Cameroon, DRC, Kenya, Lesotho, Malawi, Mozambique, Tanzania, Zambia, Zimbabwe

ACT Results, 2015
PEPFAR is supporting
488,978 children with life-saving
antiretroviral treatment in the ACT countries up
from 300,000 just 12 months
PEPFAR has more than doubled HIV testing for children during the first year of
ACT to 4.3 million in 2015.

…………………………………………………………………………………………………………...…... DREAMS FOR YOUNG WOMEN & GIRLS
Ensuring young women are Determined, Resilient, Empowered, AIDS-free, Mentored and Safe

Why DREAMS?
•

Age-gender disparity in new HIV infections
globally, 2014
720,000 new
infections
primarily
driven
by infection of
young
women

Stark Disparity in HIV Prevalence
in young women & young men
Source: Abdool Karim Q,
2014
0,0%
5,0%
10,0%
15,0%
20,0%
25,0%
30,0%
<16 16-17 18-19 ≥20
HIV
Pre
vale
nce
Age in Years
Prevalence of HIV among high school students in rural KwaZulu-Natal, South Africa (2014)
Male (n=1252)
Female (n=1423)

5.5 Million Orphans & vulnerable children
received care and support
services
PEPFAR Results for 2015

• Launched on WAD 2014
• $385 million public-private partnership
– PEPFAR
– Bill & Melinda Gates Foundation
– Girl Effect, Johnson & Johnson, ViiV Healthcare, and Gilead
• Goal: to reduce new HIV infections in adolescent girls & young
women
• Ensure that girls have an opportunity to live Determined,
Resilient, Empowered, AIDS-free, Mentored and Safe
lives.
The DREAMS
Partnership


New HIV Infections among
adolescent girls and young women
Source: UNAIDS, 2015

DREAMS Interventions
• Condom Promotion & Provision
• HIV Testing & Counseling
• PrEP
• Post-Violence Care
• Increased Contraceptive Method Mix
• Social Asset Building
• School-Based HIV & Violence Prevention
• Community Mobilization & Norms Change
• Parenting/Caregiver Programs
• Cash Transfers
• Education Subsidy
• Combination Socioeconomic
Approaches
• Characterization of Male Partners
• Linking Male Partners to Services
• Management & Coordination
• Strategic Information
EMPOWER AGYW & REDUCE RISK
MOBILIZE COMMUNITY FOR CHANGE
STRENGTHEN THE FAMILY
DECREASE PARTNER RISK
SUPPORTING ACTIVITIES
Percentages are from initial country plans and
are currently under revision.
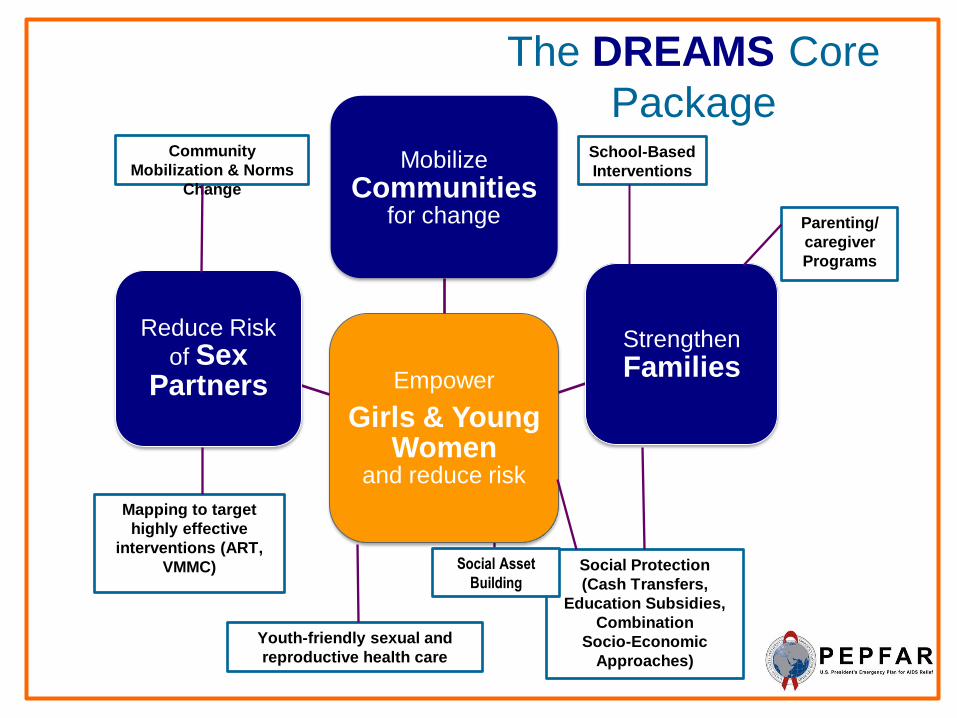
Empower
Girls & Young Women
and reduce risk
Mobilize Communities
for change
Strengthen Families
Reduce Risk
of Sex Partners
Community
Mobilization & Norms
Change
School-Based
Interventions
Mapping to target
highly effective
interventions (ART,
VMMC)
Youth-friendly sexual and
reproductive health care
Social Protection
(Cash Transfers,
Education Subsidies,
Combination
Socio-Economic
Approaches)
Parenting/
caregiver
Programs
The DREAMS Core
Package
Social Asset
Building
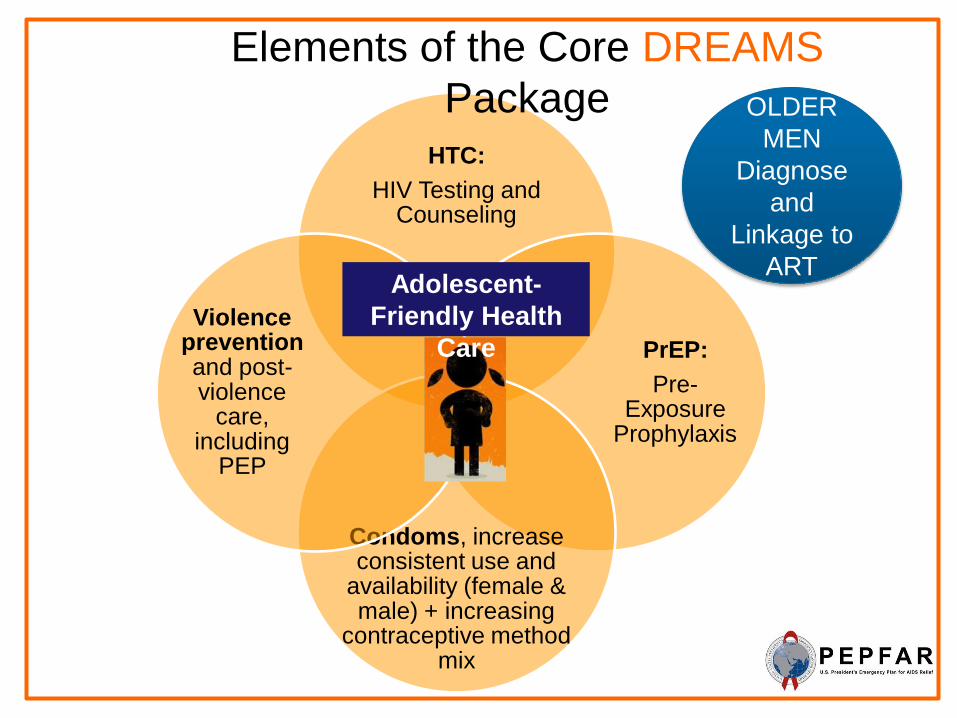
HTC:
HIV Testing and Counseling
PrEP:
Pre-Exposure
Prophylaxis
Condoms, increase consistent use and
availability (female & male) + increasing
contraceptive method mix
Violence prevention and post-violence
care, including
PEP
Adolescent-
Friendly Health
Care
Elements of the Core DREAMS
Package OLDER
MEN
Diagnose
and
Linkage to
ART

HIV Prevalence by Sex & Years of
Education Botswana, 2004-2008
Source: De Neve et al., The Lancet, 2015
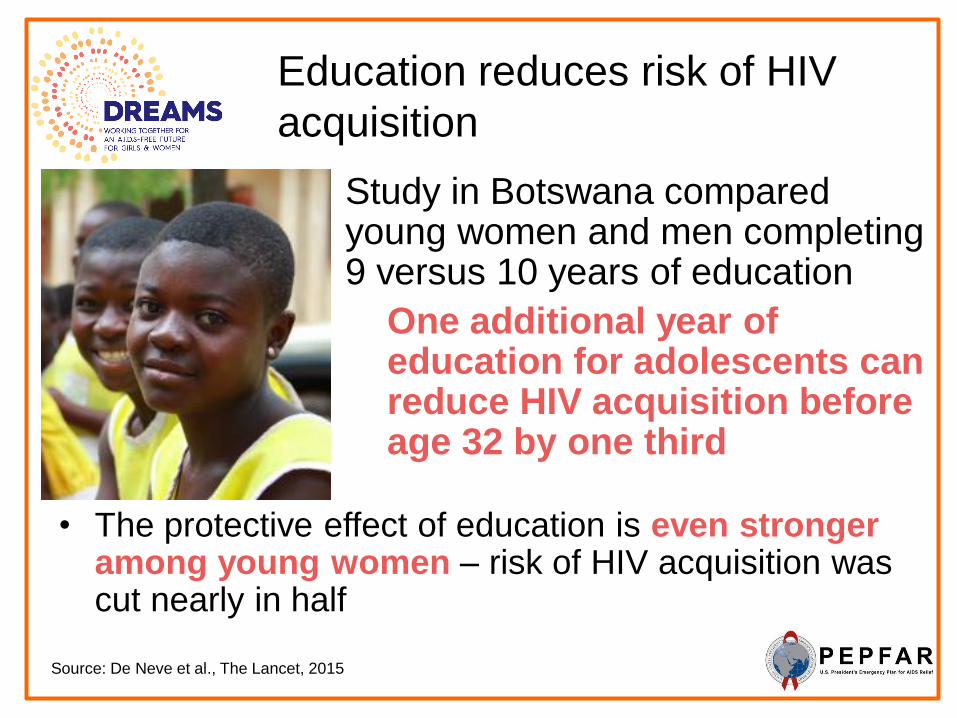
Education reduces risk of HIV
acquisition
Study in Botswana compared young women and men completing 9 versus 10 years of education
One additional year of education for adolescents can reduce HIV acquisition before age 32 by one third
Source: De Neve et al., The Lancet, 2015
• The protective effect of education is even stronger among young women – risk of HIV acquisition was cut nearly in half


DREAMS Innovation Challenge Inviting investment ideas to address gaps in core areas

Commitment to securing an AIDS-
free future for young women
Young women face great risk for HIV infection
Every year: 380,000 new HIV infections
Every week: 7,300 new HIV infections
Every day: > 1,000 new HIV infections
This must change.
PEPFAR is now investing nearly half a billion dollars
to support an AIDS-free future for adolescent girls and
young women.

…………………………………………………………………………………………………………...…... RIGHT PLACES: COUNTRY
EXAMPLES Using Data to Understand micro-epidemics and refine our response

Uganda We can be agile as governments and pivots can be
sustained

New HIV Infections & AIDS Deaths:
Uganda
1990 1991 1992 1993 1994 1995 1996 1997 1998 1999 2000 2001 2002 2003 2004 2005 2006 2007 2008 2009 2010 2011 2012 2013 2014
New Infec. 150000 130000 110000 93000 79000 71000 66000 64000 65000 67000 70000 74000 80000 87000 94000 100000 110000 110000 120000 130000 140000 130000 110000 110000 100000
Deaths 49000 59000 68000 77000 83000 89000 92000 93000 94000 92000 91000 88000 83000 79000 74000 64000 56000 59000 58000 53000 50000 46000 42000 39000 33000
0
60 000
120 000
180 000
Source: UNAIDS, 2015

Uganda: Focus on Core (Treatment)
Source: PEPFAR, 2015
2008 2009 2010 2011 2012 2013 2014
Budget 276 262 3 287 113 7 286 258 3 323 388 3 298 388 3 323 388 3 320 000 0
ART 130 837 175 367 207 872 257 689 364 207 507 633 643 458
0
100 000
200 000
300 000
400 000
500 000
600 000
700 000
0
50 000 000
100 000 000
150 000 000
200 000 000
250 000 000
300 000 000
350 000 000
PEPFAR Uganda Budget and Adults & Children on ART, 2008-2014 Uganda
Program
Review

Uganda: Focus on Core (PMTCT) B+
Acceleration
Source: PEPFAR, 2015
2008 2009 2010 2011 2012 2013 2014
PMTCT Test 594 305 849 638 785 615 1 136 884 1 231 115 1 508 404 1 647 818
PMTCT B+ 0 0 0 10 083 17 138 75 566 88 060
0
10 000
20 000
30 000
40 000
50 000
60 000
70 000
80 000
90 000
100 000
0
200 000
400 000
600 000
800 000
1 000 000
1 200 000
1 400 000
1 600 000
1 800 000
PEPFAR Uganda PMTCT: Testing of Pregnant Women & Lifelong ART for Mothers
Uganda
Program
Review

Uganda: Focus on Core (VMMC)
2008 2009 2010 2011 2012 2013 2014
budget 276 262 3 287 113 7 286 258 3 323 388 3 298 388 3 323 388 3 320 000 0
VMMC 0 0 0 9 052 57 132 352 039 906 615
0
100 000
200 000
300 000
400 000
500 000
600 000
700 000
800 000
900 000
1 000 000
0
50 000 000
100 000 000
150 000 000
200 000 000
250 000 000
300 000 000
350 000 000 Uganda
Program
Review


90:90:90 is within Uganda’s reach
1 439 974
1 066 948 1 008 952 933 805 918 453
243 000
181 131 166 352
182 055
485 359
16 798 15 244
-
19 145
90 000
172 381
-
177 906
422 214
138 315
0
200 000
400 000
600 000
800 000
1 000 000
1 200 000
1 400 000
1 600 000
1 800 000
Infected Diagnosed Linked to Care Retained inCare
On ART VirallySuppressed
Nu
mb
er o
f H
IV+
inid
ivid
ual
s
FY 2015 Est. Cascade PEPFAR FY16 Targets
GOU FY16 Targets (not PEPFAR supported) Additional patients needed to reach to 90-90-90
New Infections
90 90
90
90-90-90 TARGETS
Infected 1,578,289
Diagnosed 1,420,260
On ARVs 1,278,414
Virally Suppressed 1,150,573

Haiti There are still historically underserved populations
geographically

HIV Infections & AIDS Deaths in
Haiti
1990 1991 1992 1993 1994 1995 1996 1997 1998 1999 2000 2001 2002 2003 2004 2005 2006 2007 2008 2009 2010 2011 2012 2013 2014
New Infec. 17000 19000 20000 21000 21000 21000 18000 18000 16000 14000 13000 12000 11000 9500 9500 8500 8700 8700 8300 8400 8700 8100 7500 7100 6800
Deaths 2100 2800 3600 4500 5500 6500 7600 8600 9600 10000 11000 12000 12000 12000 12000 12000 11000 8900 7800 6600 6200 6600 5900 4800 3800
0
5 000
10 000
15 000
20 000
25 000
30 000
Estimated Number of New HIV Infections and AIDS Deaths by Year
Haiti
Source: UNAIDS, 2015


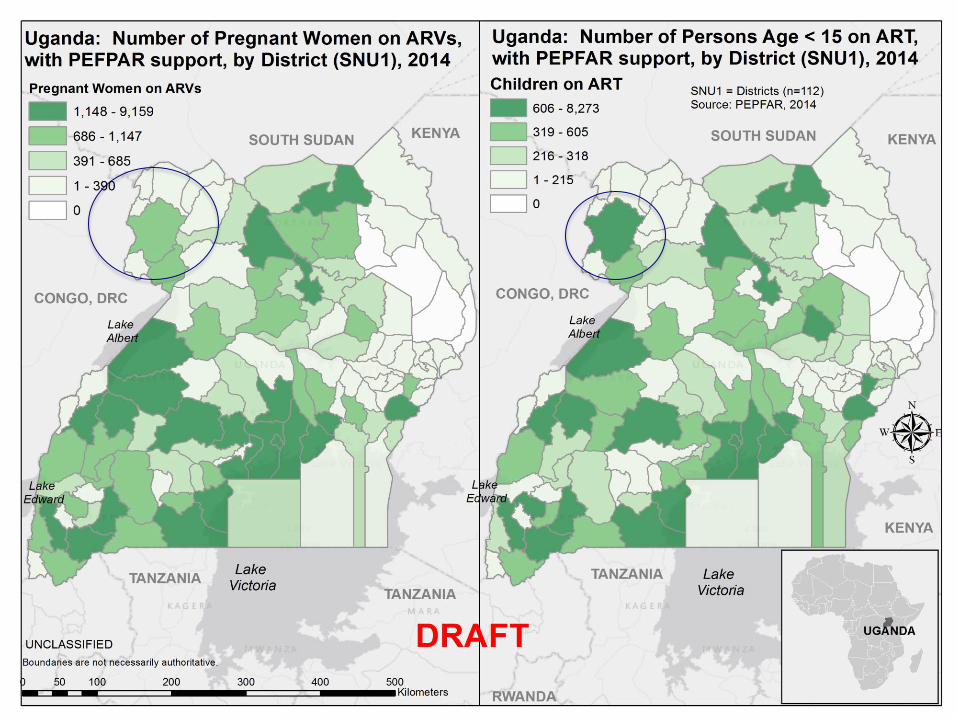
…………………………………………………………………………………………………………...…... USING GEOSPATIAL MAPPING FOR
IMPACT

Using Geospatial Mapping to Define Site Density

Nairobi: HIV Prevalence at ANC/PMTCT Sites
Source: PEPFAR, 2015

Site Prioritization: Priority Districts
Plan for detailed analysis to determine appropriate client referrals


…………………………………………………………………………………………………………...…... EMPOWERING CIVIL SOCIETY &
PLHIV Supporting civil society groups is key

The World Was Slow to Recognize the Global AIDS Crisis
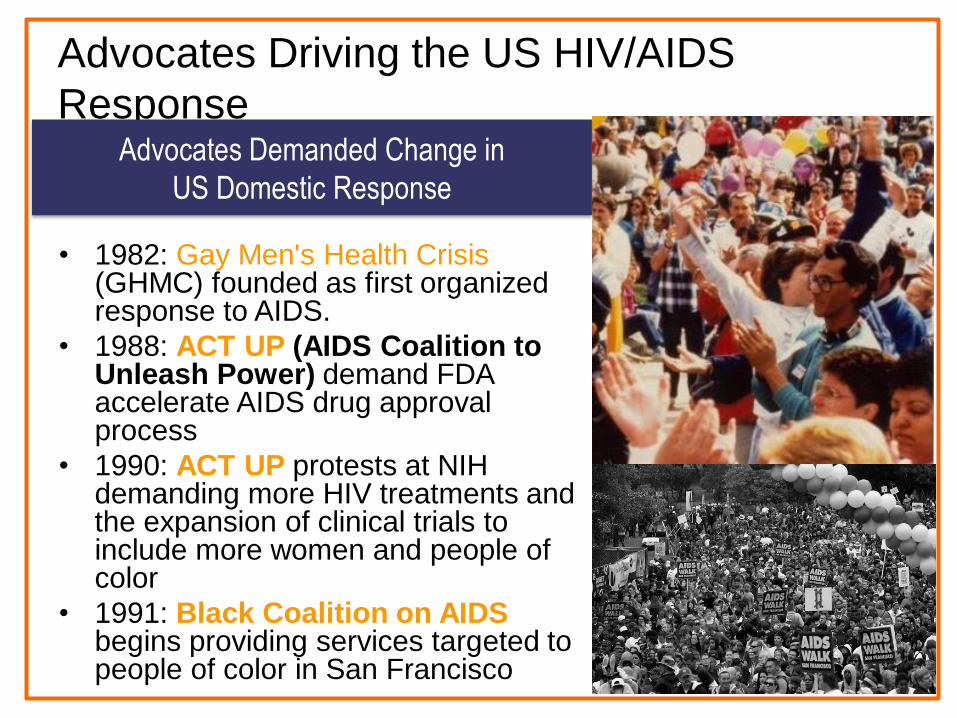
Advocates Driving the US HIV/AIDS
Response
• 1982: Gay Men's Health Crisis (GHMC) founded as first organized response to AIDS.
• 1988: ACT UP (AIDS Coalition to Unleash Power) demand FDA accelerate AIDS drug approval process
• 1990: ACT UP protests at NIH demanding more HIV treatments and the expansion of clinical trials to include more women and people of color
• 1991: Black Coalition on AIDS begins providing services targeted to people of color in San Francisco
Advocates Demanded Change in
US Domestic Response
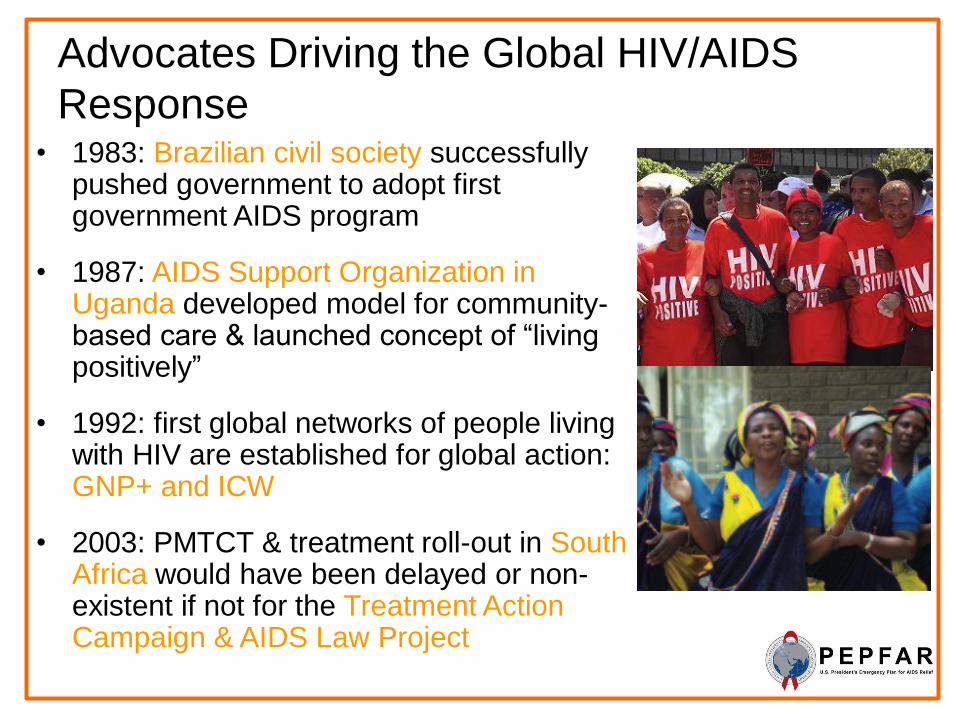
Advocates Driving the Global HIV/AIDS
Response • 1983: Brazilian civil society successfully
pushed government to adopt first government AIDS program
• 1987: AIDS Support Organization in Uganda developed model for community-based care & launched concept of “living positively”
• 1992: first global networks of people living with HIV are established for global action: GNP+ and ICW
• 2003: PMTCT & treatment roll-out in South Africa would have been delayed or non-existent if not for the Treatment Action Campaign & AIDS Law Project

Civil Society Plays Critical Role in
HIV Response
• We would not have a global HIV response if not
for civil society groups that demanded it
• People living with HIV should play a meaningful
role in shaping HIV programs & have powerful
voices within their countries
• Support from donors has been inadequate
• We can all do more to support efforts of
networks of PLHIV and civil society groups

Strengthening Civil Society, including
FBOs • PEPFAR has committed $10
million to the Robert Carr Civil
Society Networks Fund over the
next three years to build the
capacity of civil society
• $4 million two-year initiative
PEPFAR/UNAIDS faith initiative
• PEPFAR with the Elton John AIDS
Funds has committed $10 million
to support key population
advocacy
• DREAMS innovation Challenge
Fund

…………………………………………………………………………………………………………...…... SUMMARY Key take-aways & top priorities

Do we have the collective will to
focus? • We have the opportunity to control the HIV/AIDS
epidemic in countries by doing the right things in the right places, right now in partnership with host countries, UNAIDS, and GF
• Do we have the collective will to make the hard choices to reach more in need by focusing resources and efforts?
• Can we increase impact with innovative service delivery models to expand ART & prevent new HIV infections?
• USG accountability will continue to be enhanced to ensure achievement of the targets and ensuring HIV/AIDS epidemic control; PEPFAR data will be available to everyone for analyses

Our work is far from done.
This week alone…
Over 4,230 babies were infected
with HIV
Over 34,615 adults were infected of which
more than 7000 were young women
Over 20,000 adults died
this week from HIV
Over 2880 children died
this week from HIV

THANK YOU