peoria transit study public meeting #3 slides
TRANSCRIPT

Public Meeting #3Peoria/Riverside Transit Study
January 8, 2013
South Brooke Church of Christ

Agenda
1. Background
2. Bus Rapid Transit
3. Goals/Needs
4. Definitions of Alternatives
5. Evaluation Criteria
6. Evaluation Results
7. Preferred Alternative
8. Next Steps
1/9/2013 2
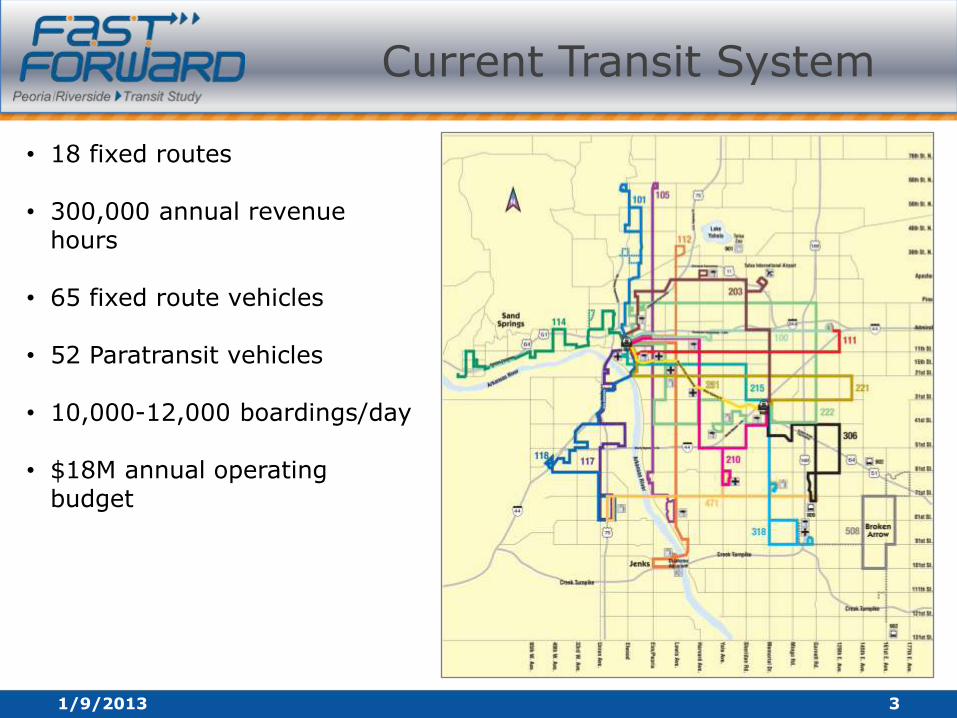
Current Transit System
1/9/2013 3
• 18 fixed routes
• 300,000 annual revenue hours
• 65 fixed route vehicles
• 52 Paratransit vehicles
• 10,000-12,000 boardings/day
• $18M annual operating budget

Tulsa Transit Ridership by Route
1/9/2013 4
47,542
48,808
80,434
86,605
89,823
113,795
126,842
130,593
130,885
134,342
161,348
166,885
171,187
190,378
260,717
315,269
458,559
306
471
118
318
117
215
203
251
111
114
100
221
210
112
101
222
105
FY12 Ridership Route 105: Peoria

Adopted 10/13/2011
Adopted Regional Transit System Plan

Adopted 10/13/2011
Adopted Regional Transit System Plan
20.2 Miles
Residents: 56,000 (1 in 7)
Jobs: 52,000 (1 in 5)
5,700 TOTAL daily trips to/from downtown (13%)
Peoria/Riverside Corridor

Major Activity Centers
1/9/2013 7
Tulsa Tech
Blair Property Park
Cherry Street
Mabee Center/ORU Brookside
Downtown
Utica Square
St. John & Hillcrest

PlaniTulsa Comprehensive Plan
1/9/2013 8
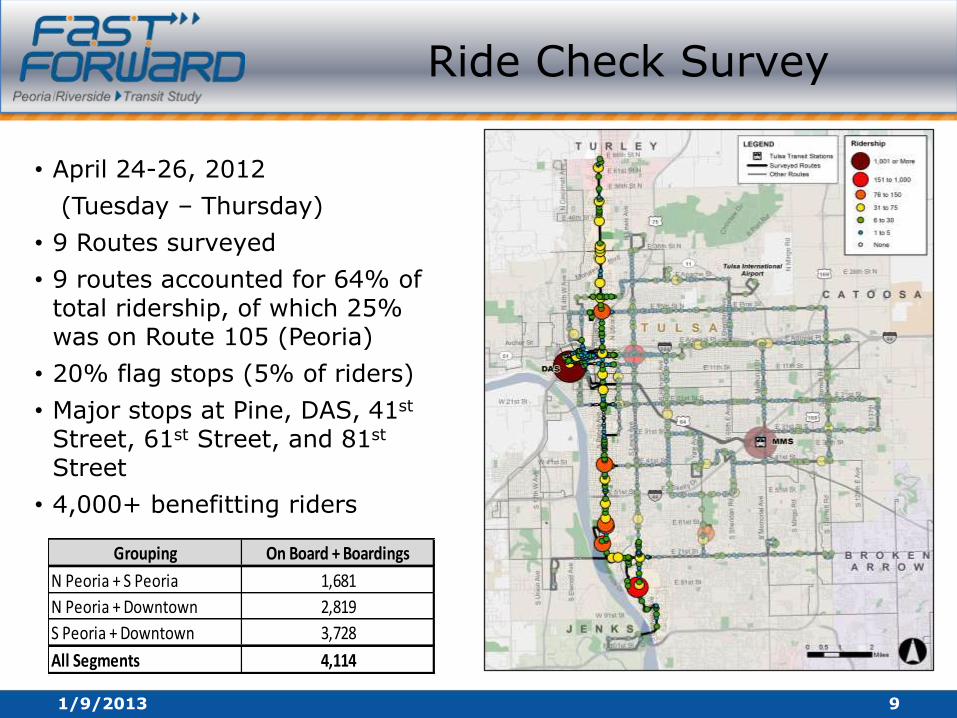
Ride Check Survey
1/9/2013 9
• April 24-26, 2012
(Tuesday – Thursday)
• 9 Routes surveyed
• 9 routes accounted for 64% of total ridership, of which 25% was on Route 105 (Peoria)
• 20% flag stops (5% of riders)
• Major stops at Pine, DAS, 41st
Street, 61st Street, and 81st
Street
• 4,000+ benefitting riders
Grouping On Board + Boardings
N Peoria + S Peoria 1,681
N Peoria + Downtown 2,819
S Peoria + Downtown 3,728
All Segments 4,114

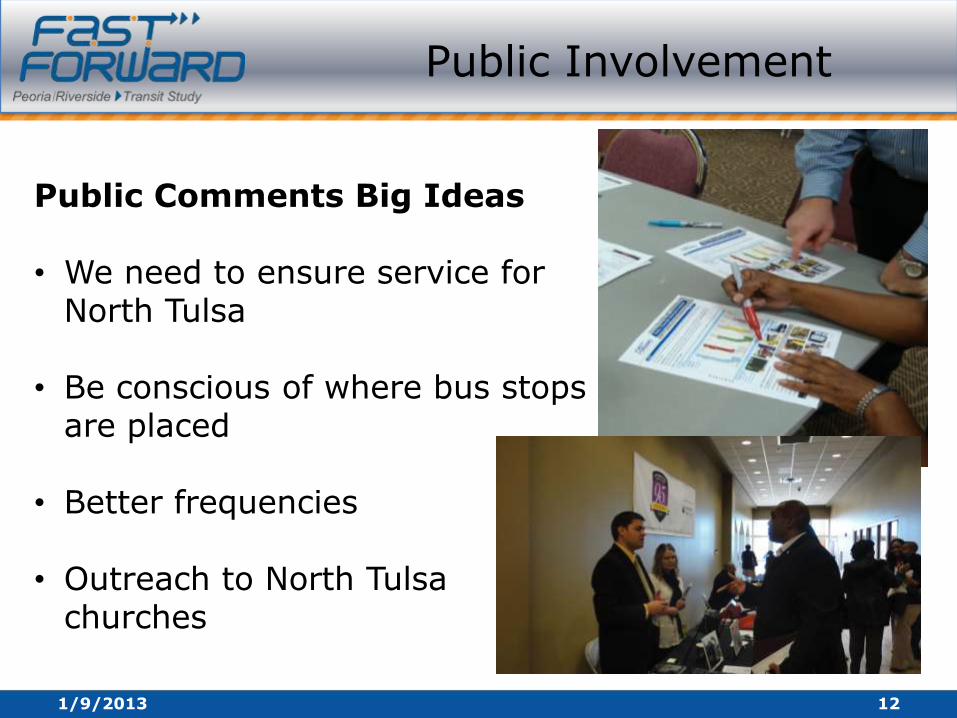
Public Involvement
1/9/2013 11
Steering Committee Initial Meeting (June)
Initial round of public meetings July 16th & 17th
Targeted Neighborhood Outreach
Public Involvement
1/9/2013 12
Public Comments Big Ideas
• We need to ensure service for North Tulsa
• Be conscious of where bus stops are placed
• Better frequencies
• Outreach to North Tulsa churches

Scenario Comparison
1/9/2013 13
Scenario A Scenario C Scenario D Scenario EScenario B
4,050 4,050 3,950 3,950 3,690
Existing Transit Riders
Based on technical analysis and public input, move forward with Scenario B(66th St. North to 81st & Lewis)

Bus Rapid Transit
1/9/2013 14
Branded Buses Off-Board Fare Collection
Passenger InformationEnhanced Boarding Platforms

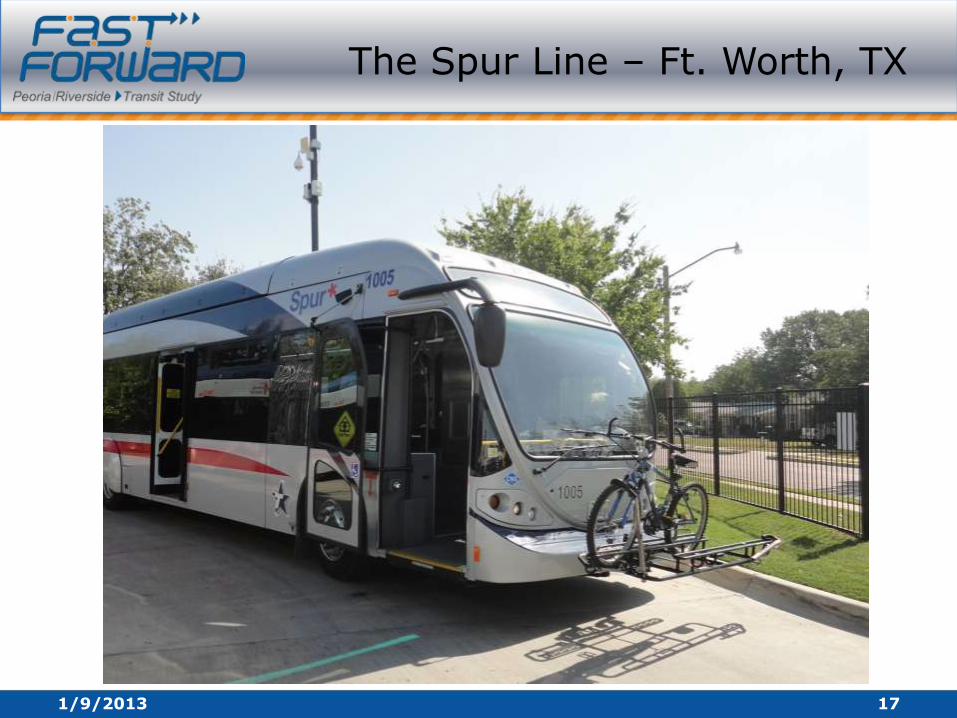
The Spur – Ft. Worth, TX
1/9/2013 15

The Spur Line – Ft. Worth, TX
1/9/2013 16
1/9/2013 17
The Spur Line – Ft. Worth, TX

Shelters & Passenger Information
1/9/2013 18

Stop Types
1/9/2013 19

Station Concept Examples
1/9/2013 20
• 20 ft Concrete platform
•Station canopy and structural framing support
•LED lighting beneath station canopy
•Benches and / or leaning rails, bicycle racks, trash cans
•Branded, BRT signage and passenger information
•Allowance for public art incorporated into amenities

Station Concept Examples
1/9/2013 21
•35 ft Concrete platform
•Station canopy and structural framing support
•LED lighting beneath station canopy
•Benches and / or leaning rails, bicycle racks, trash cans
•Branded, BRT signage and passenger information
•Allowance for public art incorporated into amenities

San Antonio Primo
1/9/2013 22

Study Goals
• Goal 1: Improve Transit Access and Regional Mobility
• Goal 2: Support Economic Development
• Goal 3: Invest in Low-Cost, High-Impact Transit Infrastructure
• Goal 4: Build Community Support for the Value of Transit
Peoria-Riverside Transit Study Goals
1/9/2013 23

Description of Alternatives
• Bus Rapid Transit- BRT (MAP-21 req)
• Fast Bus
• Tulsa Enhanced
• Tulsa (+) Plus
• “No Build”
1/9/2013 24

BRT
1/9/2013 25
• Bus Rapid Transit (BRT) 50 min. Trip Time
BRT stops at approx. ½ mi. intervals (36 stations at 19 locations)
10-15 minute headways
5:30am-8:30pm
Monday-Sunday
DEDICATED LANES
TRAFFIC PRIORITY AT SIGNAL
TICKET VENDING MACHINES
NEXT BUS ARRIVAL
PEDESTRIAN CROSSINGS
SIDEWALKS
ILLUMINATION
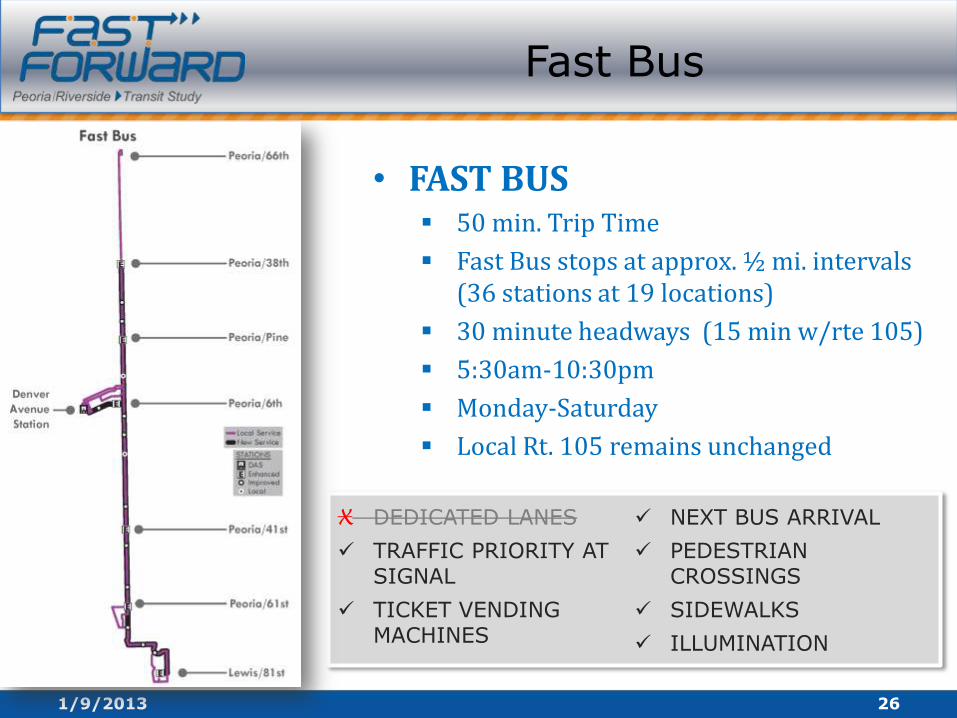
Fast Bus
1/9/2013 26
• FAST BUS 50 min. Trip Time
Fast Bus stops at approx. ½ mi. intervals (36 stations at 19 locations)
30 minute headways (15 min w/rte 105)
5:30am-10:30pm
Monday-Saturday
Local Rt. 105 remains unchanged
X DEDICATED LANES
TRAFFIC PRIORITY AT SIGNAL
TICKET VENDING MACHINES
NEXT BUS ARRIVAL
PEDESTRIAN CROSSINGS
SIDEWALKS
ILLUMINATION
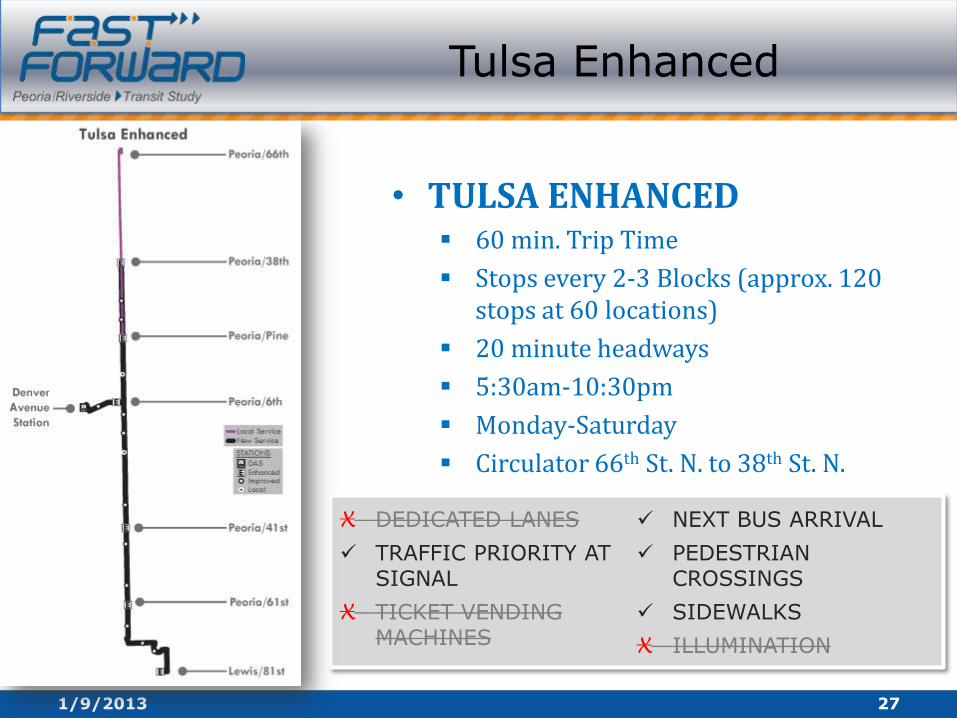
Tulsa Enhanced
1/9/2013 27
• TULSA ENHANCED 60 min. Trip Time
Stops every 2-3 Blocks (approx. 120 stops at 60 locations)
20 minute headways
5:30am-10:30pm
Monday-Saturday
Circulator 66th St. N. to 38th St. N.
X DEDICATED LANES
TRAFFIC PRIORITY AT SIGNAL
X TICKET VENDING MACHINES
NEXT BUS ARRIVAL
PEDESTRIAN CROSSINGS
SIDEWALKS
X ILLUMINATION

Tulsa (+) Plus
1/9/2013 28
• TULSA (+) PLUS 65 min. Trip Time
Local and Flag Stops (196 stops in 98 locations)
30 minute headways
5:30am-10:30pm
Monday-Saturday
X DEDICATED LANES
TRAFFIC PRIORITY AT SIGNAL
X TICKET VENDING MACHINES
X NEXT BUS ARRIVAL
X PEDESTRIAN CROSSINGS
X SIDEWALKS
X ILLUMINATION

No Build
1/9/2013 29
NO BUILD 70 min. Trip Time
Local and Flag Stops (196 stops in 98 locations)
30-45 minute headways
5:30am-8:30pm
Monday-Saturday
X DEDICATED LANES
X TRAFFIC PRIORITY AT SIGNAL
X TICKET VENDING MACHINES
X NEXT BUS ARRIVAL
X PEDESTRIAN CROSSINGS
X SIDEWALKS
X ILLUMINATION

Evaluation Criteria
• Alternatives are evaluated based on their ability to improve transit service within the PRC by:
– Travel Time
– Transit Visibility and Perception
– Comfort/Reliability
– Safety
– Capital Cost
– Operating Cost
1/9/2013 30

Travel time
• Shorter Travel Time
• Dedicated Bus Travel Lane
• Fewer Stops
• Traffic Signal Priority
1/9/2013 31
• Longer Travel Time
• Mixed Traffic
• Frequent Stops
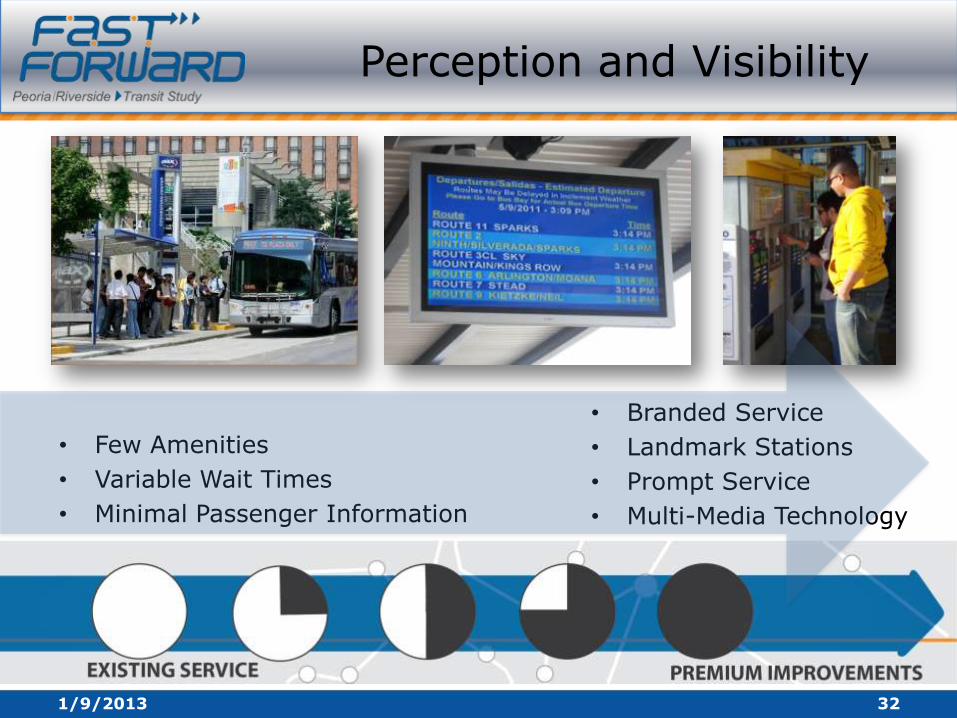
Perception and Visibility
• Branded Service
• Landmark Stations
• Prompt Service
• Multi-Media Technology
1/9/2013 32
• Few Amenities
• Variable Wait Times
• Minimal Passenger Information
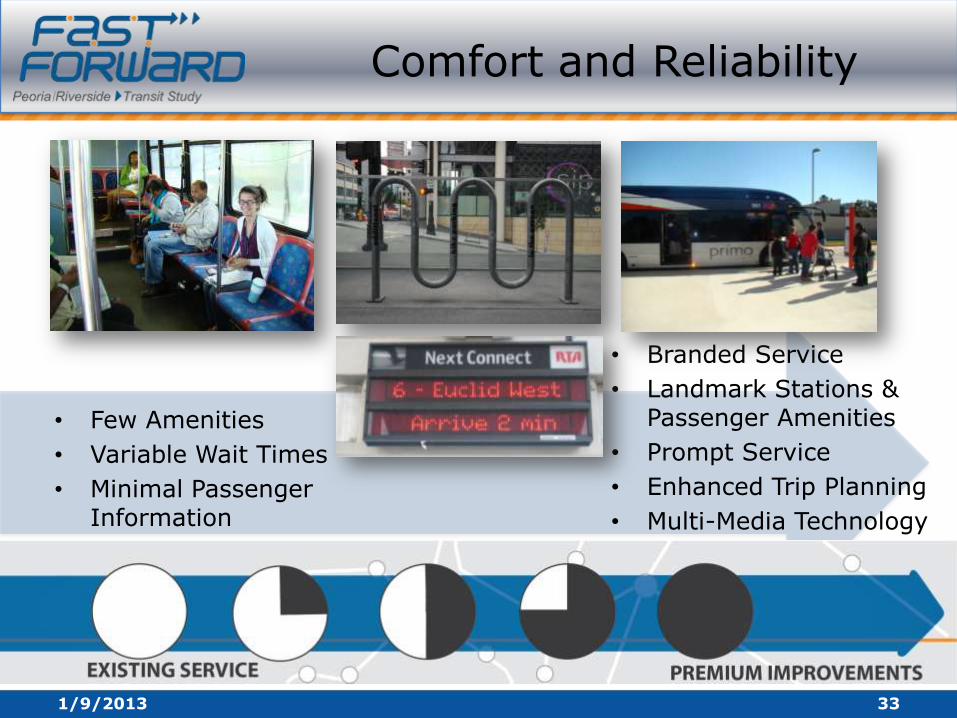
Comfort and Reliability
• Branded Service
• Landmark Stations & Passenger Amenities
• Prompt Service
• Enhanced Trip Planning
• Multi-Media Technology
1/9/2013 33
• Few Amenities
• Variable Wait Times
• Minimal Passenger Information

Safety
• Sidewalk Enhancements
• Pedestrian Street Crossings
• Lighting at Stations
1/9/2013 34
• Limited Pedestrian Improvements

Evaluation Results
1/9/2013 35
Item Description BRT FAST BUSTULSA
ENHANCEDTULSA PLUS
EXISTING
ROUTE 105
TRAVEL TIME
VISIBILTY AND
PERCEPTION
COMFORT AND
RELIABILITY
SAFETY
CAPITAL COST
OPERATING COST
(change from
existing)
FEASIBILITY - Percent
of Tulsa Transit Annual
Operating Budget*
SUMMARY SCORE= 1 = 2 = 3 = 4 = 5
$ 20.9M $15.9M $ 16.7M $ 9.2M $0
$ 3.4M $ 2.5M $ 2.2M $1.5M $1.3M
($ 2.2M) ($1.2M) ($ .9M) ($ .2M) (No Change from
Existing)
19% 14% 12% 8% 7%
*Based on Tulsa Transit Annual Operating Budget of
$18 M
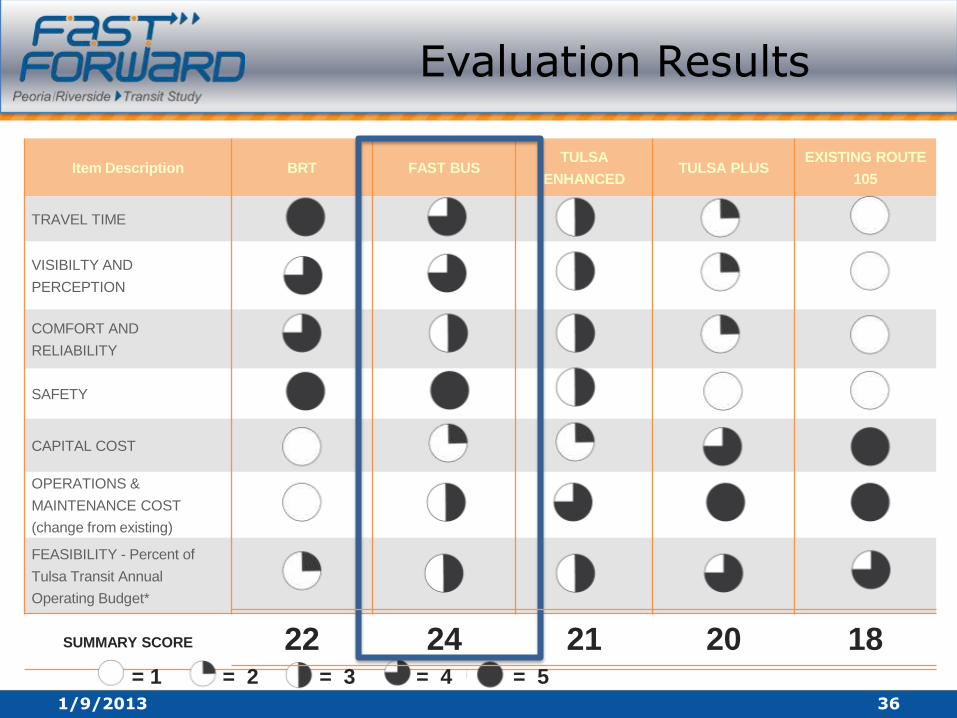
Evaluation Results
1/9/2013 36
Item Description BRT FAST BUSTULSA
ENHANCEDTULSA PLUS
EXISTING ROUTE
105
TRAVEL TIME
VISIBILTY AND
PERCEPTION
COMFORT AND
RELIABILITY
SAFETY
CAPITAL COST
OPERATIONS &
MAINTENANCE COST
(change from existing)
FEASIBILITY - Percent of
Tulsa Transit Annual
Operating Budget*
SUMMARY SCORE
= 1 = 2 = 3 = 4 = 5
22 24 21 20 18

Preferred Alternative -Fast Bus
1/9/2013 37
• FAST BUS 50 min. Trip Time, Stops @ 1/2 –mi spacing
30 minute headways (15 min w/Rt. 105)
5:30am-10:30pm, Monday-Saturday
X DEDICATED LANES
TRAFFIC PRIORITY AT SIGNAL
TICKET VENDING MACHINES
NEXT BUS ARRIVAL
PEDESTRIAN CROSSINGS
SIDEWALKS
ILLUMINATION
CAPITAL COST $15.9 M
OPERATING COST
(change from existing)
$2.5 M
($ 1.2 M)
FEASIBILITY - Percent of
Annual Operating Budget14%

Next Steps
• Feedback on preferred alternative
• Steering Committee approval
• Tulsa Transit Board concurrence
• Funding Commitments
• Design
• Implementation
1/9/2013 38

Comments & Contact Info
Send email comments to [email protected]
-OR-
Use comment card at the registration table
Contact for Questions:
James Wagner, AICP
(918) 584-7526
1/9/2013 39