people wh o know how
TRANSCRIPT

PEOPLE whOKnOw hOw
Annual Report and Accounts 2012
QinetiQ Group plc

Division
UK ServicesRevenue
£610.1m(2011: £652.7m)†
Underlying operating profit*
£63.0m(2011: £47.4m)†
Employees
5,157(2011: 5,337)†
Division
US ServicesRevenue
£534.5m(2011: £607.3m)†
Underlying operating profit*
£32.1m(2011: £45.9m)†
Employees
3,940(2011: 4,686)†
Division
Global ProductsRevenue
£325.0m(2011: £442.6m)†
Underlying operating profit*
£66.2m(2011: £52.1m)†
Employees
1,083(2011: 1,185)†
GRoUP ovERvIEwThe Group operates three divisions: UK Services, US Services and Global Products; this enables us to leverage our expertise, technology, customer relationships and business development skills effectively.
our services businesses, which account for more than 75% of total sales, are focused on providing expertise and knowledge in national markets. our products business focuses on the provision of product-based solutions to meet customer requirements, complemented by contract-funded research and development on a global basis.
* Definitions of underlying measures of performance are in the glossary on page 107. † Restated to reflect the transfer of businesses from Global Products to UK Services and US Services at the beginning of the 2012 financial year.
2012 £m
2011†
£m
UK Services 610.1 652.7
US Services 534.5 607.3
Global Products 325.0 442.6
Total 1,469.6 1,702.6
42%
36%
22%
Revenue by business £m

Capabilities• Acquisition services• Air engineering• C4ISR• Cyber solutions• Force and base protection• Programme and procurement support• Information and intelligence• Test and evaluation• Training and simulation
Developments during the year• Reorganisation of division into
strategic business units• Award of four-year £38m Naval
Combat Systems Integration Support Services contract
• Award of £22m multi-year test and evaluation A400M contract
Customers• Ministry of Defence (MOD)• DSTL• The Highways Agency• UK security agencies• Australian Department
of Defence
Capabilities• C4ISR • Cloud computing • Cyber solutions• Data analysis• IT systems, software engineering
and integration• Logistics• Mission assurance• Mobility solutions• Modelling• Training and simulation
Developments during the year• Restructuring programme undertaken,
reducing indirect costs by US$25m • Award of US$36.5m IDIQ scientific and
analytic support contract for the Patrick Air Force Base, Florida
Customers• NASA• US Department of Homeland
Security (DHS)• US Department of Defense (DoD)• US Department of State (DoS)
Capabilities• Pyrolysis (Energy from waste)• Sensor networks• Survivability systems• Vehicle power management• Unmanned systems
Developments during the year• E-X-Drive® selected for the technology
development phase of the US Army’s Ground Combat Vehicle Program
• OptaSense® incorporated as an independent global business
• Disposal of Spectro
Customers• US Department of Defense (DoD)• Ministry of Defence (MOD)• UK and North American
security agencies• Shell• European Space Agency• Astrium• BAE Systems
2012 £m
2011£m
UK Government 482.8 526.5
US Government 730.5 894.3
Other 256.3 281.8
Total 1,469.6 1,702.6
50%
33%17%
Revenue by major customer type £m
2012 £m
2011£m
United Kingdom 570.1 623.7
North America 788.7 949.2
Other 110.8 129.7
Total 1,469.6 1,702.6
39%
54%
7%
Revenue by geography £m
2012 £m
2011†
£m
UK Services 63.0 47.4
US Services 32.1 45.9
Global Products 66.2 52.1
Total 161.3 145.4
41%
20%
39%
Underlying operating profit by business* £m

Cover image Gemma Doré, Flight Test Engineer, Flight Physics team, at MOD Boscombe Down, Wiltshire.
2012 £1,469.6m
2011 £1,702.6m
2010 £1,625.4m
2012 £161.3m
2011 £145.4m
2010 £120.3m
2012 146%
2011 183%
2010 145%
2012 11.0%
2011 8.5%
2010 7.4%
2012 £122.2m
2011 £260.9m
2010 £457.4m
2012 14.6p
2011 14.2p
2010 11.1p
2012 0.5x
2011 1.4x
2010 2.5x
2012 2.90p
2011 1.60p
2010 1.58p
Revenue
£1,469.6mNet debt
£122.2m
Underlying operating profit*
£161.3mUnderlying earnings per share*
14.6p
Underlying operating cash conversion*
146%Gearing ratio†
0.5x
Underlying operating margin*
11%Total dividend
2.90p
PErfOrmancE highLights
* Definitions of underlying measures of performance are in the glossary on page 107.
† The gearing ratio is net debt to adjusted EBITDA and the definition is in the glossary on page 107.
cOntEntsANNUAL REPoRT AND ACCoUNTS 2012
12Directors’ report: Corporate governance
34 Board of Directors36 Corporate governance report44 Remuneration report53 other statutory information56 Statement of Directors’ responsibilities
Financial statements
57 Independent auditor’s report58 Consolidated income statement59 Consolidated statement of
comprehensive income59 Consolidated statement of
changes in equity60 Consolidated balance sheet61 Consolidated cash flow statement61 Reconciliation of movement in net debt62 Notes to the financial statements103 Company balance sheet104 Notes to the Company
financial statements106 Five-year record 107 Glossary108 Shareholder information109 Additional information
04
10 08
03
Directors’ report: Business review
02 our mission03 Chairman’s statement04 Chief Executive officer’s statement07 our business model08 Trusted to deliver10 Committed to the mission12 Innovative and forward-looking14 operations overview:
14 UK Services15 US Services16 Global Products
17 Chief Financial officer’s review23 Key performance indicators26 Risks and uncertainties30 Corporate responsibility and
sustainability review
QinetiQ Group plc Annual Report and Accounts 2012 1

Our business is based on technical expertise, knowledge and advice to solve some of the world’s most challenging problems. Our most prized possession is trust. Customers around the world rely on the ideas, innovations and drive of our people to help them meet their goals – often in environments where their mission has no second chance for success. Whether we are supplying technical services support to the defence industry or helping a bank to keep its customer records safe – we aim to deliver solutions that work first time and every time.
AN ovERvIEw
OUr missiOn
* Definitions of underlying measures of performance are in the glossary on page 107.† The gearing ratio is net debt to adjusted EBITDA and the definition is in the glossary on page 107.
2 QinetiQ Group plc Annual Report and Accounts 2012

Business review Corporate governance Financial statements
CHAIRMAN’S STATEMENT
DELivEring vaLUE
This was another uncertain year for businesses worldwide. The effects of global economic pressures and national budgetary constraints had an impact on companies across all geographies and the markets in which QinetiQ operates were not immune. However, I am very pleased to report that against this backdrop, QinetiQ delivered results for 2011/12 of which our employees and leaders can rightly be proud.
Results Group revenue was £1,469.6m (2011: £1,702.6m) and underlying operating profit* rose 11% to £161.3m (2011: £145.4m), resulting in an underlying profit before tax* for the Group of £118.3m (2011: £114.6m). Underlying operating cash conversion* remained very strong at 146% (2011: 183%). Full year underlying earnings per share* were 14.6p (2011: 14.2p).
Balance sheetSignificant progress on strengthening the balance sheet continued this year. Closing net debt at 31 March 2012 was £122.2m (£260.9m at 31 March 2011) with a resulting net debt: EBITDA gearing ratio† of 0.5x (2011: 1.4x). In addition to the reduction of debt, QinetiQ was also able to reach an agreement with the Trustees of the defined benefit pension scheme, which reduced the deficit and increased the stability of the scheme. The Group now has the financial stability to develop its businesses in step with its customers’ changing needs, as well as exploring carefully selected opportunities.
DividendThe Board proposes a final dividend of 2.00p per share for the year ended 31 March 2012 (31 March 2011: 1.60p), reflecting the achievement of the self-help programme and confidence in the medium term. The final dividend will be paid, subject to shareholder approval, on 7 September 2012 to shareholders on the register at 10 August 2012.
Transformation programmeQinetiQ’s 24-month self-help programme had three strands: focus, cultural transformation and strengthening the balance sheet. Management made determined advances on all fronts throughout the programme and will continue to embed these gains in the current and coming years.
A key step in the year was the Ministry of Defence’s agreement to proposed changes to its Special Shareholder rights in QinetiQ, subject to shareholder approval at the Group’s next AGM. These changes include the removal of the MOD’s right to veto any transaction or activity and the introduction of a less onerous compliance system, similar to those of comparable companies. This welcome modernisation will enable us to operate more competitively and commercially, in line with our peer group.
With the 24-month self-help programme successfully achieved and the plans for its next stage of development in place, your Board believes that QinetiQ now has a strong base for longer-term profitable growth.
Mark Elliott, Chairman
Board changesAt the end of January 2012, Sir David Lees, who had been Deputy Chairman and Senior Independent Director since 2005, retired from the QinetiQ Board. On behalf of the Board, I thank Sir David for his significant contribution to the Company, particularly in its early years of development. In November 2011, Michael Harper joined the QinetiQ Board as a Non-executive Director and, following Sir David’s retirement, became the Group’s Deputy Chairman and Senior Independent Director. An engineer by training, Michael was previously the Chief Executive Officer of Kidde plc. He is Chairman of BBA Aviation plc, the Vitec Group plc and Ricardo plc.
People who know howQinetiQ is rightly proud of the quality of its people. Our teams are committed to our customers, committed to the mission and trusted to deliver. They combine innovation, agility and responsiveness while working towards a common objective. Customers around the world rely on the expertise and capability of our people to help them meet their goals – often in environments where their mission has no second chance of success. Over a year of considerable change, our people have continued to deliver for our customers. The Board and I thank them for their support.
outlook Given the continuing uncertainty and lower than normal visibility in defence markets, the Board’s expectations for trading performance in the current year remain unchanged. However, underlying earnings per share will benefit from early repayment of private placement debt and the reduction in the deficit of the UK defined benefit pension scheme following the change to CPI as the inflation index.
The success of the self-help programme in restoring both the balance sheet and portfolio to strength gives the Board confidence in QinetiQ’s ability to build significant value over the next phase of its development.
Mark Elliott Chairman 24 May 2012
QinetiQ Group plc Annual Report and Accounts 2012 3

First phase: Self-helpTransforming QinetiQ began in May 2010 with a 24-month self-help programme. This addressed the Group’s immediate financial situation, but also targeted three areas for fundamental change: focus, cultural transformation and strengthening the balance sheet. This programme achieved its objectives, meeting key goals well ahead of schedule.
1. FocusThe Group is now managed as a strong defensible core, well-positioned for growth once markets stabilise, with a number of further potentially scalable businesses. During the self-help programme, the portfolio was realigned to ensure a full understanding of where profits were made and lost, and segmented by the sustainability of each business. This has resulted in distinct investable businesses, each representing one of the Group’s key areas of capability, with a clear route-map for the future. Loss-making businesses are being addressed, divested or closed.
Specific progress during the year included:
• Following on from the restructuring of the UK business last year, the current year saw the reshaping of US Services into a single integrated business under a new President;
• Completion of an internal review of every business unit’s potential to drive value;
• Ongoing disposals: Spectro, a supplier of oil and fuel analysis instrumentation based in Massachusetts, and the UK fuel and lubricants business, generating total net proceeds of £11.2m.
CHIEF EXECUTIvE oFFICER’S STATEMENT
wE’vE bUiLt a strOng fOUnDatiOn On which tO grOw
Leo Quinn, Chief Executive Officer
Self-help programme achieved• Group margin uplift driven by UK Services
and Global Products;
• US Services restructuring completed;
• Continuing strong cash generation reduces net debt to £122.2m; gearing ratio† 0.5x;
• Early repayment of US$177m private placement debt leading to accelerated interest of £27m;
• Pension deficit reduced to £31.5m (31 March 2011: £124.6m) following the change to CPI as the inflation index and £40m cash injection;
• MOD agreement to modernise Special Shareholder rights.
Next phase of development launched• First phase has identified strong core,
new businesses and value opportunities;
• Segmented portfolio will be actively managed to deliver rising sustainable earnings;
• Organic-Plus approach: investing in organic growth plus partnerships, alliances and selective acquisitions.
“ The Group is now managed as a strong defensible core, well-positioned for growth once markets stabilise, with a number of further potentially scalable businesses.”
† The gearing ratio is net debt to adjusted EBITDA and the definition is in the glossary on page 107.
4 QinetiQ Group plc Annual Report and Accounts 2012

Business review Corporate governance Financial statements
2. Cultural transformationThe goal of building a more competitive, customer-focused culture began with a leaning out of processes and a wide-ranging upgrade in leadership to ensure every business has clear end-to-end accountability. At the same time, measures to engage employees directly in raising productivity and customer satisfaction were underpinned by the My Contribution programme and widespread commercial training. These changes were implemented in the UK during the first 12 months of the self-help programme and removed £50m from the cost base. Similar steps followed in the US during the past 12 months, when US Services was integrated, reducing indirect costs by US$25m.
Customer satisfaction – a key goal of the transformation programme – continues to rise strongly in both the UK and the US. QinetiQ’s satisfaction ranking with the UK MOD improved from 17th to 3rd position overall, and in the US, NASA performance scores ran at well over 90% throughout the year on both new and established contracts.
Specific progress during the year included:
• An 8 percentage point rise in competed win rates in the UK, and the creation of a centralised proposal function in US Services, increasing the number and quality of bids;
what have been the highlights of the year?Seeing the first real signs of QinetiQ’s success in transforming its UK business was very satisfying. Our UK operations started their change programme earlier than those in the US, so it’s no surprise that they are showing signs of recovery sooner, but the US restructuring is now complete and it’s good to see a strong team shaping up under the new President of US Services. Both our UK and US businesses are seeing improved levels of customer satisfaction, which has to be the single most important proof.
what does focus mean in a QinetiQ context?It’s about understanding which parts of the company are making money, and which have been losing it. We know we have a very strong core in QinetiQ – businesses which account for around 90% of our revenue. Most of them fall within our UK and US Services divisions – where our people’s technological know-how helps create deep customer relationships. The profits and cash flows of these businesses are relatively stable: the challenge is that many of these businesses operate in the defence market and, at the moment, that’s facing severe budgetary pressures. In those circumstances our first task is to retain our market share, and then to use our strength to grow further.
where are you on QinetiQ’s cultural transformation journey?We now have an organisation that enables our managers to do just that – manage. We’ve re-organised QinetiQ into distinct separate businesses, each of which represents one of our key areas of capability. These businesses are led by the next generation of QinetiQ leaders. They’re totally accountable for their own revenue, profitability, cash and customer relationships. They can both reward excellent performance and take action. We also have My Contribution, which empowers all our employees to come up with ideas to drive productivity, either by increasing sales or reducing costs. So we have begun to transform the culture; but in my experience, it is an ongoing journey.
Q&A with Leo Quinn
• The My Contribution productivity programme completed its second year, with more than 9,000 proposed projects; these included US and global initiatives, such as a Group-wide IT procurement deal with potential benefits of £1.5m; and
• The creation of an elected Employee Engagement Group (EEG) to give all UK employees a voice in the Company.
In March 2012, the MOD recognised QinetiQ’s progress when it agreed to change its Special Shareholder rights, so that the Group can operate more competitively and commercially. These changes, which are subject to shareholder approval at the Group’s AGM, will help modernise QinetiQ through the removal of the MOD’s right to veto any transaction or activity and the introduction of a less onerous compliance system. The material shareholder thresholds are unchanged.
“ Building on the detailed understanding acquired in phase one, the Group will manage its portfolio actively by investing in organic growth supplemented, where appropriate, by partnerships, alliances and selective acquisitions.”
“ Customer satisfaction – a key goal of the transformation programme – continues to rise strongly in both the UK and the US.”
QinetiQ Group plc Annual Report and Accounts 2012 5

3. Strengthening the balance sheetBy focusing on cash generation throughout the business lifecycle, working capital has been reduced by more than £200m since 31 March 2009. Net debt has been driven down by more than £400m, from £537.9m to £122.2m, and the gearing ratio has fallen from 2.5x to 0.5x. This provides a robust foundation for the future and enables selective investment in medium-term growth opportunities.
Specific progress during the year included:
• A package of measures to stabilise the UK defined benefit pension scheme, including the selection of CPI as the inflation index which reduced its deficit by £141.4m. The year end IAS 19 pre-tax deficit fell to £31.5m (30 September 2011: £228.1m; 31 March 2011: £124.6m) as a result of this change and a £40m cash injection;
• An agreement with the MOD, which discharges the UK Government from its accumulated liabilities for rationalisation costs incurred in previous years, the net result of which was a £65m, one-off payment to QinetiQ, received after the year end. This settles liabilities which would otherwise be expected to be recovered through revenue rates over approximately ten years; and
• The election to make early repayment of US$177m private placement debt which will complete after the year end.
Second phase: organic-Plus The wide-ranging changes of the past 24 months have created a leaner, fitter Group which is now focused on driving value by growing its sustainable earnings.
The next phase will continue the disciplines established during the self-help programme, including performance improvement, balance sheet strength and high cash conversion. Customer satisfaction and the excellent engagement of employees will be key internal metrics.
Building on the detailed understanding acquired in phase one, the Group will manage its portfolio actively by investing in organic growth supplemented, where appropriate, by partnerships, alliances and selective acquisitions to deliver the strategy and diversify risk. This will enable mature core businesses to win market share and explore adjacent markets, while nurturing a select number of newer capabilities to determine whether their business models are scalable. Each opportunity that emerges will be managed through a disciplined process to identify and expand those which can generate sustainable returns, or to target the best point at which to crystallise their value. Through an Organic-Plus approach, QinetiQ will build out its core as a leading technology-based solutions Group, and will apply the innovation and capabilities of its people in targeted sectors.
The strength of the balance sheet will be applied to investment choices, with an increased capacity for capital expenditure and internal research and development for the 2013 financial year and a rigorous process for prioritising resources and monitoring returns.
Leo Quinn Chief Executive officer 24 May 2012
CHIEF EXECUTIvE oFFICER’S STATEMENT CoNTINUED
where will growth come in the medium to long term?Short term growth is impacted by the market in which we operate and our markets are unsettled. Given the deep expertise of our people and our good track record of delivery, however, QinetiQ’s core businesses should be able to gain market share when defence budgets stabilise. Over the medium term, we’ll manage the rest of the Group as a ‘value pipeline’ – in other words, a range of new offerings in various stages of development or business readiness. Some of them will eventually graduate to expand our core; others may not prove able to find economically viable business models. QinetiQ is not short of innovation: for us, the challenge is to find ways to turn ‘raw’ know-how and technology into commercial businesses. Sometimes the best way to do this is to exploit it ourselves; sometimes we elect to sell the patent; sometimes we retain ownership of the IP and software but outsource manufacture, sales and distribution in order to reduce our risk. The key is to have a disciplined process that enables you to work out the best route to market for each idea, or else the best point in its development to crystallise its value.
what are the major challenges that QinetiQ faces?Our challenge is to continue to evolve our business offerings to compete successfully in the changing defence markets of the UK and US, while also diversifying our portfolio by finding new sectors in which to apply our innovation and expertise. I believe, by using a rigorous combination of investment, partnerships and, where appropriate, some selective acquisitions, we can build out QinetiQ’s core into a leading technology-based solutions Group.
Q&A with Leo Quinn “ Through an organic-Plus approach, QinetiQ will build out its core into a leading technology-based solutions Group, and will apply the innovation and capabilities of its people in targeted sectors.”
6 QinetiQ Group plc Annual Report and Accounts 2012

Business review Corporate governance Financial statements
oUR BUSINESS MoDEL
Organic-PLUsThrough an Organic-Plus approach, QinetiQ will build out its core into a leading technology-based solutions Group, applying the innovation and capabilities of its people across a number of market sectors.
This will enable mature core businesses to win market share and explore adjacent markets, while nurturing a small number of newer capabilities to determine whether their business models are
sufficiently robust to deliver significant growth. Each opportunity which emerges will be managed through a disciplined process to identify and expand those which can generate sustainable returns within QinetiQ, and crystallise early value from those which cannot. The Group will target the best point at which to crystallise value from its technologies – through selling patents or retaining IP, but outsourcing manufacture to reduce overheads and risk.
Revenue breakdown
Core c90%
Explore c8%
Test for Value c2%
Maximise the CoreUK ServicesUS Services
Global Products (partial):– TALON®– Q-Nets®
– LAST™Armor
Scale the ExploreCyveillance®
International rangesOptaSense®
Training & simulationProtective monitoringRobotic controller kits
UAS Services
Maintain the RigourALARM
Energy from wasteE-X-Drive®
GAJT™
MEWSCueSim Space
UAS sensors
CoREc90% of revenue Maximise the CoreApproximately 90% of QinetiQ’s revenue is generated by proven businesses that have sustainable competitive advantage. The businesses are focused on relatively resilient sectors in which the deep domain expertise of QinetiQ’s people is used to provide trusted independent advice and solutions for customers’ critical operations. These are the Group’s core capabilities, mostly comprising UK and US Services, and operating largely in the aerospace, defence and security markets. They exhibit relatively low risk characteristics with low capital requirements and strong, predictable cash flows. Much of the revenue is derived from longer term contracts, with known dates for renewal and re-tender. QinetiQ’s core businesses retain and win market share by applying their detailed understanding of customer domains and their technical expertise to provide support for customers’ on-going and developing needs. Core businesses will receive investment on a sustainable basis as these opportunities emerge and where existing expertise can be deployed in adjacent sectors and geographic markets, from the proven platform of UK or US capability. QinetiQ’s less mature businesses will be managed through a ‘value pipeline’ with a range of new capabilities at various stages of business readiness.
EXPLoRE c8% of revenueScale the Explore Approximately 8% of QinetiQ’s revenue comes from fully commercial businesses in its Explore category. These are businesses that have a proven technology and customers, but have yet to prove that they can achieve significant scale. Examples include Cyveillance®, which delivers cyber intelligence solutions principally for US Fortune 500 customers, the OptaSense® fibre-optic sensing business, and Training & Simulation Services, which is using COTS technology to meet customer requirements to reduce the cost of training. The Group will selectively invest in these businesses to create a broader base of significant and, therefore, core businesses for the future.
TEST FoR vALUE c2% of revenueMaintain the Rigour Approximately 2% of QinetiQ’s revenue is in the Test for Value category. These are businesses with proven technologies but that have yet to prove commercial viability. In some cases, the technology is being developed for a customer-funded programme, such as the E-X-Drive® hybrid electric drive transmission which is being developed as part of a consortium for the technology development phase of the US Army’s Ground Combat Vehicle Program. In other cases, the intellectual property is licensed out to reduce implementation and sales risks, with revenue dependent on third party sales channels. Examples include the GAJT™ GPS anti-jammer via NovAtel and MEWS via L-3 TRL. Over the medium term, these early-stage technologies will be managed rigorously to resolution whether through investment, divestment, closure or trade-through until project completion.
QinetiQ Group plc Annual Report and Accounts 2012 7

trUstEDtO DELivEr
03
01 0201 Broadening our international capability
reach, we manage and operate the Flight Physiological Centre (FPC) in Linköping, Sweden on behalf of The Swedish Defence Materiel Administration (FMV). A self-contained centre that provides world-class training, research, test and evaluation facilities, comprises a human centrifuge with a free-flight-capable active gondola used for high-G training, a hypobaric chamber for low-pressure testing and hypoxia training, a hyperbaric chamber for high-pressure testing, and a rescue and test pool for parachute drill and survival equipment training.
02 QinetiQ, working in close partnership with the European Space Agency (ESA) and industrial partners, achieved the world’s first successful reception of the encrypted Galileo Public Regulated Service (PRS) signal from the first Galileo satellites, launched in October 2011.
We supplied the crypto security solution for the PRS receiver, as well as expert security advice and Galileo accreditation technical support to the EU and ESA.
03 We offer a full hosting and protective monitoring service for those sensitive information and communication systems where security and availability are critical. Our long record of hosting and operating services is built on our network of resilient sites in geographically disparate locations. We are completely independent of industry suppliers, and deploy the most appropriate technologies for the requirement.
QinetiQ’s thought leadership in the training and simulation sector is founded on a decades-long heritage of world-class research with the UK’s MOD, combined with a record of delivering high-fidelity and cost-effective military training.
Most recently, we have extended our expertise through pioneering the use of everyday gaming technologies to create more affordable and flexible synthetic training environments.
By consolidating our core UK defence activities with a number of new and existing contracts, such as the Distributed Synthetic Air Land Training system at RAF Waddington, into a single team, we have brought together a strength of capability second to none.
Our teams in the military arena are collaborating globally, and a joint UK and North American team won a place on the US Training Systems Contract III, that over three years, gives access to a group of multiple award indefinite delivery/ indefinite quantity (IDIQ) contracts. This is an opportunity to demonstrate our unique ‘Commercial off-the-shelf to capability’
approach to the design and delivery of open architecture training systems, while also bidding into a US$2.2bn addressable training and simulation market.
In the commercial sector, we are deploying highly developed simulation systems, combined with a unique approach to constructing focused and innovative training support. We are, for example, developing safety-critical training for several major Australian coal mining organisations – giving us an entry into the energy and resources market – and have delivered crisis training for a major UK transport hub.
Our training team specialises in combining ‘People who know how’ with the latest training innovation, technology and processes to deliver training systems that others cannot. As a platform independent, technology integrator, customers can trust us to work with them in an intimate partnership, in which our sole focus is to develop transformational training for their specific needs.
UK SERvICES
8 QinetiQ Group plc Annual Report and Accounts 2012

Business review Corporate governance Financial statements
“As the leading independenttraining systems integrator,we’re committed to taking whatwe do in any domain, and whatwe learn anywhere in the world,and projecting it globally.”Stephen Gumbrill, Software Engineer, Training and Simulation Services
QinetiQ Group plc Annual Report and Accounts 2012 9

cOmmittEDUS SERvICES
tO thE missiOn
“we’re effectively buildingthe Kennedy Space Port of the future to cater for NASA’s next generation of deep space programmes, as well as new commercial space providers.”Joe Broadwater, Executive Vice President,Aerospace Operations and Systems
10 QinetiQ Group plc Annual Report and Accounts 2012
Business review Corporate governance Financial statements
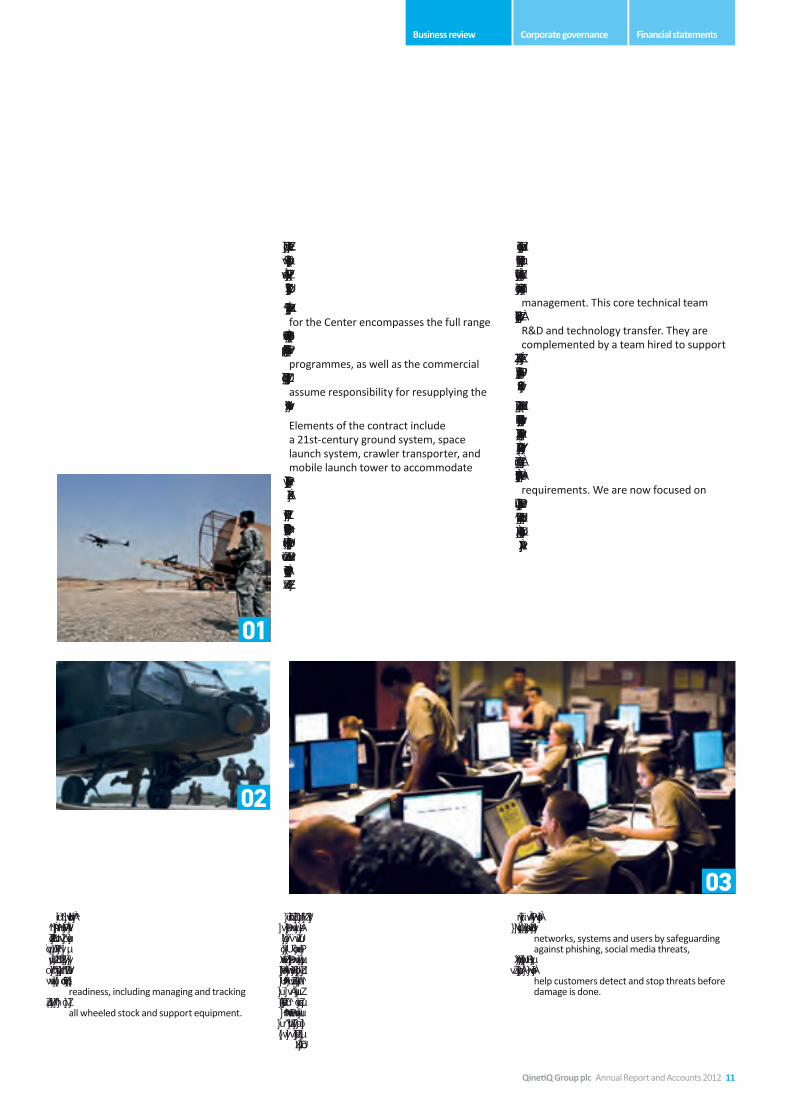
01 US Services Unmanned Aircraft Systems-Initiative Program (UAS-I) provides UAS Commanders with near-real time, highly accurate readiness reporting. It is currently in operation with US Army Shadow, Hunter and ERMP Sky Warrior units. UAS-I is capable of supporting all aspects of maintenance and readiness, including managing and tracking other critical assets to UAS operations, such as all wheeled stock and support equipment.
02 QinetiQ has worked closely with the US Army to develop a maintenance and logistics enterprise system, enhanced by an exceptional software program and complex database, for total unit maintenance and logistics management. This capability, known as Unit Level Logistics System-Aviation (Enhanced), or ULLS-A(E), is the first customer server enterprise system to use Relational Database System technology for Army maintenance management. ULLS-A(E) is widely deployed in the United States Army to support the logistics and readiness needs of 4,000 aircraft.
03 Cyveillance® brings advanced cyber business-intelligence solutions to customers; it protects networks, systems and users by safeguarding against phishing, social media threats, reputation damage and information loss. Cyveillance® offers proactive solutions that can help customers detect and stop threats before damage is done.
01
03
02
When NASA required a partner to help it transform Florida’s Kennedy Space Center for the next generation of space travel and exploration, it chose QinetiQ.
Our Engineering Services Contract (ESC) for the Center encompasses the full range of life-cycle design, development, testing and integration to support all NASA’s future programmes, as well as the commercial space sector which, it is anticipated, will assume responsibility for resupplying the International Space Station.
Elements of the contract include a 21st-century ground system, space launch system, crawler transporter, and mobile launch tower to accommodate different configurations of boosters and crew vehicles.
We were chosen by NASA – against stiff competition – for our engineering discipline, rigour and effective programme management. We already had an excellent record of delivering on commitments at other NASA space and research centres.
The complement of exceptionally qualified personnel that QinetiQ brings to the contract, covers every discipline, from technical management to financial management. This core technical team serve as the principal experts in technology R&D and technology transfer. They are complemented by a team hired to support the work driven by the task orders. As the contract progresses, it will continue to expand in scope and staffing.
The ESC’s scale, complexity and emphasis on transformational technologies, make it an outstanding example of a showcase for QinetiQ as an engineering services provider that is able to deliver cost-effectively against a backdrop of evolving requirements. We are now focused on translating this capability to other markets in the US, principally the United States Air Force, commercial space providers and energy providers.
QinetiQ Group plc Annual Report and Accounts 2012 11

fOrwarD-LOOKinginnOvativE anD
02
01 QinetiQ is teamed with BAE Systems for one of the GCV programme’s two Technology Development prime contracts. If the BAE Systems vehicle is successful, QinetiQ will supply the transmissions for the production phase.
02 Protection against navigation jamming in the fog of war is vital. QinetiQ and NovAtel have produced the first single-unit GPS anti-jam antenna designed specifically for military land vehicles. GAJT™ (pronounced ‘Gadget’) protects the satellite signals required to compute precise position and timing. At just under 290mm in diameter, GAJT provides anti-jam performance comparable with much larger systems, but at a significantly lower cost.
03 Our Q-Net® system takes an innovative approach to protecting a wide range of tactical and lightly armoured vehicles from attack by rocket-propelled grenades (RPGs). Based on nets rather than traditional armour, it is extremely lightweight, versatile, low-cost and effective. Q-Net’s performance matches or exceeds competitor bar armour solutions, and provides vehicles with RPG defeat protection from all angles, including overhead. 03
OptaSense® is the world leader in distributed acoustic sensing, a technology that transforms up to 50km of standard telecoms fibre into a listening device with thousands of sensors along its length.
Our technology is reshaping several global industries by providing high-value information that is otherwise unavailable.
OptaSense’s advantage lies in our unique ability to process immediately and make sense of gigabits of data generated each second by this new fibre-sensing technology.
Drawing on QinetiQ’s 50 years’ experience in advanced sonar processing techniques, OptaSense uses advanced acoustic fingerprint recognition and behavioural analysis to provide customers with decision-ready information. This enables preventive or corrective operational or security action to be taken in real-time.
In the oil and gas sector, distributed acoustic sensing is revolutionising oil well management. A single array incorporated into a well provides an improved image of the sub-surface without the need for intervention – improving safety, increasing recovery and reducing extraction costs.
Demand for OptaSense oil field services is primarily driven by the unconventional shale oil and gas developments, particularly in the US, where OptaSense is breaking new ground by providing
real-time hydraulic fracture monitoring services for Shell on a worldwide basis.
Using the same product platform, OptaSense monitors and protects linear assets: it converts already-installed telecoms assets into a sensor array that predicts and defeats intrusions on thousands of kilometres of pipeline. OptaSense’s infrastructure security and monitoring systems are driven by the global need to address national concerns over energy security, such as protecting the Cairn India Mangala Development Pipeline, which provides access to 75% of India’s refinery capacity. This recently completed project analyses nearly 2.5 gigabits per second from more than 63,000 acoustic sensors along 700km of pipeline across India. This makes it one of the largest single sensory systems on the planet, and there are further projects of double the size in progress.
OptaSense’s Technical and Data Services Division has an equally promising future in developing new market applications, such as rail monitoring, or finding additional value from the data collected from infrastructure monitoring. Its work on several US railroads, for example, has generated a wealth of information about earthquakes that could help provide early warnings of tremors in the region. Applications such as this will take OptaSense towards realising its ambition to be ‘The Earth’s Nervous System™’.
01
GLoBAL PRoDUCTS
12 QinetiQ Group plc Annual Report and Accounts 2012

Business review Corporate governance Financial statements
“ optaSense is an international company with a presence in the UK, US, Canada, the Middle East and, most recently, Brazil, China and Russia.”James Boultbee, Logistics Engineer, OptaSense
QinetiQ Group plc Annual Report and Accounts 2012 13

UK Services
oPERATIoNS ovERvIEw
DELivEring tEchnicaL aDvicE, sErvicE anD sOLUtiOns
UK Services delivered an encouraging profit and margin performance, despite revenue being down 7% on an organic basis, principally as a result of pressure on customer budgets. Approximately £19m of the organic reduction was due to revenue in the prior year from the DTR Early Works contract which has completed.
Underlying operating profit* grew 33% to £63.0m (2011: £47.4m)† and the underlying margin* increased to 10.3% (2011: 7.3%)†, as the division took action to address its cost base last year ahead of the expected market headwinds. These results show the impact of the 24-month self-help programme, with improved customer satisfaction and project management.
At the beginning of the year, QinetiQ’s Force Protection business, which had £41m of revenue during the 2011 financial year, was transferred from Global Products to UK Services to align with customer requirements. In August 2011, the UK fuel and lubricants business was sold as part of ongoing portfolio reviews.
The majority of UK Services’ revenue is derived from long-term managed services contracts, including the Long-Term Partnering Agreement (LTPA), under which £180m of savings have been delivered to the customer to date. In December 2011, the division won a four-year, £38m contract in the maritime domain which broadens the Naval Combat Systems Integration Support Services it provides to the MOD.
UK Services continues to deliver value to its customers by de-risking the deployment of technology for core defence programmes. In June 2011, it won a £22m multi-year contract to provide test and evaluation services for the A400M aircraft as it comes into service in 2014. This contract delivers an end-to-end evaluation capability, including flight trials, safety advice,
UK Services delivered an encouraging profit and margin performance.
£450.3m(2011: £420.4m)†
orders
£610.1m(2011: £652.7m)†
Revenue
£63.0m(2011: £47.4m)†
Underlying operating profit*
10.3%(2011: 7.3%)†
Underlying operating margin*
airworthiness and acquisition support. The division began operating ranges in Scandinavia during the year and recently delivered range control and safety systems for the Australian Woomera range. Its pipeline includes opportunities to expand the provision of test and evaluation services to other international customers.
R&D activity increased over the year, particularly for capabilities in which QinetiQ has a leading market position. These include C4ISR, where UK Services manages key enabling contracts on behalf of the MOD, and cryptography, where the business successfully delivered the world’s first reception of an encrypted signal from a Galileo satellite working for the European Space Agency. Reductions in Government departmental staffing levels are also providing outsourcing opportunities to QinetiQ as the UK’s main supplier of impartial, client-side programme and technical advice.
The newly created Training and Simulation Services (TSS) business is using COTS technology to meet customer requirements to reduce the cost of training. Its platform independent and technology-agnostic approach enables the business to integrate a broad range of simulation technologies to deliver operational and mission training. By collaborating with QinetiQ’s US Services division, TSS was awarded a position on the approved companies list for a US$2bn IDIQ (indefinite delivery/indefinite quantity) contract under which the US Naval Air Warfare Center is able to procure training and simulation services. This gives the business access to the US market as a key training supplier to the US Navy.
* Definitions of underlying measures of performance are in the glossary on page 107. † Restated to reflect the transfer of businesses from Global Products to UK Services and US Services at the beginning of the 2012 financial year.
14 QinetiQ Group plc Annual Report and Accounts 2012

Business review Corporate governance Financial statements
US Services
The leadership of US Services was strengthened by the appointment of a single experienced President.
Revenue was down in the year by 7% on an organic basis at constant currency, reflecting continued uncertainties in the federal services market. This resulted in the delay of new and incremental orders and the cancellation of some re-competes, with shorter term extensions being awarded in their place. The organic revenue variance excluded a £17m reduction following the divestment of the S&IS business in the prior year but included:
• A reduction of £33m due to completed programmes such as the Iraqi Flight Training School;
• £29m revenue impact from Government insourcing which has now slowed; and
• A £16m reduction resulting from the switching of some work to small business set-aside contracts.
Underlying operating profit* was £32.1m (2011: £45.9m)† and the underlying margin* was 6.0% (2011: 7.6%)† as a result of the volume impact on revenue, higher investment in business development, and a change in revenue mix as lower margin NASA work replaced higher margin sales.
The US Services division was the focus of the second year of the Group’s 24-month self-help programme. To position for future growth, while responding to market conditions, US Services executed a major restructuring programme reducing indirect costs by US$25m. This programme focused on eliminating duplicate overhead costs and management layers and has improved the ability of the division to compete effectively. The leadership of US Services was strengthened by the appointment of a single experienced President and the upgrading of the majority of his direct reports. Key new hires have included leaders for the newly centralised business development, pricing strategy and proposal functions in order to drive sales growth.
US Services was fully integrated during the first half of the year and reorganised into four business units that report direct to the President. During the year, the Maritime and Transportation Services business, which
£530.3m(2011: £580.9m)†
orders
£534.5m(2011: £607.3m)†
Revenue
£32.1m(2011: £45.9m)†
Underlying operating profit*
6.0%(2011: 7.6%)†
Underlying operating margin*
had FY11 revenue of £19m, was transferred from Global Products to US Services to align with customer requirements.
Despite current uncertainties, the US Government contracting market remains large and relatively resilient, and the division had 109 proposals pending decision by federal customers at year end, with a total contract value of approximately US$1.3bn.
Following commencement of work in March 2011, revenue streams ramped up on the NASA ESC contract to provide engineering support services at the Kennedy Space Center in Florida. During the year, the team won the re-compete for the US$40m Enhanced Launch Vehicle Imaging System (ELVIS) contract, and earned a 100% customer satisfaction rating in both contract support overall and safety/mission assurance. Future opportunities exist in enhancing NASA’s capabilities for deep space exploration at Kennedy, growing QinetiQ’s presence at other NASA sites and extending core competencies to US Air Force space programmes. The award of a US$36.5m IDIQ contract to provide expert scientific and analytical support at the Patrick Air Force Base in Florida demonstrates the potential of this approach.
US Services has a broad customer base and is positioned in segments expected to be relatively resilient to defence cuts. The year’s largest award was a five-year, US$85m classified contract for the US Government. Other significant contract awards included a contract to provide key components of the IT platform for the Public Buildings Service, with a total value of US$41m if all options are exercised, and a US$39m US Army IDIQ contract for its architecture characterisation programme. The division continues to invest in its cyber security capability. At the end of the year, it was selected by the Department of Transportation’s Volpe Center to provide cyber security services to protect US transportation control systems and critical national infrastructure.
QinetiQ Group plc Annual Report and Accounts 2012 15
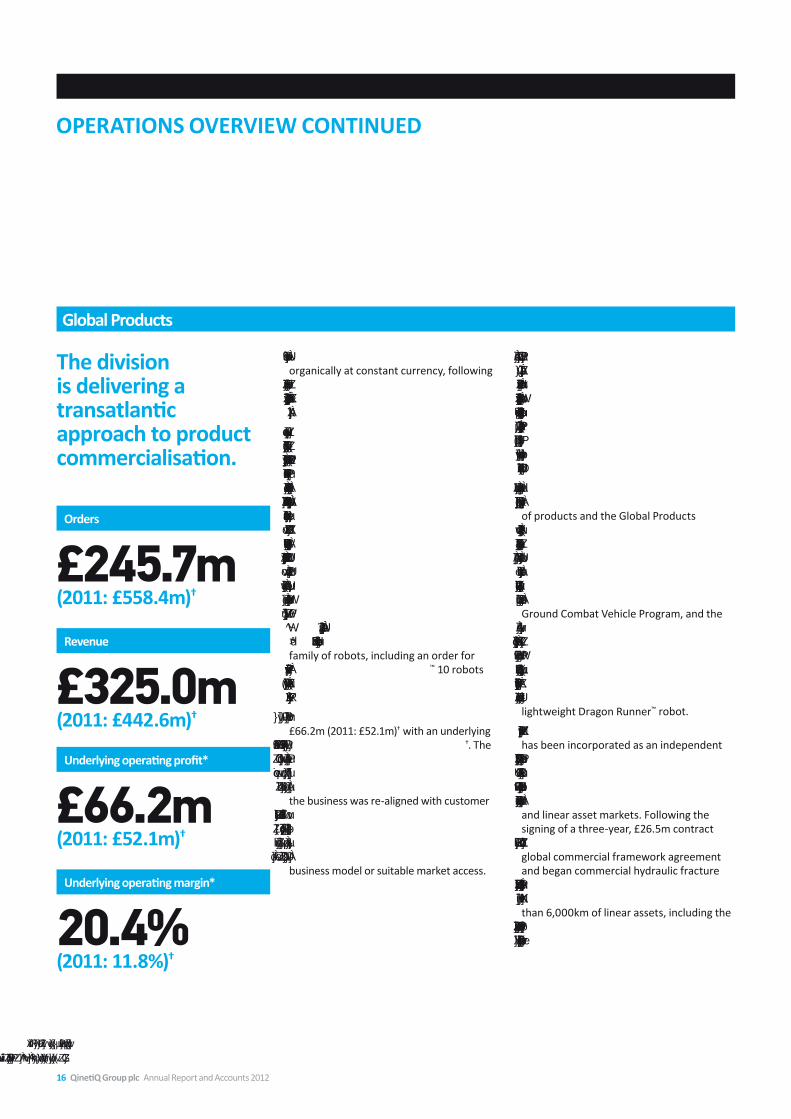
As expected, revenue declined by 24% organically at constant currency, following the exceptionally strong demand for the Q-Net® vehicle survivability product in the previous year.
Despite the announcement of a timetable for the drawdown of US troops from Afghanistan, the Global Products division met its target of generating US$100m of revenue from the Q-Net® vehicle survivability product (2011: US$288m) with products and spares contributing cUS$50m each. To date, Q-Net® has been selected to provide protection on the MRAP-Lite, Stryker, RG31 and MaxxPro vehicles in the US, against such alternatives as bar and slat armour, as well as for vehicles in France and Poland. Significant revenue was also generated by the Precision Air Drop System (PADS™), survivability products such as LAST™ Armor spall liners, and the TALON® family of robots, including an order for over 100 new Dragon Runner™ 10 robots from the US Government’s Joint IED Defeat Organisation (JIEDDO).
Underlying operating profit* increased to £66.2m (2011: £52.1m)† with an underlying profit margin* of 20.4% (2011: 11.8%)†. The margin improvement principally reflects the mix of US product sales and substantially improved performance in the UK where the business was re-aligned with customer demand late 2010/11. The technology portfolio is now rigorously tested for the best routes to value creation with loss-makers divested, or closed, where they lack a viable business model or suitable market access.
The division is delivering a transatlantic approach to product commercialisation.
£245.7m(2011: £558.4m)†
orders
£325.0m(2011: £442.6m)†
Revenue
£66.2m(2011: £52.1m)†
Underlying operating profit*
20.4%(2011: 11.8%)†
Underlying operating margin*
During the year, businesses that deliver technical services were transferred to UK and US Services, enabling the Global Products division to focus on the commercialisation of technology. In July, as part of on-going portfolio review, the Group agreed to dispose of Spectro, a supplier of oil and fuel analysis instrumentation based in Massachusetts, for US$20m.
To even out its lumpy revenue profile, the division continues to increase its portfolio of products and the Global Products framework is delivering a transatlantic approach to product commercialisation. For example, E-X-Drive®, a hybrid electric drive system developed in the UK, was selected as part of a consortium for the technology development phase of the US Army’s Ground Combat Vehicle Program, and the first transmission system was delivered at the end of the year. The division’s Global Integrated Project Team is also targeting future opportunities for US sales of ALARM, a radar that provides warning of in-coming rocket fire, and further UK sales of the lightweight Dragon Runner™ robot.
The OptaSense® fibre-optic sensing business has been incorporated as an independent global business, with new offices in North America and the Middle East. OptaSense®, a platform technology, is already generating revenue in the oil and gas down-hole and linear asset markets. Following the signing of a three-year, £26.5m contract with Shell last year, the business agreed a global commercial framework agreement and began commercial hydraulic fracture monitoring services on shale wells in North America. OptaSense® now protects more than 6,000km of linear assets, including the world’s single largest pipeline project, which connects to 75% of India’s refinery capacity.
Global Products
oPERATIoNS ovERvIEw CoNTINUED
* Definitions of underlying measures of performance are in the glossary on page 107. † Restated to reflect the transfer of businesses from Global Products to UK Services and US Services at the beginning of the 2012 financial year.
16 QinetiQ Group plc Annual Report and Accounts 2012

Business review Corporate governance Financial statements
David Mellors, Chief Financial Officer
“ Another year of excellent cash flow has enabled us to significantly strengthen the balance sheet.”
CHIEF FINANCIAL oFFICER’S REvIEw
wE nOw havE a significantLy strOngEr baLancE shEEt
Group results overview
Revenue2012
£m20111
£m
UK Services 610.1 652.7US Services 534.5 607.3Global Products 325.0 442.6Total 1,469.6 1,702.6
1 Restated to reflect the transfer of the Maritime and Transportation services businesses from Global Products to US Services and the Force Protection business from Global Products to UK Services at the beginning of the 2012 financial year.
Group revenue was £1,469.6m (2011: £1,702.6m), down 11% on an organic basis at constant currency, excluding a £25.8m reduction in revenue for divested businesses. This reflects the uncertain trading environment and contract delays in the US and UK defence markets, and the exceptionally strong demand for the Q-Net® vehicle survivability product last year, which resulted in an expected 24% organic decline in Global Products revenue.
UK Services revenue was down 7% on an organic basis at constant currency principally as a result of pressure on customer budgets. Approximately £19m
of the organic reduction was as a result of the completion in the previous year of the DTR Early Works contract.
US Services revenue was also down in the year by 7% on an organic basis at constant currency, reflecting continued uncertainties in the federal services market. This resulted in new and incremental orders being delayed and the cancellation of some re-competes with shorter-term extensions awarded in their place. Revenue was also reduced as a result of completed programmes, such as the Iraqi Flight Training School, the impact of government insourcing, though the impact has now
slowed, and the switching of some work to small business set-aside contracts. The organic revenue variance excluded a £17m reduction following the divestment of the S&IS business.
QinetiQ Group plc Annual Report and Accounts 2012 17

Group summary
2012 2011
Revenue (£m) 1,469.6 1,702.6Organic change at constant currency (11)% 5%Underlying operating profit* (£m) 161.3 145.4Underlying operating margin* 11.0% 8.5%Underlying profit before tax* (£m) 118.3 114.6Net finance expense (£m) 43.0 30.8Underlying effective tax rate* 19.9% 19.0%Basic earnings per share 39.6p 0.8pUnderlying earnings per share* 14.6p 14.2pDividend per share 2.90p 1.60pUnderlying net cash from operations (post capex)* (£m) 235.4 265.8Underlying operating cash conversion* 146% 183%Net debt (£m) 122.2 260.9Net debt: EBITDA† 0.5x 1.4xAverage US$/£ exchange rate 1.60 1.56Closing US$/£ exchange rate 1.60 1.60
Underlying operating profit*
2012 £m
20111
£m
UK Services 63.0 47.4US Services 32.1 45.9Global Products 66.2 52.1Total 161.3 145.4Underlying operating margin 11.0% 8.5%
1 Restated to reflect the transfer of the Maritime and Transportation services businesses from Global Products to US Services and the Force Protection business from Global Products to UK Services at the beginning of the 2012 financial year.
CHIEF FINANCIAL oFFICER’S REvIEw CoNTINUED
* Definitions of underlying measures of performance are in the glossary on page 107.† The gearing ratio is net debt to adjusted EBITDA and the definition is in the glossary on page 107.
18 QinetiQ Group plc Annual Report and Accounts 2012

Business review Corporate governance Financial statements
Group underlying operating profit* rose 11% to £161.3m (2011: £145.4m) and the underlying operating margin* increased to 11.0% (2011: 8.5%) as a result of last year’s early cost reduction in the UK businesses and improved efficiencies and mix in Global Products. These improvements were partially offset by lower margins in US Services, where the restructuring is now complete, reducing indirect costs by US$25m.
UK Services underlying operating profit* grew 33% to £63.0m (2011: £47.4m)1 and the underlying margin* increased to 10.3% (2011: 7.3%)1, as the division took action to address its cost base last year ahead of the expected market headwinds. These results show the impact of the 24-month self-help programme, with improved customer satisfaction and project management.
US Services underlying operating profit* was £32.1m (2011: £45.9m)1 and the underlying margin* was 6.0% (2011: 7.6%)1, as a result of the volume impact on revenue, higher
investment in business development, and a change in revenue mix as lower margin NASA work replaced higher margin sales.
In Global Products, the underlying operating profit* increased to £66.2m (2011: £52.1m)1 with an underlying profit margin* of 20.4% (2011: 11.8%)1. The margin improvement primarily reflects the mix of US product sales and substantially improved performance in the UK, where the business was re-aligned with customer demand late 2010/11. The technology portfolio is now rigorously tested for the best routes to value creation, with loss-makers divested, or closed, where they lack a viable business model or suitable market access.
Finance costsNet finance costs increased to £43.0m (2011: £30.8m). Interest on borrowings increased as a result of accelerated interest costs of £27.4m following the election to make early repayment of US$177m of private placement debt. The previous year
included £8.8m of accelerated interest costs relating to US$135m of private placement debt. A further significant component of this increase was the reduction in the net pension finance credit to £6.4m (2011: £9.1m) as a result of the change in the mix of the pension assets (a lower proportion of a higher return equities, a higher proportion of lower return bonds) and a higher level of gross pension liabilities.
TaxationThe Group’s underlying effective tax rate* was 19.9% (2011: 19.0%). The rate is principally dependent on the geographic split of profits between the UK and US businesses and the availability of Research and Development tax relief.
Acquisition amortisation and specific non-recurring items*The performance of the Group, after allowing for non-recurring events and amortisation of acquired intangible assets, is shown below.
2012 £m
2011 £m
Underlying profit* for the year attributable to equity shareholders of the parent company 94.8 92.8 Net restructuring recoveries/(charges) 69.4 (28.6)Contingent payments on acquisition treated as remuneration – (6.1)Net gain/(loss) in respect of previously capitalised DTR-programme bid costs 4.1 (23.8)Impairment of property, plant and equipment (1.9) (5.9)Amortisation of intangible assets arising from acquisitions (20.3) (26.3)Pension past service gain 141.4 – Gain on business combinations and divestments and disposals of investments 11.6 2.7 Gain on disposal of property 9.0 – Tax impact of items above (50.2) 0.2 Profit for the year attributable to equity shareholders of the parent company 257.9 5.0
1 Restated to reflect the transfer of the Maritime and Transportation services businesses from Global Products to US Services and the Force Protection business from Global Products to UK Services at the beginning of the 2012 financial year.
MOD DoD DHS NASA Commercial Defence
2011 £1,702.6m2012 £1,469.6m
30%
35%
5%
8%
18%31%
29%
9%
7%
19%
5%
Civil/Other Government Agencies
4%
Revenue by customer
QinetiQ Group plc Annual Report and Accounts 2012 19

The resulting statutory profit after tax was £257.9m (2011: £5.0m).
The net restructuring recovery of £69.4m (2011: expense of £28.6m) primarily relates to the agreement with the UK MOD in March 2012 involving a payment to QinetiQ of £65m, that was received after the year end, in April 2012. The agreement involves the discharging of MOD from its accumulated liabilities for rationalisation costs incurred in previous years, together with MOD agreement to changes in its Special Shareholder rights, and certain other operational issues.
On 19 October 2010, the MOD terminated the Defence Training Rationalisation (DTR) programme for which QinetiQ was preferred bidder as a 50/50 equity partner in the Metrix joint venture. In 2011, £23.8m was written off previously capitalised bid costs, net of estimated recovery from MOD. Negotiations with MOD concluded in 2012, resulting in a net gain of £4.1m.
The pension past service gain of £141.4m follows the agreement with the Trustees, as part of a package of measures to ensure the stability of the defined benefit pension scheme, to select the Consumer Prices Index rather than the Retail Prices Index as the relevant index for the increase of pensions in payment.
An impairment charge of £1.9m (2011: £5.9m) was taken in the year against the Group’s owned properties. These properties are no longer occupied and, since no external tenant has been found, the assets are no longer generating a return.
The gain on business divestments and disposal of investments in the year comprises £8.0m in respect of divestments and £3.6m in respect of disposal of investments. Divestments include the disposal of Spectro Inc., a business within the Global Products sector, for consideration before costs of US$20.5m. Of the £3.6m gain on disposal of investments, £2.8m relates to the sale of QinetiQ’s
investment in Nomad Holdings Limited. Excess property in the UK was also disposed of during the year, realising a gain of £9.0m.
Earnings per shareUnderlying earnings per share* was 14.6p, compared with 14.2p for the year ended 31 March 2011. Basic earnings per share increased to 39.6p (2011: 0.8p).
DividendThe proposed final dividend is 2.00p per share (2011: 1.60p per share). The record date for the final dividend will be 10 August 2012. Subject to approval at the Annual General Meeting, the final dividend will be paid on 7 September 2012.
other financialsCash flowUnderlying operating cash conversion* remained very strong at 146% (2011: 183%). Underlying cash flow from operations* of £235.4m (2011: £265.8m) was driven by rigorous Group-wide processes and the engagement of employees at all levels to reduce working capital, assisted by deferred customer-controlled capital expenditure in the UK Services business. It also included a net recovery of £18.5m of costs following the cancellation of DTR and the one-off injection of £40m into the defined benefit (DB) pension scheme.
Acquisition expenditure, net of cash acquired, totalled £0.9m (2011: £15.8m) as a result of deferred consideration payments following the acquisition of Sensoptics Ltd in December 2012. Net proceeds received from the disposal of businesses totalled £11.2m (2011: £38.2m), largely from the disposal of the Spectro business within Global Products.
Net debt at 31 March 2012 was £122.2m, compared with £260.9m at 31 March 2011. This incorporates accelerated interest of £27.4m in respect of the early repayment of private placement notes and the Company’s £40m contribution into the DB pension scheme, and excludes the £65m payment from the MOD which was received after the year end. The Group’s borrowings remained comfortably within its financial covenants, with a gearing ratio† of 0.5x compared with the covenant maximum level of 3.5x, a significant improvement from 1.4x last year.
As a result of the strong cash performance during the year the Group elected to make early repayment of US$177m of private placement debt which will complete after year end. An associated accelerated interest charge of £27.4m has been reflected in net finance costs in 2012. In 2011, net finance costs included an £8.8m accelerated interest charge in respect of the early repayment of US$135m of private placement debt in May 2011.
Following early repayment of private placement debt, total committed facilities amount to £429.4m. The remaining Group debt has no maturity before 2016.
PensionsThe net pension liability under IAS 19, after deducting deferred tax, was £18.2m (2011: £92.2m). The key assumptions used in the IAS 19 valuation of the scheme are:
CHIEF FINANCIAL oFFICER’S REvIEw CoNTINUED
* Definitions of underlying measures of performance are in the glossary on page 107.† The gearing ratio is net debt to adjusted EBITDA and the definition is in the glossary on page 107.
20 QinetiQ Group plc Annual Report and Accounts 2012

Business review Corporate governance Financial statements
Assumption31 March
201231 March
2011
Discount rate 4.8% 5.6%Inflation (2012 = CPI, 2011 = RPI) 2.6% 3.6%Salary increase 3.6% 4.6%Life expectancy – male (currently aged 40) 90 90Life expectancy – female (currently aged 40) 92 91
Each assumption is selected by the Group in consultation with the Company’s actuary and takes account of industry practice amongst comparator listed companies. The sensitivity of each of the key assumptions is shown in the table below.
AssumptionChange in
assumptionIndicative effect on scheme
liabilities (before deferred tax)
Discount rate Increase/decrease by 0.1% Decrease/increase by £21.1mInflation Increase/decrease by 0.1% Increase/decrease by £22.2mSalary increase Increase/decrease by 0.1% Increase/decrease by £3.5mLife expectancy Increase by one year Increase by £19.3m
The market value of the assets at 31 March 2012 was £1,107.9m (31 March 2011: £981.1m). The increase was the result of market performance, augmented by a one-off £40m cash injection by the Company as part of a package of measures agreed with trustees to stabilise the scheme.
The present value of scheme liabilities was £1,139.4m (31 March 2011: £1,105.7m). The increase was the result of a significant reduction in the rate used to discount the gross scheme liabilities to present value due to declining bond yields. This was partially offset by the agreement to select the Consumer Price Index as a suitable index for the payment of pensions and the revaluation of benefits, which reduced the liabilities by £141.4m before tax.
Under the agreement between the trustees and the Company, the 30 June 2011 triennial actuarial valuation was also finalised. The resulting funding deficit was measured at £74.7m and a recovery plan was agreed, with the Company making
annual contributions of £13m to 31 March 2018, approximately £2.5m of which will be derived from a new asset-backed funding structure, secured on certain QinetiQ UK property.
The next scheduled triennial valuation will be performed as at 30 June 2014.
Capital riskThe Group funds its operations through a mixture of equity funding and debt financing, including bank and capital market borrowings. At 31 March 2012 the Group’s total equity was £599.4m (2011: £457.5m), with net debt at £122.2m (2011: £260.9m).
The capital structure of the Group reflects the Directors’ judgement of an appropriate balance of funding required. The Group’s target is to maintain its gearing ratio below 2xEBITDA.
Treasury policyThe Group treasury department works within a framework of policies and procedures approved by the Audit Committee. As part of these policies and procedures, there is strict control on the use of financial instruments. Speculative trading in financial instruments is not permitted. The policies are established to manage and control risk in the treasury environment and to align the treasury goals, objectives and philosophy of the Group.
Funding and debt portfolio managementThe Group seeks to obtain certainty of access to funding in the amounts and maturities required to support its medium to long-term forecast financing requirements. Group borrowings are arranged by the Group treasury function.
Interest risk managementThe Group seeks to reduce the volatility in its interest charge caused by rate fluctuations. A significant portion of the Group’s borrowings is fixed in the short to medium term through fixed-rate debt.
UK Services US Services Global Products 2011 11,2082012 10,180
42%48%
10%
39%51%
10%
Employees by sector
QinetiQ Group plc Annual Report and Accounts 2012 21

Foreign exchange risk management
2012 2011
£/US$ – average rate 1.60 1.56£/US$ – closing rate 1.60 1.60£/US$ – opening rate 1.60 1.52
The principal exchange rate affecting the Group was the sterling to US dollar exchange rate.
The Group’s income and expenditure is largely settled in the functional currency of the relevant Group entity, principally sterling or the US dollar. The Group has a policy in place to hedge all material transaction exposure at the point of commitment to the underlying transaction. Uncommitted future transactions are not routinely hedged. The Group continues its practice of not hedging income statement translation exposure. To minimise the impact of currency depreciation of the net assets on its overseas subsidiaries, the Group seeks to borrow in the currencies of those subsidiaries, but only to the extent that its gearing covenant within its loan documentation, as well as its facility headroom, are likely to remain comfortably within limits.
Tax risk managementThe central principle of QinetiQ’s tax strategy is to manage effective and cash tax rates whilst fully complying with relevant legislation. Tax is managed in alignment with the corporate strategy and with regard to QinetiQ’s core value of integrity in all business dealings. These principles are applied in a responsible and transparent manner in pursuing the Group’s tax strategy and in all dealings with tax authorities around the world.
Credit riskCredit risk arises when a counterparty fails to perform its obligations. The Group is exposed to credit risk on financial instruments such as liquid assets, derivative assets and trade receivables. Credit risk is managed by investing liquid assets and acquiring derivatives from high-credit quality financial institutions. Trade receivables are subject to credit limits, control and approval procedures. The nature of the Group’s operations leads to concentrations of credit risk in its trade receivables. The majority of the Group’s credit risk is with the UK and US Governments and is therefore considered to be minimal.
InsuranceThe Group continually assesses the balance of risk arising from the operations undertaken against the insurance cover available for such activities and associated premiums payable for such cover. A prudent and consistent approach to risk retention and scope of cover is applied across the Group. The Group has a policy of self-insurance, through its captive insurance company, on the first layer of specific risks with insurance cover above these levels placed in the external market with third-party insurers.
EmployeesYear-end employee numbers decreased by 9% to 10,180 at 31 March 2012. The decline is principally a reflection of normal in-year attrition as well as departures under the restructuring programme in the UK and the US and the impact of Government in-sourcing and the disposal of Spectro in the US.
Accounting standardsAs a UK-listed company, the Group is required to adopt EU endorsed IFRSs and to comply with the Companies Act 2006. The effect of changes to financial reporting standards in the year is disclosed in note 1 to the financial statements.
Critical accounting estimates and judgements in applying accounting policiesA description and consideration of the critical accounting estimates and judgements made in preparing these financial statements is set out in note 1 to the Group financial statements.
David Mellors Chief Financial officer 24 May 2012
CHIEF FINANCIAL oFFICER’S REvIEw CoNTINUED
22 QinetiQ Group plc Annual Report and Accounts 2012
Business review Corporate governance Financial statements
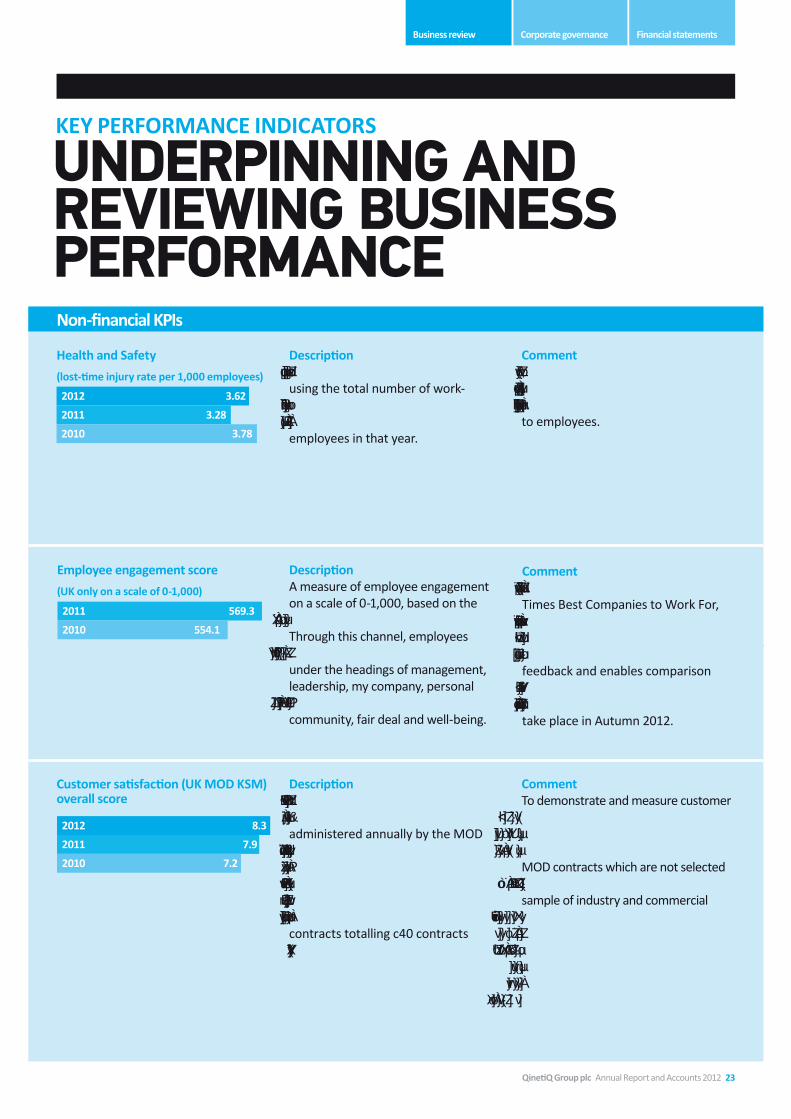
DescriptionThe lost-time injury rate is calculated using the total number of work-related lost-time incidents x1,000 divided by the average number of employees in that year.
DescriptionThe Key Supplier Management (KSM) Framework is a mandatory survey administered annually by the MOD on its Top 22 Key Suppliers. The 360 degree survey concentrates on the performance (delivery, engagement and relationship) of the largest-valued/most strategically important contracts totalling c40 contracts for QinetiQ.
CommentHealth and Safety performance is monitored to drive continual improvement in minimising risks to employees.
CommentTo demonstrate and measure customer satisfaction across the wider UK customer base, QinetiQ also administers a customer satisfaction survey on those MOD contracts which are not selected for the MOD KSM Survey as well as a sample of industry and commercial contracts. Since its inception in 2011, this survey has yielded consistent results to the KSM Survey. In the US, customer satisfaction metrics are reviewed on a contract-by-contract basis and data is therefore not available.
Non-financial KPIs
2012 3.62
2011 3.28
2010 3.78
2012 8.3
2011 7.9
2010 7.2
Health and Safety
(lost-time injury rate per 1,000 employees)
Customer satisfaction (UK MoD KSM) overall score
KEy PERFoRMANCE INDICAToRS
UnDErPinning anD rEviEwing bUsinEss PErfOrmancE
DescriptionA measure of employee engagement on a scale of 0-1,000, based on the Best Companies Employee Survey. Through this channel, employees share their views of working at QinetiQ under the headings of management, leadership, my company, personal growth, my team, giving back to the community, fair deal and well-being.
2011 569.3
2010 554.1
Employee engagement score
(UK only on a scale of 0-1,000)
CommentThe survey forms part of The Sunday Times Best Companies to Work For, an annual survey run in The Sunday Times newspaper that ranks UK employers based on their employees’ feedback and enables comparison between QinetiQ and other UK companies. The 2012 survey will take place in Autumn 2012.
QinetiQ Group plc Annual Report and Accounts 2012 23
KEy PERFoRMANCE INDICAToRS CoNTINUED
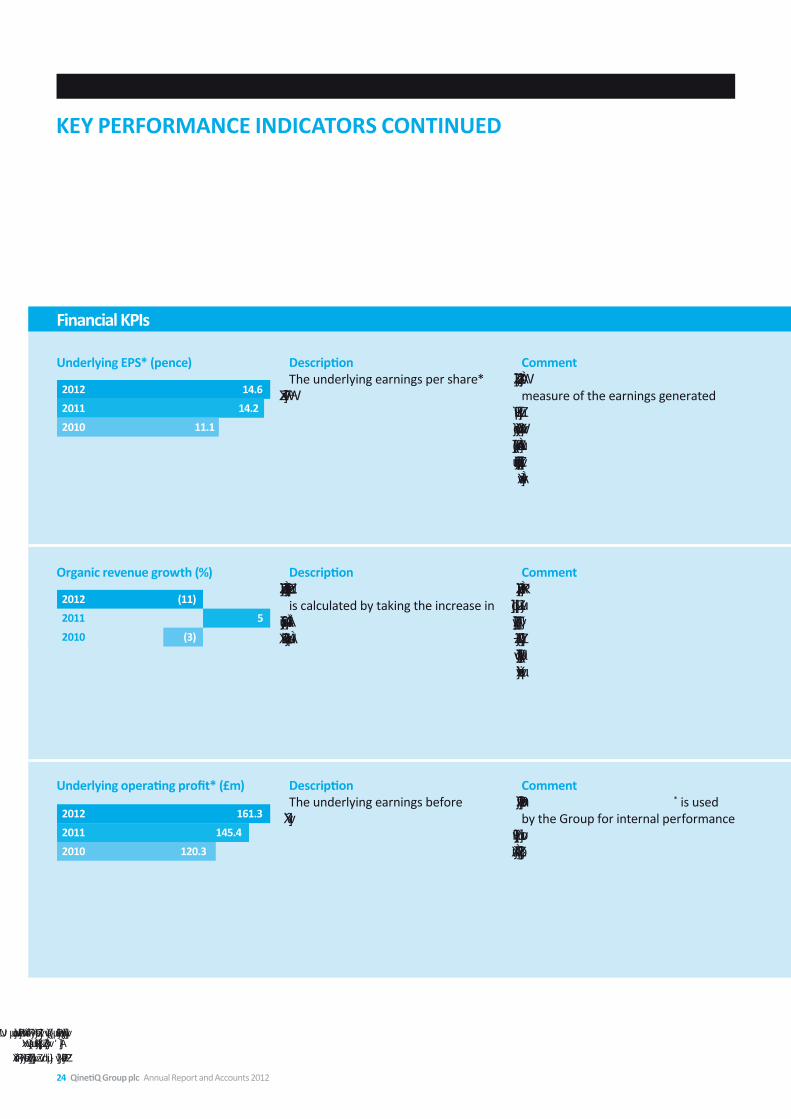
Financial KPIs
DescriptionThe underlying earnings per share* (EPS) expressed in pence per share.
CommentEPS provides shareholders with a measure of the earnings generated by the business after deducting tax and interest. EPS performance also determines the level of payout for certain of the Group’s long-term incentive plans.
2012 14.6
2011 14.2
2010 11.1
Underlying EPS* (pence)
DescriptionThe Group’s organic revenue growth is calculated by taking the increase in 2012 revenue over 2011 pro forma revenue, at constant exchange rates.
CommentOrganic revenue growth demonstrates the Group’s capability to expand its core operations within its chosen markets before the effect of acquisitions, disposals and currency translation.
2012 (11)
2011 5
2010 (3)
organic revenue growth (%)
DescriptionThe underlying earnings before interest and tax*.
CommentUnderlying operating profit* is used by the Group for internal performance analysis as a measure of operating profitability that is tracked over time.
2012 161.3
2011 145.4
2010 120.3
Underlying operating profit* (£m)
* Definitions of underlying measures of performance are in the glossary on page 107. Underlying financial measures are presented, as the Board believes these provide a better representation of the Group’s long-term performance trend.
† The gearing ratio is net debt to adjusted EBITDA and the definition is in the glossary on page 107.
24 QinetiQ Group plc Annual Report and Accounts 2012
Business review Corporate governance Financial statementsBusiness review
The Group’s strategy is underpinned by focusing on a number of performance indicators. The key indicators that the Board uses to assess Group performance are set out on pages 23-25. Similar indicators are used to review performance in each of the Group’s businesses.
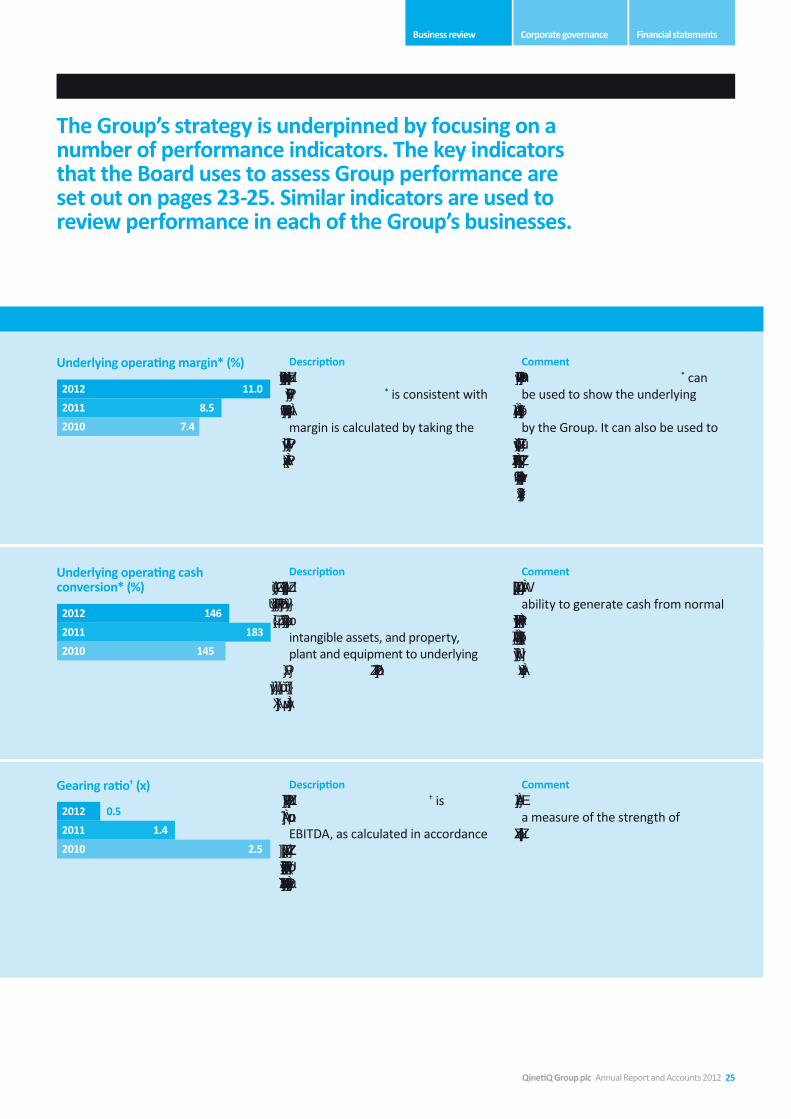
Financial KPIs
DescriptionThe Group’s calculation of underlying operating margin* is consistent with previous years. Underlying operating margin is calculated by taking the earnings before tax and interest as a percentage of revenue.
CommentUnderlying operating margin* can be used to show the underlying profitability of the revenue delivered by the Group. It can also be used to compare the Group’s performance with that of our peers, providing the definition of underlying operating profit is consistent.
2012 11.0
2011 8.5
2010 7.4
Underlying operating margin* (%)
DescriptionThe ratio of our net cash flow from operations (excluding reorganisations), less outflows on the purchase of intangible assets, and property, plant and equipment to underlying operating profit* excluding the share of post-tax results of equity accounted joint ventures and associates.
CommentProvides a measure of the Group’s ability to generate cash from normal operations and gives an indication of its ability to pay dividends, service its debt and to make discretionary investments.
2012 146
2011 183
2010 145
Underlying operating cash conversion* (%)
DescriptionThe Group’s gearing ratio† is calculated as net debt divided by EBITDA, as calculated in accordance with the terms of the Group’s credit facilities, and is comfortably within our banking covenant limit of 3.5x.
CommentNet debt to EBITDA provides a measure of the strength of the Group’s balance sheet.
2012 0.5
2011 1.4
2010 2.5
Gearing ratio† (x)
QinetiQ Group plc Annual Report and Accounts 2012 25

Risk Potential impact MitigationA change in demand from reduced military operations in Iraq and Afghanistan
Current plans of both US and UK Governments are to drawdown troops from Afghanistan by the end of 2014. A significant shift in policy by either the US Administration or the UK Government, which resulted in a significant reduction in the number of forces personnel present in Afghanistan, or a change in the timing, may have a materially adverse impact on the Group’s financial performance.
QinetiQ has capitalised on increased UK and US Government spending on technology in support of operations in Iraq and Afghanistan. In particular, QinetiQ has experienced strong demand for Unmanned Ground Vehicles and survivability products across the duration of both campaigns. The focus on operational support in defence, on both sides of the Atlantic, has however, given rise to a decline in defence expenditure in other areas, such as services to improve procurement efficiency and innovative research. The Group mitigates this by maintaining a market focus and competitive positioning in adjacent markets, including defence services (which are not directly conflict-related), aerospace, security and intelligence, which provides a degree of portfolio diversification.
A change in either US or UK Government spending on defence and security
The Strategic Defence and Security Review in the UK, the US Presidential election, and the financial burden on both UK and US Government budgets from the current economic downturn, will lead to reduced spending in the markets in which the Group operates. In particular, the UK is reducing its defence budget by 8% in real terms by 2015 and, in addition, is seeking to remove significant over-heating in its equipment programme. In the US, federal estimates indicate that DoD spending will reduce by 5% in 2013 and fall further in 2014, followed by a 2% annual increase through to 2017. Any reduction in Government defence and security spending in either the UK or the US could have an adverse impact on the Group’s financial performance.
Our focus on a range of markets in defence, security and intelligence, provides a degree of portfolio diversification. The Group will continue to review trends in defence, aerospace and security expenditure in order to align the business with those trends. The UK Government is investing an additional £650m in cyber capability, which offers some opportunity to the Group.
Changes in the timing of contracts
The amounts payable under some Government contracts can be significant and the timing of the receipt of orders could have a material impact on the Group’s performance in a given reporting period.
The contract and orders pipeline is regularly reviewed by senior operational management.
RISKS AND UNCERTAINTIES
EffEctivE managEmEnt Of risKs
Risks are assessed according to the likelihood of an event’s occurrence and its impact, both from a financial and non-financial standpoint. The Group Risk Register includes an analysis of the potential exposures and severity of each risk (as a function of its likelihood and impact), the assumptions underlying each risk and the mitigation required to manage it. The Group Risk Register is reviewed by the Executive Team and considers:
• The authority, resources and coordination of those involved in the identification, assessment and management of the significant risks the organisation faces;
• The response to the significant risks which have been identified by management and others;
• The monitoring of reports from Group management;
• The maintenance of a control environment directed towards the proper management of risk.
The risk register is reviewed by the Board and, in addition, the risk owners present an update of current status and mitigating actions by rotation throughout the year.
26 QinetiQ Group plc Annual Report and Accounts 2012

Business review Corporate governance Financial statements
Risk Potential impact MitigationFunding of the defined benefit pension scheme
The Group operates a defined benefit pension scheme in the UK. There is currently a deficit between the projected liability of the scheme and the value of the assets it holds. The size of the deficit may be materially affected by a number of factors, including inflation, investment returns, changes in interest rates, and improvements in life expectancy. An increase in the deficit may require the Group to increase the cash contributions to the scheme, which would reduce the Group’s cash available for other purposes.
Pension scheme performance is reviewed regularly by Group management, in conjunction with the scheme’s independent trustees. External actuarial and investment advice is also taken on a regular basis to ensure that the scheme is managed in the best interests of both the Group and of the scheme’s members. The most recent triennial funding valuation of the scheme, as at 30 June 2011, resulted in a deficit of £74.7m. The Group and trustees have agreed a package of measures to enhance the security of the scheme, including deficit recovery payments over six years, the use of CPI rather than RPI for indexation purposes, and an asset-backed funding programme. The next funding valuation of the scheme is at 30 June 2014.
Policies or attitudes may change towards organisational Conflicts of Interest (oCI)
The Group provides services to defence customers that meet their needs as part of the defence supply chain and also as technical advisor through its consultancy services. The future growth of the business could be compromised should our key customers’ current attitudes to policies change.
The Group takes proactive steps to manage any potential OCI and to maintain its ability to provide independent advice through its consulting and systems engineering activities. In the UK, a formal compliance regime operates with the MOD to monitor and assess potential OCI as part of the sales acceptance process. In March 2012, the Group agreed with the MOD that the Company could adopt the generic compliance regime in use with other companies, in place of the QinetiQ-specific one previously in operation. This change will not affect the rigour of the compliance process.
Tax liabilities may change as a result of changes in tax legislation
QinetiQ is liable to pay tax in the countries in which it operates, principally in the UK and the US. Changes in the tax legislation in these countries could have an adverse impact on the level of tax paid on the profits generated by the Group.
External advice and consultation is sought on potential changes in tax legislation in both the UK and the US. This enables the Group to plan for and mitigate potential changes in legislation. The Group is currently actively engaging with HM Treasury on the proposal to move R&D tax credits out of the tax charge and ‘above the line’ into operating profit. If this proposal is implemented, it could increase the Group’s Effective Tax Rate over time towards a blend of the US and UK corporation tax rates.
A material element of the Group’s revenue and operating profit is derived from one contract
The Long-Term Partnering Agreement (LTPA) is a 25-year contract to provide a variety of evaluation, testing and training services to the MOD. The original contract was signed in 2003. The LTPA operates under five-year periods with specific programmes, targets and performance measures set for each period. On 3 March 2008, the Group signed-up to a second five-year period of the LTPA with the MOD. The next break point is in 2013 and the Group is working with the MOD on the associated review. In the current year, the LTPA directly contributed 12% of the Group’s revenue and supported a further 7% through tasking services using LTPA-managed facilities. The loss, cancellation or termination of, or significant reduction in, this contract would have a material, adverse impact on the Group’s future reported performance.
The Group continues to achieve customer performance and satisfaction levels, and significantly exceeded the agreed minimum performance rating of 80% in 2012. While achieving the performance scores, the Group has achieved significant cost savings for the MOD on delivered services.
The understanding and effective management of the risks that face QinetiQ is fundamental to its success and is an integral part of managing the business. The identification, assessment, mitigation and reporting of risks are carried out at a Group, business and project level, and are included as part of the business performance review process.
QinetiQ Group plc Annual Report and Accounts 2012 27

Risk Potential impact MitigationThe Group is subject to US foreign ownership regulations
In the US, the Group undertakes work that is deemed to be of importance to US national security and, under the foreign ownership regulations, arrangements are in place to insulate these activities from undue foreign influence as a result of foreign ownership. Failure to comply with the regulations could result in sanctions, and suspension or debarment from Government contracts, as well as reputational damage to the QinetiQ brand.
The Group has procedures in place to ensure that these arrangements remain effective and to respond to any changes that might occur in US attitudes to foreign ownership of such activities. This section entitled ‘Management and control of US subsidiaries’ on page 43 of this report provides details of the proxy agreement between QinetiQ North America and the US DoD, that regulates the ownership, management and operation of QinetiQ’s principal US subsidiaries.
Failure to comply with laws and regulations, particularly trading restrictions and export controls
The Group operates in a highly-regulated environment and the majority of its revenue is generated from sales in the UK and the US. The Group is subject to numerous domestic and international laws, including import and export controls, financial and fiscal laws, health and safety, environmental, money laundering, anti-bribery, etc. The Group recognises that its operations have the potential to have an impact on its employees, contractors, visitors, customers, and others in the community and that failure to comply with particular regulations could result in a combination of fines, penalties, civil or criminal prosecution, and suspension or debarment from Government contracts, as well as reputational damage to the QinetiQ brand. Any one of these could have a material impact on the Group’s financial performance.
The Group has procedures and, where appropriate, training in place to ensure that it meets all current regulations. Together, these ensure the Group manages, both corporately and at local business level, the effective identification, measurement, and control of regulatory risk and also ensure this principle is at the centre of our management of safety and other issues. Local management continuously monitors local laws and regulations, and policies are in place for the appointment of advisors to support business development. Professional advice is sought when engaging in new territories to ensure that the Group complies with local and international regulations and requirements. The terms of reference of the Compliance Committee have been expanded to review the effectiveness of the compliance risk frameworks.
Failure of information technology systems and breaches of data security
The Group operates in a highly-regulated information technology environment. The data held by QinetiQ is highly confidential and needs to be totally secure, particularly against a background of increasing cyber-threat. A failure of systems could have an impact on contract delivery leading to a loss of customer satisfaction. A breach of data security could have an impact on our customers’ operations and have a significant reputational impact, as well as lead to the possibility of exclusion from some types of Government contracts, with a detrimental impact on the Group’s financial performance.
The information systems are designed with consideration to single points of failure and the removal of risk through minor and major system failures. The business maintains business continuity plans that cover both geography, e.g., sites and business units, as well as the technical capability of staff. These plans cover a range of scenarios, including loss of access to information technology systems. The plans are tested at appropriate intervals. Data security is assured through a multi-layered approach, that provides a hardened environment, including robust physical security arrangements, data resilience strategies and the application of security technologies, as well as comprehensive internal and external testing of potential vulnerabilities. In addition, the systems are monitored and managed on a 24/7 basis.
RISKS AND UNCERTAINTIES CoNTINUED
28 QinetiQ Group plc Annual Report and Accounts 2012

Business review Corporate governance Financial statements
Risk Potential impact MitigationThe Group is subject to US foreign ownership regulations
In the US, the Group undertakes work that is deemed to be of importance to US national security and, under the foreign ownership regulations, arrangements are in place to insulate these activities from undue foreign influence as a result of foreign ownership. Failure to comply with the regulations could result in sanctions, and suspension or debarment from Government contracts, as well as reputational damage to the QinetiQ brand.
The Group has procedures in place to ensure that these arrangements remain effective and to respond to any changes that might occur in US attitudes to foreign ownership of such activities. This section entitled ‘Management and control of US subsidiaries’ on page 43 of this report provides details of the proxy agreement between QinetiQ North America and the US DoD, that regulates the ownership, management and operation of QinetiQ’s principal US subsidiaries.
Failure to comply with laws and regulations, particularly trading restrictions and export controls
The Group operates in a highly-regulated environment and the majority of its revenue is generated from sales in the UK and the US. The Group is subject to numerous domestic and international laws, including import and export controls, financial and fiscal laws, health and safety, environmental, money laundering, anti-bribery, etc. The Group recognises that its operations have the potential to have an impact on its employees, contractors, visitors, customers, and others in the community and that failure to comply with particular regulations could result in a combination of fines, penalties, civil or criminal prosecution, and suspension or debarment from Government contracts, as well as reputational damage to the QinetiQ brand. Any one of these could have a material impact on the Group’s financial performance.
The Group has procedures and, where appropriate, training in place to ensure that it meets all current regulations. Together, these ensure the Group manages, both corporately and at local business level, the effective identification, measurement, and control of regulatory risk and also ensure this principle is at the centre of our management of safety and other issues. Local management continuously monitors local laws and regulations, and policies are in place for the appointment of advisors to support business development. Professional advice is sought when engaging in new territories to ensure that the Group complies with local and international regulations and requirements. The terms of reference of the Compliance Committee have been expanded to review the effectiveness of the compliance risk frameworks.
Failure of information technology systems and breaches of data security
The Group operates in a highly-regulated information technology environment. The data held by QinetiQ is highly confidential and needs to be totally secure, particularly against a background of increasing cyber-threat. A failure of systems could have an impact on contract delivery leading to a loss of customer satisfaction. A breach of data security could have an impact on our customers’ operations and have a significant reputational impact, as well as lead to the possibility of exclusion from some types of Government contracts, with a detrimental impact on the Group’s financial performance.
The information systems are designed with consideration to single points of failure and the removal of risk through minor and major system failures. The business maintains business continuity plans that cover both geography, e.g., sites and business units, as well as the technical capability of staff. These plans cover a range of scenarios, including loss of access to information technology systems. The plans are tested at appropriate intervals. Data security is assured through a multi-layered approach, that provides a hardened environment, including robust physical security arrangements, data resilience strategies and the application of security technologies, as well as comprehensive internal and external testing of potential vulnerabilities. In addition, the systems are monitored and managed on a 24/7 basis.
Risk Potential impact MitigationFixed-price contracts
Some of the Group’s revenue is derived from contracts that have a fixed price. There is a risk that the costs required for the delivery of a contract could be higher than those agreed in the contract as a result of the performance of new or developed products, operational over-runs or external factors, such as inflation. Any significant increase in costs which cannot be passed on to a customer may reduce the profitability of a contract or even result in a contract becoming loss-making.
The nature of many of the services provided under such fixed-price arrangements is often for a defined amount of effort or resource rather than firm deliverables and, as a result, mitigates the risk of costs escalating. The Group ensures that its fixed-price bids and projects are reviewed for early detection and management of issues which may result in cost over-run.
Highly-competitive marketplace
The aerospace, defence and security markets are highly competitive. The Group’s financial performance may be adversely affected should it not be able to compete in the markets in which it aims to operate.
QinetiQ seeks to focus on areas within these markets in which its deep customer understanding, domain knowledge, technical expertise and platform independence provide a strong proposition and a significant advantage in competitive bidding.
Inherent risks of trading in a global market
QinetiQ operates internationally. The risks associated with having a large geographic footprint may include: regulation and administration changes, changes in taxation policy, political instability, civil unrest, and differences in culture and terms of reference, leading to a lack of common understanding with customers. Any such events could disrupt some of the Group’s operations and have a material impact on its future financial performance.
While the core activities of the Group are confined to the UK and the US, it continues to explore potential customer relationships across the globe. These new relationships are assessed for their inherent risks, using our International Business Opportunity Management process before being formally entered into.
Raising external funding and volatility in interest rates
The Group relies on the proper functioning of the credit markets which could have an impact on both the availability and associated costs of financing. The Group is exposed to interest rate risk to the extent borrowings are issued at floating interest rates.
The Group maintains a prudent level of committed funding facilities: a five-year multi-currency facility totalling £275m was provided by its relationship banks and signed in 2011. This is currently undrawn. The Group also uses fixed-rate debt instruments issued to US private placement investors with maturity dates up to 2019.
Exchange rate movement
The Group is exposed to volatility in exchange rates as a result of the international nature of its operations. This includes a translational impact on the key financial statements as a result of the Group reporting its financial results in sterling. The Group has limited transaction exposure as its revenue and related costs are often borne in the same currency, principally US dollars or sterling. Of the Group’s total revenue, approximately 43% are contracted in sterling, 55% in US dollars and 2% in euros.
The Group actively hedges all significant transactional foreign exchange exposure as described in the notes to the financial statements and has adopted hedge accounting. The Group’s objective is to reduce medium-term volatility to cash flow, margins and earnings. The Group protects its balance sheets and reserves from adverse foreign exchange movements by financing acquisitions in North America with US dollar-denominated borrowings, thereby partially mitigating the risk as US dollar earnings are used to service and repay US dollar-denominated debt.
Realisation of value from intellectual property may be delayed
The funded research and development work that the Group undertakes for defence and other customers creates intellectual property that it retains and can use for commercial applications. The uncertainty that exists over new technologies and markets may result in delays, failure to realise value from intellectual property, or the need for a higher level of investment for the opportunity to be realised. The additional investment required may have to be funded from the Group’s own capital resources which may have an adverse impact on its financial performance.
The Group invests in the development of intellectual property only where it believes there is a realistic market opportunity for the technology. The performance of intellectual property realisation programmes is monitored to increase support for successful prospects and reduce expenditure where realisation appears less likely. The Group uses external experts and financial backers as partners in a variety of structures to improve the performance of certain intellectual property realisation projects.
Acquisition of businesses
The Group has the ability to acquire other businesses and companies. These acquisitions may not perform in line with expectations, thereby having a detrimental impact on the Group’s financial performance.
The risks are mitigated through the due diligence and internal approvals processes. In addition, the usual contractual protections are included in purchase agreements signed with vendors.
QinetiQ Group plc Annual Report and Accounts 2012 29

30 QinetiQ Group plc Annual Report and Accounts 2012
Corporate responsibility and sustainability review
Working With our stakeholders
Performance summary: progress in the year
2011 Objectives 2011 Progress 2012 Objectives
Reduction in reportable UK incidents to zero by 2014
New programmes such as the Actions Speak Louder Than Words campaign and QinetiQ Visible Active Leadership (QVAL) were introduced (page 31)
Reduction in reportable UK incidents to zero by 2014
Attainment of OHSAS 18001 in the UK by 2013
Assessment programme agreed with our external auditors (BSI) to commence in August 2012 (page 31)
Attainment of OHSAS 18001 in the UK by 2013
10% reduction in UK carbon emissions by 2012
Over 10% reduction in carbon emissions and attained Carbon Trust Standard re-certification in the UK (page 32)
15% reduction in UK carbon emissions by 2015 – to be delivered through investment projects, reducing business travel and improving employee engagement
Continue to improve waste management in the UK
Appointment of an Asset Management Lead. Mapping and re-examining our waste streams and re-baselining our data (page 32)
Continue to improve waste management in the UK in relation to the whole waste hierarchy, not simply recycling
Continue to work proactively with customers and suppliers on sustainable procurement issues
Engaged with the MOD on sustainable procurement. Worked with suppliers to help us map our carbon footprint better. Included sustainability in our customer satisfaction questionnaire (page 33)
Meet the MOD’s requirements for key suppliers to provide environmental information
GovernanceAt Board level, the Compliance Committee oversees the Group’s Corporate Responsibility and Sustainability (CR&S) strategy, and receives progress updates. At an Executive level, the Safety, Assurance and Sustainability Committee, which reports into the Group’s Executive Team, meets quarterly to review progress. The CR&S strategy and programmes are overseen by the Head of Corporate Responsibility and Sustainability, who works with the assurance and audit functions to monitor and evaluate programmes.
Business managementWe respond promptly to changing legislation by updating local policies, such as health and safety, environment, trade controls, business ethics and equality, taking regional differences in stakeholder requirements and law into account. Our UK business management system is certified to ISO9001. Our Australian business is also ISO9001 certified and has recently
completed a leadership restructure. In the US, we have an ongoing programme of certification, including ISO19001 for major sites and contracts.
StrategyOur vision encompasses more than financial success. We continue to focus on business ethics, our people, excellent environmental stewardship and being a good neighbour.
CustomersWe put customers first, by listening to, understanding and responding to their needs and expectations. Our approach has resulted in our customer satisfaction scores with the MOD increasing significantly (moving from 17th to 3rd over the past two years). Through our UK customer satisfaction programmes we have now embedded sustainability issues to ensure that we understand the needs of our customers. In QNA, our NASA team received a greater than 90% satisfaction score in its first year on the major ESC contract.
Business ethicsWe have introduced a new code of conduct for employees which provides guidelines on the way we do business. A clear commitment to ethical business practice from senior leaders has been communicated to employees through a range of channels, for example the innovative ‘ethical moment’ email messages at QNA. We have appointed an Ethics Officer for each region (UK, QNA and Australia), and all employees continue to be required to complete annual business ethics training. In addition, in-depth training is provided for those employees involved in international business. Due diligence for the appointment of overseas representatives is undertaken by independent third parties, such as TRACE. All employees are encouraged to seek help and advice when dealing with ethical issues and all have access to an independent whistle-blower line. We monitor important data such as gifts and hospitality and have a clear policy that we do not make political donations.

Business review Corporate governance Financial statements
QinetiQ Group plc Annual Report and Accounts 2012 31
Safety and wellbeingThroughout the Group we consider the safety and wellbeing of our people to be a priority. We ensure we provide safe places to work and provide relevant training for employees and expert advisors. This is underpinned by clear leadership and, where necessary, improvement programmes.
In the UK, our RIDDOR (Reporting of Injuries, Diseases and Dangerous Occurrences Regulations) rate for this year was 2.12 per 1,000 employees, which is well below the ‘all industries’ benchmark of 4.63 per 1,000 employees. We have set challenging targets in the UK to gain OHSAS 18001 by 2013 and to reduce reportable incidents to zero by 2014. To meet these, we have introduced a number of initiatives including piloting a new training module called QinetiQ Visible Active Leadership (QVAL), which focus on safety culture and behaviour. The QVAL package enables the business to create a bespoke programme to meet its individual needs. Programmes, such as My Contribution and Actions Speak Louder Than Words are designed to engage our employees in maintaining a safe place to work. We introduced a Health, Safety and Environment (HS&E) Leadership Benchmark, which is a simple assessment of an individual’s behaviour and actions in relation to safety and environmental issues. The benchmark aims to provide a consistent approach to setting individual HS&E objectives for our management team and senior leaders. No prosecutions or prohibition or improvement notices were issued by regulators. We were delighted to receive again a Gold award from the Royal Society for the Prevention of Accidents (ROSPA), which indicates the strength of our safety performance.
Our UK employees have access to an Employee Wellbeing Programme that provides information and support on financial, legal and family matters and counselling. In the UK, employees also have access to a benefits package – Benefits+ and a new wellbeing portal – ‘Be Healthy’. These provide an excellent package of healthcare benefits, an employee assistance programme, and a purchase discount scheme. QNA has expanded its ‘Health in Motion’ program by introducing Vitality, a comprehensive, interactive and personalised wellness programme.
Employee development We take great pride in the calibre of our people and are committed to a range of employee development initiatives, for all career stages, from induction to leadership.
In the UK, we are promoting the concept of employability; the idea that working with us, people will be more employable and better positioned in their future career moves. To support this, we have introduced career development frameworks for roles, which demonstrate the career path
that an individual can take if they wish to progress. We have also signed a three-year agreement with Skillsoft, a provider of global e-learning business courses and online books on Engineering and IT.
We have introduced a new leadership programme to increase our leadership capability. The Advanced Programme for Leaders targets our senior leaders to ensure we have consistent and strong role model behaviours around our five leadership behaviours, the five ‘Es’ (Energy, Excite, Execute, Engage and Empower). The Foundation Programme for Leadership provides a range of targeted modules in leadership and performance management for those in first line-manager roles.
We have also introduced coaching and monitoring to increase our coaching culture. In sales, we have rolled out High Value Sales and negotiation skills training for all employees involved in relevant roles and have developed a training path for Project Managers which is externally accredited by the Association of Project Management. Our talent programme aims to identify our future leaders. QNA continues to work with the Darden Business School at the University of Virginia to develop future leaders. For QNA technical employees, the focus is on providing specialist technical training, ensuring knowledge is rapidly deployed.
Employee engagementA range of channels, from intranet and emails to posters, team meetings and ‘townhall’ meetings with senior management, are used to engage with employees. In the UK, the Employee Engagement Group (EEG), a new employee engagement forum was established. The
Lost time incidents per 1,000 employees 2008 2009 2010 2011 2012
UK 7.61 4.66 5.32 4.73 5.01QNA 1.57 1.09 2.12 1.85 1.56Australia n/a n/a 3.88 3.95 10.70QinetiQ Group 5.071 3.001 3.78 3.28 3.62
1 Total for UK & QNA only.
“ In a changing world with increasing economic, environmental and social pressures, we maintain our commitment to being a responsible and sustainable business. By embedding this approach into the way we do business, we are able to increase our efficiency, reduce risks and engage with our stakeholders.” Mark Elliott, Chairman
“ We are fully committed to providing a safe working environment throughout our sites, as well as safe products, services and advice.” Stephen Evans-Howe, Director of Safety, Assurance and Sustainability

32 QinetiQ Group plc Annual Report and Accounts 2012
EEG has been introduced to provide an all-inclusive structure to improve employee engagement and consultation. More than 40 representatives, elected by employees, from across the business will work together to facilitate greater engagement. The EEG will play an active role in monitoring and feeding back on employee views.
The Australian business has introduced a half-yearly Employee Engagement Survey to monitor the effect of actions intended to improve employee engagement. At QNA, employees attend townhall meetings and participate in employee surveys. Employee focus groups have been introduced to review communication messages and channels to improve the dissemination of information.
The My Contribution programme continues to deliver results with over 9,000 ideas submitted in the UK, delivering over £20m of value. Nearly half the UK workforce has submitted an idea. This concept is being adapted for roll-out in QNA.
Employee equality and diversity As a Company that operates internationally, we employ and work with people from a wide range of backgrounds and cultures. We are committed to a workplace free of discrimination and this is reflected in the way we recruit, hire, train and promote, and provide conditions of employment.
The Board recognises the benefits of Board diversity and will work towards government recommendations and industry best practice, while always ensuring that all Board Directors are appointed on merit.
We are committed to the fair treatment of people with disabilities in relation to applications, training, promotion and career development. If an existing employee becomes disabled, the Group’s policy is to provide continuing employment and training, wherever practicable.
Environmental managementIn the UK, we have introduced a new team of environmental advisors, which is working closely with our existing network of health, safety and environmental advisors, to help drive continuous improvement in our environmental performance. We continue to maintain ISO14001:2004 certification for our estate and those sites we manage on behalf of the MOD. This includes managing our business on, or close to, areas of national and international importance for conservation, such as Sites of Special Scientific Interests (SSSI), and on St Kilda, a World Heritage Site.
Carbon managementOur UK Carbon Management Group continues to focus on initiatives to reduce energy use and travel. The table below shows our year-on-year progress. We were pleased to obtain recertification of the Carbon Trust Standard for our work in measuring and managing energy and were ranked 195th (out of 2,103) in the UK Government’s Carbon Reduction Commitment Energy Efficiency Scheme. Employees continue to be engaged in low-carbon initiatives through the Energy Champion network and campaigns, as well as contributing ideas through the My Contribution programme. We have also committed to purchase our UK electricity from renewable sources for the
next three years and, this year, introduced solar panels at our Farnborough site. We continue to report annually through the Carbon Disclosure Project.
The Australian business is now collecting data on energy consumption and travel, which are reported here for the first time (6.5 GWh of electricity use and 280 tonnes of CO2 from air travel).
Waste managementWe have set ourselves the target in the UK to improve our waste management, focusing on the complete waste hierarchy and not solely recycling. We are mapping and re-examining our waste-streams and re-baselining our data. We have appointed an Asset Management Lead, to find ways of optimising our assets, through to disposal, but with a significant focus on re-use across the business and reducing procurement. Total UK waste this year
Corporate responsibility and sustainability Continued
UK carbon data 2008 2009 2010 2011 2012UK gas use (GWh) 68.6 66.8 64.7 63.0 44.4UK oil use (GWh) 21.4 21.7 20.6 20.3 16.8UK electricity use (GWh) 113.6 102.7 99.3 94.2 87.6Total CO2 from energy use (ktonnes) 79.3 73.2 70.7 67.6 60.0Total CO2 from transport (ktonnes) n/a 26.0 19.8 16.6 12.2
“ The Carbon Trust Standard recertification enables us to demonstrate clearly our continued commitment to limiting environmental impact.” Chris Johnson, Director of Shared Services
Business review Corporate governance Financial statements
QinetiQ Group plc Annual Report and Accounts 2012 33
was 3,500 tonnes, including 72 tonnes of hazardous waste. More than 70% of our waste was diverted from landfill.
Recycling programmes operate across much of QNA. Recycling and separation of waste is the norm in QinetiQ Australia with the focus on waste reduction now at the top of the agenda, including reduction in printing and copying and more efficient use of production materials.
Sustainable procurementWe continue to instil a responsible and sustainable approach to the way we work with our customers and suppliers. As an active member of the UK MOD Sustainable Procurement Working Group, we are committed to completing the annual self-assessment on water, waste and carbon (the latter through the Carbon Disclosure Project). We have provided training for our UK buyers on topics such as bribery in the supply chain. The UK Strategic Sourcing team has introduced a new buying model embedding sustainability.
We continue to develop new technology ideas to contribute to global environmental problems, such as the need for renewable energy. Our Energy from Waste team has created a demonstrator of their pyrolysis unit at our Farnborough Head Office and trials are ongoing.
A major part of our UK business is the delivery of test and evaluation and training support services to the UK MOD. The work is conducted on MOD sites, many of which are designated conservation areas. As a result, we carry out sustainability appraisals to identify and mitigate any impact to the flora, fauna and any other sensitive receptors.
Community investmentAcross the Group, employees support their communities by volunteering their time and professional skills.
In the UK, we have introduced a new Employee Volunteering Scheme to build on a range of ad-hoc programmes and make it easier to monitor and measure success. Employees continued to focus on work with schools, through programmes such as the STEM (Science, Technology, Engineering, Maths) Academy and the QinetiQ Powerboat Challenge, with the aim of inspiring the next generation of scientists and engineers. Employees are also using their professional skills, such as our involvement in the Young Enterprise programme and with local charities. We continue to promote this programme to benefit communities in which we operate as well as to develop our people. Engineers in our Science for Society programme have provided technical advice to Non-Government Organisations working in Laos on the disposal of unexploded ordnance (UXO), for the past six years. During a recent visit to Mahaxy district in Khammouane province, the team provided advice on sustainable technologies and training.
QNA also recognises the importance of young people pursuing STEM careers and so supports initiatives, such as robot challenges. They also support a range of fundraising activities for military and health charities.
In total, across the Group, charitable donations from the business amounted to £108,400. In the UK, employees have chosen new charities to support (Cancer Research UK, RNLI and Help for Heroes) and these will continue to receive matched funding for any activities. UK employees also raised a further £53,978 through fundraising and payroll giving.
In Australia, we provide a range of opportunities for employees to contribute to a range of charities while simultaneously competing in physically demanding pursuits. As an example, the Kokoda Challenge creates opportunities for teams of four to complete a 24-hour trek in South-east Queensland to replicate the trials of Australian forces that battled along the Kokoda Track in Papua New Guinea during WWII. The teams raised AUS$4,600 for the charity, which helps disadvantaged teenagers.

34 QinetiQ Group plc Annual Report and Accounts 2012
Non-executive Chairman – 63Appointment to the BoardAppointed Non-executive Chairman in March 2010; Non-executive Director between June 2009 and February 2010.Committee membershipsChairman of the Nominations Committee; Member of the Compliance Committee and Remuneration Committee.Skills and experienceMark is a Non-executive Director of Reed Elsevier Group plc (and is also Chairman of its Remuneration Committee), Reed Elsevier NV and G4S plc. He was previously General Manager of IBM Europe, Middle East and Africa and sat on IBM’s Worldwide Management Council. The Board considers that Mark’s extensive experience in the technology services sector, in the US and Europe, together with his exposure to a variety of industry sectors on the boards of FTSE listed companies, is a valuable asset to the Group in terms of leadership and of addressing the strategic issues that affect the Group.
Mark Elliott Leo Quinn David Mellors Michael Harper
COrPOrATE GOvErNANCE
Board of directors
Chief Executive Officer – 55Appointment to the BoardAppointed Chief Executive Officer in November 2009.Committee membershipsMember of the Compliance Committee, Nominations Committee and Security Committee.Skills and experienceLeo was Chief Executive Officer of De La Rue plc between 2005 and 2009. He was previously Chief Operating Officer of Invensys plc’s Production Management Division and before that spent 16 years with Honeywell Inc., in a variety of senior management roles in the USA, Europe, the Middle East and Africa. He was formerly a Non-executive Director of Tomkins plc.
Chief Financial Officer – 43Appointment to the BoardAppointed Chief Financial Officer in August 2008.Committee membershipsMember of the Compliance Committee and Security Committee.Skills and experienceDavid was previously deputy Chief Financial Officer of Logica plc. He was also Chief Financial Officer of Logica’s international division, covering operations in North America, Australia, the Middle East and Asia and, before that, was the Group Financial Controller. His earlier experience includes various roles with CMG plc, Rio Tinto plc and Price Waterhouse. He is a member of the Institute of Chartered Accountants in England & Wales.
Deputy Chairman and Senior Independent Non-executive Director – 67Appointment to the BoardAppointed Non-executive Director in November 2011. Appointed Deputy Chairman and Senior Independent Non-executive Director in February 2012.Committee membershipsMember of the Audit Committee, Compliance Committee, Nominations Committee, Remuneration Committee and Security Committee.Skills and experienceMichael was appointed Chairman of BBA Aviation plc in June 2007, having joined the Board in February 2005. He is also Chairman of the Vitec Group plc and of Ricardo plc. He was previously a Director of Williams plc where, at the time of the demerger in 2000, he became Chairman of Kidde plc. The Board considers that Michael’s wealth of operational and corporate experience will enable him to make a significant contribution to the Board.

Business review Corporate governance Financial statements
QinetiQ Group plc Annual Report and Accounts 2012 35
Noreen DoyleColin Balmer
Jon Messent
Paul MurrayAdmiral Sir James Burnell-Nugent
Non-executive Director – 65Appointment to the BoardAppointed Non-executive Director in February 2003.Committee membershipsChairman of the Compliance Committee and Security Committee; Member of the Audit Committee, Nominations Committee and Remuneration Committee.Skills and experienceColin is currently on the Board of the Royal Mint and Chair of its Audit Committee. He has held senior posts in Government, including Managing Director of the Cabinet Office, from 2003 until his retirement in 2006. He was previously Finance Director of the MOD, and was responsible for QinetiQ’s privatisation. Notwithstanding that Colin has served on the Board for more than nine years, the Board still considers that he remains independent in character and judgement. Further, the Board considers that Colin’s extensive knowledge of the development of QinetiQ, together with his in-depth understanding of the working of Government, continue to provide a unique insight into the issues Government faces in delivering its procurement objectives and in partnering with industry suppliers.
Company Secretary and Group General Counsel – 48AppointmentAppointed as Company Secretary and Group General Counsel in January 2011.Skills and experienceJon joined QinetiQ from Chloride Group plc where he held a similar role. He has a background in legal private practice as well as general counsel and company secretarial experience in other FTSE250 companies.
Non-executive Director – 63Appointment to the BoardAppointed Non-executive Director in October 2005.Committee membershipsChairman of the Remuneration Committee; Member of the Audit Committee, Compliance Committee and Nominations Committee.Skills and experienceNoreen is a member of the Board of Credit Suisse Group (Zurich) and its UK regulated subsidiaries. She is a Non-executive Director of Newmont Mining Corporation (Denver), where she is Chair of the Audit Committee, and Rexam plc, where she is Chair of the Finance Committee. She was previously First Vice President of the European Bank for Reconstruction and Development (EBRD). Before EBRD, she worked in corporate finance and leveraged financing at Bankers Trust Company (now Deutsche Bank). The Board considers that Noreen’s extensive international business experience, particularly in corporate finance, risk management and banking, is of significant benefit to the Board.
Non-executive Director – 62Appointment to the BoardAppointed Non-executive Director in April 2010.Committee membershipsMember of the Audit Committee, Compliance Committee, Remuneration Committee, Nominations Committee and Security Committee.Skills and experienceSir James commanded the aircraft carrier HMS Invincible and three other ships and submarines during a 37-year career in the Royal Navy that culminated in his appointment as Commander-in-Chief Fleet. Between operational duties he held several positions at the MOD and gained cross-Whitehall experience while on secondment to HM Treasury. The Board considers that Sir James’ expertise in the Government contracting domain, particularly with the UK MOD and HM Treasury, is highly beneficial in the context of QinetiQ’s Government-sourced operations.
Non-executive Director – 50Appointment to the BoardAppointed Non-executive Director in October 2010.Committee membershipsChairman of the Audit Committee; Member of the Compliance Committee, Nominations Committee, Remuneration Committee and Security Committee. Skills and experiencePaul is currently a Non-executive Director and Audit Committee Chair at Royal Mail Holdings plc. He is also a Director of Naked Energy Ltd and Knowledge Peers plc and a Trustee of Pilotlight. He was previously Senior Independent Director of Taylor Nelson Sofres plc, a Non-executive Director of Thomson SA and Tangent Communications plc, and has also been Group Finance Director of Carlton Communications plc and LASMO plc. The Board considers that Paul brings a broad range of experience in finance and corporate governance from a cross-section of industries, all of which leverage technology.

36 QinetiQ Group plc Annual Report and Accounts 2012
COrPOrATE GOvErNANCE
corporate governance report
The Board considers that QinetiQ has complied with the provisions of the UK Corporate Governance Code (the ‘UK Code’) throughout the last financial year. The UK Code and associated guidance are publicly available on the Corporate Governance page of the Financial Reporting Council’s website, www.frc.org.uk/corporate. This report provides details of the way the principles of the UK Code have been applied during the year.
The Board – governance, processes and systems: Board objectivesTo demonstrate the highest standards of corporate governance in accordance with the UK Code to:
• Ensure the continuing evolution and implementation of the Group’s strategy to deliver value to all stakeholders: customers, employees and shareholders;
• Develop challenging objectives for the business and monitor management performance against those goals;
• Provide a framework of effective controls to assess and manage risks, with clear expectations for conduct to the highest standards of ethics;
• Provide support and constructive challenges to the Chief Executive Officer (CEO) to promote the Group’s success;
• Demonstrate leadership in management systems around health, safety and environment;
• Manage succession planning for the Board and the Group’s executive management.
Composition of the BoardDetails of the Board of Directors are on pages 34 and 35. The Board currently has eight members: the Non-executive Chairman; five other Non-executive Directors; and two Executive Directors – the Chief Executive Officer (CEO) and the Chief Financial Officer (CFO).
Executive and Non-executive Board compositionMark Elliott has been the Non-executive Chairman of QinetiQ since 1 March 2010, having first joined the Board as a Non-executive Director on 1 June 2009.
A number of changes in the composition of the Non-executive Directors took place during the year.
David Langstaff resigned on 18 April 2011, Admiral Ed Giambastiani resigned on 2 August 2011 and Sir David Lees resigned as Deputy Chairman and Senior Independent Non-executive Director on 31 January 2012. On 22 November 2011, Michael Harper joined us as a Non-executive Director and became the Group’s Deputy Chairman and Senior Independent Director in February 2012 following Sir David Lees’ departure. The Board thanks Sir David for his dedication and valuable contribution to the Board.
The Board considers its overall size and composition to be appropriate, having regard in particular to the independence of character and integrity of all the Directors and the experience and skills that they bring to their duties, which prevents any individual or small group from dominating its decision-making.
The Board has due regard to the benefits of diversity (including gender diversity) when considering its composition.
It considers that the skills and experience of its individual members, particularly in the areas of UK/US defence and security, the commercialisation of innovative technologies, corporate finance, mergers and acquisitions, and risk management, have been fundamental in the pursuit of QinetiQ’s strategic initiatives (as described in the Chief Executive Officer’s statement on pages 4 to 6 of this report) in the past year. In addition, the quoted company experience of members of the Board in a variety of industry sectors and international markets has also been invaluable to the Group as it seeks to consolidate its position in its core markets and geographic territories.
roles and responsibilitiesThe Board is responsible for overseeing the Executive Directors’ management of operations and, in this capacity, determines the Group’s strategic and investment policies. It also monitors the performance of the Group’s senior management team and organises its business to have regular interaction with key members of the Group. The Directors are responsible for overseeing the management of the business of the Group, and their powers are subject to the Articles of Association and any applicable legislation and regulation.
“ We continue to view the achievement of high standards of corporate governance as essential to building value in our business and to promoting the long-term success of our Company.”Mark Elliott, Chairman
6
2
Execu�ve DirectorsNon-execu�ve Directors

Business review Corporate governance Financial statements
QinetiQ Group plc Annual Report and Accounts 2012 37
Chairman and Chief Executive OfficerThe roles of Chairman and CEO are separate, and the Board has clearly articulated their responsibilities in writing. The Chairman, Mark Elliott, is responsible for the effective operation of the Board and for ensuring that all Directors are enabled and encouraged to play their full part in its activities. The CEO, Leo Quinn, is responsible to the Board for directing and promoting the profitable operation and development of the Group, consistent with enhancing long-term stakeholder value. This includes the day-to-day management of the Group; formulating, communicating and executing Group strategy; and the implementation of Board policies.
Senior Independent DirectorThe Senior Independent Non-executive Director is Michael Harper. Michael is also the Deputy Chairman of the Board. He replaced Sir David Lees who stepped down as Senior Independent Non-executive Director and Deputy Chairman of the Board during the year.
Michael serves as an additional point of contact for shareholders should they feel that their concerns are not being addressed through the normal channels, and is available to fellow Non-executive Directors, either individually or collectively, should they wish to discuss matters of concern in a forum that does not include the Chairman, the Executive Directors or the senior management of QinetiQ.
Independence of Non-executive DirectorsOf the current Directors of the Company, the Board considers all the Non-executive Directors to be independent of QinetiQ’s executive management and free from any business or other relationships that could materially interfere with the exercise of their independent judgement. Notwithstanding that Colin Balmer has served on the Board for more than nine years, the Board still considers that he remains independent in character and judgement and the Board has found no information or circumstances to lead it to conclude otherwise. Based on the above, the Board considers that more than half its members were independent Non-executive Directors throughout the last financial year.
Performance of the BoardIn accordance with the UK Code, QinetiQ continues each year to evaluate the performance of the Board and its Committees.
During the year, the Board appointed Independent Audit Limited to undertake a review of the effectiveness of the Board and to facilitate a review by the Audit Committee of its effectiveness. Independent Audit Limited had no other connection with the Company.
For the Board review, Independent Audit conducted interviews with all Board members and the Company Secretary that were wide ranging and covered all aspects of Board performance. The report summarising their findings and detailing recommendations was discussed at the May Board meeting.
The overall conclusion was that the Board is effective in its fulfilment of its governance responsibilities. The report identified areas where improvements could be made and these are being incorporated into the Board’s objectives for the coming year. They include:
• Achieving greater clarity about the role of the Board in relation to risk strategy and the oversight of risk management;
• Providing more opportunities for the Non-executive Directors to spend time in the business and meet members of senior management;
• Ensuring that the information provided to the Board is fully in line with its needs to allow tracking of progress against strategic objectives and assessing performance, tied into both financial and non-financial drivers of the business; and
• Ensuring effective oversight of the US business given that it is held through a Proxy Agreement.
The detailed, externally-facilitated review of the Audit Committee’s effectiveness was conducted through an in-depth web-based questionnaire, with the results being analysed and reported by Independent Audit. A similar review looked closely at the Board’s approach to risk governance. The reviews have resulted in a number of changes in approach, including the setting up of a Risk Committee of the Board to help ensure an effective focus on risk monitoring and risk management oversight.
Directors’ induction, on-going training and informationAll newly-appointed Directors take part in an induction programme which is tailored to meet their specific needs in relation to information on the Group. The induction programme includes an induction pack, which is refreshed to ensure that it contains the most up-to-date information available. In addition, a series of visits to Group sites, giving the opportunity to meet the senior management, is provided to new Directors to enable them to gain a full understanding of the business. All Directors are encouraged to visit QinetiQ’s principal sites, and to meet a wide cross-section of employees (including other members of the senior management team). Training is also available on key business issues or developments in policy, regulation or legislation on an ‘as-needed’ basis. The Company provides business-wide computer based training (CBT) for employees and the Board in relation to compliance with its business ethics, policies and practices.
As part of the corporate planning process, the Board has the opportunity to question the Divisional Managing Directors and the Executive Directors on the formulation of the corporate plan at Division level and the plan’s impact on Group strategy.
Each of the Directors has access to the services of the Company Secretary, and there is also an agreed procedure for the Directors to seek independent advice at the Company’s expense.
re-election of DirectorsRules concerning the appointment and replacement of Directors of the Company are contained in the Articles of Association. Changes to the Articles must be submitted to shareholders for approval. According to the Articles of Association, all Directors are subject to election by shareholders at the first Annual General Meeting (AGM) following their appointment, and to re-election thereafter at intervals of no more than three years. In line with best practice reflected in the UK Code, however, the Company requires each serving member of the Board to be put forward for election or re-election on an annual basis at each AGM.

38 QinetiQ Group plc Annual Report and Accounts 2012
COrPOrATE GOvErNANCE rEPOrT CONTINuED
Attendance at meetings of the Board and its Committees – April 2011 to March 2012
Committee*
Members Board Audit Remuneration Compliance
Mark Elliott 9/9 – 6/6 4/4Colin Balmer 8/9 3/3 5/6 3/4Admiral Sir James Burnell-Nugent 9/9 3/3 6/6 4/4Noreen Doyle 8/9 5/5 6/6 2/2Michael Harper1 3/3 1/1 2/2 1/1David Mellors 9/9 – – 1/1Paul Murray 9/9 5/5 3/3 4/4Leo Quinn 9/9 – – 4/4Admiral Edmund P. Giambastiani2 2/3 – – 1/2David Langstaff3 – – – –Sir David Lees4 7/7 4/4 – 4/4
* The composition of the committee memberships was reviewed by the Board and updated at its meeting in November 2011.
1 Michael Harper was appointed to the Board on 22 November 2011.2 Admiral Edmund P. Giambastiani resigned from the Board on 2 August 2011.3 David Langstaff resigned from the Board on 18 April 2011.4 Sir David Lees resigned from the Board on 31 January 2012.
Board meetings and attendanceThe Board has regular scheduled meetings. Eight scheduled Board meetings and one Board meeting via telephone conference were held in the last financial year. Members of the Board were also invited to attend a dinner on the occasion of each scheduled Board meeting, to assist with the process of relationship building and to ensure that key strategic initiatives were discussed thoroughly.
The table above shows the number of meetings of the Board and its Committees held during the last financial year, and individual Directors’ attendance.
Matters reserved to the BoardThe Board operates through a comprehensive set of processes, which define the schedule of matters to be considered by the Board and its Committees during the annual business cycle, the level of delegated authorities (both financial and non-financial) available to Executive Directors and other layers of management in the business, and QinetiQ’s business ethics, risk management, and health, safety and environmental processes. The Board devotes one entire meeting each year to consider strategy and planning issues that have an impact on the Group, from which the corporate plan is generated. It is also regularly kept up to date on strategic issues throughout the year. The Board has a clearly articulated set of matters which are specifically reserved to it for consideration. These include reviewing the annual budgets;
raising indebtedness; granting security over Group assets; approving Group strategy and the corporate plan; approving the annual and interim report and accounts; approving significant investment, bid, acquisition and divestment transactions; approving Human Resources policies (including pension arrangements); reviewing material litigation; and monitoring the overall system of internal controls, including risk management.
Operation of the BoardThe Board receives written reports from the CEO and CFO each month, together with a separate report on investor relations, which is prepared in consultation with QinetiQ’s brokers, and a report produced by the Company Secretary on key legal and regulatory issues that affect the Group. It also considers reports from the Chairs of the Committees of the Board at the first scheduled meeting after the date each Committee meeting was held.
The CEO’s monthly report addresses the key strategic initiatives which have had an impact on the Group since the previous Board meeting, with particular focus on the progress of each of the Divisions. Other key areas of focus include health, safety and environmental matters; employee and organisational issues; corporate responsibility; the status of key account management/customer relationship initiatives; the pipeline of potential bids, acquisitions, disposals and investments; and the post-acquisition performance of recently acquired businesses.
The Board also receives updates from key functional areas on an ‘as needed’ basis, on issues such as human resources, treasury, corporate responsibility, real estate, security, trade controls and pensions. Key issues considered by the Board in the past year include succession planning, which culminated in some changes to Board membership, strategy (in particular the effective operation of the UK Services, US Services and Global Products businesses) and the Company’s ongoing improvement to business processes in response to the key findings of the Haddon-Cave report.

Business review Corporate governance Financial statements
QinetiQ Group plc Annual Report and Accounts 2012 39
Conflicts of interestThe Company requires Directors to disclose proposed outside business interests before they are entered into. This enables prior assessment of any conflict, or potential conflict, of interest and any impact on time commitment. An annual review of all external interests is carried out by the Board.
Directors’ responsibilitiesStatements explaining the Directors’ responsibilities for preparing the Group’s annual report and financial statements and the auditor’s responsibilities for reporting on those statements are on pages 56 and 57.
Other Directors’ information

40 QinetiQ Group plc Annual Report and Accounts 2012
COrPOrATE GOvErNANCE rEPOrT CONTINuED
Compliance Committee
The Compliance Committee is chaired by Colin Balmer. The Committee’s primary purpose is to monitor adherence to the MOD Compliance Regime. In addition, it keeps a watching brief over those areas of risk, including security, trade controls, ethics, corporate social responsibility and health, safety and environment where the principal impact is not financial. All the other members of the Board are members of the Committee. Sir David Lees was Chairman of the Committee until his departure in January 2012. The Committee meets as necessary, although normally not less than four times a year. During the financial year ended 31 March 2012, the Compliance Committee met on four occasions.
This past year the Committee has focused on ethics, the QNA Proxy Regime, health, safety and the environment, trade controls, security, and trials involving human subjects that fall within the scope of the Helsinki Protocol. In addition, the Committee is providing oversight for 12 project areas that have been established to address the recommendations of the Sir Robert Nelson Report, which was completed as a result of the Haddon-Cave Review. These projects include specific activities relating to aerospace assurances and safety work, in addition to the governance of advice services, general projects seeking to simplify QinetiQ’s Competency and Assurance Frameworks, and the processes of its Business Management System.
The Committee continues to monitor the Compliance Regime, which is designed to give MOD customers confidence that QinetiQ is able to provide impartial advice during any competitive evaluation of a procurement where it wishes to operate on both the ‘buy’ and the ‘supply’ sides.
In designing the Compliance Regime, the MOD and QinetiQ sought to achieve a balance between meeting the needs of the procurement customers in the MOD (principally Defence Equipment and Support) and the need to allow QinetiQ the flexibility to exploit research into the supply chain and pursue its planned commercial activities, without compromising the defence or security interests of the UK. Oversight of the operation of the regime is provided by the Compliance Committee.
The MOD reviews the operation and effectiveness of the Compliance Regime through its right to have an observer at the Compliance Committee meetings.
The Board nominates two senior executives to act as Compliance Implementation Director and Compliance Audit Director. It receives a bi-annual report on the compliance areas that it monitors from the internal audit function. The Committee addresses any issues that would arise if QinetiQ were to fail to comply with the requirements of the regime. No breaches were noted during the year.
This year, the Committee continued to oversee health, safety and environment, trade controls, ethics and security, through quarterly reports from the heads of those functions in the business. A summary of the key focus and activities of the health, safety and environment and ethics functions is set out in the Corporate Responsibility and Sustainability Review on pages 30 to 33.
In March 2012, the Company obtained MOD agreement to changes in the Special Shareholder rights and these are subject to shareholder approval at the 2012 Annual General Meeting. These include removal of the MOD’s right to veto any transaction or activity and the introduction of a generic compliance system in alignment with that followed by other defence companies. The Company will continue with rigorous management, of potential conflicts of interest while ensuring that proportionate governance is maintained by the Board.
Colin Balmer
Business review Corporate governance Financial statements
QinetiQ Group plc Annual Report and Accounts 2012 41
Audit Committee
The Audit Committee is chaired by Paul Murray. The Board considers him to have recent and relevant financial experience, given his former roles as Group Finance Director of Carlton Communications plc and LASMO plc, and through his current role as Audit Committee Chairman at Royal Mail Holdings plc. The other members of the Committee are Colin Balmer, Admiral Sir James Burnell-Nugent, Noreen Doyle and Michael Harper, all of whom the Board considers to be independent. David Langstaff and Sir David Lees were also members of the Committee until they resigned from the Board. The members bring extensive experience of corporate management in senior executive positions to the Company.
The Audit Committee monitors the Group’s integrity in financial reporting and reviews the effectiveness of the risk management framework.
The Audit Committee meets as necessary and at least four times a year. During the financial year ended 31 March 2012, the Committee met on five occasions. The external auditor has the right to request that a meeting of the Audit Committee be convened. During the past financial year, and in accordance with its terms of reference, the Committee met with QinetiQ’s external auditor on two separate occasions, without Executive Directors present, to discuss the audit process. The Committee also met with the Group Internal Audit Manager on the same basis.
The CEO, CFO, Director of Group Finance, Group Internal Audit Manager, the QNA Internal Audit Manager and a representative of the external auditor normally attend Audit Committee meetings.
This year the Committee’s particular focus continued to be on QNA risks, issues and mitigating actions, and on an externally facilitated assessment of the effectiveness of governance arrangements.
Consideration of the audit process for the full-year and interim results was an important area of focus for the Audit Committee. As part of its review of internal controls, the Committee focused
in particular on those matters which had failed to achieve at least a ‘satisfactory’ internal audit rating in the year, and on the management plans to address the issues raised by the internal audit function.
The Committee undertook governance reviews in respect of the effectiveness of the Committee itself and risk governance.
The recommendations from those reviews are being considered and will be progressed by the Committee Chairman during the current financial year.
In addition to the detailed reviews of the Committee’s effectiveness and risk governance, the Committee also undertook an externally-facilitated review of the effectiveness of the internal audit function. Responses to a detailed questionnaire from a range of stakeholders were analysed by Independent Audit Limited who, in reporting to the Committee, made a number of recommendations. An action plan is now being implemented to introduce a number of improvements, particularly around the interaction with internal audit in the Company’s North American operations.
The Committee also reviewed the activities of the tax, insurance and treasury functions, as well as overseeing the level of KPMG’s audit fees.
The Committee confirms its view that it has received sufficient, reliable and timely information from management in the last financial year to enable it to fulfil its responsibilities.
To safeguard auditor independence and objectivity, the Committee ensures that any other advisory and/or consulting services provided by the external auditor do not conflict with its statutory audit responsibilities and are conducted through entirely separate working teams; such advisory and/or consulting services generally only cover regulatory reporting, tax, and mergers and acquisitions work. Any non-audit services conducted by the auditor require the consent of the CFO or the Chairman of the Audit Committee before being initiated; any services exceeding £50,000 in value require the
consent of the Audit Committee as a whole. In the last financial year, there have not been any non-audit services conducted by KPMG that exceeded £50,000 in value. The Committee concluded, therefore, that there had not been any conflict of interest that might compromise the independence of KPMG’s audit work.
The cost and nature of non-audit work undertaken by the auditor was regularly reviewed by the Committee during the last financial year. This process enables the Committee to take corrective action if it believes that there is a risk of the auditor’s independence being undermined through the award of such work. It is also QinetiQ’s policy that no KPMG employee may be appointed into a senior position within the QinetiQ Group without the prior approval of the CFO.
KPMG has been the Company’s auditor since 2003. The members of the Audit Committee have declared themselves satisfied with the performance of KPMG as the Company’s auditor in the last financial year. A rotation of KPMG’s lead audit partner was last undertaken during 2008. During the year, steps were undertaken in conjunction with KPMG for the appointment of a replacement lead audit partner during the 2013 financial year. It is anticipated that the new lead audit partner will continue in this role for a maximum term of five years.
Paul Murray

42 QinetiQ Group plc Annual Report and Accounts 2012
COrPOrATE GOvErNANCE rEPOrT CONTINuED
Nominations CommitteeThe Nominations Committee is now chaired by Mark Elliott. The other Committee members are Colin Balmer, Admiral Sir James Burnell-Nugent, Noreen Doyle, Michael Harper, Paul Murray and Leo Quinn. Sir David Lees and David Langstaff were also members of the Committee until they resigned. The Committee ensures that the composition of the Board and

Business review Corporate governance Financial statements
QinetiQ Group plc Annual Report and Accounts 2012 43
Going concernThe Group’s activities, combined with the factors that are likely to affect its future development and performance, are set out in the CEO’s Statement on pages 4 to 6. The CFO’s Review on pages 17 to 22 sets out details on the financial position of the Group, the cash flows, committed borrowing facilities, liquidity and the Group’s policies and processes for managing its capital and financial risks. Note 26 to the financial statements also provides details of the Group’s hedging activities, financial instruments, and its exposure to liquidity and credit risk.
The market conditions in which the Group operates have been, and are expected to continue to be, challenging as spending from the Group’s key customers in its primary markets in the UK and US remains under pressure. Despite these challenges, the Directors believe that the Group is well positioned to manage its overall business risks successfully.
After making the appropriate enquiries, including a review of the latest two-year budget, the Directors have a reasonable expectation that the Group has adequate resources to continue in operational existence for the foreseeable future.
Consequently, the Annual Report and Accounts have been prepared on a going concern basis.
Communication with shareholdersThe Company attaches significant importance to the effectiveness of its communications with shareholders. During the last financial year, the Company maintained regular dialogue with institutional shareholders and the financial community, which included presentations of the full-year and interim results, including investor ‘road shows’ held in the UK and US, and regular meetings with major shareholders and industry analysts. In addition, each member of the Board attended the Company’s AGM in August 2011 and was available to take questions. The Chairman, the Senior Independent Director and Non-executive Directors make themselves available to meet shareholders as required. All shareholders and potential shareholders can gain access to the Annual Report, presentations to investors and other significant information about QinetiQ on the Company’s website, www.QinetiQ.com.
Holders of ordinary shares may attend the Company’s AGM at which the Company highlights key business developments during the year and at which shareholders have an opportunity to ask questions. The Chairs of the Audit, Remuneration, Nominations, Compliance and Security Committees are available at that meeting to answer any questions on the work of
the Committees. The Company confirms that it will send the AGM Notice and relevant documentation to all shareholders at least 20 working days before the date of the AGM.
For those shareholders who have elected to receive communications electronically, notice is given of the availability of documents on the investor relations section of the Group’s website. All shareholders will be entitled to vote on the resolutions put to the AGM and, to ensure that all votes are counted, a poll will be taken on all the resolutions in the Notice of Meeting. The results of the votes on the resolutions will be published on the Group’s website.
Responsibility for maintaining regular communications with shareholders rests with the Executive Team, led by the CEO, assisted by an investor relations function. The Board is informed on a regular basis of key shareholder issues, including share price performance, the composition of the shareholder register and City expectations.
During the coming year, the Company will be looking to continue to improve the quality of its engagement with shareholders and to explore with investors any additional practical means by which it can give effect to the requirements of the Financial Reporting Council’s UK Stewardship Code for institutional investors, and of the UK Code.
Details of the Company’s share capital, which are required to be disclosed in accordance with rule 7.2.6 of the FSA’s Disclosure and Transparency Rules, and the Directors’ powers in relation to issuing and buying back shares can be found on pages 53 to 55 in the Other Statutory Information section of this Annual Report.
Management and control of uS subsidiariesQinetiQ’s principal US subsidiaries are currently required by the US National Industrial Security Program to maintain facility security clearances and to be insulated from foreign ownership, control or influence. To comply with these requirements, QinetiQ North America, Inc. (QNA), a wholly-owned subsidiary of QinetiQ in the US and the holding company for the substantive part of QinetiQ’s North American operations, and the US DoD, have entered into a proxy agreement that regulates the ownership, management and operation of these companies. Pursuant to this proxy agreement, QinetiQ has appointed four US citizens (Peter Marino, Riley Mixson, John Currier and Vince Vitto), who hold the requisite US security clearances, as proxy holders to exercise the voting rights of QNA’s shares in the US subsidiaries. The proxy holders are also appointed as Directors of the relevant US subsidiaries and, in addition to their
powers as Directors, have the power under the proxy arrangements to exercise all prerogatives of share ownership of QNA. The proxy holders have a fiduciary duty, and agree, to perform their role in the best interests of shareholders, and in a manner consistent with the national security interests of the US.
QinetiQ Group plc does not have any representation on the boards of the subsidiaries covered by the proxy agreement and does not have the right to attend board meetings. QinetiQ Group plc may not remove the proxy holders other than for acts of gross negligence or wilful misconduct or for breach of the proxy agreement (with the consent of the US Defense Security Service).
In terms of the power to govern, the proxy agreement vests certain powers solely with the proxy holders and certain powers solely with QinetiQ. For example, QinetiQ can, at its sole discretion, direct the proxy holders to:
• Sell or dispose of, in any manner, capital assets or the business of QNA;
• Pledge, mortgage or encumber assets of QNA for purposes other than obtaining working capital or funds for capital improvements;
• Merge, consolidate, reorganise or dissolve QNA;
• File or make any petition under the federal bankruptcy laws or similar law or statute of any state or any foreign country.
The proxy holders cannot carry out any of the above without QinetiQ’s express approval. Unlike minority interest holders with protective veto rights, QinetiQ can unilaterally require the above to be carried out and these are, therefore, considered to be to significant participative features. In addition, QinetiQ can require the payment of dividends, and the pay-down of parent company loans, from QNA.
The parties are presently in the process of revising and modernising the proxy agreement in order that it continues to best reflect the relevant shareholder and security interests of the parties.

44 QinetiQ Group plc Annual Report and Accounts 2012
COrPOrATE GOvErNANCE
remuneration report
IntroductionI am pleased to present the Remuneration Committee’s report on Directors’ remuneration for the year to 31 March 2012.
The primary objectives of our remuneration policy remain unchanged:
• To attract and retain top talent;• To incentivise key executives and
managers;• To drive superior performance in both
the short and long term; and • To align with the interests of
shareholders.
Over the past two years the Company has created and implemented a self-help programme to support its transformation, and the effectiveness of that programme is reflected in this year’s business results. As the Company progresses to the next stage in its business development, the Remuneration Committee proposes to ensure that the compensation structures and packages for the Executive Directors are appropriate to meet future business challenges. The Value Sharing Plan (VSP) was designed for the Company’s self-help phase and was considered to be a time bound Long-term Incentive Plan (LTIP). The next phase for the Company aims at resumption of growth, both in the UK and the US, despite defence markets forecast to be flat or falling, and therefore a revised LTIP has been designed to align with this phase.
Accordingly, with input from its advisors, Towers Watson, the Remuneration Committee undertook a market review and developed a revised compensation package which was reviewed and discussed
with major shareholders. Shareholders expressed two key concerns: the need for simplification of, and increased transparency around, how compensation is calculated. After receiving investor feedback and reflecting on the package, the Remuneration Committee concluded the following approach to Executive Directors’ remuneration effective for the financial year 2013 and for the future:
Base salary• The Board has determined that base
salaries will increase for the CFO by 2.7% and the CEO by 3%, effective 1 July 2012, taking into account the general direction of Company remuneration.
Annual bonus• When determining the level of bonus
opportunity available to Executive Directors, the Committee has set stretching business and personal objectives to ensure that the rewards are only achieved for strong performance relative to market conditions.
• The maximum bonus opportunity for excellent performance is increased from 125% to 150% of base salary for the CEO and CFO to align them competitively with their peer group and to compensate in part for the reduced LTIP opportunity arising with the move from the VSP to the new PSP;
• On-target bonus is set at 50% of the maximum bonus, again to bring closer alignment with the peer group. This results in an on-target bonus opportunity of 75% of base salary.
Long-term Incentive Plans• The Value Sharing Plan (under which
awards were made in 2010/11 and
2011/12) is replaced by a revised Performance Share Plan (PSP), subject to shareholder approval at the 2012 Annual General Meeting, building on the structure still in use for the broader management group. This caps the maximum potential award at 200% of base salary, although the intention is to normally set the awards at 150% of base salary;
• The PSP performance measures will be EPS and TSR, equally weighted, which have been endorsed by shareholders:• EPS – the threshold level of growth is
set at 3% CAGR (measured over three years) when 25% of the award would vest, with 100% vesting occurring once 10% CAGR (measured over three years) is achieved. This represents a challenging growth target given the context of the flat to falling defence markets in which the Group operates;
• TSR – relative TSR measured against the FTSE250 index (minus investment trusts). The threshold is set at median performance when 30% of the shares would vest, with 100% vesting upon achieving upper quartile performance.
• The maximum allocation for matching shares under the Deferred Annual Bonus Plan (DAB) remains unchanged at 50% of any bonus paid. The mandatory bonus deferment will be increased, however, to 50% to enhance alignment with shareholder interests. There will be no element of voluntary deferral;
• The DAB and PSP will be managed separately;
• The EPS performance measure in the DAB will be the same as for the PSP.
“ The key purpose of the Committee is to ensure that the remuneration structure supports the Company’s strategy and that we are able to attract, retain and motivate the highest calibre executives by rewarding the creation of long-term sustainable value.”Noreen Doyle, Chair, Remuneration Committee

Business review Corporate governance Financial statements
QinetiQ Group plc Annual Report and Accounts 2012 45
Details of the proposed changes to the long-term incentive plans are contained in the Notice of Annual General Meeting.
Assuming that the annual bonus pays out at target and 50% vesting for LTIPs, 60% of Executive Directors’ compensation (excluding pension contributions) is linked to performance-driven variable pay, based on the proposed changes outlined above.
To help promote transparency, we have set out clearly the elements that make up the Executive Directors’ pay in this report as well as explaining the approach taken to benchmarking Executive remuneration.
Noreen Doyle Chair, remuneration Committee 24 May 2012
report of the remuneration CommitteeThe following Report of the Remuneration Committee has been approved by the Board for submission to shareholders.
The Report covers the remuneration of Directors and includes specific disclosures relating to their compensation, shares and other interests. The report also describes the share-based incentive plans available to Executive Directors and to other employees. This report has been prepared and, where appropriate, audited, in accordance with the requirements of the Large and Medium-sized Companies and Groups (Accounts and Reports) Regulations 2008 and the FSA Listing Rules.
MembershipThe following Non-executive Directors were members of the Remuneration Committee during 2011/12:
• Noreen Doyle (Chair, Remuneration Committee)
• Mark Elliott (Group Chairman) • Colin Balmer• Admiral Sir James Burnell-Nugent• Paul Murray• Michael Harper (from 22 November 2011)
All Non-executive Directors became members of the Committee in September 2011, except for Sir David Lees.
The full Terms of Reference of the Committee can be found on the QinetiQ website (www.QinetiQ.com). Copies are also available on request.
Governance The Committee is chaired by Noreen Doyle and all its members are Non-executive Directors. In the financial year 2011/12, the Committee met six times.
During the year, the Committee received advice from its appointed independent advisors, Towers Watson, who also provided market data and advised on the comparator group’s TSR so that the Committee could decide whether share plan performance targets had been met.
The Group Chief Executive, Group HR Director and Head of Reward also provided information and advice to the Committee.
Directors’ remuneration policyThe Committee aims to maintain a remuneration policy, consistent with the Company’s business strategy and objectives, which:
• Attracts, retains and motivates individuals of high calibre;
• Is responsive to both Company and personal performance;
• Is competitive within relevant employment markets.
The remuneration policy is built on the following philosophy:
• Remuneration packages are structured to support business strategy and conform to current best practice;
• Appropriate rewards are given for meeting specific target objectives set at the beginning of each year;
• Incremental compensation is achieved for attaining stretching performance targets;
• Objectives are measured on metrics designed to be consistent with sustainable long-term business performance;
• To monitor pay and employment conditions elsewhere in the Group.
The total remuneration levels of the Executive Directors are reviewed annually by the Committee, taking into account:
• Performance of the Executive against specific targets;
• Competitive market practice and remuneration levels; and
• The general economic environment.
ActivitiesDuring 2011/12 the Committee meetings covered a number of topics including:
April • Executive Directors’ 2011/12 bonuses• 2011/12 performance targets
May • Executive Directors’ salary reviews• Directors’ Remuneration Report• Executive team salary reviews and 2011/12 bonuses• Long-term incentive plan awards under the Value Sharing Plan and Performance Share Plan• Review of performance metric for share options made in 2008• Review of performance metric for Restricted Stock Unit Plan vesting (applies only to US executives)
August • Awards under Restricted Stock Unit plan• Review of performance metrics for share awards made in 2008 (PSP)
November • Executive team shareholdings January • Executive incentive structure
• Remuneration Committee programme for the yearMarch • Executive team salary reviews
• Group incentive scheme targets• Deferred Annual Bonus Plan participation• Executive Directors’ salary reviews

46 QinetiQ Group plc Annual Report and Accounts 2012
remuneration report Continued
Each year, the packages are benchmarked independently by our advisors, Towers Watson, using two comparator groups: one group is based on market capitalisation and revenue and the second group is
sector specific. The first group is used as the primary reference with cross checking against the second group to capture any industry-specific features; there are about 20 companies in each group. The
lower quartile, mid-market and upper quartile reference points are captured and the packages of the CEO and CFO are benchmarked against them to ensure they remain competitive.
remuneration packageThe Executive Directors’ remuneration package is made up of the following components:
Base SalaryAnnual Bonus
& DeferredBonus Plan
Long-TermIncen�ves:
Share Awards
Benefits:Pension, CarAllowance
Remunera�on Package
Performance driven
Base salary
Annual salary 2012/13 2011/12
Leo Quinn £597,400 £580,000David Mellors £380,000 £370,000
Annual bonus
% of salaryOn-target payment
Maximum payment
2011/12 Actual bonus
earned
Leo Quinn 50% 125% 125%David Mellors 50% 125% 125%
Based on the market review, salary increases of £10,000 pa (2.7%) were approved for the CFO and £17,400 (3%) for the CEO respectively, effective 1 July 2012, to maintain their competitiveness.
Executive Directors participate in an annual bonus plan which is non-pensionable. Bonuses are linked to Group performance targets for operating profit; operating cash flow; and underlying EPS. The resulting annual cash bonus also takes into account performance against personal objectives. The 2011/12 bonus potential and actual
awards are set out above, expressed as a percentage of salary.
In 2011/12 the stretching financial targets were exceeded along with strong cash flows and continuing cost reductions. This performance drove the bonus achievement set out above and also in the Directors’ Remuneration table later in this report.
For 2012/13, the on-target and maximum bonus opportunities were increased to 75% and 150% of base salary, respectively, to bring alignment with the competitive market.
Part of all annual cash bonuses earned are deferred and paid in shares, as described in the following section.
Deferred Annual Bonus Plan (DAB) The Deferred Annual Bonus Plan aligns the interests of Executives with shareholders and aids retention of key individuals by ensuring that Executives are incentivised to take part of their annual bonus awards in shares rather than in cash.
Executive Directors have a mandatory deferral of 40% of any bonus earned and may voluntarily defer an additional 10%, giving a maximum deferral of up to 50% of their bonus into QinetiQ shares. Any deferred bonus will be matched based on EPS performance, up to a maximum match of 100% of the deferred element. After the review of Executive salary and incentive plans, for 2012/13, the mandatory deferral will be increased to 50% of any bonus earned, with no voluntary deferral, to complement the increased annual bonus target opportunities, outlined above.
In order for the matching shares to vest, EPS growth, measured over three years, must exceed defined targets: for awards made in the financial year 2011/12, EPS must grow by at least 22.5% over three years for any matching shares to vest, at which

Business review Corporate governance Financial statements
QinetiQ Group plc Annual Report and Accounts 2012 47
Example:Profit Before TaxQinetiQ’s average market capitalisation over the three months to 31 March 2011 was £851m. Group adjusted PBT for the financial year ended 31 March 2011 was £105.5m. Market capitalisation as a (fixed) multiple of PBT for 2011 VSP awards is, therefore, 8.1 (= £851m/£105.5m). Assume Group adjusted PBT for the financial year ending 31 March 2014 is £140m, and dividends to shareholders over the three-year period amount to £70m.
Additional shareholder value based on PBT is therefore:
PBT in 2014 of £140m multiplied by the fixed multiple of 8.1 equals a value of £1,134m (= £140m x 8.1) plus £70m (paid dividends) equals £1,204m (= £1,134m +£70m) less hurdle rate of £1,087m (= £851m x (1+8.5%)3) equals additional shareholder value for PBT element of award of £117m (=£1,204m – £1,087m).
In this example, the Executive would receive therefore 58,500 shares based on PBT (= £117m x 1,000 shares per £1m x 50% of award based on PBT).
Example:Total Shareholder returnQinetiQ’s average market capitalisation over the three months to 31 March 2011 was £851m. Assume that QinetiQ’s TSR over the period is 30%, the TSR for the FTSE250 index is 20% and the Executive receives 1,000 shares per £1m ASV.
Additional shareholder value based on TSR is therefore:
QinetiQ TSR out-performance of 10% (= 30% – 20%) multiplied by QinetiQ market capitalisation of £851m equals additional shareholder value based on TSR of £85.1m (=10% x £851m).
In this example, the Executive would receive therefore 42,550 shares based on TSR (= £85.1m x 1,000 shares per £1m x 50% of award based on TSR).
point deferred shares will be matched with one share for every four deferred. Vesting increases pro rata to EPS growth up to a maximum match of one share for every one deferred if EPS growth of 52% is achieved over three years, as illustrated.
Awards are in the form of matching shares delivered after three years, subject to the achievement of the EPS-based performance conditions.
100%
25%
22.5% 52%EPS performance
Three-year EPS absolute growthAward ves�ng
Long-term incentives for Executive DirectorsThe objective of QinetiQ’s long-term incentive programmes for Executive Directors is to align their rewards with returns to shareholders by a focus on increasing shareholder value over the medium to long term.
In addition to the DAB, Executive Directors are eligible for long-term incentives which have taken two forms: The Value Sharing Plan (VSP) and the Performance Share Plan (PSP). An Executive Director who is granted an award under the VSP may not also be granted an award under the PSP for the same granting year and vice versa.
These are the principal means for long-term incentivisation of the Executive Directors and the direct reports of the CEO. The Committee considered various performance conditions and determined that the criteria set out below were appropriate to incentivise the long-term creation of shareholder value for 2011/12.
value Sharing Plan (vSP)The Value Sharing Plan was approved by shareholders in July 2010. It is an annual, long-term incentive plan designed for the Company’s self-help phase, focusing on shareholder value creation, and was considered to be time bound.
Leo Quinn, David Mellors and a limited number of senior executives participate in the VSP, which rewards executives with a certain number of shares for every £1m of value created over and above three-year performance hurdles.
On 26 May 2011, Leo Quinn was granted an award under which he will be entitled to receive 1,800 QinetiQ Group shares for each £1m of additional shareholder value (ASV) created (above a hurdle) in respect of the performance period beginning on 1 April 2011. On the same date, David Mellors was granted an award under which he will be entitled to receive 900 QinetiQ Group shares for each £1m of additional shareholder value created in respect of the same performance period. For 2011/12, the VSP awards were weighted equally between the two performance indicators: 50% total shareholder return (TSR) and 50% profit before tax (PBT).
Under the 2011/12 VSP award, additional shareholder value created is measured in two ways:
• Total Shareholder return (TSr) – 50% of the award will depend on QinetiQ’s TSR out-performance of the FTSE250 index (excluding investment trusts). Participants will be entitled to a vesting of shares under the TSR element only if the Committee is also satisfied that this is justified by the underlying financial performance of the Company over the performance period.
• Profit Before Tax (PBT) – the remaining 50% of each award will be determined by PBT growth above the cost of equity of 8.5% a year, adjusted by the dividend yield.
Examples are shown below.

48 QinetiQ Group plc Annual Report and Accounts 2012
remuneration report Continued
Performance Share Plan (2007) (PSP)There were no awards of performance shares under the PSP to Executive Directors in 2011/12, although awards remain outstanding from prior years.
PSP awards are contingent on meeting pre-determined performance criteria. Individual participants’ award levels are determined by the Committee annually, based on these criteria, and with due consideration of business and personal performance.
Executive Directors are eligible to receive awards with a value of up to 100% of base salary per annum and other executives up to 75% of base salary per annum. Awards are earned based on an equal weighting of relative total shareholder return (TSR) performance and absolute underlying earnings per share (EPS) growth.
The EPS performance criterion for the PSP awards that were made in 2009/10 and earlier years was the same as that applied to the DAB (outlined above).
TSR performance for the purposes of PSP awards made in 2009/10 and earlier years is measured against the constituents of a sectoral peer group of companies.
The TSR element is earned only if relative performance is at least at median against this comparator group over a three-year performance period, calculated by an independent third party. The graph below illustrates the TSR performance condition.
100%
30%
Median Upper quar�leTSR performance
Performance vs comparatorsAward ves�ng
Directors’ terms and conditionsService agreements for the Executive and the Non-executive Directors are reviewed annually and amended as appropriate.
Date of most recent Service Agreement Date of appointment
Executive DirectorsLeo Quinn 28 October 2009 November 2009David Mellors 20 May 2008 August 2008Non-executive DirectorsMark Elliott (Group Chairman) 10 February 2010 June 2009Colin Balmer 20 January 2006 February 2003Noreen Doyle 20 January 2006 October 2005 Admiral Sir James Burnell-Nugent 10 April 2010 April 2010Paul Murray 25 October 2010 October 2010Michael Harper1 22 November 2011 November 2011Former Directors Admiral Ed Giambastiani2 31 January 2008 February 2008David Langstaff3 4 August 2009 September 2009Sir David Lees4 20 January 2006 August 2005
1 Michael Harper was appointed to the Board on 22 November 2011.2 Admiral Ed Giambastiani resigned from the Board on 2 August 2011. 3 David Langstaff resigned from the Board on 18 April 2011.4 Sir David Lees resigned from the Board on 31 January 2012.
Personal shareholding policyThe Committee believes that a meaningful way to align Executives’ interests with those of shareholders is for the Executives to build up and retain a personal holding in QinetiQ shares. During 2011/12, the Committee reviewed the executive shareholding policy and increased the length of time allowed to accumulate the required shareholding from four to five years to follow market norms.
The CEO and CFO are required to hold shares in QinetiQ with a value equivalent to one times their base salary in QinetiQ shares.
David Mellors, who joined on 20 August 2008, has been given five years to build up such a shareholding. Leo Quinn has already met the Committee’s guideline on minimum shareholding requirement.
Direct reports of the CEO are required to hold the equivalent of 50% of their base salary in QinetiQ shares. These can be
accumulated over a five-year period following appointment.
Benefits Benefits include a pension or contribution in lieu, car allowance, health insurance, life assurance and membership of the Group’s employee Share Incentive Plan, which is open to all UK employees.
The Group’s policy is to offer all UK employees membership in the QinetiQ Pension Scheme, as described in note 30 to the financial statements. Executives whose benefits are likely to exceed the Lifetime Allowance may opt out of the QinetiQ Pension Plan. In such cases, the individual will be paid a supplement in lieu of pension contributions.
In 2011/12, Leo Quinn received contributions of 25% of base salary (£145,000) in lieu of a pension. David Mellors is a member of the Company’s

Business review Corporate governance Financial statements
QinetiQ Group plc Annual Report and Accounts 2012 49
DC pension scheme and the Company contributes 20% of base salary with any contributions above the annual allowance of £50,000 paid as cash in lieu of pension.
Directors’ terms and conditionsQinetiQ’s policy is that Executive Directors should have service agreements with a rolling term providing for a maximum of one year’s notice. Consequently, Executive Directors do not have a contractual notice period in excess of 12 months. In the event of early termination, this ensures that compensation is restricted to a maximum of 12 months’ basic salary and benefits. The Committee will generally consider mitigation to reduce the compensation payable to a departing Executive Director.
Non-executive Directors’ letters of appointment are renewed on a rolling 12-month basis subject to reappointment at the Annual General Meeting. There are no provisions for compensation on early termination.
Non-executive Directors’ feesThe Group Chairman reviews the fees of the Non-executive Directors, other than his own, and makes recommendations to the Board. Non-executive Directors receive additional fees as agreed by the Board for chairing Board committees to take account of the additional responsibilities of the role. The Chairman’s fees are reviewed by the Senior Independent Non-executive Director who makes recommendations to the Board.
The level of fees paid by UK organisations of a similar size and complexity to QinetiQ is considered in setting the remuneration policy for Non-executive Directors. The fees are neither performance related nor pensionable. Non-executive Directors are not eligible to participate in bonus, profit sharing or employee share schemes.
A review of Non-executive Directors’ fees was carried out in July 2010, using an independent market survey, which resulted in no changes being made to the existing fee structures as shown in the table below.
As the Group Chairman is a US resident, the Board has agreed an accommodation allowance of £75,000 per annum.
Excluding the Group Chairman, an additional fee of US$4,000 is payable to US-resident Non-executive Directors when they attend Board Meetings in the UK. With effect from 29 July 2010, to align UK Non-executive Directors with US-resident Non-executive Directors, UK-resident Non-executive Directors are paid an additional fee of £2,500 for attending meetings held in the USA.
Management of share-based rewardsThe Committee also oversees arrangements for share-based rewards in respect of managers and the wider workforce.
Employee plansThe Share Incentive Plan is operated in the UK and Australia in the form of a share purchase award with a matching Company contribution to encourage employee ownership and engagement in the business.
Executive plansIn addition to the VSP and PSP, the Company operates the following executive share plans:
• QinetiQ Share Option Scheme (QSOS) – no awards were made during the year under QSOS but provision exists for annual awards up to a face value of 300% of salary;
• Stock Award Plan – restricted Stock units (rSu) – RSU awards are used in QinetiQ North America to retain and motivate senior managers. The RSU awards vest in four equal tranches over a four-year period. Vesting of half of the award is subject to time-based vesting criteria and vesting of the other half is subject to performance criteria linked to organic profit growth, as in the table below.
Awards are granted based on business performance, balanced with the need to attract, retain and motivate high- calibre employees.
Executive Directors do not participate in the two executive plans above.
Dilution limits In accordance with ABI guidelines, no more than 10% of the Company’s issued share capital will be used under all of the Company’s share schemes during a ten-year period. The dilution as at 31 March 2012 was significantly below this 10% level, and below 5% in respect of executive schemes. In addition, the Board intends to continue to satisfy a proportion of awards with purchased shares held in an employee benefit trust.
Performance graphThe graph below shows the Company’s TSR over the period from flotation to 31 March 2012 compared to the FTSE250 index over the same period based on spot values.
Non-executive Directors’ fees
2012 fees
Non-executive Chairman £225,000Basic fee for UK Non-executive Director £40,000Basic fee for US-resident Non-executive Director US$100,000
or £50,000Additional fee for chairing a Committee £7,000Additional fee to Deputy Chairman/Senior Independent Non-executive Director £10,000
Stock Award Plan – restricted Stock units
% Organic operating income growth achieved % RSU Award Vesting
<5% 0%
5% – 12.5% Between 25% – 100% (linear)>12.5% – 15% 100% – 125% (linear)
Valu
e of
£10
0 ho
ldin
g
FTSE Mid 250
QinetiQ
0
50
100
150
Mar-12Mar-11Mar-10Mar-09Mar-08Mar-07

50 QinetiQ Group plc Annual Report and Accounts 2012
remuneration report Continued
Audited informationDirectors’ remuneration The information about Directors’ remuneration and Directors’ interests on pages 50 to 52 has been audited.
The table below shows the aggregate remuneration of the Directors for the year ended 31 March 2012.
Salary/feesa BonusbOther
benefitscPayment in lieu
of pensionTotal 2012
Total 2011
Executive Directors Leo Quinn £580,000 £725,000 £45,284 £145,000 £1,495,284 £1,327,156David Mellorsd £352,500 £462,500 £20,567 £31,077 £866,644 £617,800Non-executive Directors Mark Elliott (Group Chairman) £225,000 – £75,000 – £300,000 £300,000Colin Balmer £46,167 – – – £46,167 £45,000Noreen Doyle £52,000 – – – £52,000 £52,000Paul Murray £52,000 – – – £52,000 £17,436Admiral Sir James Burnell-Nugent £45,000 – – – £45,000 £41,931Michael Harpere £18,577 – – – £18,577 –Former Directors Graham Lovef – – – – – £100,000Nick Luffg – – – – – £35,250Sir David Leesh £55,834 – – – £55,834 £64,000Admiral Ed Giambastianii £21,292 – – – £21,292 £79,652David Langstaffj £2,115 – – – £2,115 £65,538Total

Business review Corporate governance Financial statements
QinetiQ Group plc Annual Report and Accounts 2012 51
Interests of Executive Directors under long-term incentive share plans as at 31 March 2012
Grant date
Number at 1 April
2011 (maximum
potential of awards)
Granted in year
(maximum potential of
awards)
Exercised/vested in year
Lapsed in year
Number at 31 March
2012
Market price on date of grant
Earliest vest date
Latest vest date
Leo Quinn Matching award TSR3 16/12/09 362,844 – – – 362,844 165p1 01/06/13 01/06/13Matching award EPS3 16/12/09 362,845 – – – 362,845 165p1 01/06/13 01/06/13PSP Mirror TSR3 16/12/09 210,450 – – – 210,450 165p1 01/06/13 01/06/13PSP Mirror EPS3 16/12/09 210,450 – – – 210,450 165p1 01/06/13 01/06/13VSP TSR 29/07/10 271,800 – – – 271,800 – 29/07/13 29/07/13VSP TSR 29/07/10 271,800 – – – 271,800 – 29/07/14 29/07/14VSP PBT 29/07/10 634,200 – – – 634,200 – 29/07/13 29/07/13VSP PBT 29/07/10 634,200 – – – 634,200 – 29/07/14 29/07/14VSP TSR 26/05/11 – 382,950 – – 382,950 – 26/05/14 26/05/14VSP TSR 26/05/11 – 382,950 – – 382,950 – 26/05/15 26/05/15VSP PBT 26/05/11 – 382,950 – – 382,950 – 26/05/14 26/05/14VSP PBT 26/05/11 – 382,950 – – 382,950 – 26/05/15 26/05/15DAB Match 01/07/11 – 226,777 226,777 – 01/07/14 01/07/14David Mellors PSP TSR 07/08/08 75,567 – – 75,567 – 217.8p2 07/08/11 07/08/11PSP EPS 07/08/08 75,567 – – 75,567 – 217.8p2 07/08/11 07/08/11PSP TSR 04/08/09 100,000 – – – 100,000 135.0p 04/08/12 04/08/12PSP EPS 04/08/09 100,000 – – – 100,000 135.0p 04/08/12 04/08/12DAB Match 01/07/09 6,859 – 6,859 144.7p 01/07/12 01/07/12VSP TSR 29/07/10 135,900 – – – 135,900 – 29/07/13 29/07/13VSP TSR 29/07/10 135,900 – – – 135,900 – 29/07/14 29/07/14VSP PBT 29/07/10 317,100 – – – 317,100 – 29/07/13 29/07/13VSP PBT 29/07/10 317,100 – – – 317,100 – 29/07/14 29/07/14VSP TSR 26/05/11 – 191,475 – – 191,475 – 26/05/14 26/05/14VSP TSR 26/05/11 – 191,475 – – 191,475 – 26/05/15 26/05/15VSP PBT 26/05/11 – 191,475 – – 191,475 – 26/05/14 26/05/14VSP PBT 26/05/11 – 191,475 – – 191,475 – 26/05/15 26/05/15DAB Match 01/07/11 – 70,379 – – 70,379 – 01/07/14 01/07/14 Total 4,222,582 2,594,856 – 151,134 6,666,304
1 Shares awarded to the CEO in 2009 were based on an average market price of 138p representing the average price over the ten days before joining.2 Shares awarded to the CFO in 2008 were based on a market price of 198.5p, as at 7 August 2008.3 On appointment the CEO was granted a mirror PSP award, subject to the same EPS and TSR performance conditions as above. In addition, the CEO invested
c. £1m in QinetiQ shares, for which he received an additional matching PSP award, subject to the same EPS and TSR performance conditions.
The interests in the table above are subject to the performance conditions described in note 29. The price of a QinetiQ share at 31 March 2012 was 159.3p. The highest and lowest prices of a QinetiQ share during the year ended 31 March 2012 were 159.8p and 96.75p respectively.
There have been no changes to the interests shown above between 31 March 2012 and 22 May 2012.
Executive Directors’ interest in the All-Employee Share Incentive Plan (SIP)
Interest as at 1 April
2011
Partnership and dividend
shares acquired
during year
Interest as at 31 March
2012Interest as at 22 May 2012
Leo Quinn 1,146 1,252 2,398 2,567David Mellors 2,313 1,282 3,595 3,764
The SIP is HMRC approved and under the plan rules, matching shares are not awarded until the three year time condition has been satisfied. These shares are not, therefore, included in the above table.

52 QinetiQ Group plc Annual Report and Accounts 2012
remuneration report Continued
Interests of Directors in office as at 31 March 2012 (including shares held under SIP and DAB)
Number 1p ordinary
shares held at 22 May 2012
Number 1p ordinary
shares held at 31 March 2012
Number 1p ordinary
shares held at 1 April 2011
Executive DirectorsLeo Quinn 882,942 882,716 654,285David Mellors 98,725 98,500 26,126Non-executive DirectorsMark Elliott 125,000 125,000 125,000Colin Balmer 7,662 7,662 7,662Noreen Doyle 24,662 24,662 24,662Admiral Sir James Burnell-Nugent 11,419 11,419 11,419Paul Murray 56,077 56,077 56,077Michael Harper1 10,000 10,000 n/aFormer DirectorsDavid Langstaff2 n/a n/a 52,000Sir David Lees3 n/a n/a 100,000Admiral Ed Giambastiani4 n/a n/a 5,232
1 Michael Harper was appointed to the Board on 22 November 2011. 2 David Langstaff resigned from the Board on 18 April 2011.3 Sir David Lees resigned from the Board on 31 January 2012.4 Admiral Ed Giambastiani resigned from the Board on 2 August 2011.

Business review Corporate governance Financial statements
QinetiQ Group plc Annual Report and Accounts 2012 53
COrPOrATE GOvErNANCE
other statutory information
Principal activityQinetiQ Group plc is a public limited company, listed on the London Stock Exchange and incorporated in England and Wales with registered number 4586941.
QinetiQ Group plc is the parent company of a group whose principal activities during the year were the supply of technical support, training, test and evaluation, and know-how to customers in the global defence, aerospace and security markets. Customers include government organisations, such as the UK MOD and the US DoD and a range of other government and commercial customers globally.
research and developmentOne of the Group’s principal business streams is the provision of funded research and development (R&D) for customers. The Group also invests in the commercialisation of promising technologies across all areas of business.
The majority of R&D-related expenditure is incurred on behalf of customers as part of specific funded research contracts. R&D costs are included in the income statement and R&D income is reflected within revenue. In the financial year, the Group recorded £346.3m (2011: £395.0m) of total R&D-related expenditure, of which £331.1m (2011: £382.0m) was customer-funded work.
In the year to 31 March 2012, £15.2m (2011: £13.0m) of internally funded R&D was charged to the income statement. £0.3m (2011: £0.3m) of late-stage development costs was capitalised and £2.3m (2011: £2.2m) of capitalised development costs was amortised in the year.
Policy and practice on payment of suppliersThe policy of the Group is to agree terms of payment prior to commencing trade with a supplier and to abide by those terms based on the timely submission of satisfactory invoices. The Group has a policy of agreeing payment terms of not less than 60 days with suppliers, except in exceptional circumstances. At 31 March 2012, the trade payables of the Group represented 24 days of annual purchases (2011: 24 days).
Political and charitable contributionsQinetiQ does not make political donations to parties as that term would be commonly recognised. The legal definition of that term is, however, quite broad and may have the effect of covering a number of normal business activities, such as sponsorship of events, that would not commonly be perceived to be political donations, such as sponsorship of events.
These may include legitimate interactions in making MPs and others in the political world aware of key industry issues and matters that affect QinetiQ, and that make an important contribution to their understanding of QinetiQ, the markets in which it operates, and the work of their constituents.
Charitable donations during the year across the Group amounted to £108,400 (2011: £196,900).
Share capitalAs at 31 March 2012, the Company had allotted and fully paid up share capital of 660,476,373 ordinary shares of 1p each with an aggregate nominal value of £6.6m (including shares held by employee share trusts) and one Special Share with an aggregate nominal value of £1.
Details of the shares in issue during the financial year are shown in note 28 on page 94.
The rights of ordinary shareholders are set out in the Articles of Association. The holders of ordinary shares are entitled to receive the Company’s reports and accounts, to attend and speak at General Meetings of the Company, to exercise voting rights in person or by appointing a proxy, and to receive a dividend where declared or paid out of profits available for that purpose.
The Special Share is held by HM Government through the Secretary of State for Defence and it confers certain rights under the Articles of Association which are detailed in note 28 on page 94. These include the right to require certain persons with a material interest in QinetiQ to dispose of some or all of their ordinary shares on the grounds of national security or conflict of interest. The Special Share may only be held by and transferred to HM Government. At any time the Special Shareholder may require QinetiQ to redeem the share at par and, if wound up, the Special Shareholder would be entitled to be repaid capital before other shareholders. Any variation of the rights attaching to the Special Share requires the written approval of the MOD.
In March 2012, the Company obtained MOD agreement to changes in the Special Shareholder rights which are subject to shareholder approval at the 2012 Annual General Meeting. These include removal of the MOD’s right to veto any transaction or activity and the introduction of a generic compliance system in alignment with that followed by other defence companies.

54 QinetiQ Group plc Annual Report and Accounts 2012
OTHEr STATuTOry INFOrMATION CONTINuED
Directors’ interests in contractsAt the date of this Report, there is no contract or arrangement with the Company or any of its subsidiaries that is significant in relation to the business of the Group as a whole in which a Director of the Company is materially interested.
Change of control – significant agreementsThe following significant agreements contain provisions entitling the counterparties to require prior approval, exercise termination, alteration, or other similar rights in the event of a change of control of the Company, or if the Company ceases to be a UK company:
• The Combined Aerial Target Service contract is a 20-year contract awarded to QinetiQ by the MOD on 14 December 2006. The terms of this contract require QinetiQ Limited to remain a UK company which is incorporated under the laws of any part of the UK, or an overseas company registered in the UK, and that at least 50% of the Board of Directors are UK nationals. The terms also contain change of control conditions and restricted share transfer conditions which require prior approval from HM Government if there is a material change in the ownership of QinetiQ Limited’s share capital, unless the change relates to shares listed on a regulated market – ‘material’ is defined as being 10% or more of the share capital. In addition, there are restrictions on transfers of shares to persons from countries appearing on the restricted list as issued by HM Government;
• The Long-Term Partnering Agreement (LTPA) is a 25-year contract, which QinetiQ Limited signed on 28 February 2003, to provide test, evaluation and training services to the MOD. This contract contains conditions under which the prior approval of HM Government is required if the contractor, QinetiQ Limited, ceases to be a subsidiary of the QinetiQ Group, except where such change in control is permitted under the Shareholders Agreement to which the MOD is a party.
The Company is party to a multi-currency Revolving Credit Facility, with a US$250m tranche and a £118m tranche, provided by the Group’s six global relationship banks, that expires on 4 February 2016. Under the terms of the facility, if there is a change of control of the Company, any lender may request, by not less than 60 days’ notice to the Company, that its commitment be cancelled and all outstanding amounts be repaid to that lender at the expiry of such notice period.
On 6 December 2006, QinetiQ US Holdings, Inc., formerly known as QinetiQ North America, Inc. (as Borrower) and the Company (as Guarantor) entered into a Note Purchase Agreement to issue US$125m 5.50% Senior Notes due 6 December 2016. Under the terms of the agreement, if either (1) the MOD ceases to retain in its capacity as Special Shareholder its Special Shareholders Rights; or (2) there is a change of control of the Company; and in either case where there has been a rating downgrade, or where there are no rated securities (unless a rating of at least investment grade is not obtained within 90 days of the change of control), the Notes must be offered for prepayment by the Company within 21 days of the change of control. The prepayment date would be no later than 45 days after the offer of prepayment by the Company.
On 5 February 2009, QinetiQ US Holdings, Inc., (as Borrower) and the Company (as Guarantor) entered into a Note Purchase Agreement to issue US$62m 7.13% Senior Notes due 5 February 2016 and US$238m 7.62% Senior Notes due 5 February 2019. Under the terms of the agreement, if either (1) the MOD ceases to retain in its capacity as Special Shareholder its Special Shareholders Rights; or (2) there is a change of control of the Company, the Notes must be offered for prepayment within 21 days of the change of control. The prepayment date would be no later than 45 days after the offer of prepayment by the Company.
Financial instrumentsInformation on the Group’s financial risk management objectives and policies, and its exposure to credit risk, liquidity risk, interest rate risk and foreign currency risk are in note 26 on page 85.
BranchesThe Company and its subsidiaries have established branches in a number of different countries in which they operate; their results are, however, not material to the Group’s financial results.
Major shareholdersAt 31 March 2012, the Group had been notified of the following shareholdings in accordance with the Vote Holder and Issuer Notification Rules, which form part of the Financial Services Authority’s Disclosure Rules and Transparency Rules:
ShareholderNumber of
shares
% of issued share
capital
Artisan Partners 99,071,684 15.00Ruane Cunniff & Goldfarb, Inc. 74,366,090 11.26Fidelity International Ltd 34,816,074 5.27Schroders 33,587,315 5.09Investec 33,160,928 5.02Fidelity Management and Research Company 32,986,143 4.99Norges Bank 19,850,508 3.01
At 22 May 2012, being the latest practicable date prior to the issue of this report, the Company had received no notification of any further interests or of any changes in the interests shown above.

Business review Corporate governance Financial statements
QinetiQ Group plc Annual Report and Accounts 2012 55
Allotment/purchase of own sharesAt the Company’s AGM held in August 2011, the shareholders passed resolutions which authorised the Directors to allot relevant securities up to an aggregate nominal value of £4,403,174 (£2,201,587 pursuant only to a rights issue), to disapply pre-emption rights (up to 5% of the issued ordinary share capital) and for the Company to purchase ordinary shares (up to 10% of its ordinary share capital). Equivalent resolutions will be laid before the 2012 AGM.
During the year, the Company provided funding to the QinetiQ Group plc Employee Benefit Trust (the ‘Trust’), which holds shares in connection with its employee share schemes, to make market purchases of the Company’s ordinary shares to cover future obligations under outstanding share-option and other share-based awards. Further details are disclosed in note 29 on page 95. As at 31 March 2012, the Trust held 11,672,209 ordinary shares of 1p each. The trustees of the Trust have agreed to waive their entitlement to dividends payable on the shares held by the Trust, other than in respect of deferred shares held on behalf of participants in the Company’s Deferred Annual Bonus Plan. Dividends received by the Trust in respect of the deferred shares are paid direct to the plan participants on receipt and are not retained in the Trust.
restrictions on transfer of sharesAs outlined in note 28 on page 94, the Special Share confers certain rights under the Company’s Articles of Association to require certain persons with an interest in QinetiQ’s shares that exceed certain prescribed thresholds, to dispose of some or all of their ordinary shares on the grounds of national security or conflict of interest.
Articles of AssociationSave in respect of any variation to the rights attaching to the Special Share, the Company has not adopted any special rules relating to the amendment of the Company’s Articles of Association, other than as provided under UK corporate law.
A resolution will be proposed at the 2012 AGM to amend the Company’s Articles of Association. Details are contained in the Notice of Meeting.
Employee Share SchemeEquiniti Share Plan Trustees Limited acts as trustee in respect of all ordinary shares held by employees under the QinetiQ Group plc Share Incentive Plan (‘the Plan’). Equiniti Share Plan Trustees Limited will send a Form of Direction to all employees who hold shares under the Plan, and will vote on all resolutions proposed at general meetings in accordance with the instructions received. In circumstances where ordinary shares are held by the corporate sponsored nominee service, Equiniti Corporate Nominees Limited will send a Proxy Form to all shareholders using such corporate nominee service, and will vote on all resolutions proposed at general meetings in accordance with the instructions received.
AuditorKPMG Audit Plc has expressed its willingness to continue in office as auditor and a resolution to reappoint them will be proposed at the AGM.
Statement of disclosure of information to the auditorThe Directors who held office at the date of approval of this Directors’ report have confirmed that, so far as the Directors are aware, there is no relevant audit information of which the Company’s auditor is unaware; and the Directors have taken all the steps they reasonably should have taken as Directors to make themselves aware of any relevant audit information and to establish that the Company’s auditor is aware of that information.
Annual General MeetingThe Company’s AGM will be held on Thursday 26 July 2012 at 1.00pm, at The Royal Berkshire Hotel, London Road, Sunninghill, Ascot, Berkshire, SL5 0PP. Details of the business to be proposed and voted on at the meeting is contained in the Notice of the Annual General Meeting, which is sent to all shareholders and is also published on the Company’s website, www.QinetiQ.com.
By order of the Board
Jon Messent Company Secretary Cody Technology Park Ively Road Farnborough Hampshire GU14 0LX
24 May 2012
56 QinetiQ Group plc Annual Report and Accounts 2012
statement of directors’ responsiBilities IN rESPECT OF THE ANNuAL rEPOrT AND FINANCIAL STATEMENTS
The Directors are responsible for preparing the Annual Report and the Group and parent company financial statements in accordance with applicable law and regulations.
Company law requires the Directors to prepare group and parent company financial statements for each financial year. Under that law they are required to prepare the Group financial statements in accordance with IFRSs as adopted by the EU and applicable law and have elected to prepare the parent company financial statements in accordance with UK Accounting Standards and applicable law (UK Generally Accepted Accounting Practice).
Under company law the Directors must not approve the financial statements unless they are satisfied that they give a true and fair view of the state of affairs of the Group and parent company and of their profit or loss for that period. In preparing each of the Group and parent company financial statements, the Directors are required to:
• Select suitable accounting policies and then apply them consistently;
• Make judgements and estimates that are reasonable and prudent;
• For the Group financial statements, state whether they have been prepared in accordance with IFRSs as adopted by the EU;
• For the parent company financial statements, state whether applicable UK Accounting Standards have been followed, subject to any material departures disclosed and explained in the parent company financial statements;
• Prepare the financial statements on the going concern basis unless it is inappropriate to presume that the Group and the parent company will continue in business.
The Directors are responsible for keeping adequate accounting records that are sufficient to show and explain the parent company’s transactions and disclose with reasonable accuracy at any time the financial position of the parent company and enable them to ensure that its financial statements comply with the Companies Act 2006. They have general responsibility for taking such steps as are reasonably open to them to safeguard the assets of the Group and to prevent and detect fraud and other irregularities.
Under applicable law and regulations, the Directors are also responsible for preparing a Directors’ report, Directors’ remuneration report and corporate governance statement that comply with that law and those regulations.
The Directors are responsible for the maintenance and integrity of the corporate and financial information included on the Company’s website. Legislation in the UK governing the preparation and dissemination of financial statements may differ from legislation in other jurisdictions.
responsibility statement of the Directors in respect of the Annual reportWe, the Directors of the Company, confirm that to the best of our knowledge:
• The financial statements of the Group have been prepared in accordance with IFRS as adopted by the EU, and for the Company under UK GAAP, in accordance with applicable United Kingdom law, and give a true and fair view of the assets, liabilities, financial position and profit or loss of the Group; and
• The Directors’ Report includes a fair review of the development and performance of the business and the position of the Group, together with a description of the principal risks and uncertainties that face the Group.
By order of the Board
Mark Elliott Chairman 24 May 2012
Leo Quinn Chief Executive Officer 24 May 2012
David Mellors Chief Financial Officer 24 May 2012

Business review Corporate governance Financial statements
QinetiQ Group plc Annual Report and Accounts 2012 57
independent auditor’s report to the memBers of QinetiQ group plcWe have audited the financial statements of QinetiQ Group plc for the year ended 31 March 2012 set out on pages 58 to 105. The financial reporting framework that has been applied in the preparation of the Group financial statements is applicable law and International Financial Reporting Standards (IFRSs) as adopted by the EU. The financial reporting framework that has been applied in the preparation of the parent company financial statements is applicable law and UK Accounting Standards (UK Generally Accepted Accounting Practice).
This report is made solely to the Company’s members, as a body, in accordance with Chapter 3 of Part 16 of the Companies Act 2006. Our audit work has been undertaken so that we might state to the Company’s members those matters we are required to state to them in an auditor’s report and for no other purpose. To the fullest extent permitted by law, we do not accept or assume responsibility to anyone other than the Company and the Company’s members, as a body, for our audit work, for this report, or for the opinions we have formed.
respective responsibilities of Directors and auditorAs explained more fully in the Directors’ responsibilities statement set out on page 56, the Directors are responsible for the preparation of the financial statements and for being satisfied that they give a true and fair view. Our responsibility is to audit, and express an opinion on, the financial statements in accordance with applicable law and International Standards on Auditing (UK and Ireland). Those standards require us to comply with the Auditing Practices Board’s (APB’s) Ethical Standards for Auditors.
Scope of the audit of the financial statementsA description of the scope of an audit of financial statements is provided on the APB’s website at www.frc.org.uk/apb/scope/private.cfm.
Opinion on financial statementsIn our opinion:

CONSOLIDATED INCOME STATEMENT for the year ended 31 March
58 QinetiQ Group plc Annual Report and Accounts 2012
2012 2011
all figures in £ million Note
Before acquisition
amortisation and specific
non-recurring items
Acquisition amortisation and specific
non-recurring items* Total
Before acquisition
amortisation and specific
non-recurring items
Acquisition amortisation and specific
non-recurring items* Total
Revenue 2, 3 1,469.6 – 1,469.6 1,702.6 – 1,702.6 Operating costs excluding depreciation and amortisation (1,273.9) 223.9 (1,050.0) (1,516.4) (58.5) (1,574.9)Other income 2 5.2 – 5.2 4.3 – 4.3 EBITDA (earnings before interest, tax, depreciation and amortisation) 200.9 223.9 424.8 190.5 (58.5) 132.0 Depreciation and impairment of property, plant and equipment 3, 15 (30.6) (1.9) (32.5) (33.6) (5.9) (39.5)Amortisation and impairment of intangible assets 14 (9.0) (20.3) (29.3) (11.5) (26.3) (37.8)Group operating profit/(loss) 3 161.3 201.7 363.0 145.4 (90.7) 54.7 Gain on business combinations and divestments and disposal of investments 5 – 11.6 11.6 – 2.7 2.7 Finance income 6 69.8 – 69.8 70.4 – 70.4 Finance expense 6 (112.8) – (112.8) (101.2) – (101.2)Profit/(loss) before tax 4 118.3 213.3 331.6 114.6 (88.0) 26.6 Taxation (expense)/income 7 (23.5) (50.2) (73.7) (21.8) 0.2 (21.6)Profit/(loss) for the year attributable to equity shareholders 94.8 163.1 257.9 92.8 (87.8) 5.0 Earnings per share Basic 11 14.6p 39.6p 14.2p 0.8pDiluted 11 14.5p 39.4p 14.0p 0.8p
* For details of ‘specific non-recurring items’ refer to note 4.

Business review Corporate governance Financial statements
CONSOLIDATED STATEMENT OF COMPREHENSIVE INCOME for the year ended 31 March
QinetiQ Group plc Annual Report and Accounts 2012 59
all figures in £ million 2012 2011 Profit for the year 257.9 5.0 Other comprehensive income/(expense): Foreign currency translation differences for foreign operations (1.9) (19.4)Movement in fair value of hedging derivatives (0.4) (0.4)Reclassification of hedging derivatives to the income statement 0.2 4.1 Movement in deferred tax on hedging derivatives 0.1 (4.8)Fair value losses on available-for-sale investments (1.2) – Actuarial loss recognised in defined benefit pension schemes (118.2) (4.7)Increase in deferred tax asset due to actuarial movement in pension deficit 30.7 1.3 Other comprehensive income/(expense) for the year, net of tax (90.7) (23.9)Total comprehensive income/(expense) for the year attributable to equity holders 167.2 (18.9)
CONSOLIDATED STATEMENT OF CHANGES IN EQUITY
all figures in £ million
Issued share
capital
Capital redemption
reserve Share
premium Hedge
reserve Translation
reserve Retained earnings Total
Non-controlling
interest Total equity At 1 April 2011 6.6 39.9 147.6 0.2 21.6 241.5 457.4 0.1 457.5 Profit for the year – – – – – 257.9 257.9 – 257.9 Other comprehensive income/ (expense) for the year, net of tax – – – (0.1) (1.9) (88.7) (90.7) – (90.7)Purchase of own shares – – – – – (12.0) (12.0) – (12.0)Dividends – – – – – (16.4) (16.4) – (16.4)Share-based payments – – – – – 3.1 3.1 – 3.1 At 31 March 2012 6.6 39.9 147.6 0.1 19.7 385.4 599.3 0.1 599.4 At 1 April 2010 6.6 39.9 147.6 (12.1) 54.4 237.2 473.6 0.1 473.7 Profit for the year – – – – – 5.0 5.0 – 5.0 Other comprehensive income/ (expense) for the year, net of tax – – – (1.1) (19.4) (3.4) (23.9) – (23.9)Transfers – – – 13.4 (13.4) – – – – Purchase of own shares – – – – – (0.6) (0.6) – (0.6)Share-based payments – – – – – 3.3 3.3 – 3.3 At 31 March 2011 6.6 39.9 147.6 0.2 21.6 241.5 457.4 0.1 457.5
QinetiQ Group plc Annual Report and Accounts 2012
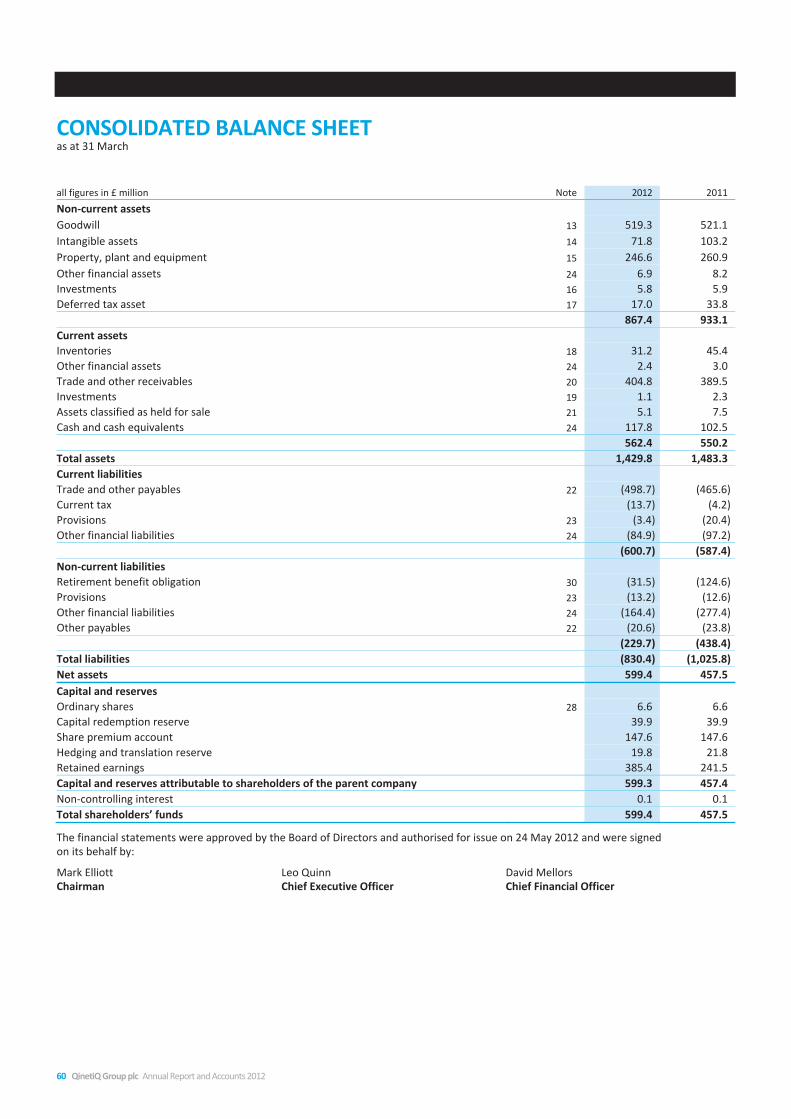
CONSOLIDATED BALANCE SHEET as at 31 March
60 QinetiQ Group plc Annual Report and Accounts 2012
all figures in £ million Note 2012 2011 Non-current assets Goodwill 13 519.3 521.1 Intangible assets 14 71.8 103.2 Property, plant and equipment 15 246.6 260.9 Other financial assets 24 6.9 8.2 Investments 16 5.8 5.9 Deferred tax asset 17 17.0 33.8 867.4 933.1 Current assets Inventories 18 31.2 45.4 Other financial assets 24 2.4 3.0 Trade and other receivables 20 404.8 389.5 Investments 19 1.1 2.3 Assets classified as held for sale 21 5.1 7.5 Cash and cash equivalents 24 117.8 102.5 562.4 550.2 Total assets 1,429.8 1,483.3 Current liabilities Trade and other payables 22 (498.7) (465.6)Current tax (13.7) (4.2)Provisions 23 (3.4) (20.4)Other financial liabilities 24 (84.9) (97.2) (600.7) (587.4)Non-current liabilities Retirement benefit obligation 30 (31.5) (124.6)Provisions 23 (13.2) (12.6)Other financial liabilities 24 (164.4) (277.4)Other payables 22 (20.6) (23.8) (229.7) (438.4)Total liabilities (830.4) (1,025.8)Net assets 599.4 457.5 Capital and reserves Ordinary shares 28 6.6 6.6 Capital redemption reserve 39.9 39.9 Share premium account 147.6 147.6 Hedging and translation reserve 19.8 21.8 Retained earnings 385.4 241.5 Capital and reserves attributable to shareholders of the parent company 599.3 457.4 Non-controlling interest 0.1 0.1 Total shareholders’ funds 599.4 457.5
The financial statements were approved by the Board of Directors and authorised for issue on 24 May 2012 and were signed on its behalf by:
Mark Elliott Chairman
Leo Quinn Chief Executive Officer
David Mellors Chief Financial Officer

Business review Corporate governance Financial statements
CONSOLIDATED CASH FLOW STATEMENT for the year ended 31 March
QinetiQ Group plc Annual Report and Accounts 2012 61
all figures in £ million Note 2012 2011 Net cash inflow from operations before restructuring costs 27 250.8 287.6 Net cash outflow relating to UK restructuring (8.9) (31.8)Cash inflow from operations 241.9 255.8 Tax paid (23.3) (42.9)Interest received 1.0 0.3 Interest paid (39.5) (28.9)Net cash inflow from operating activities 180.1 184.3 Purchases of intangible assets (0.7) (2.4)Purchases of property, plant and equipment (22.0) (19.7)Proceeds from sale of property, plant and equipment 7.3 0.3 Equity accounted investments and other investment funding 3.6 – Purchase of subsidiary undertakings (0.9) (15.8)Proceeds from sale of interests in subsidiary undertakings 11.2 38.2 Net cash (outflow)/inflow from investing activities (1.5) 0.6 Repayment of bank borrowings (133.6) (144.1)Proceeds from bank borrowings – 4.9 Payment of bank loan arrangement fees – (2.4)Settlement of forward contracts (1.6) – Purchase of own shares (12.0) (0.6)Dividends paid to shareholders (16.4) – Capital element of finance lease rental payments (2.8) (2.8)Capital element of finance lease rental receipts 3.0 3.0 Net cash outflow from financing activities (163.4) (142.0)Increase in cash and cash equivalents 15.2 42.9 Effect of foreign exchange changes on cash and cash equivalents 0.4 (1.4)Cash and cash equivalents at beginning of year 102.2 60.7 Cash and cash equivalents at end of year 117.8 102.2 Comprising: Cash and cash equivalents 24 117.8 102.5 Overdrafts 24 – (0.3)Cash and cash equivalents at end of year 117.8 102.2
RECONCILIATION OF MOVEMENT IN NET DEBT for the year ended 31 March
all figures in £ million Note 2012 2011 Increase in cash and cash equivalents in the year 15.2 42.9 Cash flows from repayment of bank loans and other financial instruments 135.0 141.4 Change in net debt resulting from cash flows 24 150.2 184.3 Other non-cash movements including foreign exchange 24 (11.5) 12.2 Movement in net debt in the year 24 138.7 196.5 Net debt at beginning of year 24 (260.9) (457.4)Net debt at end of year 24 (122.2) (260.9)

NOTES TO THE FINANCIAL STATEMENTS
62 QinetiQ Group plc Annual Report and Accounts 2012
1. Significant accounting policies Accounting policies The following accounting policies have been applied consistently to all periods presented in dealing with items that are considered material in relation to the Group’s financial statements. In the income statement, the Group presents acquisition amortisation and specific non-recurring items separately. In the judgement of the Directors, for the reader to obtain a proper understanding of the financial information, acquisition amortisation and specific non-recurring items need to be disclosed separately because of their size and incidence. Specific non-recurring items are referred to in note 4.
Basis of preparation The Group’s financial statements, approved by the Directors, have been prepared on a going concern basis as discussed in the Directors’ Report on page 43 and in accordance with International Financial Reporting Standards as adopted by the EU (‘Adopted IFRS’) and the Companies Act 2006 applicable to companies reporting under IFRS. The Company has elected to prepare its parent company financial statements in accordance with UK GAAP; these are presented on pages 103-105. The financial statements have been prepared under the historical cost convention, as modified by the revaluation of available-for-sale financial assets and other relevant financial assets and liabilities. Non-current assets held for sale are held at the lower of carrying amount and fair value less costs to sell. The Group’s reporting currency is sterling and unless otherwise stated the financial statements are rounded to the nearest £100,000.
Basis of consolidation The consolidated financial statements comprise the financial statements of the Company and its subsidiary undertakings to 31 March 2012. The purchase method of accounting has been adopted. Those subsidiary undertakings acquired or disposed of in the period are included in the consolidated income statement from the date control is obtained to the date that control is lost (usually on acquisition and disposal respectively). A subsidiary is an entity over which the Group has the power to govern financial and operating policies in order to obtain benefits. Potential voting rights that are currently exercisable or convertible are considered when determining control.
An associate is an undertaking over which the Group exercises significant influence, usually from 20%-50% of the equity voting
Business review Corporate governance Financial statements
QinetiQ Group plc Annual Report and Accounts 2012 63
Segmental information Segmental information is presented according to the Group’s management structure and the markets in which it operates. Segmental results represent the contribution of the different segments to the profit of the Group. Corporate expenses are allocated to the corresponding segments. Unallocated items mainly comprise acquisition amortisation, specific non-recurring items, net finance expense and taxation. Specific non-recurring items are referred to in note 4. Eliminations represent inter-company trading between the different segments.
Segmental assets and liabilities information is not regularly provided to the chief operating decision maker.
Research and development expenditure Research and development costs incurred on behalf of a customer as part of a specific project are directly chargeable to the customer on whose behalf the work is undertaken. These costs are recognised within operating costs and revenue is recognised in respect of the R&D services performed. Internally funded development expenditure is capitalised in the balance sheet where there is a clearly defined project, the expenditures are separately identifiable, the project is technically and commercially feasible, all costs are recoverable by future revenue and the resources are committed to complete the project. Such capitalised costs are amortised over the forecast period of sales resulting from the development. All other research and development costs are expensed to the income statement in the period in which they are incurred. If the research phase cannot be clearly distinguished from the development phase, the respective project-related costs are treated as if they were incurred in the research phase only and expensed.
Financing Financing represents the financial expense on borrowings accounted for using the effective rate method and the financial income earned on funds invested. Exchange differences on financial assets and liabilities and the income or expense from interest hedging instruments that are recognised in the income statement are included within finance income and finance expense.
Taxation The taxation charge is based on the taxable profit for the year and takes into account taxation deferred because of temporary differences between the treatment of certain items for taxation and accounting purposes. Current tax and deferred tax are charged or credited to the income statement, except where they relate to items charged or credited to equity, in which case the relevant tax is charged or credited to equity. Deferred taxation is the tax attributable to the temporary differences that appear when taxation authorities recognise and measure assets and liabilities with rules that differ from those of the consolidated financial statements. The amount of deferred tax provided is based on the expected manner of realisation or settlement of the carrying amount of assets and liabilities, using rates enacted or substantively enacted at the balance sheet date.
Any changes in the tax rates are recognised in the income statement unless related to items directly recognised in equity. Deferred tax liabilities are recognised on all taxable temporary differences excluding non-deductible goodwill. Deferred tax assets are recognised on all deductible temporary differences provided that it is probable that future taxable income will be available against which the asset can be utilised. Deferred tax assets and liabilities are offset only where there is a legally enforceable right to offset and there is an intention to settle balances on a net basis.
Business combinations Business combinations are accounted for using the acquisition method as at the acquisition date, which is the date on which control is transferred to the Group. The Group measures goodwill as the acquisition-date fair value of the consideration transferred, including the amount of any non-controlling interest in the acquiree, less the net of the acquisition-date fair values of the identifiable assets acquired and liabilities assumed, including contingent liabilities as required by IFRS 3.
Consideration transferred includes the fair values of assets transferred, liabilities incurred by the Group to the previous owners of the acquiree, equity interests issued by the Group to the previous owners of the acquiree, equity interests issued by the Group, contingent consideration and share-based payment awards of the acquiree that are replaced in the business combination. Any contingent consideration payable is recognised at fair value at the acquisition date. Subsequent changes to the fair value of contingent consideration that is not classified as equity are recognised in the consolidated income statement. If a business combination relates to the termination of pre-existing relationships between the Group and the acquiree, then the lower of the termination amount, as contained in the agreement, and the value of the off-market element, is deducted from the consideration transferred and recognised in other expenses.
Transaction costs that the Group incurs in connection with a business combination, such as finder’s fees, legal fees, due diligence fees, and other professional fees and consulting fees, are expensed as incurred.
Non-controlling interests are measured either at the non-controlling interest’s proportion of the net fair value of the identifiable assets, liabilities and contingent liabilities recognised or at fair value. The method used is determined on an acquisition-by-acquisition basis.
Goodwill Goodwill on acquisitions of subsidiaries is included in intangible assets. Goodwill on acquisitions of joint ventures and associates is included in the carrying value of equity accounted investments. Goodwill is tested annually for impairment and carried at cost less accumulated impairment losses. Gains and losses on the disposal of an entity include the carrying amount of goodwill related to the entity sold.
Financial statements Notes to the financial statements continued
64 QinetiQ Group plc Annual Report and Accounts 2012
1. Significant accounting policies continued Intangible assets Intangible assets arising from business combinations are recognised at fair value and are amortised over their expected useful lives, typically between 1 and 9 years. Internally generated intangible assets are recorded at cost, including labour, directly attributable costs and any third-party expenses. Purchased intangible assets are recognised at cost less amortisation. Intangible assets are amortised over their respective useful lives on a straight-line basis as follows:
Property, plant and equipment Property, plant and equipment are stated at cost less depreciation. Freehold land is not depreciated. Other tangible non-current assets are depreciated on a straight-line basis over their useful economic lives to their estimated residual value as follows:
Freehold buildings 20-25 years Leasehold land and buildings Shorter of useful economic life and the period of the lease Plant and machinery 3-10 years Fixtures and fittings 5-10 years Computers 3-5 years Motor vehicles 3-5 years
Assets under construction are included in property, plant and equipment on the basis of expenditure incurred at the balance sheet date. In the case of assets constructed by the Group, the value includes the cost of own work completed, including directly attributable costs and interest.
The useful lives, depreciation methods and residual values applied to property, plant and equipment are reviewed annually, and if appropriate, adjusted accordingly.
Impairment of tangible, goodwill, intangible and held for sale assets At each reporting date the Group assesses whether there is an indication that an asset may be impaired. If the carrying amount of any asset exceeds its recoverable amount an impairment loss is recognised immediately in the income statement. In addition, goodwill is tested for impairment annually irrespective of any indication of impairment. If the carrying amount exceeds the recoverable amount, the respective asset or the assets in the cash generating unit (CGU) are written down to their recoverable amounts. The recoverable amount of an asset or CGU is the higher of its fair value less costs to sell and its value in use. The value in use is the present value of the future cash flows expected to be derived from an asset or CGU calculated using an appropriate pre-tax discount rate. Impairment losses are expensed to the income statement.
Investments in debt and equity securities Investments held by the Group are classified as either a current asset or as a non-current asset and those classified as available for sale are stated at fair value, with any resultant gain or loss, other than impairment losses, being recognised directly in equity. When these investments are de-recognised, the cumulative gain or loss previously recognised directly in equity is recognised in the income statement.
The fair value of quoted financial instruments is their bid price at the balance sheet date. The fair value of unquoted equity investments is based on the price of the most recent investment by the Group or a third party, if available, or derived from the present value of forecast future cash flows.
Inventories Inventory and work-in-progress are stated at the lower of cost and net realisable value. Work-in-progress and manufactured finished goods are valued at production cost. Production cost includes direct production costs and an appropriate proportion of production overheads. A provision is established when the net realisable value of any inventory item is lower than its cost.
Bid costs Costs incurred in bidding for work are normally expensed as incurred. In the case of large multi-year government contracts the bidding process typically involves a competitive bid process to determine a preferred bidder and then a further period to reach financial close with the customer. In these cases, the costs incurred after announcement of the Group achieving preferred bidder status are deferred to the balance sheet within work-in-progress. From the point financial close is reached, the costs are amortised over the life of the contract. If an opportunity for which the Group was awarded preferred bidder status fails to reach financial close, the costs deferred to that point will be expensed in the income statement immediately, when it becomes likely that financial close will not be achieved.
Trade and other receivables Trade and other receivables are stated net of provisions for doubtful debts. Amounts recoverable on contracts are included in trade and other receivables and represent revenue recognised in excess of amounts invoiced. Payments received on account are included in trade and other payables and represent amounts invoiced in excess of revenue recognised.
Intellectual property rights 2-8 years Development costs 1-4 years Other 1-9 years
Business review Corporate governance Financial statements
QinetiQ Group plc Annual Report and Accounts 2012 65
Cash and cash equivalents Cash and cash equivalents comprise cash at bank and short-term deposits that are readily convertible into cash. In the cash flow statement overdraft balances are included in cash and equivalents.
Current and non-current liabilities Current liabilities include amounts due within the normal operating cycle of the Group. Interest-bearing current and non-current liabilities are initially recognised at fair value and then stated at amortised cost with any difference between the cost and redemption value being recognised in the income statement over the period of the borrowings on an effective interest rate basis. Costs associated with the arrangement of bank facilities or the issue of loans are held net of the associated liability presented in the balance sheet. Capitalised issue costs are released over the estimated life of the facility or instrument to which they relate using the effective interest rate method. If it becomes clear that the facility or instrument will be redeemed early, the amortisation of the issue costs will be accelerated.
Provisions A provision is recognised in the balance sheet when the Group has a present legal or constructive obligation as a result of a past event which can be reliably estimated, and it is probable that an outflow of economic benefits will be required to settle the obligation. Where appropriate, provisions are determined by discounting the expected cash flows at the Group’s weighted average cost of capital.
Financial instruments Financial assets and financial liabilities are recognised on the Group’s balance sheet when the Group becomes a party to the contractual provisions of the instrument. The derecognition of a financial instrument takes place when the Group no longer controls the contractual rights that comprise the financial instrument, when the instrument expires or is sold, terminated or exercised.
Derivative financial instruments Derivative financial instruments are initially recognised and thereafter held at fair value, being the market value for quoted instruments or valuation based on models and discounted cash flow calculations for unlisted instruments.
Fair value hedging Changes in the fair value of derivatives designated as fair value hedges of currency risk or interest rate risk are recognised in the income statement. The hedged item is held at fair value with respect to the hedged risk with any gain or loss recognised in the income statement.
Cash flow hedging Changes in the fair value of derivatives designated as a cash flow hedge that are regarded as highly effective are recognised in equity. The ineffective portion is recognised immediately in the income statement. Where a hedged item results in an asset or a liability, gains and losses previously recognised in equity are included in the cost of the asset or liability. Gains and losses previously recognised in equity are removed and recognised in the income statement at the same time as the hedged transaction.
Leased assets Leases are classified as finance leases when substantially all the risks and rewards of ownership are held by the lessee. Assets held under finance leases are capitalised and included in property, plant and equipment at the lower of the present value of minimum lease payments and fair value at the inception of the lease. Assets are then depreciated over the shorter of their useful economic lives or the lease term. Obligations relating to finance leases, net of finance charges arising in future periods, are included under financial liabilities.
Rentals payable under operating leases are charged to the income statement on a straight-line basis over the term of the lease.
Foreign currencies Transactions in foreign currencies are recorded using the rate of exchange ruling at the date of the transaction. Monetary assets and liabilities in foreign currencies are translated at period-end rates. Any resulting exchange differences are taken to the income statement. Gains and losses on designated forward foreign exchange hedging contracts are matched against the foreign exchange movements on the underlying transaction.
The individual financial statements of each Group company are presented in its functional currency. On consolidation, assets and liabilities of overseas subsidiaries, associated undertakings and joint ventures, including any related goodwill, are translated to sterling at the rate of exchange at the balance sheet date. The results and cash flows of overseas subsidiaries, associated undertakings and joint ventures are translated to sterling using the average rates of exchange during the period. Exchange adjustments arising from the re-translation of the opening net investment and the results for the period to the period-end rate are taken directly to equity and reported in the Statement of Comprehensive Income.
Post-retirement benefits The Group provides both defined contribution and defined benefit pension arrangements. The liabilities of the Group arising from defined benefit obligations, and the related current service cost, are determined using the projected unit credit method. Valuations for accounting purposes are carried out half yearly for the largest plans and on a regular basis for other plans. Actuarial advice is provided by external consultants. For the funded defined benefit plans, the excess or deficit of the fair value of plan assets less the present value of the defined benefit obligation are recognised as an asset or a liability respectively.

Financial statements Notes to the financial statements continued
66 QinetiQ Group plc Annual Report and Accounts 2012
1. Significant accounting policies continued For defined benefit plans, the actuarial cost charged to the income statement consists of current service cost, interest cost, expected return on plan assets and past service cost. The finance element of the pension charge is shown in finance income and expenses and the remaining service cost element is charged as a component of employee costs in the income statement. Actuarial gains and losses are recognised immediately in full through the Statement of Comprehensive Income. Contributions to defined contribution plans are charged to the Income Statement as incurred.
Share-based payments The Group operates share-based payment arrangements with employees. The fair value of equity-settled awards for share-based payments is determined on grant and expensed straight line over the period from grant to the date of earliest unconditional exercise. The fair value of cash-settled awards for share-based payments is determined each period end until they are exercised or lapse. The value is expensed straight line over the period from grant to the date of earliest unconditional exercise. The charges for both equity and cash-settled share-based payments are updated annually for non-market-based vesting conditions.
Share capital Ordinary share capital of the Company is recorded as the proceeds received, less issue costs. Company shares held by the employee benefit trusts are held at the consideration paid. They are classified as own shares within equity. Any gain or loss on the purchase, sale or issue of Company shares is recorded in equity.
Restatement of prior periods for finalisation of fair values arising on acquisitions The fair values of the net assets of acquired businesses are finalised within 12 months of the acquisition date. All fair value adjustments are recorded with effect from the date of acquisition and, consequently, may result in the restatement of previously reported financial results.
Recent accounting developments The following EU-endorsed amendments, improvements and interpretations of published standards are effective for accounting periods beginning on or after 1 April 2011 and have been adopted with no material impact on the Group’s financial statements:
IAS 24 (revised), Related Party Disclosures. The changes introduced by the standard relate mainly to the related party disclosure requirements for government-related entities, and the definition of a related party. The change has been applied prospectively.
Amendments to IFRIC 14 – Prepayments of a Minimum Funding Requirement. The amendment to IFRIC 14 removes unintended consequences arising from the treatment of prepayments when there is a minimum funding requirement (MFR). The amendment results in prepayments of contributions in certain circumstances being recognised as an asset rather than an expense.
Improvements to IFRSs 2010. The improvements are included in the list below. These consolidated Financial Statements have been prepared under the revised disclosure requirements.
• IFRS 3, Business Combinations; • IFRS 1, First-time Adoption of IFRS; • IFRS 7, Financial instruments: Disclosures; • IAS 1, Presentation of Financial Statements; • IAS 34, Interim Financial Reporting; • IAS 27, Consolidated and Separate Financial Statements; and • IFRIC 13, Customer Loyalty Programmes.
The Directors anticipate that the adoption of the following revised, amended and improved published standards and interpretations, which were in issue at the date of authorisation of these Financial Statements, will have no material impact on the Financial Statements of the Group when they become applicable in future periods:
• IFRS 7, Financial Instruments: Disclosures; • IFRS 1, First-time Adoption of IFRS, subject to EU endorsement; • IAS 12, Income Taxes, subject to EU endorsement; • IAS 1, Presentation of Financial Statements, subject to EU endorsement; • IAS 27, Consolidated and Separate Financial Statements, subject to EU endorsement; • IAS 28, Investment in associates, subject to EU endorsement; and • IAS 32, Financial instruments: presentation, subject to EU endorsement.

Business review Corporate governance Financial statements
QinetiQ Group plc Annual Report and Accounts 2012 67
The following new and improved published standards were in issue at the date of authorisation of these Financial Statements but are not yet effective and have not been adopted. All are subject to EU endorsement and the impact of adopting these standards is under assessment:
• IFRS 9, Financial Instruments; • IFRS 10, Consolidated Financial Statements; • IFRS 11, Joint Arrangements; • IFRS 12, Disclosure of Interests in Other Entities; • IFRS 13, Fair Value Measurement; and • IAS 19, Employee Benefits.
Critical accounting estimates and judgements in applying accounting policies The following commentary is intended to highlight those policies that are critical to the business based on the level of management judgement required in their application, their complexity and their potential impact on the results and financial position reported for the Group. The level of management judgement required includes assumptions and estimates about future events that are uncertain and the actual outcome of which may result in a materially different outcome from that anticipated.
Revenue and profit recognition The estimation process required to evaluate the potential outcome of contracts and projects requires skill, knowledge and experience from a variety of sources within the business to assess the status of the contract, costs to complete, internal and external labour resources required and other factors. This process is carried out continuously throughout the business to ensure that project and contract assessments reflect the latest status of such work. No profit is recognised on a contract until the outcome can be reliably estimated.
Business combinations Intangible assets recognised on business combinations have been valued using established methods and models to determine estimated value and useful economic life, with input, where appropriate, from external valuation consultants. Such methods require the use of estimates which may produce results that are different from actual future outcomes.
The Group tests annually whether goodwill has suffered any impairment. This process relies on the use of estimates of the future profitability and cash flows of its CGUs which may differ from the actual results delivered. In addition, the Group reviews whether identified intangible assets have suffered any impairment. Further details on the sensitivity of the carrying value of goodwill to changes in the key assumptions are set out in note 13.
Consolidation of US subsidiaries As described on page 43, the Group and the US Department of Defense (DoD) have entered into a proxy agreement that regulates the ownership, management and operation of the Group’s 100% owned subsidiary, QinetiQ North America, Inc. and its subsidiaries. Having considered the terms of the proxy agreement, the Directors consider that the Group has control over the operating and financial policies of QinetiQ North America and, therefore, consolidates the subsidiaries in the consolidated accounts.
Post-retirement benefits The Group’s defined benefit pension obligations and net income statement costs are based on key assumptions, including return on plan assets, discount rates, mortality, inflation and future salary and pension increases. Management exercises its best judgement, in consultation with actuarial advisors, in selecting the values for these assumptions that are the most appropriate to the Group. Small changes in these assumptions at the balance sheet date, individually or collectively, may result in significant changes in the size of the deficit or the net income statement costs. Any change in these assumptions would have an impact on the retirement benefit obligation recognised. Further details on these assumptions are set out in note 30.
Research and development expenditure Internally-funded development expenditure is capitalised when criteria are met and is written off over the forecast period of sales resulting from the development. Management decides on the adequacy of future demand and the potential market for such new products in order to justify capitalisation of internally-funded development expenditure. These can be difficult to determine when dealing with innovative technologies. Actual product sales may differ from these estimates.
Tax In determining the Group’s provisions for income tax and deferred tax, it is necessary to assess the likelihood and timing of recovery of tax losses created, and to consider transactions in a small number of key tax jurisdictions for which the ultimate tax determination is uncertain. To the extent that the final outcome differs from the tax that has been provided, adjustments will be made to income tax and deferred tax provisions held in the period the determination is made.

Financial statements Notes to the financial statements continued
68 QinetiQ Group plc Annual Report and Accounts 2012
2. Revenue and other income Revenue and other income is analysed as follows:
Revenue by category For the year ended 31 March all figures in £ million 2012 2011 Sales of goods 253.2 365.5 Services 1,209.4 1,330.0 Royalties 7.0 7.1 Revenue 1,469.6 1,702.6 Share of joint ventures’ and associates’ profit after tax 0.1 0.2 Other income 5.1 4.1 Total other income 5.2 4.3
The revenue and profit after tax of joint ventures and associates is £26.1m and £0.2m respectively (2011: £24.9m and £0.5m respectively). The figures in the table above represent the Group share of this profit after tax.
Other income is in respect of property rentals and the recovery of other related property costs.
Revenue by customer geographic location For the year ended 31 March all figures in £ million 2012 2011 North America 788.7 949.2 United Kingdom 570.1 623.7 Other 110.8 129.7 Total 1,469.6 1,702.6 Revenue by major customer type For the year ended 31 March all figures in £ million 2012 2011 UK Government 482.8 526.5 US Government 730.5 894.3 Other 256.3 281.8 Total 1,469.6 1,702.6
Revenue from the UK Government was generated by the UK Services and Global Products operating groups. Revenue from the US Government was generated by the US Services and Global Products operating groups.
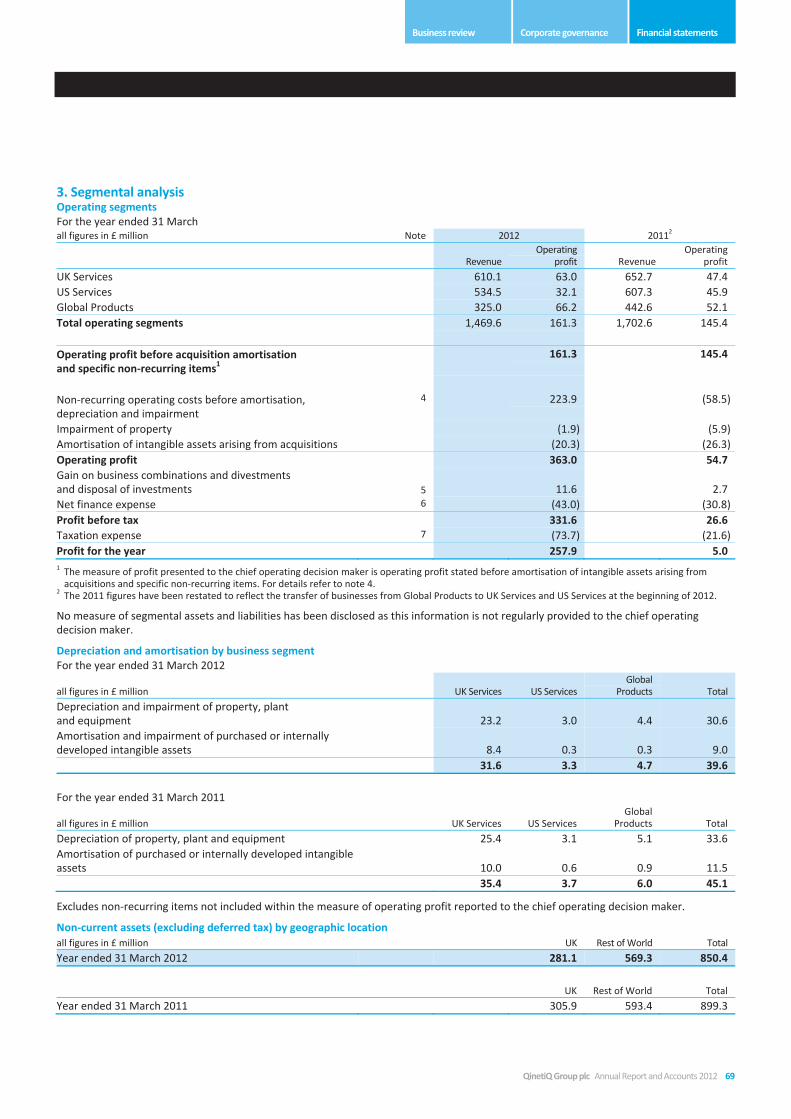
Business review Corporate governance Financial statements
QinetiQ Group plc Annual Report and Accounts 2012 69
3. Segmental analysis Operating segments For the year ended 31 March
all figures in £ million Note 2012 20112
Revenue Operating
profit RevenueOperating
profit UK Services 610.1 63.0 652.7 47.4 US Services 534.5 32.1 607.3 45.9 Global Products 325.0 66.2 442.6 52.1 Total operating segments 1,469.6 161.3 1,702.6 145.4 Operating profit before acquisition amortisation
and specific non-recurring items1
161.3
145.4
Non-recurring operating costs before amortisation,
depreciation and impairment 4
223.9
(58.5)
Impairment of property (1.9) (5.9) Amortisation of intangible assets arising from acquisitions (20.3) (26.3) Operating profit 363.0 54.7
Gain on business combinations and divestments and disposal of investments 5 11.6 2.7
Net finance expense 6 (43.0) (30.8) Profit before tax 331.6 26.6 Taxation expense 7 (73.7) (21.6) Profit for the year 257.9 5.0
1 The measure of profit presented to the chief operating decision maker is operating profit stated before amortisation of intangible assets arising from acquisitions and specific non-recurring items. For details refer to note 4.
2 The 2011 figures have been restated to reflect the transfer of businesses from Global Products to UK Services and US Services at the beginning of 2012.
No measure of segmental assets and liabilities has been disclosed as this information is not regularly provided to the chief operating decision maker.
Depreciation and amortisation by business segment For the year ended 31 March 2012
all figures in £ million
UK Services US Services Global
Products Total Depreciation and impairment of property, plant and equipment 23.2 3.0 4.4 30.6 Amortisation and impairment of purchased or internally developed intangible assets 8.4 0.3 0.3 9.0 31.6 3.3 4.7 39.6 For the year ended 31 March 2011
all figures in £ million
UK Services US Services Global
Products Total Depreciation of property, plant and equipment 25.4 3.1 5.1 33.6 Amortisation of purchased or internally developed intangible assets 10.0 0.6 0.9 11.5 35.4 3.7 6.0 45.1
Excludes non-recurring items not included within the measure of operating profit reported to the chief operating decision maker.
Non-current assets (excluding deferred tax) by geographic location all figures in £ million UK Rest of World Total Year ended 31 March 2012 281.1 569.3 850.4 UK Rest of World Total Year ended 31 March 2011 305.9 593.4 899.3

Financial statements Notes to the financial statements continued
70 QinetiQ Group plc Annual Report and Accounts 2012
4. Profit/loss before tax The following items have been charged in arriving at profit/loss before tax:
all figures in £ million 2012 2011 Fees payable to the auditor: Statutory audit 0.8 0.8 Audit of the Company’s subsidiaries pursuant to legislation 0.1 0.1 Other services relating to taxation – 0.1 Other services 0.1 0.1 Total auditor’s remuneration 1.0 1.1 Depreciation of property, plant and equipment: Owned assets: before impairment 28.2 33.6 Owned assets: impairment 4.3 5.9 Foreign exchange (gain)/loss (0.2) 0.3 Research and development expenditure – customer funded contracts 331.1 382.0 Research and development expenditure – Group funded 15.2 13.0
The following non-recurring items have been (credited)/charged in arriving at profit/loss before tax:
all figures in £ million Note 2012 2011 Net restructuring (recoveries)/charges (69.4) 28.6 Pension past service gain 30 (141.4) – Gain on disposal of property (9.0) – Contingent payments on acquisition treated as remuneration – 6.1 Net (gain)/loss in respect of previously capitalised DTR-programme bid costs (4.1) 23.8 Non-recurring operating (income)/expense before amortisation, depreciation and impairment (223.9) 58.5 Impairment of property 15 1.9 5.9 Total goodwill and intangible impairment and acquisition amortisation 14 20.3 26.3 Non-recurring operating (profit)/loss (201.7) 90.7 Gain on business combinations and divestments and disposal of investments 5 (11.6) (2.1)Gain in respect of negative goodwill on acquisitions in the period 5 – (0.2)Gain in respect of deferred consideration on prior year acquisitions 5 – (0.4)Gain on business combinations and divestments and disposal of investments 5 (11.6) (2.7) Total non-recurring (income)/expense before tax (213.3) 88.0
The net restructuring recovery of £69.4m (2011: expense of £28.6m) primarily relates to the agreement with the UK MOD in March 2012 involving a payment to QinetiQ of £65.0m that was received after the year end in April 2012. The agreement involves the discharging of MOD from its accumulated liabilities for restructuring costs incurred in previous years, together with MOD agreement to changes in its Special Shareholder rights, and certain other operational issues.

Business review Corporate governance Financial statements
QinetiQ Group plc Annual Report and Accounts 2012 71
5. Gain on business combinations and divestments and disposal of investments For the year ended 31 March
all figures in £ million 2012 2011 Gain on business divestments 8.0 2.1 Gain on disposal of investments 3.6 – Gain in respect of negative goodwill on acquisitions – 0.2 Gain in respect of deferred consideration on prior year acquisitions – 0.4 11.6 2.7
The gain on business divestments includes the disposal of Spectro Inc., a business within the Global Products sector, for consideration before costs of US$20.5m and a gain on disposal of £4.7m. Of the £3.6m gain on disposal of investments, £2.8m relates to the sale of QinetiQ’s investment in Nomad Holdings Limited.
The prior year gain on business divestments relates to the disposal of S&IS, a non-core security operations and access control business within QinetiQ’s US Services operation, to ManTech International Corporation. The total consideration net of disposal costs was £37.2m and resulted in a gain on disposal of £2.1m. Additional cash receipts in the prior year included £1.0m in respect of 2010 divestments. Total proceeds from the sale of interests in subsidiary undertakings were £38.2m.
The prior year gain in respect of negative goodwill on acquisitions in the period relates to the acquisition of Sensoptics Ltd on 16 December 2010.
The prior year gain in respect of deferred consideration on prior year acquisitions is the result of conditions for the deferred consideration in respect of the Cyveillance Inc. acquisition not being met.
6. Finance income and expense For the year ended 31 March
all figures in £ million 2012 2011 Receivable on bank deposits 1.3 0.6 Finance lease income 0.9 1.2 Expected return on pension scheme assets 67.6 68.6 Finance income 69.8 70.4 Amortisation of recapitalisation fee1 (0.6) (1.8)Payable on bank loans and overdrafts (1.6) (5.9)Payable on US dollar private placement debt2 (46.8) (32.6)Finance lease expense (0.8) (1.0)Unwinding of discount on financial liabilities (1.8) (0.4)Interest on pension scheme liabilities (61.2) (59.5)Finance expense (112.8) (101.2)Net finance expense (43.0) (30.8)1 In 2011 the Group refinanced its existing credit facility with a new five-year revolving credit facility. The un-amortised amount of the fees previously
capitalised in respect of the pre-existing facility was written off on termination of that facility and charged to finance expense. 2 The Group elected to make early repayment of US$177m of private placement debt, which will complete after the year end from surplus cash. Net finance
expense in 2012 is affected by an accelerated interest charge of £27.4m in respect of these early repayments. Net finance expense in 2011 was also affected by an accelerated interest charge of £8.8m in respect of the year-end obligation to make early repayment of US$135m of private placement debt.

Financial statements Notes to the financial statements continued
72 QinetiQ Group plc Annual Report and Accounts 2012
7. Taxation 2012 2011
all figures in £ million
Before acquisition
amortisation and specific
non-recurring items
Acquisition amortisation and specific
non-recurring items Total
Before acquisition
amortisation and specific
non-recurring items
Acquisition amortisation and specific
non-recurring items Total
Analysis of charge Current UK tax expense – 13.1 13.1 – – – Overseas corporation tax Current year 15.5 2.3 17.8 41.3 (1.1) 40.2 Adjustment for prior year (2.3) – (2.3) (0.8) – (0.8)Current tax expense/(income) 13.2 15.4 28.6 40.5 (1.1) 39.4 Deferred tax 7.3 34.8 42.1 (20.2) 0.9 (19.3)Deferred tax impact of change in rates 1.4 – 1.4 2.5 – 2.5 Deferred tax in respect of prior years 1.6 – 1.6 (1.0) – (1.0)Taxation expense/(income) 23.5 50.2 73.7 21.8 (0.2) 21.6 Factors affecting tax charge in year Principal factors reducing the Group’s current year tax charge below the UK statutory rate are explained below: Profit/(loss) before tax 118.3 213.3 331.6 114.6 (88.0) 26.6 Tax on profit/(loss) before tax at 26% (2011: 28%) 30.7 55.5 86.2 32.1 (24.7) 7.4 Effect of: Expenses not deductible for tax purposes, research and development relief and non-taxable items (11.9) (2.7) (14.6) (33.4) 22.0 (11.4)Utilisation of previously unrecognised tax losses of overseas subsidiaries – – – (0.3) – (0.3)Current tax losses for which no deferred tax asset was recognised (4.3) – (4.3) 17.5 – 17.5 Deferred tax impact of change in rates 1.4 – 1.4 2.5 – 2.5 Deferred tax in respect of prior years 0.9 – 0.9 (1.0) – (1.0)Effect of different rates in overseas jurisdictions 6.7 (2.6) 4.1 4.4 2.5 6.9 Taxation expense/(income) 23.5 50.2 73.7 21.8 (0.2) 21.6 Effective tax rate 19.9% 22.2% 19.0% 81.2% Factors affecting future tax charges The effective tax rate continues to be below the statutory rate in the UK, primarily as a result of the benefit of research and development relief in the UK. The effective tax rate is expected to remain below the UK statutory rate in the medium term, subject to any tax legislation changes and the geographic mix of profits.
The 2012 Budget on 21 March 2012 announced that the UK corporation tax rate will reduce to 22% by 2014. A reduction in the rate from 26% to 25% (effective from 1 April 2012) was substantively enacted on 5 July 2011, and a further reduction to 24% (effective from 1 April 2012) was substantively enacted on 30 March 2012. This will reduce the Group’s future tax charge accordingly. The deferred tax asset at 31 March 2012 has been calculated based on the rate of 24% substantively enacted at the balance sheet date. It has not yet been possible to quantify the full anticipated effect of the announced further 2% rate reduction, although this will further reduce the Group’s future tax charge and reduce the Group’s deferred tax asset accordingly.
At 31 March 2012, the Group had unused tax losses of £200.0m (2011: £188.7m) potentially available for offset against future profits.

Business review Corporate governance Financial statements
QinetiQ Group plc Annual Report and Accounts 2012 73
8. Dividends An analysis of the dividends paid and proposed in respect of the years ended 31 March 2012 and 2011 is provided below:
Pence
per share £m Date paid/
payable Interim 2012 0.90 5.8 Feb 2012 Final 2012 (proposed) 2.00 13.0 Sept 2012 Total for the year ended 31 March 2012 2.90 18.8 Interim 2011 – – – Final 2011 1.60 10.5 Sept 2011 Total for the year ended 31 March 2011 1.60 10.5
The Directors propose a final dividend of 2.00p (2011: 1.60p). The dividend, which is subject to shareholder approval, will be paid on 7 September 2012. The ex-dividend date is 8 August 2012 and the record date is 10 August 2012.
9. Analysis of employee costs and numbers The largest component of operating expenses is employee costs. The year-end and average monthly number of persons employed by the Group, including Directors, analysed by business segment, were:
Year end 31 March Monthly average
2012
Number 20111
Number 2012
Number 20111
Number UK Services 5,157 5,337 5,170 5,709 US Services 3,940 4,686 4,349 5,025 Global Products 1,083 1,185 1,118 1,299 Total 10,180 11,208 10,637 12,033 1 Restated to reflect the transfer of the Maritime and Transportation services business from Global Products to US Services and the Force Protection
business from Global Products to UK Services at the beginning of the 2012 financial year.
The aggregate payroll costs of these persons were as follows:
all figures in £ million Note 2012 2011 Wages and salaries 561.9 635.7 Social security costs 41.5 46.3 Pension costs 42.2 47.3 Share-based payments costs 29 4.2 3.3 Employee costs before UK restructuring costs 649.8 732.6 UK restructuring costs – 33.5 Total employee costs 649.8 766.1
The 2011 UK restructuring costs relate to the restructuring of the UK business announced in May 2010. QinetiQ reached agreement with the UK MOD in March 2012 involving a payment to QinetiQ of £65.0m that was received after the year end in April 2012. The agreement involves the discharging of MOD from its accumulated liabilities for restructuring costs incurred in previous years, together with MOD agreement to changes in its Special Shareholder rights, and certain other operational issues.
10. Directors and other senior management personnel The Directors and other senior management personnel of the Group during the year to 31 March 2012 comprise the Board of Directors and the QinetiQ Executive Team. Payments to Directors and the QinetiQ Executive Team are summarised below:
all figures in £ million 2012 2011 Short-term employee remuneration including benefits 6.8 6.4 Post-employment benefits 0.2 0.2 Share-based payments costs 1.9 1.7 Total 8.9 8.3
Short-term employee remuneration and benefits include salary, bonus, and benefits. Post-employment benefits relate to pension amounts.

Financial statements Notes to the financial statements continued
74 QinetiQ Group plc Annual Report and Accounts 2012
11. Earnings per share Basic earnings per share is calculated by dividing the profit attributable to equity shareholders by the weighted average number of ordinary shares in issue during the year. The weighted average number of shares used excludes those shares bought by the Group and held as own shares (see note 28). For diluted earnings per share the weighted average number of shares in issue is adjusted to assume conversion of all potentially dilutive ordinary shares arising from unvested share-based awards including share options. Underlying basic earnings per share figures are presented below, in addition to the basic and diluted earnings per share because the Directors consider this gives a more relevant indication of underlying business performance and reflects the adjustments to basic earnings per share for the impact of specific non-recurring items, amortisation of acquired intangible assets and tax thereon.
For the year ended 31 March 2012 2011 Basic EPS Profit attributable to equity shareholders £ million 257.9 5.0 Weighted average number of shares Million 650.5 654.6 Basic EPS Pence 39.6 0.8 Diluted EPS Profit attributable to equity shareholders £ million 257.9 5.0 Weighted average number of shares Million 650.5 654.6 Effect of dilutive securities Million 4.0 6.8 Diluted number of shares Million 654.5 661.4 Diluted EPS Pence 39.4 0.8 Underlying basic EPS Profit attributable to equity shareholders £ million 257.9 5.0 (Profit)/loss after tax in respect of acquisition amortisation and specific non-recurring items £ million (163.1) 87.8 Underlying profit after taxation £ million 94.8 92.8 Weighted average number of shares Million 650.5 654.6 Underlying basic EPS Pence 14.6 14.2 Underlying diluted EPS Profit attributable to equity shareholders £ million 257.9 5.0 (Profit)/loss after tax in respect of acquisition amortisation and specific non-recurring items £ million (163.1) 87.8 Underlying profit after taxation £ million 94.8 92.8 Weighted average number of shares Million 650.5 654.6 Effect of dilutive securities Million 4.0 6.8 Diluted number of shares Million 654.5 661.4 Underlying diluted EPS Pence 14.5 14.0

Business review Corporate governance Financial statements
QinetiQ Group plc Annual Report and Accounts 2012 75
12. Business combinations Acquisition of subsidiaries for the year ended 31 March 2012 The Group has not entered into any business combinations for the year ended 31 March 2012. During the year the Group paid £0.9m in deferred consideration in respect of the prior year Sensoptics Limited acquisition.
Acquisition of subsidiaries for the year ended 31 March 2011 On 16 December 2010, the Group acquired 100% of the issued share capital of Sensoptics Limited from its founder management team. If the acquisition had been completed on the first day of the financial year, Group revenue for the year ended 31 March 2011 would have been £1,705.0m and Group profit before tax would have been £27.3m.
Acquisitions in the year to 31 March 2011
Acquisition Acquisition date
Percentage share acquired
%
Cash consideration
£million
Contribution post-acquisition Revenue £million
Operating profit £million
Sensoptics Limited 16 December 2010 100% 2.8 0.7 0.2
Set out below are the allocations of purchase consideration, assets and liabilities of the acquisition made in the year and the adjustments required to the book values of the assets and liabilities in order to present the net assets of these businesses at fair value and in accordance with Group accounting policies.
Sensoptics Limited Acquisition in the year to 31 March 2011
all figures in £ million Book
value Fair value
adjustment Fair value at
acquisition Net assets acquired 1.0 2.9 3.9 Goodwill (0.2) 3.7 Consideration satisfied by: Cash 2.8 Deferred consideration 0.9 Total consideration 3.7
Sensoptics Limited is a designer of fibre-optic sensing hardware. It was acquired to combine its technology with QinetiQ’s OptaSense® signal processing capabilities. The OptaSense® solution provides cost-effective round-the-clock distributed acoustic monitoring over long distances.
The intangible assets acquired as part of the business combination relate to the intellectual property embodied within Sensoptics Limited’s existing products and products under development.
Total expected payments are in excess of the fair value of net assets acquired. Certain potential payments are, however, linked to continuing employment assumptions for the retained founder management team, which would be forfeited in full if they were to leave within the stipulated period. IFRS 3 (revised) requires this type of arrangement to be accounted for as remuneration expense as opposed to part of the consideration. As a result, the acquisition resulted in negative goodwill of £0.2m, which was recognised as a gain in the consolidated income statement within ‘gain/(loss) on business combinations and divestments and disposal of investments’. The discounted fair value of the deferred contingent purchase price payments treated as remuneration was £6.1m which was charged to the consolidated income statement within operating costs (significant non-recurring items). Acquisition-related costs, included in other operating costs excluding depreciation and amortisation, amount to £0.2m.

Financial statements Notes to the financial statements continued
76 QinetiQ Group plc Annual Report and Accounts 2012
13. Goodwill all figures in £ million 2012 2011 Cost At 1 April 566.2 628.0 Disposals (3.0) (32.0)Foreign exchange 1.0 (29.8)At 31 March 564.2 566.2 Impairment At 1 April (45.1) (50.2)Disposals 0.3 3.5 Foreign exchange (0.1) 1.6 At 31 March (44.9) (45.1)Net book value at 31 March 519.3 521.1
Goodwill at 31 March 2012 was allocated across various CGUs, with significant CGUs in UK Services (two), Global Products (two) and US Services (one). In the prior year two CGUs in the US Services business were amalgamated into one to reflect the way in which these businesses are managed and operated.
Goodwill is attributable to the excess of consideration over the fair value of net assets acquired and includes expected synergies, future growth prospects and employee knowledge, expertise and security clearances. The Group tests goodwill impairment for each CGU annually, or more frequently if there are indications that goodwill might be impaired.
Key assumptions The value-in-use calculations use discounted future cash flows based on financial plans approved by the Board covering a two-year period. Cash flows for periods beyond this period are extrapolated based on the second year of the two-year plan, with a terminal growth-rate assumption applied.
Terminal growth rates The specific plans for each of the CGUs have been extrapolated using a terminal growth rate of 2.0%-3.0% (2011: 2.0%-3.0%). Growth rates are based on management’s estimates which take into consideration the long-term nature of the industry in which the CGUs operate and external forecasts as to the likely growth of the industry in the longer term.
Discount rates The Group’s weighted average cost of capital (WACC) was used as a basis in determining the discount rate to be applied adjusted for risks specific to the market characteristics of CGUs as appropriate on a pre-tax basis. The pre-tax discount rates applied for the two UK Services CGUs were 10.5% and 10.6%, for the US Services CGU it was 9.7%, and for the Global Products CGUs were 9.5% and 9.7%.
Significant CGUs Sensitivity analysis shows that both the discount rate and growth rate assumptions are key variables that have an impact on the outcome of the recoverable amount.
Within UK Services the individual CGUs have significant headroom. An increase in the WACC rate or a decrease in the terminal growth rate by 1% would not cause the net operating assets to exceed their recoverable amount. The carrying value of goodwill for the UK Services CGUs as at 31 March was £27.4m and £2.8m respectively.
The US Services CGU has headroom, with current assumptions, of £84.4m. If the discount rate assumption were increased by 1% the CGU would require an impairment of £28.8m. Sensitivity analysis shows that a decrease or increase of 1% in the terminal growth rate could result in an impairment of £24.4m or headroom of £265.6m. The carrying value of goodwill for this CGU as at 31 March was £370.7m.
The Technology Solutions CGU in the US has significant headroom. An increase in either the WACC rate or a 1% decrease in the terminal growth rate would not cause the net operating assets to exceed their recoverable amount. The carrying value of goodwill for this CGU as at 31 March was £112.8m.
The Technology Solutions CGU in the UK has headroom, under current assumptions, of £18.1m. If the discount rate were to increase by 1%, or the terminal growth rate decrease by 1%, this would not cause the net operating assets to exceed their recoverable amount. The carrying value of goodwill for this CGU as at 31 March was £5.6m.
The Directors have not identified any other likely changes in other significant assumptions between 31 March 2012 and the signing of the financial statements that would cause the carrying value of the recognised goodwill to exceed its recoverable amount.

Business review Corporate governance Financial statements
QinetiQ Group plc Annual Report and Accounts 2012 77
14. Intangible assets Year ended 31 March 2012 Acquired intangible assets
Development costs
Other intangible
assets Total all figures in £ million
Customer relationships
Intellectual property
Brand names
Cost At 1 April 2011 147.3 55.3 13.9 13.9 36.8 267.2 Additions – internally developed – – – 0.3 – 0.3 Additions – purchased – – – – 0.4 0.4 Disposals – – – – (0.4) (0.4)Disposals – recognised on divestments – – (4.2) – – (4.2)Transfers – – – 0.2 (0.2) – Foreign exchange 0.4 (0.1) (0.1) – – 0.2 At 31 March 2012 147.7 55.2 9.6 14.4 36.6 263.5 Amortisation and impairment At 1 April 2011 79.5 40.9 6.1 10.8 26.7 164.0 Amortisation charge for year 12.9 5.7 1.7 2.3 4.2 26.8 Impairments – – – – 2.5 2.5 Disposals – – – – (0.1) (0.1)Disposals – recognised on divestments – – (1.8) – – (1.8)Transfers – – – 0.2 (0.2) – Foreign exchange 0.4 (0.1) – – – 0.3 At 31 March 2012 92.8 46.5 6.0 13.3 33.1 191.7 Net book value at 31 March 2012 54.9 8.7 3.6 1.1 3.5 71.8
Impairment of other intangible assets of £2.5m was incurred in the UK Services business segment and relates to certain software assets no longer being utilised.
Year ended 31 March 2011
Acquired intangible assets Development
costs
Other intangible
assets Total all figures in £ million Customer
relationships Intellectual
property Brand
names Cost At 1 April 2010 160.6 53.5 14.7 13.4 36.1 278.3 Additions – internally developed – – – 0.3 – 0.3 Additions – purchased – – – – 2.1 2.1 Additions – recognised on acquisitions – 4.0 – – – 4.0 Disposals – – – – (1.2) (1.2)Disposals – recognised on divestments (6.2) – – – – (6.2)Transfers – – – 0.2 0.1 0.3 Foreign exchange (7.1) (2.2) (0.8) – (0.3) (10.4)At 31 March 2011 147.3 55.3 13.9 13.9 36.8 267.2 Amortisation and impairment At 1 April 2010 70.5 34.5 4.2 7.3 20.1 136.6 Amortisation charge for year 16.2 7.9 2.2 2.2 9.3 37.8 Disposals – – – – (1.2) (1.2)Disposals – recognised on divestments (4.0) – – – – (4.0)Transfers – – – 1.3 (1.2) 0.1 Foreign exchange (3.2) (1.5) (0.3) – (0.3) (5.3)At 31 March 2011 79.5 40.9 6.1 10.8 26.7 164.0 Net book value at 31 March 2011 67.8 14.4 7.8 3.1 10.1 103.2

Financial statements Notes to the financial statements continued
78 QinetiQ Group plc Annual Report and Accounts 2012
15. Property, plant and equipment Year ended 31 March 2012
all figures in £ million Land and buildings
Plant, machinery
and vehicles
Computers and office
equipment Assets under construction Total
Cost At 1 April 2011 305.8 150.1 48.2 13.1 517.2 Additions 0.5 2.8 1.0 17.7 22.0 Disposals (0.4) (3.9) (3.1) (2.0) (9.4)Disposals – recognised on divestments (0.1) (1.0) (0.4) – (1.5)Transfers 2.0 5.6 2.8 (10.4) – Foreign exchange – – 0.1 – 0.1 At 31 March 2012 307.8 153.6 48.6 18.4 528.4 Depreciation At 1 April 2011 110.3 112.2 33.8 – 256.3 Charge for year 10.7 12.0 5.5 – 28.2 Impairment 1.9 0.8 1.6 – 4.3 Disposals (0.4) (3.5) (2.0) – (5.9)Disposals – recognised on divestments (0.1) (0.6) (0.4) – (1.1)Transfers (0.8) 0.4 0.4 – – At 31 March 2012 121.6 121.3 38.9 – 281.8 Net book value at 31 March 2012 186.2 32.3 9.7 18.4 246.6
Impairment of land and buildings of £1.9m, expensed in the consolidated income statement as a specific non-recurring item, relates to vacant owned properties where there have been no external tenants following vacancies arising in the year. Plant, machinery and vehicles impairment of £0.8m and computer equipment impairment of £1.6m relate to the impairment of assets, in the UK Services business segment, that are no longer generating revenue.
Year ended 31 March 2011
all figures in £ million Land and buildings
Plant, machinery
and vehicles
Computers and office
equipment Assets under construction Total
Cost At 1 April 2010 304.6 151.7 58.8 12.2 527.3 Additions 1.0 2.8 3.3 12.7 19.8 Disposals (1.9) (7.8) (11.1) (0.2) (21.0)Transfers 3.6 9.6 (1.9) (11.6) (0.3)Transfer to assets held for sale (0.9) (5.5) – – (6.4)Foreign exchange (0.6) (0.7) (0.9) – (2.2)At 31 March 2011 305.8 150.1 48.2 13.1 517.2 Depreciation At 1 April 2010 95.6 107.2 39.0 – 241.8 Charge for year 11.8 15.3 6.5 – 33.6 Impairment 5.8 1.2 – – 7.0 Impairment reversal (1.1) – – – (1.1)Disposals (1.5) (7.1) (10.9) – (19.5)Transfers 0.1 – (0.2) – (0.1)Transfer to assets held for sale – (4.0) – – (4.0)Foreign exchange (0.4) (0.4) (0.6) – (1.4)At 31 March 2011 110.3 112.2 33.8 – 256.3 Net book value at 31 March 2011 195.5 37.9 14.4 13.1 260.9
Under the terms of the Business Transfer Agreement with the MOD, certain restrictions have been placed on freehold land and buildings, and certain plant and machinery related to them. These restrictions are detailed in note 31.

Business review Corporate governance Financial statements
QinetiQ Group plc Annual Report and Accounts 2012 79
16. Non-current investments As at 31 March 2012 2011
all figures in £ million
Joint venture and associates
financial results
Group net share of joint ventures and
associates
Joint venture and associates
financial results
Group net share of joint ventures and
associates Non-current assets 1.7 0.5 1.5 0.5 Current assets 8.7 2.8 7.8 2.5 10.4 3.3 9.3 3.0 Current liabilities (5.2) (2.0) (4.7) (1.8)Non-current liabilities (1.0) (0.3) (0.4) (0.1) (6.2) (2.3) (5.1) (1.9)Net assets of joint ventures and associates 4.2 1.0 4.2 1.1 Other non-current investments – 4.8 – 4.8 Total 4.2 5.8 4.2 5.9
There were no material transactions with joint ventures and associates.
17. Deferred tax Deferred tax assets and liabilities are offset only where there is a legally enforceable right to do so and there is an intention to settle the balances net.
Movements in the deferred tax assets and liabilities are shown below:
Year ended 31 March 2012 Deferred tax asset
all figures in £ million Pension liability
Accelerated capital
allowances Hedging
Short-term timing
differences Total At 1 April 2011 32.4 0.6 0.1 37.6 70.7 Created through income statement (48.7) 3.2 (0.2) – (45.7)Created through equity 30.7 – 0.1 – 30.8 Prior-year adjustment – (0.5) – (1.1) (1.6)Foreign exchange – – – 0.1 0.1 Transfer to current tax – 0.1 – (2.4) (2.3)Deferred tax impact of change in rates (1.1) (0.3) – – (1.4)Gross deferred tax asset at 31 March 2012 13.3 3.1 – 34.2 50.6 Less: liability available for offset (33.6)Net deferred tax asset at 31 March 2012 17.0 Deferred tax liability all figures in £ million Amortisation Total At 1 April 2011 (36.9) (36.9)Created through the income statement 3.6 3.6 Foreign exchange (0.1) (0.1)Transfer to current tax (0.2) (0.2)Gross deferred tax liability at 31 March 2012 (33.6) (33.6)Less: asset available for offset 33.6 Net deferred tax liability at 31 March 2012 –
At the balance sheet date the Group had unused tax losses of £200.0m (2011: £188.7m) potentially available for offset against future profits. No deferred tax asset has been recognised in respect of this amount because of uncertainty over the timing of its utilisation. These losses can be carried forward indefinitely.
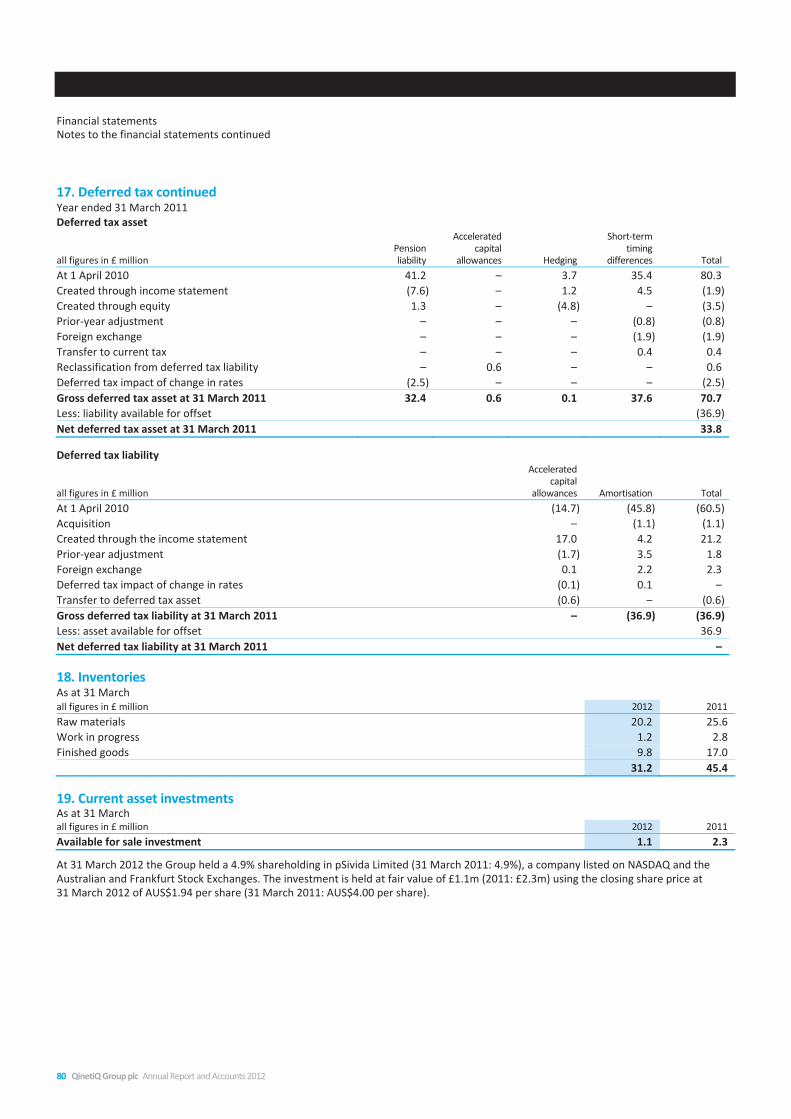
Financial statements Notes to the financial statements continued
80 QinetiQ Group plc Annual Report and Accounts 2012
17. Deferred tax continued Year ended 31 March 2011 Deferred tax asset
Deferred tax liability
all figures in £ million
Accelerated capital
allowances Amortisation Total At 1 April 2010 (14.7) (45.8) (60.5)Acquisition – (1.1) (1.1)Created through the income statement 17.0 4.2 21.2 Prior-year adjustment (1.7) 3.5 1.8 Foreign exchange 0.1 2.2 2.3 Deferred tax impact of change in rates (0.1) 0.1 – Transfer to deferred tax asset (0.6) – (0.6)Gross deferred tax liability at 31 March 2011 – (36.9) (36.9)Less: asset available for offset 36.9 Net deferred tax liability at 31 March 2011 – 18. Inventories As at 31 March all figures in £ million 2012 2011 Raw materials 20.2 25.6 Work in progress 1.2 2.8 Finished goods 9.8 17.0 31.2 45.4 19. Current asset investments As at 31 March all figures in £ million 2012 2011 Available for sale investment 1.1 2.3
At 31 March 2012 the Group held a 4.9% shareholding in pSivida Limited (31 March 2011: 4.9%), a company listed on NASDAQ and the Australian and Frankfurt Stock Exchanges. The investment is held at fair value of £1.1m (2011: £2.3m) using the closing share price at 31 March 2012 of AUS$1.94 per share (31 March 2011: AUS$4.00 per share).
all figures in £ million Pension liability
Accelerated capital
allowances Hedging
Short-term timing
differences Total At 1 April 2010 41.2 – 3.7 35.4 80.3 Created through income statement (7.6) – 1.2 4.5 (1.9)Created through equity 1.3 – (4.8) – (3.5)Prior-year adjustment – – – (0.8) (0.8)Foreign exchange – – – (1.9) (1.9)Transfer to current tax – – – 0.4 0.4 Reclassification from deferred tax liability – 0.6 – – 0.6 Deferred tax impact of change in rates (2.5) – – – (2.5)Gross deferred tax asset at 31 March 2011 32.4 0.6 0.1 37.6 70.7 Less: liability available for offset (36.9)Net deferred tax asset at 31 March 2011 33.8

Business review Corporate governance Financial statements
QinetiQ Group plc Annual Report and Accounts 2012 81
20. Trade and other receivables As at 31 March all figures in £ million 2012 2011 Trade receivables 164.5 189.8 Amounts recoverable under contracts 141.6 152.4 Other receivables 82.9 31.5 Prepayments 15.8 15.8 404.8 389.5
In determining the recoverability of trade receivables, the Group considers any changes in the credit quality of the trade receivable from the date credit was granted to the reporting date. Credit risk is limited as a result of the high percentage of revenue derived from UK and US defence and other government agencies. Accordingly, the Directors believe that no credit provision in excess of the allowance for doubtful debts is required. As at 31 March 2012 the Group carried a provision for doubtful debts of £4.0m (2011: £5.8m). Other receivables increased significantly from 2011 due to inclusion of a £78m receivable from MOD (gross of VAT) in respect of the recovery of prior year restructuring costs.
Ageing of past due but not impaired receivables
Movements on the doubtful debt provision all figures in £ million 2012 2011 At 1 April 5.8 8.8 Created 3.7 2.0 Released (4.2) (4.1)Utilised (1.3) (0.9)At 31 March 4.0 5.8
The maximum exposure to credit risk in relation to trade receivables at the reporting date is the fair value of trade receivables. The Group does not hold any collateral as security.
21. Assets classified as held for sale As at 31 March all figures in £ million 2012 2011 Property, plant and equipment 5.1 7.5 Total assets held for sale 5.1 7.5
Various properties in the UK that are surplus to the Group’s requirements are being marketed for sale.
22. Trade and other payables As at 31 March all figures in £ million 2012 2011 Trade payables 38.5 37.5 Other tax and social security 48.2 34.6 Other payables 17.7 24.5 Accruals and deferred income 394.3 369.0 Total current trade and other payables 498.7 465.6 Payments received on account 20.3 23.1 Other payables 0.3 0.7 Total non-current trade and other payables 20.6 23.8 Total trade and other payables 519.3 489.4
all figures in £ million 2012 2011 Up to three months 36.5 50.1 Over three months 4.1 2.4 40.6 52.5

Financial statements Notes to the financial statements continued
82 QinetiQ Group plc Annual Report and Accounts 2012
23. Provisions Year ended 31 March 2012 all figures in £ million Restructuring Other1 Total At 1 April 2011 10.0 23.0 33.0 Created in year – 0.8 0.8 Released in year (1.0) (3.5) (4.5)Unwind of discount – 1.0 1.0 Utilised in year (8.9) (4.8) (13.7)At 31 March 2012 0.1 16.5 16.6 Current liability 0.1 3.3 3.4 Non-current liability – 13.2 13.2 At 31 March 2012 0.1 16.5 16.6
Year ended 31 March 2011 all figures in £ million Restructuring Other1 Total At 1 April 2010 9.6 14.4 24.0 Created in year 35.5 11.5 47.0 Released in year (3.3) (2.2) (5.5)Unwind of discount – 0.2 0.2 Reclassification to other balance sheet accounts – 1.1 1.1 Utilised in year (31.8) (2.0) (33.8)At 31 March 2011 10.0 23.0 33.0 Current liability 10.0 10.4 20.4 Non-current liability – 12.6 12.6 At 31 March 2011 10.0 23.0 33.0 1 Other provisions comprise environmental, property and other liabilities and are expected to be utilised within the next five years.

Business review Corporate governance Financial statements
QinetiQ Group plc Annual Report and Accounts 2012 83
24. Net debt As at 31 March 2012
2012 2011 all figures in £ million Assets Liabilities Net Assets Liabilities Net Current financial assets/(liabilities) US$ private placement notes – 5.44% – – – – (94.3) (94.3)US$ private placement notes – 7.13% – (15.9) (15.9) – – – US$ private placement notes – 7.62% – (67.3) (67.3) – – – Bank overdraft – – – – (0.3) (0.3)Deferred financing costs – 0.6 0.6 – 0.6 0.6 Bank borrowings – (82.6) (82.6) – (94.0) (94.0)Derivative financial instruments 0.1 (0.1) – – (0.4) (0.4)Finance lease debtor/(creditor) 2.3 (2.2) 0.1 3.0 (2.8) 0.2 Total current financial assets/(liabilities) 2.4 (84.9) (82.5) 3.0 (97.2) (94.2)Non-current assets/(liabilities) US$ private placement notes – 7.13% – (26.6) (26.6) – (39.6) (39.6)US$ private placement notes – 5.50% – (30.4) (30.4) – (78.9) (78.9)US$ private placement notes – 7.62% – (102.0) (102.0) – (152.7) (152.7)Deferred financing costs – 1.0 1.0 – 1.7 1.7 Bank borrowings – (158.0) (158.0) – (269.5) (269.5)Derivative financial instruments 0.1 – 0.1 – – – Finance lease debtor/(creditor) 6.8 (6.4) 0.4 8.2 (7.9) 0.3 Total non-current financial assets/(liabilities) 6.9 (164.4) (157.5) 8.2 (277.4) (269.2)Cash 46.2 – 46.2 58.3 – 58.3 Cash equivalents 71.6 – 71.6 44.2 – 44.2 Total cash and cash equivalents 117.8 – 117.8 102.5 – 102.5 Total net debt as defined by the Group (122.2) (260.9)
At 31 March 2012 £5.2m (31 March 2011: £4.5m) of cash was held by the Group’s captive insurance subsidiary including £0.2m (2011: £0.3m) which was restricted in its use.
All US$ private placement notes have been issued as fixed-rate bonds and have not been converted to floating-rate. Further analysis of the terms and maturity dates for financial liabilities are set out in note 26. In May 2011 the Group repaid the US$135m private placement originally maturing December 2013. In 2012 the Group elected to make early repayment of US$177m of private placement debt, which will complete after the year end.
Reconciliation of net cash flow to movement in net debt all figures in £ million 2012 2011 Increase in cash in the year 15.2 42.9 Repayment of bank loans – 144.1 Proceeds from bank borrowings – (4.9)Repayment of US$ private placement notes 133.6 – Payment of bank loan arrangement fees – 2.4 Settlement of forward contracts 1.6 – Capital element of finance lease payments 2.8 2.8 Capital element of finance lease receipts (3.0) (3.0)Change in net debt resulting from cash flows 150.2 184.3 Amortisation of deferred financing costs (0.6) (1.7)Finance lease receivables 0.9 1.2 Finance lease payables (0.8) (1.0)Foreign exchange and other non-cash movements (11.0) 13.7 Movement in net debt in year 138.7 196.5 Net debt at 31 March 2011 (260.9) (457.4)Net debt at 31 March 2012 (122.2) (260.9)

Financial statements Notes to the financial statements continued
84 QinetiQ Group plc Annual Report and Accounts 2012
24. Net debt continued Finance leases Group as a lessor The minimum lease receivables under finance leases fall as follows:
Minimum lease payments Present value of minimum
lease payments all figures in £ million 2012 2011 2012 2011 Amounts receivable under finance leases Within one year 3.0 3.0 2.3 3.0 In the second to fifth years inclusive 7.5 10.5 6.8 8.2 10.5 13.5 9.1 11.2 Less: unearned finance income (1.4) (2.3) – – Present value of minimum lease payments 9.1 11.2 9.1 11.2
The Group leases out certain buildings under finance leases over a 12-year term that expires in 2015.
Group as a lessee The minimum lease payments under finance leases fall due as follows:
Minimum lease payments Present value of minimum
lease payments all figures in £ million 2012 2011 2012 2011 Amounts payable under finance leases Within one year 2.8 2.8 2.2 2.8 In the second to fifth years inclusive 7.1 9.9 6.4 7.9 9.9 12.7 8.6 10.7 Less future finance charges (1.2) (2.0) – – Present value of minimum lease payments 8.7 10.7 8.6 10.7 Classified as follows: Financial liability – current 2.2 2.8 Financial liability – non-current 6.4 7.9 8.6 10.7
The Group utilises certain buildings under finance leases. Average lease terms are typically between two and ten years (31 March 2011: between two and ten years).
25. Operating leases Group as a lessor The Group receives rental income on certain properties. The Group had contracted with tenants for the following future minimum lease payments:
Group as a lessee all figures in £ million 2012 2011 Lease and sub-lease income statement expense – minimum lease payments 22.1 22.5
The Group had the following total future minimum lease payment commitments:
all figures in £ million 2012 2011 Within one year 18.9 15.2 In the second to fifth years inclusive 67.8 68.2 Greater than five years 22.5 32.2 109.2 115.6
Operating lease payments represent rentals payable by the Group on certain office property and plant. Leases are negotiated for an average of three to ten years.
all figures in £ million 2012 2011 Within one year 7.1 6.5 In the second to fifth years inclusive 23.4 24.0 Greater than five years 1.6 0.1 32.1 30.6

Business review Corporate governance Financial statements
QinetiQ Group plc Annual Report and Accounts 2012 85
26. Financial risk management The Group’s international operations and debt financing expose it to financial risks that include the effects of changes in foreign exchange rates, interest rates, credit risks and liquidity risks.
Treasury and risk management policies, which are set by the Board, specify guidelines on financial risks and the use of financial instruments to manage risk. The instruments and techniques used to manage exposures include foreign currency derivatives and interest rate derivatives. Group treasury monitors financial risks and compliance with risk management policies.
A) Fair values of financial instruments The fair value hierarchy is as follows:
Level 1 – quoted prices (unadjusted) in active markets for identical assets or liabilities;
Level 2 – inputs other than quoted prices including those within Level 1 that are observable for the asset or liability, either directly (as prices) or indirectly (derived from prices); and
Level 3 – Inputs for the assets or liability that are not based on observable market data (unobservable inputs).
The following table presents the Group’s assets and liabilities that are measured at fair value at 31 March 2012:
all figures in £ million Note Level 1 Level 2 Level 3 Total Assets Current other investments 19 1.1 – – 1.1 Current derivative financial instruments 24 – 0.1 – 0.1 Non-current other investments 16 – – 4.8 4.8 Non-current derivative financial instruments 24 – 0.1 – 0.1 Liabilities Current derivative financial instruments 24 – (0.1) – (0.1)Total 1.1 0.1 4.8 6.0
For cash and cash equivalents, trade and other receivables and bank and current borrowings, the fair value of the financial instruments approximate to their carrying value as a result of the short maturity periods of these financial instruments. For trade and other receivables, allowances are made within the carrying value for credit risk. For other financial instruments, the fair value is based on market value, where available. Where market values are not available, the fair values have been calculated by discounting cash flows to net present value using prevailing market-based interest rates translated at the year-end rates, except for unlisted fixed asset investments where fair value equals carrying value.

Financial statements Notes to the financial statements continued
86 QinetiQ Group plc Annual Report and Accounts 2012
26. Financial risk management continued All financial assets and liabilities have a fair value that is identical to book value at 31 March 2012 and 31 March 2011 except where noted below:
As at 31 March 2012
all figures in £ million Note Available
for sale Loans and
receivables
Financial liabilities at amortised
cost
Derivatives used as hedges
Total carrying
value
Total fair
value Financial assets Non-current Finance leases 24 – 6.8 – – 6.8 7.2 Derivative financial instruments – – – 0.1 0.1 0.1 Other investments 16 4.8 – – – 4.8 4.8 Current Finance leases 24 – 2.3 – – 2.3 3.0 Trade and other receivables 20 – 404.8 – – 404.8 404.8 Derivative financial instruments – – – 0.1 0.1 0.1 Current asset investments 19 1.1 – – – 1.1 1.1 Cash and cash equivalents 24 – 117.8 – – 117.8 117.8 5.9 531.7 – 0.2 537.8 538.9 Financial liabilities Non-current Trade and other payables 22 – – (20.6) – (20.6) (20.6)Bank and other borrowings 24 – – (158.0) – (158.0) (185.7)Finance leases 24 – – (6.4) – (6.4) (6.8)Current Trade and other payables 22 – – (498.7) – (498.7) (498.7)Derivative financial instruments 24 – – – (0.1) (0.1) (0.1)Finance leases 24 – – (2.2) – (2.2) (2.8)Bank overdraft, finance cost and private placement 24 – – (82.6) – (82.6) (82.6) – – (768.5) (0.1) (768.6) (797.3)Total 5.9 531.7 (768.5) 0.1 (230.8) (258.4)

Business review Corporate governance Financial statements
QinetiQ Group plc Annual Report and Accounts 2012 87
As at 31 March 2011
all figures in £ million Note Available
for sale Loans and
receivables
Financial liabilities at
amortised cost
Derivatives used as hedges
Total carrying
value
Total fair
value Financial assets Non-current Finance leases 24 – 8.2 – – 8.2 9.2 Equity accounted investments 16 1.1 – – – 1.1 1.1 Other investments 16 4.8 – – – 4.8 4.8 Current Finance leases 24 – 3.0 – – 3.0 3.0 Trade and other receivables 20 – 389.5 – – 389.5 389.5 Current asset investments 19 2.3 – – – 2.3 2.3 Cash and cash equivalents 24 – 102.5 – – 102.5 102.5 8.2 503.2 – – 511.4 512.4 Financial liabilities Non-current Trade and other payables 22 – – (23.8) – (23.8) (23.8)Bank and other borrowings 24 – – (269.5) – (269.5) (298.5)Finance leases 24 – – (7.9) – (7.9) (8.6)Current Trade and other payables 22 – – (465.6) – (465.6) (465.6)Derivative financial instruments 24 – – – (0.4) (0.4) (0.4)Finance leases 24 – – (2.8) – (2.8) (2.8)Bank overdraft, finance cost and private placement 24 – – (94.0) – (94.0) (94.0) – – (863.6) (0.4) (864.0) (893.7)Total 8.2 503.2 (863.6) (0.4) (352.6) (381.3)

Financial statements Notes to the financial statements continued
88 QinetiQ Group plc Annual Report and Accounts 2012
26. Financial risk management continued B) Interest rate risk The Group operates an interest rate policy designed to optimise interest costs and to reduce volatility in reported earnings. The Group’s current policy is to require rates to be fixed for 30-80% of the level of borrowings, which is achieved primarily through fixed-rate borrowings, and through the use of interest rate swaps. Where there are significant changes in the level and/or structure of debt, policy permits borrowings to be 100% fixed, with regular Board reviews of the appropriateness of this fixed percentage. At 31 March 2012 100% (2011: 99%) of the Group’s borrowings were at fixed rates with no adjustment for interest rate swaps.
Financial assets/(liabilities) As at 31 March 2012
Financial asset Financial liability
all figures in £ million Fixed or capped Floating
Non-interest bearing
Fixed or capped Floating
Non-interest bearing
Sterling 9.1 95.2 4.9 (8.6) – (0.1)US dollar – 14.9 – (242.2) – – Euro – 0.2 – – – – Australian dollar – 5.5 1.1 – – – Other – 2.0 – – – – 9.1 117.8 6.0 (250.8) – (0.1)
As at 31 March 2011
Financial asset Financial liability
all figures in £ million Fixed or capped Floating
Non-interest bearing
Fixed or capped Floating
Non-interest bearing
Sterling 11.2 80.8 4.8 (10.7) (0.3) (0.4)US dollar – 15.1 – (365.5) – – Euro – 1.7 – – – – Australian dollar – 4.7 2.3 – – – Other – 0.2 – – – – 11.2 102.5 7.1 (376.2) (0.3) (0.4)
Floating-rate financial assets attract interest based on the relevant national LIBID equivalent. Floating-rate financial liabilities bear interest at the relevant national LIBOR equivalent. Trade and other receivables/payables and deferred finance costs are excluded from this analysis.
For the fixed or capped-rate financial assets and liabilities, the average interest rates (including the relevant marginal cost of borrowing) and the average period for which the rates are fixed are:
2012 2011
Fixed or capped
£m
Weighted average
interest rate %
Weighted average years
to maturity
Fixed or capped
£m
Weighted average
interest rate %
Weighted average years
to maturity Financial assets: Sterling 9.1 13.4 3.5 11.2 13.4 4.5 Financial liabilities: Sterling (8.6) 12.1 3.5 (10.7) 12.1 4.5 US dollar (242.2) 7.2 4.3 (365.5) 6.6 5.2 Total financial liabilities (250.8) 6.7 4.3 (376.2) 6.7 5.1
Sterling assets and liabilities consist primarily of finance leases with the weighted average interest rate reflecting the internal rate of return of those leases.
Interest rate risk management The Group private placement borrowings are fixed-rate, while the revolving credit facility is floating-rate and undrawn as at 31 March 2012. The notional principal amount of the outstanding interest rate swap contracts at 31 March 2012 was £nil.

Business review Corporate governance Financial statements
QinetiQ Group plc Annual Report and Accounts 2012 89
C) Currency risk Transactional currency exposure The Group is exposed to foreign currency risks arising from sales or purchases by businesses in currencies other than their functional currency. It is Group policy that when such a sale or purchase is certain, the net foreign exchange exposure is hedged using forward foreign exchange contracts. Hedge accounting documentation and effectiveness testing are undertaken for all the Group’s transactional hedge contracts.
The table below shows the Group’s currency exposures, being exposures on currency transactions that give rise to net currency gains and losses recognised in the income statement. Such exposures comprise the monetary assets and liabilities of the Group that are not denominated in the functional currency of the operating company involved.
Functional currency of the operating company Net foreign currency monetary assets/(liabilities)
all figures in £ millions US$ Euro AUS$ Other Total 31 March 2012 – sterling 13.4 1.7 6.6 2.2 23.9 31 March 2011 – sterling 15.5 (2.7) 6.4 1.1 20.3
The amounts shown in the table take into account the effect of the forward contracts entered into to manage these currency exposures.
The Group enters into forward foreign currency contracts to hedge the currency exposures that arise on sales and purchases denominated in foreign currencies, as the transaction occurs. The principal contract amounts of the outstanding forward currency contracts as at 31 March 2012 against sterling are net US Dollars sold £6.5m (US$10.4m) and net Euros sold £10.0m (€12m).
Translational currency exposure The Group has significant investments in overseas operations, particularly in the United States. As a result, the sterling value of the Group’s balance sheet can be significantly affected by movement in exchange rates. The Group seeks to mitigate the effect of these translational exposures by matching the net investment in overseas operations with borrowings denominated in their functional currencies unless the cost of such hedging activity is uneconomic. This is achieved by borrowing in the local currency or, in some cases, indirectly through the use of forward foreign exchange contracts.
D) Financial credit risk The Group is exposed to credit-related losses in the event of non-performance by counterparties to financial instruments, but does not currently expect any counterparties to fail to meet their obligations. Credit risk is mitigated by Board-approved policy of only selecting counterparties with a strong investment grade long-term credit rating for cash deposits, normally at least AA- or equivalent. In the normal course of business, the Group operates notional cash pooling systems, where a legal right of set-off applies.
The maximum credit-risk exposure in the event of other parties failing to perform their obligations under financial assets, excluding trade and other receivables, totals £133.0m (2011: £121.9m). The Group held cash and cash equivalents of £117.8m at 31 March 2012 (2011: £102.5m), which represents the maximum credit exposure on these assets. The cash and cash equivalents were held with different financial institutions which were rated AA- or better.
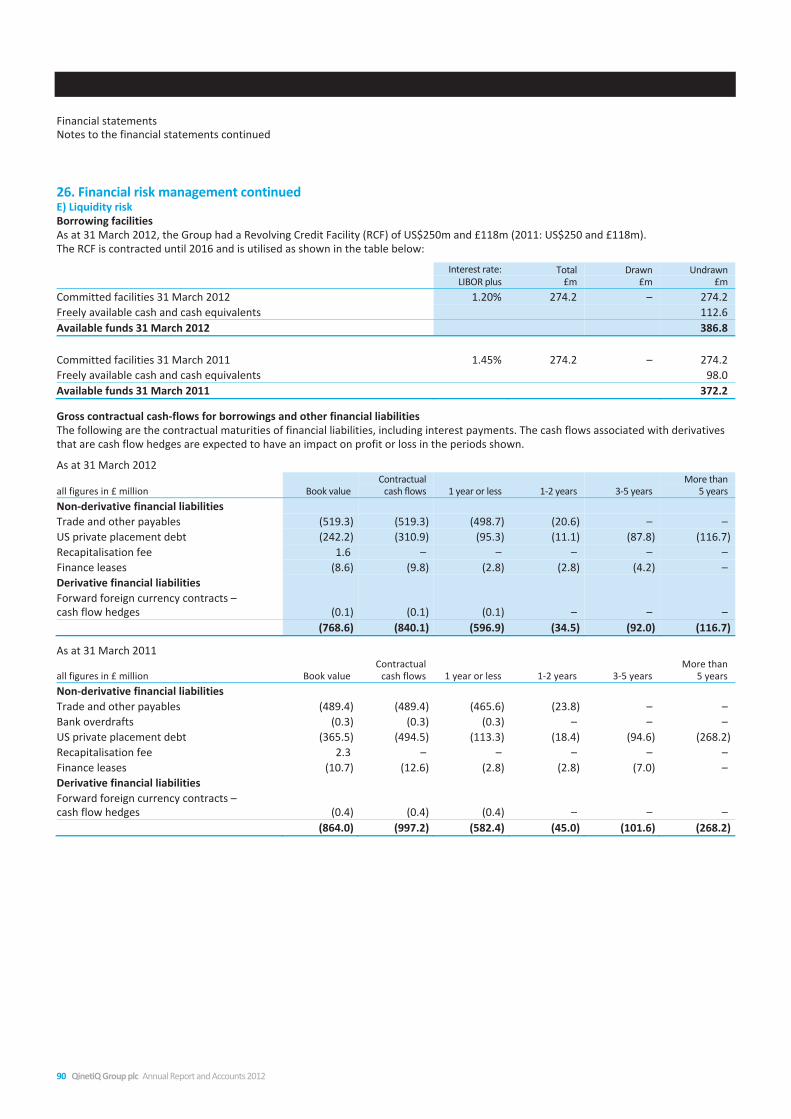
Financial statements Notes to the financial statements continued
90 QinetiQ Group plc Annual Report and Accounts 2012
26. Financial risk management continued E) Liquidity risk Borrowing facilities As at 31 March 2012, the Group had a Revolving Credit Facility (RCF) of US$250m and £118m (2011: US$250 and £118m). The RCF is contracted until 2016 and is utilised as shown in the table below:
Gross contractual cash-flows for borrowings and other financial liabilities The following are the contractual maturities of financial liabilities, including interest payments. The cash flows associated with derivatives that are cash flow hedges are expected to have an impact on profit or loss in the periods shown.
As at 31 March 2012
all figures in £ million Book value Contractual
cash flows 1 year or less 1-2 years 3-5 years More than
5 years Non-derivative financial liabilities Trade and other payables (519.3) (519.3) (498.7) (20.6) – – US private placement debt (242.2) (310.9) (95.3) (11.1) (87.8) (116.7)Recapitalisation fee 1.6 – – – – – Finance leases (8.6) (9.8) (2.8) (2.8) (4.2) – Derivative financial liabilities Forward foreign currency contracts – cash flow hedges (0.1) (0.1) (0.1) – – – (768.6) (840.1) (596.9) (34.5) (92.0) (116.7)
As at 31 March 2011
all figures in £ million Book value Contractual
cash flows 1 year or less 1-2 years 3-5 years More than
5 years Non-derivative financial liabilities Trade and other payables (489.4) (489.4) (465.6) (23.8) – – Bank overdrafts (0.3) (0.3) (0.3) – – – US private placement debt (365.5) (494.5) (113.3) (18.4) (94.6) (268.2)Recapitalisation fee 2.3 – – – – – Finance leases (10.7) (12.6) (2.8) (2.8) (7.0) – Derivative financial liabilities Forward foreign currency contracts – cash flow hedges (0.4) (0.4) (0.4) – – – (864.0) (997.2) (582.4) (45.0) (101.6) (268.2)
Interest rate:
LIBOR plus Total
£m Drawn
£m Undrawn
£m Committed facilities 31 March 2012 1.20% 274.2 – 274.2 Freely available cash and cash equivalents 112.6 Available funds 31 March 2012 386.8 Committed facilities 31 March 2011 1.45% 274.2 – 274.2 Freely available cash and cash equivalents 98.0 Available funds 31 March 2011 372.2

Business review Corporate governance Financial statements
QinetiQ Group plc Annual Report and Accounts 2012 91
F) Derivative financial instruments As at 31 March
2012 2011 all figures in £ million Asset gains Liability losses Net Asset gains Liability losses Net Forward foreign currency contracts – cash flow hedges 0.2 (0.1) 0.1 – (0.4) (0.4)Derivative assets/(liabilities) at the end of the year 0.2 (0.1) 0.1 – (0.4) (0.4)
As at 31 March
G) Maturity of financial liabilities As at 31 March 2012
all figures in £ million
Trade and other
payables
Bank borrowings
and loan notes
Finance leases and derivative
financial instruments Total
Due in one year or less 498.7 82.6 2.3 583.6 Due in more than one year but not more than two years 20.6 (0.6) 2.0 22.0 Due in more than two years but not more than five years – 56.5 4.4 60.9 Due in more than five years – 102.1 – 102.1 519.3 240.6 8.7 768.6
As at 31 March 2011
all figures in £ million
Trade and other
payables
Bank borrowings
and loan notes
Finance leases and derivative
financial instruments Total
Due in one year or less 465.6 94.0 3.2 562.8 Due in more than one year but not more than two years 23.8 (0.6) 1.9 25.1 Due in more than two years but not more than five years – 38.5 5.5 44.0 Due in more than five years – 231.6 0.5 232.1 489.4 363.5 11.1 864.0
2012 2011 all figures in £ million Asset gains Liability losses Net Asset gains Liability losses Net Expected to be recognised: In one year or less 0.1 (0.1) – – (0.4) (0.4)Between one and two years 0.1 – 0.1 – – – 0.2 (0.1) 0.1 – (0.4) (0.4)

Business review Corporate governance Financial statements
QinetiQ Group plc Annual Report and Accounts 2012 93
27. Cash flows from operations For the year ended 31 March
all figures in £ million 2012 2011 Profit after tax for the period 257.9 5.0 Adjustments for: Taxation expense 73.7 21.6 Net finance costs 43.0 30.8 Gain on business combinations and divestments and disposal of investments (11.6) (2.7)Amortisation of purchased or internally developed intangible assets 9.0 11.5 Amortisation of intangible assets arising from acquisitions and impairments 20.3 26.3 Depreciation and impairment of property, plant and equipment 32.5 39.5 (Gain)/loss on disposal of property, plant and equipment (5.8) 1.0 Share of post-tax profit of equity accounted entities (0.1) (0.2)Share-based payments charge 4.2 3.3 (Gain)/loss in respect of previously capitalised DTR-programme bid costs (4.1) 23.8 Changes in retirement benefit obligations (62.4) (13.7)Pension curtailment gain (1.1) (4.9)Pension past service (gain)/loss (141.4) 0.3 Net movement in provisions (15.8) 9.0 198.3 150.6 Decrease/(increase) in inventories 12.1 (5.1)Decrease in receivables 1.2 45.6 Increase in payables 30.3 64.7 Changes in working capital 43.6 105.2 Cash generated from operations 241.9 255.8 Add back: cash outflow relating to UK restructuring 8.9 31.8 Net cash flow from operations before UK restructuring costs 250.8 287.6

Financial statements Notes to the financial statements continued
94 QinetiQ Group plc Annual Report and Accounts 2012
28. Share capital and other reserves Shares allotted, called up and fully paid:
Ordinary shares of 1p each (equity)Special Share of £1
(non-equity) Total £ Number £ Number £ Number
At 1 April 2010 6,604,764 660,476,373 1 1 6,604,765 660,476,374 Issued in the year – – – – – – At 31 March 2011 6,604,764 660,476,373 1 1 6,604,765 660,476,374 Issued in the year – – – – – – At 31 March 2012 6,604,764 660,476,373 1 1 6,604,765 660,476,374
Except as noted below all shares in issue at 31 March 2012 rank pari passu in all respects.
Rights attaching to the Special Share QinetiQ carries out activities which are important to UK defence and security interests. To protect these interests in the context of the ongoing commercial relationship between the MOD and QinetiQ, and to promote and reinforce the Compliance Principles, the MOD holds a Special Share in QinetiQ. The Special Share confers certain rights on the holder:
a) to require the Group to implement and maintain the Compliance System (as defined in the Articles of Association) so as to make at all times effective its and each member of QinetiQ Controlled Group’s application of the Compliance Principles, in a manner acceptable to the Special Shareholder;
b) to refer matters to the Board or the Compliance Committee for its consideration in relation to the application of the Compliance Principles;
c) to veto any contract, transaction, arrangement or activity which the Special Shareholder considers: i) may result in circumstances which constitute unacceptable ownership, influence or control over QinetiQ or any other member
of the QinetiQ consolidated Group contrary to the defence or security interests of the United Kingdom; or ii) would not, or does not, ensure the effective application of the Compliance Principles to and/or by all members of the QinetiQ
Controlled Group or would be or is otherwise contrary to the defence or security interests of the United Kingdom; d) to require the Board to take any action (including, but not limited to, amending the Compliance Principles), or rectify any omission
in the application of the Compliance Principles, if the Special Shareholder is of the opinion that such steps are necessary to protect the defence or security interests of the United Kingdom;
e) to exercise any of the powers contained in the Articles in relation to the Compliance Committee; and f) to demand a poll at any of QinetiQ’s meetings (even though it may have no voting rights except those specifically set out in the
Articles).
The Special Shareholder has an option to purchase defined Strategic Assets of the Group in certain circumstances. The Special Shareholder has, inter alia, the right to purchase any Strategic Assets which the Group wishes to sell. Strategic Assets are normally testing and research facilities (see note 31 for further details).
The Special Share may only be issued to, held by and transferred to H.M. Government (or as it directs). At any time the Special Shareholder may require QinetiQ to redeem the Special Share at par. If QinetiQ is wound up the Special Shareholder will be entitled to be repaid the capital paid up on the Special Share before other shareholders receive any payment. The Special Shareholder has no other right to share in the capital or profits of QinetiQ.
The Special Shareholder must give consent to a general meeting held on short notice.
The Special Share entitles the Special Shareholder to require certain persons who hold (together with any person acting in concert with them) a material interest in QinetiQ to dispose of some or all of their Ordinary Shares in certain prescribed circumstances on the grounds of national security or conflict of interest.
The Directors must register any transfer of the Special Share within seven days.
Changes to the Special Share As announced on 30 March 2012, QinetiQ has obtained MOD consent to changes in its Special Shareholder rights, which are subject to shareholder approval at the 2012 AGM. These changes include the removal of the MOD’s right to veto any transaction or activity and the introduction of a less onerous compliance system similar to those of comparable companies. If approved, the rights detailed in paragraphs (b) to (e) detailed above will be amended as follows:
b) to refer matters to the Board for its consideration in relation to the application of the Compliance Principles; c) to require the Board to obtain the Special Shareholder’s consent:
i) if at any time when the chairman is not a British Citizen, it is proposed to appoint any person to the office of chief executive, who is not a British Citizen; and
ii) if at any time when the chief executive is not a British Citizen, it is proposed to appoint any person to the office of chairman, who is not a British Citizen.

Business review Corporate governance Financial statements
QinetiQ Group plc Annual Report and Accounts 2012 95
d) to require the Board to take action to rectify any omission in the application of the Compliance Principles, if the Special Shareholder is of the opinion that such steps are necessary to protect the defence or security interests of the United Kingdom;
e) deleted.
Other reserves The translation reserve includes the cumulative foreign exchange difference arising on translation since the Group transitioned to IFRS. Movements on hedge instruments, where the hedge is effective, are recorded in the hedge reserve until the hedge ceases.
The capital redemption reserve, which was created following the redemption of preference share capital and the bonus issue of shares, cannot be distributed.
Own shares Own shares represent shares in the Company that are held by independent trusts and include treasury shares and shares held by the employee share ownership plan. Included in retained earnings at 31 March 2012 are 12,819,460 shares (2011: 5,494,001 shares).
29. Share-based payments The Group operates a number of share-based payment plans for employees. The total share-based payment expense in the year was £4.2m of which £3.7m related to equity settled schemes and £0.5m related to cash settled schemes (year to 31 March 2011: £3.3m, all equity settled schemes).

Financial statements Notes to the financial statements continued
96 QinetiQ Group plc Annual Report and Accounts 2012
29. Share-based payments continued Performance Share Plan (PSP) In the year, the Group made awards of conditional shares to certain UK senior executives under the Performance Share Plan. The awards vest after three years with 50% of the awards subject to total shareholder return conditions and 50% subject to EPS conditions as detailed in the QSOS TSR and EPS conditions above.
2012 Number
of shares
2011Number
of shares Outstanding at start of year 3,438,612 3,686,623 Granted during year 1,240,500 943,500 Forfeited/lapsed during year (994,626) (1,191,511)Outstanding at end of year 3,684,486 3,438,612
PSP awards are equity-settled awards and those outstanding at 31 March 2012 had an average remaining life of 1.1 years (2011: 1.7 years). There is no exercise price for these PSP awards. Monte Carlo modelling was used to fair value the TSR element of the awards at grant date. Assumptions used in the models included 34% (2011: 35%) for the average share price volatility to the FTSE comparator group and 36% (2011: 40%) for the average correlation to the comparator group. The weighted average fair value of grants made during the year was £0.88 (2011: £1.01). Of the options outstanding at the end of the year nil were exercisable (2011: nil).
Restricted Stock Units (RSU) In the year the Group granted RSU awards to certain senior US employees under the RSU plan. The awards vest over one, two, three and four years. Of the awards granted before 2012 half are dependent on achieving QNA organic profit growth targets and half on a time-based criterion. The time-based criterion requires the employee to have been in continual service up to the date of vesting. QNA organic profit growth is measured over the most recent financial year compared with the previous financial year, with 125% of this element awarded at a QNA organic profit-growth rate above 15%, 100% awarded at 12.5%, 75% awarded at 10% and 25% awarded at 5%. The 2012 grants are entirely dependent on achieving QNA organic profit-growth targets.
2012 Number of
shares
2011Number of
shares Outstanding at start of year 7,936,513 7,321,228 Granted during year 1,651,250 4,315,625 Exercised during year (2,478,688) (869,663)Forfeited/lapsed during year (1,650,549) (2,830,677)Outstanding at end of year 5,458,526 7,936,513
RSUs are equity-settled awards; those outstanding at 31 March 2012 had an average remaining life of 1.3 years (2011: 1.5 years). There is no exercise price for these RSU awards. The weighted average fair value of grants made during the year was £1.10 (2011: £1.25). Of the awards outstanding at the end of the year 20,724 were exercisable (2011: 7,845).
Value Sharing Plan (VSP) In the year, the Group granted VSP awards to certain senior UK employees under the VSP Plan. The awards vest over a three-year performance period: 50% (2011: 70%) of the awards are dependent on creating additional shareholder value, measured as net cash returns to investors and the increase in PBT over an 8.5% hurdle; 50% (2011: 30%) of the awards are dependent on total shareholder return (TSR) against a comparator group of FTSE 250 listed companies (less investment trusts) over a three-year performance period. Half the awards vest three years from the date of grant, the remaining half of the awards vest four years from the date of grant. Further details of the vesting conditions of the scheme are in the Remuneration Report on page 47.
2012 Number of
shares
2011Number of
shares Outstanding at start of year 6,287,640 – Granted during year 5,361,300 6,287,640 Forfeited during year (543,600) – Outstanding at end of year 11,105,340 6,287,640
VSP awards are equity-settled awards; those outstanding at 31 March 2012 had an average remaining life of 1.7 years (2011: 2.5 years). There is no exercise price for these VSP awards. Monte Carlo modelling was used to fair value the TSR element of the awards at grant date. Assumptions used in the models included 34% (2011: 34%) for the average share price volatility to the FTSE comparator group and 49% (2011: 50%) for the average correlation to the comparator group. The weighted average fair value of grants made during the year was £0.72 (2011: £0.95). Of the awards outstanding at the end of the year nil were exercisable (2011: nil).

Business review Corporate governance Financial statements
QinetiQ Group plc Annual Report and Accounts 2012 97
Group Share Incentive Plan (SIP) Under the QinetiQ Share Incentive Plan the Group offers UK employees the opportunity of purchasing up to £125 worth of shares a month at the prevailing market rate. The Group will make a matching share award of a third of the employee’s payment. The Group’s matching shares may be forfeited if the employee ceases to be employed by QinetiQ within three years of the award of the shares. There is no exercise price for these SIP awards.
2012 Number of
matching shares
2011Number of
matching shares
Outstanding at start of year 1,382,025 1,339,543 Awarded during year 358,350 511,825 Exercised during year (331,536) (414,487)Forfeited during year (89,371) (54,856)Outstanding at end of year 1,319,468 1,382,025
SIP matching shares are equity-settled awards; those outstanding at 31 March 2012 had an average remaining life of 1.5 years (2011: 1.5 years). There is no exercise price for these SIP awards. Of the shares outstanding at the end of the year nil were exercisable (2011: nil).
Group Deferred Annual Bonus Plan (DAB) Under the QinetiQ Deferred Annual Bonus Plan the Group requires certain senior executives to defer part of their annual bonus as shares and be entitled to matching awards to a maximum of 1:1 based on EPS performance. The number that will vest is dependent on the growth of EPS over the measurement period of three years as detailed in the QSOS EPS conditions above. No awards will vest if EPS growth in the vesting period is below 22.5%.
2012 Number of
matching shares
2011Number of
matching shares
Outstanding at start of year 6,859 11,988 Granted during year 480,922 – Exercised during year – (2,052)Forfeited during year (39,099) (3,077)Outstanding at end of year 448,682 6,859
DAB matching shares are equity-settled awards; those outstanding at 31 March 2012 had an average remaining life of 2.2 years (2011: 1.2 years). There is no exercise price for these DAB awards. Of the shares outstanding at the end of the year nil were exercisable (2011: nil).
Cash Alternative Units (CAU) In the year, the Group granted CAU awards to certain US employees.
2012 Number of
shares
2011Number of
shares Outstanding at start of year – – Awarded during year 1,321,000 – Forfeited during year (12,000) – Outstanding at end of year 1,309,000 –
CAUs are cash-settled awards which vest over one, two, three and four years from the date of grant. The CAUs have no performance criteria attached, other than the requirement that the employee remains in employment with the Group. Those awards outstanding at 31 March 2012 had an average remaining life of 1.8 years. There is no exercise price for these awards. The fair value of the grants at 31 March 2012 was £1.59 being the Group’s closing share price on that day. The carrying amount of the liability of the grants at the balance sheet date was £0.5m. No CAUs expired during the year and none were exercisable.
Share-based award pricing – other Share-based awards that vest based on non-market performance conditions, including certain PSP, RSUs and Deferred Annual Bonus awards, have been valued at the share price at grant, less attrition. For the 2003 Share Option Scheme, there was a pre-bonus issue weighted average share price of £1 and a weighted average exercise price of £1 based on third-party transactions in the Company’s shares in the period immediately before the issue of the share options. Before the IPO in February 2006, there was no active market for the Company’s shares and expected volatility was, therefore, determined using the average volatility for a comparable selection of businesses. Since the Group had no established pattern of dividend payments at this time, no dividends were assumed in this model.

Financial statements Notes to the financial statements continued
98 QinetiQ Group plc Annual Report and Accounts 2012
30. Post-retirement benefits The QinetiQ Pension Scheme In the UK the Group operates the QinetiQ Pe

Business review Corporate governance Financial statements
QinetiQ Group plc Annual Report and Accounts 2012 99
The fair value of the scheme’s assets, which are not intended to be realised in the short term and may be subject to significant change before they are realised, and the present value of the scheme’s liabilities, which are derived from cash flow projections over long periods, and thus inherently uncertain, were:
all figures in £ million 2012 2011 2010 2009 Equities 583.2 564.1 714.6 473.7 Corporate bonds 194.6 158.7 69.5 78.4 Government bonds 183.5 165.3 69.6 83.2 Property 82.4 78.0 53.4 – Other 64.2 15.0 8.8 12.1 Total market value of assets 1,107.9 981.1 915.9 647.4 Present value of scheme liabilities (1,139.4) (1,105.7) (1,063.2) (752.6)Net pension liability before deferred tax (31.5) (124.6) (147.3) (105.2)Deferred tax asset 13.3 32.4 41.2 29.4 Net pension liability (18.2) (92.2) (106.1) (75.8) Changes to the fair value of scheme assets
Changes to the present value of the defined benefit obligation
Total income/expense recognised in the income statement
Analysis of amounts recognised in statement of comprehensive income all figures in £ million 2012 2011 2010 2009 Total actuarial loss (gross of deferred tax) (118.2) (4.7) (60.2) (95.7)Cumulative total actuarial losses recognised in the Statement of Recognised Income and Expense (376.3) (258.1) (253.4) (193.2)History of scheme experience gains and losses* Experience gains/(losses) on scheme assets 2.9 (14.0) 206.6 (212.8)Experience gains/(losses) on scheme liabilities 10.8 32.0 (2.9) 37.1 *Experience gains and losses exclude the impact of changes in assumptions.
all figures in £ million 2012 2011 Opening fair value of scheme assets 981.1 915.9 Expected return on assets 67.6 68.6 Actuarial gain/(loss) on scheme assets 2.9 (14.0)Contributions by the employer 83.2 36.6 Contributions by plan participants 0.1 0.2 Net benefits paid out and transfers (27.0) (26.2)Closing fair value of scheme assets 1,107.9 981.1
all figures in £ million 2012 2011 Opening defined benefit obligation 1,105.7 1,063.2 Current service cost 20.8 22.9 Interest cost 61.2 59.5 Contributions by plan participants 0.1 0.2 Actuarial loss/(gain) on scheme liabilities 121.1 (9.3)Curtailment gain (1.1) (4.9)Past service (gain)/cost (141.4) 0.3 Net benefits paid out and transfers (27.0) (26.2)Closing defined benefit obligation 1,139.4 1,105.7
all figures in £ million 2012 2011 Pension costs charged to the income statement: Current service cost 20.8 22.9 Past service (gain)/cost (141.4) 0.3 Interest cost 61.2 59.5 Expected return on plan assets (67.6) (68.6)Curtailment gain (1.1) (4.9)Total (income)/expense recognised in the income statement (gross of deferred tax) (128.1) 9.2

Financial statements Notes to the financial statements continued
100 QinetiQ Group plc Annual Report and Accounts 2012
30. Post-retirement benefits continued Assumptions The major assumptions (weighted to reflect individual scheme differences) were:
2012 2011 Rate of increase in salaries 3.6% 4.6%Rate of increase in pensions in payment 3.6% 3.6%Discount rate applied to scheme liabilities 4.8% 5.6%RPI inflation assumption 3.4% 3.6%CPI inflation assumption 2.6% 2.7%Assumed life expectancies in years: Future male pensioners (currently aged 60) 88 88 Future female pensioners (currently aged 60) 90 90 Future male pensioners (currently aged 40) 90 90 Future female pensioners (currently aged 40) 92 91
The assumptions used by the actuary are the best estimates chosen from a range of possible actuarial assumptions which, because of the timescale covered, may not necessarily be borne out in practice. It is important to note that these assumptions are long term and, in the case of the discount rate and the inflation rate, are measured by external market indicators. The mortality assumptions as at 31 March 2012 were 90% of S1PMA for males and 100% of S1PFA for females, based on year of birth making allowance for improvements in mortality in line with CMI_2011 Core Projections and a long-term rate of improvement of 1.25% per annum. The comparative period used mortality rates reflecting the tables as published by the Continuous Mortality Investigation and previously adopted as standard by the actuarial profession. These were tables PNMA00MC (for males) and PNFA00MC (for females) for members’ year of birth.
The balance sheet net pension liability is a snapshot view which can be significantly influenced by short-term market factors. The calculation of the surplus or deficit depends, therefore, on factors which are beyond the control of the Group – principally the value at the balance sheet date of equity shares in which the scheme has invested and long-term interest rates which are used to discount future liabilities. The funding of the scheme is based on long-term trends and assumptions relating to market growth, as advised by qualified actuaries and investment advisors.
Sensitivity analysis of the principal assumptions used to measure scheme liabilities
Scheme assets The overall expected rate of return on plan assets is based on the expected return rates for each asset class. Equity return rates are the long-term expected return rates based on the market rates of return for risk-free investments, typically government bonds, together with the historical level of risk premium associated with equities; with the resulting rate then being reviewed and benchmarked against a peer group of listed companies. Expected long-term rates of return on scheme assets (weighted to reflect the individual scheme actual asset allocations) were:
Return on scheme assets
Defined contribution schemes Payments to the defined contribution schemes totalled £20.3m (March 2011: £24.1m).
Assumption Change in assumption Impact on scheme liabilities Discount rate Increase/decrease by 0.1% Decrease/increase by £21.1m Rate of inflation Increase/decrease by 0.1% Increase/decrease by £22.2m Salary increase Increase/decrease by 0.1% Increase/decrease by £3.5m Rate of mortality Increase by one year Increase by £19.3m
2012 2011 Equities 7.3% 8.0%Corporate bonds 4.3% 5.5%Government bonds 3.2% 4.3%Property 6.8% 8.0%Cash 3.2% 4.3%Weighted average 5.8% 6.9%
all figures in £ million 2012 2011 Actual return on plan assets: Expected return on scheme assets 67.6 68.6 Actuarial gain/(loss) on scheme assets 2.9 (14.0)Actual gain on scheme assets 70.5 54.6

Business review Corporate governance Financial statements
QinetiQ Group plc Annual Report and Accounts 2012 101
31. Transactions with the MOD The MOD continues to own its Special Share in QinetiQ which conveys certain rights as set out in note 28. Transactions between the Group and the MOD are disclosed as follows:
Recovery of UK restructuring costs QinetiQ reached agreement with the UK MOD in March 2012 involving a payment to QinetiQ of £65m that was received after the year end in April 2012. The agreement involves the discharging of the MOD from its accumulated liabilities for restructuring costs incurred in previous years, together with MOD agreement to changes in its Special Shareholder rights, and certain other operational issues.
Freehold land and buildings and surplus properties Under the terms of the Group’s acquisition of part of the business and certain assets of DERA from the MOD on 1 July 2001, the MOD retained certain rights in respect of the freehold land and buildings transferred.
i) Restrictions on transfer of title The title deeds of those properties with strategic assets (see below) include a clause that prevents their transfer without the approval of the MOD. The MOD also has the right to purchase any strategic assets in certain circumstances.
ii) Property clawback agreement The MOD retains an interest in future profits on disposal following a ‘trigger event’. A ‘trigger event’ includes the granting of planning permission for development and/or change of use, and the disposition of any of the acquired land and buildings. During the 12 years from 1 July 2001, following a ‘trigger event’, the MOD is entitled to clawback a proportion of the gain on each individual property transaction in excess of a 30% gain on a July 2001 professional valuation. The proportion of the excess gain due to the MOD is based on a sliding scale that reduces over time from 50% to 9% and at 31 March 2012 stood at 16% (2011: 16%). The July 2001 valuation was approximately 16% greater in aggregate than the consideration paid for the land and buildings on 1 July 2001.
Compliance Regime The Compliance Committee monitors the effective application of the Compliance Regime required by the MOD to maintain the position of QinetiQ as a supplier of independent and impartial scientific/technical advice to the MOD and ensures that the required standards are met in trials involving human volunteers.
Strategic assets Under the Principal Agreement with the MOD, the QinetiQ controlled Group is not permitted without the written consent of the MOD, to:
i) dispose of or destroy all or any part of a strategic asset; or ii) voluntarily undertake any closure of, or cease to provide a strategic capability by means of, all or any part of a strategic asset.
The net book value of assets identified as being strategic assets as at 31 March 2012 was £1.5m (31 March 2011: £3.8m).
Long-Term Partnering Agreement On 27 February 2003 QinetiQ Limited entered into a Long-Term Partnering Agreement to provide the Test and Evaluation (T&E) facilities and training support services to the MOD. This is a 25-year contract with a total revenue value of up to £5.6bn, dependent on the level of usage by the MOD, under which QinetiQ Limited is committed to providing the T&E services with increasing efficiencies through cost saving and innovative service delivery.
32. Contingent liabilities and assets Subsidiary undertakings within the Group have given unsecured guarantees of £55.1m at 31 March 2012 (31 March 2011: £56.7m) in the ordinary course of business.
The Group is aware of claims and potential claims by, or on behalf of, current and former employees, including former employees of the MOD and DERA and contractors, in respect of intellectual property, employment rights and industrial illness and injury, which involve or may involve legal proceedings against the Group. The Directors are of the opinion, having regard to legal advice received, and the Group’s insurance arrangements and provisions carried in the balance sheet, that it is unlikely that these matters will, in aggregate, have a material effect on the Group’s financial position, results of operations and liquidity.
The Group has not recognised contingent amounts receivable relating to the Chertsey property which was disposed of during 2004 or the Fort Halstead property disposed of in September 2005. Additional consideration, subject to clawback to the MOD pursuant to the arrangements referred to in note 31, is potentially due on the purchasers obtaining additional planning consents, with the quantum dependent on the scope of the consent achieved.
The Group has also not recognised contingent amounts receivable relating to property impairments in prior years that may potentially be recovered from the MOD. Recovery is subject to future negotiations. It is not considered practicable to calculate the value of this contingent asset.

Financial statements Notes to the financial statements continued
102 QinetiQ Group plc Annual Report and Accounts 2012
33. Capital commitments The Group had the following capital commitments for which no provision has been made:
all figures in £ million 2012 2011 Contracted 14.1 4.3
Capital commitments at 31 March 2012 include £13m (2011: £3.9m) in relation to property, plant and equipment that will be wholly-funded by a third-party customer under long-term contract arrangements.
34. Subsidiaries The companies listed below are those which were part of the Group at 31 March 2012 and which, in the opinion of the Directors, significantly affected the Group’s results and net assets during the year. The Directors consider that those companies not listed are not significant in relation to the Group as a whole. A comprehensive list of all subsidiaries will be disclosed as an appendix to the Group’s annual return.
Name of company Principal area of operation Country of incorporation Subsidiaries1,2,3 QinetiQ Holdings Limited UK England & Wales QinetiQ Limited UK England & Wales QinetiQ Overseas Holdings Limited UK England & Wales QinetiQ North America, Inc. USA USA QinetiQ US Holdings, Inc. USA USA Analex Corporation USA USA Apogen Technologies, Inc. USA USA Foster-Miller, Inc. USA USA Westar Aerospace & Defence Group, Inc. USA USA 1 Accounting reference date is 31 March. All principal subsidiary undertakings listed above have financial year ends of 31 March and 100% of the ordinary
shares are owned by the Group. 2 QinetiQ Holdings Limited is a direct subsidiary of QinetiQ Group plc. All other subsidiaries are held indirectly by other subsidiaries of QinetiQ Group plc. 3 All companies except for holding companies are operating companies engaged in the Group’s principal activities as described on page 53.

Business review Corporate governance Financial statements
COMPANY BALANCE SHEET as at 31 March
QinetiQ Group plc Annual Report and Accounts 2012 103
all figures in £ million Note 2012 2011 Fixed assets Investments in subsidiary undertaking 2 447.6 112.0 447.6 112.0 Current assets Debtors 3 – 306.3 – 306.3 Current liabilities Creditors amounts falling due within one year 4 (118.3) (79.2)Net current assets (118.3) 227.1 Net assets 329.3 339.1 Capital and reserves Equity share capital 6 6.6 6.6 Capital redemption reserve 6 39.9 39.9 Share premium account 6 147.6 147.6 Profit and loss account 6 135.2 145.0 Capital and reserves attributable to shareholders 329.3 339.1
There are no other recognised gains and losses.
The financial statements of QinetiQ Group plc (company number 4586941) were approved by the Board of Directors and authorised for issue on 24 May 2012 and were signed on its behalf by:
Mark Elliott Chairman
Leo Quinn Chief Executive Officer
David Mellors Chief Financial Officer

NOTES TO THE COMPANY FINANCIAL STATEMENTS
104 QinetiQ Group plc Annual Report and Accounts 2012
1. Accounting policies The following accounting policies have been applied consistently in dealing with items which are considered material in relation to the Company’s financial statements.
Basis of preparation The financial statements have been prepared under the historical cost convention and in accordance with applicable UK accounting standards. As permitted by section 408(4) of the Companies Act 2006, a separate profit and loss account dealing with the results of the Company has not been presented.
Investments In the Company’s financial statements, investments in subsidiary undertakings are stated at cost less any impairment in value.
Share-based payments The fair value of equity-settled awards for share-based payments is determined on grant and expensed straight line over the period from grant to the date of earliest unconditional exercise. The fair value of cash-settled awards for share-based payments is determined at each period end until they are exercised or lapse. The value is expensed straight line over the period from grant to the date of earliest unconditional exercise. The charges for both equity and cash-settled share-based payments are updated annually for non-market-based vesting conditions. Further details of the Group’s share-based payment charge is disclosed in note 29 of the Group financial statements. The cost of share-based payments is charged to subsidiary undertakings.
2. Investment in subsidiary undertaking As at 31 March all figures in £ million 2012 2011 Subsidiary undertaking – 100% of ordinary share capital of QinetiQ Holdings Limited 424.3 92.4 Capital contributions arising from share-based payments to employees of subsidiaries 23.3 19.6 447.6 112.0
A list of all principal subsidiary undertakings of QinetiQ Group plc is disclosed in note 34 to the Group financial statements. The increase in investment in the year relates to the capitalisation of a loan with a Group subsidiary.
3. Debtors As at 31 March
4. Creditors As at 31 March
5. Share capital The Company’s share capital is disclosed in note 28 to the Group financial statements.
all figures in £ million 2012 2011 Amounts owed by Group undertakings – 306.3
all figures in £ million 2012 2011 Amounts owed to Group undertakings 118.3 79.2

Business review Corporate governance Financial statements
Financial statements Notes to the Company financial statements continued
QinetiQ Group plc Annual Report and Accounts 2012 105
6. Reserves
all figures in £ million Issued share
capital
Capital redemption
reserve Share
premium Profit
and loss Total
equity At 1 April 2011 6.6 39.9 147.6 145.0 339.1 Profit – – – 14.8 14.8 Purchase of own shares – – – (11.9) (11.9)Dividend paid – – – (16.4) (16.4)Share-based payments – – – 3.7 3.7 At 31 March 2012

FIVE-YEAR RECORD FOR THE YEARS ENDED 31 MARCH (UNAUDITED)
106 QinetiQ Group plc Annual Report and Accounts 2012
all figures in £ million 2012 20114 2010 UK Services £m 610.1 652.7 693.9 US Services £m 534.5 607.3 628.0 Global Products £m 325.0 442.6 303.5 Revenue £m 1,469.6 1,702.6 1,625.4 UK Services £m 63.0 47.4 59.1 US Services £m 32.1 45.9 52.6 Global Products £m 66.2 52.1 8.6 Underlying operating profit1 £m 161.3 145.4 120.3 2011 20103 20092 20082 QinetiQ North America £m 800.1 765.6 540.2 EMEA £m 818.8 842.3 820.1 Ventures £m 6.5 9.4 5.7 Revenue £m 1,625.4 1,617.3 1,366.0 QinetiQ North America £m 67.7 83.0 62.1 EMEA £m 61.1 84.2 80.0 Ventures £m (8.5) (15.6) (15.1)Underlying operating profit1 £m 120.3 151.6 127.0 Underlying operating margin1 % 11.0 8.5 7.4 9.4 9.3 Underlying profit before tax1 £m 118.3 114.6 85.7 130.2 109.0 Profit/(loss) before tax £m 331.6 26.6 (66.1) 114.0 51.4 Profit/(loss) after tax £m 257.9 5.0 (63.3) 93.6 47.4 Underlying basic EPS1 (pence) Pence 14.6 14.2 11.1 15.9 13.4 Basic EPS (pence) Pence 39.6 0.8 (9.7) 14.3 7.2 Diluted EPS (pence) Pence 39.4 0.8 (9.7) 14.3 7.2 Dividend per share Pence 2.90 1.60 1.58 4.75 4.25 Underlying net cash from operations (post capex)1 £m 235.4 265.8 169.2 175.2 138.3 Net debt £m 122.2 260.9 457.4 537.9 379.9 Average number of employees 10,637 12,033 13,604 13,882 13,470 Orders £m 1,226.3 1,559.7 1,400.9 1,596.0 1,277.1 1 Underlying measures are stated before amortisation of intangibles arising from acquisitions and specific non-recurring items. Definitions of underlying
measures of performance are in the glossary on page 107. Underlying financial measures are presented because the Board believes these provide a better representation of the Group’s long-term performance trend.
2 Operating profit and operating margins for 2009 and 2008 have been restated to show the net finance element of the IAS 19 pension cost in the finance income and expense lines. This was previously reported in other operating costs.
3 The Group’s management structure changed with effect from 1 April 2010. Comparatives for the new structure have been provided for 2010. Segmental data for 2008 to 2010 has been retained on the old structure as reported in previous financial statements.
4 The 2011 figures have been restated to reflect the transfer of businesses from Global Products to UK Services and US Services at the beginning of the 2012 financial year.
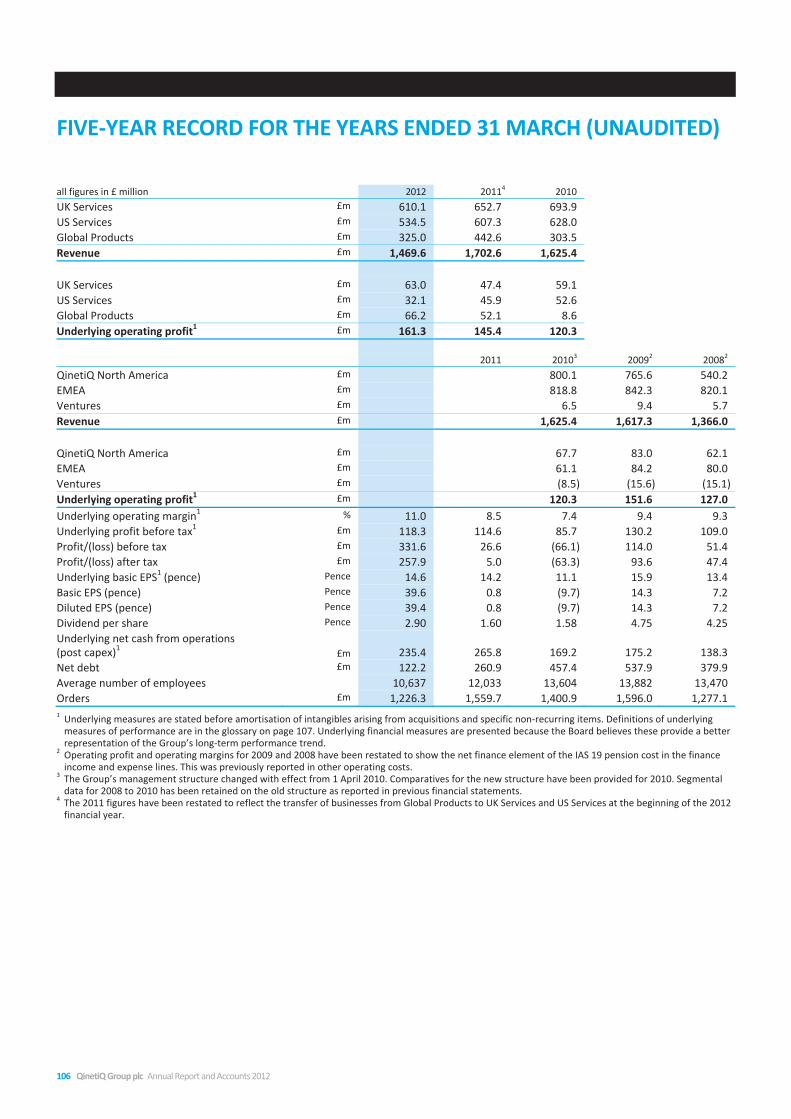
Business review Corporate governance Financial statements
GLOSSARY
QinetiQ Group plc Annual Report and Accounts 2012 107
ABI Association of British Insurers AGM Annual General Meeting
Book to bill ratio Ratio of funded orders received in the year to
revenue for the year, adjusted to exclude revenue from the 25-year LTPA contract
BPS Basis points BSI British Standards Institution
CAGR Compound Annual Growth Rate C4ISR Command, control, communications, computers,
intelligence, surveillance and reconnaissance COTS Commercial off-the-shelf
CR Corporate Responsibility
DAB Deferred Annual Bonus DERA Defence Evaluation and Research Agency, the
majority of which was transferred into QinetiQ in 2001
DHS US Department of Homeland Security DoD US Department of Defense DTR MOD’s Defence Training Rationalisation programme
EBITDA Earnings before interest, tax, depreciation
and amortisation EMEA Europe, Middle East and Australasia
EPS Earnings per share
Funded backlog The expected future value of revenue from contractually committed and funded customer orders (excluding £3.6bn value of the remaining 16 years of the LTPA contract)
Gearing ratio This is the ratio of net debt to adjusted EBITDA in
accordance with the Group’s credit-facility ratios. EBITDA is adjusted to exclude charges for share-based payments. Net debt is adjusted to reflect the same exchange rates as used for EBITDA and to reflect other requirements of the debt-holders covenant calculations
GWh Giga-Watt hours
IAS International Accounting Standards IDIQ Indefinite Delivery/Indefinite Quantity IFRS International Financial Reporting Standards IPO Initial Public Offering
KPI Key Performance Indicator
LIBID London inter-bank bid rate
LIBOR London inter-bank offered rate LSE London Stock Exchange
LTPA Long-Term Partnering Agreement – 25-year contract established in 2003 to manage the MOD’s test and evaluation ranges
MOD UK Ministry of Defence
NASA National Aeronautics and Space Administration
(USA)
OHSAS Occupational Health and Safety Advisory Services Organic Growth The level of year-on-year growth, expressed as
a percentage, calculated at constant foreign exchange rates, adjusting comparatives to incorporate the results of acquired entities but excluding the results for any disposals or discontinued operations for the same duration of ownership as the current period
PBT Profit before tax PSP Performance Share Plan
QNA QinetiQ North America
QSOS QinetiQ Share Option Scheme
R&D Research and development ROCE Return on Capital Employed
RSU Restricted Stock Unit
Specific non-recurring items and
acquisition amortisation
Net restructuring charges/recoveries; pension curtailment gains; pension past service gains; contingent payments on acquisition treated as remuneration; net gain/loss in respect of previously capitalised DTR-programme bid costs; impairment of property; impairment of intangible assets; gain/(loss) on business combinations and divestments; gain/(loss) on disposal of investments; and tax thereon
TSR Total Shareholder Return
UK Corporate
Governance Code Guidelines of the Financial Reporting Council to address the principal aspects of corporate governance
UK GAAP UK Generally Accepted Accounting Practice Underlying basic
earnings per share Basic earnings per share as adjusted to exclude ‘specific non-recurring items and acquisition amortisation’
Underlying effective tax rate
The tax charge for the year excluding the tax impact of ‘specific non-recurring items and acquisition amortisation’ expressed as a percentage of underlying profit before tax
Underlying net cash from operations
(post capex)
Net cash inflow from operations before restructuring costs less net cash outflow on purchase/sale of intangible assets and property, plant and equipment
Underlying operating cash conversion
The ratio of underlying net cash from operations (post capex) to underlying operating profit excluding share of post-tax result of equity-accounted joint ventures and associates
Underlying operating margin
Underlying operating profit expressed as a percentage of revenue
Underlying operating profit
Operating profit as adjusted to exclude ‘specific non-recurring items and acquisition amortisation’
Underlying profit before tax
Profit before tax as adjusted to exclude ‘specific non-recurring items and acquisition amortisation’
Unfunded Orders Typically long-term contracts awarded by the US government which the customer funds incrementally over the life of the contract. The Group does not recognise such awards into the reported backlog until funding is confirmed
VSP Value Sharing Plan


Registered office Cody Technology Park Ively Road, Farnborough Hampshire GU14 0LX United Kingdom
Tel +44 (0) 8700 100 942 www.QinetiQ.com
Company Registration Number 4586941
©QinetiQ Group plc QINETIQ/CF/CM/AR1200023