peonies for field cut flower production - uaf home 44.pdfjacent rows on the same 39-inch-wide ......
TRANSCRIPT
AFESResearchProgressReport44 �
Peonies for field cut flower Production
Patricia S. Holloway, Janice T. Hanscom and Grant E.M. Matheke
Cultivar trials with herbaceous peonies were begun during the summer of 2001 to evaluate their potential as field grown cut flowers. All but three cultivars bloomed in 2002. In 2003, all cultivars produced blooms, although individual plants of nine cultivars did not bloom (Holloway et al. 2004). The bloom times for all cultivars ranged from 30 June through the first week of August in both 2003 and 2004. Potential problems identified in 2003 included Botrytis sp. rot and short stem length (Holloway et al. 2003, 2004).
Managementrecommendationsforfieldproductionof peonies vary widely among commercial growers andresearchers. Plant spacing recommendations range from�8inchesto4feetbetweenplants.Becausepeoniesgrowacrossabroadgeographicarea,recommendationsonsoilsandsoilamendmentsdifferbyregion.Noinformationisavailable on basic cultivation techniques for peonies inAlaska.Thepurposeofthisreportistopresentresultsof
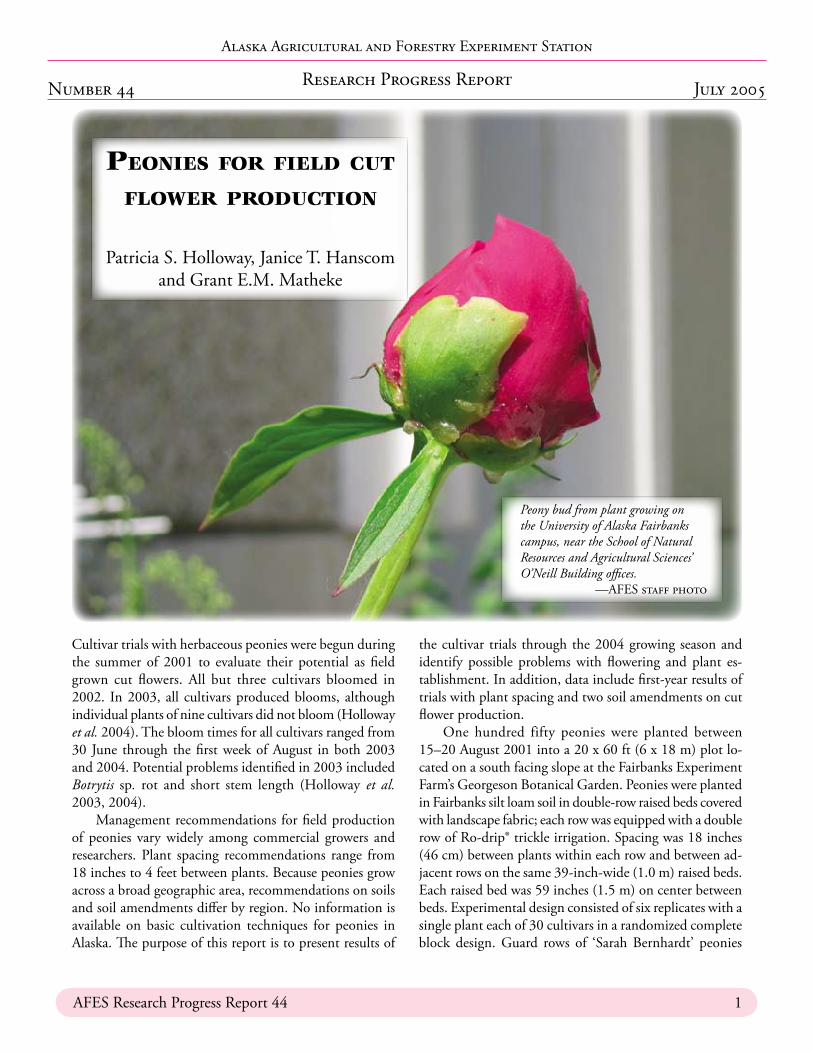
Peony bud from plant growing on the University of Alaska Fairbanks campus, near the School of Natural Resources and Agricultural Sciences’ O’Neill Building offices.
—AFESstaffphoto
thecultivar trials throughthe2004growingseasonandidentify possible problems with flowering and plant es-tablishment.Inaddition,dataincludefirst-yearresultsoftrialswithplantspacingandtwosoilamendmentsoncutflowerproduction.
One hundred fifty peonies were planted between�5–20August200�intoa20x60ft(6x�8m)plotlo-catedonasouthfacingslopeattheFairbanksExperimentFarm’sGeorgesonBotanicalGarden.PeonieswereplantedinFairbankssiltloamsoilindouble-rowraisedbedscoveredwithlandscapefabric;eachrowwasequippedwithadoublerowofRo-drip®trickleirrigation.Spacingwas�8inches(46cm)betweenplantswithineachrowandbetweenad-jacentrowsonthesame39-inch-wide(�.0m)raisedbeds.Eachraisedbedwas59inches(�.5m)oncenterbetweenbeds.Experimentaldesignconsistedofsixreplicateswithasingleplanteachof30cultivarsinarandomizedcompleteblock design. Guard rows of ‘Sarah Bernhardt’ peonies
ResearchProgressReportNumber44 July2005
AlaskaAgriculturalandForestryExperimentStation
2 PeoniesforFieldCutFlowerProduction
surroundedtheplotonallsides.PlotsweremulchedwithsprucebranchesinOct200�andstrawinOct2002.Theywerenotmulchedin2003,butfoliagewasremovedattheendoftheseasontominimizediseaseproblems.
In2002,asecondtrialplotidenticalinsizeandsimilarinlayoutonraisedbedstothecultivartrialswasplantedwith‘SarahBernhardt’peoniesatthreespacings:30,45and60cmbetweenplants.Treatmentswererandomizedwithinthreemainplots:unamendedFairbankssiltloamsoilsandthoseamendedwitha�5cmlayerofLemetapeatorcom-postfromtheUAFAgriculturalandForestryExperimentStationfarm.Theamendmentsweretilledintothetop20cmofthesoilsurfacebeforeplanting.Betweenrowspacing,weeklyirrigation,anduseoflandscapefabricmulchwereidenticaltothecultivarstudy.Peonieswereplantedinasplitplotdesignwithtenplantsperspacing/amendmentcombination. Five plants per treatment were randomlyselectedfornondestructiveanalysisofflowerbudsusingAnalysisofVariance.Nodatawerecollectedin2003.
Cultivar trials
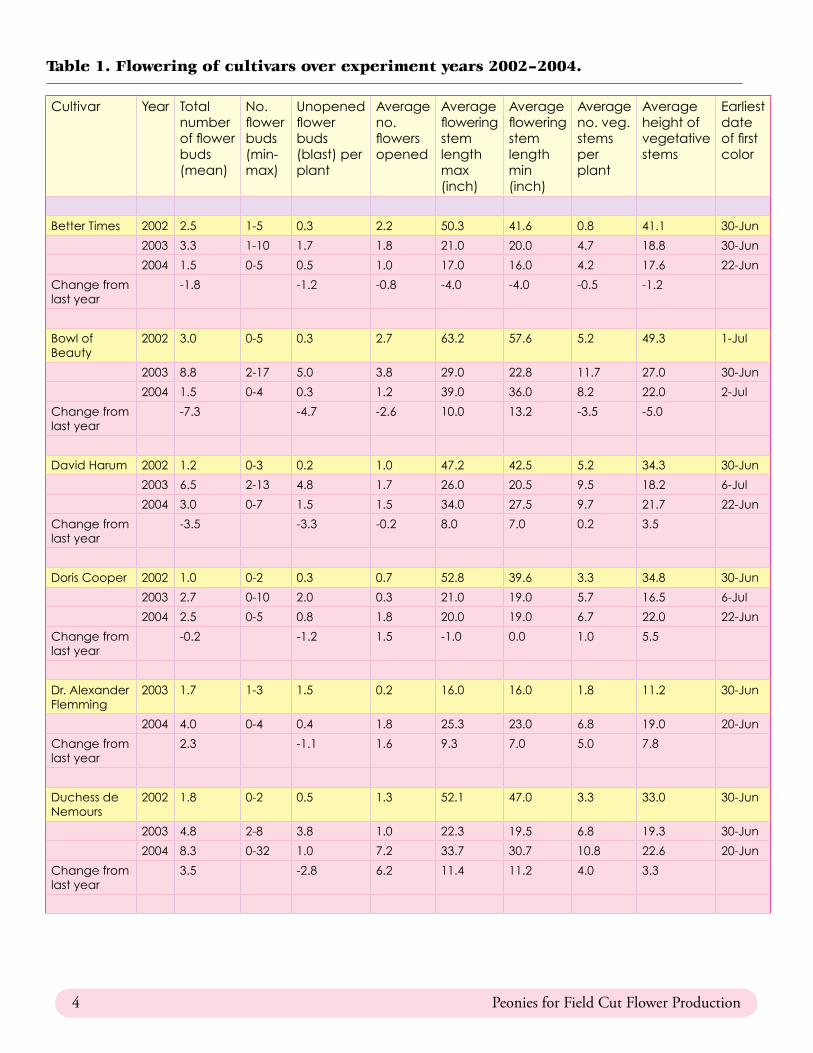
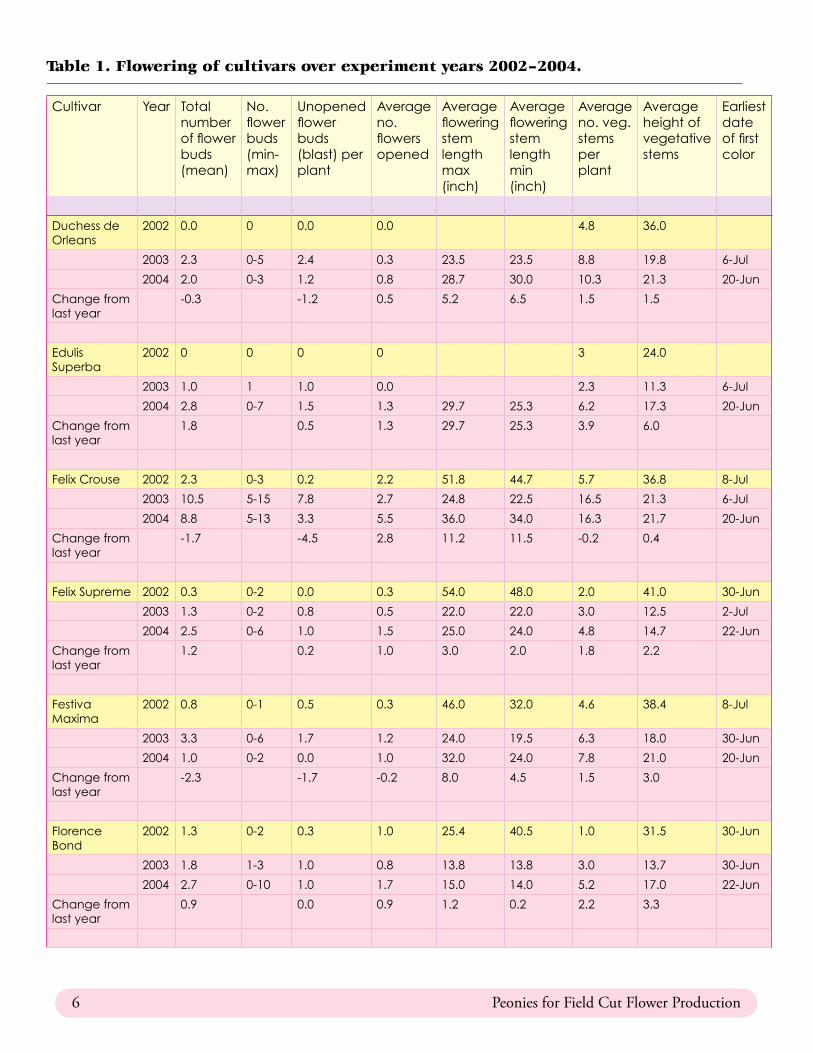
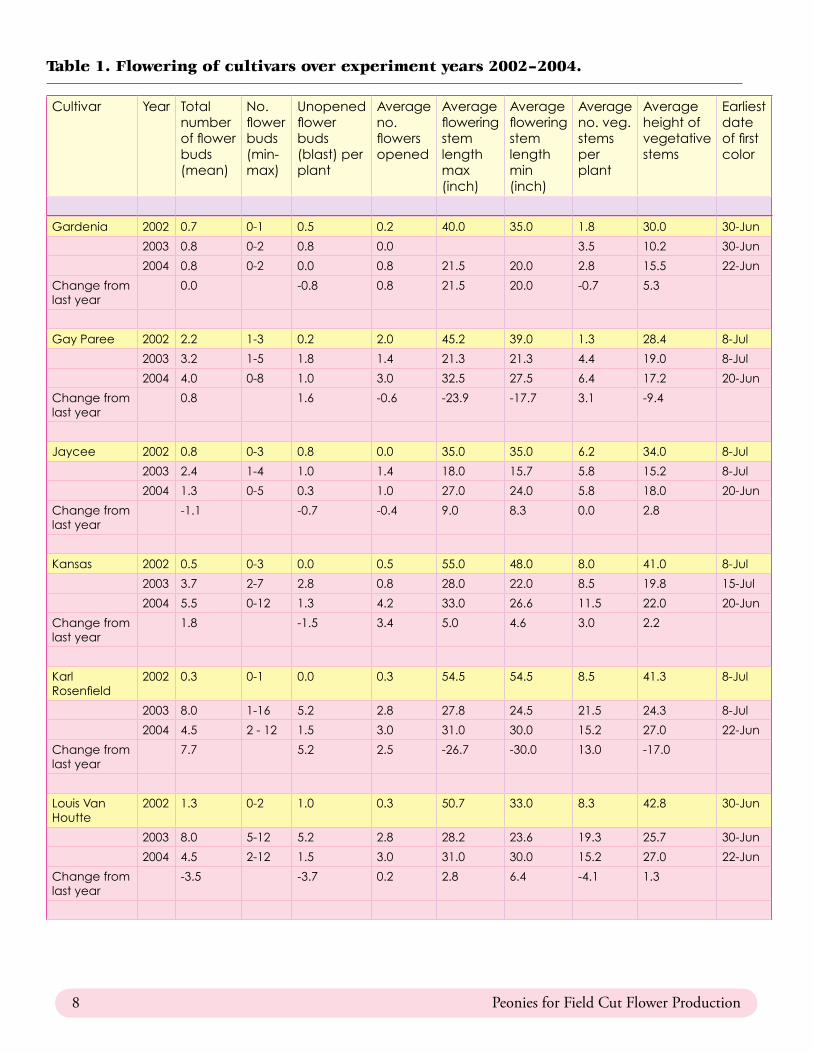
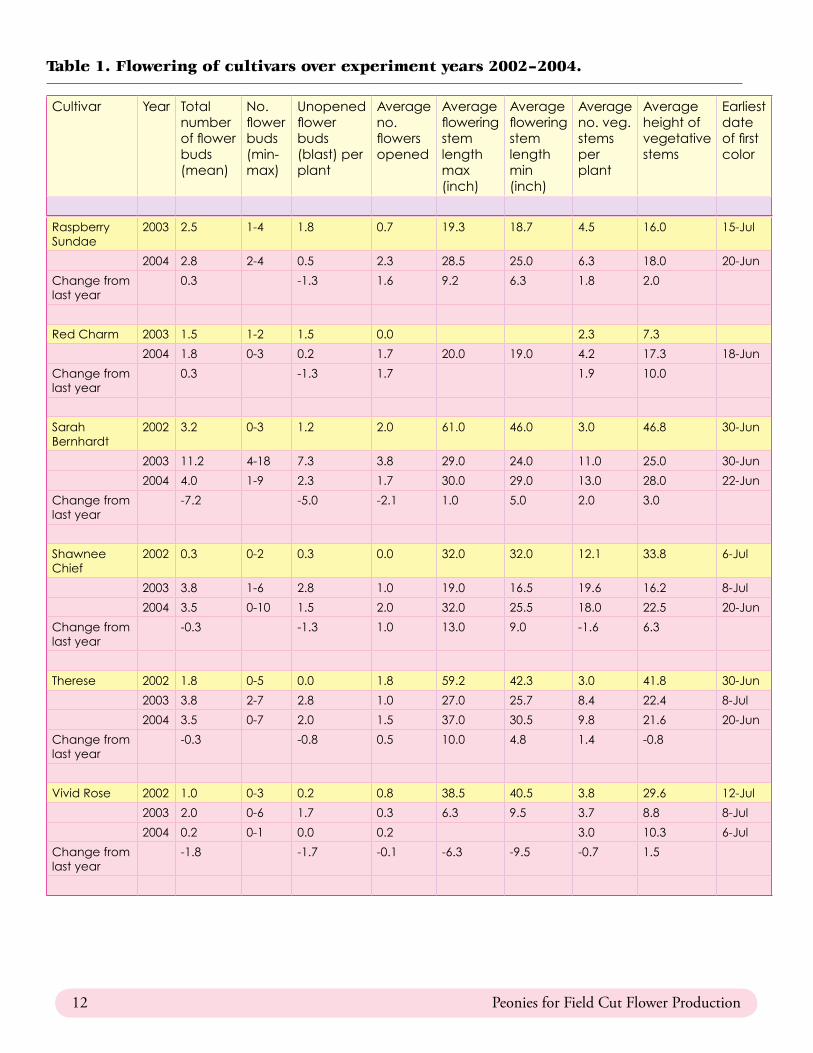
Twenty of the 30 cultivars averaged fewer total number of flowers in 2004 than 2003 (Table 1, p. 4). Reductions ranged on average from 0.2 to 7.3 fewer flower buds per plant. The most productive peonies in 2003 were ‘Bowl of Beauty’, ‘Sarah Bernhardt’, Louis Van Houtte’, Karl Rosenfield’ and ‘Felix Crouse’. All of these cultivars showed reductions in flower bud production in 2004 with ‘Bowl of Beauty’ and ‘Sarah Bernhardt’ showing the greatest change of all cultivars. The most productive cultivars in 2004 were ‘Duchess de Nemours’ and ‘Felix Crouse’. The incidence of bud blast in 2004 was reduced for 27 of the 30 cultivars when compared to 2003 possibly because we removed the end-of-season foliage and cleaned off the beds at the end of the season, or, with some cultivars, because there was a lower level of overall flowering (Table 1 and Table 3, p. 14).
Cutflowergradingisbased,inpart,onstemlengthwithU.S.No�graderequiringaminimumstemlengthof20inches,(5�cm)andU.S.No2,�8inches(46cm).Inadditiontothedesiredproductlength,growerscutstemshighenoughtoleaveatleast�2inches(30cm)ofleafybase to promote future growth (Gast �997). Therefore,thecombinedstemlengthforcommercialproductionis32inches(8�cm)forU.S.No.�stemsand30inches(76cm)forU.S.No2stems.Fivecultivarsmettherequisitestem length forU.S.No.�grading standards: ‘BowlofBeauty’, ‘DavidHarum’,FelixCrouse’, ‘ShawneeChief ’and‘Therese’.FiveothercultivarsonlymetthestandardsforU.S.No.2:‘DuchessdeNemours’,‘FestivaMaxima’,‘Gay Paree’, ‘Kansas’, ‘Sarah Bernhardt’. The remaining20cultivarshadstemlengthsthatweretooshorttomeetthestandardsifa�2-inchleafystembaseistoremainontheplant(Table�).Ourlistofmostproductivecultivarsissimilartoonesreportedatlowerlatitudes(Armitage2003,Gast�997).
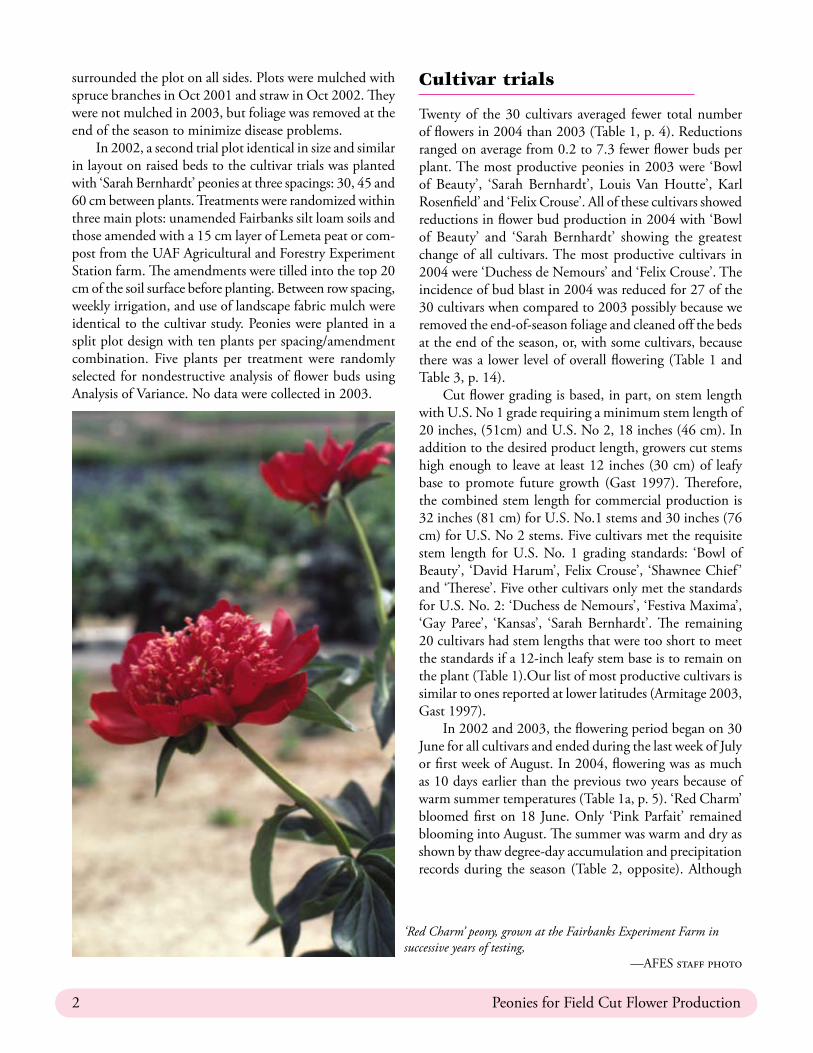
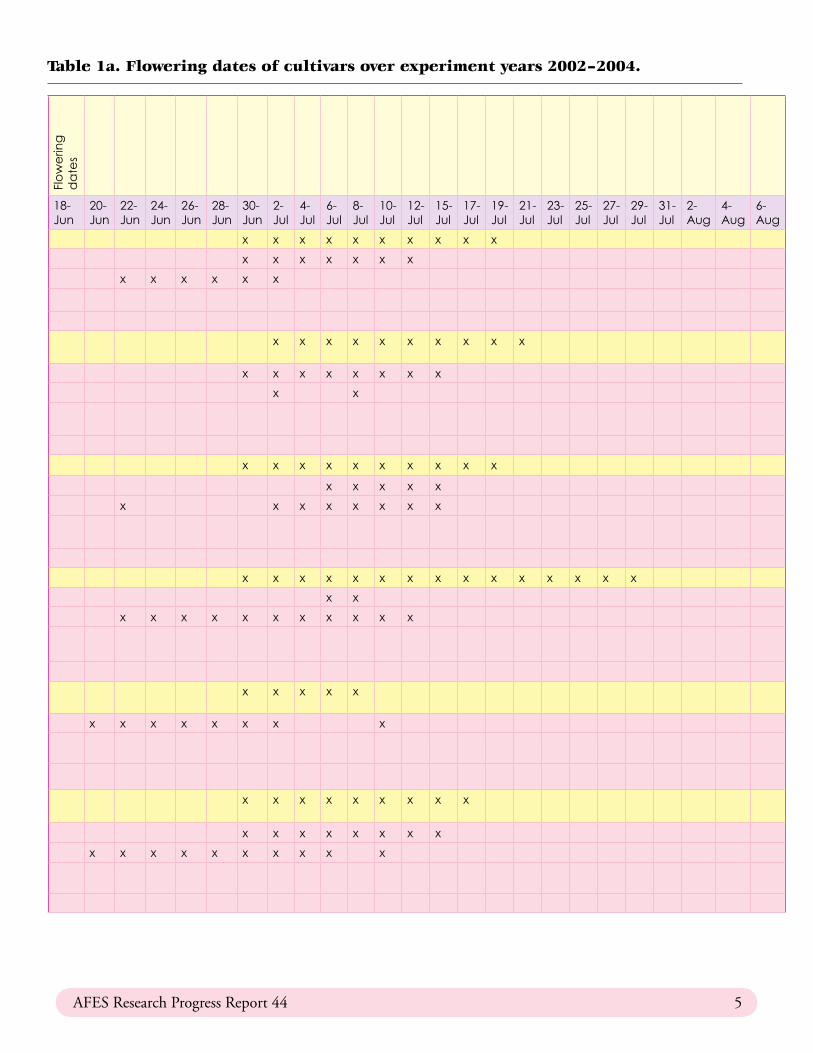
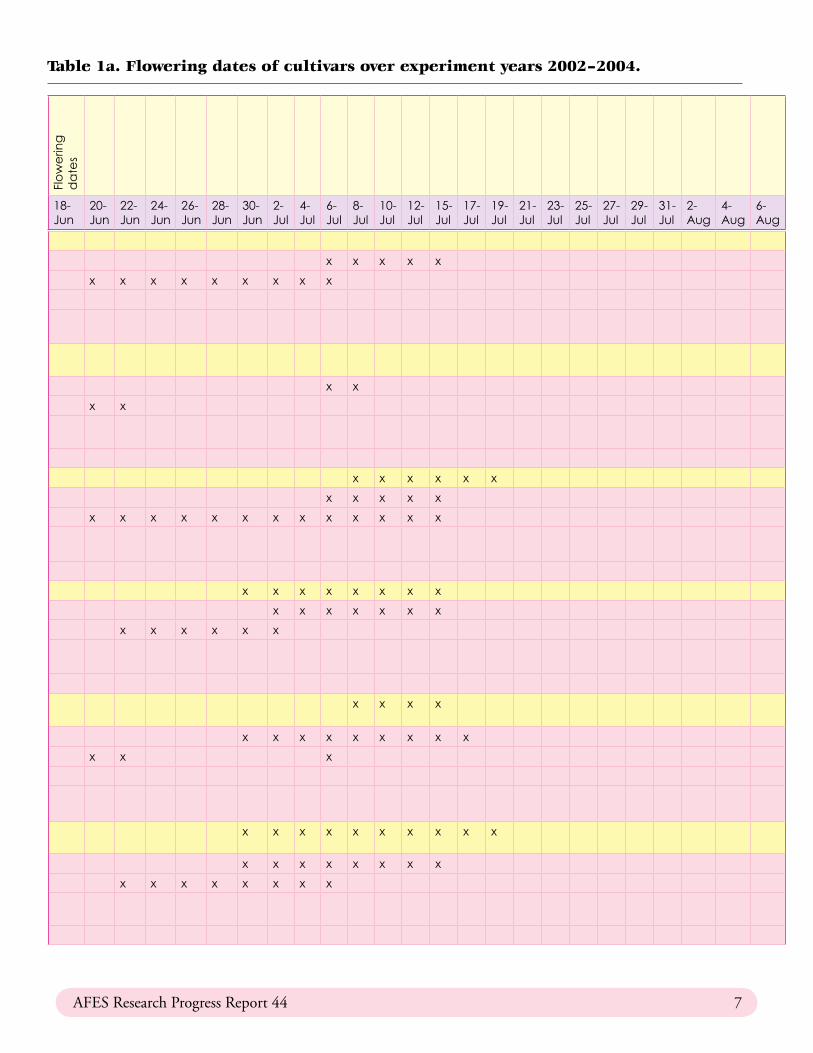
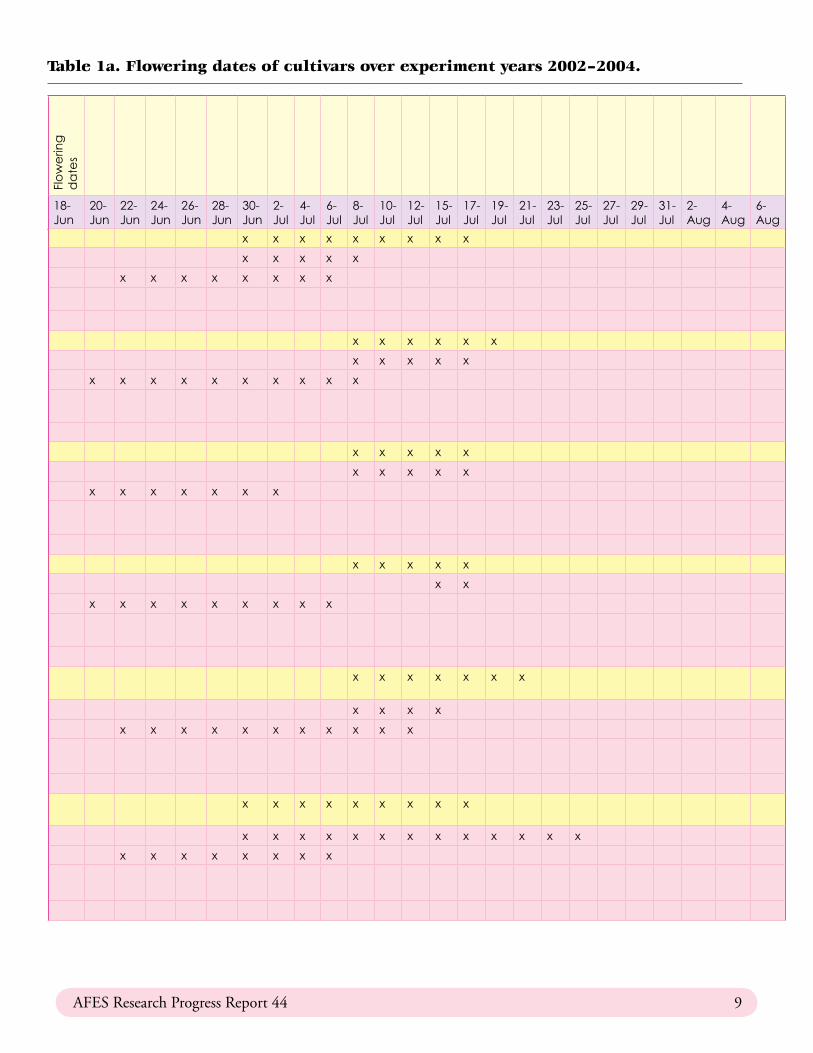
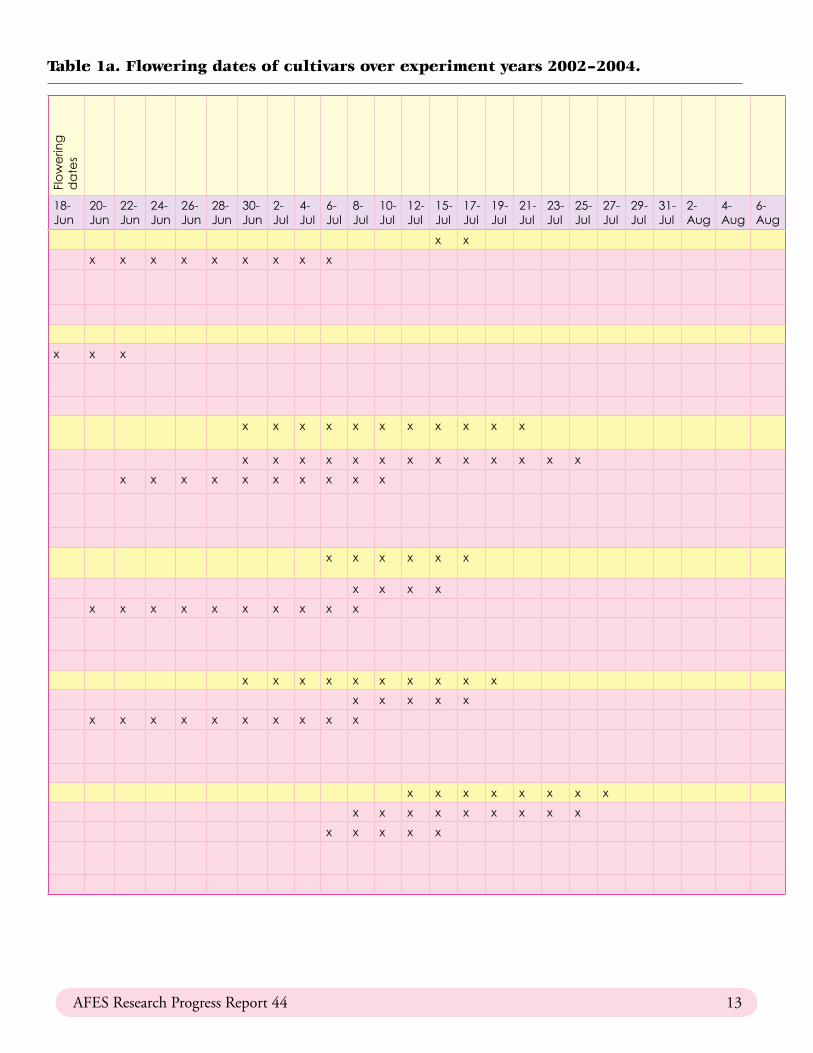
In2002and2003,thefloweringperiodbeganon30JuneforallcultivarsandendedduringthelastweekofJulyorfirstweekofAugust.In2004,floweringwasasmuchas�0daysearlierthantheprevioustwoyearsbecauseofwarmsummertemperatures(Table�a,p.5).‘RedCharm’bloomedfirston�8June.Only ‘PinkParfait’ remainedbloomingintoAugust.Thesummerwaswarmanddryasshownbythawdegree-dayaccumulationandprecipitationrecordsduringtheseason(Table2,opposite).Although
‘Red Charm’ peony, grown at the Fairbanks Experiment Farm in successive years of testing,
—AFESstaffphoto
AFESResearchProgressReport44 3
mostpeonygrowersatlowerlatitudesendpeonyproduc-tioninlateJune,anunseasonablywarmsummerinAlaskamayresultinearlierharvestdatesandaslightoverlapinharvest seasons, negating somewhat the northern geo-graphicadvantage.
Soil amendment trials
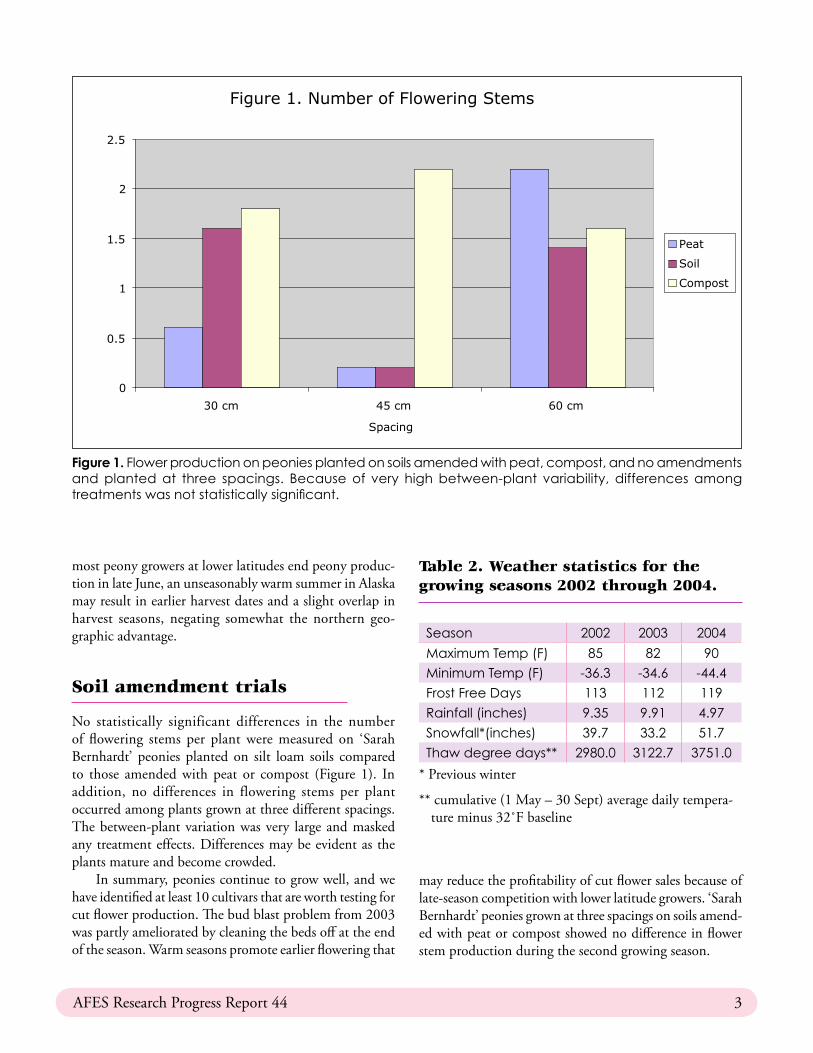
No statistically significant differences in the number of flowering stems per plant were measured on ‘Sarah Bernhardt’ peonies planted on silt loam soils compared to those amended with peat or compost (Figure 1). In addition, no differences in flowering stems per plant occurred among plants grown at three different spacings. The between-plant variation was very large and masked any treatment effects. Differences may be evident as the plants mature and become crowded.
Insummary,peoniescontinuetogrowwell,andwehaveidentifiedatleast�0cultivarsthatareworthtestingforcutflowerproduction.Thebudblastproblemfrom2003waspartlyamelioratedbycleaningthebedsoffattheendoftheseason.Warmseasonspromoteearlierfloweringthat
Figure 1. Flower production on peonies planted on soils amended with peat, compost, and no amendments and planted at three spacings. Because of very high between-plant variability, differences among treatments was not statistically significant.
mayreducetheprofitabilityofcutflowersalesbecauseoflate-seasoncompetitionwithlowerlatitudegrowers.‘SarahBernhardt’peoniesgrownatthreespacingsonsoilsamend-edwithpeatorcompostshowednodifferenceinflowerstemproductionduringthesecondgrowingseason.
Table 2. Weather statistics for the growing seasons 2002 through 2004.
Season 2002 2003 2004
Maximum Temp (F) 85 82 90Minimum Temp (F) -36.3 -34.6 -44.4
Frost Free Days 113 112 119
Rainfall (inches) 9.35 9.91 4.97
Snowfall*(inches) 39.7 33.2 51.7
Thaw degree days** 2980.0 3122.7 3751.0
*Previouswinter
**cumulative(�May–30Sept)averagedailytempera-tureminus32˚Fbaseline
Figure 1. Number of Flowering Stems
0
0.5
1
1.5
2
2.5
30 cm 45 cm 60 cm
Spacing
Number of flowers
Peat
Soil
Compost
4 PeoniesforFieldCutFlowerProduction
Cultivar Year Total number of flower buds (mean)
No. flower buds (min-max)
Unopened flower buds (blast) per plant
Average no. flowers opened
Average flowering stem length max (inch)
Average flowering stem length min (inch)
Average no. veg. stems per plant
Average height of vegetative stems
Earliest date of first color
Better Times 2002 2.5 1-5 0.3 2.2 50.3 41.6 0.8 41.1 30-Jun
2003 3.3 1-10 1.7 1.8 21.0 20.0 4.7 18.8 30-Jun
2004 1.5 0-5 0.5 1.0 17.0 16.0 4.2 17.6 22-Jun
Change from last year
-1.8 -1.2 -0.8 -4.0 -4.0 -0.5 -1.2
Bowl of Beauty
2002 3.0 0-5 0.3 2.7 63.2 57.6 5.2 49.3 1-Jul
2003 8.8 2-17 5.0 3.8 29.0 22.8 11.7 27.0 30-Jun
2004 1.5 0-4 0.3 1.2 39.0 36.0 8.2 22.0 2-Jul
Change from last year
-7.3 -4.7 -2.6 10.0 13.2 -3.5 -5.0
David Harum 2002 1.2 0-3 0.2 1.0 47.2 42.5 5.2 34.3 30-Jun
2003 6.5 2-13 4.8 1.7 26.0 20.5 9.5 18.2 6-Jul
2004 3.0 0-7 1.5 1.5 34.0 27.5 9.7 21.7 22-Jun
Change from last year
-3.5 -3.3 -0.2 8.0 7.0 0.2 3.5
Doris Cooper 2002 1.0 0-2 0.3 0.7 52.8 39.6 3.3 34.8 30-Jun
2003 2.7 0-10 2.0 0.3 21.0 19.0 5.7 16.5 6-Jul
2004 2.5 0-5 0.8 1.8 20.0 19.0 6.7 22.0 22-Jun
Change from last year
-0.2 -1.2 1.5 -1.0 0.0 1.0 5.5
Dr. Alexander Flemming
2003 1.7 1-3 1.5 0.2 16.0 16.0 1.8 11.2 30-Jun
2004 4.0 0-4 0.4 1.8 25.3 23.0 6.8 19.0 20-Jun
Change from last year
2.3 -1.1 1.6 9.3 7.0 5.0 7.8
Duchess de Nemours
2002 1.8 0-2 0.5 1.3 52.1 47.0 3.3 33.0 30-Jun
2003 4.8 2-8 3.8 1.0 22.3 19.5 6.8 19.3 30-Jun
2004 8.3 0-32 1.0 7.2 33.7 30.7 10.8 22.6 20-Jun
Change from last year
3.5 -2.8 6.2 11.4 11.2 4.0 3.3
Table 1. Flowering of cultivars over experiment years 2002–2004.
AFESResearchProgressReport44 5
Flo
we
ring
d
ate
s
18-Jun
20-Jun
22-Jun
24-Jun
26-Jun
28-Jun
30-Jun
2-Jul
4-Jul
6-Jul
8-Jul
10-Jul
12-Jul
15-Jul
17-Jul
19-Jul
21-Jul
23-Jul
25-Jul
27-Jul
29-Jul
31-Jul
2-Aug
4-Aug
6-Aug
x x x x x x x x x x
x x x x x x x
x x x x x x
x x x x x x x x x x
x x x x x x x x
x x
x x x x x x x x x x
x x x x x
x x x x x x x x
x x x x x x x x x x x x x x x
x x
x x x x x x x x x x x
x x x x x
x x x x x x x x
x x x x x x x x x
x x x x x x x x
x x x x x x x x x x
Table 1a. Flowering dates of cultivars over experiment years 2002–2004.
6 PeoniesforFieldCutFlowerProduction
Duchess de Orleans
2002 0.0 0 0.0 0.0 4.8 36.0
2003 2.3 0-5 2.4 0.3 23.5 23.5 8.8 19.8 6-Jul
2004 2.0 0-3 1.2 0.8 28.7 30.0 10.3 21.3 20-Jun
Change from last year
-0.3 -1.2 0.5 5.2 6.5 1.5 1.5
Edulis Superba
2002 0 0 0 0 3 24.0
2003 1.0 1 1.0 0.0 2.3 11.3 6-Jul
2004 2.8 0-7 1.5 1.3 29.7 25.3 6.2 17.3 20-Jun
Change from last year
1.8 0.5 1.3 29.7 25.3 3.9 6.0
Felix Crouse 2002 2.3 0-3 0.2 2.2 51.8 44.7 5.7 36.8 8-Jul
2003 10.5 5-15 7.8 2.7 24.8 22.5 16.5 21.3 6-Jul
2004 8.8 5-13 3.3 5.5 36.0 34.0 16.3 21.7 20-Jun
Change from last year
-1.7 -4.5 2.8 11.2 11.5 -0.2 0.4
Felix Supreme 2002 0.3 0-2 0.0 0.3 54.0 48.0 2.0 41.0 30-Jun
2003 1.3 0-2 0.8 0.5 22.0 22.0 3.0 12.5 2-Jul
2004 2.5 0-6 1.0 1.5 25.0 24.0 4.8 14.7 22-Jun
Change from last year
1.2 0.2 1.0 3.0 2.0 1.8 2.2
Festiva Maxima
2002 0.8 0-1 0.5 0.3 46.0 32.0 4.6 38.4 8-Jul
2003 3.3 0-6 1.7 1.2 24.0 19.5 6.3 18.0 30-Jun
2004 1.0 0-2 0.0 1.0 32.0 24.0 7.8 21.0 20-Jun
Change from last year
-2.3 -1.7 -0.2 8.0 4.5 1.5 3.0
Florence Bond
2002 1.3 0-2 0.3 1.0 25.4 40.5 1.0 31.5 30-Jun
2003 1.8 1-3 1.0 0.8 13.8 13.8 3.0 13.7 30-Jun
2004 2.7 0-10 1.0 1.7 15.0 14.0 5.2 17.0 22-Jun
Change from last year
0.9 0.0 0.9 1.2 0.2 2.2 3.3
Cultivar Year Total number of flower buds (mean)
No. flower buds (min-max)
Unopened flower buds (blast) per plant
Average no. flowers opened
Average flowering stem length max (inch)
Average flowering stem length min (inch)
Average no. veg. stems per plant
Average height of vegetative stems
Earliest date of first color
Table 1. Flowering of cultivars over experiment years 2002–2004.
AFESResearchProgressReport44 7
x x x x x
x x x x x x x x x
x x
x x
x x x x x x
x x x x x
x x x x x x x x x x x x x
x x x x x x x x
x x x x x x x
x x x x x x
x x x x
x x x x x x x x x
x x x
x x x x x x x x x x
x x x x x x x x
x x x x x x x x
Flo
we
ring
d
ate
s
18-Jun
20-Jun
22-Jun
24-Jun
26-Jun
28-Jun
30-Jun
2-Jul
4-Jul
6-Jul
8-Jul
10-Jul
12-Jul
15-Jul
17-Jul
19-Jul
21-Jul
23-Jul
25-Jul
27-Jul
29-Jul
31-Jul
2-Aug
4-Aug
6-Aug
Table 1a. Flowering dates of cultivars over experiment years 2002–2004.
8 PeoniesforFieldCutFlowerProduction
Gardenia 2002 0.7 0-1 0.5 0.2 40.0 35.0 1.8 30.0 30-Jun
2003 0.8 0-2 0.8 0.0 3.5 10.2 30-Jun
2004 0.8 0-2 0.0 0.8 21.5 20.0 2.8 15.5 22-Jun
Change from last year
0.0 -0.8 0.8 21.5 20.0 -0.7 5.3
Gay Paree 2002 2.2 1-3 0.2 2.0 45.2 39.0 1.3 28.4 8-Jul
2003 3.2 1-5 1.8 1.4 21.3 21.3 4.4 19.0 8-Jul
2004 4.0 0-8 1.0 3.0 32.5 27.5 6.4 17.2 20-Jun
Change from last year
0.8 1.6 -0.6 -23.9 -17.7 3.1 -9.4
Jaycee 2002 0.8 0-3 0.8 0.0 35.0 35.0 6.2 34.0 8-Jul
2003 2.4 1-4 1.0 1.4 18.0 15.7 5.8 15.2 8-Jul
2004 1.3 0-5 0.3 1.0 27.0 24.0 5.8 18.0 20-Jun
Change from last year
-1.1 -0.7 -0.4 9.0 8.3 0.0 2.8
Kansas 2002 0.5 0-3 0.0 0.5 55.0 48.0 8.0 41.0 8-Jul
2003 3.7 2-7 2.8 0.8 28.0 22.0 8.5 19.8 15-Jul
2004 5.5 0-12 1.3 4.2 33.0 26.6 11.5 22.0 20-Jun
Change from last year
1.8 -1.5 3.4 5.0 4.6 3.0 2.2
Karl Rosenfield
2002 0.3 0-1 0.0 0.3 54.5 54.5 8.5 41.3 8-Jul
2003 8.0 1-16 5.2 2.8 27.8 24.5 21.5 24.3 8-Jul
2004 4.5 2 - 12 1.5 3.0 31.0 30.0 15.2 27.0 22-Jun
Change from last year
7.7 5.2 2.5 -26.7 -30.0 13.0 -17.0
Louis Van Houtte
2002 1.3 0-2 1.0 0.3 50.7 33.0 8.3 42.8 30-Jun
2003 8.0 5-12 5.2 2.8 28.2 23.6 19.3 25.7 30-Jun
2004 4.5 2-12 1.5 3.0 31.0 30.0 15.2 27.0 22-Jun
Change from last year
-3.5 -3.7 0.2 2.8 6.4 -4.1 1.3
Cultivar Year Total number of flower buds (mean)
No. flower buds (min-max)
Unopened flower buds (blast) per plant
Average no. flowers opened
Average flowering stem length max (inch)
Average flowering stem length min (inch)
Average no. veg. stems per plant
Average height of vegetative stems
Earliest date of first color
Table 1. Flowering of cultivars over experiment years 2002–2004.
AFESResearchProgressReport44 9
Flo
we
ring
d
ate
s
18-Jun
20-Jun
22-Jun
24-Jun
26-Jun
28-Jun
30-Jun
2-Jul
4-Jul
6-Jul
8-Jul
10-Jul
12-Jul
15-Jul
17-Jul
19-Jul
21-Jul
23-Jul
25-Jul
27-Jul
29-Jul
31-Jul
2-Aug
4-Aug
6-Aug
x x x x x x x x x
x x x x x
x x x x x x x x
x x x x x x
x x x x x
x x x x x x x x x x
x x x x x
x x x x x
x x x x x x x
x x x x x
x x
x x x x x x x x x
x x x x x x x
x x x x
x x x x x x x x x x x
x x x x x x x x x
x x x x x x x x x x x x x
x x x x x x x x
Table 1a. Flowering dates of cultivars over experiment years 2002–2004.

�0 PeoniesforFieldCutFlowerProduction
Mighty Mo 2002 0.5 0-1 0.0 0.5 37.6 5.0 34.3 1-Jul
2003 2.2 0-5 1.5 0.7 21.8 21.8 5.7 17.5 30-Jun
2004 0.0 0 0.0 0.0 0.0 0.0 4.6 14.8 22-Jun
Change from last year
-2.2 -1.5 -0.7 -21.8 -21.8 -1.1 -2.7
Mons. Jules Elie
2002 1.7 0-3 0.8 0.8 42.7 35.0 3.4 35.5 1-Jul
2003 2.0 0-6 1.7 0.7 21.0 21.0 5.0 14.5 8-Jul
2004 1.0 0-3 0.4 0.6 23.0 21.0 4.6 15.2 22-Jun
Change from last year
-1.0 -1.3 -0.1 2.0 0.0 -0.4 0.7
Mrs. FDR 2002 0.2 0-1 0.2 0.0 12.0 2.0 29.8 8-Jul
2003 1.4 0-2 1.0 0.4 17.0 17.0 3.2 10.8 6-Jul
2004 0.6 0-2 0.4 0.2 27.0 27.0 3.8 19.0 20-Jun
Change from last year
-0.8 -0.6 -0.2 10.0 10.0 0.6 8.2
Nancy Nicholls
2002 0.8 0-3 0.0 0.8 53.0 52.0 4.5 39.8 15-Jul
2003 4.0 1-6 3.5 0.5 12.0 15.5 7.7 17.8 15-Jul
2004 1.0 0-2 0.6 0.4 28.0 28.0 4.6 15.2 15-Jul
Change from last year
-3.0 -2.9 -0.1 16.0 12.5 -3.1 -2.6
Pink Parfait 2002 1.2 0-3 0.3 1.0 41.5 45.0 1.8 38.8 8-Jul
2003 4.3 1-8 3.0 1.3 21.0 20.2 5.0 18.8 15-Jul
2004 0.7 0-2 0.3 0.4 23.0 21.0 6.4 21.7 2-Jul
Change from last year
-3.6 -2.7 -0.9 2.0 0.8 1.4 2.9
Princess Bride 2002 2.2 0-2 1.3 0.8 38.5 40.0 2.0 34.0 8-Jul
2003 2.2 1-3 1.3 0.8 19.5 19.3 3.0 19.0 8-Jul
2004 0.2 0-1 0.2 0.0 19.0 19.0 5.0 18.6 2-Jul
Change from last year
-2.0 -1.1 -0.8 -0.5 -0.3 2.0 -0.4
Cultivar Year Total number of flower buds (mean)
No. flower buds (min-max)
Unopened flower buds (blast) per plant
Average no. flowers opened
Average flowering stem length max (inch)
Average flowering stem length min (inch)
Average no. veg. stems per plant
Average height of vegetative stems
Earliest date of first color
Table 1. Flowering of cultivars over experiment years 2002–2004.

AFESResearchProgressReport44 ��
Flo
we
ring
d
ate
s
18-Jun
20-Jun
22-Jun
24-Jun
26-Jun
28-Jun
30-Jun
2-Jul
4-Jul
6-Jul
8-Jul
10-Jul
12-Jul
15-Jul
17-Jul
19-Jul
21-Jul
23-Jul
25-Jul
27-Jul
29-Jul
31-Jul
2-Aug
4-Aug
6-Aug
x x x x x x x
x x x x x x x x x x x x x x
x
x x x x x x x x
x x x
x x x x x x x x x
x x x
x x x x x x x x x x x
x x
x x x x x
x x x
x x
x x x x x x x x x x x x x x
x x x x x x x x
x x x x x x
x x x x
x x x
x x x x x x
Table 1a. Flowering dates of cultivars over experiment years 2002–2004.
�2 PeoniesforFieldCutFlowerProduction
Raspberry Sundae
2003 2.5 1-4 1.8 0.7 19.3 18.7 4.5 16.0 15-Jul
2004 2.8 2-4 0.5 2.3 28.5 25.0 6.3 18.0 20-Jun
Change from last year
0.3 -1.3 1.6 9.2 6.3 1.8 2.0
Red Charm 2003 1.5 1-2 1.5 0.0 2.3 7.3
2004 1.8 0-3 0.2 1.7 20.0 19.0 4.2 17.3 18-Jun
Change from last year
0.3 -1.3 1.7 1.9 10.0
Sarah Bernhardt
2002 3.2 0-3 1.2 2.0 61.0 46.0 3.0 46.8 30-Jun
2003 11.2 4-18 7.3 3.8 29.0 24.0 11.0 25.0 30-Jun
2004 4.0 1-9 2.3 1.7 30.0 29.0 13.0 28.0 22-Jun
Change from last year
-7.2 -5.0 -2.1 1.0 5.0 2.0 3.0
Shawnee Chief
2002 0.3 0-2 0.3 0.0 32.0 32.0 12.1 33.8 6-Jul
2003 3.8 1-6 2.8 1.0 19.0 16.5 19.6 16.2 8-Jul
2004 3.5 0-10 1.5 2.0 32.0 25.5 18.0 22.5 20-Jun
Change from last year
-0.3 -1.3 1.0 13.0 9.0 -1.6 6.3
Therese 2002 1.8 0-5 0.0 1.8 59.2 42.3 3.0 41.8 30-Jun
2003 3.8 2-7 2.8 1.0 27.0 25.7 8.4 22.4 8-Jul
2004 3.5 0-7 2.0 1.5 37.0 30.5 9.8 21.6 20-Jun
Change from last year
-0.3 -0.8 0.5 10.0 4.8 1.4 -0.8
Vivid Rose 2002 1.0 0-3 0.2 0.8 38.5 40.5 3.8 29.6 12-Jul
2003 2.0 0-6 1.7 0.3 6.3 9.5 3.7 8.8 8-Jul
2004 0.2 0-1 0.0 0.2 3.0 10.3 6-Jul
Change from last year
-1.8 -1.7 -0.1 -6.3 -9.5 -0.7 1.5
Cultivar Year Total number of flower buds (mean)
No. flower buds (min-max)
Unopened flower buds (blast) per plant
Average no. flowers opened
Average flowering stem length max (inch)
Average flowering stem length min (inch)
Average no. veg. stems per plant
Average height of vegetative stems
Earliest date of first color
Table 1. Flowering of cultivars over experiment years 2002–2004.
AFESResearchProgressReport44 �3
Flo
we
ring
d
ate
s
18-Jun
20-Jun
22-Jun
24-Jun
26-Jun
28-Jun
30-Jun
2-Jul
4-Jul
6-Jul
8-Jul
10-Jul
12-Jul
15-Jul
17-Jul
19-Jul
21-Jul
23-Jul
25-Jul
27-Jul
29-Jul
31-Jul
2-Aug
4-Aug
6-Aug
x x
x x x x x x x x x
x x x
x x x x x x x x x x x
x x x x x x x x x x x x x
x x x x x x x x x x
x x x x x x
x x x x
x x x x x x x x x x
x x x x x x x x x x
x x x x x
x x x x x x x x x x
x x x x x x x x
x x x x x x x x x
x x x x x
Table 1a. Flowering dates of cultivars over experiment years 2002–2004.
�4 PeoniesforFieldCutFlowerProduction
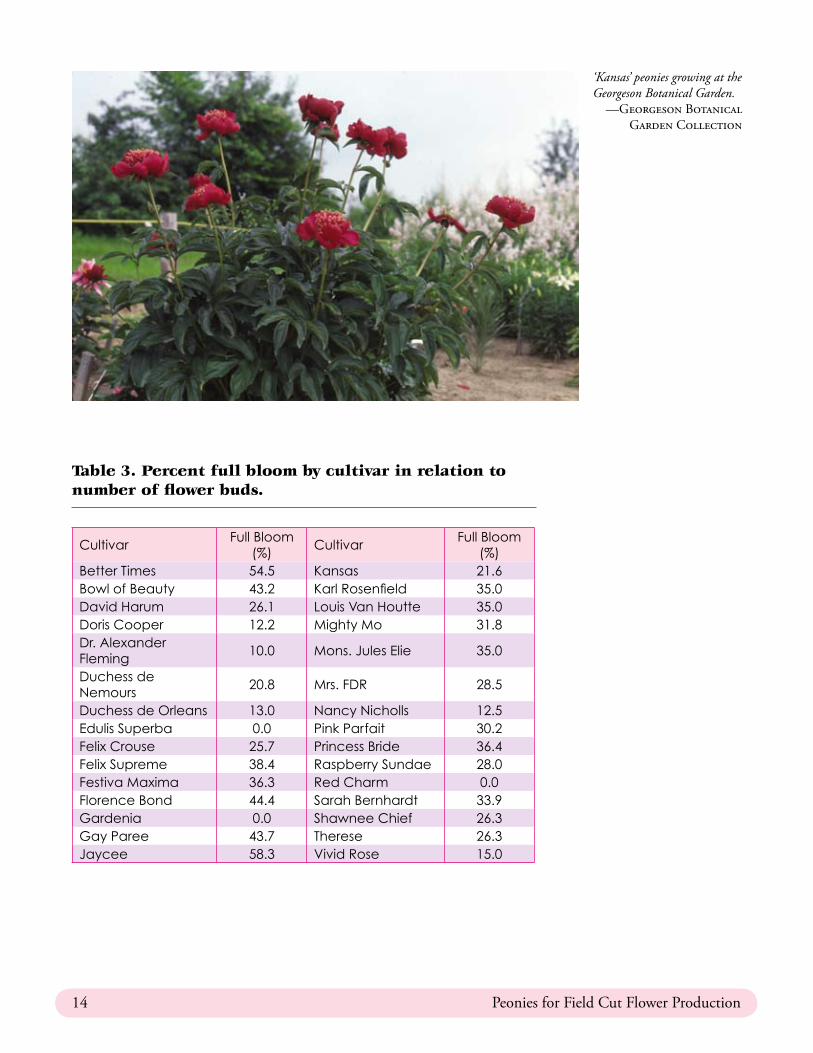
‘Kansas’ peonies growing at the Georgeson Botanical Garden.
—GeorgesonBotanicalGardenCollection
Table 3. Percent full bloom by cultivar in relation to number of flower buds.
CultivarFull Bloom
(%)Cultivar
Full Bloom (%)
Better Times 54.5 Kansas 21.6Bowl of Beauty 43.2 Karl Rosenfield 35.0David Harum 26.1 Louis Van Houtte 35.0Doris Cooper 12.2 Mighty Mo 31.8Dr. Alexander Fleming
10.0 Mons. Jules Elie 35.0
Duchess de Nemours
20.8 Mrs. FDR 28.5
Duchess de Orleans 13.0 Nancy Nicholls 12.5Edulis Superba 0.0 Pink Parfait 30.2Felix Crouse 25.7 Princess Bride 36.4Felix Supreme 38.4 Raspberry Sundae 28.0Festiva Maxima 36.3 Red Charm 0.0Florence Bond 44.4 Sarah Bernhardt 33.9Gardenia 0.0 Shawnee Chief 26.3Gay Paree 43.7 Therese 26.3Jaycee 58.3 Vivid Rose 15.0
AFESResearchProgressReport44 �5
References
Armitage, A. and J.M. Lauschman. 2003. Specialty Cut Flowers.TimberPress,Portland,Oregon.
Gast, K.L.B. 2000. �997 Production and post harvestevaluation of fresh-cut peonies. Kansas State UniversityAgriculturalExperimentStationandCooperativeExten-sionService.Availableonline:www.oznet.ksu.edu/library/hort2/Samplers/SRP8�8.asp.
Holloway,P.J.HanscomandG.Matheke.2003.Peoniesforfieldcutflowerproduction.First-yeargrowth.UniversityofAlaskaFairbanks.AgriculturalandForestryExperimentStationResearchProg.Report4�.4pp.
Holloway,P.J.HanscomandG.Matheke.2004.Peoniesforfieldcutflowerproduction.Second-yeargrowth.UniversityofAlaskaFairbanks.AgriculturalandForestryExperimentStationResearchProg.Report43.8pp.
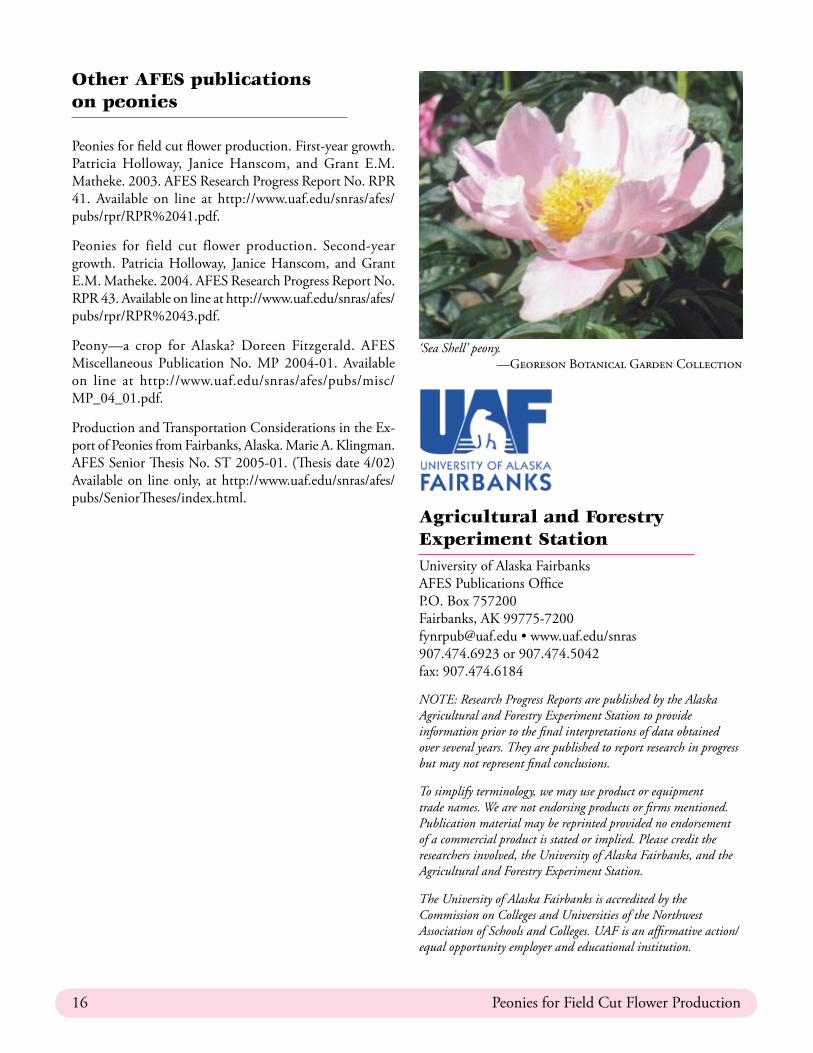
Below: ‘Karl Rosenfeld’ peony.—GeorgesonBotanicalGardenCollection
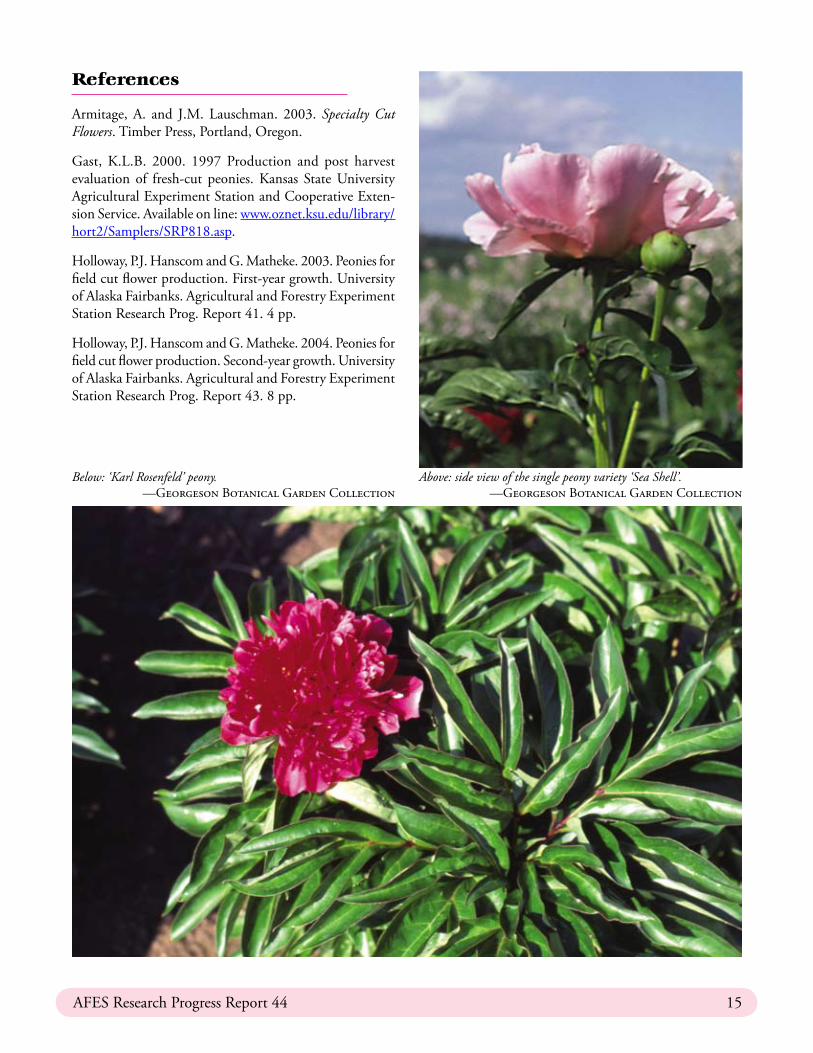
Above: side view of the single peony variety ‘Sea Shell’.—GeorgesonBotanicalGardenCollection
�6 PeoniesforFieldCutFlowerProduction
Other AFES publications on peonies
Peoniesforfieldcutflowerproduction.First-yeargrowth.Patricia Holloway, Janice Hanscom, and Grant E.M.Matheke.2003.AFESResearchProgressReportNo.RPR4�. Available on line at http://www.uaf.edu/snras/afes/pubs/rpr/RPR%204�.pdf.
Peonies for field cut flower production. Second-yeargrowth. Patricia Holloway, Janice Hanscom, and GrantE.M.Matheke.2004.AFESResearchProgressReportNo.RPR43.Availableonlineathttp://www.uaf.edu/snras/afes/pubs/rpr/RPR%2043.pdf.
Peony—a crop for Alaska? Doreen Fitzgerald. AFESMiscellaneous Publication No. MP 2004-0�. Availableon line at http://www.uaf.edu/snras/afes/pubs/misc/MP_04_0�.pdf.
ProductionandTransportationConsiderationsintheEx-portofPeoniesfromFairbanks,Alaska.MarieA.Klingman.AFESSeniorThesisNo.ST2005-0�.(Thesisdate4/02)Availableon lineonly, athttp://www.uaf.edu/snras/afes/pubs/SeniorTheses/index.html.
‘Sea Shell’ peony.—GeoresonBotanicalGardenCollection
Agricultural and Forestry Experiment StationUniversity of Alaska FairbanksAFES Publications OfficeP.O. Box 757200Fairbanks, AK [email protected] • www.uaf.edu/snras907.474.6923 or 907.474.5042fax: 907.474.6184
NOTE: Research Progress Reports are published by the Alaska Agricultural and Forestry Experiment Station to provide information prior to the final interpretations of data obtained over several years. They are published to report research in progress but may not represent final conclusions.
To simplify terminology, we may use product or equipment trade names. We are not endorsing products or firms mentioned. Publication material may be reprinted provided no endorsement of a commercial product is stated or implied. Please credit the researchers involved, the University of Alaska Fairbanks, and the Agricultural and Forestry Experiment Station.
The University of Alaska Fairbanks is accredited by the Commission on Colleges and Universities of the Northwest Association of Schools and Colleges. UAF is an affirmative action/equal opportunity employer and educational institution.