pension systems in latin america: concepts and...
TRANSCRIPT

NO. 0616S P D I S C U S S I O N P A P E R
Pension Systems in LatinAmerica: Concepts andMeasurements of Coverage
Rafael RofmanLeonardo Lucchetti
November 2006

∗ Rafael Rofman ([email protected]) is a Lead Social Protection Specialist at the Human Development Department, Latin America and the Caribbean Regional Office (LCSHS), the World Bank. ∗∗ Leonardo Lucchetti ([email protected]) worked at this project while being a Junior Professional Associate at the Human Development Department, Latin America and the Caribbean Regional Office (LCSHS), the World Bank. The information and opinions contained in this work are the exclusive responsibility of the authors and do not necessarily represent their employers. We would like to thank Alejandro Tamola for his help processing some of the data bases, and Fabio Bertranou, Marisa Bucheli, Ivan Cordero, Carmen Corral, Alvaro Forteza, Ramiro Gamboa, Carlos Grushka, Carmelo Mesa Lago, Eduardo Moron, Thomas Otter, Helena Ribe, and Francis Suñiga Gonzalez, for their comments and guidance. Gustavo Demarco, Robert Palacios and Fabio Bertranou provided excellent comments, as well as participants in several seminars held in Washington and Buenos Aires, where earlier versions of the document were presented. Sarah Bailey and Maria Lourdes Noel provided invaluable support editing the document, and Stanislao Maldonado helped us with a final revision of the data set. Of course, the information and opinions contained in this work are the exclusive responsibility of the authors.
Pension Systems in Latin America: Concepts and Measurements of Coverage
Rafael Rofman∗ and Leonardo Lucchetti∗∗ November 2006
(this version, January 2007)

1
I. INTRODUCTION Pension systems’ performance around the world can be usually assessed by considering
three dimensions: coverage, adequacy, and sustainability. The first dimension refers to the proportion of the elderly population protected by the systems (and, if contributory, the proportion of young adults contributing). Adequacy refers to the level of benefits and whether those who receive them are able to maintain an “adequate” level of consumption. Finally, sustainability refers to the ability, of society and government, to maintain the systems operating without major disturbances in fiscal accounts.
This paper focuses on the coverage dimension, looking at empirical data in Latin America. Coverage of pension systems has slowly become a central issue in the policy debate in the region. After more than a decade of reforms and debates, the central problem of the pension systems in Latin America (how to protect most workers and their families from the economic risks caused by aging and retirement from the labor force) remains unsolved in countries were structural reforms were implemented, as well as in countries where reforms were limited to parametric adjustments and countries where no significant reforms were adopted. Proposals and debates over the last decade have been shaped by ideological positions and objectives that were not always related to the central goals of the programs, and should not be the driving force to shape the social security systems.
Good practice in policy design requires rigorous evaluation, which in turn requires data sources that are reliable, comparable, and consistent over time. However, many analyses are seriously affected by the lack of such data, impairing the ability of policy makers to review and propose reforms to the systems. This problem is clear with regards to coverage and fiscal impacts of the old age income protection systems, as data sources have serious problems of definitions, consistency, and comparability, over time and across countries.
This paper presents a new stage in the efforts by the authors to produce a reliable estimation of coverage indicators in the region. This work represents a review and expansion of a previous analysis prepared in 2004-05 (Rofman and Carranza, 2005), as it corrects a few methodological problems and expands the timeframe from a single observation around 2002 to a data series ranging from 1990 to 2006. Of course, the data still present gaps, and comparability problems originated on differences in the sources are still present, as explained in the methodological annex.
The literature on pension systems generally agrees that the core objectives of these systems are to prevent poverty among the elderly and smooth consumption profiles over a person’s lifetime. In addition, several authors have focused their analysis on other objectives or secondary aspects that need to be addressed when designing pension systems, such as their effects on national savings, the accumulation of capital, the labor market, or the fiscal situation. The relative importance of each of these elements (including the role of the State in the design, implementation, and management of the systems) varies in accordance with the philosophical and political position of the various authors. Some authors believe that the principal objective should be the alleviation of poverty in extreme cases. Others propose a broader approach, giving the pension system a central role in a society’s income redistribution policy. A third group focuses on the labor market, understanding that pension benefits are part of labor agreements in the form of delayed

2
wages and, as such, only in the context of a performing labor market is it possible to find an effective pension system. This controversy on the best way to achieve the core objectives of pension is far from being settled, and it seems that better information on what is the current status and recent trends on coverage and access should clarify the debate.
A good conceptual definition is a necessary but insufficient condition for ensuring proper empirical measurements of coverage. There are many methodological problems, arising from practical difficulties for implementing the concept. These include the quality of the information collection instruments, availability and access to databases, and issues involving the comparability of different countries and different time spans.
Data were available for 17 countries, for a period that starts in the early 1990s to the mid 2000s. Recognizing the difficulties involved in comparing the available information, the paper presents a group of similar indicators that make it possible to measure coverage in the various countries, both among active workers and among the elderly. In addition, several socio-demographic characteristics of the covered and uncovered population are presented and discussed, identifying relevant differentials. The covariates taken into account in the study are: age, geographical areas, sector of employment, level of education, gender, occupation, firm size, and income quintiles.
The paper has five sections, including this introduction and final conclusions, and three annexes. The second section discusses the conceptual dimension of pension coverage. The third section focuses on the methodological approach and discusses problems and caveats, while the fourth presents comparative results for the 17 countries considered. Two annexes include detailed data on coverage for each country, considering the systems as a whole (in Annex I) and only the non contributory schemes for countries with available data (Annex II). Finally, Annex III offers a detailed explanation of methodological aspects.
II. PENSION SYSTEMS, THEIR OBJECTIVES AND TOOLS Pension systems are State-instituted transfer programs, aiming at providing income
security to the elderly in a context where traditional informal arrangements are considered to be insufficient. The rationale that supports the creation of pension systems is clear. In traditional societies, the elderly were either supported through family or informal social networks that shared food and goods produced by its members, or received no support at all, living in poverty and exposed to high morbidity and mortality. As economies developed, labor markets extended and salaried work became the main source of income for most households, an alternative approach to this problem became necessary. This need was enhanced by the demographic transition process, as the ratio of elderly to young adults in families slowly increased, making the old informal arrangements less sustainable.
While the overarching goal is generally agreed upon, there are divergences on how to achieve it. Debates are focused on three main dimensions, where analysts and policy makers have opposing views. First, there are some divergences regarding the links between pension systems and the labor market, a question that defines who has the right to receive benefits as a general principle. The second area of debate is the origin of financial resources for the system, where some support the idea of requiring contributions from future beneficiaries (hence, making the system “contributory”) and others propose to keep it open to all individuals, making it “non contributory”. The third dimension in discussion

3
refers to the role of the State, either as a facilitator, enforcer or provider. While there are other debates (the most noticeable one in regards to whether contributory pension systems should be pre-funded or an intergenerational transfer scheme), they seem to refer to a second level problem, as they do not affect the main principles of the systems, but how they are implemented. The three main controversies are presented next.
- Postponed salaries or citizens right?
A central discussion regarding pension systems is whether they should be considered as a continuation of a financial flow for salaried workers after retirement or a benefit provided to all citizens. The first approach is based on the idea that the need for a pension system originates in the inability of individuals to continue working and earning salaries after a certain age. This would make it necessary to find a scheme in order to replace those lost earnings. Within this logic, there would be no reason to provide pension benefits to those who had no earnings before retirement, since they have no “loss” at retirement that needs to be compensated. Alternatively, the second approach postulates that the society concern should not be about replacing income, but about ensuring adequate living conditions for a group (the elderly) that cannot generate income in the form of labor earnings. In this view, all individuals should have the right to receive benefits, regardless of their past history, and the only discriminating criteria that should be admissible are the existence of alternative income sources, such as savings, capital earnings, et cetera. This controversy is usually presented as the opposition between those supporting “Bismarkian” models and those preferring “Beveridgian” schemes, in reference to the founders of the pension systems in Germany and the UK.
- Contributory or non-contributory? The second area of debate is about the financing principles of pension systems. This
discussion relates to the previous one, but it is more specific, as the previous one focuses on who should receive benefits, and this is about who should finance them. The opposing views, in this case, refer to whether the system should be financed by those who will benefit from it or by the population in general, through general taxation. The first approach is defined as “contributory”, since those who contribute earn the right to receive benefits, the second, by opposition, as “non contributory”.
Proponents of pension systems as income-smoother mechanisms usually prefer contributory schemes, as it is relatively simple to link benefits to previous earnings through contributions. Thus, active workers would contribute part of their salaries to the system, and then receive a benefit proportional to past contributions and wages. The smoothing effect can be achieved through different schemes, including funded systems (where workers save to finance their future benefits) or unfunded systems (where current workers finance current retirees), as well as individual (where each worker provides for him or herself) or collective (where a group of workers provide for each other).
Non-contributory approaches usually focus on the elderly needs, regardless of past income or contributions history. With this approach, the source of financing becomes irrelevant, as long as it is sustainable. Benefits are assigned to all elderly (in universal models) or those who need assistance (in targeted models). The first approach has some advantages in terms of political economy (universal programs usually have wider public support as everyone benefits from them) and managing costs, but it may be unnecessarily

4
costly if they end up providing generous benefits to those who already had adequate means to support themselves.
While income-smoothing schemes are usually organized as contributory schemes, this is not caused by technical constraints. It is possible, and there are more than a few examples around the world, to design a contributory scheme that provides universal or targeted poverty alleviation for the elderly. Symmetrically, systems financed with general revenue taxes but paying benefits that are linked to individual income history are also common. However, these combinations are usually strongly criticized from a political economy perspective, as they tend to generate implicit and sometimes unwanted effects on income distribution.
In most countries actual pension systems are organized as a combination of contributory and non contributory schemes, as they provide poverty alleviation and income-smoothing. All across Latin America, and also throughout the world, pension systems have components that aim at replacing income and components that aim at providing basic support to the elderly. This combination was traditionally achieved in an implicit way, as pension systems were formally contributory and fully financed through “Pay-As-You-Go” (PAYG) schemes, but in practice most of them had minimum or non-contributory pensions and received some financial support from general revenues. Many structural reforms in the 1990s introduced multipillar schemes, where the components became more clearly separated, as zero and first pillars focus on distributive goals and second and third pillars on income smoothing through individual savings.
- The role of the State While agreeing in the need for income security, scholars and policy makers have
important differences about the role the State should have, either as a regulator, facilitator or provider. The literature is wide open and full of controversies in this matter. Some analysts suggest that the State should limit its role to regulation of financial and insurance markets that could provide adequate financial tools for most individuals trying to smooth their lifetime consumption, allowing them to exercise their own decisions with regards to their lifetime consumption strategy. By adequately regulating financial and insurance markets, the State would allow most workers to save according to their preferences during their working years and then spend these funds after retirement, either through regular savings schemes or through annuity providers. A second approach proposes that the State should have a more proactive role, mostly because market incentives may not be fully aligned with social interest. Thus, governments could promote individual savings, by subsidizing them (for example, declaring long term savings as income tax free), matching individual’s contributions to private savings accounts, and so on. Finally, a third approach considers that these measures are not enough to overcome problems such as information asymmetry, myopia and uncertainty, and consequently the State needs to actively intervene in the process by providing income support in the form of a state run pension system, with compulsory participation.
Pension system coverage is one of the main indicators of the effectiveness of the State’s policy regarding income security, but the way it is measured is affected by the definition of this policy. It is not the only one as other aspects, such as benefits adequacy or financial and political sustainability are equally important. Coverage is the first indicator of
5
inclusion, since a system that is sustainable and adequate but does not cover most of those who are supposed to be protected suffers from a serious failure as a public policy.
Coverage definitions and measurement is affected by the policy principles adopted for the system’s design. For example, systems that focus on labor market participation and aim at maintaining an income flow after retirement should have, in general, lower coverage than those aiming at universal coverage, but this should not be treated as evidence of a flaw in the system, since the policy goal is to cover a smaller portion of the population. A similar problem arises with regards to coverage measurement among active workers. The literature usually considers that workers are covered if they are affiliated or contributing to a pension system. However, if a country has a universal pension scheme financed with general revenue funds, then everyone is covered regardless of any affiliation. In fact, the most serious conceptual and methodological problems arise when considering coverage among active workers, since the definition of this status is not clear.
The most common definition of coverage in social protection programs refers to the proportion of persons receiving a benefit within a given reference group, considered to be the “target population.” This general definition needs to be refined when considering pension systems, since it is necessary to indicate the type of benefit involved and the target population that will be considered when evaluating the scope of the system. According to Grushka (2001) and Bertranou, Grushka and Rofman (2001a, 2001b), quite frequently when discussing pension coverage, reference is made to those individuals who are receiving a pension or retirement benefit. Nonetheless, coverage has two phases. The first is related to the period in which a worker contributes to the system and accrues the right to benefits. This phase is coverage of the economically active population. The second is related to the receipt of monetary benefits when the individual reaches an advanced age, that is, coverage of the elderly.
Coverage indicators among active workers are usually presented as ratios of covered to potentially covered population. One indicator is the ratio between the number of affiliates to pension systems (that is, individuals registered in the pension institutions), and the economically active population. A great advantage of this indicator is the relative simplicity of its calculation. Indeed, even those pension systems with the most deficient administrations are generally capable of estimating the number of workers enrolled, and the size of the economically active population is easy to obtain. Nonetheless, the indicator poses serious problems when analyzed in detail, since many individuals enrolled in the systems are not actually eligible to receive benefits. The records of pension institutions also tend to exaggerate the number of actual affiliates, as erroneous or duplicate records are rarely corrected. One particular problem that became evident after the pension reforms in Latin America is that workers can enroll as participants but not make contributions (or make just a few in the course of their economically active life), either because they lose their job, or because they abandon economic activities (but without applying for benefits, since they do not meet the legal requirements), or simply because they stop paying into the system, joining the informal sector, yet without “disenrolling.” This phenomenon of alternation between a status of non-activity, unemployment, informal employment, and

6
formal employment to economically active population, results in a high and ever-growing ratio of affiliates which eventually surpasses 100%.1
Figure 1 illustrates the evolution of this indicator in Argentina, Chile, and Mexico, based on the number of years passed since the implementation of the reforms. The ratio tends to steadily grow in the three countries, even during recession periods, simply because those who were affiliates and stop contributing during the crises maintained their status. Eventually, the ratio tends to reach and surpass the 100% mark, indicating that there are more affiliates than labor force in the country (in Chile that occurred in 1995, 15 years after the reform). The problem with this indicator (the lack of relevance of the number of affiliates to the system) also affects another commonly used indicator in analyses of the new funded schemes: the ratio of contributors to affiliates, which tends to decline overtime.
Figure 1. Ratio of affiliates to labor force ratio, by years after the reform
Argentina, Chile and Mexico.
20%
40%
60%
80%
100%
120%
0 1 2 3 4 5 6 7 8 9 10 11 12 13 14 15 16 17 18 19 20 21 22 23 24 25Years since reform
% o
f Lab
or F
orce
Chile
Argentina
Mexico
Source: Own, based on information from Arenas de Mesa (2001), SAFJP (2005), CONSAR, and ECLAC
Trying to avoid these distortions, several authors prefer to compare the number of
contributors (that is, the number of persons actually making contributions in a given period) with the number of workers employed—occupational coverage—or with the economically active population (EAP)—coverage of the labor force—in order to provide better estimations of coverage. Though this measurement seems more appropriate, it is important to note that it is not free of biases or distortions. The problem is that the definition of what “being covered” means for active workers is not always clear, as discussed before. Some workers may be covered (meaning that they have the right to receive benefits after retirement) even if they are not making contributions, if they qualify for non-contributory benefits or if they have already made enough contributions to qualify for a contributory benefit. Others, are not covered even if they make contributions, since
1 When analyzing the Argentine case, Paz (2004) estimated that 24% of the economically active population moves between jobs with contributions, jobs without contributions, and unemployment.

7
they live in a country where a relatively high vesting period is required for accessing benefits.
Measuring coverage of the elderly poses fewer difficulties than measuring coverage for the economically active population, since instead of measuring the accrual of rights to a potential benefit, the indicators are based on the number of individuals actually receiving benefits. The indicator customarily used in this regard is the proportion of the elderly population that receives a retirement benefit or pension. This measurement has some limitations, as some elderly individuals may qualify for retirement benefits but prefer to continue working, and others may have enough alternative resources that they do not need or want to apply for a retirement benefit. Bertranou, Grushka and Rofman (2001a) proposed three alternative measurements for coverage among the elderly that would take these factors into consideration. Accordingly, it would be possible to measure “individual coverage,” which would estimate the proportion of the population receiving a benefit, “joint coverage,” which includes spouses of benefit recipients among those covered, or “joint occupational coverage,” which also includes as “covered” those persons who remain employed in the labor market and their spouses. The relevance of this final indicator is that its complement (that is, those who are not covered) are persons who do not have any income from the labor market or from the pension system. Their survival, therefore, depends on the consumption of savings or family transfers.
III. METHODOLOGICAL PROBLEMS AND CAVEATS: Data sources, comparability and risks.
Traditionally, coverage has been measured using registration data, a simple choice given the availability of data sources. This provides a simple method for monitoring coverage trends over time, since pension agencies and institutes customarily release annual membership figures. The method also makes it possible, if the records are high in quality, to analyze labor histories and observe the “density” of their contributions, which cannot be accurately measured by other means. However, using records poses certain problems. Information in countries with multiple independent systems can vary in availability. The quality of the records can also vary (in particular, many pension systems are affected by the existence of incorrect records or duplications). Finally, other sociodemographic characteristics of the population with and without coverage may be hard to determine through these records.
In countries with multiple pension systems, it is common that records are readily available for the largest national schemes, but less accessible for smaller schemes. The most serious problems are seen in relation to sub-national systems (such as provincial pension funds in Argentina or state pension funds in Brazil and Mexico) or systems that cover a specific occupation (such as professional funds in Uruguay, Paraguay, or Argentina, civil servants systems in Peru and Mexico, or retirement schemes for the military and police in almost all the countries of the region), since such programs rarely offer updated, reliable information. Given this situation, one promising alternative consists of using data from household surveys, which allow for a more detailed analysis of the information and reduce the influence of administrative errors.

8
Household surveys collect detailed data on a variety of sociodemographic and economic characteristics, making cross-comparisons of variables possible and assemble information that is not available in the official records. In recent years, several studies have been published in the region using this methodology, but they rarely include international comparisons. Among these works are case studies on Argentina (Bertranou, Grushka and Rofman, 2003), Brazil (MPS, 2004), Ecuador (World Bank, 2006), Paraguay (Cruces and Arca, 2003), Peru (World Bank, 2003), and Uruguay (Bucheli, 2004). Some efforts have also been made to collect information on coverage based on surveys at a regional level, assembling comparable published information. These comparisons represent an important advance in the effort to obtain cross-national data, but they have rarely gone beyond a description of the most basic indicators. Among the most important works in this area are the report issued by the ILO (2000), a compilation of data from surveys published by Packard (2002), and a more recent study focusing on employment histories, by Gasparini (2004).
While more reliable than register information, data from household surveys are not problem-free, as a number of consistency and definition problems affect longitudinal and cross-national comparability. The problems arise from differences in coverage (some surveys are national, other are urban only), phrasing of questions (some surveys ask about affiliation in pension schemes, others about actual contributions; in some cases individuals are asked if they are pensioners, in others they are asked about sources of income, including pensions), individuals interviewed (in some cases, only salaried workers are questioned about their status, in others all workers are questioned) and, of course, differences in systems design.
This paper presents the results of an effort to collect, review, and process household surveys for 17 countries in Latin America in a period that spans from the early 1990s to the mid 2000s2. Data series for each indicator were built and are presented in a statistical annex. Coverage is captured by measuring the proportion of the economically active population above the age of 20 who make contributions to a pension system as an indicator of coverage in the economically active stage and the proportion of the population over the age of 65 who receive benefits as an indicator of coverage among the elderly.
For active workers, three indicators were selected and processed: (i) the ratio of contributors to economically active individuals (ii) the ratio of contributors to employed workers, and (iii) the ratio of contributors to wage earners. Additionally, two indicators for the elderly were considered: (i) the ratio of pension recipients to individuals over the age of 65 and (ii) the ratio of individuals aged 65 and more and residing in households with pension recipients to individuals over the age of 65.
The indicators and their evolution are presented in the next section. Additionally, tabulates on the coverage rates for different groups were calculated, where age, geographical areas, sector of employment, level of education, gender, occupation, firm size, and income quintiles are the main covariates to be considered3.
2 The analysis is similar to the one presented by Rofman and Carranza (2005), but the present one includes all the available data between 1990 toand 2004 instead of doing the analysis in one moment of time. 3 For a complete description of the indicators, coverage of every survey, description of the covariates, and the questions posed by all the surveys, see the methodological annex.

9
Results presented in this paper are generally consistent with published and unpublished data from national pension scheme registries around the region. While figures are not identical (and shouldn’t be, considering the difference in sources), informal consultations with colleagues and local experts around the continent indicated that the data presented in the rest of the paper is reasonable and, with some unavoidable margin of error, represent the actual situation in each country.
IV. MEASURING THE LEVEL AND EVOLUTION OF PENSION COVERAGE IN LATIN AMERICA
IV.1 Coverage of the Active workers Figure 2 presents coverage rates for active workers in the mid 1990s and 2000s4, using
the three indicators described in the previous section. Specifically, it shows the coverage of the economically active population, of the employed, and of the salaried workers.
Figure 2. Coverage Rates of the Economically Active Population
(a) Economically Active Population
0
10
20
30
40
50
60
70
80
BO PY PE NI GU CO EC SA VE MX AR BR UY CL CR
1990s 2000s
4 Since available years are not identical across countries, the data presented in figures in this section represent the closest years to 1995 and 2004 as available. Years used are: Argentina 1995 - 2006; Bolivia 1999 - 2002; Brazil 1995 - 2002; Chile 1996 - 2003; Colombia 1996 - 1999; Costa Rica 1995 - 2004; Ecuador 2000 - 2004; Guatemala 1998 - 2000; Mexico 1998 - 2004; Nicaragua 1998 - 2001; Paraguay 1999 - 2004; Peru 1999- 2003; El Salvador 1995 - 2003; Uruguay 1995 - 2004; Venezuela 1995 - 2004.

10
Figure 2. Coverage Rates of the Economically Active Population (cont…)
(b) Employed
0
10
20
30
40
50
60
70
80
BO PY PE NI GU CO EC SA VE MX AR BR UY CL CR
1990s 2000s
(c) Salaried Workers
0
10
20
30
40
50
60
70
80
90
BO PY PE NI GU CO EC SA VE MX AR BR UY CL CR
1990s 2000s
Source: own, based on Survey of Households. Note: For exact years shown, see footnote 4
This figure shows that nearly half the countries in the region have low or very low coverage rates, with less than 30 percent of the labor force being covered by the pension systems. The numbers somehow improve for the occupied and the wage earners, indicating that unemployment and low coverage among independent workers are a problem in most countries, but even so coverage continues to be low. Only three countries are providing pension protection to more than 70 percent of their salaried workers. Not only are the
11
current levels low, but the evolution in recent years has been negative in ten of the fifteen countries with available data, including the six largest countries in the region.
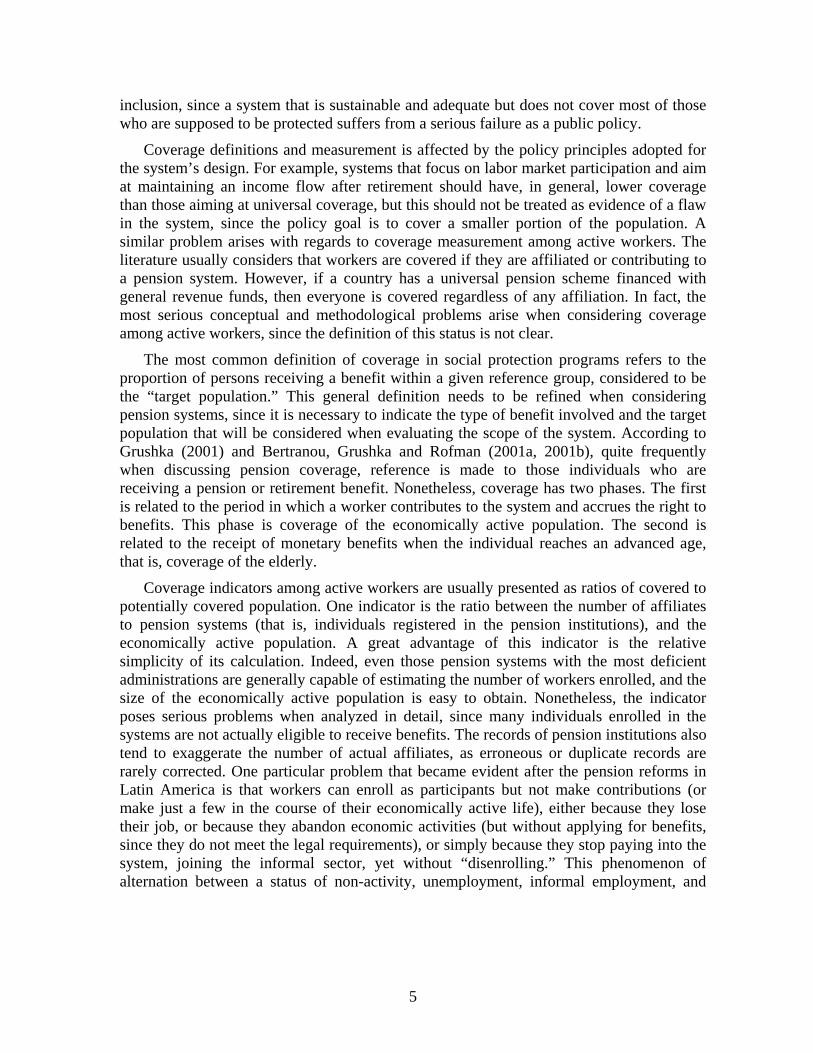
Figure 3 presents the level of the coverage by sector of activity for the two periods under analysis. The employed population was divided into three groups of activity: agriculture, manufacturing and services (called primary, secondary, and tertiary sectors respectively in the figure). The primary sector has low coverage in relation to the other two sectors and the difference is considerable for those countries with relative lower aggregated coverage. This difference is expected given the difficulties experienced by traditional pension systems in covering the rural areas. The differences between manufacturing and services are relatively minor. The figure also indicates that the poor overall evolution of coverage of the employed is driven mainly by a steadily decreasing coverage in the manufacturing sector in almost all of the countries. Figure 4 shows that this is the case in Chile, where coverage in the primary and tertiary sectors is stable over time, while the coverage of workers in manufacturing gradually declines.
Figure 3. Coverage Rates of the Employed Persons, by Sector of the Economy
01020304050607080
BO PY PE NI
01020304050607080
GU CO EC SA
010
2030
40506070
80
VE MX AR BR0
10
20
30
40
50
60
70
80
UY CL CR
Source: own, based on Survey of Households. Note: For exact years shown, see footnote 4
Primary 1990s Tertiary 2000s
Tertiary 1990s Secondary 1990s
Primary 2000s Secondary 2000s
01020304050607080
VE MX AR BR

12
Figure 4. Chile - Participation Rates for Employed Workers by Sector of the
Economy.
0
20
40
60
80
1990 1992 1994 1996 1998 2000 2003
Primary Secondary Tertiary
Source: own, based on Survey of Households.
It is also important to study the coverage indicator of the wage-earners depending on whether they work for the public or the private sector. One would expect a full coverage in the public sector; however, Figure 5 shows that this is far from being the case. In some cases, the coverage in the public sector is less than 80 percent, as in Argentina, Bolivia, and Peru. Though part of the gap could be explained by data misreporting, the low coverage rate of many of the countries in the public sector might be related to a real informality problem in the sector (which is growing over time in some cases, like in Argentina). However, most of the countries have coverage in the public sector higher than 80 percent and favorable evolution over time.5 This is the case of Brazil, where the stable average is hiding a slightly decline of the coverage in the private sector and an increase in the public one over time.
5 In the case of Uruguay, we followed the methodology adopted by Marisa Bucheli (2004) who assumes that all the public sector is covered. Although this is not the case, it is close to the real situation in the country.

13
Figure 5. Coverage Rates of the Employed Persons, by Type of Employer
0
20
40
60
80
100
BO PY PE NI0
20
40
60
80
100
GU CO EC SA
0
20
40
60
80
100
VE MX AR BR0
20
40
60
80
100
UY CL CR
Source: own, based on Survey of Households. Note: For exact years shown, see footnote 4
Figure 6. Brazil - Participation Rates for Employed Workers by Type of Employer.
0
20
40
60
80
100
1992 1993 1995 1996 1997 1998 1999 2001 2002
Public Private
Source: own, based on Survey of Households.
Private 2000s
Private 1990s Public 1990s
Public 2000s

14
It is well known that there is a high correlation between the coverage of wage-earners and the size of the workplace. Considering three firm size groups -small (five or less workers), medium (6 to 50 workers), and big workplaces (more than 50 workers)6-, it is clear that the largest firms offer more coverage to their workers. Almost all of the countries have coverage higher than 60 percent for those who work in large firms and have coverage lower than 20 percent for those who work in small firms. This supports the idea that the biggest firms tend to be more formal, while the opposite happens with those workplaces that are small in terms of number of worker. Many of the countries present a constant (or even an increasing) coverage over the last decade for those who work in medium or large firms, while there is almost a generalized decreasing coverage of those who work in small workplaces. This is the case of Uruguay, as it is presented in Figure 8.
Figure 7. Coverage Rates of the Employed, by Firm Size
0
20
40
60
80
100
BO PY PE NI0
20
40
60
80
100
GU CO EC
0
20
40
60
80
100
VE MX AR BR
0
20
40
60
80
100
UY CL CR
Source: own, based on Survey of Households. Note: For exact years shown, see footnote 4
6 We could not do the same division for all of the countries given that the surveys do not contemplate the same size among countries. However, we tried to maintain a similar definition across countries. See the methodological annex for a full description in relation to the size of the workplace.
Small 1990s Large 2000s
Large 1990s Medium 1990s
Small 2000s Medium 2000s

15
Figure 8. Uruguay - Coverage Rates for Employed Workers by Firm Size. 1995-
2004
0
20
40
60
80
100
1995 1997 1998 1999 2000 2001 2002 2003 2004
Small Medium Large
Source: own, based on Survey of Households.
Just as the characteristics of the labor relationship and those of the employer have a relevant effect on the level of coverage, the sociodemographic characteristics of individuals can also be a determinant. In this analysis, consideration is given to the workers’ gender, age, income levels and education.
There are no systematic and important differences in the coverage of active workers by gender at any time in the observed period. On the other hand, the data show a clear pattern when considering the age of the population contributing to the pension system. In most countries, the coverage by age has an inverted U shape form of the employed population. Most importantly, the inverted U shape is getting clearer over time, indicating a decline in coverage among the younger and older workers.
Figure 9. Coverage Rates of the Economically Active Population, by gender
0
20
40
60
80
BO PY PE NI GU CO EC SA VE MX AR BR UY CL CR
Male 1990s Male 2000s Female 1990s Female 2000s
Source: own, based on Survey of Households. Note: For exact years shown, see footnote 4

16
Figure 10. Coverage Rates of the Employed, by Age
0
20
40
60
80
BO PY PE NI0
20
40
60
80
GU CO EC SA
0
20
40
60
80
VE MX AR BR0
20
40
60
80
UY CL CR
Source: own, based on Survey of Households. Note: For exact years shown, see footnote 4
Coverage by income levels is a dimension of particular interest for analysts and policy makers. One of the main objectives of pension systems is to protect retired workers from poverty. In order to achieve this objective, a contributory scheme requires that the poorest sectors participate in the program during their economically active life, in order to receive benefits after retirement. Figure 11 presents coverage rates of the labor force by quintiles of per capita income. In almost all countries the poorest are practically excluded from the system. The situation is similar when considering the employed population, showing that pension systems suffer from major inequities in terms of access, even if differential unemployment is ignored. Most countries have coverage rates higher than 50 percent for the highest quintile, but none has a rate higher than that for the poorest. The recent evolution of coverage by quintiles shows that inequity has grown. This shows an increasing inequality in coverage in terms of per capita income. The clearest example is the case of Argentina, which is presented in Figure 12.
40-49 (1990s)
40-49 (2000s) 30-39 (2000s)
30-39 (1990s) 20-29 (1990s)
50-59 (2000s)
50-59 (1990s)
20-29 (2000s)
60-69 (1990s)
60-69 (2000s)

17
Table 11. Coverage Rates of the Economically Active Population, by Quintile of Per capita Income
0
20
40
60
80
BO PY PE NI
0
20
40
60
80
GU CO EC SA
0
20
40
60
80
VE MX AR BR0
20
40
60
80
UY CL CR
Source: own, based on Survey of Households. Note: For exact years shown, see footnote 4
Figure 12. Argentina - Coverage Rates for Employed Workers by Quintile of Per capita Income.
0
20
40
60
80
100
1992 1994 1996 1998 2000 2002 2004 2006
Quintile 1 Quintile 2 Quintile 3 Quintile 4 Quintile 5
Source: own, based on Survey of Households.
Q-III (1990s)
Q-III (2000s) Q-II (2000s)
Q-II (1990s) Q-I (1990s) Q-IV (2000s)
Q-IV (1990s)
Q-I (2000s)
Q-V (1990s)
Q-V (2000s)

18
A similar situation occurs in terms of education. Figure 13 shows the evolution of coverage among employed workers by country, considering their educational attainment. Most countries under consideration have very low coverage among population with lower education and gaps are higher for those countries with relative low aggregated coverage. Additionally, the situation is getting worse over time for most of the countries.
Figure 13. Coverage Rates of the Active Population, by Level of Education
0
20
40
60
80
100
BO PY PE NI
0
20
40
60
80
100
GU CO EC SA
0
20
40
60
80
100
VE MX AR BR0
20
40
60
80
100
UY CL CR
Source: own, based on Survey of Households. Note: For exact years shown, see footnote 4
IV.2 Coverage of the Elderly Pension coverage among the elderly is relatively simpler to measure, as it requires
verification of whether individuals are actually receiving benefits or not. Figure 14 presents the coverage of the elderly in Latin America and its evolution in the near past. Coverage is extremely low in many countries, and only in Costa Rica, Argentina, Bolivia, Chile, Uruguay, and Brazil the rates are at 60 percent or higher. It is clear that the situation got worse over the years for some of the countries. Argentina has the worst relative performance in this indicator, since coverage declined from 77 percent in 1995 to 65
Primary 1990s Superior 2000s
Superior 1990s Secondary 1990s
Primary 2000s Secondary 2000s

19
percent in 2004. Other countries such as Colombia, Venezuela, Costa Rica, and Panama, had a more favorable evolution.
Coverage is limited to contributory schemes in countries with relatively low participation. However, the importance of non contributory benefits is important among some the countries with high coverage. Uruguay and Argentina have small non contributory benefits that cover some poor individuals aged 70 or more that do not qualify for contributory retirement benefits. In Brazil, there is a large quasi-non contributory system that covers rural workers7. Other countries, like Mexico, have some non-contributory schemes at the subnational level. The data available from household surveys do not distinguish between contributory and non contributory beneficiaries in most cases, but in Bolivia, Ecuador, Chile, Costa Rica, surveys ask specifically about these programs. In these cases, those who receive only non contributory benefits represent 58%, 17%, 14% and 21% of the elderly, respectively.
Figure 14. Coverage Rates of the Elderly
0
20
40
60
80
100
GU DR SA PY CO MX PE VE EC PA CR AR BO CL UY BR
1990s - Non cont. 2000s - Non cont. 1990s - Cont. 2000s - Cont.
Source: own, based on Survey of Households. Notes: For exact years shown, see footnote 4. The lighter section of the bars represents beneficiaries that receive only non contributory pensions.
The aggregate coverage rates hide important differences. Figure 15 shows rates by gender. In all countries women have lower rates, and differences are important, except in the case of Uruguay. In many cases, coverage rates for men are twice as large, indicating a serious problem of access to the pension system for women in general.
7 While the rural pension system in Brazil is formally contributory, contributions are not linked to salaries or individual income but on rural production. Benefits are not linked in any way to past contributions, but defined in relation with the minimum wage, and the system is heavily subsidized. (for a detailed discussion, see Schwarzer and Querino, 2002)

20
Figure 15. Coverage Rates of the Elderly, by Gender
0
20
40
60
80
100
GU DR SA PY CO MX PE VE EC PA CR AR BO CL UY BR
Rural 1990s - Non Cont. Rural 2000s - Non Cont. Urban 1990s - Non Cont. Urban 2000s - Non Cont.Rural 1990s - Cont. Rural 2000s - Cont. Urban 1990s - Cont. Urban 2000s - Cont.
Source: own, based on Survey of Households. Note: For exact years shown, see footnote 4. The lighter section of the bars represents beneficiaries that receive only non contributory pensions.
Age differentials are also important. Coverage rates tend to increase with age for some countries, especially those with larger coverage, as some workers delay their retirement past the minimum legal age, but eventually apply for benefits. The gap in coverage between age groups is growing over time in countries with larger coverage. This is the case in Uruguay, as shown in Figure 17. In other cases, coverage seems to be unaffected by age, or even declining as individuals are older. This may be caused by the immaturity of some systems that were recently introduced or expanded, resulting in better coverage for younger cohorts.

21
Figure 16. Coverage Rates of the Elderly, by Age
0
20
40
60
80
100
GU DR SA PY
0
20
40
60
80
100
CO MX PE VE
0
20
40
60
80
100
EC PA CR AR
0
20
40
60
80
100
BO CL UY BR
Source: own, based on Survey of Households. Note: For exact years shown, see footnote 4. The lighter section of the bars represents beneficiaries that receive only non contributory pensions.
Figure 17. Uruguay - Coverage Rates for the Elderly by Age, 1995-2004
0
20
40
60
80
100
1995 1997 1998 1999 2000 2001 2002 2003 2004
60-64 65-69 70-74 75-79
Source: own, based on Survey of Households Most contributors to pension are urban residents, as labor markets are better organized
in cities and government agencies have more enforcement power. In consequence, most beneficiaries are also urban residents. Figure 18 presents coverage rates of the elderly by
65-69 (1990s) 65-69 (2000s)
60-64 (1990s) 70-74 (2000s) 70-74 (1990s)
60-64 (2000s) 75-79 (1990s) 75-79 (2000s)

22
residence, showing that there is a considerable coverage gap favoring urban residents. Changes in the last decade do not seem to have affected the elderly differentially. Brazil is the exception in this case, due to the existence of a large, cuasi non-contributory, rural pension scheme.
Figure 18. Coverage Rates of the Elderly, by Region
0
20
40
60
80
100
GU DR SA PY CO MX PE VE EC PA CR AR BO CL UY BR
Rural 1990s - Non Cont. Rural 2000s - Non Cont. Urban 1990s - Non Cont. Urban 2000s - Non Cont.Rural 1990s - Cont. Rural 2000s - Cont. Urban 1990s - Cont. Urban 2000s - Cont.
Source: own, based on Survey of Households. Note: For exact years shown, see footnote 4. The lighter section of the bars represents beneficiaries that receive only non contributory pensions.
Figure 19. Brazil - Coverage Rates of the Elderly by Region, 1992-2002
0
20
40
60
80
100
1992 1993 1995 1996 1997 1998 1999 2001 2002
Rural Urban
Source: own, based on Survey of Households Pension benefits provide an important flow of cash to households with elderly
members. The impact of these transfers on income distribution is important, but difficult to measure, since these benefits affect the observed income distribution. Furthermore, given that retirement benefits in households that include elderly members are a major component of total income, measuring the relation between poverty and coverage would yield confusing data, since the uncovered are more likely to be poor, partly because they do not receive a retirement benefit.
Figure 20 shows coverage rates of the elderly, by quintiles of per capita income. The figure indicates a clear bias towards covering the richer groups in almost every country, a

23
finding consistent with the literature. There seems to be three clear categories of countries in this respect. The first group includes six countries (Guatemala, Dominican Republic, El Salvador, Ecuador, Paraguay, and Mexico) that offer low protection (less than 40% coverage rate) to all income groups, with some inequities. This group pension systems coverage could be characterized as “universally low with inequities”. The second group includes four countries (Colombia, Peru, Venezuela, and Panama) that provide better protection to the rich elderly, but their incidence among the poor is minimal. A characterization of coverage in these countries could be “reasonable for the rich, minimum for the poor”. Finally, the third group of countries is integrated by those that provide protection to most of their rich and mid income elderly (Costa Rica, Argentina, Bolivia, Chile, Uruguay and Brazil), and while there are some inequities in access, coverage among the poorest is significant, partly thanks to the impact of non contributory benefits. This group’s coverage could be defined as “reasonable, with some inequities”8.
Figure 20. Coverage Rates of the Elderly, by Quintile
0
20
40
60
80
100
GU DR SA PY
0
20
40
60
80
100
CO MX PE VE
0
20
40
60
80
100
EC PA CR AR0
20
40
60
80
100
BO CL UY BR
Source: own, based on Survey of Households. Note: For exact years shown, see footnote 4. The lighter section of the bars represents beneficiaries that receive only non contributory pensions.
The decline on overall coverage reported before appears to be affecting mostly the poorest groups, while the richest quintile has improved its coverage. Argentina is a 8 The inclusion of Bolivia in this group is caused by the non contributory scheme (BONOSOL), which covers almost 75% of the population in a very equalitarian way. If only the contributory scheme is considered, then Bolivia would be part of the first group (“universally low with inequities”)
Q-III (1990s)
Q-III (2000s) Q-II (2000s)
Q-II (1990s) Q-I (1990s)
Q-IV (2000s)
Q-IV (1990s)
Q-I (2000s)
Q-V (1990s)
Q-V (2000s)

24
particularly dramatic example of this trend that, presented in more detail in figure 21, as it seems to be shifting the country from the third to the second category, as presented in more detail in figure 21.
Figure 21. Argentina – Coverage Rates of the Elderly by Quintile
0
20
40
60
80
100
1992 1993 1994 1995 1996 1997 1998 1999 2000 2001 2002 2003 2004 2005 2006
Quintile 1 Quintile 2 Quintile 3 Quintile 4 Quintile 5
Source: own, based on Survey of Households
Figure 22. Coverage Rates of the Elderly, by Level of Education
0
20
40
60
80
100
GU DR SA PY
0
20
40
60
80
100
CO MX PE VE
0
20
40
60
80
100
EC PA CR AR0
20
40
60
80
100
BO CL UY BR
Source: own, based on Survey of Households. Note: For exact years shown, see footnote 4. The lighter section of the bars represents beneficiaries that receive only non contributory pensions.
Primary 1990s
Superior 2000s
Superior 1990s Secondary 1990s
Primary 2000s Secondary 2000s

25
One way to avoid the problem introduced by measuring coverage by income level when being covered affects individuals’ income is to use a proxy for lifetime income, such as education. Old individuals achieved their maximum educational level years before retiring, and the literature has shown that there is a strong link between educational attainment and lifetime income. As expected, the pension systems cover higher educated individuals more extensively than those with lower education, in most countries. The coverage gaps and trends observed with regards to income levels are similar for this dimension, but differences are smaller. Still, the three groups of countries described before can be easily identified in figure 22. Interestingly, while the decline in coverage observed in higher coverage countries affected mostly low income individuals, the impact by educational attainment was more even, as shown in figure 23 for Uruguay.
Figure 23. Uruguay - Coverage Rates of the Elderly by Education
0
20
40
60
80
100
1995 1997 1998 1999 2000 2001 2002 2003 2004
Primary Secondary Superior
Source: own, based on Survey of Households
Pension benefits received by covered individuals are regularly used to finance their consumption, as well as that of other members of their household. Adapting a definition originally used for Argentina by Bertranou, Grushka and Rofman (2001a), an alternative measurement of coverage might include as covered individuals that, while not receiving a benefit by themselves, share a household with somebody that is a beneficiary. This approach allows considering spouses and dependents of covered individuals as covered as well. The indicator (“joint coverage”) represents the percentage of the elderly who reside in a household in which at least one pension benefit is received.

26
Figure 24. Individual and Joint Coverage
0
20
40
60
80
100
GU DR SA BO EC PY CO MX PE VE CR PA CL AR UY BR
Individual 1990s Individual 2000s Joint 1990s Joint 2000s
Source: own, based on Survey of Households Note: For exact years shown, see footnote 4.
Figure 24 presents, for comparison, both the individual and the joint coverage for each country. As expected, joint coverage is somewhat higher than individual coverage, since it includes all beneficiaries and their relatives aged 65 and more. The effect is similar in almost all the countries, with increases in coverage ranging from 2 to 12 percentage points. The evolution of both indicators, as expected, is also similar over time.
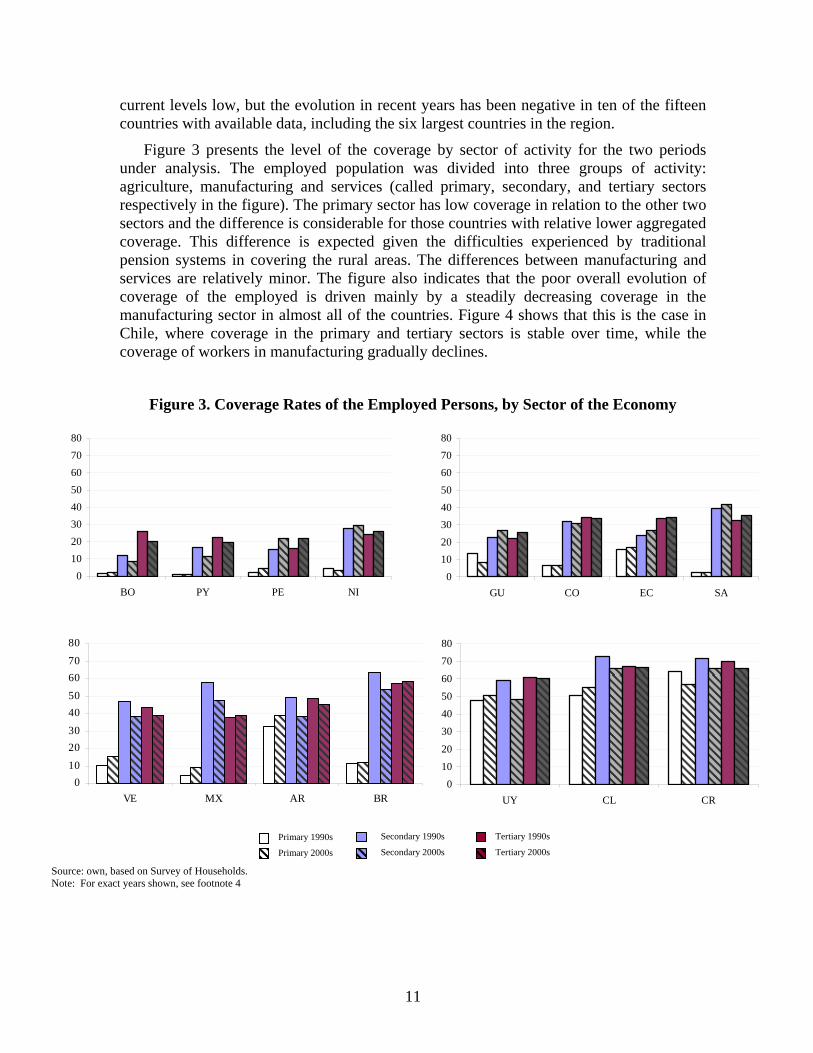
Finally, as discussed in previous sections, coverage is only one dimension to assess the effectiveness of a pension system. High coverage with extremely low benefits results in inadequate income protection for the elderly. An indirect approach to assess the adequacy of pension benefits is to consider the proportion of total household income that originates from pensions, in the case of households with pensioners. Figure 25 shows these proportions for each country, for households composed exclusively of elderly members and households that have younger and older members (but, still, at least one of them is a pensioner)9. As expected the importance of pension benefits in the household budget is less important when younger individuals live in the household, since some of them have other income sources. Still, in many countries the proportion for these households is over 50%, showing that pension benefits have an important role to finance consumption of younger individuals. In elderly only households, the proportions are high, over 70% in most countries, with the exception of Dominican Republic and Peru, where benefits appear to be relatively low in comparison with other income sources.
9 This figure is only for contributory benefits, as data on noncontributory benefits income is incomplete in most surveys.
27
Figure 25. Rate of Total Household Income from Pensions to Total Household Income, by Type of Family
0
20
40
60
80
100
GU DR SA BO EC PY CO MX PE CR PA CL AR UY BR
Total 1990s Total 2000s Only Elderly 1990s Only Elderly 2000s
Source: own, based on Survey of Households Note: For exact years shown, see footnote 4.
V. CONCLUSIONS AND FUTURE CHALLENGES This paper presents the results of an important effort to collect, review, and process
information from household surveys in Latin America, to measure pension coverage and some relevant covariates. After reviewing existing data, a set of seventeen countries (fifteen had information on active workers, sixteen on retirees) was selected and available data since the early 1990s was processed.
While this paper does not aim at presenting an elaborate analytical framework, explaining coverage determinants or attempting to identify causalities, it provides an important amount of comparable data that allows formulation of a few stylized facts about pension coverage in Latin America:
- Coverage among active workers is low in most countries, as less than 40% of the labor force made regular contributions to pension systems in 11 of the 15 countries considered in the mid 2000s. This low coverage is partly caused by high unemployment and low participation of self employed workers, but even if only salaried workers are considered, there are nine countries with rates at 50% or below.
- Problems are higher among workers in the primary sector and small firms, where coverage is almost non existent, with a few exceptions. Manufacturing and services sectors are doing better, and large firms (50 workers or more) have very high rates.
- As expected, coverage is high among public sector employees. However, in most countries this rate is far from 100% (in some cases, as Peru, Nicaragua,

28
Guatemala, and Argentina is below 80%), showing that compliance problems also affect the public sector.
- Gender biases tend to be minor among active workers, but large among the retired. In eight countries women have lower coverage rates than men; in seven they have higher rates. In all cases differences are small, and have not changed significantly since the 1990s. Interestingly, the gender differences in coverage of the elderly are very large, exceeding 100% in some countries. The data seem to indicate that the cause of the gender bias in coverage among the elderly is not a differential access to contributory systems for woman in the labor force, but differences in access to the labor force. Also, while changes in coverage of active workers since the 1990s appear to have been small, it is possible that differences before then were higher, and those differences are now reflected in the elderly coverage rates.
- Poor workers have little or no participation in contributory pension systems, with the exception of two or three countries. In 13 of the 15 countries with data coverage of the lowest quintile was below 20% in the mid 2000s, while the rates for the highest quintile were between three and forty five times larger. Inequity in access has increased since the 1990s in countries with high coverage and declined in those with lower coverage.
- Coverage of contributory schemes among the elderly is very low in most countries in the region, since twelve of the sixteen countries with available data provide pensions to 40% of their elderly or less. The low coverage of public pensions affects more seriously the, those living in rural areas, the poorest and least educated.
- Four countries (Chile, Argentina, Uruguay, and Brazil) have significantly higher coverage rates, at 60% or higher. Two other countries, Costa Rica and Bolivia, join the group when non contributory benefits are considered. If older individuals living in households where at least one member receives a benefit are also considered as covered, then rates grow to over 70% in Chile and Argentina and over 90% in Uruguay and Brazil.
- The trends in elderly coverage have been mixed since the 1990s. Ten countries had small increases in rates, while six countries had declines. These changes are slow by design since individuals live long periods as retirees. In a few cases there is a worrying declining trend in the overall rates, which is mostly originated in a lower flow of new retirements. For example, in Argentina the coverage rate of population aged 65 to 69 declined by 21 percentage points, and in Uruguay the decline of the same rate was 5 percentage points.
While findings in this document are useful to better understand the pension systems in the region, much remains to be done. On one hand, the data presented in the paper and its annex will probably require further evaluation, as definition, inconsistencies and comparison problems are likely to be identified once the data are used for analytical purposes. Also, the time series should be continued, as more surveys become available, and more countries and indicators incorporated. In this sense, this paper presents a work in progress, which will be continued in the future.

29
As discussed in the introduction, old age income security systems performance can be analyzed considering three basic dimensions: coverage, adequacy and sustainability. This paper focused on the first one, showing the current status and recent evolution of coverage indicators in several Latin American countries. Further work should improve and expand this analysis, but should also aim at collecting data on adequacy and sustainability. In the first case, information on benefits of those currently retired would be important. Also, as most systems continue to be contributory, the question of contribution densities and accrued rights of active workers is critical to predict future coverage and adequacy of benefits. Analysts in several countries in the region have been working on this topic for some time, and comparable data, with some restrictions, could be collected. Finally, the discussion about sustainability should always be present. Indicators of long term financial sustainability, such as the “Implicit Pension Debt” have been used for some time and are appropriated for those comparisons, but other, shorter term indicators should also be collected an analyzed. These are all pending tasks, that analysts around the region should work on to advance in a more comprehensive understanding of the pension systems, their performance and possible improvements.

30
REFERENCES Arenas de Mesa Alberto and Hernández Sánchez, Héctor (2001) “Análisis, evolución y
propuestas de ampliación de la cobertura del sistema civil de pensiones en Chile,” in Cobertura Previsional en Argentina, Brasil y Chile. Oficina Internacional del Trabajo, [International Labor Office] Santiago, Chile.
Arza, Camila and Cruces, Guillermo (2003) “Social Protection in Paraguay: Pension Coverage and Social Vulnerability.” Mimeo. The World Bank, Washington.
Bertranou, Fabio; Grushka, Carlos and Rofman, Rafael (2001a) “La Política Previsional en Argentina a comienzos del siglo XXI.” In VI Jornadas Argentinas de Población. AEPA [Asociación de Estudios de Población de la Argentina – Argentine Association on Population Studies], Neuquén.
Bertranou, Fabio; Grushka, Carlos and Rofman, Rafael (2001b) “La previsión social en la Argentina: una mirada integral de sus instituciones, las políticas públicas y sus desafíos.” In “Informe de Tercera Edad en la Argentina”, Secretaría de la Tercera Edad y Acción Social [Secretariat on Aging and Social Action], Buenos Aires.
Bertranou, Fabio; Grushka, Carlos and Rofman, Rafael (2003) “De la reforma a la crisis: El Sistema de Pensiones de la Argentina.” In Revista Internacional de Seguridad Social, ISSA [International Social Security Association], Geneva.
Bucheli, Marisa (2004) “La cobertura de la Seguridad Social en el Empleo, 1991-2002,” in Protección Social y Mercado Laboral, Oficina Internacional del Trabajo [Internacional Labor Office], Santiago.
Gasparini, Leonardo (2004) “América Latina: Estudio de la protección social y el empleo sobre la base de encuestas de hogares,” in Protección Social y Mercado Laboral, Oficina Internacional del Trabajo [International Labor Office], Santiago.
Gill, Indermint, Packard, Truman and Yermo, Juan (2004) Keeping the Promise of Social Security in Latin America. The World Bank, Washington.
Grushka, Carlos (2001) La cobertura previsional en Argentina a fines del Siglo XX. In Socialis, No. 4. Rosario, Argentina.
Holzmann, Robert (2005) Perspectivas y tendencias internacionales en las reformas a los sistemas de pensiones. In Avances, experiencia internacional y retos de los sistemas de ahorro para el retiro. CONSAR (Comisión Nacional del Sistema de Ahorro para el Retiro [National Commission for the Retirement Savings System]), Mexico City. Publication pending.
ILO (2001) Social Security: A New Consensus. International Labor Office, Geneva.
ILO [International Labor Organization] (2000) World Labor Report. International Labor Office, Geneva.
Isuani, Aldo (1979) The State and Social Security Policies towards Labor: Theoretical Elements and the Argentine Case, 1900-1925. Doctoral Thesis, University of Pittsburg.
31
Mesa Lago, Carmelo (2001) “La cobertura de pensiones de seguridad social en América Latina. Antes y después de la reforma previsional.” En Socialis, No. 4. Rosario, Argentina.
MPS [Ministério da Previdência Social] (2004) Informe de Previdencia Social Vol. 16 No. 5. Ministério da Previdência Social [Social Security Department], Brasilia.
Packard, Truman (2002) “Are there Positive Incentives from Privatizing Social Security? A Panel Analysis of Pension Reform in Latin America,” Journal of Pensions, Economics, and Finance, Vol. 1., No. 2.
Paz, Jorge (2004) “Argentina: Dinámica de la protección social y el Mercado laboral, 1995-2002,” in Protección Social y Mercado Laboral, Oficina Internacional del Trabajo [International Labor Office], Santiago.
Rofman, Rafael and Carranza, Eliana (2005) Social Security Coverage in Latin America. Social Protection Discussion Paper Series # 0523. The World Bank, Washington DC.
SAFJP [Superintendencia de Administradoras de Fondos de Jubilaciones y Pensiones] (2005) El régimen de capitalización a diez años de la reforma. Superintendencia de AFJP [Superindendency of Administrators of Pension and Retirement Funds], Buenos Aires.
Schwarzer, Helmut and Querino, Ana C. (2002) “Beneficios sociales y los pobres en Brasil: Programas de Pensiones no Convencionales” in Bertranou et al (eds) Pensiones no Contributivas y Asistenciales. ILO, Santiago
Secretaría de Seguridad Social [Secretariat of Social Security] (2002) Libro Blanco de la Seguridad Social. MTESS [Ministerio de Trabajo, Empleo y Seguridad Social – Ministry of Labor, Employment, and Social Security], Buenos Aires.
World Bank (1994) Averting the Old Age Crisis. Washington.
World Bank (2004) Peru: Restoring the Multiple Pillars of Old Age Income Security. Washington.
World Bank (2006) Ecuador: Policy Options for the Social Insurance System. Publication pending, Washington.

32
ANNEX I Basic Statistics
1. Argentina
Table A1.1. Argentina - Coverage Rates of the Economically Active Population and Elderly
Year
Contributors / Economically
Active Population
Contributors / Employed Persons
Contributors / Wage-Earners
Contributors / Employers - Independent
Beneficiaries / Population Age
65+
1992 46.76 49.71 72.44 . 78.09 1993 44.22 47.98 71.26 . 77.16 1994 45.45 50.86 73.67 . 77.60 1995 41.41 48.68 69.26 . 77.74 1996 40.51 48.06 67.09 . 76.34 1997 41.28 47.28 65.66 . 75.19 1998 41.09 46.22 64.36 . 73.38 1999 39.99 45.93 63.81 . 73.31 2000 39.04 45.28 63.24 . 70.70 2001 36.88 44.65 62.97 . 71.59 2002 34.08 40.93 57.00 . 69.44 2003 32.98 38.29 51.94 . 68.26 2004 34.95 39.45 53.26 . 67.83 2005 37.69 41.62 55.91 . 68.91 2006 39.18 43.43 57.67 . 68.80
Source: own, based on Permanent and Ongoing Survey of Households – Expanded User Base
Table A1.2. Argentina - Coverage Rates of the Employed Person, by age
Year 20-29 30-39 40-49 50-59 60-69
1992 52.89 52.17 51.01 48.17 31.71 1993 52.46 50.72 48.49 45.77 27.92 1994 53.75 55.04 49.61 49.43 30.65 1995 48.49 53.97 48.84 46.92 34.48 1996 52.06 52.35 47.20 44.07 30.98 1997 49.50 52.38 47.07 44.28 32.10 1998 46.80 51.31 47.36 42.98 33.31 1999 46.81 50.61 46.71 43.56 33.14 2000 44.87 50.42 46.94 42.45 33.29 2001 43.67 49.47 46.63 43.02 33.26 2002 35.49 46.43 43.66 41.48 35.09 2002 26.97 40.42 37.44 35.77 29.40 2003 25.79 39.77 38.51 34.08 27.03 2004 37.05 44.95 41.88 39.05 28.70 2005 41.03 45.67 45.16 39.75 30.80 2006 40.97 49.02 46.60 42.39 33.03

33
Source: own, based on Permanent and Ongoing Survey of Households – Expanded User Base
Table A1.3. Argentina - Coverage Rates of the Elderly , by age
Year 60-64 65-69 70-74 75-79 1992 65.59 79.98 85.09 91.69 1993 64.12 80.90 84.83 89.83 1994 65.86 80.40 86.17 88.50 1995 65.99 80.41 85.96 88.71 1996 63.23 80.41 85.34 86.89 1997 61.07 75.34 86.73 88.56 1998 58.41 74.15 82.96 90.63 1999 56.44 72.56 84.54 90.99 2000 51.42 71.07 83.54 88.71 2001 53.08 69.84 82.97 89.91 2002 54.46 68.39 76.33 87.35 2003 49.95 66.42 79.54 86.67 2004 48.28 67.52 78.53 84.87 2005 48.56 67.92 81.96 85.40 2006 47.60 67.57 82.08 87.76
Source: own, based on Permanent and Ongoing Survey of Households – Expanded User Base
Table A1.4. Argentina - Coverage Rates of the Economically Active Population, Employed Persons, and Elderly, by gender
Contributors / Economically Active Population Contributors / Employed Persons Beneficiaries / Population Age 65+
Year
Men Women Men Women Men Women 1992 47.60 45.35 50.50 48.39 84.39 73.86 1993 45.73 41.83 49.01 46.31 85.46 71.50 1994 46.66 43.53 51.39 49.98 85.68 72.58 1995 42.34 39.99 48.80 48.49 86.61 71.89 1996 42.02 38.20 48.88 46.73 85.24 70.55 1997 42.82 38.96 48.05 46.05 80.82 71.60 1998 41.99 39.73 46.74 45.42 80.61 68.62 1999 40.71 38.96 46.28 45.40 79.00 69.67 2000 39.77 37.98 45.61 44.78 74.88 68.01 2001 36.80 37.01 44.86 44.35 76.34 68.56 2002 33.48 34.90 40.13 42.02 73.39 66.96 2003 34.92 30.48 39.83 36.24 74.26 64.24 2004 36.92 32.37 41.05 37.29 73.23 64.32 2005 39.30 35.60 42.73 40.11 73.06 66.31 2006 41.48 36.18 45.07 41.19 73.90 65.44
Source: own, based on Permanent and Ongoing Survey of Households – Expanded User Base
34
Table A1.5. Argentina - Coverage Rates of the Economically Active Population, Employed Persons, and Elderly, by Region
Contributors / Economically Active Population
Contributors / Employed Persons Beneficiaries / Population Age 65+
Year
Rural Urban Rural Urban Rural Urban 1992 . 46.76 . 49.71 . 78.09 1993 . 44.22 . 47.98 . 77.16 1994 . 45.45 . 50.86 . 77.60 1995 . 41.41 . 48.68 . 77.74 1996 . 40.51 . 48.06 . 76.34 1997 . 41.28 . 47.28 . 75.19 1998 . 41.09 . 46.22 . 73.38 1999 . 39.99 . 45.93 . 73.31 2000 . 39.04 . 45.28 . 70.70 2001 . 36.88 . 44.65 . 71.59 2002 . 34.08 . 40.93 . 69.44 2003 . 32.98 . 38.29 . 68.26 2004 . 34.95 . 39.45 . 67.83 2005 . 37.69 . 41.62 . 68.91 2006 . 39.18 . 43.43 . 68.80
Source: own, based on Permanent and Ongoing Survey of Households – Expanded User Base
Table A1.6. Argentina - Coverage Rates of the Economically Active Population, by Quintile Year Quintile 1 Quintile 2 Quintile 3 Quintile 4 Quintile 5 1992 39.49 47.99 50.60 57.74 52.68 1993 34.26 43.11 51.16 50.28 50.07 1994 30.22 43.94 50.59 52.01 56.38 1995 22.28 39.46 44.48 52.55 53.42 1996 17.57 41.46 43.78 50.96 53.10 1997 20.92 38.07 45.16 52.13 54.37 1998 19.48 36.19 45.19 53.33 54.61 1999 18.20 35.04 44.52 50.43 55.50 2000 14.97 32.53 43.87 51.26 55.62 2001 9.50 29.74 41.16 50.09 56.18 2002 5.32 24.65 36.52 45.54 57.39 2003 4.49 21.32 35.32 46.87 56.01 2004 6.08 23.31 36.53 48.65 57.36 2005 7.40 26.04 41.44 51.94 60.06 2006 8.64 28.42 42.51 53.31 61.17
Source: own, based on Permanent and Ongoing Survey of Households – Expanded User Base

35
Table A1.7. Argentina - Coverage Rates of the Employed Persons, by Quintile Year Quintile 1 Quintile 2 Quintile 3 Quintile 4 Quintile 5 1992 48.08 51.87 54.64 58.15 54.23 1993 43.79 49.13 53.96 52.72 51.11 1994 42.55 52.67 55.43 55.09 57.79 1995 36.48 49.70 52.11 59.62 55.03 1996 33.01 51.94 52.51 55.83 56.49 1997 31.15 48.02 51.66 56.80 56.46 1998 29.15 42.87 51.73 57.74 55.51 1999 27.98 43.69 50.78 55.56 58.87 2000 24.00 43.18 51.34 55.56 58.86 2001 21.59 40.87 51.61 57.65 58.83 2002 11.41 35.54 46.87 53.90 60.04 2003 8.92 30.17 44.62 52.34 59.67 2004 9.58 30.93 44.00 53.77 59.39 2005 11.43 33.07 47.16 55.58 61.81 2006 13.30 35.02 48.36 57.57 63.43
Source: own, based on Permanent and Ongoing Survey of Households – Expanded User Base
Table A1.8. Argentina - Coverage Rates of the Elderly, by Quintile Year Quintile 1 Quintile 2 Quintile 3 Quintile 4 Quintile 5 1992 63.43 84.09 83.63 83.90 80.11 1993 62.39 79.72 86.41 79.37 82.07 1994 58.65 82.00 80.46 85.17 84.41 1995 58.10 79.23 82.92 85.24 86.67 1996 59.26 79.15 82.21 84.05 80.58 1997 57.67 77.20 83.79 83.41 77.49 1998 56.81 72.97 80.32 80.63 79.03 1999 57.50 71.60 79.41 80.85 81.20 2000 50.77 67.20 77.55 80.52 80.87 2001 50.05 67.64 81.34 79.80 81.45 2002 51.67 65.30 75.40 78.88 80.86 2003 33.23 62.87 79.22 79.80 80.26 2004 34.07 63.69 74.97 80.46 79.00 2005 36.58 63.87 78.29 80.06 80.44 2006 39.90 61.96 80.87 78.36 77.81
Source: own, based on Permanent and Ongoing Survey of Households – Expanded User Base

36
Table A1.9. Argentina - Coverage Rates of the Employed, by Field of Activity
Field of Activity Year Primary Secondary Tertiary
1992 36.61 53.29 48.61 1993 37.70 51.12 47.05 1994 40.98 51.05 51.01 1995 32.84 49.38 48.68 1996 49.05 46.40 48.66 1997 51.84 45.97 47.80 1998 33.95 43.33 47.40 1999 39.14 43.06 46.94 2000 32.28 41.63 46.52 2001 40.89 39.24 46.23 2002 34.85 33.68 42.89 2003 27.08 32.26 40.08 2004 35.28 34.45 41.00 2005 37.58 36.76 43.08 2006 38.86 38.02 45.11
Source: own, based on Permanent and Ongoing Survey of Households – Expanded User Base
Table A1.10. Argentina - Coverage Rates of the Employed, by Sizes of Establishments
Sizes of Establishments Year
Small Medium Large 1992 13.73 74.53 93.48 1993 12.57 74.59 91.64 1994 15.90 75.19 93.51 1995 12.75 71.26 90.14 1996 12.99 70.61 89.09 1997 12.32 67.80 88.12 1998 11.81 67.08 87.58 1999 11.78 66.06 87.39 2000 12.35 66.77 88.18 2001 10.90 68.75 89.06 2002 10.52 57.07 85.22 2003 9.78 51.27 81.29 2004 9.67 53.09 84.07 2005 10.35 56.22 85.16 2006 10.84 58.00 86.10
Source: own, based on Permanent and Ongoing Survey of Households – Expanded User Base

37
Table A1.11. Argentina - Coverage Rates of the
Employed, by Sector
Sector Year Public Private
1992 94.14 67.66 1993 95.95 66.02 1994 96.20 69.69 1995 94.71 62.13 1996 94.42 59.53 1997 88.09 59.36 1998 88.62 57.13 1999 87.82 56.73 2000 86.21 56.24 2001 85.46 55.61 2002 66.18 53.29 2003 64.21 47.72 2004 68.35 48.67 2005 74.25 50.85 2006 75.95 52.36
Source: own, based on Permanent and Ongoing Survey of Households – Expanded User Base
Table A1.12. Argentina - Coverage Rates of the Active Population and Employed, by Education
Contributors / Economically Active Population Contributors / Employed Persons Year Primary Secondary Superior Primary Secondary Superior
1992 37.28 49.29 59.68 39.94 52.50 62.41 1993 34.78 46.98 54.70 38.26 51.17 57.97 1994 36.97 46.44 57.65 41.81 52.72 62.05 1995 33.74 42.17 51.77 40.65 50.29 57.53 1996 30.39 42.57 51.78 37.01 50.68 58.98 1997 30.53 41.97 54.24 35.65 48.46 59.97 1998 29.34 41.80 55.16 33.95 47.32 59.41 1999 28.33 40.68 52.80 33.10 47.18 58.64 2000 26.61 38.94 53.99 31.80 45.70 59.60 2001 23.39 36.61 52.63 29.45 45.22 59.52 2002 20.28 33.72 49.40 24.69 41.39 56.93 2003 20.04 31.20 48.44 23.62 36.56 54.82 2004 21.22 33.99 50.00 24.14 38.90 55.11 2005 22.94 36.95 52.11 25.44 41.51 56.18 2006 25.48 37.43 53.76 28.18 42.19 58.57
Source: own, based on Permanent and Ongoing Survey of Households – Expanded User Base

38
Table A1.13. Argentina - Coverage Rates of the Elderly, by
Education
Beneficiaries / Population Age 65+ Year Primary Secondary Superior
1992 76.94 82.12 81.86 1993 76.69 80.76 73.26 1994 76.34 79.19 87.30 1995 76.28 80.36 86.05 1996 74.86 79.58 82.68 1997 74.51 77.58 75.09 1998 72.05 77.90 73.75 1999 72.44 74.25 79.67 2000 69.44 74.35 74.73 2001 70.01 74.76 77.86 2002 67.54 73.83 72.73 2003 66.13 70.38 78.81 2004 65.89 69.01 77.86 2005 67.69 69.33 75.97 2006 66.70 70.83 77.60
Source: own, based on Permanent and Ongoing Survey of Households – Expanded User Base
Table A1.14. Argentina - Rate of Total Household Income from Pensions to Total Household Income, by Type of Family
Year Only Elderly Youth and Elderly At Least one Old
1992 92.75 48.47 70.29 1993 92.17 49.72 69.67 1994 93.98 48.91 71.78 1995 93.19 49.82 72.36 1996 93.31 51.56 72.62 1997 91.71 52.67 72.90 1998 91.18 51.48 71.81 1999 91.50 50.68 71.05 2000 91.21 52.55 72.30 2001 93.21 54.27 74.89 2002 94.88 55.25 76.00 2003 86.64 54.05 71.98 2004 86.34 52.20 71.21 2005 84.77 50.34 69.20 2006 86.98 50.25 69.90
Source: own, based on Permanent and Ongoing Survey of Households – Expanded User Base

39
Table A1.15. Argentina - Other Definitions of Pensions
Year Definition (1) Definition (2)
1992 88.77 93.80 1993 89.13 94.34 1994 88.88 93.45 1995 89.17 93.29 1996 88.39 93.79 1997 85.98 93.00 1998 85.22 92.33 1999 85.25 92.34 2000 82.15 90.32 2001 83.57 90.71 2002 81.67 89.60 2003 81.01 88.99 2004 80.37 89.44 2005 80.90 90.84 2006 81.06 90.21
Note: Definition (1) refers to the “Joint Coverage” which represents the percentage of the elderly who reside in a household in which at least one social security benefit is received. On the other hand, Definition (2) refers to the percentage of the elderly who reside in a household in which at least one social security benefit is received or one person over 65 years of age is occupied. Source: own, based on Permanent and Ongoing Survey of Households – Expanded User Base.
2. Bolivia
Table A2.1. Bolivia. Coverage Rates of the Economically Active Population and Elderly
Year
Contributors / Economically
Active Population
Contributors / Employed Persons
Contributors / Wage-Earners
Contributors / Employers - Independent
Beneficiaries / Population Age
65+
1996 . . . . 17.63 1997 . . . . 19.92 1999 13.76 14.15 40.62 1.02 17.73 2000 13.35 13.56 37.99 1.53 16.97 2001 13.04 13.26 33.75 1.93 19.87 2002 10.71 10.85 29.01 1.62 14.71
Source: own, based on Household Survey, Mecovi Program
Table A2.2. Bolivia. Coverage Rates of the Employed Person, by Age
Year 20-29 30-39 40-49 50-59 60-69
1999 12.64 17.79 17.39 12.26 4.87 2000 11.93 16.28 17.45 11.56 4.77 2001 11.33 15.31 18.35 12.86 4.09

40
2002 8.36 13.38 14.30 10.94 4.72 Source: own, based on Household Survey, Mecovi Program

41
Table A2.3. Bolivia. Coverage Rates of the Elderly , by Age
Year 60-64 65-69 70-74 75-79 1996 14.70 20.70 14.76 21.25 1997 15.01 17.68 24.12 33.65 1999 16.15 16.96 16.46 24.64 2000 15.18 13.14 24.91 19.27 2001 15.97 19.79 20.17 28.23 2002 11.19 12.42 18.19 22.46
Source: own, based on Household Survey, Mecovi Program
Table A2.4. Bolivia. Coverage Rates of the Economically Active Population, Employed Persons, and Elderly, by Gender
Contributors / Economically Active Population Contributors / Employed Persons Beneficiaries / Population Age 65+
Year
Men Women Men Women Men Women 1996 . . . . 23.37 12.30 1997 . . . . 24.72 15.52 1999 15.50 11.63 15.86 12.05 22.58 13.27 2000 15.35 10.81 15.40 11.18 23.85 11.57 2001 15.17 10.49 15.33 10.78 22.97 17.20 2002 12.30 8.69 12.44 8.80 16.93 12.87
Source: own, based on Household Survey, Mecovi Program
Table A2.5. Bolivia. Coverage Rates of the Economically Active Population, Employed Persons, and Elderly, by Region
Contributors / Economically Active Population
Contributors / Employed Persons
Beneficiaries / Population Age 65+
Year
Rural Urban Rural Urban Rural Urban 1997 . . . . 5.82 32.95 1999 4.02 20.04 4.04 20.98 3.44 34.25 2000 3.84 19.20 3.85 19.79 4.04 27.90 2001 3.02 19.45 3.03 20.18 5.34 33.74 2002 2.74 15.72 2.74 16.14 5.07 24.40
Source: own, based on Household Survey, Mecovi Program

42
Table A2.6. Bolivia. Coverage Rates of the Economically Active Population, by Quintile
Year Quintile 1 Quintile 2 Quintile 3 Quintile 4 Quintile 5 1999 0.38 4.94 11.67 20.85 31.35 2000 0.96 3.49 9.98 19.02 33.84 2001 0.74 3.60 9.98 17.32 33.88 2002 0.67 2.58 7.44 13.14 30.13
Source: own, based on Household Survey, Mecovi Program
Table A2.7. Bolivia. Coverage Rates of the Employed Persons, by Quintile Year Quintile 1 Quintile 2 Quintile 3 Quintile 4 Quintile 5 1999 0.39 4.72 12.40 21.18 32.49 2000 0.99 3.32 10.07 19.90 34.09 2001 0.40 3.52 10.01 17.61 35.16 2002 0.54 2.57 7.50 13.21 30.86
Source: own, based on Household Survey, Mecovi Program
Table A2.8. Bolivia. Coverage Rates of the Elderly, by Quintile Year Quintile 1 Quintile 2 Quintile 3 Quintile 4 Quintile 5 1996 0.16 3.44 15.65 24.60 44.36 1997 . 3.54 17.12 34.83 44.12 1999 . 0.40 12.32 25.32 50.56 2000 . 3.38 8.56 28.93 44.01 2001 . 1.47 15.25 29.88 52.78 2002 . 0.20 5.70 21.32 46.19
Source: own, based on Household Survey, Mecovi Program
Table A2.9. Bolivia - Coverage Rates of the Employed, by Field of Activity
Field of Activity Year Primary Secondary Tertiary
1999 1.38 11.89 25.78 2000 2.96 11.93 22.98 2001 3.19 11.21 23.68 2002 1.91 8.39 19.85
Source: own, based on Household Survey, Mecovi Program
43
Table A2.10. Bolivia - Coverage Rates of the Employed, by Sizes of Establishments
Sizes of Establishments Year Small Medium Large
1999 1.67 18.79 80.05 2000 1.51 29.23 63.87 2001 2.37 22.97 68.07 2002 2.06 22.70 56.88
Source: own, based on Household Survey, Mecovi Program
Table A2.11. Bolivia - Coverage Rates of the Employed, by Sector
Sector Year
Public Private 1999 100.00 22.21 2000 72.78 27.98 2001 73.50 22.51 2002 69.29 16.99
Source: own, based on Household Survey, Mecovi Program
Table A2.12. Bolivia. Coverage Rates of the Active Population and Employed, by Education
Contributors / Economically Active Population Contributors / Employed Persons Year Primary Secondary Superior Primary Secondary Superior
1996 . . . . . . 1997 . . . . . . 1999 2.81 15.75 47.19 2.82 16.77 49.35 2000 3.35 13.90 47.52 3.32 14.35 49.10 2001 3.05 11.75 46.87 3.10 12.13 48.59 2002 2.18 10.56 43.59 2.21 10.91 44.87
Source: own, based on Household Survey, Mecovi Program

44
Table A2.13. Bolivia. Coverage Rates of the Active Population
and Employed, by Education
Beneficiaries / Population Age 65+ Year Primary Secondary Superior
1996 13.34 42.81 55.26 1997 14.29 41.95 67.73 1999 11.22 31.70 84.99 2000 12.05 34.18 55.89 2001 13.03 39.53 68.87 2002 8.86 32.15 69.98
Source: own, based on Household Survey, Mecovi Program
Table A2.14. Bolivia. Rate of Total Household Income from Pensions to Total Household Income, by Type of Family
Year Only Elderly Youth and Elderly
At Least one Elderly
1996 82.08 45.47 58.81 1997 84.07 46.80 58.12 1999 82.42 51.84 59.71 2000 84.89 46.27 56.80 2001 80.14 55.65 62.67 2002 81.25 54.44 62.61
Source: own, based on Household Survey, Mecovi Program
Table A2.15. Bolivia. Other Definitions of Pensions
Year Definition (1) Definition (2)
1996 22.48 78.84 1997 24.86 80.17 1999 21.59 78.69 2000 21.42 73.59 2001 24.31 79.42 2002 18.14 72.32
Note: Definition (1) refers to the “Joint Coverage” which represents the percentage of the elderly who reside in a household in which at least one social security benefit is received. On the other hand, Definition (2) refers to the percentage of the elderly who reside in a household in which at least one social security benefit is received or one person over 65 years of age is occupied. Source: own, based on Household Survey, Mecovi Program

45
3. Brazil
Table A3.1. Brazil. Coverage Rates of the Economically Active Population and Elderly,
Alternative Indicators
Year
Contributors / Economically
Active Population
Contributors / Employed Persons
Contributors / Wage-Earners
Contributors / Employers - Independent
Beneficiaries / Population Age
65+
1992 46.28 48.89 68.49 19.97 80.78 1993 45.89 48.27 67.27 19.85 83.50 1995 47.63 47.63 67.27 18.18 84.07 1996 47.85 47.85 65.82 19.51 84.51 1997 47.74 47.74 66.60 18.06 84.21 1998 48.22 48.22 68.07 16.16 85.08 1999 47.27 47.27 67.40 16.00 85.77 2001 45.10 48.95 67.96 14.92 85.92 2002 44.67 48.35 67.74 13.81 86.66
Source: own, based on National Household Survey by Sampling
Table A3.2. Brazil. Coverage Rates of the Employed Person, by Age
Year 20-29 30-39 40-49 50-59 60-69
1992 49.31 55.06 52.93 42.53 26.30 1993 48.41 54.28 52.40 42.09 25.96 1995 47.93 52.82 52.36 41.82 24.51 1996 47.54 53.20 52.48 41.80 26.47 1997 48.30 52.94 52.02 40.82 25.36 1998 49.57 53.28 52.37 41.42 24.23 1999 48.46 52.43 51.59 40.82 23.67 2001 50.49 53.67 52.90 42.81 25.29 2002 49.87 53.36 52.39 42.36 23.76
Source: own, based on National Household Survey by Sampling

46
Table A3.3. Brazil. Coverage Rates of the Elderly , by Age
Year 60-64 65-69 70-74 75-79 1992 69.24 85.52 89.36 91.37 1993 75.39 85.96 89.57 91.62 1995 76.93 86.15 90.76 91.59 1996 76.44 86.38 91.23 93.09 1997 75.84 87.07 90.37 92.76 1998 77.40 86.52 91.78 93.36 1999 77.72 88.42 91.62 93.42 2001 77.74 88.84 90.72 94.15 2002 77.94 88.99 92.93 94.39
Source: own, based on National Household Survey by Sampling
Table A3.4. Brazil. Coverage Rates of the Economically Active Population, Employed Persons, and Elderly, by Gender
Contributors / Economically Active Population Contributors / Employed Persons Beneficiaries / Population Age 65+
Year
Men Women Men Women Men Women 1992 50.14 40.47 52.50 43.32 88.44 74.61 1993 49.75 40.13 51.93 42.71 89.73 78.42 1995 50.78 43.03 50.78 43.03 90.24 79.19 1996 50.18 44.35 50.18 44.35 89.61 80.51 1997 49.69 44.81 49.69 44.81 89.26 80.20 1998 49.55 46.23 49.55 46.23 89.41 81.71 1999 48.76 45.12 48.76 45.12 89.93 82.48 2001 46.83 42.73 49.91 47.57 89.89 82.90 2002 46.35 42.43 49.28 47.05 89.98 84.17
Source: own, based on National Household Survey by Sampling

47
Table A3.5. Brazil. Coverage Rates of the Economically Active Population, Employed Persons, and Elderly, by
Region
Contributors / Economically Active Population
Contributors / Employed Persons
Beneficiaries / Population Age 65+ Year
Rural Urban Rural Urban Rural Urban 1992 15.91 55.12 16.11 58.97 80.56 80.85 1993 16.80 54.19 17.00 57.65 87.55 82.34 1995 16.74 56.57 16.74 56.57 88.42 82.86 1996 19.15 55.74 19.15 55.74 88.77 83.33 1997 17.96 56.07 17.96 56.07 89.79 82.73 1998 19.35 56.24 19.35 56.24 89.83 83.82 1999 19.77 55.07 19.77 55.07 89.82 84.73 2001 17.64 50.49 18.02 55.48 92.04 84.62 2002 17.31 49.94 17.67 54.69 92.13 85.56
Source: own, based on National Household Survey by Sampling
Table A3.6. Brazil. Coverage Rates of the Economically Active Population, by Quintile Year Quintile 1 Quintile 2 Quintile 3 Quintile 4 Quintile 5 1992 14.52 34.85 48.77 59.71 73.76 1993 15.69 36.08 47.15 59.13 71.48 1995 18.98 36.16 48.43 60.17 72.28 1996 19.23 37.36 49.83 60.05 70.27 1997 18.16 36.64 49.29 60.70 71.12 1998 18.97 37.53 49.23 61.09 71.06 1999 18.11 36.31 47.65 60.01 70.83 2001 17.02 35.60 46.93 57.57 68.06 2002 17.00 35.73 46.07 57.19 67.15
Source: own, based on National Household Survey by Sampling
Table A3.7. Brazil. Coverage Rates of the Employed Persons, by Quintile Year Quintile 1 Quintile 2 Quintile 3 Quintile 4 Quintile 5 1992 16.69 38.06 51.51 62.57 75.91 1993 18.06 38.77 49.94 61.49 73.25 1995 19.46 36.66 49.21 60.41 72.56 1996 19.91 37.99 50.59 60.34 70.55 1997 18.80 37.22 50.39 61.16 71.29 1998 19.67 38.24 50.19 61.47 71.41 1999 18.95 37.29 48.40 60.49 71.16 2001 21.40 40.39 51.07 61.11 70.53 2002 21.00 40.47 49.91 60.46 69.75
Source: own, based on National Household Survey by Sampling

48
Table A3.8. Brazil. Coverage Rates of the Elderly, by Quintile
Year Quintile 1 Quintile 2 Quintile 3 Quintile 4 Quintile 5 1992 69.43 78.43 89.40 84.89 81.81 1993 75.26 81.91 93.17 84.84 82.39 1995 76.88 88.45 89.55 83.69 81.80 1996 76.11 89.54 89.13 84.08 83.70 1997 76.42 89.00 88.82 84.13 82.72 1998 79.19 89.74 88.66 84.66 83.37 1999 79.71 89.98 88.55 86.01 84.75 2001 77.32 90.26 89.51 86.63 85.94 2002 78.70 90.60 90.77 86.74 86.53
Source: own, based on National Household Survey by Sampling
Table A3.9. Brazil - Coverage Rates of the Employed, by Field of Activity
Field of Activity Year Primary Secondary Tertiary
1992 11.00 67.32 60.35 1993 11.56 65.09 58.97 1995 11.48 63.54 57.43 1996 12.60 61.74 56.97 1997 11.95 60.75 57.22 1998 11.73 58.87 58.01 1999 12.54 57.82 57.09 2001 12.60 58.70 57.33 2002 11.81 53.60 58.41
Source: own, based on National Household Survey by Sampling
Table A3.10. Brazil - Coverage Rates of the Employed, by Sizes of Establishments
Sizes of Establishments Year
Small Medium Large 1992 39.63 67.09 89.85 1993 37.48 65.48 89.34 1995 38.57 68.01 88.73 1996 39.61 64.77 86.56 1997 39.11 67.49 86.96 1998 40.63 68.04 88.09 1999 40.04 66.70 86.69 2001 39.90 66.68 86.85 2002 38.68 65.38 85.87
Source: own, based on National Household Survey by Sampling

49
Table A3.11. Brazil - Coverage Rates of the
Employed, by Sector
Sector Year Public Private
1992 86.89 78.02 1993 83.63 77.05 1995 85.96 76.00 1996 82.38 73.56 1997 85.25 74.28 1998 85.24 75.55 1999 87.23 74.16 2001 88.84 74.05 2002 89.73 73.18
Source: own, based on National Household Survey by Sampling
Table A3.12. Brazil. Coverage Rates of the Active Population and Employed, by Education
Contributors / Economically Active Population Contributors / Employed Persons Year Primary Secondary Superior Primary Secondary Superior
1992 37.16 66.52 81.54 39.11 72.03 84.69 1993 36.51 65.68 80.63 38.26 70.67 83.75 1995 37.30 68.94 82.23 37.30 68.94 82.23 1996 37.71 66.60 79.91 37.71 66.60 79.91 1997 36.83 67.47 80.00 36.83 67.47 80.00 1998 36.67 67.58 80.08 36.67 67.58 80.08 1999 35.27 66.27 80.62 35.27 66.27 80.62 2001 33.37 59.22 74.82 36.05 65.87 79.24 2002 32.53 57.70 73.86 34.92 64.38 78.25
Source: own, based on National Household Survey by Sampling
Table A3.13. Brazil. Coverage Rates of the Elderly, by Education
Beneficiaries / Population Age 65+ Year Primary Secondary Superior
1992 80.67 82.24 82.61 1993 83.47 81.80 87.51 1995 84.12 79.72 89.31 1996 84.56 80.92 88.48 1997 84.30 80.45 87.28 1998 85.15 82.59 87.38 1999 85.83 83.92 87.16 2001 85.94 84.48 87.78 2002 86.78 83.15 89.80
Source: own, based on National Household Survey by Sampling

50
Table A3.14. Brazil. Rate of Total Household Income from Pensions to Total Household Income, by Type of Family
Year Only Elderly Youth and Elderly
At Least one Elderly
1992 90.33 59.98 68.54 1993 90.34 63.58 71.33 1995 87.32 53.40 62.89 1996 88.08 53.91 63.59 1997 88.63 54.07 63.58 1998 87.23 54.87 63.80 1999 87.93 56.53 65.49 2001 90.20 62.41 71.25 2002 90.92 62.13 71.15
Source: own, based on National Household Survey by Sampling
Table A3.15. Brazil. Other Definitions of Pensions
Year Definition (1) Definition (2)
1992 90.19 95.95 1993 91.47 96.23 1995 91.78 95.96 1996 91.74 95.84 1997 91.46 95.74 1998 92.19 96.19 1999 92.77 96.85 2001 92.88 96.52 2002 93.15 96.78
Note: Definition (1) refers to the “Joint Coverage” which represents the percentage of the elderly who reside in a household in which at least one social security benefit is received. On the other hand, Definition (2) refers to the percentage of the elderly who reside in a household in which at least one social security benefit is received or one person over 65 years of age is occupied. Source: own, based on National Household Survey by Sampling

51
4. Chile
Table A4.1. Chile. Coverage Rates of the Economically Active Population and Elderly
Year
Contributors / Economically
Active Population
Contributors / Employed Persons
Contributors / Wage-Earners
Contributors / Employers - Independent
Beneficiaries / Population Age
65+
1990 62.21 67.46 80.71 30.24 73.04 1992 61.14 64.35 79.10 20.68 66.50 1994 62.26 66.20 80.42 23.40 68.21 1996 62.43 65.84 79.62 21.71 65.94 1998 58.90 64.77 78.58 20.47 62.17 2000 58.06 64.34 78.09 18.61 68.89 2003 58.74 64.71 78.65 19.02 62.99
Source: own, based on National Socioeconomic Survey
Table A4.2. Chile. Coverage Rates of the Employed Person, by Age
Year 20-29 30-39 40-49 50-59 60-69
1990 67.36 70.89 68.15 63.88 57.87 1992 66.74 67.14 65.05 59.63 50.08 1994 69.26 69.10 66.51 62.62 50.91 1996 69.63 69.43 65.69 60.66 48.15 1998 67.70 68.16 65.18 62.35 46.59 2000 66.02 68.82 64.91 62.19 46.56 2003 65.63 69.31 64.96 63.14 50.62
Source: own, based on National Socioeconomic Survey
Table A4.3. Chile. Coverage Rates of the Elderly , by Age
Year 60-64 65-69 70-74 75-79 1990 60.10 77.49 80.89 83.91 1992 55.08 70.05 74.48 75.96 1994 59.16 70.35 75.09 75.85 1996 56.34 66.59 72.89 77.18 1998 53.96 61.75 68.92 72.64 2000 59.16 69.00 74.49 81.49 2003 54.09 63.04 67.60 72.62
Source: own, based on National Socioeconomic Survey
52
Table A4.4. Chile. Coverage Rates of the Economically Active Population, Employed Persons, and Elderly, by Gender
Contributors / Economically Active Population Contributors / Employed Persons Beneficiaries / Population Age 65+
Year
Men Women Men Women Men Women 1990 63.31 59.96 68.22 65.86 80.11 67.49 1992 62.39 58.61 65.10 62.81 74.42 60.53 1994 63.46 59.91 66.88 64.85 78.43 60.38 1996 63.46 60.48 66.41 64.72 74.70 59.51 1998 60.08 56.84 65.54 63.39 69.08 57.01 2000 59.38 55.81 65.23 62.78 75.54 63.82 2003 61.13 54.89 66.31 62.02 71.76 56.42
Source: own, based on National Socioeconomic Survey
Table A4.5. Chile. Coverage Rates of the Economically Active Population, Employed Persons, and Elderly, by Region
Contributors / Economically Active Population
Contributors / Employed Persons
Beneficiaries / Population Age 65+ Year
Rural Urban Rural Urban Rural Urban 1990 46.59 65.05 49.67 70.75 67.81 74.27 1992 45.02 63.78 46.31 67.38 58.47 68.26 1994 46.20 64.73 48.63 68.95 57.81 70.49 1996 41.67 65.48 43.26 69.22 55.87 68.17 1998 39.42 61.60 42.65 67.89 43.42 66.10 2000 42.48 60.11 45.66 66.88 61.26 70.43 2003 44.78 60.52 47.74 66.95 45.39 66.52
Source: own, based on National Socioeconomic Survey
Table A4.6. Chile. Coverage Rates of the Economically Active Population, by Quintile Year Quintile 1 Quintile 2 Quintile 3 Quintile 4 Quintile 5 1990 45.07 59.67 63.30 68.56 72.94 1992 49.45 59.86 62.23 64.21 68.33 1994 45.98 58.95 63.94 69.39 71.74 1996 47.41 60.67 65.20 68.03 69.77 1998 39.50 57.45 61.82 64.94 70.05 2000 36.98 54.00 61.19 65.60 71.15 2003 40.20 55.46 61.45 65.27 70.19
Source: own, based on National Socioeconomic Survey

53
Table A4.7. Chile. Coverage Rates of the Employed Persons, by Quintile
Year Quintile 1 Quintile 2 Quintile 3 Quintile 4 Quintile 5 1990 56.24 66.32 67.03 71.51 74.85 1992 56.44 63.91 64.70 65.88 69.35 1994 54.29 63.60 67.37 71.08 73.58 1996 55.14 64.98 67.80 69.50 70.87 1998 53.35 63.57 66.26 67.95 72.21 2000 49.94 61.67 66.04 69.92 72.97 2003 53.08 62.60 65.83 68.66 72.41
Source: own, based on National Socioeconomic Survey
Table A4.8. Chile. Coverage Rates of the Elderly, by Quintile Year Quintile 1 Quintile 2 Quintile 3 Quintile 4 Quintile 5 1990 61.44 74.25 81.42 80.01 68.30 1992 52.10 66.26 74.12 72.21 67.78 1994 55.70 67.87 75.28 73.09 69.61 1996 47.87 67.50 76.48 72.04 65.81 1998 41.97 60.00 71.04 68.33 69.58 2000 53.07 66.81 79.33 76.66 68.76 2003 43.20 59.74 73.13 70.10 68.97
Source: own, based on National Socioeconomic Survey
Table A4.9. Chile - Coverage Rates of the Employed, by Field of Activity
Field of Activity Year Primary Secondary Tertiary
1990 55.04 73.31 68.92 1992 52.46 71.16 64.75 1994 53.85 70.79 67.32 1996 50.27 72.77 67.19 1998 49.86 69.92 66.34 2000 52.07 68.53 65.56 2003 55.19 66.12 66.34
Source: own, based on National Socioeconomic Survey
54
Table A4.10. Chile - Coverage Rates of the Employed, by Sizes of
Establishments
Sizes of Establishments Year Small Medium Large
1990 42.60 80.91 93.41 1992 36.20 77.55 91.37 1994 37.47 82.25 91.95 1996 37.92 80.30 91.10 1998 34.66 77.89 90.42 2000 34.06 77.54 90.43 2003 32.71 77.97 90.76
Source: own, based on National Socioeconomic Survey
Table A4.11. Chile - Coverage Rates of the Employed, by Sector
Sector Year
Public Private 1990 82.96 . 1992 81.34 . 1994 82.82 . 1996 93.51 80.21 1998 81.21 . 2000 92.22 78.35 2003 91.42 79.53
Source: own, based on National Socioeconomic Survey
Table A4.12. Chile. Coverage Rates of the Active Population and Employed, by Education
Contributors / Economically Active Population Contributors / Employed Persons Year Primary Secondary Superior Primary Secondary Superior
1990 50.36 65.68 79.14 54.68 71.94 83.72 1992 49.14 65.31 77.97 51.35 69.28 81.75 1994 48.70 65.19 78.79 51.68 69.87 82.35 1996 46.66 65.88 78.52 49.14 69.99 81.65 1998 42.05 61.28 75.90 46.90 67.56 81.52 2000 41.90 59.04 75.12 46.92 66.22 80.23 2003 44.15 59.26 72.93 48.29 66.15 78.87
Source: own, based on National Socioeconomic Survey
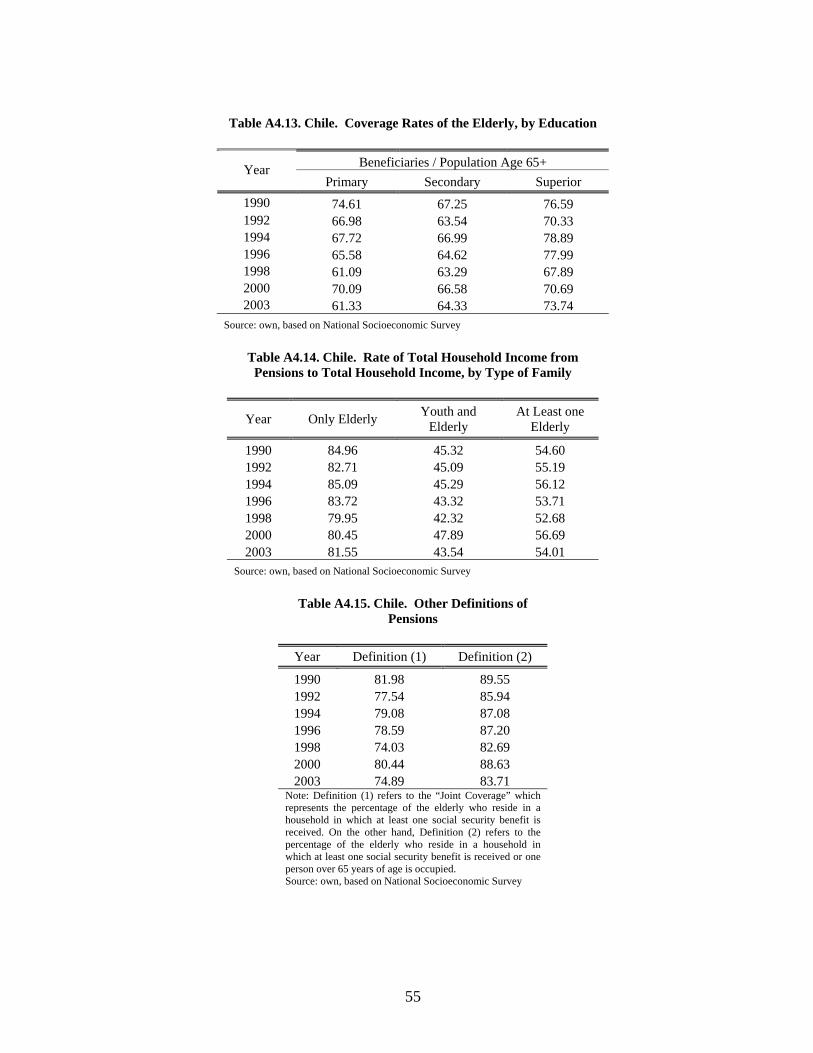
55
Table A4.13. Chile. Coverage Rates of the Elderly, by Education
Beneficiaries / Population Age 65+ Year
Primary Secondary Superior 1990 74.61 67.25 76.59 1992 66.98 63.54 70.33 1994 67.72 66.99 78.89 1996 65.58 64.62 77.99 1998 61.09 63.29 67.89 2000 70.09 66.58 70.69 2003 61.33 64.33 73.74
Source: own, based on National Socioeconomic Survey
Table A4.14. Chile. Rate of Total Household Income from Pensions to Total Household Income, by Type of Family
Year Only Elderly Youth and Elderly
At Least one Elderly
1990 84.96 45.32 54.60 1992 82.71 45.09 55.19 1994 85.09 45.29 56.12 1996 83.72 43.32 53.71 1998 79.95 42.32 52.68 2000 80.45 47.89 56.69 2003 81.55 43.54 54.01
Source: own, based on National Socioeconomic Survey
Table A4.15. Chile. Other Definitions of Pensions
Year Definition (1) Definition (2)
1990 81.98 89.55 1992 77.54 85.94 1994 79.08 87.08 1996 78.59 87.20 1998 74.03 82.69 2000 80.44 88.63 2003 74.89 83.71
Note: Definition (1) refers to the “Joint Coverage” which represents the percentage of the elderly who reside in a household in which at least one social security benefit is received. On the other hand, Definition (2) refers to the percentage of the elderly who reside in a household in which at least one social security benefit is received or one person over 65 years of age is occupied. Source: own, based on National Socioeconomic Survey

56
5. Colombia
Table A5.1. Colombia. Coverage Rates of the Economically Active Population and Elderly
Year
Contributors / Economically
Active Population
Contributors / Employed Persons
Contributors / Wage-Earners
Contributors / Employers - Independent
Beneficiaries / Population Age
65+
1992 . . . . 20.03 1995 . . . . 13.66 1996 25.25 27.55 42.76 6.13 13.34 1997 27.20 29.78 46.12 6.96 13.53 1998 26.33 29.51 48.34 5.98 13.91 1999 22.99 26.91 44.98 5.71 15.26 2000 . . . . 18.61
Source: own, based on Continual Survey of Households
Table A5.2. Colombia. Coverage Rates of the Employed Person, by Age
Year 20-29 30-39 40-49 50-59 60-69
1996 28.35 31.58 29.92 21.98 12.39 1997 31.23 33.75 31.98 24.48 12.79 1998 29.00 34.40 32.77 26.39 11.66 1999 26.00 29.82 30.48 24.99 14.95
Source: own, based on Continual Survey of Households
Table A5.3. Colombia. Coverage Rates of the Elderly , by Age
Year 60-64 65-69 70-74 75-79 1992 18.99 21.22 20.34 20.06 1995 14.42 14.08 14.20 10.75 1996 13.50 13.64 12.76 13.10 1997 14.17 13.37 13.51 12.45 1998 14.90 12.80 15.13 12.48 1999 15.42 16.94 15.47 12.15 2000 19.25 20.02 18.83 15.27
Source: own, based on Continual Survey of Households

57
Table A. Colombia5.4. Coverage Rates of the Economically Active Population, Employed Persons, and Elderly, by
Gender
Contributors / Economically Active Population Contributors / Employed Persons Beneficiaries / Population Age 65+
Year
Men Women Men Women Men Women 1992 . . . . 29.16 13.06 1995 . . . . 19.37 8.66 1996 22.88 29.18 24.42 33.05 17.87 9.38 1997 25.05 30.72 26.76 35.08 17.88 9.66 1998 24.93 28.49 27.18 33.39 19.14 9.35 1999 21.56 25.12 24.31 31.19 20.34 10.98 2000 . . . . 24.51 13.55
Source: own, based on Continual Survey of Households
Table A. Colombia5.5. Coverage Rates of the Economically Active Population, Employed Persons, and Elderly, by Region
Contributors / Economically Active Population
Contributors / Employed Persons
Beneficiaries / Population Age 65+ Year
Rural Urban Rural Urban Rural Urban 1992 . . . . 20.18 20.00 1995 . . . . 4.86 20.82 1996 10.57 33.28 11.12 37.06 5.26 18.97 1997 11.63 35.59 12.27 39.78 4.97 19.78 1998 12.07 33.76 12.81 38.99 4.83 20.31 1999 10.49 29.52 11.53 35.78 4.81 22.41 2000 . . . . 6.23 27.24
Source: own, based on Continual Survey of Households
Table A5.6. Colombia. Coverage Rates of the Economically Active Population, by Quintile Year Quintile 1 Quintile 2 Quintile 3 Quintile 4 Quintile 5 1996 9.27 13.25 21.38 32.26 50.75 1997 12.07 13.56 23.54 35.24 52.36 1998 11.02 13.16 21.84 33.68 52.61 1999 9.72 9.66 17.17 28.68 49.74
Source: own, based on Continual Survey of Households

58
Table A5.7. Colombia. Coverage Rates of the Employed Persons, by Quintile Year Quintile 1 Quintile 2 Quintile 3 Quintile 4 Quintile 5 1996 10.42 15.40 24.23 35.19 53.43 1997 13.66 15.63 26.67 38.61 55.37 1998 12.84 15.88 25.56 38.03 56.27 1999 11.88 12.91 21.89 33.82 54.39
Source: own, based on Continual Survey of Households
Table A5.8. Colombia. Coverage Rates of the Elderly, by Quintile Year Quintile 1 Quintile 2 Quintile 3 Quintile 4 Quintile 5 1992 7.13 15.30 22.02 28.18 27.70 1995 3.24 7.30 10.56 18.99 28.63 1996 4.98 4.76 11.61 17.36 28.30 1997 5.20 3.85 11.20 20.29 27.36 1998 0.06 3.52 11.37 21.10 33.67 1999 0.07 3.37 10.76 23.29 38.63 2000 5.89 3.94 12.44 25.96 44.88
Source: own, based on Continual Survey of Households
Table A5.9. Colombia - Coverage Rates of the Employed, by Field of Activity
Field of Activity Year Primary Secondary Tertiary
1996 6.77 31.86 34.15 1997 8.04 34.87 36.20 1998 8.25 34.09 37.13 1999 6.53 30.77 33.48
Source: own, based on Continual Survey of Households
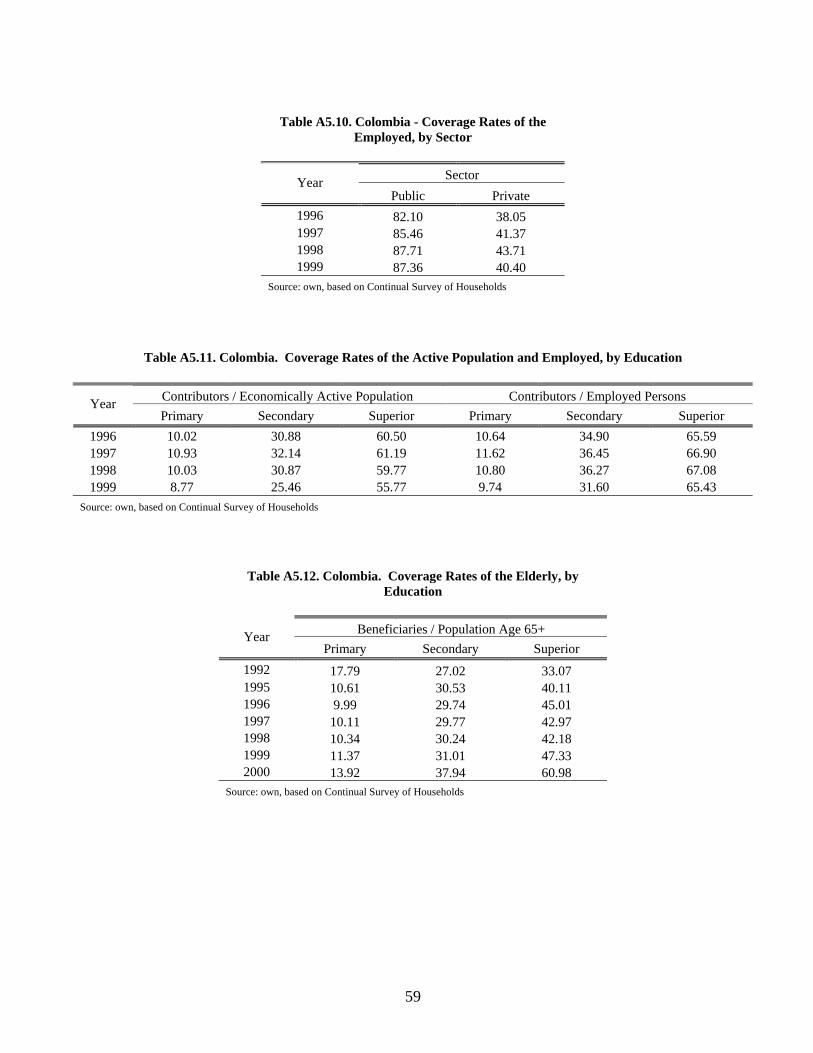
59
Table A5.10. Colombia - Coverage Rates of the
Employed, by Sector
Sector Year Public Private
1996 82.10 38.05 1997 85.46 41.37 1998 87.71 43.71 1999 87.36 40.40
Source: own, based on Continual Survey of Households
Table A5.11. Colombia. Coverage Rates of the Active Population and Employed, by Education
Contributors / Economically Active Population Contributors / Employed Persons Year Primary Secondary Superior Primary Secondary Superior
1996 10.02 30.88 60.50 10.64 34.90 65.59 1997 10.93 32.14 61.19 11.62 36.45 66.90 1998 10.03 30.87 59.77 10.80 36.27 67.08 1999 8.77 25.46 55.77 9.74 31.60 65.43
Source: own, based on Continual Survey of Households
Table A5.12. Colombia. Coverage Rates of the Elderly, by Education
Beneficiaries / Population Age 65+ Year
Primary Secondary Superior 1992 17.79 27.02 33.07 1995 10.61 30.53 40.11 1996 9.99 29.74 45.01 1997 10.11 29.77 42.97 1998 10.34 30.24 42.18 1999 11.37 31.01 47.33 2000 13.92 37.94 60.98
Source: own, based on Continual Survey of Households

60
Table A5.13. Colombia. Rate of Total Household Income from Pensions to Total Household Income, by Type of Family
Year Only Elderly Youth and Elderly
At Least one Elderly
1998 80.09 57.09 60.44 1999 81.64 58.52 62.62 2000 85.89 62.46 66.45
Source: own, based on Continual Survey of Households
Table A5.14. Colombia. Other Definitions of Pensions
Year Definition (1) Definition (2)
1992 25.57 49.36 1995 17.99 53.02 1996 17.38 50.66 1997 17.55 51.81 1998 18.46 51.85 1999 19.40 49.26 2000 23.73 54.42
Note: Definition (1) refers to the “Joint Coverage” which represents the percentage of the elderly who reside in a household in which at least one social security benefit is received. On the other hand, Definition (2) refers to the percentage of the elderly who reside in a household in which at least one social security benefit is received or one person over 65 years of age is occupied. Source: own, based on Continual Survey of Households

61
6. Costa Rica
Table A6.1. Costa Rica. Coverage Rates of the Economically Active Population and Elderly
Year
Contributors / Economically
Active Population
Contributors / Employed Persons
Contributors / Wage-Earners
Contributors / Employers - Independent
Beneficiaries / Population Age
65+
1990 66.93 68.50 79.05 43.36 . 1992 67.96 69.65 79.68 42.97 28.11 1993 68.93 70.40 80.66 44.63 28.71 1994 67.05 68.49 78.44 43.46 31.44 1995 67.49 69.17 79.40 42.56 32.79 1996 66.30 68.52 77.93 44.00 32.97 1997 63.84 66.13 76.84 39.10 36.79 1998 64.84 66.96 77.19 38.43 37.48 2000 63.83 65.95 76.44 37.39 36.62 2001 62.02 64.25 77.61 30.71 35.98 2002 61.41 63.98 77.65 30.55 35.73 2003 60.93 63.46 76.04 29.09 . 2004 62.00 64.67 78.36 29.63 39.42
Source: own, based on Multi-Purpose Household Survey
Table A6.2. Costa Rica. Coverage Rates of the Employed Person, by Age
Year 20-29 30-39 40-49 50-59 60-69
1990 68.21 73.40 70.84 66.99 46.01 1992 70.27 73.66 71.31 67.47 45.89 1993 72.44 74.58 70.01 66.54 47.67 1994 69.78 72.66 68.49 66.38 47.84 1995 71.90 73.43 69.10 64.51 48.40 1996 70.43 71.89 69.60 66.32 46.55 1997 68.87 69.63 67.21 62.86 42.73 1998 70.68 69.70 67.66 63.08 48.39 2000 66.26 68.99 66.80 65.95 48.91 2001 67.26 66.66 65.97 61.26 41.98 2002 65.95 66.92 64.94 61.80 42.58 2003 63.37 66.61 65.83 62.56 45.53 2004 66.43 68.21 65.14 62.57 46.48
Source: own, based on Multi-Purpose Household Survey

62
Table A6.3. Costa Rica. Coverage Rates of the Elderly , by Age
Year 60-64 65-69 70-74 75-79 1991 29.59 30.65 22.83 19.41 1992 31.90 30.03 31.38 20.87 1993 31.39 33.83 28.25 23.67 1994 33.96 31.87 34.92 26.71 1995 33.28 36.76 34.62 27.53 1996 36.26 33.94 38.93 24.12 1997 38.53 39.66 40.77 28.90 1998 40.31 39.68 38.23 33.88 2000 37.14 42.26 37.64 31.27 2001 33.78 40.74 39.43 30.55 2002 34.67 39.28 43.36 27.13 2004 35.57 43.99 45.81 33.72
Source: own, based on Multi-Purpose Household Survey
Table A6.4. Costa Rica. Coverage Rates of the Economically Active Population, Employed Persons, and Elderly, by Gender
Contributors / Economically Active Population Contributors / Employed Persons Beneficiaries / Population Age 65+
Year
Men Women Men Women Men Women 1990 69.52 60.44 70.89 62.42 . . 1992 70.98 60.89 72.44 63.00 40.92 16.05 1993 72.37 60.92 73.71 62.62 41.08 17.54 1994 70.62 58.79 71.85 60.57 44.06 19.19 1995 71.12 59.28 72.57 61.32 45.08 21.50 1996 69.79 58.41 71.57 61.37 43.30 23.10 1997 67.80 55.39 69.71 58.28 46.41 27.53 1998 69.69 55.02 71.37 57.77 49.39 26.86 2000 67.74 56.05 69.52 58.74 48.01 26.65 2001 66.60 53.88 68.54 56.43 48.63 25.33 2002 66.02 53.06 68.28 56.07 47.44 25.68 2003 65.15 53.46 67.37 56.43 . . 2004 65.98 54.66 68.25 57.84 51.13 29.25
Source: own, based on Multi-Purpose Household Survey
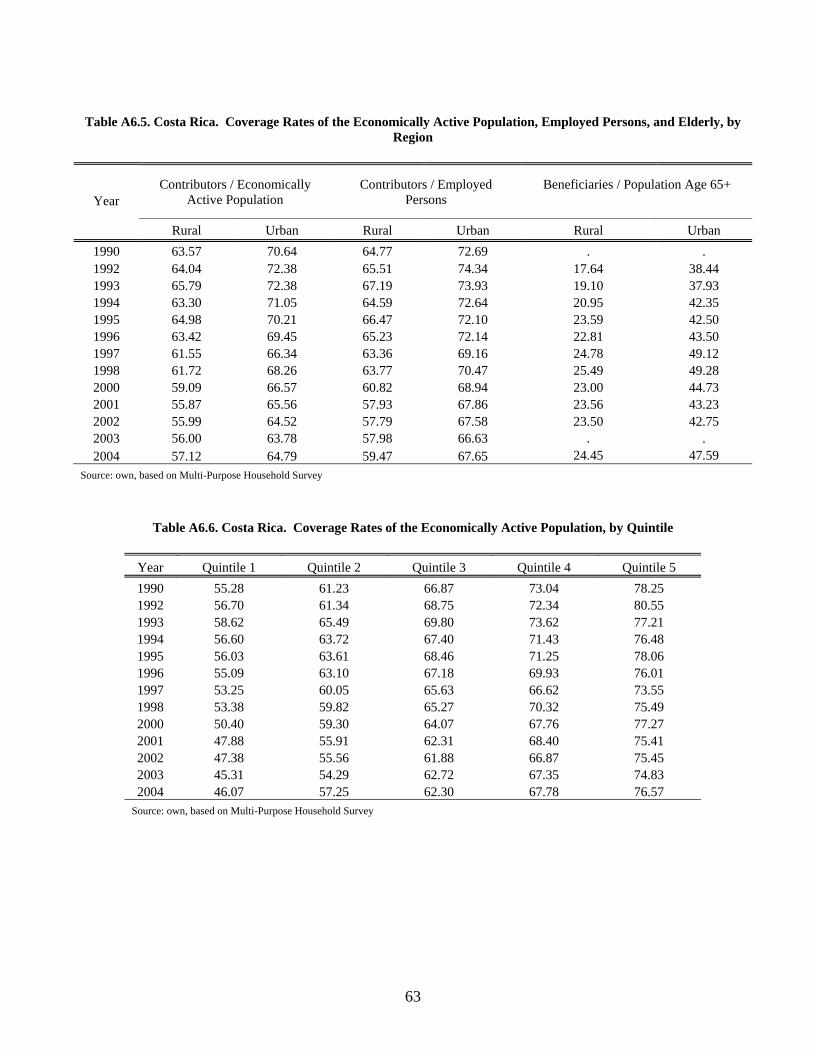
63
Table A6.5. Costa Rica. Coverage Rates of the Economically Active Population, Employed Persons, and Elderly, by
Region
Contributors / Economically Active Population
Contributors / Employed Persons
Beneficiaries / Population Age 65+ Year
Rural Urban Rural Urban Rural Urban 1990 63.57 70.64 64.77 72.69 . . 1992 64.04 72.38 65.51 74.34 17.64 38.44 1993 65.79 72.38 67.19 73.93 19.10 37.93 1994 63.30 71.05 64.59 72.64 20.95 42.35 1995 64.98 70.21 66.47 72.10 23.59 42.50 1996 63.42 69.45 65.23 72.14 22.81 43.50 1997 61.55 66.34 63.36 69.16 24.78 49.12 1998 61.72 68.26 63.77 70.47 25.49 49.28 2000 59.09 66.57 60.82 68.94 23.00 44.73 2001 55.87 65.56 57.93 67.86 23.56 43.23 2002 55.99 64.52 57.79 67.58 23.50 42.75 2003 56.00 63.78 57.98 66.63 . . 2004 57.12 64.79 59.47 67.65 24.45 47.59
Source: own, based on Multi-Purpose Household Survey
Table A6.6. Costa Rica. Coverage Rates of the Economically Active Population, by Quintile Year Quintile 1 Quintile 2 Quintile 3 Quintile 4 Quintile 5 1990 55.28 61.23 66.87 73.04 78.25 1992 56.70 61.34 68.75 72.34 80.55 1993 58.62 65.49 69.80 73.62 77.21 1994 56.60 63.72 67.40 71.43 76.48 1995 56.03 63.61 68.46 71.25 78.06 1996 55.09 63.10 67.18 69.93 76.01 1997 53.25 60.05 65.63 66.62 73.55 1998 53.38 59.82 65.27 70.32 75.49 2000 50.40 59.30 64.07 67.76 77.27 2001 47.88 55.91 62.31 68.40 75.41 2002 47.38 55.56 61.88 66.87 75.45 2003 45.31 54.29 62.72 67.35 74.83 2004 46.07 57.25 62.30 67.78 76.57
Source: own, based on Multi-Purpose Household Survey

64
Table A6.7. Costa Rica. Coverage Rates of the Employed Persons, by Quintile
Year Quintile 1 Quintile 2 Quintile 3 Quintile 4 Quintile 5 1990 56.36 63.95 69.35 74.21 78.67 1992 59.20 63.81 70.00 74.14 80.98 1993 61.14 67.29 71.29 74.51 77.86 1994 58.90 65.16 68.46 72.54 77.58 1995 58.58 65.52 70.42 72.41 78.85 1996 58.30 65.76 69.24 71.96 77.16 1997 56.27 62.96 67.90 68.89 74.54 1998 57.06 62.57 66.68 71.86 76.79 2000 54.39 61.53 66.29 68.61 78.62 2001 51.11 58.75 64.80 70.58 75.90 2002 51.47 58.49 64.98 68.81 76.33 2003 49.91 57.24 65.06 69.45 75.54 2004 50.27 60.96 64.75 69.54 77.80
Source: own, based on Multi-Purpose Household Survey
Table A6.8. Costa Rica. Coverage Rates of the Elderly, by Quintile Year Quintile 1 Quintile 2 Quintile 3 Quintile 4 Quintile 5 1991 2.73 13.98 26.85 37.83 46.00 1992 3.28 19.19 31.36 40.67 46.26 1993 3.74 24.24 28.09 41.96 45.49 1994 7.46 24.60 32.40 43.70 49.06 1995 4.80 28.15 30.74 46.83 53.17 1996 4.05 21.36 34.22 49.36 55.58 1997 10.68 26.67 37.77 50.55 57.24 1998 11.39 28.61 39.58 48.12 58.43 2000 8.21 31.83 38.10 48.88 53.80 2001 7.90 28.44 38.68 48.82 53.57 2002 10.52 22.54 38.18 50.86 55.69 2004 10.79 29.89 46.63 45.99 62.05
Source: own, based on Multi-Purpose Household Survey

65
Table A6.9. Costa Rica - Coverage Rates of the Employed, by Field of Activity
Field of Activity Year Primary Secondary Tertiary
1990 59.31 71.12 71.70 1992 61.79 73.81 70.86 1993 63.64 74.09 71.43 1994 62.84 70.98 69.38 1995 64.06 71.34 70.09 1996 62.13 69.98 70.29 1997 60.96 68.29 66.93 1998 60.65 69.40 68.04 2000 61.50 66.53 67.01 2001 57.13 66.22 65.20 2002 55.71 65.45 65.40 2003 55.17 65.72 64.47 2004 56.97 66.01 65.90
Source: own, based on Multi-Purpose Household Survey
Table A6.10. Costa Rica - Coverage Rates of the Employed, by Sizes of Establishments
Sizes of Establishments Year
Small Medium Large 1990 45.36 89.46 . 1992 46.99 89.29 . 1993 47.48 90.71 . 1994 46.31 76.96 94.04 1995 46.49 79.15 93.21 1996 48.75 77.99 91.71 1997 43.54 76.11 93.54 1998 44.68 78.68 92.54 2000 42.71 74.32 91.58 2001 38.11 74.47 93.30 2002 37.64 76.27 93.88 2003 36.90 74.93 92.56 2004 37.21 74.36 92.71
Source: own, based on Multi-Purpose Household Survey

66
Table A6.11. Costa Rica - Coverage Rates of the Employed, by Sector
Sector Year
Public Private 1990 96.62 75.25 1992 96.84 76.89 1993 97.99 77.90 1994 96.74 75.84 1995 97.69 76.98 1996 95.09 75.68 1997 96.18 74.48 1998 95.85 75.37 2000 94.02 74.69 2001 96.60 75.30 2002 97.70 75.49 2003 97.74 73.94 2004 97.80 76.36
Source: own, based on Multi-Purpose Household Survey
Table A6.12. Costa Rica. Coverage Rates of the Active Population and Employed, by Education
Contributors / Economically Active Population Contributors / Employed Persons Year Primary Secondary Superior Primary Secondary Superior
1990 59.28 74.43 82.12 60.40 76.79 84.21 1992 60.20 74.17 84.11 61.57 76.56 85.49 1993 61.31 74.59 83.81 62.60 76.35 85.23 1994 60.21 72.75 79.78 61.43 74.45 81.46 1995 60.05 72.19 81.68 61.24 74.69 83.54 1996 58.94 71.33 80.10 60.94 73.57 82.79 1997 55.26 69.59 79.45 56.94 72.59 82.30 1998 56.24 68.84 80.48 58.08 71.53 82.31 2000 53.68 68.15 81.73 55.83 70.55 82.98 2001 51.05 66.14 79.82 52.84 68.84 82.01 2002 50.25 64.21 80.67 52.38 67.43 82.83 2003 50.24 63.27 78.01 52.42 66.15 80.31 2004 51.28 63.56 80.51 53.43 67.05 82.73
Source: own, based on Multi-Purpose Household Survey

67
Table A6.13. Costa Rica. Coverage Rates of the Elderly, by Education
Beneficiaries / Population Age 65+ Year
Primary Secondary Superior 1992 25.20 47.38 66.33 1993 25.56 44.66 70.02 1994 27.40 48.39 77.15 1995 28.70 57.52 64.17 1996 29.45 57.48 63.45 1997 32.01 62.53 81.83 1998 33.15 56.91 76.93 2000 33.05 51.97 77.69 2001 32.40 45.96 78.15 2002 32.64 46.13 69.78 2004 35.17 57.76 73.54
Source: own, based on Multi-Purpose Household Survey
Table A6.14. Costa Rica. Rate of Total Household Income from Pensions to Total Household Income, by Type of Family
Year Only Elderly Youth and Elderly
At Least one Elderly
1991 93.86 54.74 61.27 1992 89.82 52.04 58.76 1993 90.48 55.34 62.80 1994 86.34 48.09 56.48 1995 87.56 48.46 57.78 1996 85.80 49.40 57.59 1997 87.57 52.40 61.33 1998 83.43 50.91 59.13 2000 85.01 48.78 56.87 2001 89.89 53.35 62.34 2002 87.65 50.66 59.24 2004 90.25 48.62 60.30
Source: own, based on Multi-Purpose Household Survey

68
Table A6.15. Costa Rica. Other Definitions of Pensions
Year Definition (1) Definition (2)
1991 32.86 55.16 1992 36.52 53.92 1993 38.25 56.20 1994 41.23 59.04 1995 42.38 58.64 1996 42.24 57.34 1997 45.07 63.63 1998 46.75 63.10 2000 45.68 60.63 2001 45.79 61.59 2002 45.34 62.66 2004 49.07 63.61
Note: Definition (1) refers to the “Joint Coverage” which represents the percentage of the elderly who reside in a household in which at least one social security benefit is received. On the other hand, Definition (2) refers to the percentage of the elderly who reside in a household in which at least one social security benefit is received or one person over 65 years of age is occupied. Source: own, based on Multi-Purpose Household Survey

69
7. Dominican Republic
Table A7.1. Dominican Republic. Coverage Rates of the Elderly
Year Beneficiaries / Population Age 65+
2000 10.99 2001 12.15 2002 11.42 2003 10.87 2004 13.17
Source: own, based on Panel Survey of the Labor Force
Table A7.2. Dominican Republic. Coverage Rates of the Elderly , by Age
Year 60-64 65-69 70-74 75-79 2000 12.68 9.82 10.49 10.19 2001 12.58 13.33 13.65 8.36 2002 11.32 10.72 13.38 11.06 2003 9.90 10.92 16.39 8.26 2004 15.63 12.07 13.71 10.75
Source: own, based on Panel Survey of the Labor Force
Table A7.3. Dominican Republic. Coverage Rates of the Elderly, by Gender
Beneficiaries / Population Age 65+ Year
Men Women 2000 15.59 6.76 2001 18.59 6.72 2002 16.53 6.95 2003 17.60 5.28 2004 18.77 7.42
Source: own, based on Panel Survey of the Labor Force

70
Table A7.4. Dominican Republic. Coverage Rates of the Elderly, by Region
Beneficiaries / Population Age 65+ Year
Rural Urban 2000 3.88 15.18 2001 3.85 17.11 2002 3.82 15.97 2003 3.69 15.53 2004 6.02 18.26
Source: own, based on Panel Survey of the Labor Force
Table A7.5. Dominican Republic. Coverage Rates of the Elderly, by Quintile Year Quintile 1 Quintile 2 Quintile 3 Quintile 4 Quintile 5 2000 5.50 5.36 11.19 17.65 15.23 2001 1.84 12.91 11.91 16.67 17.37 2002 2.32 8.07 10.10 15.82 20.77 2003 4.46 4.32 8.48 17.45 19.67 2004 4.44 10.60 11.18 17.96 21.64
Source: own, based on Panel Survey of the Labor Force
Table A7.6. Dominican Republic. Coverage Rates of the Elderly, by Education
Beneficiaries / Population Age 65+ Year
Primary Secondary Superior 2000 9.12 38.10 38.99 2001 10.08 36.05 42.66 2002 8.97 30.21 41.96 2003 8.96 27.98 44.84 2004 11.26 23.68 45.77
Source: own, based on Panel Survey of the Labor Force

71
Table A7.7. Dominican Republic. Rate of Total Household
Income from Pensions to Total Household Income, by Type of Family
Year Only Elderly Youth and Elderly
At Least one Elderly
2000 41.61 25.39 28.12 2001 41.92 27.23 30.51 2002 44.19 26.27 30.17 2003 46.66 28.95 32.43 2004 50.53 29.18 33.25
Source: own, based on Panel Survey of the Labor Force
Table A7.8. Dominican Republic. Other Definitions of Pensions
Year Definition (1) Definition (2)
2000 13.76 43.81 2001 15.55 41.47 2002 14.31 41.03 2003 14.55 40.48 2004 16.01 45.98
Note: Definition (1) refers to the “Joint Coverage” which represents the percentage of the elderly who reside in a household in which at least one social security benefit is received. On the other hand, Definition (2) refers to the percentage of the elderly who reside in a household in which at least one social security benefit is received or one person over 65 years of age is occupied. Source: own, based on Panel Survey of the Labor Force

72
8. Ecuador
Table A8.1. Ecuador. Coverage Rates of the Economically Active Population and Elderly
Year
Contributors / Economically
Active Population
Contributors / Employed Persons
Contributors / Wage-Earners
Contributors / Employers - Independent
Beneficiaries / Population Age
65+
1990 39.42 40.32 61.29 9.46 18.60 1991 38.82 39.90 58.75 11.61 19.83 1992 38.94 40.25 60.68 13.26 18.65 1993 38.03 39.30 56.79 14.52 19.35 1994 38.06 39.10 56.13 13.48 19.27 1995 37.23 38.23 56.38 11.26 20.20 1996 39.88 41.41 61.08 13.15 21.22 1997 38.38 39.57 57.53 12.09 19.64 1998 33.96 35.78 52.24 10.42 20.81 1999 32.97 34.79 50.13 10.78 22.38 2000 26.29 26.83 39.38 11.41 13.68 2001 26.61 27.18 39.33 13.37 14.66 2003 26.66 27.40 39.69 12.17 15.22 2004 26.81 27.57 41.94 11.79 16.08
Source: own, based on National Survey on Employment, Unemployment and Underemployment
Table A8.2. Ecuador. Coverage Rates of the Employed Person, by Age
Year 20-29 30-39 40-49 50-59 60-69
1990 35.28 45.69 44.97 36.88 35.72 1991 33.76 45.21 44.36 40.19 34.46 1992 34.53 45.31 44.16 40.70 35.34 1993 32.56 42.58 45.01 40.55 39.99 1994 33.14 41.72 44.25 42.14 38.17 1995 32.37 41.51 43.41 37.75 37.18 1996 36.86 43.81 46.07 42.11 39.87 1997 34.86 41.24 45.37 40.74 33.48 1998 29.58 37.80 40.24 39.48 35.84 1999 28.00 37.39 40.20 36.88 33.57 2000 22.37 28.79 31.71 28.65 23.64 2001 21.75 29.15 31.71 29.71 26.58 2003 22.42 27.90 32.66 29.56 27.67 2004 22.91 28.14 31.19 32.20 25.20
Source: own, based on National Survey on Employment, Unemployment and Underemployment

73
Table A8.3. Ecuador. Coverage Rates of the Elderly , by Age
Year 60-64 65-69 70-74 75-79 1990 15.78 18.41 21.50 20.66 1991 16.87 19.54 22.81 21.97 1992 14.27 22.51 24.69 16.71 1993 14.01 22.77 22.77 22.21 1994 13.33 20.25 30.23 19.09 1995 16.08 20.15 26.85 21.44 1996 17.32 20.20 24.23 26.74 1997 19.12 19.21 21.53 19.53 1998 18.21 22.52 20.99 23.85 1999 16.58 23.75 29.07 24.61 2000 12.21 15.30 13.15 14.41 2001 14.07 13.44 17.56 14.34 2003 11.48 16.97 18.06 16.20 2004 11.31 16.98 18.57 19.99
Source: own, based on National Survey on Employment, Unemployment and Underemployment
Table A8.4. Ecuador. Coverage Rates of the Economically Active Population, Employed Persons, and Elderly, by Gender
Contributors / Economically Active Population Contributors / Employed Persons Beneficiaries / Population Age 65+
Year
Men Women Men Women Men Women 1990 40.88 36.86 41.45 38.29 28.43 9.83 1991 40.37 36.31 41.13 37.84 27.99 12.83 1992 41.26 35.40 42.17 37.23 27.86 10.13 1993 39.80 35.29 40.81 36.90 27.46 12.44 1994 38.69 37.07 39.59 38.32 29.38 10.61 1995 37.79 36.35 38.64 37.59 30.50 11.19 1996 40.81 38.42 41.98 40.50 30.85 12.38 1997 38.30 38.52 39.18 40.21 26.94 13.14 1998 34.59 33.03 36.01 35.42 29.93 13.33 1999 33.86 31.63 35.19 34.16 30.92 15.23 2000 25.70 27.31 26.05 28.19 18.25 9.18 2001 27.31 25.55 27.89 26.09 17.68 11.72 2003 27.17 25.83 27.78 26.78 18.71 11.87 2004 27.06 26.42 27.70 27.36 19.38 12.95
Source: own, based on National Survey on Employment, Unemployment and Underemployment

74
Table A8.5. Ecuador. Coverage Rates of the Economically Active Population, Employed Persons, and Elderly, by
Region
Contributors / Economically Active Population
Contributors / Employed Persons Beneficiaries / Population Age 65+
Year
Rural Urban Rural Urban Rural Urban 1990 . 39.42 . 40.32 . 18.60 1991 . 38.82 . 39.90 . 19.83 1992 . 38.94 . 40.25 . 18.65 1993 . 38.03 . 39.30 . 19.35 1994 . 38.06 . 39.10 . 19.27 1995 . 37.23 . 38.23 . 20.20 1996 . 39.88 . 41.41 . 21.22 1997 . 38.38 . 39.57 . 19.64 1998 . 33.96 . 35.78 . 20.81 1999 . 32.97 . 34.79 . 22.38 2000 18.39 30.15 18.46 31.05 3.70 20.72 2001 21.16 29.46 21.25 30.36 4.90 21.67 2003 18.33 30.55 18.37 31.81 4.85 22.16 2004 19.13 30.49 19.10 31.80 5.45 23.17
Source: own, based on National Survey on Employment, Unemployment and Underemployment
Table A8.6. Ecuador. Coverage Rates of the Economically Active Population, by Quintile Year Quintile 1 Quintile 2 Quintile 3 Quintile 4 Quintile 5 1990 25.98 29.38 35.54 45.08 61.35 1991 23.49 29.36 36.80 48.10 56.09 1992 24.47 29.93 36.15 48.17 56.56 1993 25.65 30.69 35.20 46.25 52.48 1994 28.45 28.05 35.87 44.17 53.57 1995 22.68 28.97 33.85 47.59 52.66 1996 26.92 31.64 38.45 46.33 55.81 1997 22.43 28.88 38.54 45.45 56.20 1998 13.30 23.40 31.55 43.96 57.31 1999 15.10 23.08 28.63 42.05 56.21 2000 14.29 16.73 22.28 31.29 46.44 2001 15.02 16.66 22.55 32.52 45.70 2003 13.92 15.81 22.15 33.15 48.22 2004 13.80 16.19 22.16 32.67 49.24
Source: own, based on National Survey on Employment, Unemployment and Underemployment

75
Table A8.7. Ecuador. Coverage Rates of the Employed Persons, by Quintile
Year Quintile 1 Quintile 2 Quintile 3 Quintile 4 Quintile 5 1990 27.66 29.46 36.58 46.68 61.50 1991 24.33 31.17 37.19 49.71 56.82 1992 25.97 30.91 37.17 50.83 57.07 1993 27.09 32.01 37.68 47.10 52.79 1994 29.62 29.51 36.32 45.63 54.27 1995 23.96 29.79 35.63 48.39 53.04 1996 28.39 33.78 40.22 47.34 57.13 1997 23.91 29.98 39.75 46.95 56.88 1998 14.66 25.43 34.25 45.08 59.26 1999 16.51 24.64 30.69 44.71 57.70 2000 14.42 17.45 22.49 32.38 46.99 2001 15.40 17.05 23.18 33.40 46.23 2003 14.30 16.27 23.14 34.05 49.20 2004 14.33 16.78 23.01 33.57 50.18
Source: own, based on National Survey on Employment, Unemployment and Underemployment
Table A8.8. Ecuador. Coverage Rates of the Elderly, by Quintile Year Quintile 1 Quintile 2 Quintile 3 Quintile 4 Quintile 5 1990 5.26 15.41 15.53 24.95 31.94 1991 8.29 16.71 18.53 24.15 31.75 1992 5.36 13.11 18.96 26.33 29.49 1993 4.79 15.49 22.10 20.62 33.79 1994 2.05 16.59 16.92 24.72 35.08 1995 5.45 12.33 19.15 29.27 34.90 1996 8.24 17.26 20.41 28.38 31.52 1997 7.78 13.72 20.29 26.39 29.65 1998 7.14 15.07 16.79 28.29 36.77 1999 5.59 19.98 20.62 30.83 34.84 2000 3.46 8.58 12.78 19.19 24.38 2001 2.11 10.38 15.00 16.06 29.56 2003 1.90 4.52 11.47 17.75 40.45 2004 2.03 7.71 10.88 22.79 36.97
Source: own, based on National Survey on Employment, Unemployment and Underemployment

76
Table A8.9. Ecuador - Coverage Rates of the Employed, by Field of
Activity
Field of Activity Year Primary Secondary Tertiary
1990 18.78 38.25 43.45 1991 19.70 38.35 42.59 1992 24.57 38.85 42.32 1993 23.70 37.02 41.87 1994 22.94 35.27 41.95 1995 21.86 34.27 40.83 1996 25.95 36.30 44.34 1997 22.11 35.05 42.65 1998 18.68 31.29 38.97 1999 20.75 29.84 37.82 2000 15.74 23.53 33.86 2001 18.43 26.17 32.43 2003 17.28 25.83 33.46 2004 16.91 26.53 33.95
Source: own, based on National Survey on Employment, Unemployment and Underemployment
Table A8.10. Ecuador - Coverage Rates of the Employed, by Sizes of Establishments
Sizes of Establishments Year
Small Medium Large 1992 17.43 54.40 81.82 1993 18.18 51.15 79.52 1994 17.44 47.81 81.24 1995 15.34 45.51 80.37 1996 17.53 48.49 86.29 1997 15.23 43.91 82.38 1998 13.22 38.20 82.42 1999 13.99 40.28 80.09 2000 13.09 34.61 64.38 2001 14.42 33.33 65.40 2003 12.64 36.27 72.30 2004 12.41 36.37 74.58
Source: own, based on National Survey on Employment, Unemployment and Underemployment

77
Table A8.11. Ecuador - Coverage Rates of the
Employed, by Sector
Sector Year Public Private
1990 92.24 47.93 1991 88.51 46.92 1992 90.70 50.68 1993 88.58 46.36 1994 89.31 46.15 1995 89.78 46.20 1996 99.76 48.90 1997 100.00 44.57 1998 99.41 40.51 1999 98.52 40.27 2000 79.99 31.21 2001 83.38 32.22 2003 83.95 31.95 2004 88.36 33.46
Source: own, based on Permanent and Ongoing Survey of Households – Expanded User Base
Table A8.12. Ecuador. Coverage Rates of the Active Population and Employed, by Education
Contributors / Economically Active Population Contributors / Employed Persons Year Primary Secondary Superior Primary Secondary Superior
1990 23.86 42.08 68.39 23.95 43.63 70.46 1991 23.35 41.88 63.86 23.71 43.40 66.53 1992 22.62 40.72 64.58 23.07 42.32 68.18 1993 21.93 39.91 63.29 22.32 41.53 66.17 1994 20.97 38.70 62.14 21.19 40.26 64.11 1995 21.04 36.18 62.09 21.27 37.48 64.25 1996 23.12 38.83 65.75 23.37 41.09 69.10 1997 19.95 37.96 63.78 20.10 39.64 66.16 1998 16.18 32.95 60.88 16.74 35.11 64.66 1999 16.70 30.72 60.15 17.17 32.81 64.04 2000 15.76 27.23 54.38 15.92 28.16 56.16 2001 16.70 27.05 51.07 16.88 27.83 52.84 2003 15.80 28.02 50.03 16.01 29.11 52.31 2004 15.72 27.03 52.88 15.88 28.17 55.45
Source: own, based on National Survey on Employment, Unemployment and Underemployment
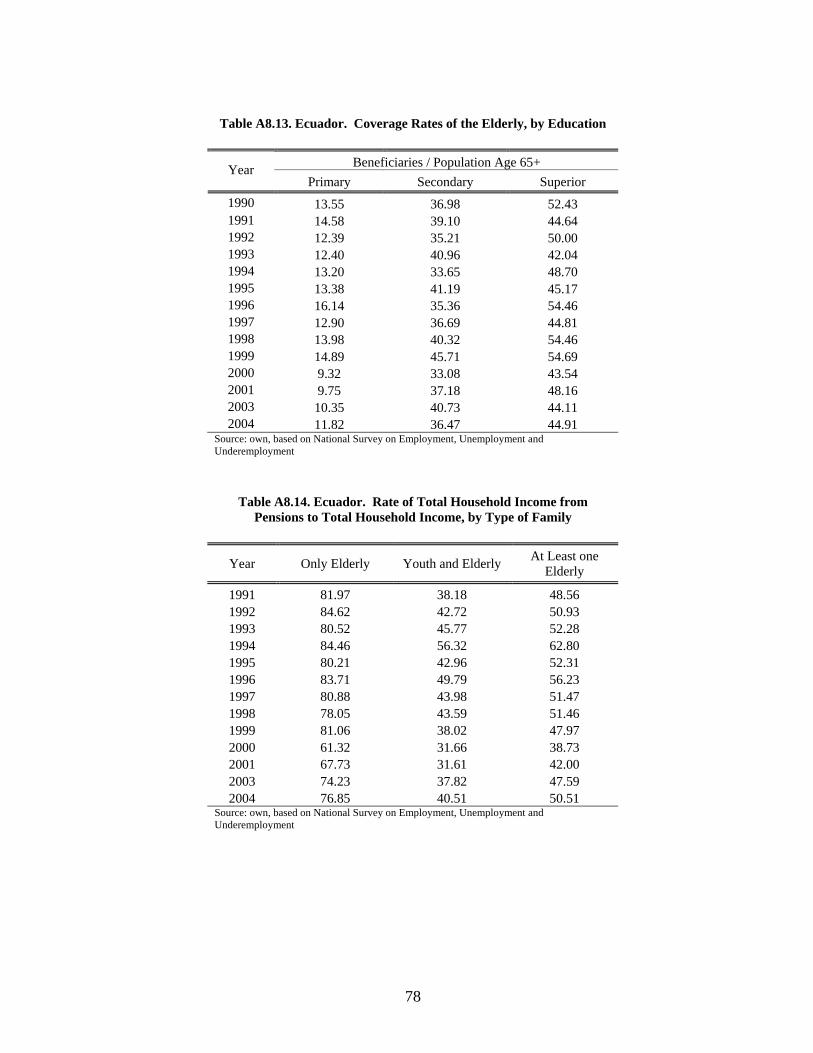
78
Table A8.13. Ecuador. Coverage Rates of the Elderly, by Education
Beneficiaries / Population Age 65+ Year
Primary Secondary Superior 1990 13.55 36.98 52.43 1991 14.58 39.10 44.64 1992 12.39 35.21 50.00 1993 12.40 40.96 42.04 1994 13.20 33.65 48.70 1995 13.38 41.19 45.17 1996 16.14 35.36 54.46 1997 12.90 36.69 44.81 1998 13.98 40.32 54.46 1999 14.89 45.71 54.69 2000 9.32 33.08 43.54 2001 9.75 37.18 48.16 2003 10.35 40.73 44.11 2004 11.82 36.47 44.91
Source: own, based on National Survey on Employment, Unemployment and Underemployment
Table A8.14. Ecuador. Rate of Total Household Income from Pensions to Total Household Income, by Type of Family
Year Only Elderly Youth and Elderly At Least one Elderly
1991 81.97 38.18 48.56 1992 84.62 42.72 50.93 1993 80.52 45.77 52.28 1994 84.46 56.32 62.80 1995 80.21 42.96 52.31 1996 83.71 49.79 56.23 1997 80.88 43.98 51.47 1998 78.05 43.59 51.46 1999 81.06 38.02 47.97 2000 61.32 31.66 38.73 2001 67.73 31.61 42.00 2003 74.23 37.82 47.59 2004 76.85 40.51 50.51
Source: own, based on National Survey on Employment, Unemployment and Underemployment
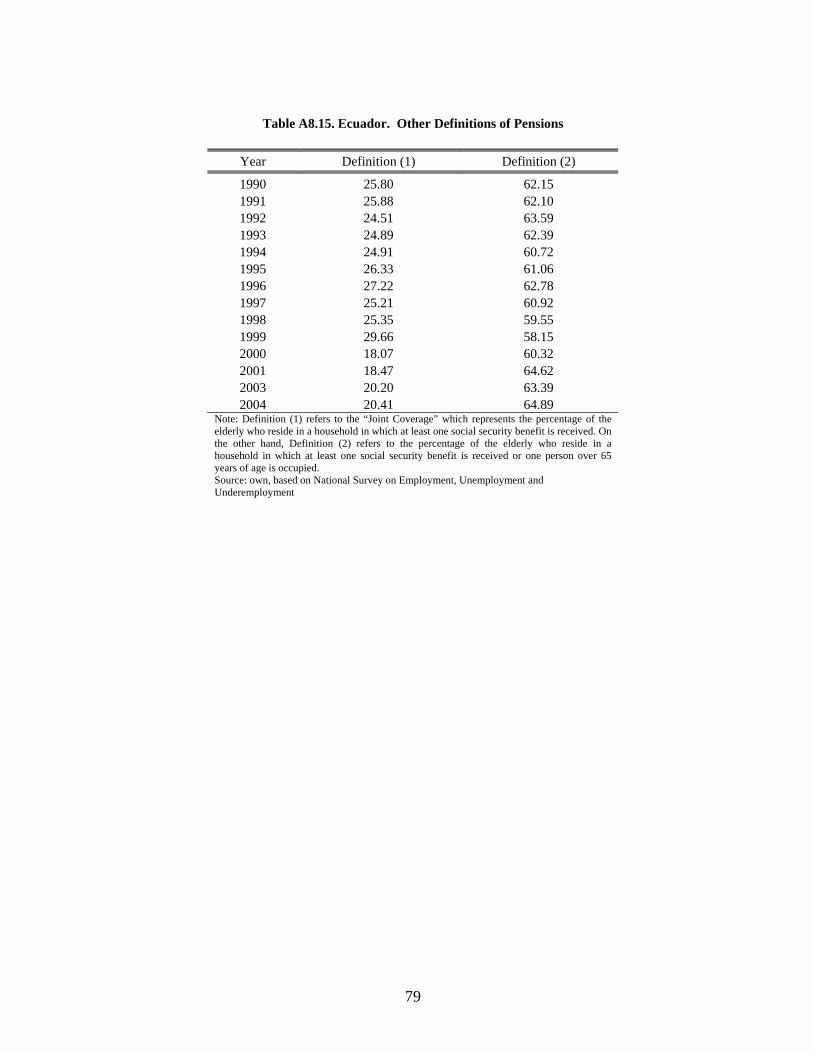
79
Table A8.15. Ecuador. Other Definitions of Pensions
Year Definition (1) Definition (2)
1990 25.80 62.15 1991 25.88 62.10 1992 24.51 63.59 1993 24.89 62.39 1994 24.91 60.72 1995 26.33 61.06 1996 27.22 62.78 1997 25.21 60.92 1998 25.35 59.55 1999 29.66 58.15 2000 18.07 60.32 2001 18.47 64.62 2003 20.20 63.39 2004 20.41 64.89
Note: Definition (1) refers to the “Joint Coverage” which represents the percentage of the elderly who reside in a household in which at least one social security benefit is received. On the other hand, Definition (2) refers to the percentage of the elderly who reside in a household in which at least one social security benefit is received or one person over 65 years of age is occupied. Source: own, based on National Survey on Employment, Unemployment and Underemployment

80
9. Guatemala
Table A9.1. Guatemala. Coverage Rates of the Economically Active Population and Elderly
Year
Contributors / Economically
Active Population
Contributors / Employed Persons
Contributors / Wage-Earners
Contributors / Employers - Independent
Beneficiaries / Population Age
65+
1998 18.90 19.19 37.18 0.78 13.73 2000 19.62 19.90 39.70 0.12 11.17
Source: own, based on National Survey on Living Conditions
Table A9.2. Guatemala. Coverage Rates of the Employed Person, by Age
Year 20-29 30-39 40-49 50-59 60-69
1998 22.67 22.36 20.17 15.77 7.55 2000 24.65 21.63 21.19 13.46 7.77
Source: own, based on National Survey on Living Conditions
Table A9.3. Guatemala. Coverage Rates of the Elderly , by Age
Year 60-64 65-69 70-74 75-79 1998 11.76 15.18 13.28 16.21 2000 14.65 11.10 7.44 7.72
Source: own, based on National Survey on Living Conditions
Table A9.4. Guatemala. Coverage Rates of the Economically Active Population, Employed Persons, and Elderly, by Gender
Contributors / Economically Active Population Contributors / Employed Persons Beneficiaries / Population Age 65+
Year
Men Women Men Women Men Women 1998 20.98 15.43 21.36 15.60 18.10 9.50 2000 21.60 16.09 21.87 16.35 19.10 3.59
Source: own, based on National Survey on Living Conditions

81
Table A9.5. Guatemala. Coverage Rates of the Economically Active Population, Employed Persons, and Elderly, by
Region
Contributors / Economically Active Population
Contributors / Employed Persons
Beneficiaries / Population Age 65+
Year
Rural Urban Rural Urban Rural Urban 1998 12.18 26.27 12.28 26.88 8.64 19.94 2000 11.58 28.97 11.65 29.62 6.89 16.46
Source: own, based on National Survey on Living Conditions
Table A9.6. Guatemala. Coverage Rates of the Economically Active Population, by Quintile Year Quintile 1 Quintile 2 Quintile 3 Quintile 4 Quintile 5 1998 1.69 11.31 17.27 28.68 36.40 2000 2.05 11.03 19.01 26.78 39.77
Source: own, based on National Survey on Living Conditions
Table A9.7. Guatemala. Coverage Rates of the Employed Persons, by Quintile Year Quintile 1 Quintile 2 Quintile 3 Quintile 4 Quintile 5 1998 1.72 11.40 17.19 29.37 37.15 2000 2.10 11.07 19.34 27.17 40.35
Source: own, based on National Survey on Living Conditions
Table A9.8. Guatemala. Coverage Rates of the Elderly, by Quintile Year Quintile 1 Quintile 2 Quintile 3 Quintile 4 Quintile 5 1998 3.80 11.36 11.89 16.93 24.60 2000 0.67 6.47 8.56 13.99 26.08
Source: own, based on National Survey on Living Conditions
Table A9.9. Guatemala - Coverage Rates of the Employed, by Field of Activity
Field of Activity Year Primary Secondary Tertiary
1998 13.71 22.42 22.10 2000 8.34 26.93 25.71
Source: own, based on National Survey on Living Conditions

82
Table A9.10. Guatemala - Coverage Rates of the Employed, by Sizes of
Establishments
Sizes of Establishments Year Small Medium Large
1998 . . . 2000 2.67 39.44 77.62
Source: own, based on Permanent and Ongoing Survey of Households – Expanded User Base
Table A9.11. Guatemala - Coverage Rates of the Employed, by Sector
Sector Year
Public Private 1998 72.14 32.93 2000 73.84 37.78
Source: own, based on Permanent and Ongoing Survey of Households – Expanded User Base
Table A9.12. Guatemala. Coverage Rates of the Active Population and Employed, by Education
Contributors / Economically Active Population Contributors / Employed Persons Year Primary Secondary Superior Primary Secondary Superior
1998 12.42 36.19 52.41 12.53 37.70 53.57 2000 12.16 39.13 49.10 12.29 40.22 50.10
Source: own, based on National Survey on Living Conditions
Table A9.13. Guatemala. Coverage Rates of the Elderly, by Education
Beneficiaries / Population Age 65+ Year
Primary Secondary Superior 1998 11.11 46.72 54.66 2000 8.15 47.01 59.27
Source: own, based on National Survey on Living Conditions
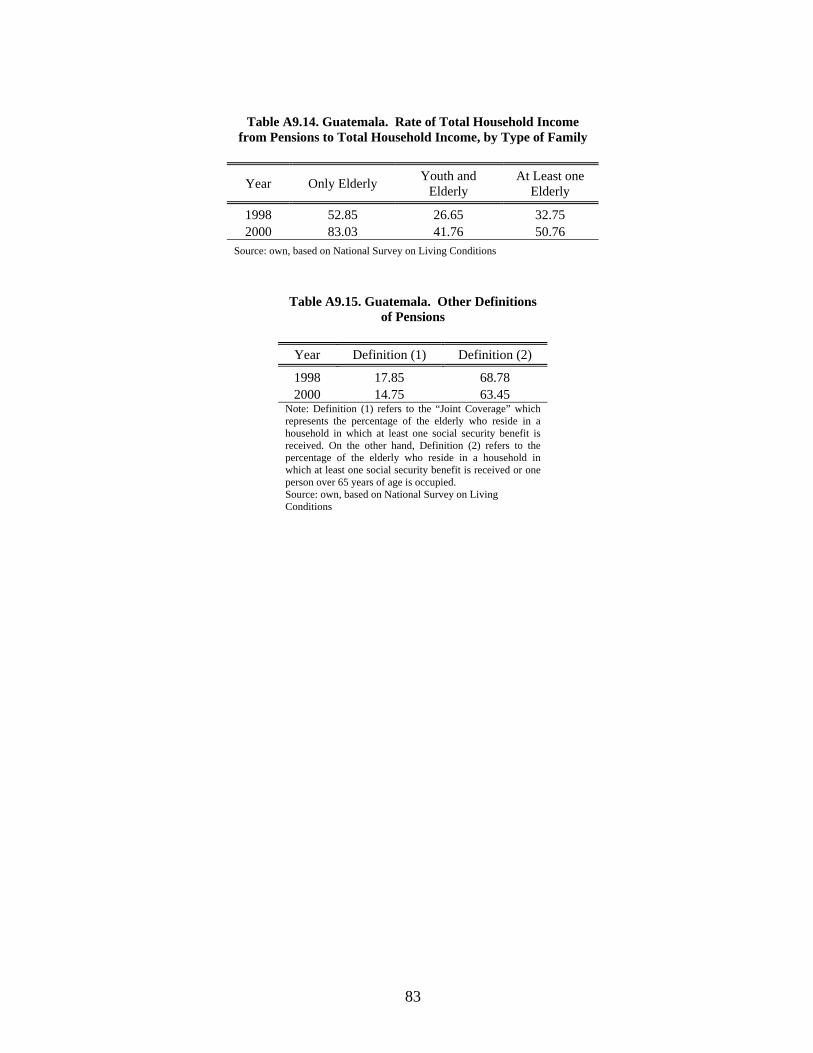
83
Table A9.14. Guatemala. Rate of Total Household Income
from Pensions to Total Household Income, by Type of Family
Year Only Elderly Youth and Elderly
At Least one Elderly
1998 52.85 26.65 32.75 2000 83.03 41.76 50.76
Source: own, based on National Survey on Living Conditions
Table A9.15. Guatemala. Other Definitions of Pensions
Year Definition (1) Definition (2)
1998 17.85 68.78 2000 14.75 63.45
Note: Definition (1) refers to the “Joint Coverage” which represents the percentage of the elderly who reside in a household in which at least one social security benefit is received. On the other hand, Definition (2) refers to the percentage of the elderly who reside in a household in which at least one social security benefit is received or one person over 65 years of age is occupied. Source: own, based on National Survey on Living Conditions
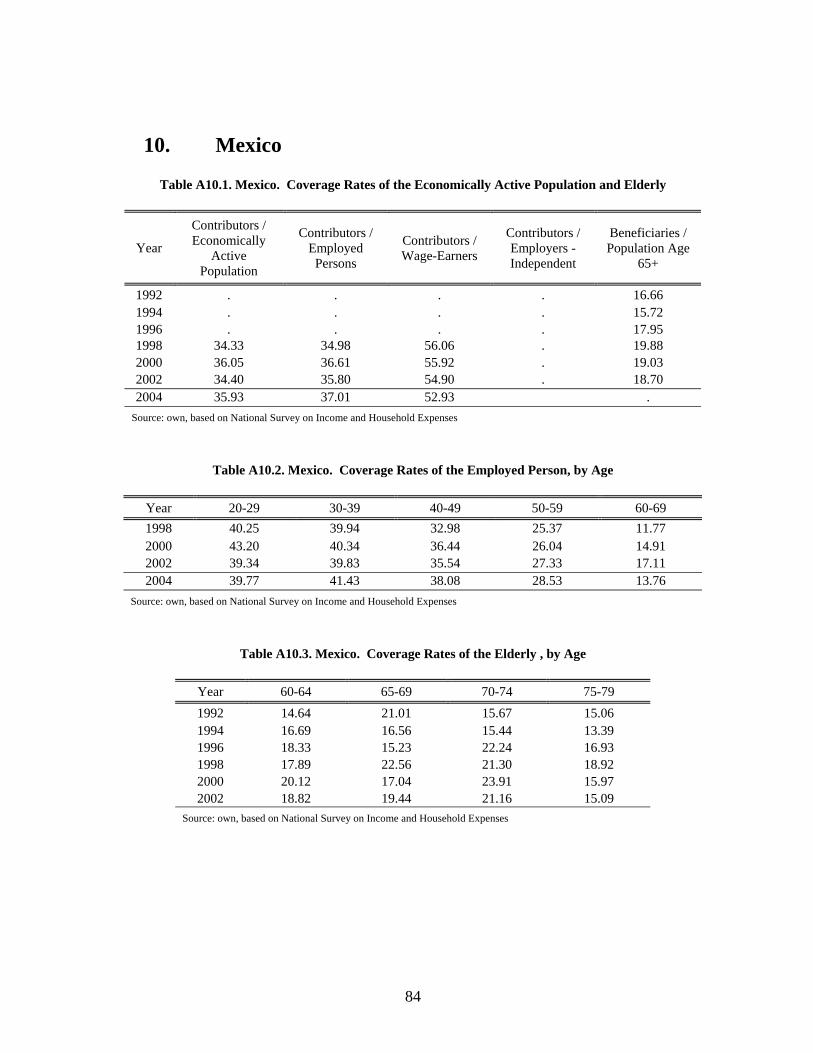
84
10. Mexico
Table A10.1. Mexico. Coverage Rates of the Economically Active Population and Elderly
Year
Contributors / Economically
Active Population
Contributors / Employed Persons
Contributors / Wage-Earners
Contributors / Employers - Independent
Beneficiaries / Population Age
65+
1992 . . . . 16.66 1994 . . . . 15.72 1996 . . . . 17.95 1998 34.33 34.98 56.06 . 19.88 2000 36.05 36.61 55.92 . 19.03 2002 34.40 35.80 54.90 . 18.70 2004 35.93 37.01 52.93 .
Source: own, based on National Survey on Income and Household Expenses
Table A10.2. Mexico. Coverage Rates of the Employed Person, by Age
Year 20-29 30-39 40-49 50-59 60-69 1998 40.25 39.94 32.98 25.37 11.77 2000 43.20 40.34 36.44 26.04 14.91 2002 39.34 39.83 35.54 27.33 17.11 2004 39.77 41.43 38.08 28.53 13.76
Source: own, based on National Survey on Income and Household Expenses
Table A10.3. Mexico. Coverage Rates of the Elderly , by Age
Year 60-64 65-69 70-74 75-79 1992 14.64 21.01 15.67 15.06 1994 16.69 16.56 15.44 13.39 1996 18.33 15.23 22.24 16.93 1998 17.89 22.56 21.30 18.92 2000 20.12 17.04 23.91 15.97 2002 18.82 19.44 21.16 15.09
Source: own, based on National Survey on Income and Household Expenses
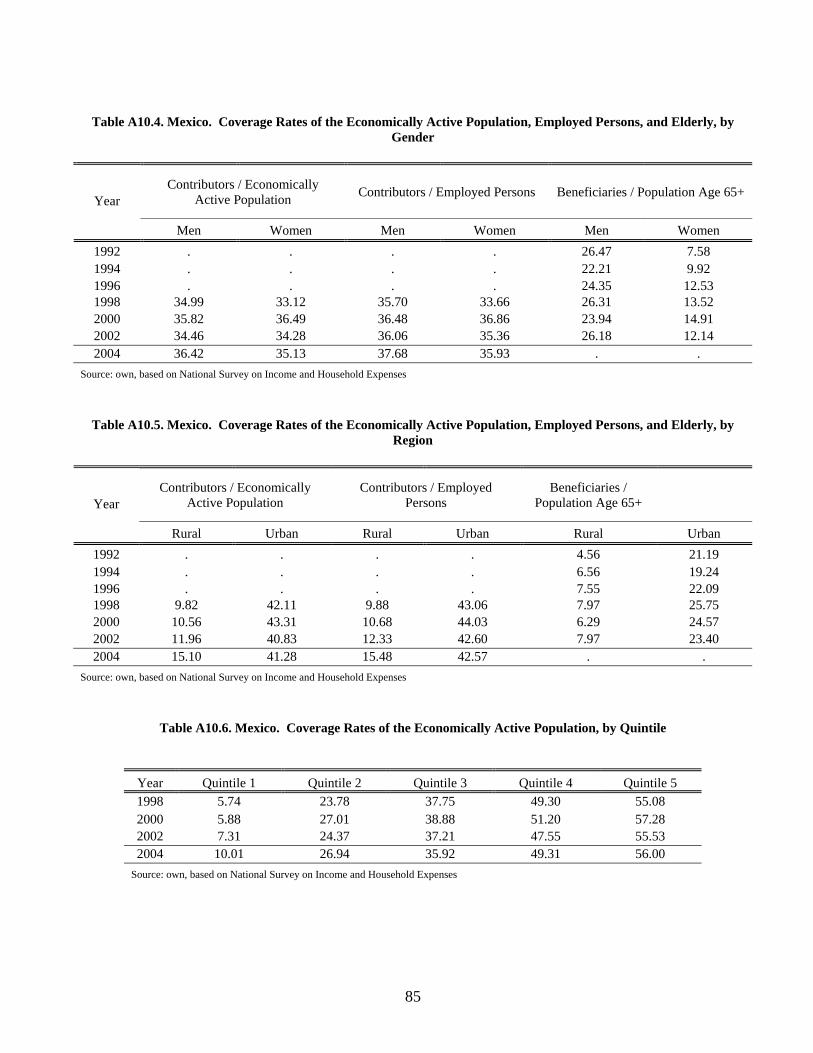
85
Table A10.4. Mexico. Coverage Rates of the Economically Active Population, Employed Persons, and Elderly, by
Gender
Contributors / Economically Active Population Contributors / Employed Persons Beneficiaries / Population Age 65+
Year
Men Women Men Women Men Women 1992 . . . . 26.47 7.58 1994 . . . . 22.21 9.92 1996 . . . . 24.35 12.53 1998 34.99 33.12 35.70 33.66 26.31 13.52 2000 35.82 36.49 36.48 36.86 23.94 14.91 2002 34.46 34.28 36.06 35.36 26.18 12.14 2004 36.42 35.13 37.68 35.93 . .
Source: own, based on National Survey on Income and Household Expenses
Table A10.5. Mexico. Coverage Rates of the Economically Active Population, Employed Persons, and Elderly, by Region
Contributors / Economically Active Population
Contributors / Employed Persons
Beneficiaries / Population Age 65+
Year
Rural Urban Rural Urban Rural Urban 1992 . . . . 4.56 21.19 1994 . . . . 6.56 19.24 1996 . . . . 7.55 22.09 1998 9.82 42.11 9.88 43.06 7.97 25.75 2000 10.56 43.31 10.68 44.03 6.29 24.57 2002 11.96 40.83 12.33 42.60 7.97 23.40 2004 15.10 41.28 15.48 42.57 . .
Source: own, based on National Survey on Income and Household Expenses
Table A10.6. Mexico. Coverage Rates of the Economically Active Population, by Quintile
Year Quintile 1 Quintile 2 Quintile 3 Quintile 4 Quintile 5 1998 5.74 23.78 37.75 49.30 55.08 2000 5.88 27.01 38.88 51.20 57.28 2002 7.31 24.37 37.21 47.55 55.53 2004 10.01 26.94 35.92 49.31 56.00
Source: own, based on National Survey on Income and Household Expenses

86
Table A10.7. Mexico. Coverage Rates of the Employed Persons, by Quintile
Year Quintile 1 Quintile 2 Quintile 3 Quintile 4 Quintile 5 1998 5.85 24.50 38.64 50.15 55.74 2000 6.00 27.96 38.90 52.60 57.61 2002 7.94 25.64 38.94 48.78 57.68 2004 10.72 27.88 37.51 50.24 56.82
Source: own, based on National Survey on Income and Household Expenses
Table A10.8. Mexico. Coverage Rates of the Elderly, by Quintile Year Quintile 1 Quintile 2 Quintile 3 Quintile 4 Quintile 5 1992 2.56 15.36 19.15 20.73 25.48 1994 1.40 6.14 17.08 21.86 32.18 1996 0.86 8.25 18.26 28.85 33.71 1998 1.16 7.56 22.58 32.47 35.59 2000 2.15 9.42 16.69 29.29 37.66 2002 2.97 12.78 18.65 28.97 30.13
Source: own, based on National Survey on Income and Household Expenses
Table A10.9. Mexico. Coverage Rates of the Employed, by Field of Activity
Field of Activity Year
Primary Secondary Tertiary 1998 4.52 57.55 37.67 2000 7.99 46.43 40.91 2002 8.67 44.72 39.89 2004 9.35 47.37 38.85
Source: own, based on National Survey on Income and Household Expenses
Table A10.10. Mexico - Coverage Rates of the Employed, by Sizes of Establishments
Sizes of Establishments Year Small Medium Large
1998 7.08 57.35 88.66 2000 7.11 57.34 88.15 2002 6.66 55.63 88.02 2004 8.09 45.67 77.91
Source: own, based on National Survey on Income and Household Expenses

87
Table A10.11. Mexico - Coverage Rates of the
Employed, by Sector
Sector Year Public Private
1998 85.16 48.98 2000 87.34 48.75 2002 85.54 47.74 2004 . .
Source: own, based on National Survey on Income and Household Expenses
Table A10.12. Mexico. Coverage Rates of the Active Population and Employed, by Education
Contributors / Economically Active Population Contributors / Employed Persons Year Primary Secondary Superior Primary Secondary Superior
1992 . . . . . . 1994 . . . . . . 1996 . . . . . . 1998 17.00 49.54 58.81 17.17 50.74 61.12 2000 17.55 48.12 61.91 17.72 49.07 63.23 2002 16.78 45.57 58.68 17.47 47.09 62.06 2004 16.86 44.11 57.37 17.25 45.68 59.31
Source: own, based on National Survey on Income and Household Expenses
Table A10.13. Mexico. Coverage Rates of the Elderly, by Education
Beneficiaries / Population Age 65+
Year Primary Secondary Superior
1992 14.50 43.86 33.76 1994 13.45 50.26 46.29 1996 15.53 43.86 50.31 1998 16.83 45.22 58.92 2000 15.72 52.05 50.49 2002 15.52 39.13 57.05
Source: own, based on National Survey on Income and Household Expenses

88
Table A10.14. Mexico. Rate of Total Household Income from
Pensions to Total Household Income, by Type of Family
Year Only Elderly Youth and Elderly
At Least one Elderly
1992 82.15 38.36 48.95 1994 74.71 41.00 49.53 1996 71.82 40.43 49.05 1998 82.46 44.27 54.29 2000 81.52 39.82 51.87 2002 73.75 41.92 50.81
Source: own, based on National Survey on Income and Household Expenses
Table A10.15. Mexico. Other Definitions of Pensions
Year Definition (1) Definition (2)
1992 22.85 56.22 1994 20.94 59.93 1996 23.27 60.28 1998 25.20 64.88 2000 24.27 62.33 2002 25.01 66.23
Note: Definition (1) refers to the “Joint Coverage” which represents the percentage of the elderly who reside in a household in which at least one social security benefit is received. On the other hand, Definition (2) refers to the percentage of the elderly who reside in a household in which at least one social security benefit is received or one person over 65 years of age is occupied. Source: own, based on National Survey on Income and Household Expenses

89
11. Nicaragua
Table A11.1. Nicaragua. Coverage Rates of the Economically Active Population and Elderly, Alternative Indicators
Year
Contributors / Economically
Active Population
Contributors / Employed Persons
Contributors / Wage-Earners
Contributors / Employers - Independent
Beneficiaries / Population Age
65+
1993 24.38 27.51 44.90 6.98 . 1998 18.01 18.54 32.86 1.24 . 2001 18.78 19.43 36.04 0.85 .
Source: own, based on National Household Survey to Measure the Standard of Living
Table A11.2. Nicaragua. Coverage Rates of the Employed Person, by Age
Year 20-29 30-39 40-49 50-59 60-69
1993 28.87 32.33 26.39 20.90 16.03 1998 18.21 22.15 21.24 15.61 6.34 2001 21.14 22.63 20.30 15.63 7.34
Source: own, based on National Household Survey to Measure the Standard of Living
Table A11.3. Nicaragua. Coverage Rates of the Economically Active Population, Employed Persons, and Elderly, by Gender
Contributors / Economically Active Population Contributors / Employed Persons
Year
Men Women Men Women 1993 22.46 27.88 25.64 30.79 1998 16.64 20.46 17.10 21.14 2001 16.97 21.78 17.53 22.61
Source: own, based on National Household Survey to Measure the Standard of Living
Table A11.4. Nicaragua. Coverage Rates of the Economically Active Population, Employed Persons, and Elderly, by Region
Contributors / Economically Active Population Contributors / Employed Persons
Year
Rural Urban Rural Urban 1993 11.36 32.10 12.10 37.50 1998 8.81 24.51 8.93 25.50 2001 8.03 25.10 8.16 26.25
Source: own, based on National Household Survey to Measure the Standard of Living
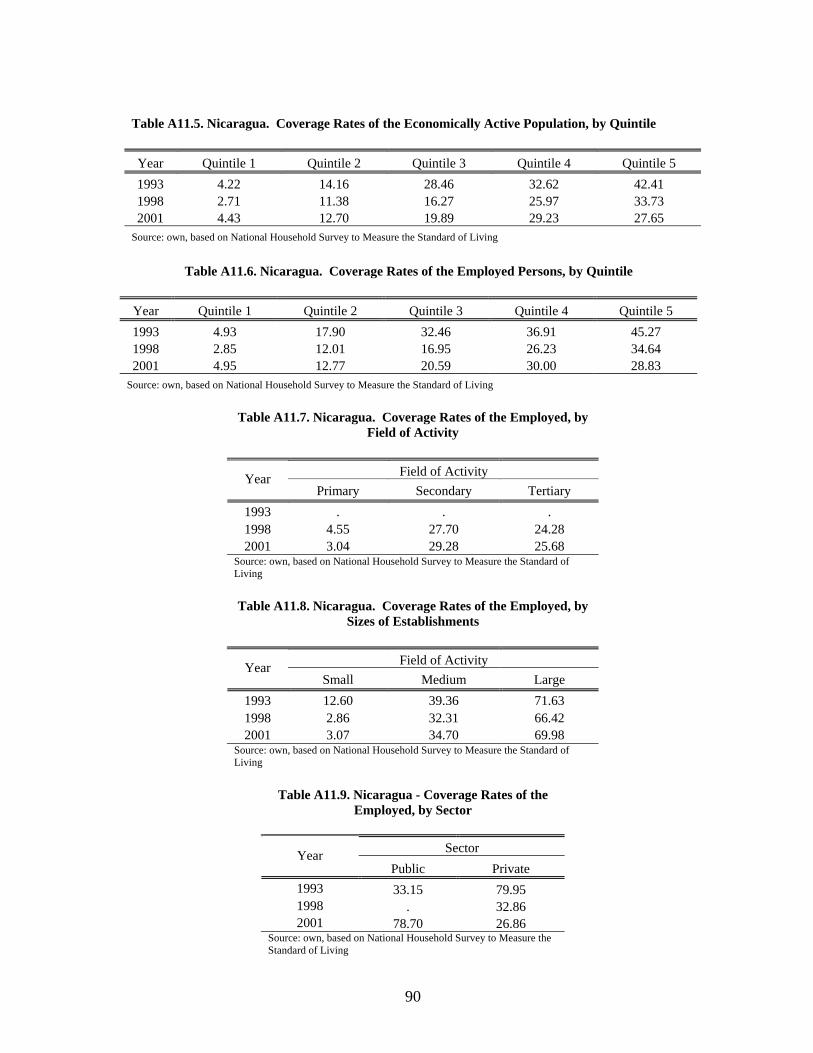
90
Table A11.5. Nicaragua. Coverage Rates of the Economically Active Population, by Quintile Year Quintile 1 Quintile 2 Quintile 3 Quintile 4 Quintile 5 1993 4.22 14.16 28.46 32.62 42.41 1998 2.71 11.38 16.27 25.97 33.73 2001 4.43 12.70 19.89 29.23 27.65
Source: own, based on National Household Survey to Measure the Standard of Living
Table A11.6. Nicaragua. Coverage Rates of the Employed Persons, by Quintile Year Quintile 1 Quintile 2 Quintile 3 Quintile 4 Quintile 5 1993 4.93 17.90 32.46 36.91 45.27 1998 2.85 12.01 16.95 26.23 34.64 2001 4.95 12.77 20.59 30.00 28.83
Source: own, based on National Household Survey to Measure the Standard of Living
Table A11.7. Nicaragua. Coverage Rates of the Employed, by Field of Activity
Field of Activity Year
Primary Secondary Tertiary 1993 . . . 1998 4.55 27.70 24.28 2001 3.04 29.28 25.68
Source: own, based on National Household Survey to Measure the Standard of Living
Table A11.8. Nicaragua. Coverage Rates of the Employed, by
Sizes of Establishments
Field of Activity Year Small Medium Large
1993 12.60 39.36 71.63 1998 2.86 32.31 66.42 2001 3.07 34.70 69.98
Source: own, based on National Household Survey to Measure the Standard of Living
Table A11.9. Nicaragua - Coverage Rates of the
Employed, by Sector
Sector Year Public Private
1993 33.15 79.95 1998 . 32.86 2001 78.70 26.86
Source: own, based on National Household Survey to Measure the Standard of Living

91
Table A. Nicaragua11.10. Coverage Rates of the Active Population and Employed, by Education
Contributors / Economically Active Population Contributors / Employed Persons Year Primary Secondary Superior Primary Secondary Superior
1993 14.57 40.33 59.99 16.26 46.43 70.05 1998 7.88 31.27 52.30 8.04 32.64 55.27 2001 8.46 29.75 53.37 8.64 31.57 56.33
Source: own, based on National Household Survey to Measure the Standard of Living
12. Panama
Table A12.1. Panama. Coverage Rates of the
Elderly
Year Beneficiaries / Population Age
65+
1991 35.55 1995 35.04 1996 36.87 1997 37.40 1998 40.53 1999 43.27 2000 44.97 2001 41.13 2002 42.52 2003 41.86
Source: own, based on Household Survey
Table A12.2. Panama. Coverage Rates of the Elderly , by Age
Year 60-64 65-69 70-74 75-79 1991 36.30 36.70 37.56 30.61 1995 35.45 37.04 36.25 30.78 1996 35.55 38.98 39.58 34.00 1997 37.17 38.84 40.39 33.56 1998 38.35 41.90 46.43 36.80 1999 41.14 45.30 48.71 39.44 2000 44.46 45.06 47.80 43.31 2001 41.18 41.60 41.16 40.44 2002 42.28 44.36 43.02 40.23 2003 43.87 40.73 41.88 40.06
Source: own, based on Household Survey

92
Table A12.3. Panama. Coverage Rates of
the Elderly, by Gender
Beneficiaries / Population Age 65+ Year
Men Women 1991 43.91 26.94 1995 44.70 26.21 1996 45.79 28.66 1997 44.92 30.30 1998 46.36 35.41 1999 51.32 35.86 2000 52.05 38.39 2001 50.00 32.58 2002 50.06 35.19 2003 48.72 35.04
Source: own, based on Household Survey
Table A12.4. Panama. Coverage Rates of the Elderly, by Region
Beneficiaries / Population Age 65+
Year
Rural Urban 1995 15.44 49.87 1996 14.92 52.42 1997 15.37 53.20 1998 16.25 55.47 1999 20.44 56.86 2000 20.57 58.57 2001 17.54 56.22 2002 17.64 58.55 2003 17.69 57.62
Source: own, based on Household Survey

93
Table A12.5. Panama. Coverage Rates of the Elderly, by Quintile
Year Quintile 1 Quintile 2 Quintile 3 Quintile 4 Quintile 5 1991 1.14 15.67 39.32 52.95 68.54 1995 1.98 17.27 34.94 51.94 69.23 1996 2.03 19.79 37.07 50.44 75.02 1997 2.78 19.72 34.04 55.69 73.57 1998 3.33 21.40 38.89 61.69 73.89 1999 4.96 25.66 42.79 66.04 75.21 2000 6.77 30.39 48.02 65.01 74.12 2001 5.51 22.57 43.01 59.31 74.57 2002 5.26 24.19 43.93 63.17 75.61 2003 5.16 24.18 42.39 63.13 73.96
Source: own, based on Household Survey
Table A12.6. Panama. Coverage Rates of the Active Population and Employed, by Education
Beneficiaries / Population Age 65+ Year
Primary Secondary Superior 1991 27.09 68.67 75.98 1995 25.46 67.02 87.23 1996 26.33 70.83 82.77 1997 26.56 66.75 85.48 1998 28.55 72.51 84.64 1999 30.63 70.73 84.98 2000 31.74 73.62 83.03 2001 30.95 72.68 87.32 2002 29.68 76.12 92.33 2003 29.30 72.78 86.89
Source: own, based on Household Survey
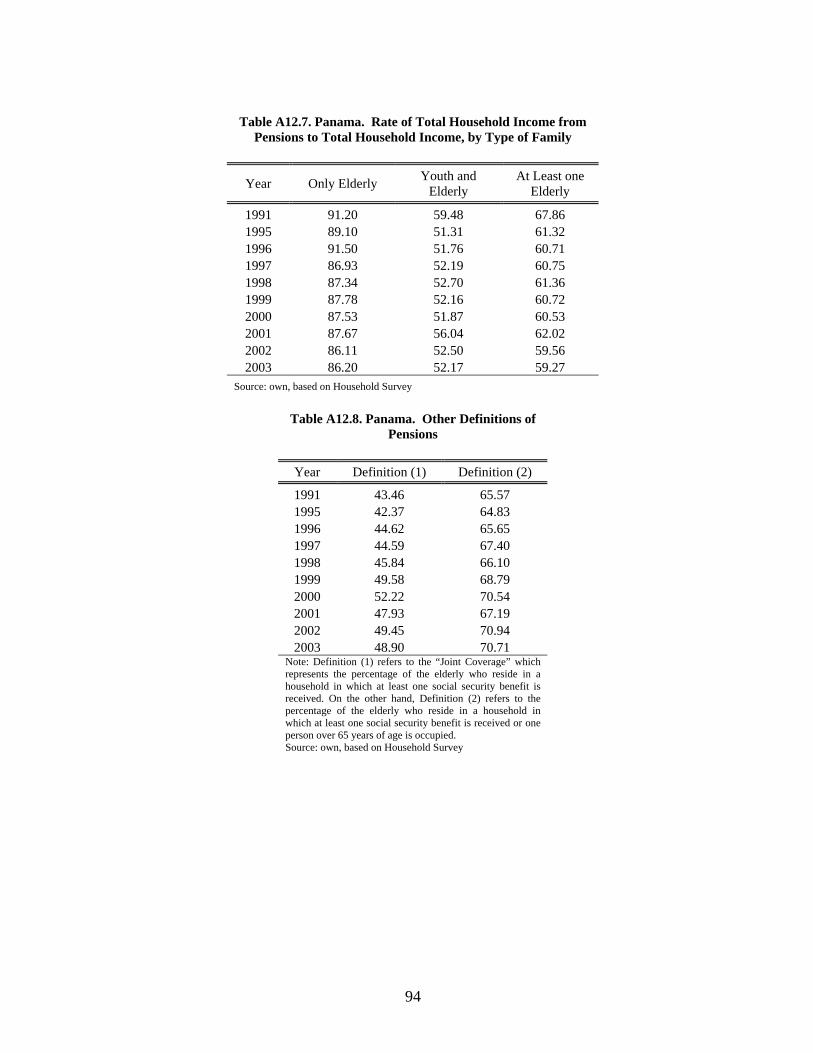
94
Table A12.7. Panama. Rate of Total Household Income from
Pensions to Total Household Income, by Type of Family
Year Only Elderly Youth and Elderly
At Least one Elderly
1991 91.20 59.48 67.86 1995 89.10 51.31 61.32 1996 91.50 51.76 60.71 1997 86.93 52.19 60.75 1998 87.34 52.70 61.36 1999 87.78 52.16 60.72 2000 87.53 51.87 60.53 2001 87.67 56.04 62.02 2002 86.11 52.50 59.56 2003 86.20 52.17 59.27
Source: own, based on Household Survey
Table A12.8. Panama. Other Definitions of Pensions
Year Definition (1) Definition (2)
1991 43.46 65.57 1995 42.37 64.83 1996 44.62 65.65 1997 44.59 67.40 1998 45.84 66.10 1999 49.58 68.79 2000 52.22 70.54 2001 47.93 67.19 2002 49.45 70.94 2003 48.90 70.71
Note: Definition (1) refers to the “Joint Coverage” which represents the percentage of the elderly who reside in a household in which at least one social security benefit is received. On the other hand, Definition (2) refers to the percentage of the elderly who reside in a household in which at least one social security benefit is received or one person over 65 years of age is occupied. Source: own, based on Household Survey

95
13. Paraguay
Table A13.1. Paraguay. Coverage Rates of the Economically Active Population and Elderly
Year
Contributors / Economically
Active Population
Contributors / Employed Persons
Contributors / Wage-Earners
Contributors / Employers - Independent
Beneficiaries / Population Age
65+
1999 14.36 15.23 30.85 1.34 17.39 2000 13.85 14.79 32.49 0.01 19.60 2002 12.94 14.24 30.92 1.21 15.81 2003 12.98 13.94 29.48 1.27 16.55 2004 11.56 12.35 27.25 0.51 14.91
Source: own, based on Integrated Household Survey
Table A13.2. Paraguay. Coverage Rates of the Employed Person, byAge
Year 20-29 30-39 40-49 50-59 60-69
1999 15.53 16.20 15.87 15.76 9.82 2000 15.66 19.04 15.51 10.32 5.56 2002 13.36 16.86 16.38 11.98 8.95 2003 12.63 17.62 14.42 12.88 7.73 2004 12.04 15.50 12.94 10.76 7.32
Source: own, based on Integrated Household Survey
Table A13.3. Paraguay. Coverage Rates of the Elderly , by Age
Year 60-64 65-69 70-74 75-79 1999 12.31 10.15 16.02 37.64 2000 14.95 12.35 19.65 37.36 2002 8.39 15.82 12.38 31.95 2003 10.89 13.68 15.11 29.87 2004 10.25 13.31 15.34 24.89
Source: own, based on Integrated Household Survey
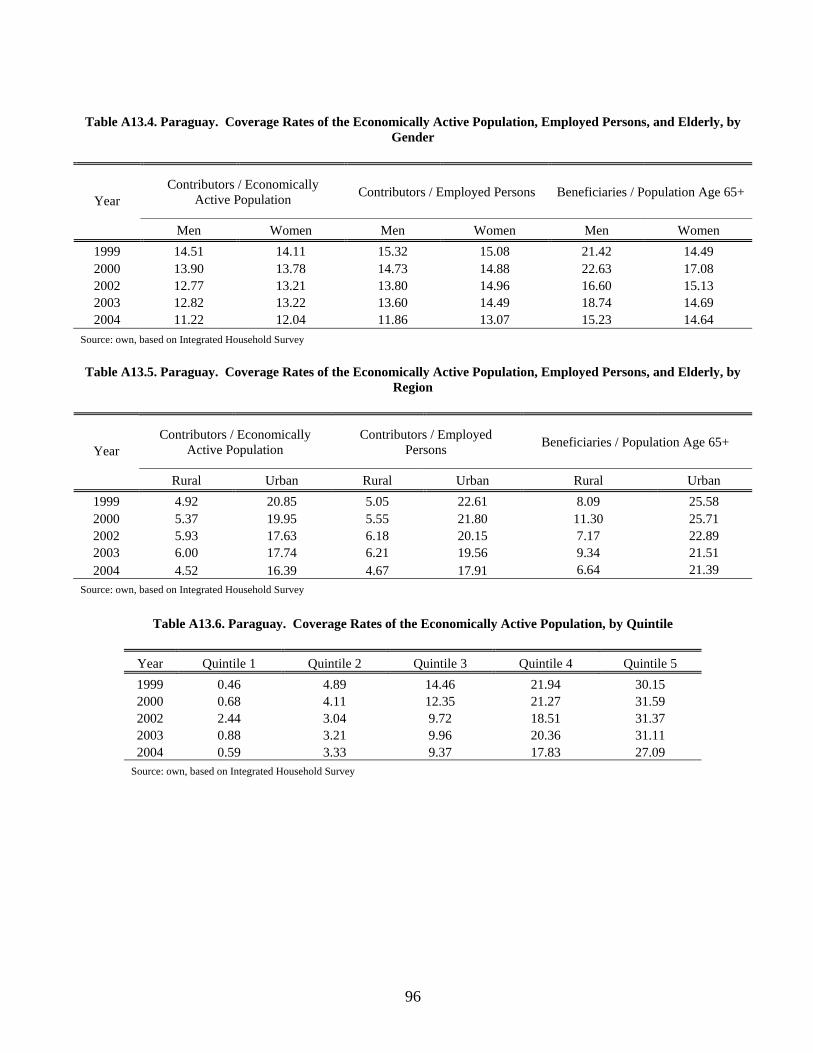
96
Table A13.4. Paraguay. Coverage Rates of the Economically Active Population, Employed Persons, and Elderly, by
Gender
Contributors / Economically Active Population Contributors / Employed Persons Beneficiaries / Population Age 65+
Year
Men Women Men Women Men Women 1999 14.51 14.11 15.32 15.08 21.42 14.49 2000 13.90 13.78 14.73 14.88 22.63 17.08 2002 12.77 13.21 13.80 14.96 16.60 15.13 2003 12.82 13.22 13.60 14.49 18.74 14.69 2004 11.22 12.04 11.86 13.07 15.23 14.64
Source: own, based on Integrated Household Survey
Table A13.5. Paraguay. Coverage Rates of the Economically Active Population, Employed Persons, and Elderly, by Region
Contributors / Economically Active Population
Contributors / Employed Persons Beneficiaries / Population Age 65+
Year
Rural Urban Rural Urban Rural Urban 1999 4.92 20.85 5.05 22.61 8.09 25.58 2000 5.37 19.95 5.55 21.80 11.30 25.71 2002 5.93 17.63 6.18 20.15 7.17 22.89 2003 6.00 17.74 6.21 19.56 9.34 21.51 2004 4.52 16.39 4.67 17.91 6.64 21.39
Source: own, based on Integrated Household Survey
Table A13.6. Paraguay. Coverage Rates of the Economically Active Population, by Quintile Year Quintile 1 Quintile 2 Quintile 3 Quintile 4 Quintile 5 1999 0.46 4.89 14.46 21.94 30.15 2000 0.68 4.11 12.35 21.27 31.59 2002 2.44 3.04 9.72 18.51 31.37 2003 0.88 3.21 9.96 20.36 31.11 2004 0.59 3.33 9.37 17.83 27.09
Source: own, based on Integrated Household Survey

97
Table A13.7. Paraguay. Coverage Rates of the Employed Persons, by Quintile
Year Quintile 1 Quintile 2 Quintile 3 Quintile 4 Quintile 5 1999 0.49 5.33 15.47 23.91 31.04 2000 0.73 4.43 13.66 23.23 32.75 2002 2.68 3.60 11.71 21.09 32.57 2003 0.95 3.60 11.19 22.26 32.45 2004 0.60 3.70 10.11 19.53 28.28
Source: own, based on Integrated Household Survey
Table A13.8. Paraguay. Coverage Rates of the Elderly, by Quintile Year Quintile 1 Quintile 2 Quintile 3 Quintile 4 Quintile 5 1999 . 4.78 18.42 20.64 42.95 2000 2.73 2.52 18.55 27.89 46.20 2002 2.35 3.35 9.24 22.55 41.28 2003 0.83 5.43 16.46 22.53 37.50 2004 1.03 4.54 7.78 23.06 37.85
Source: own, based on Integrated Household Survey
Table A13.9. Paraguay. Coverage Rates of the Employed, by Field of Activity
Field of Activity Year
Primary Secondary Tertiary 1999 0.88 16.83 22.16 2000 1.41 15.38 22.12 2002 1.71 13.50 22.13 2003 1.52 13.03 21.21 2004 1.23 11.33 19.26
Source: own, based on Integrated Household Survey
Table A13.10. Paraguay. Coverage Rates of the Employed, by Sizes of Establishments
Sizes of Establishments Year
Primary Secondary Tertiary 1999 4.08 30.83 68.23 2000 2.46 41.67 66.79 2002 3.55 34.42 65.50 2003 3.52 37.96 62.80 2004 2.67 34.44 63.25
Source: own, based on Integrated Household Survey

98
Table A13.11. Paraguay - Coverage Rates of the
Employed, by Sector
Sector Year Public Private
1999 77.16 22.81 2000 82.20 25.45 2002 81.04 19.86 2003 81.73 18.03 2004 80.67 17.51
Source: own, based on Integrated Household Survey
Table A13.12. Paraguay. Coverage Rates of the Active Population and Employed, by Education
Contributors / Economically Active Population Contributors / Employed Persons Year Primary Secondary Superior Primary Secondary Superior
1999 5.05 20.18 46.22 5.33 21.73 48.11 2000 4.35 17.28 46.80 4.58 19.04 49.75 2002 4.81 15.48 48.38 5.21 17.61 52.89 2003 4.17 13.22 45.21 4.40 14.58 48.82 2004 3.18 13.03 41.96 3.35 14.20 45.45
Source: own, based on Integrated Household Survey
Table A13.13. Paraguay. Coverage Rates of the Active Population and Employed, by Education
Beneficiaries / Population Age 65+ Year
Primary Secondary Superior 1999 13.84 41.35 67.63 2000 15.96 27.32 66.09 2002 12.35 35.84 61.91 2003 12.18 36.40 51.39 2004 11.91 30.79 53.10
Source: own, based on Integrated Household Survey
Table A13.14. Paraguay. Rate of Total Household Income from Pensions to Total Household Income, by Type of Family
Year Only Elderly Youth and Elderly
At Least one Elderly
1999 85.02 54.29 60.38 2000 70.36 49.49 53.80 2002 88.97 52.37 60.87 2003 76.62 55.07 58.68 2004 87.38 56.10 62.65
Source: own, based on Integrated Household Survey

99
Table A13.15. Paraguay. Other Definitions of Pensions
Year Definition (1) Definition (2)
1999 22.07 61.72 2000 25.73 63.01 2002 19.98 61.98 2003 21.44 60.54 2004 18.73 62.66
Note: Definition (1) refers to the “Joint Coverage” which represents the percentage of the elderly who reside in a household in which at least one social security benefit is received. On the other hand, Definition (2) refers to the percentage of the elderly who reside in a household in which at least one social security benefit is received or one person over 65 years of age is occupied. Source: own, based on Integrated Household Survey
14. Peru
Table A14.1. Peru. Coverage Rates of the Economically Active Population and Elderly
Year
Contributors / Economically
Active Population
Contributors / Employed Persons
Contributors / Wage-Earners
Contributors / Employers - Independent
Beneficiaries / Population Age
65+
1998 . . . . 29.85 1999 10.81 11.51 26.61 1.08 31.52 2000 10.46 11.16 26.02 1.61 28.40 2001 13.70 14.24 30.41 3.16 25.91 2002 13.88 14.41 31.29 2.69 25.74 2003 14.83 15.24 33.35 3.68 26.19
Source: own, based on National Household Survey
Table A14.2. Peru. Coverage Rates of the Employed Person, by Age
Year 20-29 30-39 40-49 50-59 60-69
1999 11.46 14.19 13.88 10.69 3.28 2000 11.47 16.62 12.67 5.06 2.77 2001 10.90 16.35 17.06 14.77 12.30 2002 10.33 16.91 17.88 16.92 10.29 2003 10.49 17.30 18.39 19.16 12.69
Source: own, based on National Household Survey

100
Table A14.3. Peru. Coverage Rates of the Elderly , by Age
Year 60-64 65-69 70-74 75-79 1998 25.38 29.01 35.95 33.19 1999 23.96 33.32 38.81 35.36 2000 24.07 32.20 37.03 22.55 2001 22.24 30.30 30.74 22.41 2002 21.03 29.99 30.07 24.15 2003 21.58 28.62 27.34 29.02
Source: own, based on National Household Survey
Table A14.4. Peru. Coverage Rates of the Economically Active Population, Employed Persons, and Elderly, by Gender
Contributors / Economically Active Population Contributors / Employed Persons Beneficiaries / Population Age 65+
Year
Men Women Men Women Men Women 1998 . . . . 38.91 21.66 1999 12.09 9.27 12.51 10.24 40.78 22.52 2000 12.11 8.50 12.62 9.36 38.84 18.58 2001 16.48 10.25 16.64 11.11 34.02 18.14 2002 16.52 10.62 16.78 11.37 35.01 17.42 2003 18.56 10.31 18.74 10.83 34.49 18.62
Source: own, based on National Household Survey
Table A14.5. Peru. Coverage Rates of the Economically Active Population, Employed Persons, and Elderly, by Region
Contributors / Economically Active Population
Contributors / Employed Persons
Beneficiaries / Population Age 65+
Year
Rural Urban Rural Urban Rural Urban 1998 . . . . 6.73 41.97 1999 1.92 15.05 1.99 16.37 9.63 42.10 2000 1.63 14.91 1.64 16.39 5.09 40.67 2001 3.06 19.16 3.09 20.46 5.21 37.22 2002 3.73 19.07 3.79 20.32 4.74 37.01 2003 3.78 20.74 3.85 21.85 5.72 38.80
Source: own, based on National Household Survey

101
Table A14.6. Peru. Coverage Rates of the Economically Active Population, by Quintile
Year Quintile 1 Quintile 2 Quintile 3 Quintile 4 Quintile 5 1999 0.40 4.59 8.60 13.54 27.80 2000 0.94 4.00 9.32 14.28 24.13 2001 1.43 4.39 10.03 20.13 33.09 2002 0.89 4.86 10.85 19.70 33.53 2003 1.58 4.83 11.32 20.72 36.25
Source: own, based on National Household Survey
Table A14.7. Peru. Coverage Rates of the Employed Persons, by Quintile Year Quintile 1 Quintile 2 Quintile 3 Quintile 4 Quintile 5 1999 0.33 4.99 9.25 14.31 29.65 2000 0.80 3.78 9.91 15.03 26.72 2001 1.06 4.23 10.71 21.24 34.54 2002 0.63 4.84 11.53 20.68 34.85 2003 1.31 4.71 11.59 21.48 37.71
Source: own, based on National Household Survey
Table A14.8. Peru. Coverage Rates of the Elderly, by Quintile Year Quintile 1 Quintile 2 Quintile 3 Quintile 4 Quintile 5 1998 4.02 10.69 29.75 43.94 61.86 1999 2.59 18.00 24.76 45.13 67.35 2000 2.58 15.39 26.78 34.43 61.32 2001 2.12 10.35 23.83 40.70 53.40 2002 0.85 8.27 23.32 40.42 56.49 2003 0.95 8.27 22.22 41.51 58.46
Source: own, based on National Household Survey
Table A14.9. Peru. Coverage Rates of the Employed, by Field of Activity
Field of Activity Year
Primary Secondary Tertiary 1999 2.05 15.45 15.95 2000 1.57 13.81 16.16 2001 3.04 17.22 21.06 2002 3.33 16.56 21.53 2003 4.40 21.72 21.68
Source: own, based on National Household Survey
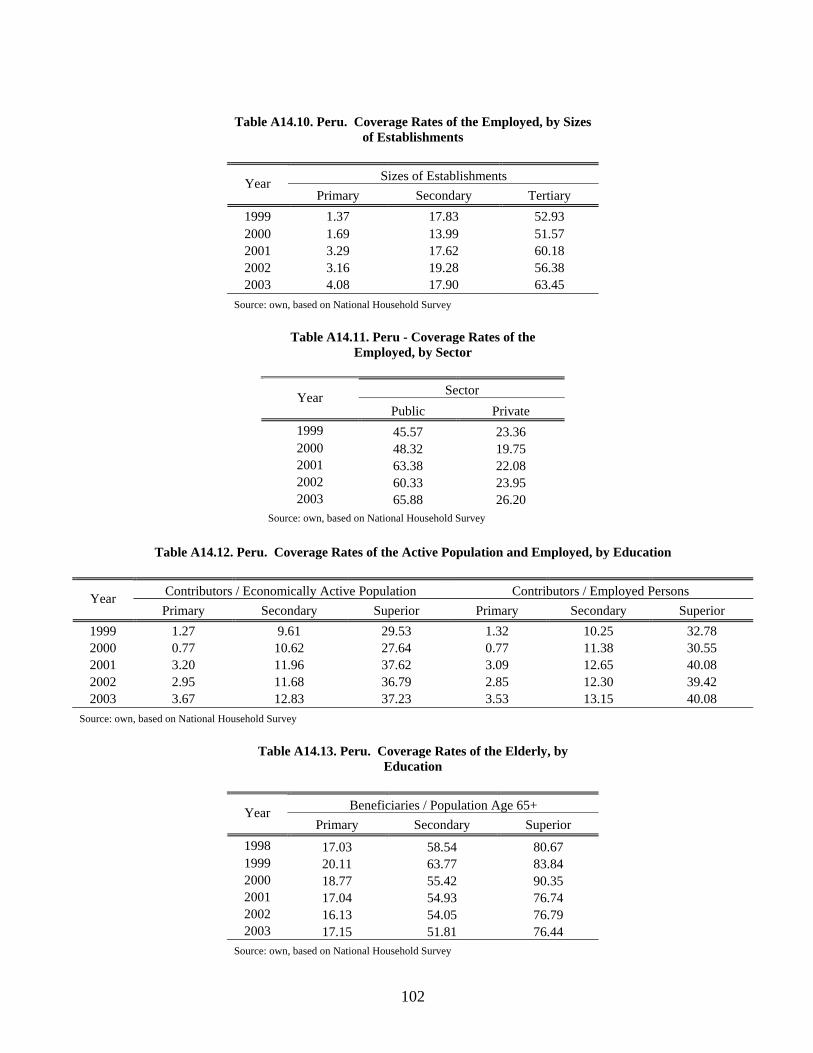
102
Table A14.10. Peru. Coverage Rates of the Employed, by Sizes
of Establishments
Sizes of Establishments Year Primary Secondary Tertiary
1999 1.37 17.83 52.93 2000 1.69 13.99 51.57 2001 3.29 17.62 60.18 2002 3.16 19.28 56.38 2003 4.08 17.90 63.45
Source: own, based on National Household Survey
Table A14.11. Peru - Coverage Rates of the Employed, by Sector
Sector Year
Public Private 1999 45.57 23.36 2000 48.32 19.75 2001 63.38 22.08 2002 60.33 23.95 2003 65.88 26.20
Source: own, based on National Household Survey
Table A14.12. Peru. Coverage Rates of the Active Population and Employed, by Education
Contributors / Economically Active Population Contributors / Employed Persons Year Primary Secondary Superior Primary Secondary Superior
1999 1.27 9.61 29.53 1.32 10.25 32.78 2000 0.77 10.62 27.64 0.77 11.38 30.55 2001 3.20 11.96 37.62 3.09 12.65 40.08 2002 2.95 11.68 36.79 2.85 12.30 39.42 2003 3.67 12.83 37.23 3.53 13.15 40.08
Source: own, based on National Household Survey
Table A14.13. Peru. Coverage Rates of the Elderly, by Education
Beneficiaries / Population Age 65+ Year
Primary Secondary Superior 1998 17.03 58.54 80.67 1999 20.11 63.77 83.84 2000 18.77 55.42 90.35 2001 17.04 54.93 76.74 2002 16.13 54.05 76.79 2003 17.15 51.81 76.44
Source: own, based on National Household Survey

103
Table A14.14. Peru. Rate of Total Household Income from
Pensions to Total Household Income, by Type of Family
Year Only Elderly Youth and Elderly
At Least one Elderly
1998 46.25 23.35 27.22 1999 47.55 27.67 31.31 2000 50.47 30.68 34.44 2001 52.48 32.54 35.41 2002 51.03 30.95 33.88 2003 52.21 33.09 36.58
Source: own, based on National Household Survey
Table A14.15. Peru. Other Definitions of Pensions
Year Definition (1) Definition (2)
1998 37.28 76.30 1999 38.83 77.33 2000 35.56 74.43 2001 33.17 74.48 2002 32.79 75.82 2003 32.35 76.01
Note: Definition (1) refers to the “Joint Coverage” which represents the percentage of the elderly who reside in a household in which at least one social security benefit is received. On the other hand, Definition (2) refers to the percentage of the elderly who reside in a household in which at least one social security benefit is received or one person over 65 years of age is occupied. Source: own, based on National Household Survey
15. El Salvador
Table A15.1. El Salvador. Coverage Rates of the Economically Active Population and Elderly
Year
Contributors / Economically
Active Population
Contributors / Employed Persons
Contributors / Wage-Earners
Contributors / Employers - Independent
Beneficiaries / Population Age
65+
1995 25.84 27.46 47.47 0.97 . 1996 25.10 26.79 44.02 3.25 . 1997 26.19 28.10 46.33 2.88 12.35 1998 30.28 32.43 51.78 2.26 11.96 1999 31.06 33.05 52.26 2.19 13.91 2000 29.68 31.60 52.96 1.84 14.49 2001 29.68 31.74 51.90 2.19 14.47 2002 29.79 31.60 53.94 1.23 15.72 2003 29.75 31.79 51.37 1.65 13.88
Source: own, based on Multi-Purpose Household Survey

104
Table A15.2. El Salvador. Coverage Rates of the Employed Person, by Age
Year 20-29 30-39 40-49 50-59 60-69
1995 34.88 32.31 24.82 17.97 10.05 1996 33.45 30.22 26.30 19.34 8.82 1997 34.58 33.22 24.57 23.31 9.46 1998 38.16 37.93 30.74 22.19 14.25 1999 38.84 39.43 31.39 23.27 16.17 2000 37.31 36.80 31.43 24.48 13.26 2001 36.79 37.72 30.89 24.57 12.66 2002 36.80 37.70 31.96 23.08 12.15 2003 36.98 37.68 28.18 24.66 13.60
Source: own, based on Multi-Purpose Household Survey
Table A15.3. El Salvador. Coverage Rates of the Elderly , by Age
Year 60-64 65-69 70-74 75-79 1997 12.63 14.39 12.72 9.19 1998 15.15 10.39 10.11 9.84 1999 15.58 13.96 12.99 12.20 2000 15.18 16.05 14.63 11.52 2001 15.37 17.54 13.83 10.25 2002 16.46 16.49 18.23 11.95 2003 13.79 16.38 13.35 11.40
Source: own, based on Multi-Purpose Household Survey
Table A15.4. El Salvador. Coverage Rates of the Economically Active Population, Employed Persons, and Elderly, by Gender
Contributors / Economically Active Population Contributors / Employed Persons Beneficiaries / Population Age 65+
Year
Men Women Men Women Men Women 1995 26.32 25.09 28.24 26.27 . . 1996 25.29 24.80 27.13 26.27 . . 1997 26.07 26.38 28.37 27.70 17.98 7.93 1998 31.08 29.10 33.57 30.78 15.26 9.34 1999 31.17 30.90 33.62 32.26 19.54 9.56 2000 29.51 29.92 32.06 30.96 20.34 9.95 2001 29.41 30.07 31.81 31.64 19.02 11.04 2002 29.12 30.71 31.51 31.72 21.97 11.03 2003 29.49 30.13 32.33 31.09 19.81 9.38
Source: own, based on Multi-Purpose Household Survey

105
Table A15.5. El Salvador. Coverage Rates of the Economically Active Population, Employed Persons, and Elderly,
by Region
Contributors / Economically Active Population
Contributors / Employed Persons
Beneficiaries / Population Age 65+
Year
Rural Urban Rural Urban Rural Urban 1995 10.34 35.03 11.01 37.17 . . 1996 10.24 33.96 10.93 36.25 . . 1997 11.04 34.94 11.91 37.37 3.41 18.34 1998 13.66 39.12 14.58 41.98 4.18 17.06 1999 13.28 40.39 14.12 43.01 4.63 19.56 2000 12.72 38.53 13.60 40.93 4.21 20.54 2001 13.14 38.38 14.07 41.02 5.98 19.51 2002 13.46 38.31 14.26 40.67 4.59 21.98 2003 13.59 38.20 14.73 40.51 3.89 20.00
Source: own, based on Multi-Purpose Household Survey
Table A15.6. El Salvador. Coverage Rates of the Economically Active Population, by Quintile Year Quintile 1 Quintile 2 Quintile 3 Quintile 4 Quintile 5 1995 4.27 15.13 24.01 35.22 51.34 1996 3.42 13.37 25.29 33.60 50.77 1997 4.41 14.80 24.73 36.02 52.07 1998 4.18 16.36 28.32 43.31 60.23 1999 4.43 16.45 30.93 42.46 61.79 2000 4.09 16.10 28.83 40.04 60.15 2001 6.45 14.49 28.50 39.41 60.26 2002 7.45 15.66 29.73 40.20 56.57 2003 11.16 17.07 29.13 37.95 54.26
Source: own, based on Multi-Purpose Household Survey
Table A15.7. El Salvador. Coverage Rates of the Employed Persons, by Quintile Year Quintile 1 Quintile 2 Quintile 3 Quintile 4 Quintile 5 1995 5.41 16.81 26.01 37.45 52.51 1996 4.06 15.66 26.02 36.50 52.81 1997 5.13 17.06 27.11 38.28 54.17 1998 5.06 18.47 31.54 45.45 62.75 1999 5.27 18.98 32.96 44.73 64.17 2000 5.25 18.26 30.80 42.86 61.75 2001 7.63 17.34 30.87 42.15 61.52 2002 8.44 18.28 31.67 42.67 57.69 2003 13.21 19.46 31.22 40.14 55.84
Source: own, based on Multi-Purpose Household Survey

106
Table A15.8. El Salvador. Coverage Rates of the Elderly, by Quintile
Year Quintile 1 Quintile 2 Quintile 3 Quintile 4 Quintile 5 1997 0.66 5.13 10.74 16.96 28.33 1998 0.62 4.25 8.67 17.62 28.63 1999 1.04 6.93 14.81 16.37 30.43 2000 1.16 5.98 11.88 17.08 36.51 2001 3.07 7.68 10.44 18.34 33.09 2002 1.17 6.07 14.71 22.03 34.70 2003 1.13 4.88 13.61 17.14 32.61
Source: own, based on Multi-Purpose Household Survey
Table A15.9. El Salvador. Coverage Rates of the Employed, by Field of Activity
Field of Activity Year
Primary Secondary Tertiary 1995 2.37 39.68 32.71 1996 2.02 37.73 33.39 1997 2.72 39.85 33.74 1998 3.80 46.12 37.84 1999 3.36 43.15 39.23 2000 3.50 42.29 36.65 2001 2.96 41.96 36.84 2002 3.01 43.14 35.56 2003 2.48 41.63 35.53
Source: own, based on Multi-Purpose Household Survey
Table A15.10. El Salvador. Coverage Rates of the Employed, by
Sizes of Establishments
Sizes of Establishments Year Primary Secondary Tertiary
1995 2.32 23.50 65.67 1996 4.47 23.60 55.95 1997 6.03 47.54 75.24 1998 5.05 46.38 82.01 1999 4.81 45.90 84.17 2000 4.26 41.47 84.57 2001 4.25 43.12 86.68 2002 4.22 45.75 86.82 2003 3.70 36.04 85.59
Source: own, based on Multi-Purpose Household Survey

107
Table A15.11. El Salvador - Coverage Rates of the
Employed, by Sector
Sector Year Public Private
1995 76.98 43.98 1996 65.07 43.25 1997 70.52 44.39 1998 87.95 48.39 1999 91.89 48.60 2000 92.04 48.49 2001 91.92 48.51 2002 92.62 50.65 2003 93.60 47.97
Source: own, based on Multi-Purpose Household Survey
Table A15.12. El Salvador. Coverage Rates of the Active Population and Employed, by Education
Contributors / Economically Active Population Contributors / Employed Persons Year Primary Secondary Superior Primary Secondary Superior
1995 15.81 50.53 62.93 16.75 54.72 66.48 1996 15.22 49.68 57.11 16.12 55.17 60.65 1997 15.31 51.45 60.15 16.35 56.50 64.29 1998 17.61 54.26 73.62 18.77 59.67 78.06 1999 17.25 55.67 74.44 18.25 60.64 79.35 2000 16.52 51.57 72.63 17.49 56.64 76.47 2001 15.57 52.70 73.19 16.64 57.26 76.59 2002 15.64 51.00 71.46 16.51 55.32 75.15 2003 15.60 50.06 73.27 16.66 54.30 76.80
Source: own, based on Multi-Purpose Household Survey
Table A15.13. El Salvador. Rate of Total Household Income from Pensions to Total Household Income, by Type of Family
Year Only Elderly Youth and Elderly
At Least one Elderly
1997 80.82 40.10 47.46 1998 67.85 37.54 44.42 1999 68.82 41.11 46.56 2000 73.98 37.61 46.35 2001 76.25 41.73 48.48 2002 74.79 43.56 50.93 2003 72.79 44.46 49.90
Source: own, based on Multi-Purpose Household Survey

108
Table A15.14. El Salvador. Other
Definitions of Pensions
Year Definition (1) Definition (2)
1997 15.81 50.86 1998 15.17 50.43 1999 17.89 52.62 2000 17.78 52.56 2001 17.92 51.60 2002 19.50 51.67 2003 17.62 47.88
Source: own, based on Multi-Purpose Household Survey
16. Uruguay
Table A16.1. Uruguay. Coverage Rates of the Economically Active Population and Elderly
Year
Contributors / Economically
Active Population
Contributors / Employed Persons
Contributors / Wage-Earners
Contributors / Employers - Independent
Beneficiaries / Population Age
65+
1995 55.47 59.54 75.03 20.56 87.62 1997 53.32 58.00 73.10 19.81 88.17 1998 54.33 58.44 74.01 18.57 87.44 1999 53.56 58.45 74.15 17.67 87.73 2000 52.93 58.67 74.05 16.01 87.49 2001 52.64 59.62 77.04 16.34 85.87 2002 51.80 59.80 77.76 15.95 87.09 2003 49.95 57.82 75.48 13.96 85.93 2004 51.43 57.35 74.02 16.23 85.97
Source: own, based on Ongoing Household Survey
Table A16.2. Uruguay. Coverage Rates of the Employed Person, by Age
Year 20-29 30-39 40-49 50-59 60-69
1995 61.83 64.40 60.64 59.22 42.75 1997 62.27 61.61 58.55 57.46 40.11 1998 60.02 63.93 59.73 57.89 37.93 1999 60.02 62.48 60.11 58.33 39.38 2000 59.75 61.86 60.21 59.25 43.83 2001 61.33 63.26 62.00 58.73 44.33 2002 60.08 63.45 62.25 59.18 47.21 2003 55.00 60.26 62.84 58.89 44.87 2004 53.92 61.20 60.79 58.52 47.85
Source: own, based on Ongoing Household Survey
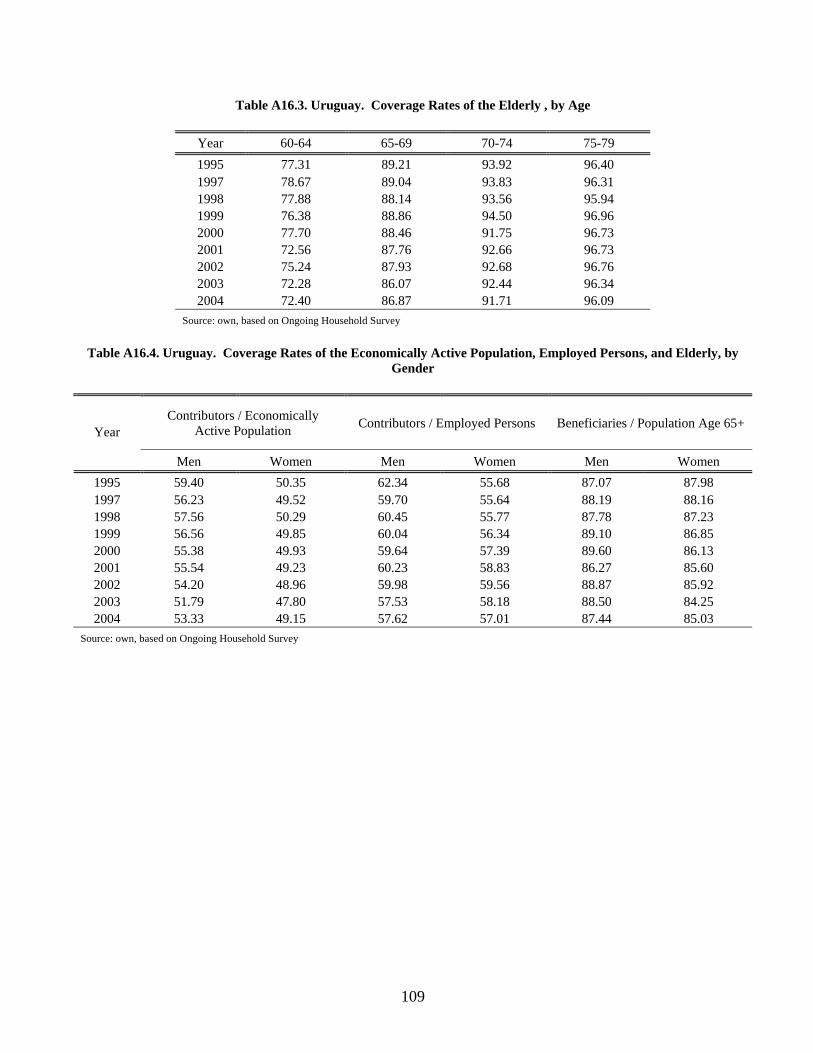
109
Table A16.3. Uruguay. Coverage Rates of the Elderly , by Age
Year 60-64 65-69 70-74 75-79 1995 77.31 89.21 93.92 96.40 1997 78.67 89.04 93.83 96.31 1998 77.88 88.14 93.56 95.94 1999 76.38 88.86 94.50 96.96 2000 77.70 88.46 91.75 96.73 2001 72.56 87.76 92.66 96.73 2002 75.24 87.93 92.68 96.76 2003 72.28 86.07 92.44 96.34 2004 72.40 86.87 91.71 96.09
Source: own, based on Ongoing Household Survey
Table A16.4. Uruguay. Coverage Rates of the Economically Active Population, Employed Persons, and Elderly, by Gender
Contributors / Economically Active Population Contributors / Employed Persons Beneficiaries / Population Age 65+
Year
Men Women Men Women Men Women 1995 59.40 50.35 62.34 55.68 87.07 87.98 1997 56.23 49.52 59.70 55.64 88.19 88.16 1998 57.56 50.29 60.45 55.77 87.78 87.23 1999 56.56 49.85 60.04 56.34 89.10 86.85 2000 55.38 49.93 59.64 57.39 89.60 86.13 2001 55.54 49.23 60.23 58.83 86.27 85.60 2002 54.20 48.96 59.98 59.56 88.87 85.92 2003 51.79 47.80 57.53 58.18 88.50 84.25 2004 53.33 49.15 57.62 57.01 87.44 85.03
Source: own, based on Ongoing Household Survey

110
Table A16.5. Uruguay. Coverage Rates of the Economically Active Population, Employed Persons, and Elderly, by
Region
Contributors / Economically Active Population
Contributors / Employed Persons
Beneficiaries / Population Age 65+
Year
Rural Urban Rural Urban Rural Urban 1995 . 55.47 . 59.54 . 87.62 1997 . 53.32 . 58.00 . 88.17 1998 . 54.33 . 58.44 . 87.44 1999 . 53.56 . 58.45 . 87.73 2000 . 52.93 . 58.67 . 87.49 2001 . 52.64 . 59.62 . 85.87 2002 . 51.80 . 59.80 . 87.09 2003 . 49.95 . 57.82 . 85.93 2004 . 51.43 . 57.35 . 85.97
Source: own, based on Ongoing Household Survey
Table A16.6. Uruguay. Coverage Rates of the Economically Active Population, by Quintile Year Quintile 1 Quintile 2 Quintile 3 Quintile 4 Quintile 5 1995 33.26 51.87 61.35 67.73 63.64 1997 29.23 47.21 59.37 66.30 64.84 1998 30.85 49.22 59.54 66.94 65.27 1999 28.52 49.06 59.09 64.67 66.34 2000 24.13 45.17 59.59 67.68 68.04 2001 24.49 45.20 57.26 66.54 69.67 2002 20.47 42.82 56.42 66.78 72.48 2003 19.70 37.96 53.86 66.69 71.57 2004 18.91 41.82 55.77 67.41 73.22
Source: own, based on Ongoing Household Survey
Table A16.7. Uruguay. Coverage Rates of the Employed Persons, by Quintile Year Quintile 1 Quintile 2 Quintile 3 Quintile 4 Quintile 5 1995 39.93 58.08 65.45 69.65 65.24 1997 36.18 54.08 64.49 69.14 66.61 1998 37.36 54.71 64.08 69.58 66.71 1999 34.97 56.90 63.23 69.71 67.41 2000 31.90 53.67 66.27 72.24 69.32 2001 32.67 54.34 65.45 72.82 72.93 2002 29.72 53.28 66.05 73.14 76.86 2003 27.51 48.98 63.19 73.75 75.86 2004 24.97 50.26 62.78 73.21 75.60
Source: own, based on Ongoing Household Survey
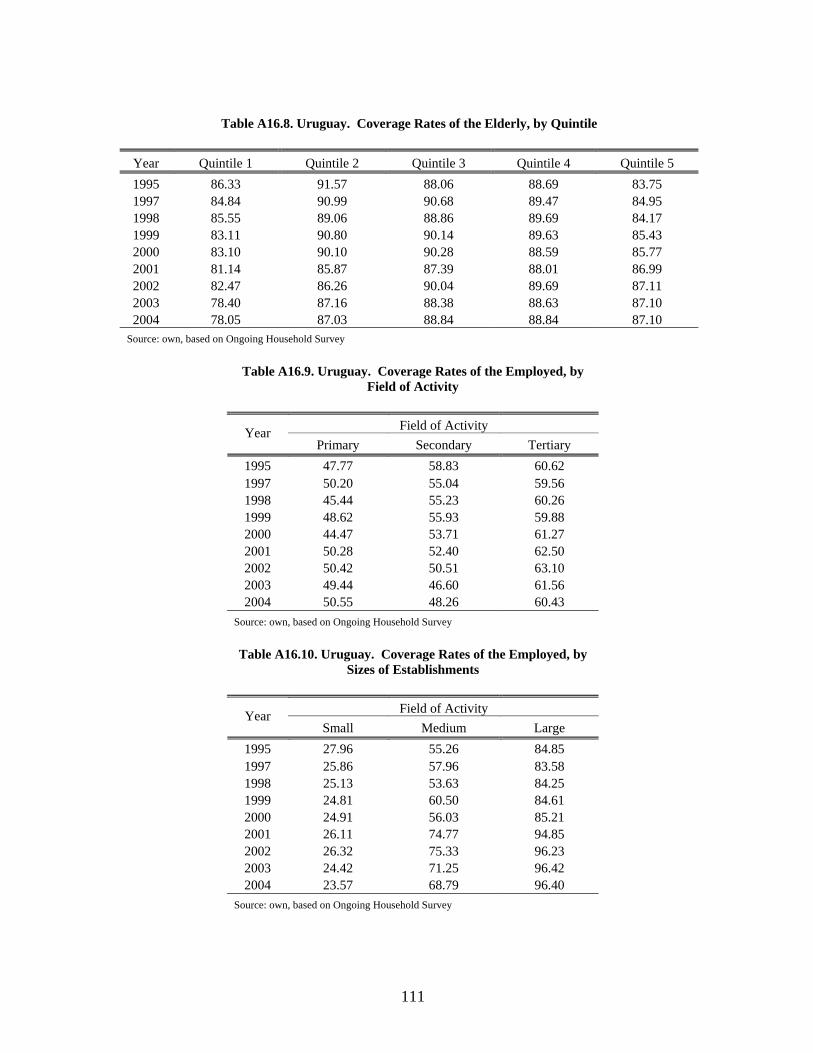
111
Table A16.8. Uruguay. Coverage Rates of the Elderly, by Quintile
Year Quintile 1 Quintile 2 Quintile 3 Quintile 4 Quintile 5 1995 86.33 91.57 88.06 88.69 83.75 1997 84.84 90.99 90.68 89.47 84.95 1998 85.55 89.06 88.86 89.69 84.17 1999 83.11 90.80 90.14 89.63 85.43 2000 83.10 90.10 90.28 88.59 85.77 2001 81.14 85.87 87.39 88.01 86.99 2002 82.47 86.26 90.04 89.69 87.11 2003 78.40 87.16 88.38 88.63 87.10 2004 78.05 87.03 88.84 88.84 87.10
Source: own, based on Ongoing Household Survey
Table A16.9. Uruguay. Coverage Rates of the Employed, by Field of Activity
Field of Activity Year
Primary Secondary Tertiary 1995 47.77 58.83 60.62 1997 50.20 55.04 59.56 1998 45.44 55.23 60.26 1999 48.62 55.93 59.88 2000 44.47 53.71 61.27 2001 50.28 52.40 62.50 2002 50.42 50.51 63.10 2003 49.44 46.60 61.56 2004 50.55 48.26 60.43
Source: own, based on Ongoing Household Survey
Table A16.10. Uruguay. Coverage Rates of the Employed, by Sizes of Establishments
Field of Activity Year
Small Medium Large 1995 27.96 55.26 84.85 1997 25.86 57.96 83.58 1998 25.13 53.63 84.25 1999 24.81 60.50 84.61 2000 24.91 56.03 85.21 2001 26.11 74.77 94.85 2002 26.32 75.33 96.23 2003 24.42 71.25 96.42 2004 23.57 68.79 96.40
Source: own, based on Ongoing Household Survey
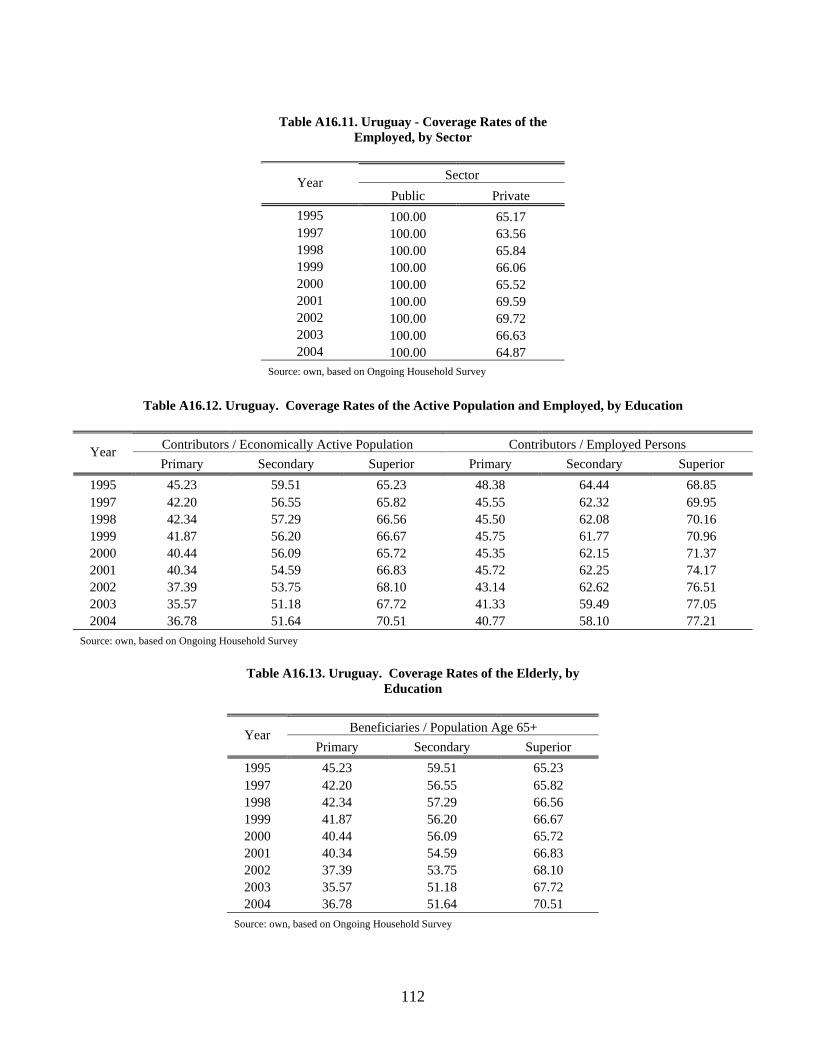
112
Table A16.11. Uruguay - Coverage Rates of the
Employed, by Sector
Sector Year Public Private
1995 100.00 65.17 1997 100.00 63.56 1998 100.00 65.84 1999 100.00 66.06 2000 100.00 65.52 2001 100.00 69.59 2002 100.00 69.72 2003 100.00 66.63 2004 100.00 64.87
Source: own, based on Ongoing Household Survey
Table A16.12. Uruguay. Coverage Rates of the Active Population and Employed, by Education
Contributors / Economically Active Population Contributors / Employed Persons Year Primary Secondary Superior Primary Secondary Superior
1995 45.23 59.51 65.23 48.38 64.44 68.85 1997 42.20 56.55 65.82 45.55 62.32 69.95 1998 42.34 57.29 66.56 45.50 62.08 70.16 1999 41.87 56.20 66.67 45.75 61.77 70.96 2000 40.44 56.09 65.72 45.35 62.15 71.37 2001 40.34 54.59 66.83 45.72 62.25 74.17 2002 37.39 53.75 68.10 43.14 62.62 76.51 2003 35.57 51.18 67.72 41.33 59.49 77.05 2004 36.78 51.64 70.51 40.77 58.10 77.21
Source: own, based on Ongoing Household Survey
Table A16.13. Uruguay. Coverage Rates of the Elderly, by Education
Beneficiaries / Population Age 65+ Year
Primary Secondary Superior 1995 45.23 59.51 65.23 1997 42.20 56.55 65.82 1998 42.34 57.29 66.56 1999 41.87 56.20 66.67 2000 40.44 56.09 65.72 2001 40.34 54.59 66.83 2002 37.39 53.75 68.10 2003 35.57 51.18 67.72 2004 36.78 51.64 70.51
Source: own, based on Ongoing Household Survey

113
Table A16.14. Uruguay. Rate of Total Household Income from Pensions to Total Household Income, by Type of Family
Year Only Elderly Youth and Elderly
At Least one Elderly
1995 86.06 50.36 65.76 1997 87.97 53.08 68.68 1998 85.49 50.76 66.22 1999 86.09 51.37 67.90 2000 85.79 51.49 68.37 2001 84.58 51.99 67.84 2002 85.91 53.54 69.20 2003 85.46 53.39 69.28 2004 83.44 51.78 67.14
Source: own, based on Ongoing Household Survey
Table A16.15. Uruguay. Other Definitions of Pensions
Year Definition (1) Definition (2)
1995 93.55 97.63 1997 94.22 97.93 1998 93.75 97.64 1999 93.93 97.78 2000 93.96 97.58 2001 92.98 97.43 2002 93.70 97.16 2003 93.59 97.11 2004 92.94 97.20
Note: Definition (1) refers to the “Joint Coverage” which represents the percentage of the elderly who reside in a household in which at least one social security benefit is received. On the other hand, Definition (2) refers to the percentage of the elderly who reside in a household in which at least one social security benefit is received or one person over 65 years of age is occupied. Source: own, based on Ongoing Household Survey

114
17. Venezuela
Table A17.1. Venezuela. Coverage Rates of the Economically Active Population and Elderly, Alternative Indicators
Year
Contributors / Economically
Active Population
Contributors / Employed Persons
Contributors / Wage-Earners
Contributors / Employers - Independent
Beneficiaries / Population Age
65+
1995 36.30 39.90 66.36 . 18.79 1996 33.59 37.76 64.56 . 18.78 1997 34.58 38.21 62.71 . 23.10 1998 34.46 38.18 66.21 . 20.67 1999 33.95 39.11 68.31 . 21.20 2000 35.12 39.96 71.49 . 23.82 2001 35.48 39.07 68.17 . 26.43 2002 32.43 36.65 64.94 . 25.61 2003 30.24 34.37 62.54 . 25.75 2004 31.86 36.08 63.71 . 26.82
Source: own, based on Household Survey by Sampling
Table A17.2. Venezuela. Coverage Rates of the Employed Person, by Age
Year 20-29 30-39 40-49 50-59 60-69
1995 43.50 42.29 40.71 34.51 19.16 1996 42.52 40.39 37.94 28.84 19.47 1997 41.08 40.87 39.13 33.41 17.57 1998 39.98 41.59 39.26 34.16 17.45 1999 40.79 41.83 41.16 35.12 20.75 2000 42.34 43.53 41.20 34.22 20.19 2001 40.14 43.14 40.56 34.36 20.58 2002 36.22 40.99 39.41 32.12 20.54 2003 32.64 38.30 37.63 32.30 20.11 2004 35.22 40.64 38.55 32.63 20.95
Source: own, based on Household Survey by Sampling

115
Table A17.3. Venezuela. Coverage Rates of the Elderly , by Age
Year 60-64 65-69 70-74 75-79 1995 18.54 18.95 19.40 18.49 1996 16.19 19.70 20.57 20.95 1997 22.98 23.71 23.10 22.44 1998 20.36 21.43 21.40 19.44 1999 20.06 23.33 23.59 18.06 2000 22.43 25.35 25.37 22.92 2001 25.36 27.54 28.33 25.13 2002 24.22 26.35 29.68 23.64 2003 23.72 27.04 30.33 23.64 2004 25.65 27.43 30.38 24.87
Source: own, based on Household Survey by Sampling
Table A17.4. Venezuela. Coverage Rates of the Economically Active Population, Employed Persons, and Elderly, by Gender
Contributors / Economically Active Population Contributors / Employed Persons Beneficiaries / Population Age 65+
Year
Men Women Men Women Men Women 1995 33.22 42.23 35.92 47.95 24.93 13.67 1996 30.77 38.80 33.95 45.22 26.09 12.67 1997 32.62 37.98 35.49 43.15 29.58 17.71 1998 33.29 36.44 36.56 40.98 27.32 15.15 1999 32.28 36.79 36.88 42.97 28.48 15.17 2000 33.34 38.13 37.70 43.86 30.72 18.11 2001 33.16 39.47 36.61 43.25 33.13 20.90 2002 29.83 36.85 33.83 41.42 32.12 20.24 2003 27.96 34.03 31.80 38.65 31.13 21.31 2004 29.46 35.90 33.38 40.60 33.00 21.73
Source: own, based on Household Survey by Sampling

116
Table A17.5. Venezuela. Coverage Rates of the Economically Active Population, Employed Persons, and Elderly, by
Region
Contributors / Economically Active Population
Contributors / Employed Persons Beneficiaries / Population Age 65+
Year
Rural Urban Rural Urban Rural Urban 1995 . 36.30 . 39.90 . 18.79 1996 . 33.59 . 37.76 . 18.78 1997 . 34.58 . 38.21 . 23.10 1998 . 34.46 . 38.18 . 20.67 1999 . 33.95 . 39.11 . 21.20 2000 . 35.12 . 39.96 . 23.82 2001 . 35.48 . 39.07 . 26.43 2002 . 32.43 . 36.65 . 25.61 2003 . 30.24 . 34.37 . 25.75 2004 . 31.86 . 36.08 . 26.82
Source: own, based on Household Survey by Sampling
Table A17.6. Venezuela. Coverage Rates of the Economically Active Population, by Quintile Year Quintile 1 Quintile 2 Quintile 3 Quintile 4 Quintile 5 1995 15.44 28.04 40.27 47.92 49.77 1996 15.68 26.14 34.92 42.90 48.41 1997 18.00 30.01 35.72 41.38 47.73 1998 18.73 29.37 34.67 41.40 47.36 1999 14.90 28.76 35.09 42.79 48.04 2000 19.33 29.27 36.02 41.83 48.61 2001 35.27 34.24 35.45 35.52 36.51 2002 13.34 24.45 33.29 39.81 50.86 2003 12.90 21.51 29.21 37.38 49.53 2004 15.62 23.49 31.82 38.57 49.37
Source: own, based on Household Survey by Sampling

117
Table A17.7. Venezuela. Coverage Rates of the Employed Persons, by Quintile
Year Quintile 1 Quintile 2 Quintile 3 Quintile 4 Quintile 5 1995 19.93 33.07 44.83 50.32 51.38 1996 19.15 33.29 38.97 47.11 50.46 1997 23.20 34.70 39.02 44.91 49.25 1998 23.53 34.55 39.41 43.65 49.04 1999 23.33 33.59 41.53 46.39 50.58 2000 26.07 35.16 40.74 45.58 51.79 2001 38.51 39.66 38.92 38.89 38.97 2002 18.57 28.98 36.63 44.77 53.91 2003 16.60 26.66 33.54 41.93 52.42 2004 20.52 28.99 35.52 42.62 52.32
Source: own, based on Household Survey by Sampling
Table A17.8. Venezuela. Coverage Rates of the Elderly, by Quintile Year Quintile 1 Quintile 2 Quintile 3 Quintile 4 Quintile 5 1995 9.84 16.52 18.45 22.47 26.80 1996 14.28 14.15 19.95 20.86 24.68 1997 13.00 15.61 25.10 24.99 36.92 1998 10.85 14.91 18.25 25.72 33.70 1999 12.01 12.30 20.56 27.44 33.98 2000 9.92 15.24 24.81 26.99 42.04 2001 26.04 25.92 27.01 27.64 25.60 2002 8.57 13.04 24.60 33.21 48.64 2003 10.36 15.26 22.14 34.75 46.21 2004 11.84 16.15 23.97 34.92 47.37
Source: own, based on Household Survey by Sampling
Table A17.9. Venezuela. Coverage Rates of the Employed, by Field of Activity
Field of Activity Year
Primary Secondary Tertiary 1995 10.07 46.74 43.61 1996 13.38 42.99 40.88 1997 14.02 41.75 40.33 1998 16.71 41.59 40.22 1999 17.89 42.79 41.04 2000 18.12 42.56 42.45 2001 18.82 40.22 41.58 2002 15.70 37.75 39.39 2003 13.48 35.22 37.35 2004 15.38 38.01 38.61
Source: own, based on Household Survey by Sampling

118
Table A17.10. Venezuela. Coverage Rates of the Employed, by Sizes of Establishments
Sizes of Establishments Year Small Medium Large
1995 5.21 49.79 84.44 1996 4.02 50.66 81.69 1997 4.63 48.55 80.16 1998 5.04 52.95 82.91 1999 5.75 53.06 83.58 2000 6.53 53.86 84.42 2001 6.14 41.39 78.58 2002 5.45 38.50 78.58 2003 5.11 39.43 76.54 2004 5.52 41.45 77.45
Source: own, based on Household Survey by Sampling
Table A17.11. Venezuela - Coverage Rates of the Employed, by Sector
Sector Year Public Private
1995 86.27 57.40 1996 83.36 56.25 1997 83.11 54.15 1998 84.65 58.61 1999 89.74 59.95 2000 91.35 63.79 2001 88.05 60.43 2002 88.98 55.86 2003 87.05 52.97 2004 84.85 55.32
Source: own, based on Permanent and Ongoing Survey of Households – Expanded User Base
Table A17.12. Venezuela. Coverage Rates of the Active Population and Employed, by Education
Contributors / Economically Active Population Contributors / Employed Persons Year Primary Secondary Superior Primary Secondary Superior
1995 27.69 49.61 54.58 30.27 55.19 60.52 1996 25.10 45.91 51.02 28.21 52.07 56.88 1997 24.90 45.02 54.58 27.45 50.68 59.54 1998 25.49 44.69 54.35 28.18 50.18 59.83 1999 25.32 41.03 54.89 29.12 47.96 62.51 2000 26.62 42.76 55.11 30.00 49.99 62.79 2001 25.76 42.66 56.66 28.20 47.51 62.66 2002 22.58 39.55 54.16 25.45 45.01 61.24 2003 20.62 36.14 51.90 23.27 41.75 59.20 2004 22.18 38.44 53.20 24.97 44.20 60.37
Source: own, based on Household Survey by Sampling

119
Table A17.13. Venezuela. Coverage Rates of the Elderly, by Education
Beneficiaries / Population Age 65+ Year Primary Secondary Superior
1995 16.04 49.17 50.03 1996 16.77 41.16 53.53 1997 19.48 54.27 62.35 1998 17.56 48.14 53.95 1999 18.49 44.29 56.09 2000 20.71 45.37 59.40 2001 23.35 50.74 58.09 2002 22.68 48.45 59.79 2003 23.07 49.11 48.12 2004 24.11 46.13 55.41
Source: own, based on Household Survey by Sampling
Table A17.14. Venezuela. Other Definitions of Pensions
Year Definition (1) Definition (2)
1995 23.51 51.93 1996 24.23 53.94 1997 27.67 53.41 1998 25.60 53.88 1999 26.41 54.17 2000 29.74 55.20 2001 32.65 56.56 2002 31.71 56.52 2003 31.83 57.64 2004 32.89 58.42
Note: Definition (1) refers to the “Joint Coverage” which represents the percentage of the elderly who reside in a household in which at least one social security benefit is received. On the other hand, Definition (2) refers to the percentage of the elderly who reside in a household in which at least one social security benefit is received or one person over 65 years of age is occupied. Source: own, based on Household Survey by Sampling

120
ANNEX II Detail of contributory and non contributory benefits
Table A1. Coverage Rates for the Elderly by Type of Pension
Bolivia Chile Costa Rica Ecuador Year Total Cont. Non cont.
Total Cont. Non cont.
Total Cont. Non cont.
Total Cont. Non cont.
1990 . . . 77.19 73.04 6.78 . . . 18.60 18.60 . 1991 . . . . . . 25.56 25.56 . 19.83 19.83 . 1992 . . . 74.63 66.50 8.47 45.99 28.11 17.96 18.65 18.65 . 1993 . . . . . . 43.65 28.71 15.26 19.35 19.35 . 1994 . . . 75.93 68.21 9.65 47.53 31.44 17.21 19.27 19.27 . 1995 . . . . . . 49.90 32.79 17.56 20.20 20.20 . 1996 17.63 17.63 . 76.03 65.94 14.36 51.81 32.97 19.12 21.22 21.22 . 1997 19.92 19.92 . . . . 56.03 36.79 19.36 19.64 19.64 . 1998 . . . 75.59 62.17 13.56 56.48 37.48 18.96 20.81 20.81 . 1999 17.73 17.73 . . . . . . . 22.38 22.38 . 2000 16.97 16.97 . 75.76 68.89 14.01 55.63 36.62 18.37 27.52 13.68 14.54 2001 75.07 19.87 70.78 . . . 57.42 35.98 20.65 31.36 14.66 17.71 2002 72.34 14.71 69.46 . . . 59.65 35.73 23.12 . . . 2003 . . . 77.26 62.99 14.42 . . . 34.22 15.22 20.45 2004 . . . . . . 60.09 39.42 20.12 33.27 16.08 18.47 Source: own, based on Survey of Households

121
Table A2. Bolivia. Coverage Rates for the Elderly, by Quintile and Type of Pension
Total Contributory Non contributory
Year Q1 Q2 Q3 Q4 Q5 Q1 Q2 Q3 Q4 Q5 Q1 Q2 Q3 Q4 Q5
1990 . . . . . . . . . . . . . . . 1991 . . . . . . . . . . . . . . . 1992 . . . . . . . . . . . . . . . 1993 . . . . . . . . . . . . . . . 1994 . . . . . . . . . . . . . . . 1995 . . . . . . . . . . . . . . . 1996 0.16 3.44 15.65 24.60 44.36 0.16 3.44 15.65 24.60 44.36 . . . . . 1997 . 3.54 17.12 34.83 44.12 . 3.54 17.12 34.83 44.12 . . . . . 1998 . . . . . . . . . . . . . . . 1999 . 0.40 12.32 25.32 50.56 . 0.40 12.32 25.32 50.56 . . . . . 2000 . 3.38 8.56 28.93 44.01 . 3.38 8.56 28.93 44.01 . . . . . 2001 66.76 69.38 67.41 87.69 84.48 . 1.47 15.25 29.88 52.78 66.61 69.38 62.72 83.69 71.84 2002 59.96 73.43 71.03 77.41 79.85 . 0.20 5.70 21.32 46.19 59.82 73.48 69.28 74.24 70.41 2003 . . . . . . . . . . . . . . . 2004 . . . . . . . . . . . . . . .
Source: own, based on Household Survey, Mecovi Program

122
Table A3. Chile. Coverage Rates for the Elderly, by Quintile and Type of Pension
Total Contributory Non contributory
Year Q1 Q2 Q3 Q4 Q5 Q1 Q2 Q3 Q4 Q5 Q1 Q2 Q3 Q4 Q5
1990 70.61 79.27 84.80 81.90 69.61 61.44 74.25 81.42 80.01 68.30 10.33 7.64 7.00 6.82 2.16 1991 . . . . . . . . . . . . . . . 1992 72.69 76.78 79.94 74.98 68.81 52.10 66.26 74.12 72.21 67.78 21.03 11.01 6.17 3.13 1.08 1993 . . . . . . . . . . . . . . . 1994 73.57 78.95 80.41 76.67 70.62 55.70 67.87 75.28 73.09 69.61 19.34 13.21 7.44 6.93 1.47 1995 . . . . . . . . . . . . . . . 1996 72.19 80.04 84.07 76.45 67.46 47.87 67.50 76.48 72.04 65.81 27.16 17.83 14.18 9.98 2.78 1997 . . . . . . . . . . . . . . . 1998 74.71 79.11 78.82 73.93 71.58 41.97 60.00 71.04 68.33 69.58 32.76 19.51 7.92 5.67 2.04 1999 . . . . . . . . . . . . . . . 2000 70.30 76.07 83.75 79.32 69.49 53.07 66.81 79.33 76.66 68.76 21.62 18.10 12.41 14.91 2.97 2001 . . . . . . . . . . . . . . . 2002 . . . . . . . . . . . . . . . 2003 75.32 79.79 83.37 76.77 71.42 43.20 59.74 73.13 70.10 68.97 32.29 20.27 10.32 6.92 2.46 2004 . . . . . . . . . . . . . . .
Source: own, based on National Socioeconomic Survey

123
Table A4. Costa Rica. Coverage Rates for the Elderly, by Quintile and Type of Pension
Total Contributory Non contributory
Year Q1 Q2 Q3 Q4 Q5 Q1 Q2 Q3 Q4 Q5 Q1 Q2 Q3 Q4 Q5
1990 . . . . . . . . . . . . . . . 1991 2.73 13.98 26.85 37.83 46.00 2.73 13.98 26.85 37.83 46.00 . . . . . 1992 26.10 51.82 48.40 53.06 50.84 3.28 19.19 31.36 40.67 46.26 22.80 32.75 17.04 12.84 4.58 1993 20.98 45.55 44.21 55.81 51.79 3.74 24.24 28.09 41.96 45.49 17.14 22.22 16.17 14.68 6.07 1994 28.15 47.99 50.04 57.04 54.55 7.46 24.60 32.40 43.70 49.06 23.16 23.01 18.37 14.02 7.59 1995 29.14 53.76 49.35 59.12 58.04 4.80 28.15 30.74 46.83 53.17 24.83 26.29 19.04 12.29 5.54 1996 29.76 57.07 51.21 60.87 59.81 4.05 21.36 34.22 49.36 55.58 25.98 35.98 16.90 12.07 4.82 1997 40.96 59.13 52.41 63.69 63.32 10.68 26.67 37.77 50.55 57.24 29.38 33.21 14.66 14.18 5.70 1998 43.51 56.70 59.00 59.46 62.80 11.39 28.61 39.58 48.12 58.43 30.95 27.77 20.30 11.32 4.61 1999 . . . . . . . . . . . . . . . 2000 39.80 59.19 58.36 61.14 58.30 8.21 31.83 38.10 48.88 53.80 28.18 27.23 20.19 11.97 4.33 2001 38.43 65.17 58.63 64.46 58.49 7.90 28.44 38.68 48.82 53.57 27.15 36.29 19.33 15.51 5.11 2002 41.77 64.11 61.46 66.09 64.03 10.52 22.54 38.18 50.86 55.69 28.88 41.20 22.83 14.90 7.88 2003 . . . . . . . . . . . . . . . 2004 46.33 61.83 66.91 58.63 65.94 10.79 29.89 46.63 45.99 62.05 32.53 31.78 20.10 12.36 3.83
Source: own, based on Multi-Purpose Household Survey

124
Table A5. Ecuador. Coverage Rates for the Elderly, by Quintile and Type of Pension
Total Contributory Non contributory
Year Q1 Q2 Q3 Q4 Q5 Q1 Q2 Q3 Q4 Q5 Q1 Q2 Q3 Q4 Q5
1990 5.26 15.41 15.53 24.95 31.94 5.26 15.41 15.53 24.95 31.94 . . . . . 1991 8.29 16.71 18.53 24.15 31.75 8.29 16.71 18.53 24.15 31.75 . . . . . 1992 5.36 13.11 18.96 26.33 29.49 5.36 13.11 18.96 26.33 29.49 . . . . . 1993 4.79 15.49 22.10 20.62 33.79 4.79 15.49 22.10 20.62 33.79 . . . . . 1994 2.05 16.59 16.92 24.72 35.08 2.05 16.59 16.92 24.72 35.08 . . . . . 1995 5.45 12.33 19.15 29.27 34.90 5.45 12.33 19.15 29.27 34.90 . . . . . 1996 8.24 17.26 20.41 28.38 31.52 8.24 17.26 20.41 28.38 31.52 . . . . . 1997 7.78 13.72 20.29 26.39 29.65 7.78 13.72 20.29 26.39 29.65 . . . . . 1998 7.14 15.07 16.79 28.29 36.77 7.14 15.07 16.79 28.29 36.77 . . . . . 1999 5.59 19.98 20.62 30.83 34.84 5.59 19.98 20.62 30.83 34.84 . . . . . 2000 21.71 27.36 29.02 28.60 30.94 3.46 8.58 12.78 19.19 24.38 18.69 19.14 16.92 11.52 6.44 2001 17.97 33.79 32.22 34.79 37.95 2.11 10.38 15.00 16.06 29.56 16.13 24.90 19.32 19.45 8.92 2002 . . . . . . . . . . . . . . . 2003 28.42 32.89 32.79 32.82 44.25 1.90 4.52 11.47 17.75 40.45 27.17 29.86 22.90 16.86 5.56 2004 30.03 30.22 31.61 33.56 40.73 2.03 7.71 10.88 22.79 36.97 28.48 24.32 22.28 11.85 5.22
Source: own, based on National Survey on Employment, Unemployment and Underemployment

125
ANNEX III: METHODOLOGICAL ASPECTS
The study analyzes pension coverage using data from household surveys of 17 countries of Latin America from 1990 to 2004 (see table MA.1). This source was preferred over other sources given that it has a larger level of detail and consistency. Though these surveys differ in terms of their geographic coverage and other elements (both between countries and years within the same country), they nonetheless make it possible to apply a standardized conceptual framework and standard definitions for calculating coverage levels of social security systems in Latin America. The study measures the level of coverage, but also tries to understand coverage presenting it by age group, gender, geographical areas, occupation, sector of employment, size of firms, level of education, and income.
Table MA.1: Name, geographical coverage and period of time of the household surveys used in the study
Country Name Geographical coverage Period of time
Argentina 1990 to 2002 – Encuesta Permanente de Hogares (EPH). 2003 to 2006 – Encuesta Continua de Hogares (EPH-C).
Urban 1990 to 2002 - October. 2003 to 2004 - Second Semester.
Bolivia
1996 and 1997 - Encuesta Nacional de Empleo (ENE). 1999 and 2002 - Encuesta Continua de Hogares - Condiciones de Vida (ECH).
1996 to 2002 - National.
1996 - June. 1997 to 2001 - November. 2002 – December.
Brazil 1992 to 2002 - Pesquisa Nacional por Amostra de Domicilios (PNAD). National September
Chile 1990, 1992, 1994, 1996, 1998, 2000, and 2003 - Encuesta de Caracterización Socioeconómica Nacional (CASEN).
National November
Colombia 1992 and 1995 to 2002 - Encuesta Nacional de Hogares - Fuerza de Trabajo (ENH).
1992 - Urban, 1995 to 2000 - National
September
Costa Rica
1992 to 1995 - Encuesta de Hogares de Propósitos Múltiples (EHPM). 1996 to 2004 - Encuesta Permanente de Hogares de Propósitos Múltiples (EpHPM).
National July
Dominican Republic
2000 to 2004 - Encuesta Nacional de Fuerza de Trabajo (ENFT). National October
Ecuador
1990 to 2001 - Encuesta Periódica de Empleo y Desempleo (EPED). 2002 to 2004 - Encuesta de Empleo, Desempleo y Subempleo. (ENEMDU)
1990 a 1999 - Urban. 2000 al 2004 - National.
1990 to 2001 - November. 2003 - December. 2004 - March.
El Salvador 1995 to 2003 - Encuesta de Hogares de Propósitos Múltiples (EHPM). National. Annual
Guatemala
1998/99 – Encuesta Nacional de Ingresos y Gastos (ENIGFAM). 2000 - Encuesta Nacional sobre Condiciones de Vida (ENCOVI).
National.
1998/99 - March 1998 to March 1999. 2000 - July to November.
México 1992, 1994, 1996, 1998, 2000, 2002 and 2004 Encuesta Nacional de Ingresos y Gastos de los Hogares (ENIGH)
National. Third Quarter

126
Country Name Geographical
coverage Period of time
Nicaragua 1993, 1998 and 2001 - Encuesta Nacional de Hogares sobre Medición de Nivel de Vida (EMNV).
National.
1993 - February to April 1998 - April to September 2001 - April to August
Panama 1991 Encuesta de Hogares – Mano de Obra (EMO). 1995 to 2003 - Encuesta de Hogares (EH).
National. August.
Paraguay
1999 Encuesta Permanente de Hogares (EPH) 2000/2001Encuesta Integrada de Hogares (EIH). 2002 to 2003 Encuesta Permanente de Hogares (EPH)
National
1999 - August to December. 2000/2001 - September 2000 to August 2001. 2003 - August to December.
Perú 1998 to 2003 - Encuesta Nacional de Hogares (ENAHO). National Fourth quarter.
Uruguay 1995 to 2004 - Encuesta Continua de Hogares (ECH). Urban Annual.
Venezuela 1995 to 2004 - Encuesta de Hogares por Muestreo (EHM). National Second Semester.
Given that the definitions of economic activity status, the geographic scope considered,
and the concept of coverage used by prior studies varies from country to country, the coverage indicators are not exactly equivalent. Furthermore, a comparison of indicators derived from local studies overlooks the fact that workers in certain occupational categories are not entitled to social security benefits in all countries (for example, the laws differ on the treatment given to household workers and the self-employed). As such, the measurement of coverage called for by the legal criteria also differs. In order to overcome these obstacles, this study focuses on measuring national levels of coverage10 and considers all persons over the age of 20 - of the economically active phase - or who are over the age of 65 - for the beneficiary stage to be potentially eligible for social security protection.
Although the definition of the Economically Active Population usually includes individuals approximately 15 years of age or older, we have not used this reference group and prefer to define the Economically Active Population as starting at age 20 for various reasons. Primarily, because being of adult age is explicitly required in order to participate in social security systems. This definition also considers the quality of the information presented on child and adolescent employment and the customary age at which an individual is expected to take responsibility for supporting himself. The justification of the age bracket for the elderly is much more direct: the majority of national legislations indicate 60 or 65 as the age for receiving retirement benefits. We chose to work with the “over the age of 65” bracket in order to keep the coverage indicator of the elderly from being distorted by age-requirement differences from one country to another. Additional information on determination of the coverage indicators is presented below. 10 All the countries have information at a national level with the exception of Argentina and Uruguay which have data for the urban area and Bolivia, Colombia, and Ecuador which have data at a national level in some of the years under consideration.

127
COVERAGE IN THE ECONOMICALLY ACTIVE STAGE When analyzing general levels of coverage in the economically active stage, we
defined three indicators of interest: (i) contributors/economically active individuals (ii) contributors/employed persons, and (iii) contributors/wage earners. The first two indicators are known as “coverage of the labor force” and “occupational coverage.” One measures the degree of social security protection enjoyed by the labor force, while the other recognizes the existence of a group of persons who are not employed and therefore not so entitled. The third indicator of “coverage for wage earners” could be called legal coverage, since national laws coincide in recognizing entitlement to social security and a call for mandatory participation of wage earners in the pension systems (with some exceptions, such as household employees in El Salvador).
In order to standardize criteria for defining the ratios, we consider the “economically active population” to be individuals over the age of 20 who are employed or are actively seeking employment. Employed persons are defined as those over the age of 20 who are engaged in some form of work, whether paid or unpaid during the reference week of the survey, or who may not have worked (due to vacations, medical leave, etc.) but do have employment to which they are expected to return. We also include those who describe themselves as underemployed in this category. Our definition of wage earners includes workers and employees of the public and private sectors, as well as household employees. Finally, the self-employed include employers, whether or not they receive wages, those who work for themselves with or without business premises, farm hands, day laborers, and members of labor cooperatives.
It is, in fact, relatively easy to standardize the basis for the coverage indicator. That is hardly the case, however, for information on participation in the system. The surveys pose different types of questions to elicit that information: whether benefits are received at work (Argentina, Mexico, Uruguay, and Venezuela), whether contributions are being made into the pension system (Brazil and Chile), whether contributions are being made into the social security system (Costa Rica, Guatemala, and Nicaragua), whether the person is enrolled in the pension system (Bolivia, Paraguay, and Peru), or whether the person is enrolled in the social security system (Colombia, Ecuador, El Salvador, and Nicaragua). Due to these differences, the coverage indicator for the first three groups of countries responds to a definition of coverage as the making of contributions, while in the case of the last two groups a coverage indicator is obtained in terms of enrollment. No question whatsoever is asked in the Dominican Republic and Panama.
Differences are also seen in terms of the individuals who were asked the question regarding the pension systems: employed persons (Brazil, Chile, Guatemala, Nicaragua, Paraguay, and Uruguay), employed persons, with exceptions (El Salvador), wage earners (Argentina, Mexico, and Venezuela), or anyone (Bolivia, Costa Rica, Ecuador, and Peru). All things considered, taking into account that the number of unemployed persons who contribute to the pension systems is low, the distortions to the results for the ten countries that did not ask the question to all economically active persons are minor. Table MA.2 summarizes the information related to coverage in the economically active stage.

128
Table MA.2: Information about coverage in the economically active stage
Country Type of question Variable constructed Person asked
Argentina
Benefits received by the worker (EPH) or the worker receives pension discount (EPH-C)
The worker has only pension or a combination of benefits and pension (EPH) or the worker has pension (EPH-C).
Salaried workers
Bolivia Enrollment into the pension system (AFP) The worker is enrolled All individuals older than
seven years old.
Brazil Contributions made into the pension system. The person contributes Employed Persons
Chile Contributions made into the pension system The person contributes Employed Persons
Colombia Enrollment into the social security system The person is enrolled Employed Persons
Costa Rica Contributions made into the social security system
The person contributes to the social security system (as salary worker, as self employed or with convenio)
Anyone
Ecuador Enrollment into the social security system (IESS)
The person is enrolled (until 2000) or the person is enrolled into IESS seguro general, IESS seguro campesino, and ISSFA and ISSPOL (from 2001 to 2004).
Anyone
El Salvador
Enrollment into the social security system (enrollment or benefits from 1998 to 2003)
The worker is enrolled (or is beneficiary from 1998 to 2003)
Employed Persons with exceptions

129
Table MA.2 : Information about coverage in the economically active stage - Continuation
Country Type of question Variable constructed Person asked
Guatemala Contributions made into the social security system (IGSS) The person contributes Employed Persons
México Benefits received by the worker
The worker has SAR or AFORE, or is covered by IMSS, ISSTE, PEMEX, or University insurance programs
Salaried Workers
Nicaragua
Enrollment and contributions (included in 1998) made into the social security system (INSS) or other firm.
The person is enrolled or contributes to the INSS or to other firm.
Employed Persons
Paraguay Enrollment into the pension system The worker is enrolled Employed Persons
Peru Enrollment into the pension system The worker is enrolled All individuals older than 13
years old.
Uruguay Rights to receive medical attention
Benefits by DISSE or others or the individual is a public employee (until 2000) or benefits by DISSE, reception of income from “cuotas mutuales” (health insurance) or the person is a public employee (from 2001 to 2004).
Employed Persons
Venezuela Benefits received by the worker
The worker receives social benefits Salaried Workers
COVERAGE AMONG THE ELDERLY
Two ratios were defined to analyze coverage among the elderly: (i) pension recipients/ individuals over the age of 65, (ii) individuals residing in households with pension recipients/individuals over the age of 65.
The first ratio responds to the traditional definition of coverage of the elderly: the proportion of persons who receive income from pensions. The second indicator, known as “joint coverage,” also recognizes those cases in which social security protection is available through the retirement-benefit income of one’s spouse.
When the traditional indicator of coverage was developed, pension recipients were identified based on variables regarding the receipt of income from pensions. Such

130
questions were preferred over those relating to the condition of being a retired person/ pensioner, to eliminate those cases in which an elderly person withdraws from the labor market without receiving any type of benefits, and declares that he or she is retired, even though he/she does not receive benefits. The information on income from pensions and retirement benefits was captured using three question formats: (i) source of income (Argentina), (ii) whether the person is receiving income from pensions (Brazil, Peru, and Venezuela) (iii) the amount of income from pensions (Argentina, Bolivia, Chile, Colombia, Costa Rica, Ecuador, El Salvador, Guatemala, Mexico, Panama, and Paraguay). The quality of the information gathered using the first two formats is better, since cases were identified in which the individuals state that they receive a pension but they cannot remember the amount. In countries where the amount of the pension is the only source of information on the condition of being a pensioner, coverage would be underestimated. Table MA.3 summarizes the information related to coverage among the elderly.
Table MA.3 : Information about coverage among the elderly
Country Type of question Variable constructed
Argentina Sources of income (EPH) or income from pensions (EPH-C)
The person receives income from pensions.
Bolivia
Amount of income from pensions (contributory pensions) and amount of income from Bonosol (non contributory pensions).
Contributory pensions: The person receives income from pensions, “benemerito”, or survivor benefits, (disability is included in 1999). Non contributory pensions: The person receives income from Bonosol.
Brazil Reception of income from pensions
The person receives aposentadoria ou pensão do Instituto de previdência ou do governo federal or de outro tipo de aposentadoria ou pensão.
Chile
Amount of income from pensions (contributory pensions) and amount of income from PASIS (non contributory pensions).
Contributory pensions: The person receives income from old age pension or retirement, from disability benefit (included in 1992), from “montepíos” (widow’s pension, included also 1992), and from orphans pension (included in 1996). Non contributory pensions: The person receives income from PASIS.
Colombia Amount of income from pensions. The person receives income from pensions.
Costa Rica
Amount of income from pensions (contributory pensions) and type of social security coverage that the person has (non contributory
Contributory pensions: The person receives income from pensions. Non contributory pensions: The person belongs to the non

131
pensions). contributory regime.
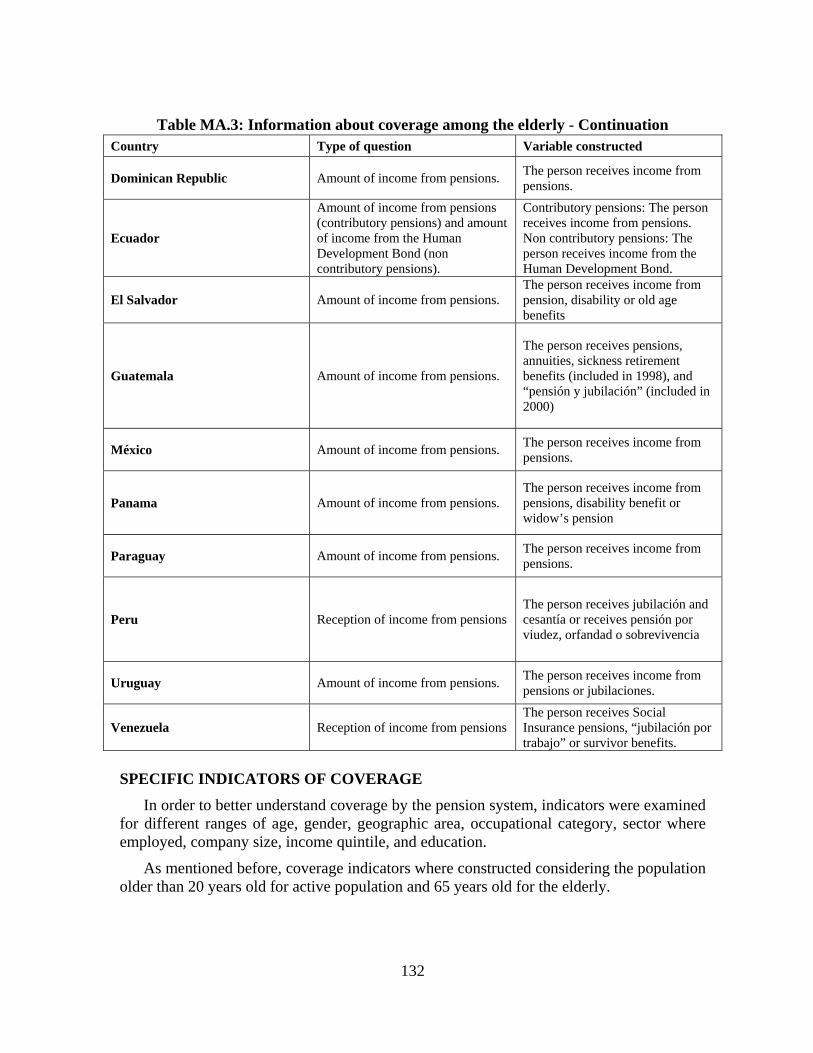
132
Table MA.3: Information about coverage among the elderly - Continuation
Country Type of question Variable constructed
Dominican Republic Amount of income from pensions. The person receives income from pensions.
Ecuador
Amount of income from pensions (contributory pensions) and amount of income from the Human Development Bond (non contributory pensions).
Contributory pensions: The person receives income from pensions. Non contributory pensions: The person receives income from the Human Development Bond.
El Salvador Amount of income from pensions. The person receives income from pension, disability or old age benefits
Guatemala Amount of income from pensions.
The person receives pensions, annuities, sickness retirement benefits (included in 1998), and “pensión y jubilación” (included in 2000)
México Amount of income from pensions. The person receives income from pensions.
Panama Amount of income from pensions. The person receives income from pensions, disability benefit or widow’s pension
Paraguay Amount of income from pensions. The person receives income from pensions.
Peru Reception of income from pensions The person receives jubilación and cesantía or receives pensión por viudez, orfandad o sobrevivencia
Uruguay Amount of income from pensions. The person receives income from pensions or jubilaciones.
Venezuela Reception of income from pensions The person receives Social Insurance pensions, “jubilación por trabajo” or survivor benefits.
SPECIFIC INDICATORS OF COVERAGE
In order to better understand coverage by the pension system, indicators were examined for different ranges of age, gender, geographic area, occupational category, sector where employed, company size, income quintile, and education.
As mentioned before, coverage indicators where constructed considering the population older than 20 years old for active population and 65 years old for the elderly.

133
We consider only the active population to calculate the ratio of individuals who contribute (or are affiliated) for those over 20 years old. Additionally, we included employees in the private and public sector and domestic workers to construct the ratio of individuals who contribute (or are affiliated) to salary workers. Finally, we consider employers, self employers, “peones”, cooperative members and family workers without remuneration to calculate the ratio of individuals who contribute to independent workers.
We did not include domestic workers when computing the total family income (as well as any component of it, such us the total family income from pensions), the per capita income, and the household size.
We excluded also those observations that appeared twice in the survey. This means that we deleted those observations that are identical for the variables that identified each household, the individuals within each household, the age of the individuals, and the relationship to the head of the household.
Coverage by age and gender First, coverage indicators were calculated considering 10-year age intervals for persons
in the economically active stage (from 20 to 80 years old or more) and 5-year age intervals for the elderly (65 to 80 years old or more). Then, coverage for men and women was considered separately.
Coverage by geographical area With respect to geographic area, coverage levels were estimated in the urban and rural
areas of each country. Unlike other countries, the surveys from Mexico and Peru did not include an indicator for urban vs. rural areas, and those indicators had to be constructed based on information regarding population strata, using the definition of urban provided by the statistics office of each country: population greater than 2500 inhabitants in the case of Mexico and population settlements with more than 400 housing units or 2000 inhabitants in the case of Peru.
Coverage by occupational category In the case of the occupational category, the surveys gathered information with varying
degrees of detail. In order to make these categories more comparable, individuals were categorized into 4 groups: (i) independent, self-employed, and family workers; (ii) workers employed in the public sector; (iii) workers employed in the private sector; and (iv) other workers.
The first category included business owners with and without wages, self-employed workers with and without business premises, cooperative members (Bolivia, El Salvador, Mexico, Nicaragua, and Uruguay) and day laborers (Ecuador and Mexico). The second category included government agencies, government-owned companies, the armed forces, and law enforcement (Brazil, Chile, and Peru), autonomous and municipal governments (Nicaragua). Finally, the fourth category was comprised of household employees and other kinds of workers. In the analysis we included only workers in the public and the private sector.

134
Coverage by sector of activity Three major categories were defined (i) Primary sector, (ii) Secondary sector and (iii)
Tertiary sector based on the UIIC classifications (Uniform International Industrial Classifications) adopted by all countries, but with variations in the degree of desegregation detail.
Coverage by firm size With respect to firm size, differences were seen in the manner of reporting the
information. It was therefore decided to categorize company size into three groups: small, medium, and large. The first group was comprised of establishments with five workers or less, the second with establishments employing six to 50 workers, and the third with 51 workers or more. Nonetheless, in several countries these limits had to be corrected, due to a lack of availability of the information. In these cases, the distribution was made considering the number of individuals which was closer to the limit imposed by the three groups. Table MA.4 lists the intervals used for each country.
Table MA.4: Information related to firm size
Number of workers Country
Small Medium Large
Argentina 1 to 5
1992 to 1994 - 6 to 50 1995 to 2004 - 6 to 40
1992 to 1994 - more than 40 1995 to 2004 - more than 40
Bolivia 1 to 5 6 to 49 More than 49 Brazil 1 to 5 6 to 10 More than 10 Chile 1 to 5 6 to 49 More than 49 Costa Rica 1 to 5 6 to 19 More than 19 Ecuador 1 to 5 6 to 50 More than 50
El Salvador 1 to 4 1995 to 1996 - 5 to 9 1997 to 2003 - 5 to 50
1995 to 1996 – more than 9 1997 to 2003 - more than 50
Guatemala 1 to 5 6 to 50 More than 50 México 1 to 5 6 to 50 More than 50 Nicaragua 1 to 5 6 to 50 More than 50 Paraguay 1 to 5 6 to 50 More than 50

135
Table MA.4: Information related to the size of the firm -
Continuation
Number of workers Country
Small Medium Large Peru 1 to 5 6 to 50 More than 50
Uruguay 1 to 4 1995 to 2000 - 5 to 9 2001 to 2004 - 5 to 49
1995 to 2000 - more than 9 2001 to 2004 - more than 49
Venezuela 1 to 4
1995 to 1998 - 5 to 50 1999 to 2004 - 5 to 20
1995 to 1998 - more than 50 1999 to 2004 - more than 20
Coverage by quintile of income To evaluate coverage by income quintiles, total-income quintiles were generated for
economically active workers and the employed, and then coverage was considered by quintile for each group. Zero incomes were included in the analysis and only the population under study was considered to build the quintiles (this means that in observing coverage by quintiles for those individuals who are employed, the quintiles are constructed taking the employed over 20 years old into account). The same applies to the elderly.
Coverage by level of education Given the diversity of the different systems of education between countries and the
changes that they suffer from year to year within the same country, only three binary variables were constructed to capture the level of education for each individual. Those variables refer to primary education (no education is included here), secondary education, and university.