pension plan mcgill university
TRANSCRIPT

Pension Management, McGill University688 Sherbrooke Street West, Suite 1420
Montreal, Quebec H3A 3R1
Tel: (514) 398-6250 Fax: (514) 398-6889www.mcgill.ca/pensions
McGill UniversityPension PlanReport and Financial StatementsDecember 31, 2008

Annual Report and Financial Statements
for the fiscal year ended December 31, 2008
Members of the Pension ADMINISTRATION COMMITTEEMr. Étienne Brodeur Independent Member
Professor Antal Deutsch (Chair) Representing Academic Staff
Ms. Lynne B. Gervais Representing the Principal & Chair of the Board
Professor Gerald Ratzer Representing Academic Staff
Mr. Warren Simpson Representing the Board of Governors
Dr. Saul Ticktin Representing Administrative & Support Staff
Ms. Cristiane Tinmouth Representing the Principal & Chair of the Board
Ms. Kathleen Tobin Representing Administrative & Support Staff
Ms. Manon Vennat Representing the Board of Governors

NOTICE OF ANNUAL MEETING 1
INTRODUCTION 2
FUND INVESTMENTS 3
THE ACCUMULATION FUND 3
Asset Allocation 4
Investment Management 6
Market and Fund Performance 6
Investment Manager Performance 8• Equity Pool 8• Fixed Income Pool 13• Socially Responsible Investment Pool 14• Money Market Pool 15• Workout Asset Pool 15
Unit Values 16
THE PENSIONER FUND 17
Asset Allocation 17
Investment Management 17
Performance 18
BENEFITS AND ADMINISTRATIVE MATTERS 19
Plan Amendments 19
2008 Benefit Payments 19
Annuity Dividends 20
Annuity Dividend Valuation 22
Actuarial Valuation of the Plan 22
Administration 22
Contact Us and Staff Directory 23
CHART 1A and CHART 1BACCUMULATION FUND PERFORMANCE 24
CHART 2PENSIONER FUND PERFORMANCE 25
APPENDIX I – RETIREMENTS 26
APPENDIX II – DEATHS 27
APPENDIX III – UNIT VALUE HISTORY 29
APPENDIX IV – GLOSSARY 31
AUDITORS’ REPORT 34
FINANCIAL STATEMENTS 35
Table ofCONTENTS

Notice of Annual Meeting of Pension Plan MembersThe Annual Meeting of Members of the McGill University Pension Plan will be held in Room 132 of the Stephen Leacock Building, 855 Sherbrooke Street West, Montreal,Quebec on Tuesday, the 5th day of May, 2009 at 12:00 noon for the purposes of:
(a) tallying and announcing the voting results – continuance of voting procedures;
(b) electing one Academic Staff representative, who is member of the Plan as ofDecember 31, 2008 and active employee of the University, to the PensionAdministration Committee;
(c) receiving the financial statements of the McGill University Pension Plan for the year ended December 31, 2008 and the Auditors’ Report thereon;
(d) receiving the stewardship report of the Pension Administration Committee;
(e) receiving the investment performance report of the McGill University Pension Plan for the year ended December 31, 2008, including the:
• Accumulation Fund;• Pensioner Fund; and the• impact of non-bank Asset-Backed Commercial Paper (“non-bank ABCP”) on
the holdings of the Pension Fund; and
(f) conducting such other business as shall be properly brought before the assembly.
Attendance at the meeting shall be restricted to active and non-active members of theplan, including beneficiaries. All attendees are requested to bring one of the followingvalid pieces of identification:
u McGill Identification Card
u Personal Statement of Holdings as of December 31, 2008
u Personal Mail Ballot/Proxy Form
If you have not executed and returned the personal Mail Ballot/Proxy Form issued in your name, you are requested to bring this document to the meeting with you foridentification and voting purposes.
John D’AgataSecretary, Pension Administration CommitteeApril 2009
McGill UniversityPENSION PLAN
1
M c G I L L U N I V E R S I T Y P E N S I O N P L A N
M c G I L L U N I V E R S I T Y P E N S I O N P L A N
This Annual Report reviews and highlights the investment and administrativeactivities of the Pension Administration Committee (“PAC”) of the McGillUniversity Pension Plan (“Plan”) for the fiscal year ended December 31st, 2008.
StructureThe Committee is composed of nine members, of which four are elected by the members of the Plan, two are designated by the Board of Governors and twoare designated by the Principal and the Chair of the Board. One independentmember is appointed by the Board of Governors acting upon therecommendation of the PAC.
PAC Membership Changes in 2008The following changes occurred in the membership of the PAC during the year. Atthe Annual Meeting held on May 6th, Ms. Kathleen Tobin was elected asAdministrative & Support Staff representative replacing Mr. Leo Kerklaan. In June2008, Ms. Cristiane Tinmouth replaced Mr. Albert Caponi as the representative forthe Principal and Chair of the Board of Governors. The PAC extends its thanks toMr. Kerklaan and Mr. Caponi for their wise counsel and valuable contributions to thedeliberations of the PAC.
ResponsibilitiesAs trustees of the Pension Fund, the members of the PAC have fiduciaryresponsibility for ensuring that investments are made on a prudent basis and inaccordance with the demographic profile of its members and the financial needsof the membership. The PAC is also responsible for all administrative matterspertaining to the provision of benefits as set forth in the Plan Document and acts within the framework of legislation and regulations issued under theSupplemental Pension Plans Act of the Province of Quebec and the Income Tax Act ofCanada. These responsibilities are discharged through regular meetings of the PACand through a network of external advisors, consultants and the staff of PensionAdministration and Pension Investments. During 2008, there were twelvemeetings of the full PAC and a number of informal working group meetings. Aninternal support staff of 16 acting under the direction and guidance of the PACcarry out the daily investment and administrative operations of the Plan.
Pension Investment Board (“PIB”)The fundamental role of the PIB, created in 1999 by the PAC, is to developdetailed investment policies and set investment strategy that is recommended tothe PAC for approval.
The PIB is responsible for overseeing the implementation of investment policy. Itconsists of four to six independent external members who are not part of McGillUniversity administration or staff and who are not members of another decision-making body within the pension plan governance structure.
Introduction to 37th ANNUAL REPORT
2

In September 2008, Mr. Carl Otto’s term endedand he was replaced by Mr. Scott Taylor. The PACand the PIB would like to express their sincereappreciation for the wise counsel and valuablecontributions that Mr. Otto made as Chair of thePIB since its inception in 1999.
The current members of the PIB are: Mr. DonaldWalcot, Chair; Ms. Maureen Farrow; Mr. Chilion
Heward; Mr. Pierre Lajeunesse; and Mr. Scott Taylor.PIB members, who are appointed by the PAC, servestaggered terms of not more than five years and arelimited to a maximum of two consecutive terms.
During 2008, there were seven regular meetings ofthe PIB as well as numerous teleconference calls.
3
The assets of the Pension Fund are invested inthree separate investment portfolios inaccordance with the three liability segments of the Pension Plan:
u assets in respect of active staff members areinvested prior to retirement in theAccumulation Fund,
u assets in respect of retired members who haveopted for an internal settlement are investedin the Pensioner Fund, and
u assets necessary to provide any supplementarypensions required to meet the provisions ofthe Defined Benefit Minimum Provision aswell as previous contributions made by theUniversity resulting from solvency deficits areinvested in the Supplemental Fund.
The PAC has adopted a comprehensive Statementof Investment Policy which addresses such issuesas investment objectives, risk tolerance, assetallocation, permissible asset classes, investmentdiversification, liquidity requirements, expectedrates of return, valuation procedures and otherissues relevant to the investment process, therebyestablishing a framework within which all theinvestment managers must operate.
The policy is reviewed on a regular basis andupdated when necessary to ensure that itcontinues to meet legal standards and theinvestment requirements of the membership. Acopy of the policy, most recently updated in June2008, can be found on our website at:http://www.mcgill.ca/pensions/investments/ or can be viewed in the offices of the PAC, duringnormal business hours.
The Accumulation Fund, consisting of an EquityPool, a Fixed Income Pool, a Socially ResponsibleInvestment (SRI) Pool, a Money Market Pool and a Workout Asset Pool, is the section of thePension Fund in which the assets of activemembers are invested prior to retirement. Thisstructure offers a wide range of possible financialstrategies and will allow members to create thespecific investment strate gies that will bestrespond to their financial needs.
The PAC also maintains a Balanced Account thatconsists of allocations to the Equity Pool and theFixed Income Pool. The current policy targetprovides that 65% of the assets of the Balanced
Account are allocated to the Equity Pool and 35%are allocated to the Fixed Income Pool. Thecalculation of the Defined Benefit MinimumProvision, as applicable, is compared to theperformance of the Balanced Account.
The PAC expects that the general policy of globalequity diversification that is in effect will continueto be a cornerstone of the strategic asset allocationpolicy for the Equity Pool, the SRI Pool and theBalanced Account.
The investment objectives for the Equity Pool,Fixed Income Pool, SRI Pool, Money Market Pooland Workout Asset Pool, as well as the BalancedAccount are disclosed in Appendix IV.
M c G I L L U N I V E R S I T Y P E N S I O N P L A N
FundINVESTMENTS
The AccumulationFUND
Balanced Account – Asset Allocation Policy, Related Benchmarks and Actual Asset Allocation as at December 31, 2008
Current ActualPolicy BalancedAllocation Account
Asset Class Benchmark (%) (%) MIN% MID% MAX%
Equity Pool
Cash & Cash Equivalents DEX 91-Day T-Bill 0 10.4 0 0 10
Canadian Equities S&P/TSX Composite 27 23.1 22 27 32
US Equities S&P 1500 AllCap or 15 9.9 10 15 20S&P 500 LargeCap (8) (10) (12)S&P 1000 Small/MidCap (2) (5) (8)
Non-NorthAmerican Equities MSCI EAFE 12 8.3 9 12 15
S&P/IFCI 3 3.2 1 3 5
Alternative Equities:Real Estate Industry Composite 4 3.7 0 4 8Private Equity S&P/TSX Composite 2 5.1 0 2 4Resource Properties S&P/TSX Capped Energy Trust 2 1.2 0 2 4
65% 64.9% 65%
Fixed Income Pool
Cash & Cash Equivalents DEX 91-Day T-Bill 2 2.7 0 2 20Bonds DEX Universe Bond 18 20.5 16 18 20
DEX Real Return 11 9.1 9 11 13ML Global HY (hedged) 4 2.8 3 4 5
35% 35.1% 35%
Balanced Account 100% 100.0% 100%
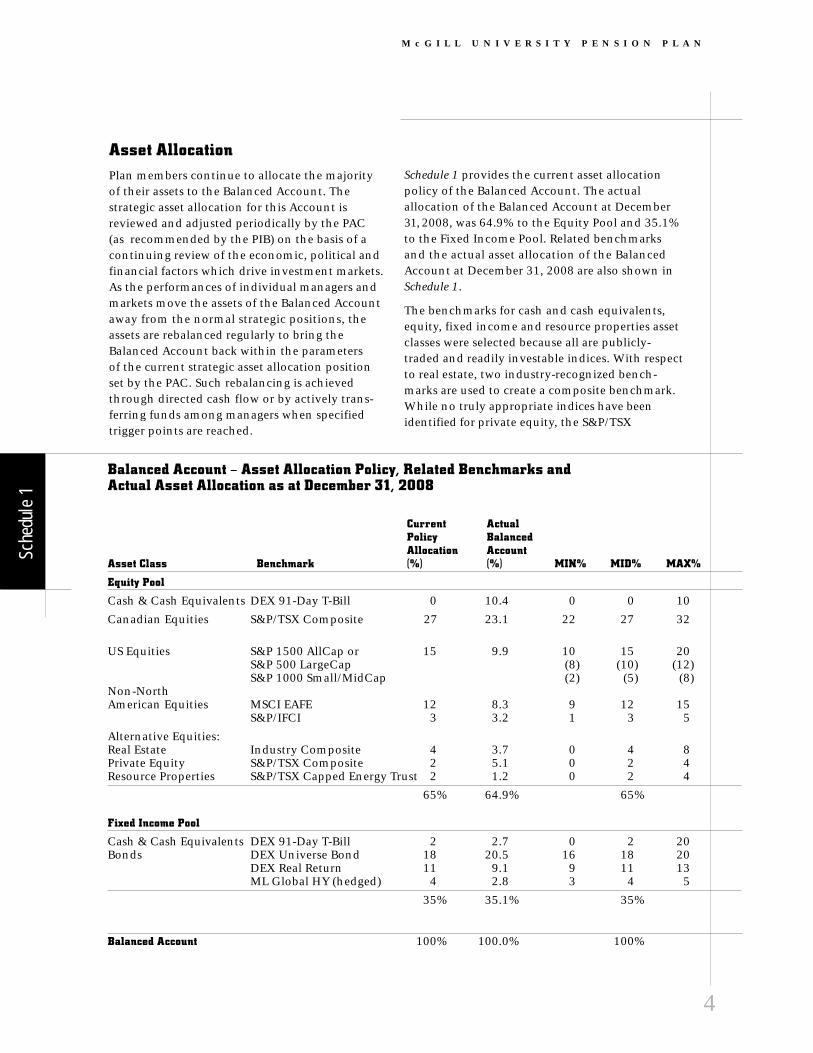
Asset AllocationPlan members continue to allocate the majority of their assets to the Balanced Account. Thestrategic asset allocation for this Account isreviewed and adjusted periodically by the PAC(as recommended by the PIB) on the basis of acontinuing review of the economic, political andfinancial factors which drive investment markets.As the performances of individual managers andmarkets move the assets of the Balanced Accountaway from the normal strategic positions, theassets are rebalanced regularly to bring theBalanced Account back within the parameters of the current strategic asset allocation positionset by the PAC. Such rebalancing is achievedthrough directed cash flow or by actively trans-ferring funds among managers when specifiedtrigger points are reached.
Schedule 1 provides the current asset allocationpolicy of the Balanced Account. The actualallocation of the Balanced Account at December31, 2008, was 64.9% to the Equity Pool and 35.1%to the Fixed Income Pool. Related benchmarksand the actual asset allocation of the BalancedAccount at December 31, 2008 are also shown inSchedule 1.
The benchmarks for cash and cash equivalents,equity, fixed income and resource properties assetclasses were selected because all are publicly-traded and readily investable indices. With respectto real estate, two industry-recognized bench -marks are used to create a composite benchmark.While no truly appropriate indices have beenidentified for private equity, the S&P/TSX
M c G I L L U N I V E R S I T Y P E N S I O N P L A N
4
Sche
dule
1

5
Composite is used as a benchmark for this assetclass.
The actual asset allocations in the AccumulationFund at any particular time will reflect the strate gic asset allocation policies with respect to the Balanced Account, the separate assetallocation policies followed by members whoutilize an investment strategy other than
the Balanced Account as well as the allocation bythe Pensioner Fund to the Accumulation Fund($89.7 million in Fixed Income Pool units atDecember 31, 2008).
The actual management and asset allocationstructure of the Accumulation Fund as atDecember 31, 2008 are shown in Schedule 2.
M c G I L L U N I V E R S I T Y P E N S I O N P L A N
Accumulation Fund – Asset Allocation and Manager Structure – December 31, 2008
Amount % of PoolAsset Class Manager (millions) Holdings
Equity Pool
Cash & Cash Equivalents: Internal/TD Asset Management $ 86.9 16.0%
Canadian Equities: Jarislowsky Fraser 88.9 16.4%TD Asset Management 84.0 15.5%Van Berkom & Associates 19.8 3.6%
US Equities: New York Life Investment Management 26.9 5.0%LSV Asset Management – LargeCap 26.0 4.8%LSV Asset Management – Small/MidCap 21.4 4.0%State Street Global Advisors 8.6 1.6%
Non-North American Equities: Brandes Investment Partners 39.3 7.3%William Blair & Company 30.1 5.6%Capital International 21.7 4.0%Comgest Asset Management Ltd. 2.7 0.5%Aberdeen Asset Management Ltd. 2.0 0.4%
Real Estate: External 31.0 5.7%Private Equity: External 42.4 7.8%Resource Properties: Internal 9.8 1.8%
Total Equity Pool: $ 541.5 100.0%
Fixed Income Pool
Cash & Cash Equivalents: TD Asset Management $ 15.1 3.9%Non-bank ABCP: Internal 14.2 3.6%
Real-Return Bonds: Phillips, Hager & North 102.1 26.1%High-Yield Bonds: Phillips, Hager & North 31.1 7.9%Short-Term Bonds: Phillips, Hager & North 46.6 11.9%Bonds: Addenda Capital 102.4 26.1%
TD Asset Management 80.1 20.5%
Total Fixed Income Pool: $ 391.6 100.0%
SRI Pool Guardian Ethical Management $ 9.2 100.0%
Money Market Pool (MMP):
Cash & Cash Equivalents: Internal/TD Asset Management $ 13.2 100.0%
Workout Asset Pool
Non-bank ABCP: Internal $ 2.8 100.0%
Total Accumulation Fund: $ 958.3
Sche
dule
2

Investment Management The following investment manager changes weremade in 2008:
In March 2008, the non-North American equitymandate of JPMorgan Asset Management wasterminated. In April 2008, Guardian EthicalManagement Inc. was hired to manage a “sociallyresponsible investment” mandate for the SRIPool. In July 2008, a commitment in the amountof $8 million was made to Redbourne Realty FundII Inc., a Canadian real estate fund. BetweenOctober and December 2008, the fund’sinvestment in the Fortis (formerly ABN AMRO)Global Real Estate Fund was liquidated.
Comgest Asset Management InternationalLimited and Aberdeen Asset Management Inc.were hired to manage non-North Americanemerging markets mandates, in October andNovember 2008, respectively.
PerformanceMARKET PERFORMANCE
After many years of positive performance,Canadian equities provided negative returns in2008. The S&P/TSX Composite Index decreasedby 33.0%. All sectors recorded negative returns,with the Financial and Energy sectors contribut-ing the most to the negative performance. TheS&P/TSX SmallCap Index, the measure of small-cap performance, was down 45.5% during theyear. The DEX Universe Bond Index and the DEXShort-Term Bond Index gained 6.4% and 8.6%,respectively. Real-return bonds returned 0.7% forthe year versus the 0.4% return of the DEX Real-Return Bond Index.
The Canadian dollar depreciated 18.1% versus theUS dollar during the year. In Canadian dollarterms, the S&P 500 lost 21.2% for the year out-performing the S&P/TSX Composite Index for thefirst time in seven years. Overall returns inCanadian dollars for the S&P 1500, S&P 1000 andthe S&P 400 indices were -21.0%, -21.9%, and-20.2%, respectively, reflecting the relativesimilarity in return for small, mid and large capstocks during the year. Non-North Americanmarkets represented by the MSCI EAFE Index andthe S&P/IFCI Index finished the year with returns of -28.8% and -42.1%, respectively.
FUND PERFORMANCE
Schedule 3 following shows the gross rates of marketreturns achieved by the various asset classescomprising each of the investment pools and bythe Balanced Account for the one, five and tenyear periods ended December 31, 2008. Theapplicable benchmark performance for each assetclass is also noted in Schedule 3.
The Equity Pool returned -23.5% for the year incomparison to the composite benchmark of -28.2%. The Canadian equity performance of -28.7% was above the S&P/TSX Composite Indexbenchmark of -33.0%. The performance of alter -native equity assets at -15.0% outperformed itsS&P/TSX Composite Index benchmark. The USequity performance of -21.0% was almost equal tothe S&P 1500 benchmark perfor mance of -20.9%for the year, while the non-North Americanequity performance of -29.5%, was ahead of itscomposite benchmark of -31.6%.
The Fixed Income Pool turned in a performanceof 1.9% for the year, lagging the 2.3% return of itscomposite benchmark.
The Balanced Account’s performance of -14.9% for the year outperformed its composite bench-mark of -18.5%.
The SRI Pool’s performance of -17.7% since itsinception, was ahead of the -19.6% return of itsbenchmark, the GEM Balanced Benchmark.
The Money Market Pool returned 2.8% for theyear, slightly higher than the 2.6% return of theDEX 30-Day T-Bill Index.
6
M c G I L L U N I V E R S I T Y P E N S I O N P L A N

Accumulation Fund Performance1 as at December 31, 2008
Annualized Rates of ReturnAsset Class 1 year 5 years 10 years
Equity Pool:Cash & Cash Equivalents: 2.9% 2.7% 3.5%Benchmark DEX 91-Day T-Bill: 3.3% 3.3% 3.7%
Canadian Equities: -28.7% 5.7% 5.6%Benchmark S&P/TSX Composite: -33.0% 4.2% 5.3%
US Equities: -21.0% -4.3% -1.2%Benchmark S&P 1500: -20.9% -2.8% -3.1%
Non-North American Equities: -29.5% 3.4% 3.4%Benchmark 80% MSCI EAFE + 20% S&P/IFCI: -31.6% 2.6% 0.7%
Alternative Equities2: -15.0% 6.0% 9.1%Benchmark S&P/TSX Composite2a: -33.0% 4.2% 5.3%
Total Equity Pool: -23.5% 3.7% 4.0%Composite Equity Pool Benchmark3: -28.2% 2.8% 3.2%
Fixed Income Pool:Cash & Cash Equivalents4: -7.6% 0.5% 2.4%Benchmark DEX 91-Day T-Bill: 3.3% 3.3% 3.7%
Bonds: 3.2% 5.7% 6.3%Composite Bond Benchmark5: 2.2% 4.8% 5.9%
Total Fixed Income Pool: 1.9% 5.0% 5.9%Composite Fixed Income Pool Benchmark6: 2.3% 4.7% 5.8%
Balanced Account: -14.9% 4.6% 5.1%Composite Balanced Account Benchmark7 -18.5% 3.8% 5.8%
Socially Responsible Investment Pool8: -17.7% n/a n/aGEM Balanced Benchmark8: -19.6% n/a n/a
Money Market Pool: 2.8% 3.3% 3.8%Benchmark DEX 30-Day T-Bill: 2.6% 3.1% 3.5%
Workout Asset Pool4,9: -27.7% n/a n/a
Note 1: Returns have been determined by an independent performance measurement firm, are reported in Canadian dollarsand are gross of fees.
Note 2: Total of Real Estate, Private Equity and Resource Property Portfolios.
Note 2a: This benchmark is currently being reviewed by the PIB.
Note 3: Current policy allocation benchmark is 50% of S&P/TSX Composite Index + 22% of S&P 1500 Index + 18% of EAFE Index + 6% of Real Estate Industry Composite + 4% of S&P/IFCI Index.
Note 4: The annualized returns include the write-downs to the non-bank ABCP held in the pool.
Note 5: Current benchmark is 57% of DEX Universe Bond Index + 33% of DEX Real-Return Bond Index + 10% of ML Global HY (hedged).
Note 6: Current policy allocation benchmark is 53% of DEX Universe Bond Index + 31.25% DEX Real-Return Bond Index + 9.5% of ML Global HY (hedged) + 6.25% of DEX 91-Day T-Bill Index.
Note 7: Current policy allocation benchmark is 65% of Composite Equity Pool Benchmark + 35% of Composite Fixed Income Pool Benchmark.
Note 8: Socially Responsible Investment Pool began in April 2008.
Note 9: Workout Asset Pool was established August 31, 2007. Since its inception, the return is -34.6%. For additional detail,see page 15.
7
M c G I L L U N I V E R S I T Y P E N S I O N P L A N
Sche
dule
3

35.6%
15.4%
16.0%
17.7% Canadian
US
Non-North American
Alternative Investments
Cash & Cash Equivalents
15.3%
M c G I L L U N I V E R S I T Y P E N S I O N P L A N
Summary of Equity Pool Investments
Accu
mula
tion
Fund
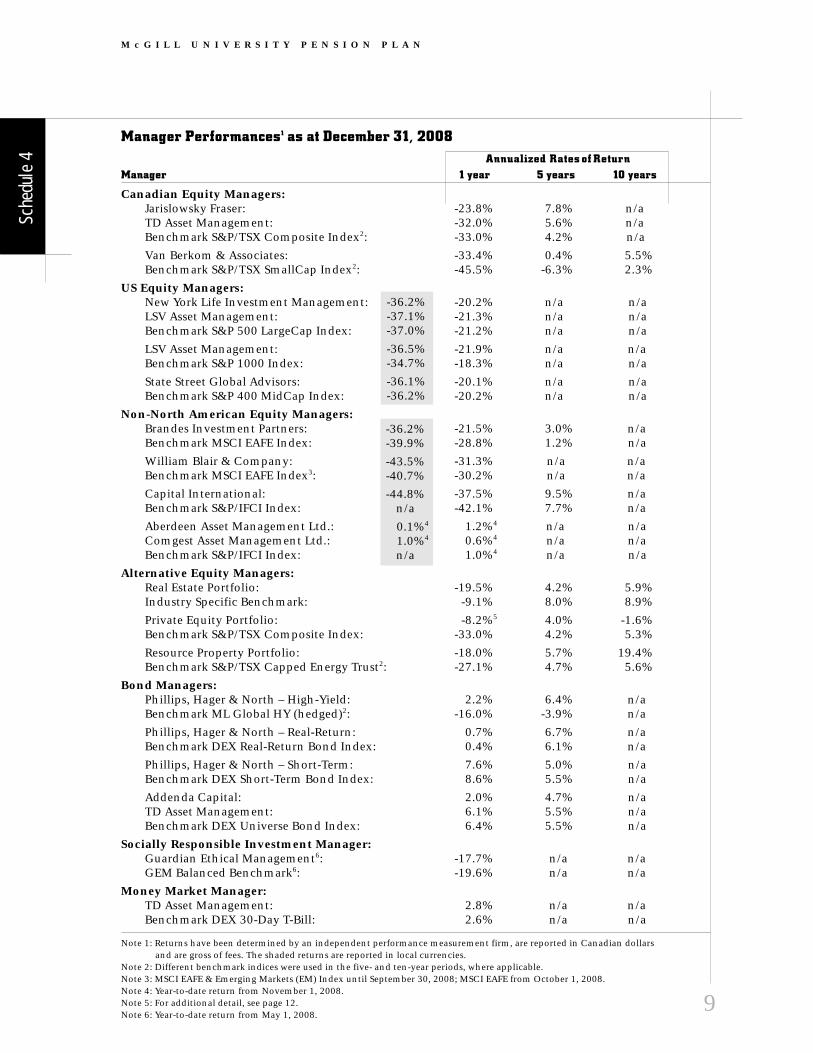
Fund for the calendar year 2008 and, whereapplicable, over the five and ten-year periodsending December 31st, 2008. The benchmarksapplicable to each manager and alternative equityportfolio are also noted in Schedule 4.
The shaded area of Schedule 4 shows the grossrates of market returns and benchmarksapplicable to the US and non-North Americanmanagers for the 2008 calendar year expressed inlocal currencies.
EQUITY POOL
The Equity Pool includes Canadian, US, and non-North American equities, investments inalternative strategies and cash and cashequivalents.
At December 31, 2008, the Equity Pool held$278,000, which represents 0.05% of the totalEquity Pool, in non-bank asset-backedcommercial paper (ABCP).
8
Long-Term Expected Rate of ReturnEquity Pool: 4.0% plus the annual change in the Canadian Consumer Price Index (CPI).
Fixed Income Pool: 2.0% plus the annual change in the Canadian CPI.
Balanced Account: 3.3% plus the annual change in the Canadian CPI.
SRI Pool: 3.30% plus the annual change in the Canadian CPI.
Money Market Pool: The return on the DEX 30-Day T-Bill Index, before fees.
While the objectives above are meant to be long-term (no less than 10 years), the following table includes comparative performance over 1 and 5 years:
1-year Long-Term 5-year Long-Term 10-year Long-TermReturn Objective Return Objective Return Objective
Equity Pool: -23.5% 5.2% 3.7% 5.9% 4.0% 6.2%
Fixed Income Pool: 1.9% 3.2% 5.0% 3.9% 5.9% 4.2%
Balanced Account: -14.9% 4.5% 4.6% 5.2% 5.1% 5.5%
SRI Pool1: n/a n/a n/a n/a n/a n/a
Money Market Pool: 2.8% 2.6% 3.3%2 3.2% 3.8%2 3.6%
CPI for the period: 1.2% 1.9% 2.2%
Note 1: SRI Pool began in April 2008.Note 2: Excludes the impact of the Workout Asset Pool returns for 2007 and 2008.
Investment Manager PerformanceSchedule 4 shows the gross rates of market returnsachieved by the various specialist managers andalternative equity portfolios of the Accumulation
The key to performance is meeting the long-terminvestment objectives that are specific to thePension Fund.
As shown in the following table, theperformances of the Fixed Income Pool and
Money Market Pool surpassed their respectivelong-term benchmarks as at December 31, 2008,measured over no less than ten years. Those ofthe Equity Pool and Balanced Account fell short,primarily due to the impact of their one-yearreturns.
9
Manager Performances1 as at December 31, 2008Annualized Rates of Return
Manager 1 year 5 years 10 years
Canadian Equity Managers:Jarislowsky Fraser: -23.8% 7.8% n/aTD Asset Management: -32.0% 5.6% n/aBenchmark S&P/TSX Composite Index2: -33.0% 4.2% n/a
Van Berkom & Associates: -33.4% 0.4% 5.5%Benchmark S&P/TSX SmallCap Index2: -45.5% -6.3% 2.3%
US Equity Managers:New York Life Investment Management: -20.2% n/a n/aLSV Asset Management: -21.3% n/a n/aBenchmark S&P 500 LargeCap Index: -21.2% n/a n/a
LSV Asset Management: -21.9% n/a n/aBenchmark S&P 1000 Index: -18.3% n/a n/a
State Street Global Advisors: -20.1% n/a n/aBenchmark S&P 400 MidCap Index: -20.2% n/a n/a
Non-North American Equity Managers:Brandes Investment Partners: -21.5% 3.0% n/aBenchmark MSCI EAFE Index: -28.8% 1.2% n/a
William Blair & Company: -31.3% n/a n/aBenchmark MSCI EAFE Index3: -30.2% n/a n/a
Capital International: -37.5% 9.5% n/aBenchmark S&P/IFCI Index: -42.1% 7.7% n/a
Aberdeen Asset Management Ltd.: 1.2%4 n/a n/aComgest Asset Management Ltd.: 0.6%4 n/a n/aBenchmark S&P/IFCI Index: 1.0%4 n/a n/a
Alternative Equity Managers:Real Estate Portfolio: -19.5% 4.2% 5.9%Industry Specific Benchmark: -9.1% 8.0% 8.9%
Private Equity Portfolio: -8.2%5 4.0% -1.6%Benchmark S&P/TSX Composite Index: -33.0% 4.2% 5.3%
Resource Property Portfolio: -18.0% 5.7% 19.4%Benchmark S&P/TSX Capped Energy Trust2: -27.1% 4.7% 5.6%
Bond Managers:Phillips, Hager & North – High-Yield: 2.2% 6.4% n/aBenchmark ML Global HY (hedged)2: -16.0% -3.9% n/a
Phillips, Hager & North – Real-Return: 0.7% 6.7% n/aBenchmark DEX Real-Return Bond Index: 0.4% 6.1% n/a
Phillips, Hager & North – Short-Term: 7.6% 5.0% n/aBenchmark DEX Short-Term Bond Index: 8.6% 5.5% n/a
Addenda Capital: 2.0% 4.7% n/aTD Asset Management: 6.1% 5.5% n/aBenchmark DEX Universe Bond Index: 6.4% 5.5% n/a
Socially Responsible Investment Manager:Guardian Ethical Management6: -17.7% n/a n/aGEM Balanced Benchmark6: -19.6% n/a n/a
Money Market Manager:TD Asset Management: 2.8% n/a n/aBenchmark DEX 30-Day T-Bill: 2.6% n/a n/a
Note 1: Returns have been determined by an independent performance measurement firm, are reported in Canadian dollars and are gross of fees. The shaded returns are reported in local currencies.
Note 2: Different benchmark indices were used in the five- and ten-year periods, where applicable.Note 3: MSCI EAFE & Emerging Markets (EM) Index until September 30, 2008; MSCI EAFE from October 1, 2008.Note 4: Year-to-date return from November 1, 2008.Note 5: For additional detail, see page 12.Note 6: Year-to-date return from May 1, 2008.
M c G I L L U N I V E R S I T Y P E N S I O N P L A N
Sche
dule
4
-36.2%-37.1%-37.0%
-36.5%-34.7%
-36.1%-36.2%
-36.2%-39.9%
-43.5%-40.7%
-44.8%n/a
0.1%4
1.0%4
n/a

CANADIAN EQUITY INVESTMENTS
The Equity Pool’s holdings ($541.5 million at year-end) are invested in Canadian equities throughboth enhanced index and fully active strategies.For the year, TD Asset Management, whichmanages an enhanced index mandate returned -32.0% and Jarislowsky Fraser, employing a fullyactive investment approach, returned -23.8%,compared to the S&P/TSX Composite return of -33.0%. The performance of Van Berkom &Associates who actively manage a smallcap
10
M c G I L L U N I V E R S I T Y P E N S I O N P L A N
Ten Largest Canadian Publicly Traded Equity Holdings in the Equity Poolas at December 31, 2008
Market Value % of % of BalancedSecurity Name (in millions) Equity Pool Account
Royal Bank of Canada $10.1 1.9% 1.2%
Encana Corporation $8.6 1.6% 1.0%
Manulife Financial Corporation $7.4 1.4% 0.9%
The Bank of Nova Scotia $7.0 1.3% 0.8%
Toronto Dominion Bank $6.9 1.3% 0.8%
Enerplus Resources Fund $5.5 1.0% 0.7%
Potash Corporation of Saskatchewan $5.5 1.0% 0.7%
SNC - Lavalin Group Inc. $5.1 0.9% 0.6%
Enbridge Inc. $4.9 0.9% 0.6%
Suncor Energy Inc. $4.8 0.9% 0.6%
43.6%
1 0.3%
46.1%
Jarislowsky Fraser
TD Asset Management
Van Berkom & Associates
Management Structurein Canadian Equities
mandate was -33.4% for the year, above itsS&P/TSX SmallCap Index benchmark performanceof -45.5%.
At December 31, 2008, approximately 44% of theCanadian equity portfolio was invested in anenhanced index strategy, the same percentage asat December 31, 2007. The entire Canadian equityportfolio was managed externally at year-end.

US EQUITY INVESTMENTS
The Equity Pool’s holdings in US equities ($82.9million at year-end) were allocated to enhancedindex, index and fully active strategies at year-end.
New York Life Investment Management, whichmanages an enhanced large cap mandate,returned -20.2% versus the S&P 500 indexbenchmark return of -21.2%. The S&P MidCapindex fund, managed by State Street GlobalAdvisors, returned -20.1% versus -20.2% for itsbenchmark. LSV Asset Management with two
US equity mandates, returned -21.9% for itssmall/midcap fully active value mandate versus itsbenchmark, the S&P1000 which returned -18.3%for the year, and -21.3% for its enhanced large capmandate versus the S&P500 index benchmarkreturn of -21.2%.
At December 31, 2008, approximately 74% of theUS equity portfolio was invested in an index orenhanced index strategy versus 70% at the end ofDecember 2007. At December 31, 2008, the entireUS equity portfolio was managed externally as itwas at the end of 2007.
NON-NORTH AMERICAN EQUITY INVESTMENTS
The Equity Pool’s holdings in non-NorthAmerican equities ($95.8 million at year-end)were allocated to active managers in bothdeveloped and emerging markets.
Brandes Investment Partners, following a valuestyle solely in developed markets, returned -21.5%compared to the benchmark MSCI EAFE return of -28.8% for the year. William Blair & Company,following a growth mandate in developed andemerging markets up until September 30th andsolely in developed markets thereafter, returned -31.3% for the year versus the benchmark return of -30.2%. The -37.5% return of the CapitalInternational Emerging Markets Fund, investedsolely in emerging market stocks, outperformed
11
Ten Largest US Publicly Traded Equity Holdings in the Equity Poolas at December 31, 2008
Market Value % of % of BalancedSecurity Name (in Cdn $ millions) Equity Pool Account
Exxon Mobil $3.0 0.6% 0.4%
Chevron Corporation $1.2 0.2% 0.1%
AT & T $1.2 0.2% 0.1%
Pfizer $1.1 0.2% 0.1%
Procter & Gamble $1.1 0.2% 0.1%
Microsoft $1.1 0.2% 0.1%
IBM $1.0 0.2% 0.1%
Johnson & Johnson $1.0 0.2% 0.1%
Verizon Communications $1.0 0.2% 0.1%
General Electric $0.9 0.2% 0.1%
M c G I L L U N I V E R S I T Y P E N S I O N P L A N
1 0.4%
25.8%
31.4%
32.4%
State Street Global Advisors
LSV Asset Management (Small/MidCap)
LSV Asset Management (LargeCap)
New York Life Investment Management
Management Structure in US Equities

12
Ten Largest Non-North American Publicly Traded Equity Holdings in the Equity Poolas at December 31, 2008
Market Value % of % of BalancedSecurity Name (in Cdn $ millions) Equity Pool Account
Sanofi-Aventis (France) $1.7 0.3% 0.2%
Deutsche Telekom (Germany) $1.6 0.3% 0.2%
Nippon Tel & Tel (Japan) $1.5 0.3% 0.2%
Astrazeneca (United Kingdom) $1.4 0.3% 0.2%
Glaxosmithkline (United Kingdom) $1.4 0.3% 0.2%
Roche Holdings (Switzerland) $1.3 0.2% 0.2%
Zurich Financial Services (Switzerland) $1.2 0.2% 0.1%
Beiersdorf (Germany) $1.2 0.2% 0.1%
France Telecom (France) $1.2 0.2% 0.1%
Mitsui Sumitomo Insurance (Japan) $1.1 0.2% 0.1%
M c G I L L U N I V E R S I T Y P E N S I O N P L A N
the -42.1% return of its benchmark, the S&P/IFCIindex. Comgest Asset Management and AberdeenAsset Management, hired toward the end ofthe year, had returns similar to to those of theemerging markets S&P/IFCI benchmark.
At December 31, 2008, the entire non-NorthAmerican portfolio was managed externally as itwas at the end of 2007.
ALTERNATIVE EQUITY INVESTMENTS
The Equity Pool’s holdings in alternative strategies($83.2 million at year-end) are meant to provide
41.0%
22.7%
31.4%
2.8% 2.1%
Brandes Investment PartnersCapital InternationalWilliam BlairComgestAberdeen
Management Structure in Non-North American Equities
diversification relative to the publicly-tradedequity and fixed income markets. In 2008, an$8 million commitment was made to RedbourneRealty Fund II Inc., a Canadian real estate fundand the fund’s investment in the Fortis GlobalReal Estate Fund (formerly ABN AMRO GlobalReal Estate Fund) was liquidated.
The real estate porfolio return of -19.5% waslower than the -9.1% return of its compositebenchmark. The real estate portfolio includesboth privately-held real estate which returned -1.8% versus its industry specific benchmark of3.2% and publicly-traded global real estatesecurities and REITs which returned -57.0%versus the -33.8% return of its benchmark, theGPR 250 Net.
The private equity portfolio returned -8.2%versus the S&P/TSX Composite return of -33.0%.The -8.2% return is based on the market valuesof portfolio holdings at September 30, 2008adjusted downward at year-end followingdiscussions with private equity managers. Thereturn in local currency, which excludes theimpact of fluctuations in the value of theCanadian dollar, was approximately -27.0%.
Resource properties which are comprised of oiland gas royalty trust units provided a return of-18.0% versus the S&P/TSX Capped Energy Trustreturn of -27.1%.

13
M c G I L L U N I V E R S I T Y P E N S I O N P L A N
FIXED INCOME POOL
The Fixed Income Pool’s holdings ($391.6 millionat year-end) include allocations to bonds(managed against the DEX Capital Universe BondIndex), high-yield bonds, real-return bonds,short-term bonds and cash and cash equivalents.
At December 31, 2008, the Fixed Income Poolheld $21.8 million, which represents 5.6% of thetotal Fixed Income Pool, in non-bank ABCPwhich at that time was illiquid. As of year end,the PAC has applied a 35% liquidity discount tothe value of such investments.
Addenda Capital, which manages an active bondmandate and TD Asset Management whichmanages an indexed bond mandate returned2.0% and 6.1%, respectively versus the DEXCapital Universe Bond Index of 6.4%. Phillips,Hager & North’s mandate to manage a high-yieldbond fund provided a 2.2% return versus the MLGlobal HY (hedged) Index return of -16.0%, itsbenchmark. The return on real-return bonds of0.7% surpassed the 0.4% return of its benchmark,the DEX Real-Return Bond Index. Philips, Hager& North’s short-term bond mandate returned7.6% versus the DEX Short-Term Bond indexreturn of 8.6%.
26.1%
7.9%
58.5%
7.5%
Real Return Bonds
High Yield Bonds
Nominal Bonds
Cash & Cash Equivalents
Summary of Fixed Income Pool Investments
45.9%24.3%
26.1%
3.7%
Phillips, Hager & North
Addenda
TD Asset Management
Internal
Management Structure in Fixed Income Investments
Ten Largest Fixed Income Pool Holdings as at December 31, 2008
Market Value % of Fixed % of BalancedSecurity Name (in Cdn $ millions) Income Pool Account
Gov’t of Canada 4% 2031/12/01 Real Return $56.8 14.5% 5.0%
Gov’t of Canada 4.25% 2026/12/01 Real Return $33.6 8.6% 3.0%
Gov’t of Canada 4.25% 2021/12/01 Real Return $11.3 2.9% 1.0%
Canada Housing Trust 4.80% 2012/06/15 $9.4 2.4% 0.8%
Financement Québec 1.715% 2013/09/16 $8.4 2.1% 0.7%
Province of Ontario 4.30% 2017/03/08 $7.1 1.8% 0.6%
Canada Mortgage Bonds 1.709% 2013/06/15 $5.2 1.3% 0.5%
Canada Mortgage Bonds 1.724% 2010/03/15 $4.6 1.2% 0.4%
Province of Ontario 4.75% 2013/06/02 $4.4 1.1% 0.4%
Canada Mortgage Bonds 1.714% 2010/09/15 $4.0 1.0% 0.4%

14
M c G I L L U N I V E R S I T Y P E N S I O N P L A N
Ten Largest Socially-Responsible Investment (SRI) Pool Holdings as at December 31, 2008
Market Value % ofSecurity Name (in Cdn $ millions) SRI Pool
Royal Bank of Canada 5.20% 2012/08/15 $0.2 2.3%
Gov’t of Canada 5.75% 2029/06/01 $0.2 2.2%
Enbridge Inc. $0.2 2.0%
Canada Housing Trust 4.00% 2012/06/15 $0.2 2.0%
The Bank of Nova Scotia 4.99% 2013-2018/03/27 $0.2 1.9%
Rogers Communications $0.2 1.8%
Encana Corporation $0.2 1.8%
Canada Housing Trust 3.95% 2013/06/15 $0.1 1.7%
Barrick Gold Corporation $0.1 1.7%
Goldcorp Inc. $0.1 1.6%
SOCIALLY-RESPONSIBLE INVESTMENT(“SRI”) POOL
The SRI Pool was established on April 1, 2008.The SRI Pool has a minimum ongoing thresholdof $8 million, set by the PAC, as a condition ofmaintaining this investment option under thePlan. At December 31, 2008, the SRI Pool had$9.2 million in assets.
The SRI Pool invests in the Guardian EthicalManagement (“GEM”) Balanced Pool. GEM is ajoint venture between Guardian Capital LP andThe Ethical Funds Company, both establishedleaders in their respective fields of expertise.
Guardian Capital LP focuses on investmentmanage ment governed by a sustainablediscipline, whereas The Ethical Funds Companyfocuses on ongoing shareholder engagementand the evaluation of environmental, social andgovernance performance of holdings andinvestment prospects.
The GEM Balanced Pool, and in turn the SRI Pool,invests in Canadian equities, US equities, non-North American equities, Canadian fixed incomeand cash and cash equivalents. The actual SRIPool asset class allocations as at December 31,2008 are shown below.
Guardian Ethical Management, which has a“socially responsible” investment mandate,returned -17.7% for the eight-months endingDecember 31, 2008 versus its benchmark returnof -19.6%.
At December 31, 2008, the entire SRI Pool wasmanaged externally.
34.8%
39.4%
9.3% Canadian Equity
US Equity
Non-North American Equity
Fixed Income
Cash & Cash Equivalents
12.6%
3.9%
Summary of SRI Pool Investments

15
M c G I L L U N I V E R S I T Y P E N S I O N P L A N
Ten Largest Money Market Pool Holdings as at December 31, 2008
Market Value % of MoneySecurity Name (in Cdn $ millions) Market Pool
Gov’t of Canada T-Bill 2009/01/02 $ 3.7 28.2%
Gov’t of Canada T-Bill 2009/01/22 $ 2.6 19.9%
Gov’t of Canada T-Bill 2009/02/05 $ 1.8 13.7%
Gov’t of Canada T-Bill 2009/01/08 $ 1.7 13.0%
Gov’t of Canada T-Bill 2009/02/19 $ 1.0 7.4%
Gov’t of Canada T-Bill 2009/03/05 $ 1.0 7.4%
Gov’t of Canada T-Bill 2009/03/19 $ 0.9 7.1%
Canadian Wheat Board 2009/02/02 $ 0.3 2.5%
Gov’t of Canada T-Bill 2009/05/14 $ 0.1 0.7%
CIBC Mellon Trust Co TD 2009/01/02 $0.04 0.1%
MONEY MARKET POOL
The Money Market Pool’s holdings ($13.2 millionat year-end) include allocations to cash and cashequivalents. Cash equivalents include Federal andProvincial Government issues, Banker’sAcceptances and term deposits.
The externally-managed investments are investedin TD Asset Management’s TD EmeraldGovernment of Canada Fund.
2.5%
97.4%*
0.1%
Government Issued T-Bills
Federal Agency Commercial Paper
Term Deposits
Summary of Money Market Pool Investments
The Money Market Pool generated a return of2.8% for the year versus the 2.6% generated by itsbenchmark, the DEX 30-Day T-Bill Index.
At December 31, 2008, the Money Market Pooldid not hold non-bank ABCP as these holdingswere transferred to the Workout Asset Pool onAugust 31, 2007.
WORKOUT ASSET POOL
The Workout Asset Pool was established inAugust 2007 to hold the non-bank asset-backedcommercial paper (ABCP) which was initiallyheld in the Money Market Pool at the time of thecredit market disruptions in August 2007 whichresulted in the inability of the issuers of suchcommercial paper to repay maturing issues.
At December 31, 2008, the Workout Asset Poolheld $4.35 million in non-bank ABCP which atthat time was illiquid. As of year-end, the PAChas applied a 35% liquidity discount to the valueof such investments, reducing the value of theholdings to $2.8 million.
The Workout Asset Pool generated a return of -27.7% for the year ending December 31, 2008.
For further information, please refer to thePension Plan’s website at:www.mcgill.ca/pensions/communiques/.
*Includes 28.2% allocation to reverse repurchase agreementwith a Canadian Schedule A chartered bank which maturedJanuary 2, 2009. A reverse repurchase agreement is theimmediate purchase of securities (i.e. Government of CanadaT-Bills) and a simultaneous agreement to resell thesesecurities at a later date and agreed upon price.

Unit Values Unit values are calculated on a single-month basiswith a one-month lag (i.e. units valued atDecember, were based on the market value ineffect in November). In addition, the unit valuesare net of all investment and administrationexpenses and fluctuate (subject to increase ordecrease) based on prevailing market conditions.Consequently, the unit value returns can be quitedifferent from the market performance returns setout in Schedule 3, which are reported gross of feesand on a calendar basis.
The annual rates of return achieved by investors inthe various pools over the last 10 years, measuredon the basis of unit values as at December 31stof each year, calculated as described above, areshown in Schedule 5.
The actual rate of return earned during the yearby a member’s account will, of course, varyaccording to the mix of investments chosen bythe member. For members who have changedtheir asset mix strategies from time to time overthe years, the long-term rate of return will alsoreflect the gains and/or losses that were achieved
as a result of such changes. As noted earlier, onlythe performance of the Balanced Account is takeninto account in the calculation of your DefinedBenefit Minimum Provision, if applicable. If youhave participated in any of the other investmentpools, your Defined Benefit Minimum Provisionwill be adjusted to reflect the impact of theinvestment gains or losses achieved under thosepools rela tive to the performance of the BalancedAccount.
Charts 1A and IB on page 24 illustrate thehistorical progress of the unit values frominception of the Plan in 1972 until December 31,2008. A listing of unit values for the past 10 yearsis shown in Appendix III.
Unit Values – Historic PerformanceFixed Socially Money Workout
Balanced Equity Income Responsible Market AssetYear Account Pool Pool Investment Pool Pool Pool
1999 10.77% 15.22% 1.38% 5.16%
2000 15.12% 18.28% 6.85% 5.87%
2001 -8.39% -15.01% 6.80% 5.10%
20021 -0.87% -4.80% 7.51% 2.96%
2003 11.80% 11.78% 10.77% 3.02%
2004 12.53% 13.75% 10.01% 2.36%
2005 14.97% 18.13% 7.96% 2.70%
2006 13.81% 17.89% 4.73% 3.99%
2007 2.23% 2.52% 0.94% 4.43% -9.60%2
2008 -15.68% -23.62% 0.32% -17.90%3 2.78% -11.15%
10-Year Annualized Rate of Return: 5.09% 4.34% 5.67% n/a 3.83% n/a
Note 1: Unit values are calculated on a monthly basis with a one-month lag. For market performance on a calendar-yearbasis please refer to Schedule 3 on page 7.
Note 2: 4 months only – Workout Asset Pool was established in August 2007.
Note 3: 8 months only – Socially Responsible Investment (SRI) Pool was established in April 2008.
Updates on the web
Unit values and current performancenumbers are updated monthly and can be viewed on our web site:www.mcgill.ca/pensions/unithistory.
M c G I L L U N I V E R S I T Y P E N S I O N P L A N
Sche
dule
5
16

The PensionerFUND
17
M c G I L L U N I V E R S I T Y P E N S I O N P L A N
The Pensioner Fund is the section of the PensionFund that contains the assets required to financethe benefits for retired staff who have opted for aninternal pension settlement. The investmentobjective of the Pensioner Fund is to optimize thereturn of the fund over the long term in such amanner as to provide high security for pensions inprogress, to provide enhance ments of pensionamounts in accordance with the Plan Documentand to minimize the possibility of actuarialdeficiencies. It seeks to achieve this objective byinvesting in a diversified portfolio of fixedincome and equity investments.
Asset AllocationDuring 2008, there were no asset allocationchanges made.
The mortgage portfolio continued to decrease invalue due to mortgage repayments. The mortgagesare issued by Aylmer & Sherbrooke InvestmentsInc., a captive mortgage corporation wholly-owned by the McGill University Pension Plan.The corporation is accredited by the CanadaMortgage and Housing Corporation (CMHC). The mortgage portfolio is secured by Canadian realestate and is diversified on the basis of geographyand type of product.
At December 31, 2008, approximately 69% of the Pensioner Fund’s portfolio was managedexternally versus 66% in 2007.
As the performances of individual managers andmarkets move the assets of the Pensioner Fundaway from the strategic asset allocation policyestablished by the PAC, consideration is given torebalancing the assets back to policy.
At December 31, 2008, the Pensioner Fund held$14.8 million, which represents 5.7% of thePensioner Fund, in non-bank asset-backedcommercial paper (ABCP) which at that time wasilliquid. As of year-end, the PAC has applied a35% liquidity discount to the value of suchinvestments. For further information, please referto the Pension Plan’s website at the following link:www.mcgill.ca/pensions/communiques/.
Schedule 6 compares the actual Pensioner Fundholdings to the policy allocation on the basis ofmarket values as at December 31, 2008.
Investment ManagementIn July 2008, an $8 million commitment wasmade to Redbourne Realty Fund II Inc., aCanadian real estate fund.
Pensioner Fund – Asset Allocation Policy
December 3 1 , 2008
Amount % ofAsset Class Manager (in millions) Total Fund MIN% MID% MAX%
Cash & Cash Equivalents Int/Ext. 15.7 6.1 0 5 10
Non-bank ABCP Internal 9.6 3.7 - - -
Bonds1 External 66.3 25.9 17 20 23
Real-Return Bonds1 External 23.4 9.1 8 10 12
Mortgages Internal 61.4 23.9 25 30 35
Real Estate External 37.9 14.8 10 12 14
Equity External 34.3 13.4 16 19 22
Resource Properties Internal 8.0 3.1 2 4 6
Total Pensioner Fund: $256.6 100.0% 100%
1 Exposure to bonds and real-return bonds is through the Accumulation Fund – Fixed Income Pool units.
Sche
dule
6
M c G I L L U N I V E R S I T Y P E N S I O N P L A N
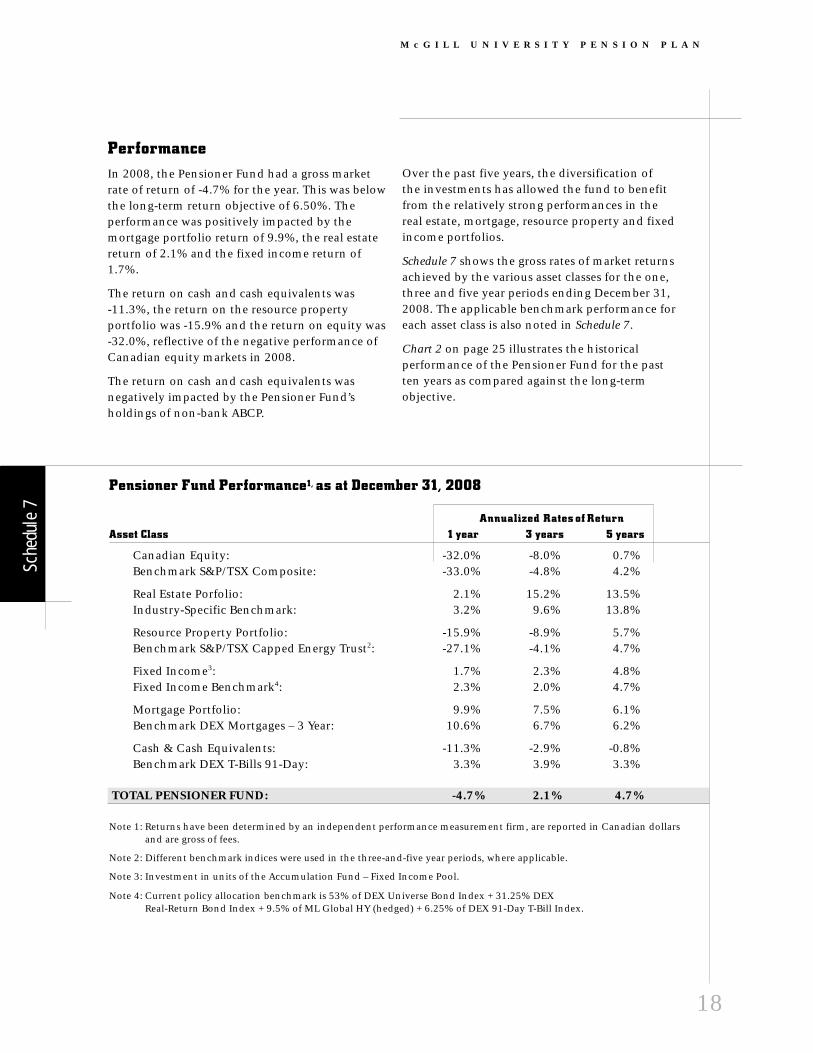
PerformanceIn 2008, the Pensioner Fund had a gross marketrate of return of -4.7% for the year. This was belowthe long-term return objective of 6.50%. Theperformance was positively impacted by themortgage portfolio return of 9.9%, the real estatereturn of 2.1% and the fixed income return of1.7%.
The return on cash and cash equivalents was-11.3%, the return on the resource propertyportfolio was -15.9% and the return on equity was-32.0%, reflective of the negative performance ofCanadian equity markets in 2008.
The return on cash and cash equivalents wasnegatively impacted by the Pensioner Fund’sholdings of non-bank ABCP.
Over the past five years, the diversification of the investments has allowed the fund to benefitfrom the relatively strong performances in thereal estate, mortgage, resource property and fixedincome portfolios.
Schedule 7 shows the gross rates of market returnsachieved by the various asset classes for the one,three and five year periods ending December 31,2008. The applicable benchmark performance foreach asset class is also noted in Schedule 7.
Chart 2 on page 25 illustrates the historicalperformance of the Pensioner Fund for the pastten years as com pared against the long-termobjective.
Sche
dule
7
18
Pensioner Fund Performance1, as at December 31, 2008
Annualized Rates of ReturnAsset Class 1 year 3 years 5 years
Canadian Equity: -32.0% -8.0% 0.7%Benchmark S&P/TSX Composite: -33.0% -4.8% 4.2%
Real Estate Porfolio: 2.1% 15.2% 13.5%Industry-Specific Benchmark: 3.2% 9.6% 13.8%
Resource Property Portfolio: -15.9% -8.9% 5.7%Benchmark S&P/TSX Capped Energy Trust2: -27.1% -4.1% 4.7%
Fixed Income3: 1.7% 2.3% 4.8%Fixed Income Benchmark4: 2.3% 2.0% 4.7%
Mortgage Portfolio: 9.9% 7.5% 6.1%Benchmark DEX Mortgages – 3 Year: 10.6% 6.7% 6.2%
Cash & Cash Equivalents: -11.3% -2.9% -0.8%Benchmark DEX T-Bills 91-Day: 3.3% 3.9% 3.3%
TOTAL PENSIONER FUND: -4.7% 2.1% 4.7%
Note 1: Returns have been determined by an independent performance measurement firm, are reported in Canadian dollars and are gross of fees.
Note 2: Different benchmark indices were used in the three-and-five year periods, where applicable.
Note 3: Investment in units of the Accumulation Fund – Fixed Income Pool.
Note 4: Current policy allocation benchmark is 53% of DEX Universe Bond Index + 31.25% DEX Real-Return Bond Index + 9.5% of ML Global HY (hedged) + 6.25% of DEX 91-Day T-Bill Index.

19
M c G I L L U N I V E R S I T Y P E N S I O N P L A N
Benefits and ADMINISTRATIVE MATTERS
Plan AmendmentsEffective December 31, 2008, the Pension Planwas amended (Amendment No. 22) in order tocomply with applicable legislation, to harmonizethe Plan Document with current practices as wellas other changes of an administrative nature.
The most significant changes introduced inAmendment No. 22 are:
For current members of the Plan and employeeseligible to join the Plan as at December 31, 2008:
• The introduction of Additional VoluntaryContributions.
• The pro-rating of future credited service forthose members who are not employed on a full-time basis.
• The ability to recognize additional modes ofcommunication in accordance with proceduresestablished by the PAC; this will allow for theintroduction of online transactions in thefuture.
• The deletion of references regarding theavailable investment options within the PlanDocument; this information has beenconsolidated on the Plan’s website.
• The ability to provide compensation to theIndependent Member of the PAC when deemedappropriate; this will allow for greater flexibilityin attracting and retaining qualified externalcandidates to fulfill this role.
Changes only impacting employees ineligible tojoin the Plan as at December 31, 2008 or thoseemployees hired after December 31, 2008:
• Throughout the document, variousamendments have been made in order to reflectthe following changes:
– The elimination of the internal annuityoption; and
– The elimination of the minimum benefitprovisions.
Members are reminded that the text of thecurrent Plan Document and all formalamendments may be examined during normalbusiness hours (Monday to Friday from 9:00 a.m.to 5:00 p.m.) at the offices of the PensionAdministration Commitee located at: 688Sherbrooke Street West, Suite 1420, Montreal,Quebec, H3A 3R1.
2008 Benefit Payments During 2008, 75 plan members settled theirpension accounts. Of these, 44 chose externalsettlements, 28 chose internal pensionsettlements (including 2 temporary annuitypurchases) and 3 chose a combination of internaland external settlement options. The new retireeswho consented to have their names included inthis Report are listed in Appendix I. As atDecember 31, 2008, there were 1368 retiredmembers and beneficiaries receiving pensionsfrom the Pensioner Fund. Of these, 998 are in theOld Pool with an average age of 79.6 years and370 are in the New Pool with an average age of67.4 years. The total of such pensions paymentsamounted to $33,209,175 in 2008.
During the year, 65 deaths were recorded amongmembers of the Plan, of which 11 were activemembers, 52 were retired members from the OldPool and 2 were retired members from the NewPool (see Appendix II). 254 individual benefitsettlements were transacted under the Plan duringthe year for a total amount of $32,040,580. Thetypes of settlement transactions processed and thebenefit amounts paid out of the Plan during 2008are summarized in Schedule 8.
In addition to these settlements, deferred annuityaccounts were set up for 146 terminating mem -bers who reinvested holdings of $4,888,910 in thepension fund.

20
M c G I L L U N I V E R S I T Y P E N S I O N P L A N
Annuity Dividends Historically, Plan Annuity Rates have been seton the basis of assumptions with respect tointerest earnings and mortality rates in order toinclude provision for potential increases in pen-sions. When surplus earnings emerge in thePensioner Fund as a result of mortality experienceor investment returns that are more favorablethan the rates required to cover current pensioncosts; or when the present value of assets exceedthe present value of liabilities as a result ofchanges in interest rates, these amounts can be setaside to provide increases in the form of “AnnuityDividends” to pensions currently in the course of payment. Annuity Dividends are granted onthe advice of the Plan’s actuary and are subject tothere being sufficient assets in the Pensioner Fundto cover the future cost of pensions purchased.
In 2000, the Pensioner Fund was notionallyseparated into two accounts. One account repre-sents the assets and liabilities in respect of thepensioners who purchased their pensions on the“old” rate basis (prior to January 1, 2000); theother covers the pensioners who annuitize underthe “new” rate basis. Separate dividend distribu-tions apply to each group. The new annuity rates,which came into effect on January 1, 2000, arebased on revised mortality and interest rateassumptions. Schedule 9 shows the full history of
the Annuity Dividends that have been grantedsince the inception of this program and theimpact dividends have had on the benefits paid to the McGill pensioners over the years.
The amount and frequency of each AnnuityDividend is determined by the PAC following anannual actuarial valuation of the liabilities of the Pensioner Fund. All Annuity Dividends are calculated and paid on an actuarial basis thatis designed to distribute the benefits evenly over the remaining lifetimes of all pensioners,within the respective pool. Each new dividend is allocated on a compounded basis in which the benefit is expressed as a percentage increase to be applied to the total of the initial basepension plus all past dividends granted.
Once an Annuity Dividend has been granted it forms part of the contractual lifetime benefitand the member’s pension can never be reducedbelow this amount in the future. Nevertheless, it is important to note that although past divi -dends are guaranteed, future dividend increasesare entirely dependent on the ability of thePensioner Fund to continue to generate surplusearnings; there can be no guarantee that this will be the case.
External Settlements Paid in 2008 (excluding retirement settlements)
Number Total Amount Average Payment
Transfers to LIFs: 27 $13,135,948 $486,517
Transfers to LIRAs: 77 14,255,531 185,137
Death Benefits: 7 1,413,356 201,908
Other1: 5 794,340 158,868
Marriage Breakdown Settlements: 4 264,431 66,108
Lump-Sum Payments: 121 1,788,519 14,781
Transfers to other Pension Plans: 10 342,694 34,269
Temporary Annuity Purchases: 2 44,290 22,145
Cash Payments: 1 1,471 1,471
Total: 254 $32,040,580 $126,144
1Includes transfers to RRSPs and RIFs
Sche
dule
8

M c G I L L U N I V E R S I T Y P E N S I O N P L A N
Impact of Past Dividends – “Old Pool”
2008 Value of Dividends Cumulative Cumulative AnnualYear of Initial Pension Granted Pension Annual Average AverageRetirement of $20,000 “Old Pool”1 Increase Inflation Inflation
1975 $ 41,895 109.48% 294.50% 10.81%
1976 $ 40 675 3.00% 103.37% 266.38% 7.67%
1977 $ 39 395 3.25% 96.97% 239.89% 7.80%
1978 $ 37 879 4.00% 89.40% 211.82% 9.00%
1979 $ 36 648 3.36% 83.24% 185.81% 9.10%
1980 $ 35 581 3.00% 77.90% 159.60% 10.10%
1981 $ 34 427 3.35% 72.14% 131.04% 12.36%
1982 $ 32 580 5.67% 62.90% 108.40% 10.86%
1983 $ 30 554 6.63% 52.77% 96.41% 6.11%
1984 $ 28 751 6.27% 43.76% 88.27% 4.32%
1985 $ 27 260 5.47% 36.30% 81.13% 3.94%
1986 $ 25 947 5.06% 29.74% 73.82% 4.21%
1987 $ 25 012 3.74% 25.06% 66.59% 4.34%
1988 $ 24 131 3.65% 20.66% 60.13% 4.03%
1989 $ 23 467 2.83% 17.34% 52.66% 4.90%
1990 $ 22 484 4.37% 12.42% 45.65% 4.81%
1991 $ 21 651 3.85% 8.25% 37.96% 5.57%
1992 $ 21 247 1.90% 6.24% 35.71% 1.66%
1993 $ 20 904 1.64% 4.52% 33.20% 1.88%
1994 $ 20 659 1.19% 3.29% 32.83% 0.28%
1995 $ 20 365 1.44% 1.83% 30.23% 2.00%
1996 $ 20 100 1.32% 0.50% 28.20% 1.58%
1997 $ 20 000 0.50% 0.00% 26.11% 1.66%
1998 $ 20 000 0.00% 0.00% 24.89% 0.98%
1999 $ 20 000 0.00% 0.00% 22.83% 1.68%
2000 $ 20 000 0.00% 0.00% 19.59% 2.71%
2001 $ 20 000 0.00% 0.00% 16.59% 2.57%
2002 $ 20 000 0.00% 0.00% 14.15% 2.14%
2003 $ 20 000 0.00% 0.00% 11.01% 2.83%
2004 $ 20 000 0.00% 0.00% 8.97% 1.87%
2005 $ 20 000 0.00% 0.00% 6.62% 2.20%
2006 $ 20 000 0.00% 0.00% 4.52% 2.01%
2007 $ 20 000 0.00% 0.00% 2.37% 2.10%
2008 $ 20 000 0.00% 0.00% 0.00% 2.37%
1 “Old Pool” represents those people who purchased their pensions on the “old” rate basis prior to January 1, 2000. No dividends have been granted in the “old pool” since 1997.
2 “New Pool” represents those people who purchased their pensions on the “new” rate basis from January 1, 2000 on. No dividends have been granted in the “new pool” since its inception in 2000.
Example: A pensioner who retired in 1993 with an initial pension of $20,000 per annum was receiving $20,904 per annum as of December 31, 2008. This represents a cumulative pension increase of 4.52% for a 15-year period in which cumulative inflation amounted to 33.20%.
Source: BNY Mellon 21
Sche
dule
9

22
M c G I L L U N I V E R S I T Y P E N S I O N P L A N
Annuity Dividend ValuationA separate valuation of the Pensioner Fund isundertaken each year for Annuity Dividendpurposes. The December 31, 2007 valuation of thePensioner Fund for purposes of issuing an AnnuityDividend confirmed an excess of liabilities overassets of $36,339,500 for the “old pool” and$1,729,600 for the “new pool”. Consequently, noAnnuity Dividends could be declared.
The Executive Summary of the Annuity DividendValuation as at December 31, 2007, as prepared bythe Plan actuaries, Eckler Ltd., can be found onour web site at:http://www.mcgill.ca/pensions/dividends/summary.
Valuations for Annuity Dividend purposes arelimited to the assets and liabilities of thePensioner Fund. The assumptions used forAnnuity Dividend valuation purposes may not bethe same as those used for triennial valuationpurposes. The assumptions used for triennialvaluation purposes are largely prescribed by theRégie des rentes du Québec and the CanadianInstitute of Actuaries. In addition, triennialvaluations are based on the Pension Plan as awhole whereas valuations for Annuity Dividendpurposes are restricted to the Pensioner Fund.
The adoption of revised mortality assumptions in1999 significantly increased the liabilities of the Pensioner Fund which in turn resulted in a shortfall for Annuity Dividend purposes. Thecurrent shortfall can be largely attributed to thischange in mortality assumptions recognizing that this action was necessary in order to reflectthe increasing longevity of McGill Universitypensioners.
The December 31, 2008 valuation of thePensioner Fund for Annuity Dividend purposeswill be based on current mortality tables and aninterest rate assumption based on market ratesand asset valuation methods requiring smoothingof values over a three-year period. The ExecutiveSummary of the Annuity Dividend Valuation as atDecember 31, 2008 will be posted to the websiteonce it is available.
Actuarial Valuation of the PlanThe Plan is required to provide information andactuarial certification at least every three years.Plan actuaries, Eckler Ltd, in their December 31,2006 valuation report, established the financialposition of the Plan.
The actuarial valuation of the Pension Plan as awhole, established that a going-concern actuarialsurplus of $33,597,000 existed as at December 31,2006.
The degree of solvency is described as the ratio ofsolvency assets to the solvency liabilities. As atDecember 31, 2006, the degree of solvency,excluding the defined contribution balances forthose members who would not have been entitledto receive any benefits under the defined benefitminimum provision of the Plan, had the Planbeen terminated on December 31, 2006 was97.0%. Under the Supplemental Pension Plans Act,as of January 2007, university and municipalpension plans are no longer required to makecontributions to amortize solvency deficits.
The next triennial actuarial valuation of the Planmust be performed no later than December 31,2009.
AdministrationThe day-to-day administration of the PensionPlan is performed by the staff of PensionAdministration, Pension Investments as well asthe staff of Aylmer & Sherbrooke Investments Inc.on the basis of policies and proceduresestablished and monitored by the PensionAdministration Committee and the Board ofDirectors of the Corporation.
The total fees for the investment options in theAccumulation Fund, as well as the total fees forthe Pensioner Fund, are presented in Schedule 10.

23
M c G I L L U N I V E R S I T Y P E N S I O N P L A N
23
Fees as a Percentage of Average Net Assets
ACCUMULATION FUND2008 2007
Balanced Account 0.60%1 0.33%
Equity Pool 0.43% 0.43%
Fixed Income Pool 0.25% 0.21%
Socially Responsible Investment Pool (established April 2008) 0.88% n/a
Money Market Pool 0.21% 0.05%2
Workout Asset Pool 0.17% 0.00%2
PENSIONER FUND 0.26% 0.25%
Note 1: The process for allocating fees to the Balanced Account is being re-examined.
Note 2: Effective January 1, 2008, the fees will be approximately 0.20% for these two pools.
23
The offices of the Pension AdministrationCommittee, Pension Administration, andInvestments and Aylmer & SherbrookeInvestments Inc. are located at:
688 Sherbrooke Street West, Suite 1420Montreal, Quebec H3A 3R1Tel: 514-398-6250, Fax: (514) 398-6889
A copy of this annual report and other documents can also be accessed through our web site at http://www.mcgill.ca/pensions
Staff Directory
Pension Administration
John D’Agata Director – Pension Administration514-398-6250 Ext. 2097
Karen Rasinger Communications and Administrative Officer514-398-6250 Ext. 0840
General Information(514) 398-4747 (HRHR)
Christine Halse, Manager514-398-2100
Brenda Shanahan, Pensions and Benefits Officer 514-398-2098
Joanne St-Denis, Pensions and Benefits Officer 514-398-2748
Celine GarrochoPensions and Benefits Administrator514-398-6250 Ext. 00330
Tammy Brunet, Service Centre Representative514-398-4747 (HRHR)
Filomena Ferrara, Clerk/Secretary514-398-4747 (HRHR)
Pension Investments
John Limeburner, Director – Pension Investments514-398-6040
General Information514-398-8943
Robert Hall, ManagerExt. 1383
La version française de ce rapport est disponible sur demande.
CONTACT US
Sche
dule
10

24
M c G I L L U N I V E R S I T Y P E N S I O N P L A N
0
5
10
15
20
25
30
35
40
45
YEAR
UN
IT V
AL
UE
($
)
Accumulation Fund Average Unit Values Since Inception
0
1
10
100
YEAR
UN
IT V
AL
UE
($
)
Accumulation Fund Average Unit Values (logarithmic scale) Since Inception
CHAR
T 1A
CHAR
T 1B
Balanced Account Equity Pool Fixed Income Pool Money Market Pool C.P.I. Workout Asset Pool
Balanced Account Equity Pool Fixed Income Pool Money Market Pool C.P.I. Workout Asset Pool

CHAR
T 2
2525
M c G I L L U N I V E R S I T Y P E N S I O N P L A N
-4.00
-2.00
0.00
2.00
4.00
6.00
8.00
10.00
1999 2000 2001 2002 2003 2004 2005 2006 2007 2008 1999-2008
YEAR
FUN
D R
AT
E R
ET
UR
N (
%)
Current Objective is 6.50%. Prior to 2004, the primary objective was 6.75% and the secondary objective was 4.25% plus the increase in the Canadian Consumer Price Index.
Pensioner Fund Performance History from 1999 to 2008
¾ Fund Rate of Return ¾ Objective

26
M c G I L L U N I V E R S I T Y P E N S I O N P L A N
The following members of the Plan retired in 2008 and consented to have their names published in this report.
Name Department or Faculty
Mrs. Mona Bissada Biology
Ms. Carol L. Cardinal McGill-Queen’s University Press
Professor Ronald Chase Biology
Mr. André Demers Macdonald Campus
Dr. Janet Donin Educational Counseling & Psychology
Professor Myron J. Echenberg History
Mr. Edwin F. Fernandez Mining, Metals & Materials Engineering
Miss Barbara Joyce Finlay Libraries
Mrs. Suzanne Higgins Registrar’s Office
Professor Pierre-Gabriel Jobin Law
Mr. Eric Johnstone School of Physical & Occupational Therapy
Ms. Anastassia Khouri Libraries
Dr. Harriet V. Kuhnlein School of Dietetics & Human Nutrition
Miss Frances M. J. Langton Human Genetics
Ms. Claudette Yvonne Lapierre Continuing Education
Professor John E. Leide Graduate School of Library & Information Studies
Mrs. Joan Longo Microbiology & Immunology
Dr. James C. MacDougall Psychology
Mrs. Virginia Mann Athletics
Mr. Narciso Mejia Biochemistry
Mrs. Louise Mineau Plant Science
Professor Monroe Newborn School of Computer Science
Mrs. Janet S. O’Connor Information Systems Resources
Mr. Richard Edward Owen Information Systems Resources
Mr. Robert E. Peuckert Medicine
Miss Beverly Ann Redmond Medicine
Ms. Elsa Schotman University Clinic - RVH
Professor Georg Schmidt Mathematics & Statistics
Professor Josef Schmidt German Studies
Ms. Blossom Shaffer Centre for Research and Teaching on Women
Professor Lee A. Soderstrom University Clinic - RVH
Mrs. Veronica Webster-John Microbiology Lab - RVH
Appendix I2008 RETIREMENTS

2727
M c G I L L U N I V E R S I T Y P E N S I O N P L A N
Active Plan Members whose deaths occurred in 2008:
Name Department or Faculty
Mrs. Brenda Bewick Deferred Annuitant
Mrs. Kathleen Craig Anatomy & Cell Biology
Dr. Geoffrey M. Davis Pediatrics
Mr. Alan Ford Linguistics
Ms. Josée Gadbois Inventions & Patents
Dr. Annette Herscovics McGill Cancer Centre
Professor Y. Gregory Kelebay Integrated Studies in Education
Dr. Joe Kincheloe Integrated Studies in Education
Dr. Peter Schneider Centre for International Management
Mrs. Marisa Terrenzio Integrated Studies in Education
Retired Plan Members whose deaths occurred in 2008:
Name Department or Faculty
Mr. Mohammed Iqbal Alavi Pathology
Mrs. Mary Eleanor Algie Libraries
Professor Effie C. Astbury Graduate School of Library Science
Mrs. Jeannette Ayotte Anatomy & Cell Biology
Mr. Pasquale Biello Facilities Management
Mr. Albert F. Banville Management
Mr. Herby Berry Plant Science - Macdonald Campus
Mrs. Ilse Berzins Retiree
Professor L. Bernard Birch Education
Mr. Donald Birnie Facilities Development
Professor A. Clark Blackwood Microbiology & Immunology
Mr. Saverino Caputo Facilities Management
Dr. Pierre Chollet Office of Inventions & Patents
Miss Alison G. Cole Libraries
Professor Jan Comaj Education
Mr. Rocco Di Benedetto Facilities Management
Mr. Raphael Daniel Facilities Management
Mr. Nicola Di Lalla Facilities Management
Mrs. Jennie Epstein Accounting
Dr. Barbara Esplin Pharmacology & Therapeutics
Professor Arwel Evans Mathematics & Statistics
Dr. Claus D. M. Fengler Electrical Engineering
Mr. Percy Charles Ford Facilities Management - Macdonald Campus
Mrs. T. Pauline Fox Electrical Engineering
Mr. Alberto Furtado Residences - Royal Victoria College
Appendix II2008 DEATHS

M c G I L L U N I V E R S I T Y P E N S I O N P L A N
Appendix II – Deaths (continued)
Name Department or Faculty
Professor Angus F. Graham Biochemistry
Mr. Guy Harrison Pathology
Mr. Eric Hurley Education
Mr. Ivan L. Ivessa Libraries
Mr. Garfield John Job Facilities Management
Mrs. Patricia Lalonde Pensioner
Mr. Giovanni Lancia Facilities Management
Professor Peter Cory Landry Physics
Miss Anita Levac Diploma Program
Mrs. Margaret M. Lodge Libraries - Macdonald Campus
Professor James D. MacArthur Agriculture - Macdonald Campus
Mrs. Elizabeth Lyman-MacCormack Registrar’s Office
Mr. Roger Martel Facilities Management - Macdonald Campus
Mr. Roger Meloche Facilities Management - Macdonald Campus
Mrs. Marjorie Grace Menard Administration - Macdonald Campus
Mrs. Eva Patti Faculty Club - Macdonald Campus
Mrs. Barbara Ann Petrin Montreal Neurological Institute
Mrs. Jeannine Proulx Montreal Neurological Institute
Mr. Guy Richard Facilities Management - Macdonald Campus
Mr. Philippe Robillard Facilities Management - Macdonald Campus
Mr. Rolf Selbach Instructional Communications Centre
Mr. Abal Sen Geography
Ms. Lise St-Onge Telecommunications Office
Professor A. Lloyd Thompson Mechanical Engineering
Mrs. Kathleen Toccacelli Engineering
Mrs. Chrysoula Tsesmes Residences
Professor Jeremy D. B. Walker Philosophy
Professor Martin Weber Chemical Engineering
Mrs. Anni K. Zarudzka Montreal Neurological Hospital
28

2929
M c G I L L U N I V E R S I T Y P E N S I O N P L A N
1998 Balanced Equity Fixed MMF
Jan: 14.5018 19.7671 11.1748 1.1499Feb: 14.5512 19.8363 11.2300 1.1537Mar: 14.8598 20.3340 11.2957 1.1575Apr: 15.2796 20.9892 11.3988 1.1614May: 15.6893 21.6491 11.4616 1.1654Jun: 15.8714 21.9150 11.5533 1.1697Jul: 15.8155 21.7950 11.6212 1.1742Aug: 15.6343 21.4562 11.6658 1.1791Sep: 15.0895 20.4681 11.6402 1.1841Oct: 14.7042 19.6825 11.7140 1.1893Nov: 14.5704 19.3745 11.7887 1.1946Dec: 14.9594 19.9910 11.9425 1.2001
1999 Balanced Equity Fixed MMF
Jan: 15.3489 20.6891 12.0095 1.2055Feb: 15.6247 21.1567 12.0986 1.2110Mar: 15.6431 21.2020 12.0957 1.2163Apr: 15.7308 21.3465 12.1235 1.2216May 15.8995 21.6640 12.1434 1.2269Jun: 16.1746 22.1693 12.1883 1.2322Jul: 16.3831 22.5995 12.1703 1.2372Aug: 16.4793 22.8354 12.1133 1.2422Sep: 16.6038 23.0948 12.0985 1.2472Oct: 16.5590 23.0043 12.1078 1.2521Nov: 16.5147 22.9225 12.1078 1.2571Dec: 16.5702 23.0345 12.1079 1.2620
2000 Balanced Equity Fixed MMF
Jan: 16.9261 23.7529 12.0879 1.2670Feb: 17.1845 24.2555 12.0953 1.2721Mar: 17.5188 24.8386 12.1763 1.2769Apr: 17.7909 25.2703 12.2904 1.2835May: 18.1059 25.7994 12.3972 1.2903Jun: 18.3413 26.2237 12.4464 1.2977Jul: 18.6019 26.7027 12.5083 1.3037Aug: 18.9056 27.2334 12.6050 1.3099Sep: 19.3357 28.0186 12.7181 1.3164Oct: 19.4782 28.2458 12.7917 1.3230Nov: 19.4804 28.1845 12.8577 1.3296Dec: 19.0751 27.2448 12.9375 1.3361
2001 Balanced Equity Fixed MMF
Jan: 18.8967 26.7648 13.0438 1.3247Feb: 18.9814 26.7963 13.1810 1.3492Mar: 18.9467 26.6388 13.2801 1.3556Apr: 18.6260 25.9294 13.3222 1.3618May: 18.2869 25.2752 13.2766 1.3678Jun: 18.3545 25.4481 13.2467 1.3737Jul: 18.4196 25.5753 13.2618 1.3792Aug: 18.3218 25.3015 13.3410 1.3846Sep: 18.0483 24.6452 13.4471 1.3898Oct: 17.6659 23.7933 13.5387 1.3950Nov: 17.4360 23.1657 13.7199 1.3998Dec: 17.4740 23.1558 13.8173 1.4043
2002 Balanced Equity Fixed MMF
Jan: 17.9039 23.9697 13.8821 1.4084Feb: 18.1813 24.5708 13.8499 1.4119Mar: 18.3080 24.8314 13.8622 1.4148Apr: 18.4354 25.0816 13.8672 1.4175May: 18.5615 25.2771 13.9392 1.4200Jun: 18.6226 25.3179 14.0373 1.4228Jul: 18.3525 24.6474 14.2024 1.4257Aug: 17.9165 23.6867 14.3101 1.4288Sep: 17.3433 22.3001 14.6106 1.4355Oct: 16.6620 20.7499 14.8441 1.4389Nov: 16.8302 21.2061 14.6796 1.4424Dec: 17.3226 22.0446 14.8556 1.4458
2003 Balanced Equity Fixed MMF
Jan: 17.3540 21.8714 15.2290 1.4493Feb: 17.0718 21.2949 15.2817 1.4528Mar: 16.8962 20.7734 15.5348 1.4560Apr: 16.6278 20.2884 15.5088 1.4596May: 17.1724 21.1801 15.6604 1.4633Jun: 17.7196 21.8669 16.1379 1.4673Jul: 17.9044 22.2442 16.1165 1.4712Aug: 18.4525 23.3308 15.9285 1.4752Sep: 18.8098 23.9054 16.0383 1.4791Oct: 18.7357 23.5706 16.3446 1.4826Nov: 19.2127 24.4562 16.3156 1.4860Dec: 19.3661 24.6410 16.4558 1.4894
2004 Balanced Equity Fixed MMF
Jan: 20.1508 25.9145 16.7430 1.4929Feb: 20.8050 26.8790 17.0751 1.4963Mar: 21.3357 27.7052 17.2653 1.4993Apr: 21.1602 27.2757 17.4522 1.5023May: 21.0476 27.1537 17.3262 1.5051Jun: 21.1630 27.2987 17.4264 1.5077Jul: 21.3096 27.6035 17.4016 1.5103Aug: 21.0888 27.0563 17.6022 1.5130Sep: 21.0239 26.7810 17.8328 1.5158Oct: 21.1753 27.0982 17.7827 1.5185Nov: 21.3621 27.3258 17.9626 1.5215Dec: 21.7925 28.0294 18.1028 1.5246
2005 Balanced Equity Fixed MMF
Jan: 22.4656 29.1164 18.3652 1.5279Feb: 22.7639 29.5178 18.5330 1.5313Mar: 23.3901 30.6765 18.4840 1.5343Apr: 23.0769 30.0532 18.5631 1.5376May: 23.1344 29.9807 18.8019 1.5409Jun: 23.6103 30.7015 19.0697 1.5443Jul: 23.8824 31.1277 19.2146 1.5476Aug: 24.6414 32.5791 19.1772 1.5510Sep: 24.7339 32.5708 19.4491 1.5544Oct: 25.1308 33.2706 19.5248 1.5579Nov: 24.4788 32.1154 19.4273 1.5617Dec: 25.0545 33.1110 19.5429 1.5657
Appendix IIIUNIT VALUE HISTORY

30
M c G I L L U N I V E R S I T Y P E N S I O N P L A N
A complete listing of all unit values since the inception of the Plan in 1972 is available on our website at: www.mcgill.ca/pensions/unithistory
2006 Balanced Equity Fixed MMF
Jan: 25.7284 34.2023 19.8134 1.5699Feb: 26.4328 35.5417 19.7344 1.5743Mar: 26.3327 35.2714 19.8369 1.5785Apr: 27.0132 36.6001 19.7653 1.5834May: 26.9609 36.6474 19.5790 1.5883Jun: 26.1696 35.1219 19.5779 1.5936Jul: 26.2878 35.4038 19.5484 1.5991Aug: 26.7267 35.9556 19.8910 1.6049Sep: 27.0561 36.3806 20.1818 1.6108Oct: 27.0088 36.2247 20.2386 1.6165Nov: 27.8154 37.7581 20.2863 1.6224Dec: 28.5146 39.0342 20.4672 1.6281
Appendix III – Unit Value History (continued)
2007 Balanced Equity Fixed MMF WAP
Jan: 29.0009 40.1696 20.2984 1.6341Feb: 29.5130 41.1199 20.3348 1.6400Mar: 29.6213 41.0314 20.5361 1.6454Apr: 29.6918 41.2720 20.5283 1.6514May: 29.8870 41.6067 20.6045 1.6572Jun: 30.0617 42.1974 20.3309 1.6633Jul: 29.7806 41.6921 20.2642 1.6692Aug: 29.5262 41.1179 20.3010 1.1395Sep: 29.3258 40.6423 20.3675 1.1438 0.5360Oct: 29.4669 40.7507 20.5116 1.1480 0.5371Nov: 29.6986 41.2270 20.5254 1.1522 0.4839Dec: 29.1511 40.0191 20.6587 1.1563 0.4843
2008 Balanced Equity Fixed SRI MMF WAP
Jan: 29.2701 40.0508 20.8448 1.1604 0.4847Feb: 28.4734 38.3491 20.9358 1.1643 0.4851Mar: 28.5605 38.3099 21.0553 1.1677 0.4311Apr: 28.8644 38.6270 21.3085 10.0000 1.1710 0.4310May: 29.4248 39.8404 21.2056 10.0000 1.1735 0.4310Jun: 29.9795 40.7614 21.4163 10.1362 1.1758 0.4309Jul: 29.3949 39.5961 21.5610 9.8906 1.1782 0.4308Aug: 28.8688 38.4603 21.6171 9.6495 1.1805 0.4307Sep: 29.3699 39.2365 21.7152 9.7252 1.1826 0.4306Oct: 27.0325 35.2275 21.0550 8.9411 1.1850 0.4305Nov: 25.0872 31.6132 20.6198 8.3603 1.1869 0.4304Dec: 24.5816 30.5670 20.7240 8.2101 1.1885 0.4303

31
M c G I L L U N I V E R S I T Y P E N S I O N P L A N
Active Management: A management stylewhereby a manager selects individual investmentswith the goal of earning a higher return than itscomparative benchmark.
Actuary: An independent professional who calcu -l ates pension plan liabilities and compares them to pension plan assets in order to determine thefinancial status of a pension plan.
Annualized Rate of Return: A rate of returnexpressed over one year, although the actual rates of return being annualized are for periods longer or shorter than one year.
Annuity: A series of payments of a fixed amount for a specified period of time.
Asset Allocation: The proportion of assets inves -ted in different asset classes such as cash andequivalents, fixed-income securities and equities.
Asset-backed commercial paper (ABCP):ABCPs are issued by banks and non-bank financialcompanies and is backed by longer term assets suchas car loans, mortgage loans, credit card balances andother interest-bearing assets.
Balanced Account: The investment optionestablished by the Pension AdministrationCommittee and which consists of allocations to the Equity and Fixed Income Pools in suchproportions as shall be determined from time to time by the Committee.
Basis Point: One-hundredth of a percentage point.The difference between 5.25% and 5.50% is 25 basis points.
Benchmark: A standard against which rates ofreturn can be measured, such as stock and bondmarket indices.
Bonds: Evidence of a debt on which the issuerpromises to pay the holder a specified amount of interest for a specified length of time and to repay the indebtedness at maturity.
Commercial paper: Commercial paper is short-term debt issued, usually maturing in under a yearbut frequently in as little as a month.
Common shares: Securities representing owner-ship in a company, usually carrying voting privileges.Common shareholders share in growth throughcapital appreciation and may also be entitled todividends, at the company’s discretion.
Consumer Price Index (CPI): An inflationaryindicator provided by Statistics Canada that meas -ures the change in the price of a fixed basket ofgoods and services. The basket is supposed to reflectthe average needs of a family.
Custodian: An independent organization, usually a trust company, entrusted with holding investmentson behalf of the owner. The custodian maintainsfinancial records for the investments and may per -orm other services for the owner as well.
Defined Benefit Minimum Provision: Based ona formula that takes into account the plan member’scredited service and highest 60-consecutive monthsof earnings and applicable to members of the Planincluding members eligible to join the Plan prior toJanuary 1, 2009.
DEX 30 or 91-day Treasury Bills Index:Measures the performance attributable to 30 or 91-day Treasury Bills of the provincial and federalgovernments.
DEX Real-Return Bond Index: Measures theperformance of Canadian real-return bonds.
DEX Universe Bond Index: Designed to be abroad measure of the Canadian investment-gradefixed income market. The Universe Index is dividedinto a variety of sub-indices (e.g. Short, Mid, Long)according to term and credit and also consists of four main credit or borrower categories: bonds issuedby the Government of Canada (including CrownCorporations), Provincial bonds (includingprovincially-guaranteed securities), Municipal Bonds,and Corporate Bonds.
Diversification: A strategy to spread investmentrisk among different asset classes, different types ofassets, among securities, among economic sectors,and among different countries.
Duration: A measure of the interest rate sensitivityof a bond’s market price taking into consideration itscoupon and maturity date.
Emerging Markets: Markets in developingcountries as defined by the International FinanceCorporation (IFC) on the basis of Gross NationalProduct (GNP) per capita. Countries classified aslow or middle-income by the World Bank areconsidered developing or emerging countries.
Enhanced Index Mandate: A form of activemanagement whereby an investment manager aimsto outperform the index by investing in securitiesincluded in the index, subject to investmentrestrictions, such as weighting limits of holdings in the portfolio.
Equity Pool: Those holdings of common andpreferred shares and other such holdings which aregenerally considered to be equity securities. TheEquity Pool may hold cash and cash equivalentsfrom time to time.
Appendix IVGLOSSARY

32
M c G I L L U N I V E R S I T Y P E N S I O N P L A N
Fixed Income Pool: Those holdings of bonds,debentures, mortgage loans, notes and other such holdings which are considered to be debtinstruments. The Fixed Income Pool may hold cashand cash equivalents from time to time.
Going-concern actuarial surplus: Means theamount, if any, by which the sum of the going-concern assets exceed the going-concern liabilities;going-concern valuation: assumes that the Plan willremain in effect indefinitely and is, therefore, based onlong-term actuarial assumptions and methods.
GPR 250 Net Index: – is a real estate benchmarkconsisting of the 250 most liquid propertycompanies worldwide, and uses the tradable marketcapitalization of these companies as index weights.
Gross Rate of Return: Rate of return of a portfoliobefore deducting investment management fees.
High-Yield Bonds: A corporate bond that hasbeen assigned a rating below investment grade by arating agency reflecting lower credit quality of theissue.
Index Funds: An investment fund that closelyreplicates the composition of a particular marketindex (e.g. S&P 400 MidCap Index Fund).
Inflation: The term used to describe rising prices of goods and services within an economy. Thepurchasing power of the monetary unit declineswhen inflation is present.
Investment Objective – Balanced Account:To optimize capital accumulation over the long-termthrough allocations to the Equity and Fixed IncomePools with a target asset mix of 65% equity securitiesand 35% fixed income securities.
Investment Objective – Equity Pool: To providelong-term capital appreciation and dividend incomeby investing in a diversified portfolio of Canadianand foreign equity securities.
Investment Objective – Fixed Pool: To provide apredictable source of interest income, reducedvolatility of investment returns and a hedge againstdeflation, by investing in a diversified portfolio ofprimarily Canadian fixed income securities. Anallocation to real-return bonds will provide a hedgeagainst inflation.
Investment Objective – Money Market Pool:To preserve capital, provide stable returns andmaintain liquidity.
Investment Objective – SRI Pool: To optimizecapital accumulation over the long-term in a"socially responsible" manner through allocations toequity and fixed income investments with a targetasset mix of 65% equity securities and 35% fixedincome securities including a maximum cash limitof 10%.
Investment Objective – Workout Asset Pool:To minimize the erosion of capital related to itsinvestment holdings.
Liquidity: The ability to buy or sell an assetquickly.
Market Value: The price at which an investmentcan be bought or sold.
Merrill Lynch Global High Yield (Hedged)Index: Measures the performance of belowinvestment grade Canadian and US dollar-denominated bonds (i.e. rated BBB and lower) ofCanadian domiciled corporate issuers. The index isfully hedged to eliminate the impact of the USdollar on US dollar-denominated issues.
MSCI EAFE: The Morgan Stanley Capital Inc. EAFE®
Index (Europe, Australasia, Far East) is a free float-adjusted (i.e. the equity of a company available tointernational investors) market value weighted index(stock price times the number of shares outstanding)that is designed to measure the market equityperformance of 21 developed markets, excluding the US & Canada.
Money Market Pool: Those holdings of cash, short-term investments and other such securitieswith maturities less than a year which are generallyconsidered to be money market instruments.
New Pool: Represents plan members whopurchased their pensions on the “new” rate basisfrom January 1, 2000 on.
Non-North American Investments: Investmentsmade in securities of companies generally domiciledoutside of Canada or the United States.
Old Pool: Represents plan members who purchasedtheir pensions on the “old” rate basis prior toJanuary 1, 2000.
Pension Fund: Consists of employee and employercontributions into the Pension Plan plus the income,gains and/or losses derived from fund investments.In addition, the pension fund disburses all benefitsprovided by the Pension Plan and pays Pension Planadministration expenses.
Pension Plan: Shall mean the McGill UniversityPension Plan as described in the Plan Document, asamended from time to time. The Pension Plan hasbeen established for the purpose of providingretirement, death and termination benefits foremployees and their beneficiaries.
Plan Document: The text of the McGill UniversityPension Plan as amended to January 1, 2001 andwhich is available for viewing by members at theoffices of the Pension Administration Committee.
Appendix IV – Glossary (continued)

33
M c G I L L U N I V E R S I T Y P E N S I O N P L A N
33
Private Equity: Equity capital invested in a privatecompany and which may include investments inventure capital, corporate buyouts and mezzaninefinancing.
Rate of Return: The income earned (i.e. yield)plus/minus any realized and unrealized capitalgains/losses for a particular period, usually expressedas a percentage.
Realized Gains/Losses: Capital gains/losses thatresult when an appreciated/depreciated asset is sold.
Real Estate Investment Trust (REIT):A corporation or trust that uses the pooled capital of many investors to purchase and manage income property.
Real-Return Bonds: Evidence of a debt on whichthe issuer promises to pay the holder a periodicamount of interest for a specified length of timebased on a real rate of interest and actual inflation.The bond’s principal or indebtedness is repaid on maturity.
Rebalancing: An investment approach by which the investor or manager maintains an investmentmix by reallocating funds periodically over time.
S&P 1500 (or SuperComposite 1500): An indexcombining the S&P 500, S&P 400 MidCap, and S&P600 SmallCap indices to efficiently create a broadmarket portfolio representing approximately 90% ofthe market value of US publicly-traded equities.
S&P 500 LargeCap: A US index consisting of 500stocks chosen for market size, liquidity, and industrygroup representation. It is a market value weightedindex (stock price times number of sharesoutstanding), with each stock’s weight in the Indexproportionate to its market value.
S&P 400 MidCap: A US index consisting of 400domestic stocks chosen for market size, liquidity, andindustry group representation. Like the S&P 500index, it is also a market value weighted index. It isconsidered a proxy for measuring performance of themid-size company segment of the US market.
S&P 1000 Small/MidCap: A combination of the S&P 600 SmallCap and S&P 400 MidCap indices,where the S&P 600 SmallCap representsapproximately 30% and the S&P 400 MidCaprepresents approximately 70%.
S&P/IFCI: A market capitalization-weighted indexmeasuring the equity performance of 27 emergingmarkets.
S&P/TSX Canadian SmallCap: An index ofsmaller Canadian companies that have beenincluded in the S&P/TSX Composite index, but arenot members of the S&P/TSX 60 or the S&P/TSXCanadian MidCap Indices.
S&P/TSX Capped Energy Trust: A sector-basedindex of income trusts in the Energy sector. Theindividual constituent Energy income trusts willhave their relative weights capped at 25%.
S&P/TSX Composite: The principal broad marketmeasure for Canadian equity markets includingcommon stocks and income trust units.
Socially-Responsible Investment (SRI) Pool:Those equity and fixed income holdings and othersuch securities which are managed within a sociallyresponsible investment framework. The SRI Pool mayhold cash and cash equivalents from time to time.
Solvency deficiency: Means the amount by whichthe sum of the solvency liabilities exceeds the sum ofthe solvency assets. A solvency valuation is based onthe assumption that the Plan is being terminated.
T-Bills: Treasury bills are short-term governmentdebt, which do not pay interest but are sold at a discount to reflect short-term interest rates andmature at par value. The difference between thepurchase price and the proceeds at maturityrepresents investment income.
Trust Units: Investments in business trusts, royaltytrusts (oil and gas), or real estate investment trusts(REITs).
Unit Value: The value/cost of each unit in a par -ticular investment pool. Unit values for all the poolsare calculated on a market-value basis on the lastbusiness day of each month with a one-month lag.(e.g. the December unit values were based on themarket values in effect on November 30th). Unitvalues are net of all investment and administrativeexpenses and fluctuate (subject to increase ordecrease) on a monthly basis in accordance withprevailing market conditions.
Venture Capital: Financing provided to start-upcompanies and early and later stage businesses withhigh growth potential.
Workout Asset Pool: A new pool establishedAugust 31, 2007 to hold the non-bank asset-backedcommercial paper which was initially held in theMoney Market Pool at the time of the global creditmarket disruptions in August 2007. The WorkoutAsset Pool is a closed pool and is not open to newinvestments.
Yield: A ratio obtained by dividing the annualincome (dividends, interest, rent) by the currentmarket price of an investment, generally expressed as a percentage.
Appendix IV – Glossary (continued)

34
M c G I L L U N I V E R S I T Y P E N S I O N P L A N
To the Pension Administration CommitteeMcGill University Pension Plan
We have audited the statement of net assets available forbenefits of the McGill University Pension Plan as at December 31, 2008 and the statements of changes in net assetsavailable for benefits for the year then ended. These financialstate ments are the responsibility of the Plan’s management and the Pension Administration Committee. Our responsibility is to express an opinion on these financial statements based on our audit.
We conducted our audit in accordance with Canadian generallyaccepted auditing standards. Those standards require that we plan and perform an audit to obtain reasonable assurancewhether the financial statements are free of material misstate-ment. An audit includes examining, on a test basis, evidencesupporting the amounts and disclosures in the financialstatements. An audit also includes assessing the accountingprinciples used and significant estimates made by manage-ment, as well as evaluating the overall financial statementpresentation.
In our opinion, these financial statements present fairly, in all material respects, the net assets available for benefits of thePlan as at December 31, 2008 and the changes in net assetsavailable for benefits for the year then ended in accordancewith Canadian generally accepted accounting principles.
Montreal, QuebecFebruary 20, 2009
1Chartered accountant auditor permit no 22220
Auditors’REPORTREPORT
1

35
M c G I L L U N I V E R S I T Y P E N S I O N P L A N
35
Statement of Net AssetsAVAILABLE FOR BENEFITS
Accumulation FundASSETS 2008 2007
Investments (Note 3) $ 955,364,297 $1,118,969,270Cash 1,143,219 3,297,473Accrued investment income 1,814,187 1,990,779Accounts receivable 1,667,255 1,656,124Due from McGill University 262,090 22,888
960,251,048 1,125,936,534
LIABILITIES
Owing to former members for units redeemed 6,498,858 5,320,839Due to Pensioner Fund (Note 5) 90,852,260 92,956,775Accounts payable 629,705 3,534,553Accrued expenses 907,364 983,661
98,888,187 102,795,828
Net assets available for benefits 861,362,861 1,023,140,706
Pensioner Fund ASSETS
Investments (Note 3) 256,570,911 286,546,211Cash 135,616 11,355Accrued investment income 405,503 487,120Accounts receivable 201 450Due from Accumulation Fund (Note 5) 1,136,734 4,757,309Due from McGill University 11,422 ------
258,260,387 291,802,445
LIABILITIES
Due to McGill University - 2,803Accrued expenses 72,586 70,227
72,586 73,030
Net assets available for benefits 258,187,801 291,729,415
Total net assets available for benefits $1,119,550,662 $1,314,870,121
As at December 31, 2008

36
M c G I L L U N I V E R S I T Y P E N S I O N P L A N
Statementof Changes inNetAssetsAVAILABLE FOR BENEFITS
Accumulation Fund2008 2007
Net assets available for benefits, January 1 $1,023,140,706 $1,012,528,635
INCREASE
Investment incomeInterest – short-term and cash 4,048,418 3,461,978Interest – fixed income 15,330,118 16,048,173Dividends – common stocks 12,324,596 11,736,244Real estate 799,308 1,498,084Private equity 59,385 350,911Resource properties 1,667,443 1,642,950
34,229,268 34,738,340
Members’ regular contributions 15,003,604 14,267,838University contributions 26,825,578 25,674,713Transfers from other registered plans 833,872 3,079,870
42,663,054 43,022,421
Total increase in assets 76,892,322 77,760,761
DECREASE
Administration expenses 2,195,725 2,070,515Investment management fees 2,134,440 2,519,644Amounts transferred to Pensioner Fund 13,006,767 13,286,105Units redeemed 33,181,894 28,049,222
Total decrease in assets 50,518,826 45,925,486
Current year change in fair value of investments (188,151,341) (21,223,204 )
Change in net assets available for benefits (161,777,845) 10,612,071
Net assets available for benefits, December 31 $861,362,861 $1,023,140,706
Year ended December 31, 2008

3737
M c G I L L U N I V E R S I T Y P E N S I O N P L A N
Pensioner Fund2008 2007
Net assets available for benefits, January 1 $291,729,415 $304,174,561
INCREASE
Investment income
Interest – short-term and cash 164,544 1,372,180Interest – mortgages 4,247,518 4,747,710Interest – fixed income 439,133 117,597Dividends – common stocks 1,658,465 2,978,373Real estate 967,958 1,421,297Resource properties 1,349,999 1,320,678
8,827,617 11,957,835
Amounts transferred from Accumulation Fund 13,006,767 13,286,105
Total increase in assets 21,834,384 25,243,940
DECREASE
Administration expenses 613,798 614,383Investment management fees 88,952 115,343Pension payments 33,209,175 34,747,816
Total decrease in assets 33,911,925 35,477,542
Current year change in fair value of investments (21,464,073) (2,211,544)
Change in net assets available for benefits (33,541,614) (12,445,146)
Net assets available for benefits, December 31 $258,187,801 $291,729,415
Statementof Changes inNetAssetsAVAILABLE FOR BENEFITS Year ended December 31, 2008

38
M c G I L L U N I V E R S I T Y P E N S I O N P L A N
Notes to the FINANCIAL STATEMENTS
1.
Year ended December 31, 2008
Summary Description of the Plan
(A) GENERAL
The Plan provides retirement benefits for the staffof McGill University (“University”). The pensionfor each member is determined in accordancewith the accumulated value of the member’spension account at retirement under a definedcontribution arrangement.
(B) FUNDING POLICY
Geographic Full-Time University staff (“GFT-U”)are required to contribute 5.5% of Basic Earnings,as defined in the Plan Document, less 1.8% of the portion of Basic Earnings that is subject to aQuebec Pension Plan contribution. All othermembers of the Plan are required to contribute5% of Basic Earnings less 1.8% of the portion ofBasic Earnings that is subject to a Quebec PensionPlan contribution.
The University is required to make regularmonthly contributions to the Plan equal to apercentage of Basic Earnings determinedaccording to the following table, less 1.8% of theportion of Basic Earnings subject to a requiredemployer contribution to the Quebec PensionPlan:
Percentage of Basic Earnings
Members’ age at end of preceding GFT-U Othermonth Members Members
39 or less 5.8% 5.0%
40 through 49 8.3% 7.5%
50 to 69 10.8% 10.0%
The University is required to make additionalcontributions as may be necessary to fund the cost of the Defined Benefit Minimum Provisionof the Plan, as well as to ensure the solvency of the Plan. The determination of the value of the Defined Benefit Minimum Provision and thedegree of solvency are based on a triennialactuarial valuation (see Note 6).
(C) RETIREMENT BENEFITS
The retirement benefit for each member is determined in accordance with the accumulatedvalue of the member’s pension account at retire-ment. For those members enrolled in the Plan oreligible to enroll in the Plan prior to January 1,2009, there is a Defined Benefit MinimumProvision determined according to a highestaverage earnings formula. Any shortfall betweenthe accumulated value and the Defined BenefitMinimum Provision is funded by the Universityout of the Supplemental Fund.
(D) DEATH BENEFITS
In the event of death before retirement, a lumpsum death benefit equal to the total value of the member’s pension account is paid to thebeneficiary or beneficiaries entitled thereto.
In the event of death after retirement, the deathbenefit, if any, is determined according to thesettlement option chosen at retirement.
(E) TERMINATION BENEFITS
A termination benefit is payable when a memberceases to be employed. The value of the termi-nation benefit is determined in accordance withthe accumulated value of a member’s pensionaccount.
(F) ACCUMULATION FUND
The Accumulation Fund is composed of an EquityPool, a Fixed Income Pool, a Socially ResponsibleInvestment Pool, a Money Market Pool and aWorkout Asset Pool. A Balanced Account is alsoavailable, composed of allocations to the EquityPool and the Fixed Income Pool in proportionsdetermined from time to time by the PensionAdministration Committee (“PAC”).
This structure offers a wide range of possible investment strategies permitting members tocreate specific strategies that best respond to theirindividual financial needs.

39
M c G I L L U N I V E R S I T Y P E N S I O N P L A N
39
Summary Description of the Plan
(F) ACCUMULATION FUND (continued)
All assets of the Accumulation Fund are allocatedto individual accounts and all investment income,gains and losses are distributed accordingly. Assets are, by definition, equal to liabilities andthere can be no surplus or deficit in the fund.
(G) SUPPLEMENTAL FUND
The Supplemental Fund holds University con-tributions arising from the Defined BenefitMinimum Provision, as well as the University’sfunding related to actuarial valuation deficiencies.
Any actuarial surplus existing in the Supple-mental Fund is the property of the University tobe applied in such fashion as the University shall determine, including but not limited to, thepayment of University contributions otherwiserequired under the Plan.
Any actuarial deficit arising from the DefinedBenefit Minimum Provision or from actuarialvaluation deficiencies is the responsibility of the University, to be funded by Universitycontributions.
The assets of the Supplemental Fund are investedin the Balanced Account and included in theAccumulation Fund.
(H) PENSIONER FUND
The Pensioner Fund holds the assets required tosecure the obligation for retired staff who have opted for an internal pension settlement.
Significant Accounting Policies
BASIS OF PRESENTATION
These financial statements include the accountsof Aylmer & Sherbrooke Investments Inc., whichis a wholly-owned subsidiary of the Plan. Thiscompany invests primarily in mortgages (see Note3D on page 41 - National Housing Act insured andconventional mortgages). Aylmer & SherbrookeInvestments Inc. was incorporated in 1993 under
the Canada Business Corporations Act to facilitatethe origination and administration of mortgageinvestments for the Pensioner Fund. It is a tax-exempt pension investment corporation.
The preparation of financial statements in con-formity with Canadian generally acceptedaccounting principles requires management tomake estimates and assumptions that affect the reported amounts of assets and liabilities atthe date of the financial statements and thereported amounts of current period change in fairvalue of investments. Actual results could differfrom such estimates and assumptions.
INVESTMENTS
Investments are recorded as of the trade date andare carried at fair value. Fair value is the amount of the consideration that would be agreed upon inan arm’s length transaction between knowledge-able, willing parties who are under no compulsionto act.
The fair value of investments is determined asfollows:
(a) Short-term investments are valued at quotedmarket prices.
(b) Non-bank asset backed commercial paper(“ABCP”) is valued at management’s bestestimate of current fair values. The Plan holdsinvestments in non-bank ABCP with a parvalue of $41,210,000 at December 31, 2008,allocated as follows: $26,424,000 -Accumulation Fund and $14,786,000 -Pensioner Fund. These investments havematured and have not been repaid due toliquidity problems in the non-bank ABCPmarket. There is a proposal to restructure the non-bank ABCP market that calls for the non-bank ABCP to be converted into medium-term notes with maturities that correspond to the maturities of the assets underlying the non-bank ABCP. Subsequent to year-end, the proposal was approved. The Plan has
2.
1.
Notes to the Financial Statements Year ended December 31, 2008

40
M c G I L L U N I V E R S I T Y P E N S I O N P L A N
Notes to the Financial Statements Year ended December 31, 2008
Significant Accounting Policies (continued)
INVESTMENTS (continued)
used a discounted cash flow approach toestimate a fair value using the best informationcurrently available. As a result, the Planrecognized a discount of $10,277,000 (2007 -$4,120,000) during the year, allocated asfollows: $6,582,000 (2007 - $2,639,000) -Accumulation Fund and $3,695,000 (2007 -$1,481,000) - Pensioner Fund. This estimateis subject to measurement uncertainty andthe fair value of the non-bank ABCP may differ from an actual fair value that willbe realized.
(c) Bond investments and equity investments arevalued at quoted market prices.
(d) Mortgage investments are valued at thepresent value of the future payments usingcurrent market yields of financial instrumentsof similar maturity and credit rating.
(e) Real estate investment valuations are based on periodic appraisals for privately-heldinvestments.
(f) Private equity investments are valued atmanagement’s best estimate of current fairvalues.
(g) Resource property investments are valued atquoted market prices.
INCOME RECOGNITION
Investment income is recorded on the accrualbasis.
CURRENT YEAR CHANGE IN FAIR VALUE
The current year change in fair value ofinvestments comprises both realized andunrealized gains and losses.
CHANGE IN ACCOUNTING POLICIES
The Plan’s management adopted the followingrecommenda-tions of the Canadian Institute ofChartered Accountants Handbook: Section 3862,Financial Instruments - Disclosures, Section 3863 -Financial instruments - Presentation and Section1535, Capital Disclosures. Section 3862 requiresthe disclosure of information about: a) the signifi -cance of financial instruments for the entity’sfinancial position and performance and b) thenature and extent of risks arising from financial
instruments to which the entity is exposed duringthe period and at the balance sheet date, andhow the entity manages those risks. The requireddisclosures are included in note 4. Section 3863contains standards for presentation of financialinstruments and non-financial derivatives. Section1535 requires the disclosure of information aboutexternally imposed capital requirements. Therequired disclosures are included in note 6. Theadoption of these Sections had no impact on thefinancial statements other than disclosure.
Investments
(A) TERMS AND CONDITIONS
The Plan holds investments to fund the retire-ment benefits for members of the Plan. The termsand conditions of investments are as follows:
Short-Term Investments
Short-term investments, primarily securitiesissued by Canadian chartered banks, governmentagencies and Canadian corporations, have anaverage term to maturity of 30 days in theAccumulation Fund (2007 - 34 days) and 28 daysin the Pensioner Fund (2007 - 41 days).
Non-Bank ABCP
The non-bank ABCP currently consists ofholdings of illiquid non-bank ABCP issued bytrusts. Under the restructuring proposal approvedsubsequent to year-end, the Plan received longer-term notes which have limited liquidity.
Bonds
In the Accumulation Fund, bonds, 63% of whichare guaranteed by the federal and provincialgovernments (2007 - 66%), have a weightedaverage yield to maturity of 4.63% (2007 - 4.17%)and an average duration of 7.5 years (2007 - 8.3years). In the Pensioner Fund, the yield tomaturity and duration are identical to that of the Accumulation Fund, as it invests in units of the Accumulation Fund’s Fixed Income Pool.
Mortgages
In the Pensioner Fund, mortgages, 25% of whichare insured under the National Housing Act
3.
2.

41
M c G I L L U N I V E R S I T Y P E N S I O N P L A N
41
Notes to the Financial Statements Year ended December 31, 2008
Investments (continued)
(A) TERMS AND CONDITIONS (continued)
Mortgages (continued)
(2007 - 27%), have a weighted average term of2.2 years (2007 - 3.0 years) and an averagecoupon rate of 7.40% (2007 - 7.41%). Themortgage portfolio is diversified throughoutCanada.
Common Stock
In both the Accumulation Fund and PensionerFund, common stocks, including trust units, arediversified by issuer, industry and country.
Real Estate
In both the Accumulation Fund and PensionerFund, real estate consists of investments inpooled funds investing directly in land andbuildings.
Private Equity
In the Accumulation Fund, private equityinvestments consist of investments in Canadianpension fund corporations, a U.S. limitedpartnership and six non-Canadian private equityfunds of funds.
Resource Properties
In both the Accumulation Fund and PensionerFund, resource properties consist of investmentsin publicly-traded Canadian oil and gas trustunits.
(B) COMMITMENTS
There are commitments in the amount of $66.9million (2007 - $56.0 million) to fund privateequity and real estate investments. It isanticipated that these commitments will be metin the normal course of operations.
(C) SECURITIES LENDING
Effective March 2008, the Plan ceased lendingsecurities. Prior to this date, contracts wereentered into whereby securities were loaned to aborrower for a fee, in accordance with the termsof a prearranged contract. At all times, theborrower had to maintain collateral coverage inthe amount of 105% of the fair value of thesecurities on loan.
3.
(D) FAIR VALUE
Accumulation Fund 2008 2007
Short-term investments $ 122,763,766 $ 100,274,007
Fixed income investmentsFederal bonds 179,308,385 185,033,462
Provincial bonds 58,328,743 58,726,254
Municipal bonds 2,402,770 1,640,806
Corporate bonds 118,357,387 122,472,188
Non-bank ABCP (Note 2B and 3A) 17,178,476 23,760,241
375,575,761 391,632,951
Equity investments
Common stocks, Canadian 199,561,990 283,377,967
Common stocks, Foreign 174,386,813 249,127,247
Real estate 31,005,308 46,047,461
Private equity 42,392,094 35,208,728
Resource properties 9,678,565 13,300,909
457,024,770 627,062,312
$ 955,364,297 $1,118,969,270

M c G I L L U N I V E R S I T Y P E N S I O N P L A N
Notes to the Financial Statements Year ended December 31, 2008
Financial Instruments
(A) CREDIT RISK
Credit risk arises from the potential for a bondissuer or mortgagor to default on its contractualobligations to the Plan. Although the Plan policypermits investments in below investment gradesecurities, it provides limits on such investments.The credit risk of mortgagors is minimized bydealing with borrowers considered to be of highquality and by monitoring their credit risk.Investments are recorded at fair value. Thisrepresents the maximum credit risk exposure ofthe Plan. At December 31, 2008, no amountsdue to the Plan are past due.
(B) INTEREST RATE RISK
Interest rate risk refers to the impact of interestrate changes on the Plan’s financial position.Interest rate changes directly impact the fair valueof fixed income securities held in the Plan.Interest rate changes will also have an indirectimpact on the remaining assets in the Plan. ThePlan employs investment diversification tomanage this risk.
(C) FOREIGN CURRENCY RISK
Foreign currency risk is the risk that the value of aforeign currency denominated asset or liability
will fluctuate due to changes in foreign exchangerates. The Plan employs diversification of assets tomanage this risk.
(D) MARKET RISK
Market risk is the risk that the fair value of aninvestment will fluctuate as a result of changes inmarket price. The Plan employs diversification ofassets to manage this risk.
Due from (to) Accumulation Fund(Pensioner Fund)
Pensioner Fund
Due from Accumulation Fund $ 1,136,734
Investment, AccumulationFund - Fixed Income Pool $89,715,526
Accumulation Fund
Due to Pensioner Fund $90,852,260
The amount of $89,715,526 (2007 - $88,199,466)relates to an investment made by the PensionerFund in units of the Accumulation Fund’s FixedIncome Pool. The amount of $1,136,734 (2007 -$4,757,309) relates to transfers into the PensionerFund that were accrued at year end.
3. Investments (continued)
(D) FAIR VALUE (continued)
Pensioner Fund
Short-term investments $ 15,703,646 $ 17,722,429
Mortgages
National Housing Act insured mortgages 15,068,505 18,060,884
Conventional mortgages 46,327,525 47,855,743
61,396,030 65,916,627
Fixed income investments
Accumulation Fund – Fixed Income Pool (Note 5) 89,715,526 88,199,466
Non-bank ABCP (Note 2B and 3A) 9,610,679 13,305,947
99,326,205 101,505,413
Equity investments
Common stocks, Canadian 34,286,085 56,453,871Real estate 37,833,697 34,216,093Resource properties 8,025,248 10,731,778
80,145,030 101,401,742
$256,570,911 $286,546,211
42
4.
5.

43
M c G I L L U N I V E R S I T Y P E N S I O N P L A N
6.
7.
Funding Deficit
The most recent triennial actuarial valuation, which was carried out as at December 31, 2006 by Eckler Ltd., the Plan’s actuary, confirmed apension asset for actuarial valuation purposes of$1.3 billion and a going-concern actuarial surplus of $33,597,000.
Comparative Amounts
Certain comparative amounts were reclassified toconform to the current year’s presentation.
Notes to the Financial Statements Year ended December 31, 2008

Pension Management, McGill University688 Sherbrooke Street West, Suite 1420
Montreal, Quebec H3A 3R1
Tel: (514) 398-6250 Fax: (514) 398-6889www.mcgill.ca/pensions
McGill UniversityPension PlanReport and Financial StatementsDecember 31, 2008