penn state university - multiphase flow science group at … · penn state university . ......
TRANSCRIPT

Sarma V. Pisupati Professor and Chair, Energy Engineering Program
Penn State University
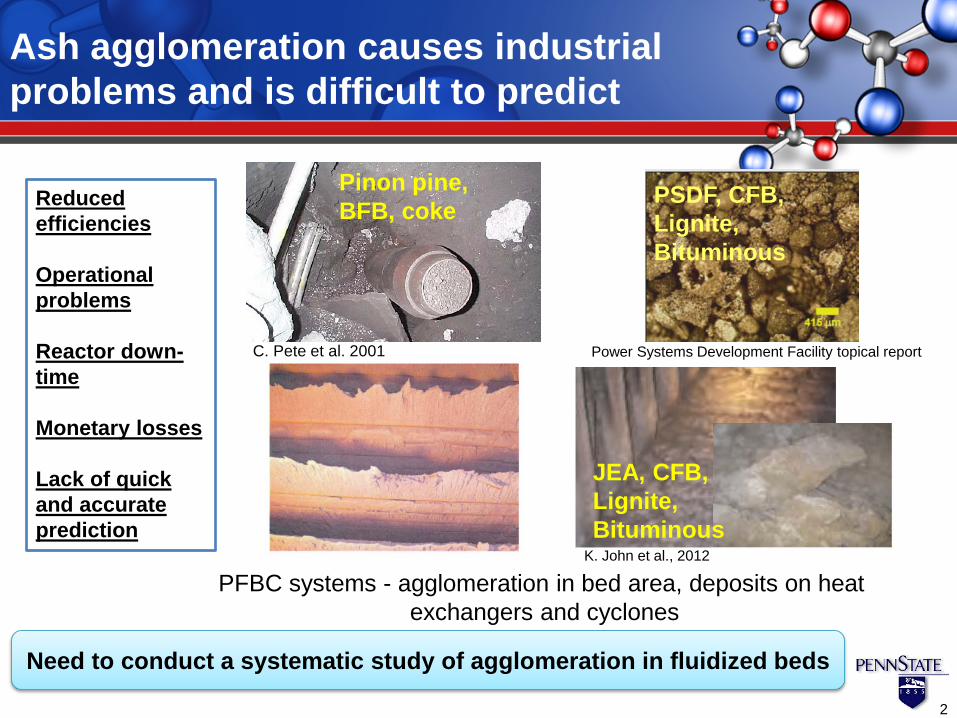
Ash agglomeration causes industrial problems and is difficult to predict
2
PFBC systems - agglomeration in bed area, deposits on heat exchangers and cyclones
Reduced efficiencies Operational problems Reactor down-time Monetary losses Lack of quick and accurate prediction
Need to conduct a systematic study of agglomeration in fluidized beds
Pinon pine, BFB, coke PSDF, CFB,
Lignite, Bituminous
JEA, CFB, Lignite, Bituminous
Power Systems Development Facility topical report
K. John et al., 2012
C. Pete et al. 2001

Prediction of agglomeration Only bulk properties - inadequate
Spatial and temporal variations - important Above parameters - interdependent – net effect on agglomeration
Non-uniformities throughout the reactor promote local initiation of agglomeration
3
• Bed ash is polydisperse Particle size
• Distribution of temperature among bed particles
• Particle temperature often 100 oC higher Temperature
• Ash is heterogeneous Chemical Composition
• Combustion and Gasification • Pockets of reducing conditions Gaseous atmosphere
• Distribution of particle velocities, granular temperatures, collision frequencies Hydrodynamics

Integration of particle-level chemistry and physics is required to predict agglomeration in FB gasification
4
Particle-level non-uniformities
Integration of ash chemistry and particle hydrodynamics
A.D. Salman, 2007., M.J. Adams, 1994.,B.J. Ennis, G. Tardos, R. Pfeffer, 1991. S. M. Iverson, J. D. Litster, 1998.
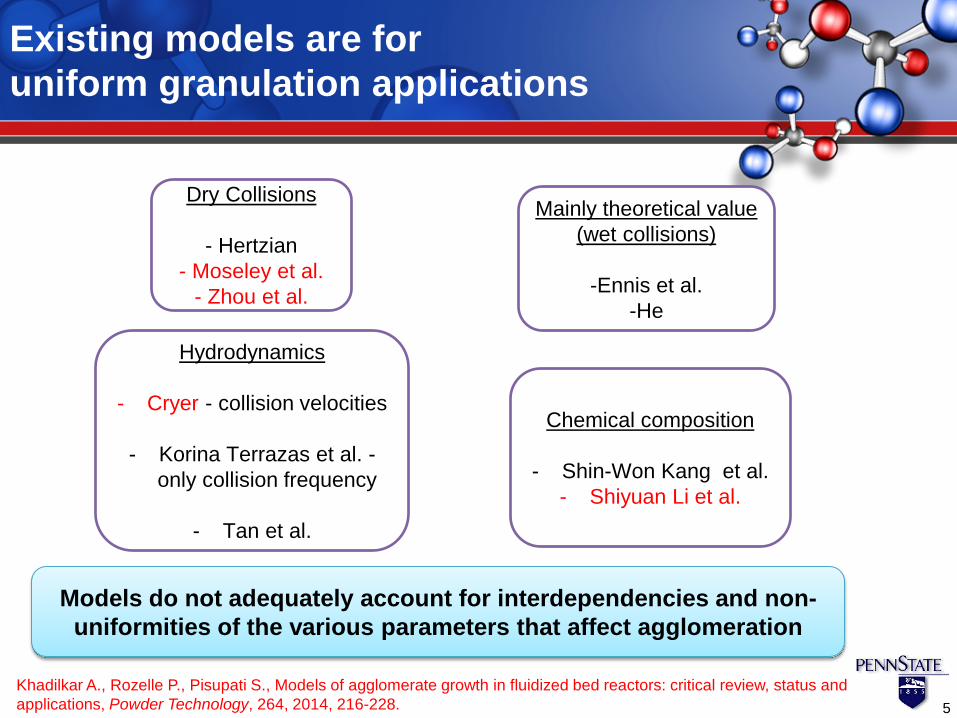
Existing models are for uniform granulation applications
Dry Collisions
- Hertzian - Moseley et al.
- Zhou et al.
Mainly theoretical value (wet collisions)
-Ennis et al.
-He
Chemical composition
- Shin-Won Kang et al. - Shiyuan Li et al.
Hydrodynamics
- Cryer - collision velocities
- Korina Terrazas et al. -
only collision frequency
- Tan et al.
Models do not adequately account for interdependencies and non-uniformities of the various parameters that affect agglomeration
5 Khadilkar A., Rozelle P., Pisupati S., Models of agglomerate growth in fluidized bed reactors: critical review, status and applications, Powder Technology, 264, 2014, 216-228.

Overall Objective: Development of a unified method to predict fluidized bed agglomeration
6
Amount of Slag
Viscosity
Collision frequency Granular
temperature Bed volume
Collision velocity
Mathematical model to predict resultant particle
growth rate
FactSageTM
CFD
Mathematica
• Polydispersity • Probability of wet collision • Collision frequency (particle number, granular temperature) • Kinetics and particle temperature distribution
in bed (Burn out time, fuel addition rate) • Stokes’ criterion

Stokes’ criterion used as basis for the energy dissipation
St Inertial forces/ Viscous forces
7 A.D. Salman, Granulation (Handbook of Powder Technology- Vol 11, Elsevier, 2007. S. A. Cryer, Modeling agglomeration processes in fluid-bed granulation, AIChE Journal, (1999) 45, 2069–2078.
St- Stokes number U – Particle collision velocity m- Particle mass d- Particle diameter 𝜇𝜇- Liquid layer viscosity
𝑆𝑆𝑆𝑆 = 𝑚𝑚𝑚𝑚
12𝜋𝜋𝜇𝜇𝑑𝑑2

FactSage Thermodynamic Simulation
8
Gaseous Atmosphere
Ash Chemical Composition
Equilibrium phase composition Solids Slag
Gases
Gaseous Atmosphere Oxidizing- 3% O2, 15% CO2, 72% N2 and 10 % water vapour Reducing- 32.6 % CO, 27.6 % H2, 14.3 % CO2 and balance water vapor
Ash Chemical Composition Gravity Separated fractions of Pittsburgh Seam Coal
Khadilkar A., Rozelle P., Pisupati S., Modeling Agglomeration during Fluidized Bed Combustion and Gasification, Proceedings of the International Conference of Coal Science and Technology, 2013,
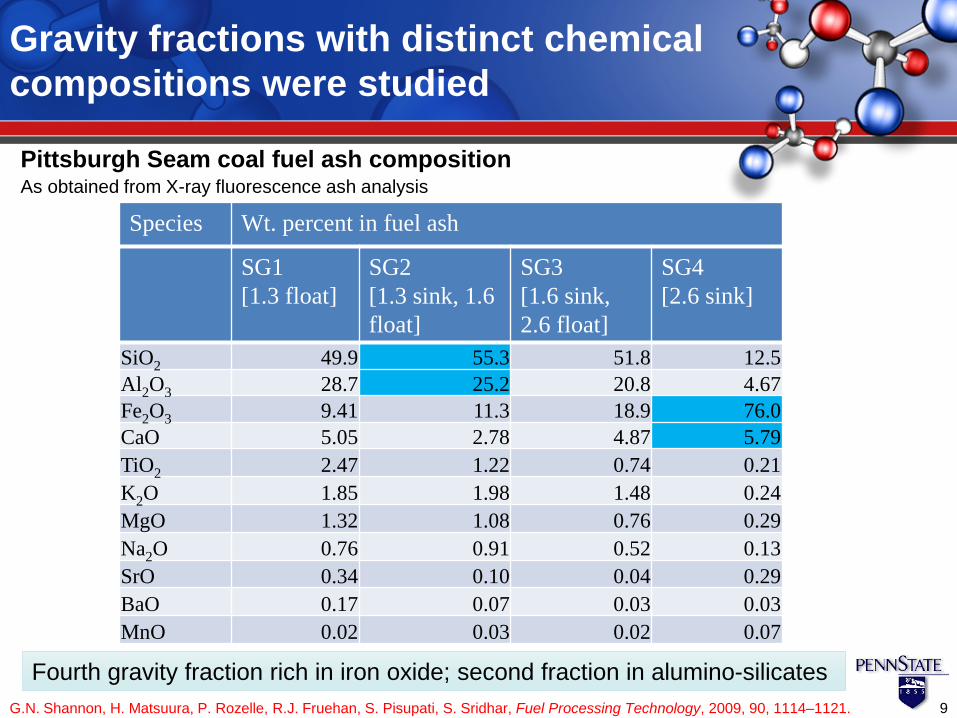
Gravity fractions with distinct chemical compositions were studied
Pittsburgh Seam coal fuel ash composition
As obtained from X-ray fluorescence ash analysis
9
Fourth gravity fraction rich in iron oxide; second fraction in alumino-silicates
Species Wt. percent in fuel ash
SG1 [1.3 float]
SG2 [1.3 sink, 1.6 float]
SG3 [1.6 sink, 2.6 float]
SG4 [2.6 sink]
SiO2 49.9 55.3 51.8 12.5 Al2O3 28.7 25.2 20.8 4.67 Fe2O3 9.41 11.3 18.9 76.0 CaO 5.05 2.78 4.87 5.79 TiO2 2.47 1.22 0.74 0.21 K2O 1.85 1.98 1.48 0.24 MgO 1.32 1.08 0.76 0.29 Na2O 0.76 0.91 0.52 0.13 SrO 0.34 0.10 0.04 0.29 BaO 0.17 0.07 0.03 0.03 MnO 0.02 0.03 0.02 0.07
G.N. Shannon, H. Matsuura, P. Rozelle, R.J. Fruehan, S. Pisupati, S. Sridhar, Fuel Processing Technology, 2009, 90, 1114–1121.
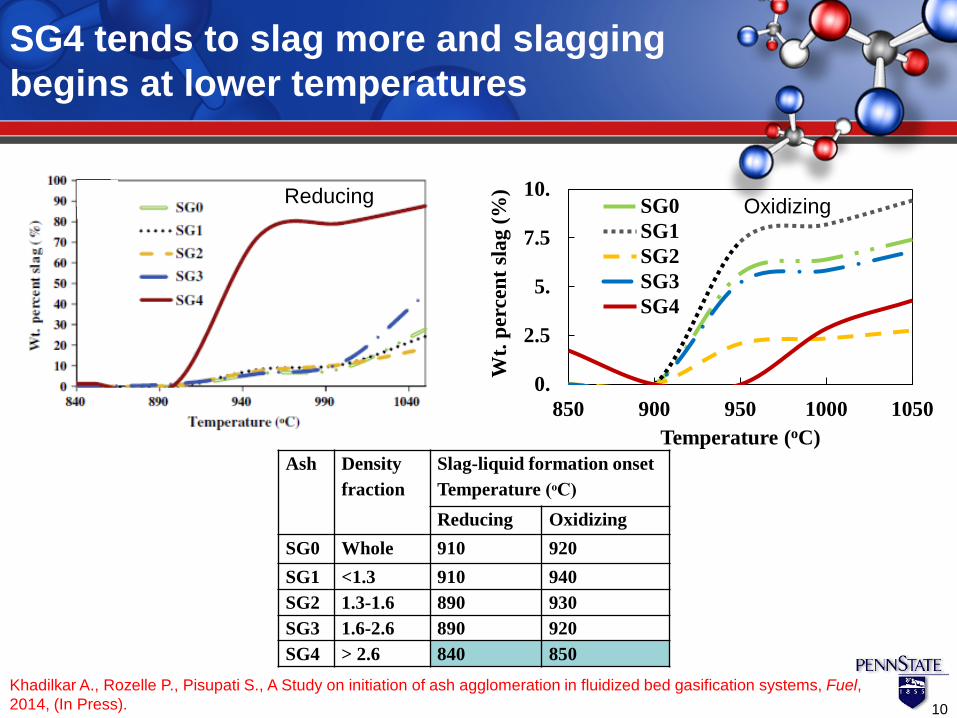
SG4 tends to slag more and slagging begins at lower temperatures
10
Ash Density fraction
Slag-liquid formation onset Temperature (ᵒC) Reducing Oxidizing
SG0 Whole 910 920 SG1 <1.3 910 940 SG2 1.3-1.6 890 930 SG3 1.6-2.6 890 920 SG4 > 2.6 840 850
0.
2.5
5.
7.5
10.
850 900 950 1000 1050
Wt.
perc
ent s
lag
(%)
Temperature (oC)
SG0SG1SG2SG3SG4
Khadilkar A., Rozelle P., Pisupati S., A Study on initiation of ash agglomeration in fluidized bed gasification systems, Fuel, 2014, (In Press).
Reducing Oxidizing
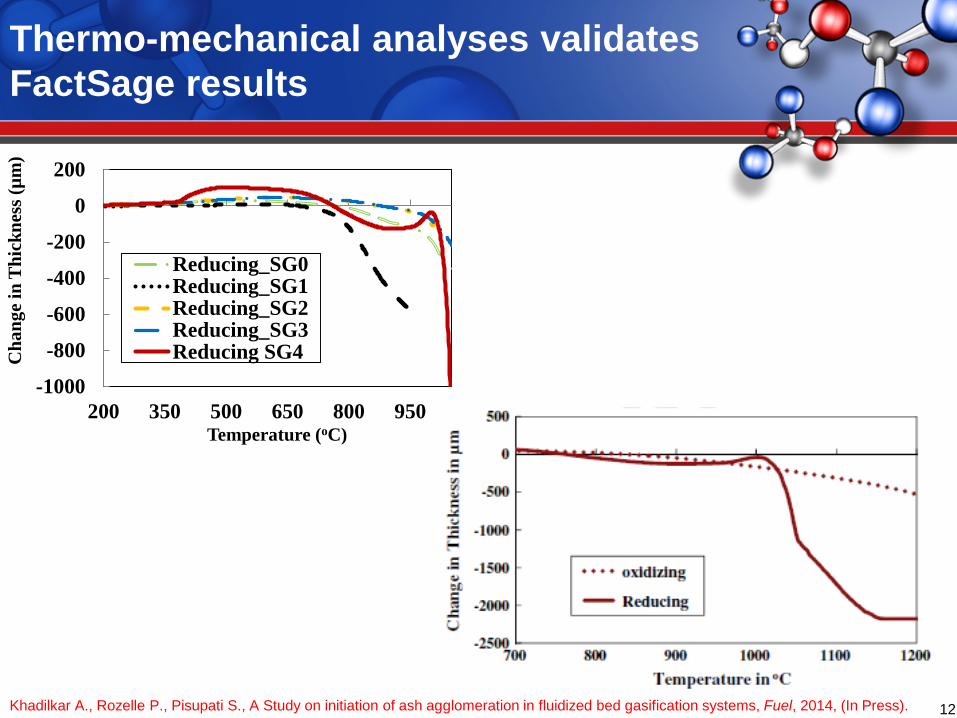
Thermo-mechanical analyses validates FactSage results
12
-1000
-800
-600
-400
-200
0
200
200 350 500 650 800 950
Cha
nge
in T
hick
ness
(µm
)
Temperature (oC)
Reducing_SG0Reducing_SG1Reducing_SG2Reducing_SG3Reducing SG4
Khadilkar A., Rozelle P., Pisupati S., A Study on initiation of ash agglomeration in fluidized bed gasification systems, Fuel, 2014, (In Press).

Reduced iron-containing phases are not detected in whole coal
13
Slag formation due to iron based eutectics may not be detected by bulk analysis
PS6SG4
Khadilkar A., Rozelle P., Pisupati S., A Study on initiation of ash agglomeration in fluidized bed gasification systems, Fuel, 2014, (In Press).

Methodology to obtain hydrodynamics
MFIX (Finite volume method) Eulerian-Eulerian, 3 D with cut cells
Mass, Momentum balance, Wen-Yu Drag law, Princeton friction model, Lun et al. Kinetic theory of granular flow
Particle size distribution, specific gravity Reactor dimensions
Velocity at the jet
Granular temperature Particle velocity
Voidage Bed volume
14
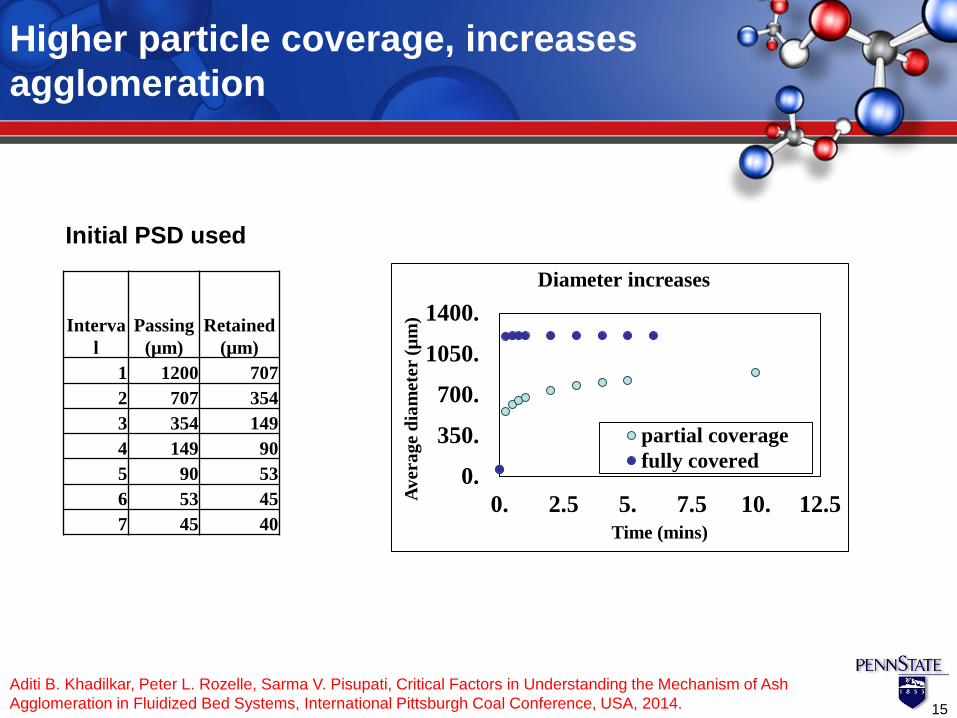
Higher particle coverage, increases agglomeration
15
0.
350.
700.
1050.
1400.
0. 2.5 5. 7.5 10. 12.5Aver
age
diam
eter
(µm
)
Time (mins)
Diameter increases
partial coveragefully covered
Initial PSD used
Interval
Passing (µm)
Retained (µm)
1 1200 707 2 707 354 3 354 149 4 149 90 5 90 53 6 53 45 7 45 40
Aditi B. Khadilkar, Peter L. Rozelle, Sarma V. Pisupati, Critical Factors in Understanding the Mechanism of Ash Agglomeration in Fluidized Bed Systems, International Pittsburgh Coal Conference, USA, 2014.
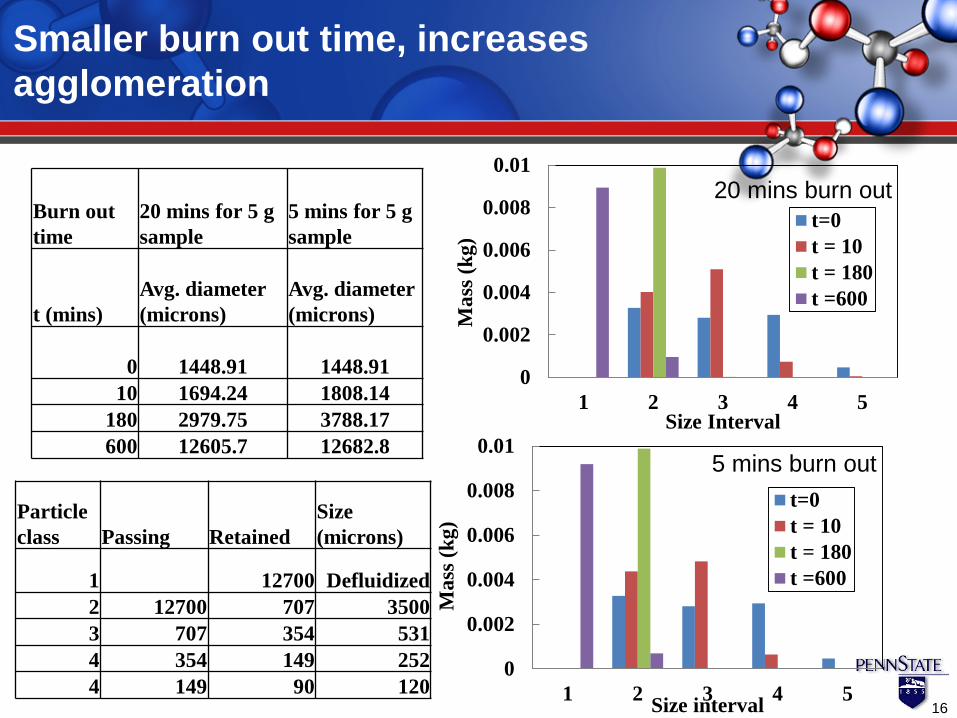
Smaller burn out time, increases agglomeration
Burn out time
20 mins for 5 g sample
5 mins for 5 g sample
t (mins) Avg. diameter (microns)
Avg. diameter (microns)
0 1448.91 1448.91 10 1694.24 1808.14
180 2979.75 3788.17 600 12605.7 12682.8
0
0.002
0.004
0.006
0.008
0.01
1 2 3 4 5
Mas
s (kg
)
Size Interval
t=0t = 10t = 180t =600
0
0.002
0.004
0.006
0.008
0.01
1 2 3 4 5
Mas
s (kg
)
Size interval
t=0t = 10t = 180t =600
20 mins burn out
5 mins burn out
Particle class Passing Retained
Size (microns)
1 12700 Defluidized 2 12700 707 3500 3 707 354 531 4 354 149 252 4 149 90 120
16
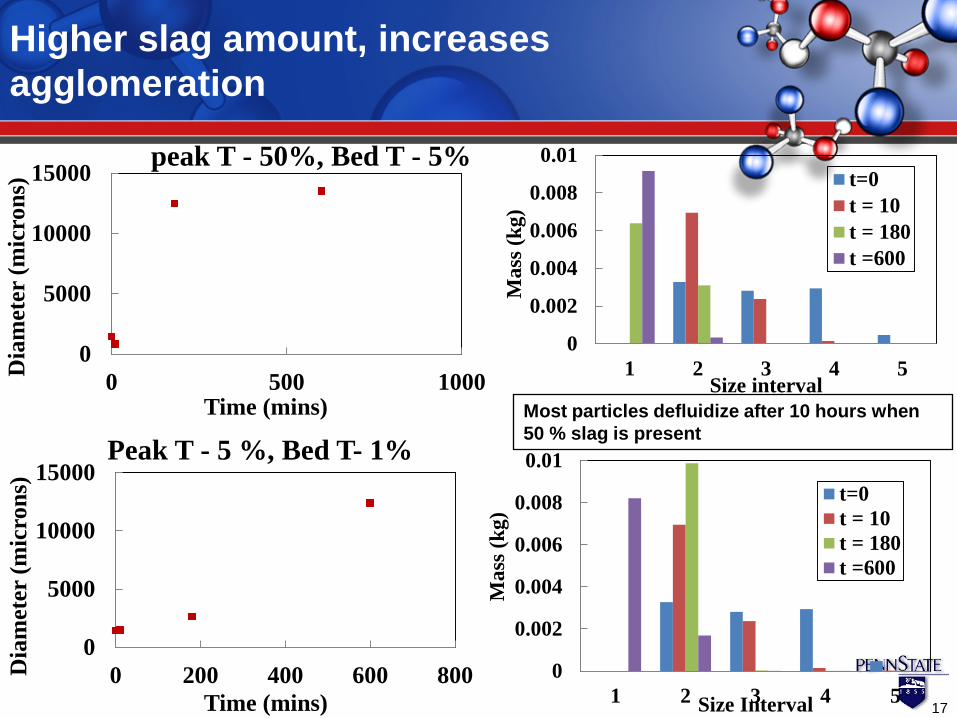
Higher slag amount, increases agglomeration
0
5000
10000
15000
0 500 1000Dia
met
er (m
icro
ns)
Time (mins)
peak T - 50%, Bed T - 5%
0
0.002
0.004
0.006
0.008
0.01
1 2 3 4 5
Mas
s (kg
)
Size interval
t=0t = 10t = 180t =600
0
5000
10000
15000
0 200 400 600 800Dia
met
er (m
icro
ns)
Time (mins)
Peak T - 5 %, Bed T- 1%
0
0.002
0.004
0.006
0.008
0.01
1 2 3 4 5
Mas
s (kg
)
Size Interval
t=0t = 10t = 180t =600
Most particles defluidize after 10 hours when 50 % slag is present
17
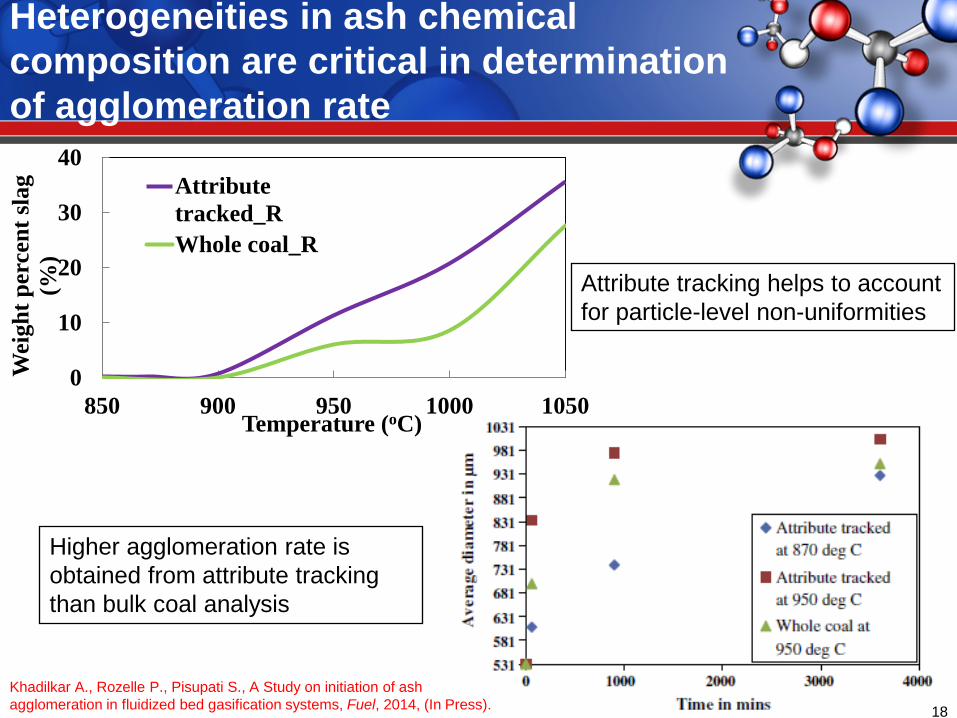
Heterogeneities in ash chemical composition are critical in determination of agglomeration rate
18
0
10
20
30
40
850 900 950 1000 1050
Wei
ght p
erce
nt sl
ag
(%)
Temperature (oC)
Attributetracked_RWhole coal_R
Attribute tracking helps to account for particle-level non-uniformities
Higher agglomeration rate is obtained from attribute tracking than bulk coal analysis
Khadilkar A., Rozelle P., Pisupati S., A Study on initiation of ash agglomeration in fluidized bed gasification systems, Fuel, 2014, (In Press).
Summary
• Penn State study has shown that certain particle classes are responsible for initiating agglomeration which the bulk analysis alone cannot detect.
• Particles rich in iron compounds such as those in the SG4 fraction initiate agglomeration at low fluidized bed operating conditions.
• FactSage thermodynamic analysis of gravity separated fuel fractions, along with attribute tracking, helps to predict particle-class level initiation of agglomeration.
• The Penn State Ash Agglomeration Model integrates both fuel chemistry and particle physics to predict agglomerate growth kinetics.
• This model accounts for heterogeneities in ash chemical composition and particle temperatures as well as polydispersity in the bed.
19
Application of this work extends to several related industries
Agglomeration model • Chemical Looping • Direct iron reduction • Agglomeration during biomass combustion and gasification • Agglomeration due to low rank coals such as in TRIG (KBR) • Bed agglomeration during oxy-fuel combustion (Aerojet RocketDyne) • Flow assurance in petroleum industry • Fluidized catalytic cracking • Fluidized bed drying • Granulation in pharmaceuticals and nano particle agglomeration Characterization Techniques involved • Slag viscosity measurement – Reliance India Ltd. • SEM-EDX- Post mortem agglomerate analyses- Integrated Waste
Treatment Units
20
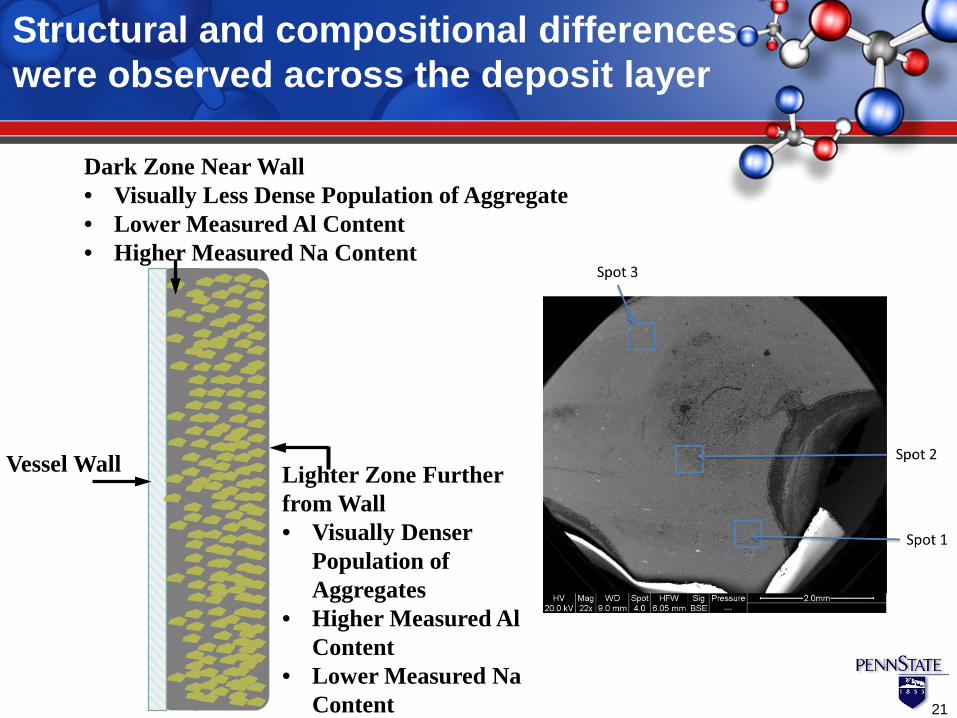
Dark Zone Near Wall • Visually Less Dense Population of Aggregate • Lower Measured Al Content • Higher Measured Na Content
Vessel Wall Lighter Zone Further from Wall • Visually Denser
Population of Aggregates
• Higher Measured Al Content
• Lower Measured Na Content
Structural and compositional differences were observed across the deposit layer
21
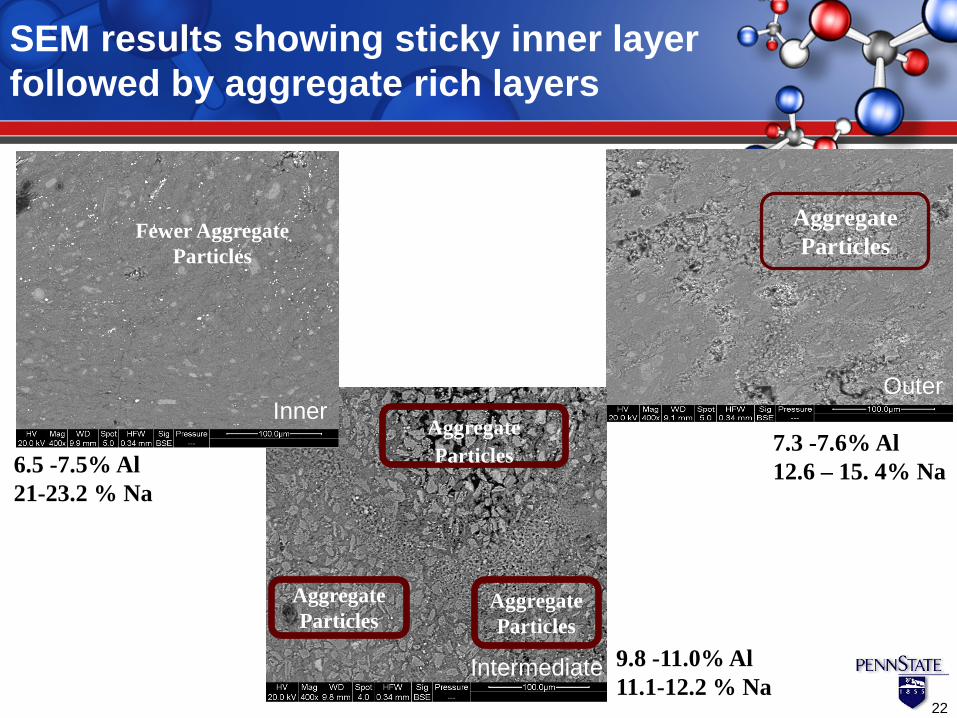
SEM results showing sticky inner layer followed by aggregate rich layers
22
7.3 -7.6% Al 12.6 – 15. 4% Na
Aggregate Particles
Aggregate Particles
Aggregate Particles
Aggregate Particles
9.8 -11.0% Al 11.1-12.2 % Na
Fewer Aggregate Particles
6.5 -7.5% Al 21-23.2 % Na
Inner
Intermediate
Outer
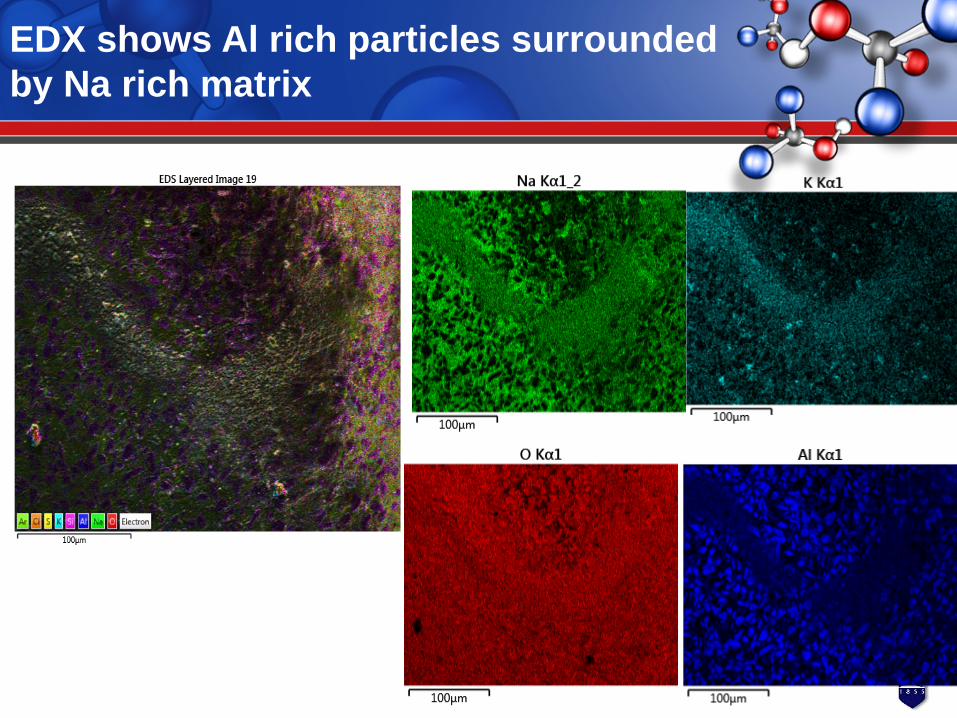
EDX shows Al rich particles surrounded by Na rich matrix