pengelola jurnal journal of asean...
TRANSCRIPT

Jurnal of Asean Studies on Maritime Issues Vol. 3 No 4 May 2017
i
PENGELOLA JURNAL
JOURNAL OF ASEAN STUDIES ON MARITIME ISSUES
Penanggung Jawab : Prof. Dr. Ir. Inneke Rumengan, M.Sc. (Ketua LPPM UNSRAT)
Redaktur : Prof. Dr. Ir. Sangkertadi, DEA.
Prof. Dr. Fety Fatimah, M.Si.
Prof. Dr. Ir. Carolus P. Paruntu, M.Sc.
Prof. Dr. Paulus Kindangen, SU.,MA.
Penyunting / Editor : Dr. Meita Rumbayan, ST. M.Eng. EVA
Dr. Feny Mentang, M.Sc.
Calvyn F. A. Sondak, S.Pi., M.Sc., Stud., Ph.D.
Dr. Ir. Suria Darwisto, M. Sc.
Johan R. Tumiwa, SE. MM.
Dr. Dra. Benedicta J. Mokalu, M.Si.
Dr. Eng. Steven Sentinuwo, ST. MTI
Desain Grafis : Xaverius Najoan, ST. MT
Izaac Runtulalo, S.Pt.
Sekertariat : Greis O. Sengkey
Alamat : Jl. Kampus UNSRAT, Bahu Manado.
Email : [email protected]
Laman : lppm.unsrat.ac.id

Jurnal of Asean Studies on Maritime Issues Vol. 3 No 4 May 2017
ii
DAFTAR ISI
Indonesian North Bolaang Mongondow’s Furniture Industry - Qspm And Topsis Model
Farlane Rumokoy ..................................................................................................................... 1
Program Of Pt Tirta Investama (Danone Aqua) Airmadidi Addressing Mea By Evaluating The
Welfare By Using The Importance And Performance Analysis
Stevie A. Lasut ........................................................................................................................ 19
Analyzing Consumer Attitude Between Male And Female To Purchase Intention Counterfeit
Wakai Shoes
Michael Raintung .................................................................................................................... 31
Profesi Akuntan Di Era Masyarakat Ekonomi Asean
Princilvanno A. Naukoko......................................................................................................... 42
Evaluating Servicescape Of The Premiere Cineplex 21 Group In Manado Town Square 3 Using
Importance And Performance Analysis
Farlane S. Rumokoy dan George G. Sumampouw .................................................................. 52
Relationships Of Causality From Level Of Education, Revenues, And Consumption To The
Quantities Of Poor People In The Coastal Beach In City Of Bitung In Aec Free Competition
Sifrid S. Pangemanan ............................................................................................................... 60
Journal of ASEAN Studies on Maritime Issues Vol. 3 No. 4 May 2017
1
INDONESIAN NORTH BOLAANG MONGONDOW’S FURNITURE
INDUSTRY - QSPM AND TOPSIS MODEL
Farlane Rumokoy
International Business Administration, Faculty of Economics and Business,
Sam Ratulangi University, Manado 95115, Indonesia
email: [email protected]
ABSTRACT
Almost all regions in Indonesia are experiencing rapid growth in the development. Day by day the
construction is growing rapidly, not an exception for North Bolaang Mongondow. Since inaugurated
as a regional autonomy on 2 January 2007, the development of this area is developed rapidly. For
example the opening of some land to be constructed of housing and offices and this tendency of
development will be on and on along with the opening of new land in this area. By the increasing of
public demand for furniture products then it will automatically increasing the number of companies
engaged in this same field of industry. This research has the purpose to concerning MSMEs as the
object of the research where furniture industry is chosen as the main object of it by considering its
existence and prospect to grow ahead with the opportunity of both national and international issues
such as the Asean Economic Community AEC) and any other global issues which these condition
indirectly pushes the competitiveness among MSMEs become more tight and it is inevitably to be
avoid. By doing strategic management process which is strategy formulation, then this could help the
business that engaged in furniture industry to improving the performance so that they can survive and
remain consistent to its goal in running the business. The research method used is the combination of
descriptive qualitative and quantitative method where quantitative is used to facilitate the qualitative
by using some of the analytical tools such as IE, SWOT,QSPM and TOPSIS .The result on QSPM and
Fuzzy TOPSIS show that market development becomes the top preferred priority among other
alternative strategies with the amount of weight is 3.697 in QSPM and 0.72124 in Fuzzy TOPSIS.
Keywords: IE Matrix, QSPM, Strategy Formulation, Strategic Management, SWOT, TOPSIS Model
INTRODUCTION
In Indonesia, Micro, Small and Medium Enterprises often abbreviated (MSMEs) is
currently regarded as an effective ways to reducing poverty. From the statistics, MSMEs
represent the largest number of business groups, where the number of MSMEs registered in
2013 was 57.89 million units, or approximately 97.9% of total business units and the number
continues to grow each year.
SMEs are the largest group of economic actors in the Indonesian economy and proved
to be a safety valve in the national economy during the crisis, as well as a dynamic factor of
economic growth after the economic crisis. In addition, to being the greatest business sector
contribution to national development, SMEs also create employment opportunities for a large
enough domestic labor, thus greatly helping to reduce unemployment. The development trend
shows that SMEs have a huge potential for non-oil exports. Based on BPS data in 2013, there
were about 182,112.7 trillion in non-oil exports. The contribution of SMEs to GDP is very
Journal of ASEAN Studies on Maritime Issues Vol. 3 No. 4 May 2017
2
significant where the contribution of small, and medium to gross domestic product increased
from 57.84% to 60.34% of the total GDP in the last five years. In terms of investments
existence of SMEs is quite dominant with achieving 341,341.6 trillion or about 56.15%
(Central Bureau of Statistics, 2013).
Most of the population is poorly educated and live in small business activity in both
traditional and modern sectors. However, the development effort that has been carried out is
still not satisfactory result, because in reality the progress of SMEs is very small compared to
the progress made by the great labor. This condition in tandem directly to what micro, small
and medium enterprises has faced in the developing country include lack of access to finance
and market, the low ability to acquire necessary technical and managerial skills, as well as
access to technology (Stevenson & St-Onge, 2006 cited by Ogot, 2012).These obstacles are in
tandem directly to the low of educational level, low-skilled work base, and also the regulatory
constrain facing by the perpetrators of MSMEs.
By conducting the strategic management which is the strategy formulation then this
MSMEs can be focused analyzed with a deep observation in it, in order to find the root of
problem that hinder the businesses within the furniture industry to be develop because in
conducting the business they are experiencing problems regarding to the management of its
business the performance generated by the company is still less than what is expected because
there are still certain people who run in double jobs, making it less focus on work and not the
maximum workable results. That is why this kind of condition needs to upgrade which is
regenerate the management system in order to overhaul and reformulate the strategy so the
MSMEs can be able to survive and even gain more revenue from it, because if this business is
not perceptive to recognize the condition that rapidly change, then it is difficult for the
business engaged in furniture industry in this case, to produce products which complied with
consumer tastes or demand of the market.
THEORETICAL REVIEW
In the process of conducting the research, strategic management subject was proposed
in this study, the formulation strategies that has been conducted is including developing the
vision and mission, identifying opportunities and external threats of the organization,
determining the internal strengths and weaknesses to the organization, set the long-term goals,
made a number of alternative strategies, and choose a strategy that will be implemented.
Decisions are binding the organization in order to formulating strategy towards products,
market, resources and technology for a long period of time (David, 2006).
Journal of ASEAN Studies on Maritime Issues Vol. 3 No. 4 May 2017
3
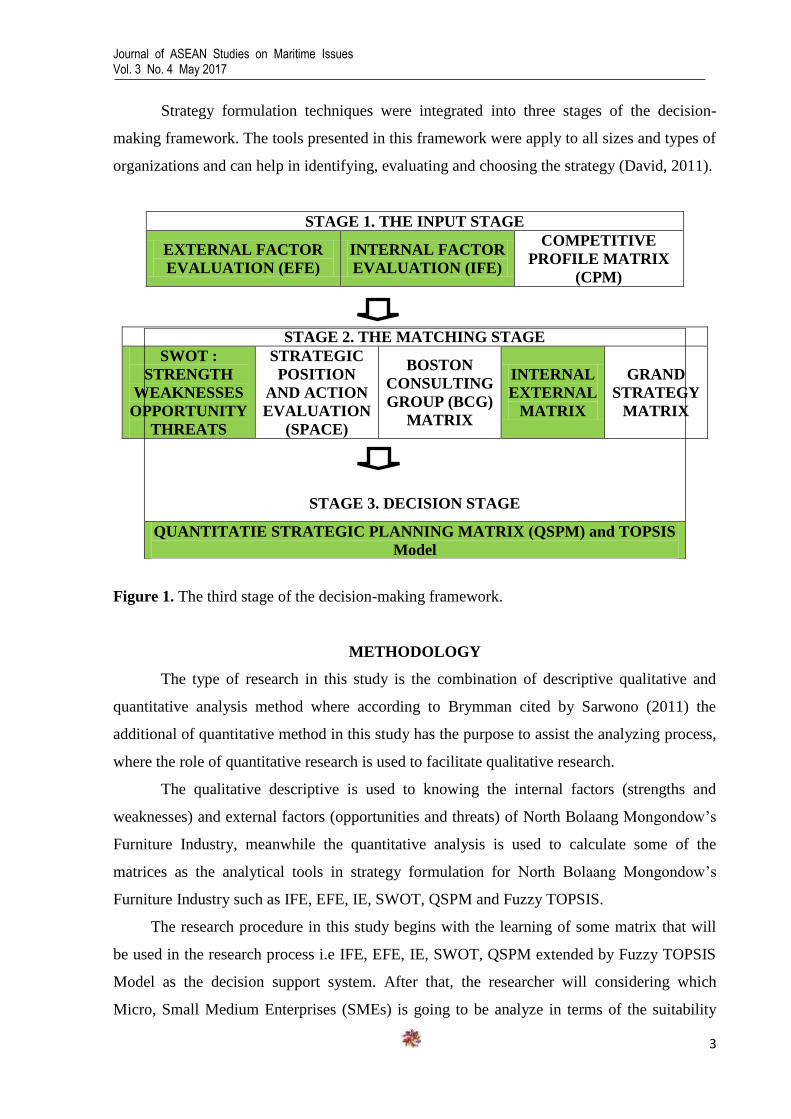
Strategy formulation techniques were integrated into three stages of the decision-
making framework. The tools presented in this framework were apply to all sizes and types of
organizations and can help in identifying, evaluating and choosing the strategy (David, 2011).
STAGE 1. THE INPUT STAGE
EXTERNAL FACTOR
EVALUATION (EFE)
INTERNAL FACTOR
EVALUATION (IFE)
COMPETITIVE
PROFILE MATRIX
(CPM)
Figure 1. The third stage of the decision-making framework.
METHODOLOGY
The type of research in this study is the combination of descriptive qualitative and
quantitative analysis method where according to Brymman cited by Sarwono (2011) the
additional of quantitative method in this study has the purpose to assist the analyzing process,
where the role of quantitative research is used to facilitate qualitative research.
The qualitative descriptive is used to knowing the internal factors (strengths and
weaknesses) and external factors (opportunities and threats) of North Bolaang Mongondow‟s
Furniture Industry, meanwhile the quantitative analysis is used to calculate some of the
matrices as the analytical tools in strategy formulation for North Bolaang Mongondow‟s
Furniture Industry such as IFE, EFE, IE, SWOT, QSPM and Fuzzy TOPSIS.
The research procedure in this study begins with the learning of some matrix that will
be used in the research process i.e IFE, EFE, IE, SWOT, QSPM extended by Fuzzy TOPSIS
Model as the decision support system. After that, the researcher will considering which
Micro, Small Medium Enterprises (SMEs) is going to be analyze in terms of the suitability
STAGE 2. THE MATCHING STAGE
SWOT :
STRENGTH
WEAKNESSES
OPPORTUNITY
THREATS
STRATEGIC
POSITION
AND ACTION
EVALUATION
(SPACE)
BOSTON
CONSULTING
GROUP (BCG)
MATRIX
INTERNAL
EXTERNAL
MATRIX
GRAND
STRATEGY
MATRIX
STAGE 3. DECISION STAGE
QUANTITATIE STRATEGIC PLANNING MATRIX (QSPM) and TOPSIS
Model

Journal of ASEAN Studies on Maritime Issues Vol. 3 No. 4 May 2017
4
and appropriateness of the business by the consideration of how long the business started, the
number of workers employed, the organization structured, the amount of initial capital and
many other factors.
After chosen the MSMEs that is going to analyze then the next step is setting up
interviews with business owner, employees, stakeholders and continued with the distribution
of questionnaires to determine the weight and rating of the IFE and EFE which previously
evaluated from the internal and external environment. When the weighted score has been
obtained from IFE and EFE, then the next step is determining the Internal-External by using
the weighted score from IFE and EFE. Beside the weighted score, each external factor and
internal factor evaluation of IFE and EFE can be used as well to formulating the strategy of
SWOT.
Eventually, when all the strategy has already been analyzed and determined then the
last step is formulating the best strategy of North Bolaang Mongondow‟s Furniture Industry
by using QSPM and TOPSIS model as the decision support system model. The result of both
QSPM and TOPSIS will be the best strategy that will be implemented by the MSMEs
involved.
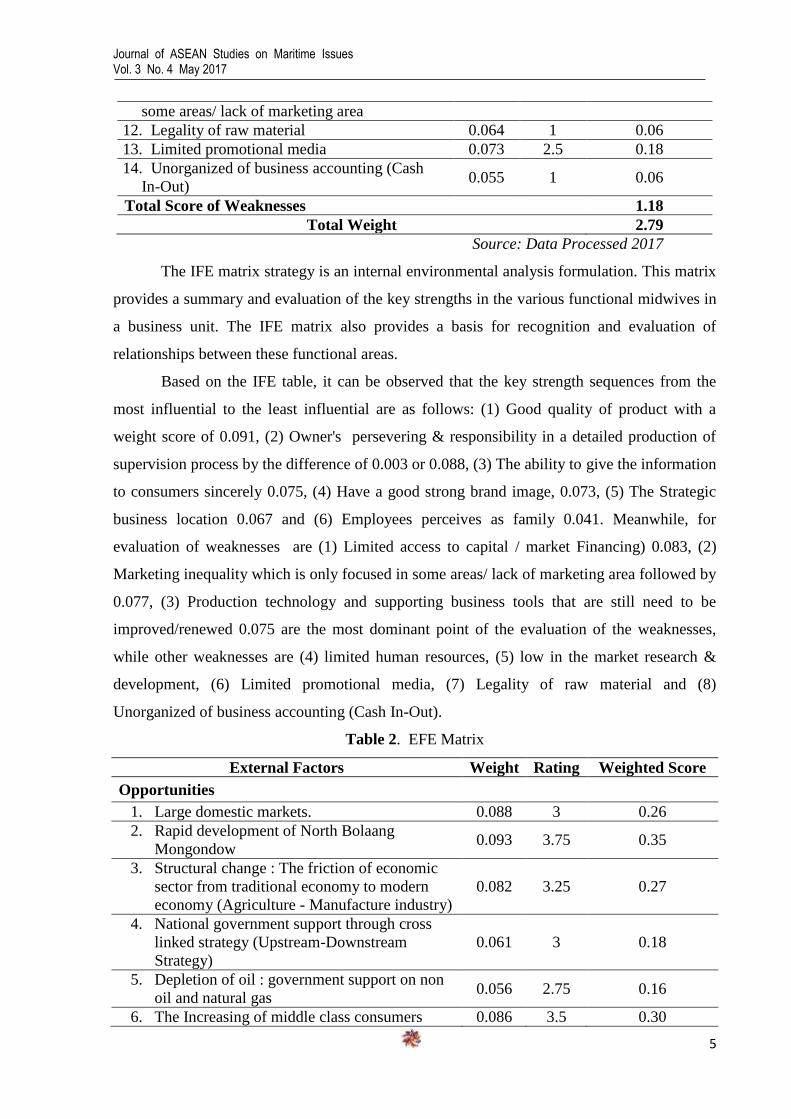
ANALYSIS & DISCUSSION
Input Stage
Table 1. IFE Matrix
External Factor Weight Rating Weighted Score
Strengths
1. Good quality of product 0.091 4 0.36
2. Owner's persevering & responsibility in a
detailed production of supervision process 0.088 4 0.35
3. The ability to give the information to
consumers sincerely 0.075 3.75 0.28
4. Have a strong brand image 0.073 3.75 0.27
5. The strategic business location 0.067 3.25 0.22
6. Employees perceives as family 0.041 3 0.12
Total Score of Strengths 1.61
Weaknesses
7. Limited human resources 0.072 2 0.14
8. Low in the market research & development 0.066 1 0.07
9. Limited access to capital /market financing 0.083 3 0.25
10. Production technology and supporting
business tools that need to be
improved/renewed
0.075 2.5 0.19
11. Marketing inequality which is only focused in 0.077 3 0.23
Journal of ASEAN Studies on Maritime Issues Vol. 3 No. 4 May 2017
5
some areas/ lack of marketing area
12. Legality of raw material 0.064 1 0.06
13. Limited promotional media 0.073 2.5 0.18
14. Unorganized of business accounting (Cash
In-Out) 0.055 1 0.06
Total Score of Weaknesses 1.18
Total Weight 2.79
Source: Data Processed 2017
The IFE matrix strategy is an internal environmental analysis formulation. This matrix
provides a summary and evaluation of the key strengths in the various functional midwives in
a business unit. The IFE matrix also provides a basis for recognition and evaluation of
relationships between these functional areas.
Based on the IFE table, it can be observed that the key strength sequences from the
most influential to the least influential are as follows: (1) Good quality of product with a
weight score of 0.091, (2) Owner's persevering & responsibility in a detailed production of
supervision process by the difference of 0.003 or 0.088, (3) The ability to give the information
to consumers sincerely 0.075, (4) Have a good strong brand image, 0.073, (5) The Strategic
business location 0.067 and (6) Employees perceives as family 0.041. Meanwhile, for
evaluation of weaknesses are (1) Limited access to capital / market Financing) 0.083, (2)
Marketing inequality which is only focused in some areas/ lack of marketing area followed by
0.077, (3) Production technology and supporting business tools that are still need to be
improved/renewed 0.075 are the most dominant point of the evaluation of the weaknesses,
while other weaknesses are (4) limited human resources, (5) low in the market research &
development, (6) Limited promotional media, (7) Legality of raw material and (8)
Unorganized of business accounting (Cash In-Out).
Table 2. EFE Matrix
External Factors Weight Rating Weighted Score
Opportunities
1. Large domestic markets. 0.088 3 0.26
2. Rapid development of North Bolaang
Mongondow 0.093 3.75 0.35
3. Structural change : The friction of economic
sector from traditional economy to modern
economy (Agriculture - Manufacture industry)
0.082 3.25 0.27
4. National government support through cross
linked strategy (Upstream-Downstream
Strategy)
0.061 3 0.18
5. Depletion of oil : government support on non
oil and natural gas 0.056 2.75 0.16
6. The Increasing of middle class consumers 0.086 3.5 0.30
Journal of ASEAN Studies on Maritime Issues Vol. 3 No. 4 May 2017
6
7. The enhancement of society‟s awareness
towards information technology such as social
media
0.062 3 0.19
8. Good relationship and high credibility with the
supplier. 0.062 3.5 0.22
Total Score of Opportunities 1.93
Threats
9. Inadequate of infrastructure in North Bolaang
Mongondow 0.073 3.5 0.26
10. The emergence of more innovative common
business, supported by renewal technology &
extensive business capital.
0.080 3 0.24
11. The Increasing of substitute product 0.087 3.75 0.33
12. The Development of global business in the era
of free trade 0.041 1.25 0.05
13. Customer are more demanding 0.067 3.5 0.23
14. Unavailability of supporting business in North
Bolaang Mongondow 0.060 3.25 0.19
Total Score of Threats 1.30
Total Weight 3.23
Source: Data Processed 2017
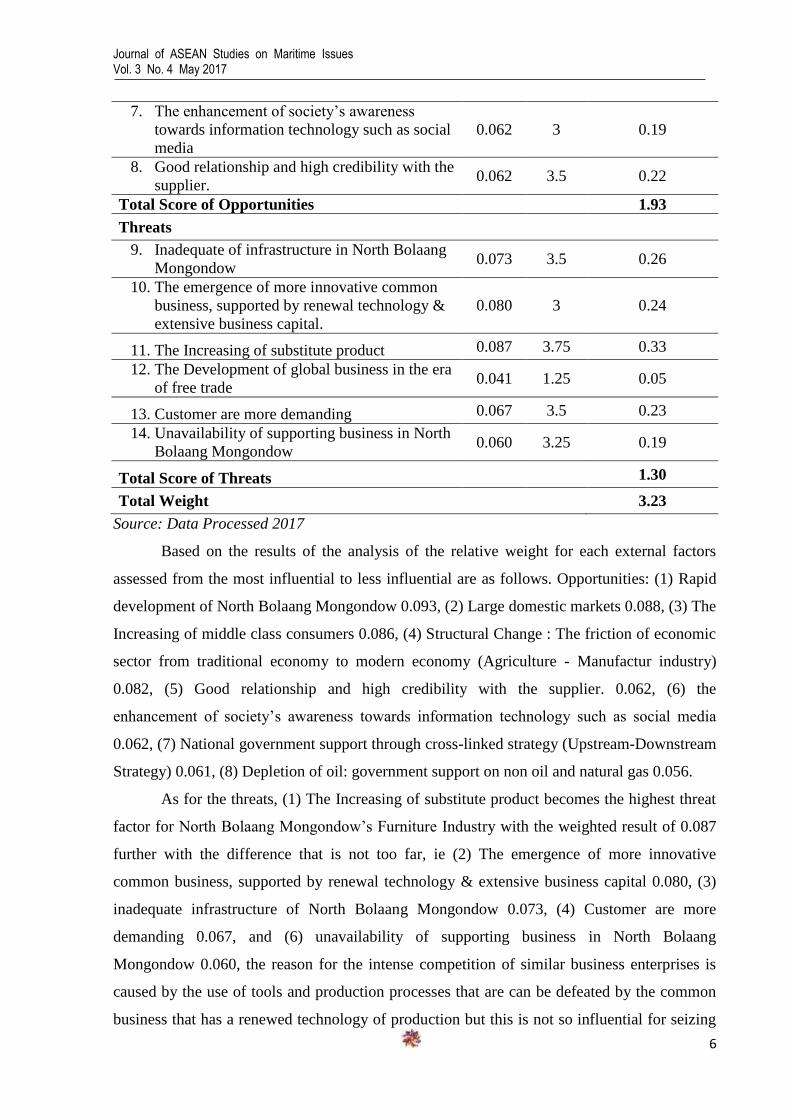
Based on the results of the analysis of the relative weight for each external factors
assessed from the most influential to less influential are as follows. Opportunities: (1) Rapid
development of North Bolaang Mongondow 0.093, (2) Large domestic markets 0.088, (3) The
Increasing of middle class consumers 0.086, (4) Structural Change : The friction of economic
sector from traditional economy to modern economy (Agriculture - Manufactur industry)
0.082, (5) Good relationship and high credibility with the supplier. 0.062, (6) the
enhancement of society‟s awareness towards information technology such as social media
0.062, (7) National government support through cross-linked strategy (Upstream-Downstream
Strategy) 0.061, (8) Depletion of oil: government support on non oil and natural gas 0.056.
As for the threats, (1) The Increasing of substitute product becomes the highest threat
factor for North Bolaang Mongondow‟s Furniture Industry with the weighted result of 0.087
further with the difference that is not too far, ie (2) The emergence of more innovative
common business, supported by renewal technology & extensive business capital 0.080, (3)
inadequate infrastructure of North Bolaang Mongondow 0.073, (4) Customer are more
demanding 0.067, and (6) unavailability of supporting business in North Bolaang
Mongondow 0.060, the reason for the intense competition of similar business enterprises is
caused by the use of tools and production processes that are can be defeated by the common
business that has a renewed technology of production but this is not so influential for seizing

Journal of ASEAN Studies on Maritime Issues Vol. 3 No. 4 May 2017
7
the market due to the consumer loyalty which is high against the product quality and owner's
capability in informing every production process that sincere and consistent that makes the
business has a very strong brand image among the society so that the competition effort
among the common business can be minimized. Furthermore, (7) the development of global
business in the era of free trade became the last threat with the lowest weight of 0.041 due to
competition that has not been so influential on the business development.
Matching Stage
Internal-External Matrix Analysis
IE matrix is based on two key dimensions ie total IFE values weighted on the X axis
and total IFE values weighted on Y axis. Based on IFE matrix analysis results obtained a
score of 2.67 and EFE analysis obtained score of 3.23. The combined value puts the company
in the first awareness of the strategy of growing and developing, so the appropriate strategy to
do is backward, forward and horizontal integration, market penetration, market
development, & product development.
EFE Total
Weighted Score
EFE 3.23
IFE 2.79
Figure 2. Internal-External Matrix
4.0
STRONG
3.0-4.0
3.0
AVERAGE
2.0-2.99
2.0
WEAK
1.0-1.99
1.0
HIGH
3.0-4.0
I
II
III
MEDIUM
2.0-2.99
IV
V
VI
SLOW
1.0-1.99
VII
VIII
IX
Journal of ASEAN Studies on Maritime Issues Vol. 3 No. 4 May 2017
8
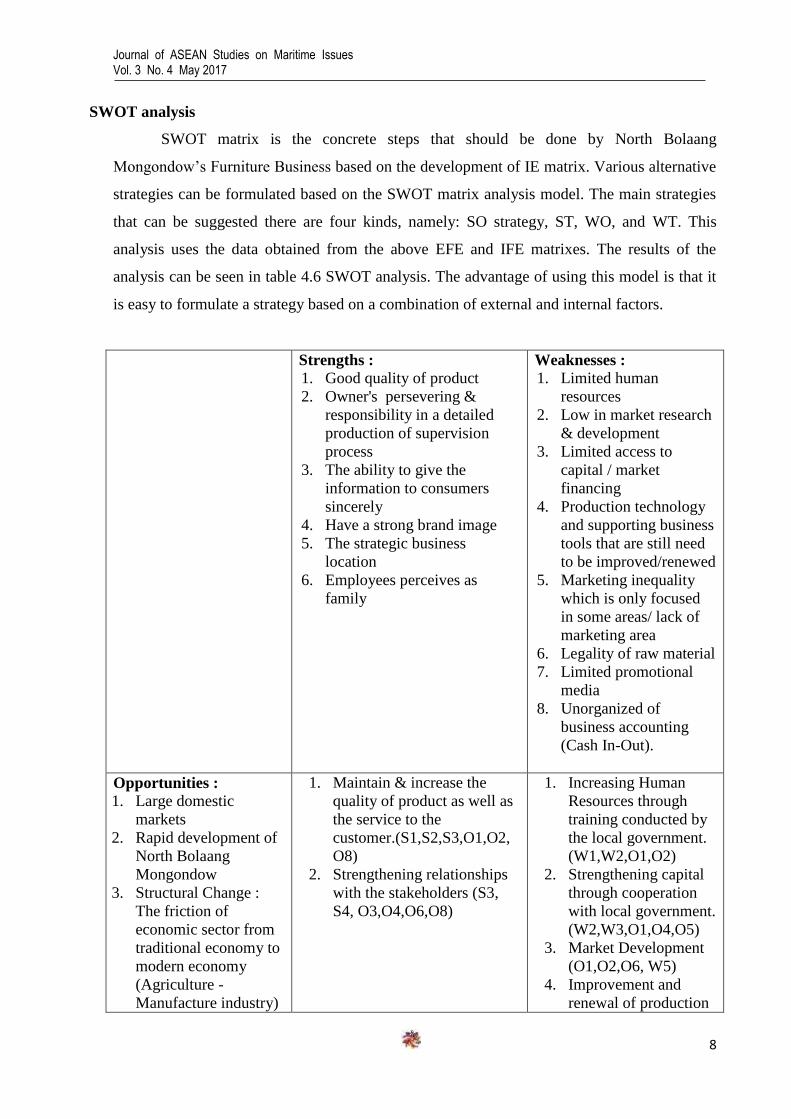
SWOT analysis
SWOT matrix is the concrete steps that should be done by North Bolaang
Mongondow‟s Furniture Business based on the development of IE matrix. Various alternative
strategies can be formulated based on the SWOT matrix analysis model. The main strategies
that can be suggested there are four kinds, namely: SO strategy, ST, WO, and WT. This
analysis uses the data obtained from the above EFE and IFE matrixes. The results of the
analysis can be seen in table 4.6 SWOT analysis. The advantage of using this model is that it
is easy to formulate a strategy based on a combination of external and internal factors.
Strengths :
1. Good quality of product
2. Owner's persevering &
responsibility in a detailed
production of supervision
process
3. The ability to give the
information to consumers
sincerely
4. Have a strong brand image
5. The strategic business
location
6. Employees perceives as
family
Weaknesses :
1. Limited human
resources
2. Low in market research
& development
3. Limited access to
capital / market
financing
4. Production technology
and supporting business
tools that are still need
to be improved/renewed
5. Marketing inequality
which is only focused
in some areas/ lack of
marketing area
6. Legality of raw material
7. Limited promotional
media
8. Unorganized of
business accounting
(Cash In-Out).
Opportunities :
1. Large domestic
markets
2. Rapid development of
North Bolaang
Mongondow
3. Structural Change :
The friction of
economic sector from
traditional economy to
modern economy
(Agriculture -
Manufacture industry)
1. Maintain & increase the
quality of product as well as
the service to the
customer.(S1,S2,S3,O1,O2,
O8)
2. Strengthening relationships
with the stakeholders (S3,
S4, O3,O4,O6,O8)
1. Increasing Human
Resources through
training conducted by
the local government.
(W1,W2,O1,O2)
2. Strengthening capital
through cooperation
with local government.
(W2,W3,O1,O4,O5)
3. Market Development
(O1,O2,O6, W5)
4. Improvement and
renewal of production
Journal of ASEAN Studies on Maritime Issues Vol. 3 No. 4 May 2017
9
4. National government
support through cross
linked strategy
(Upstream-
Downstream Strategy)
5. Depletion of oil :
government support on
non oil and natural gas
6. The Increasing of
middle class
consumers
7. The enhancement of
society‟s awareness
towards information
technology such as
social media
8. Good relationship and
high credibility with
the supplier.
technology.
(W2,W4,S1-S4)
5. Utilization of social
media as a promotion
tool to reach a wider
market.(W7,O6,O7)
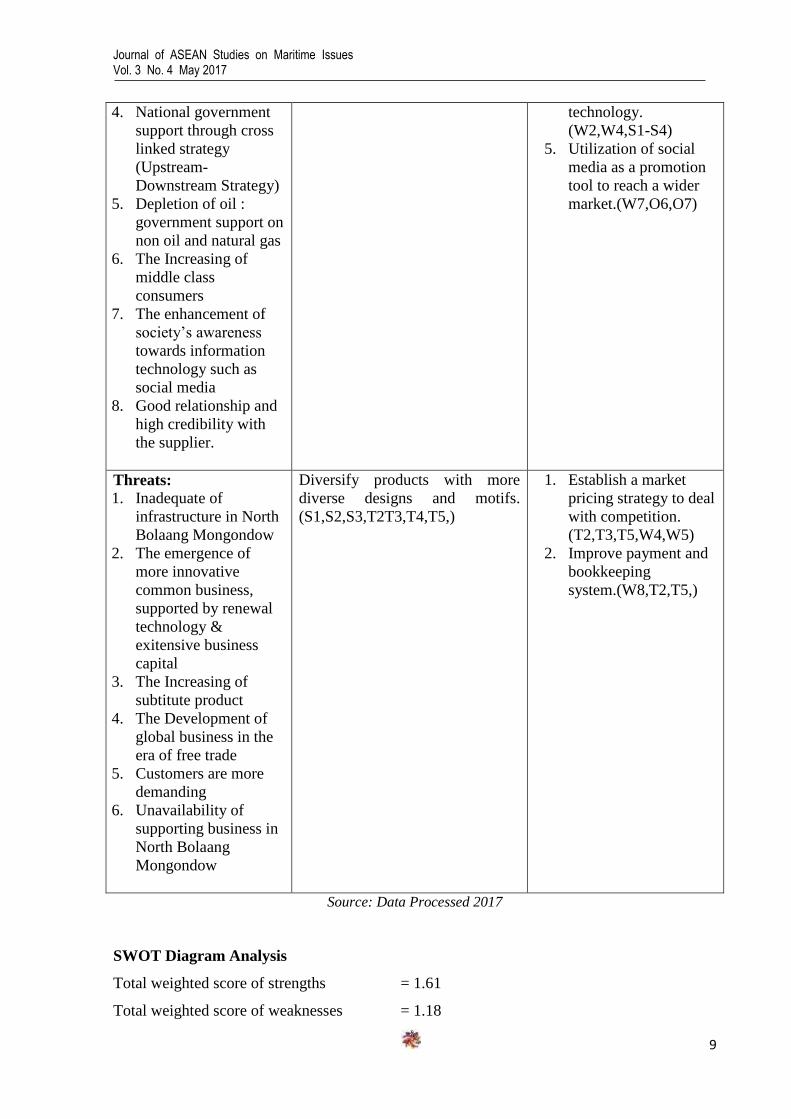
Threats:
1. Inadequate of
infrastructure in North
Bolaang Mongondow
2. The emergence of
more innovative
common business,
supported by renewal
technology &
exitensive business
capital
3. The Increasing of
subtitute product
4. The Development of
global business in the
era of free trade
5. Customers are more
demanding
6. Unavailability of
supporting business in
North Bolaang
Mongondow
Diversify products with more
diverse designs and motifs.
(S1,S2,S3,T2T3,T4,T5,)
1. Establish a market
pricing strategy to deal
with competition.
(T2,T3,T5,W4,W5)
2. Improve payment and
bookkeeping
system.(W8,T2,T5,)
Source: Data Processed 2017
SWOT Diagram Analysis
Total weighted score of strengths = 1.61
Total weighted score of weaknesses = 1.18
Journal of ASEAN Studies on Maritime Issues Vol. 3 No. 4 May 2017
10
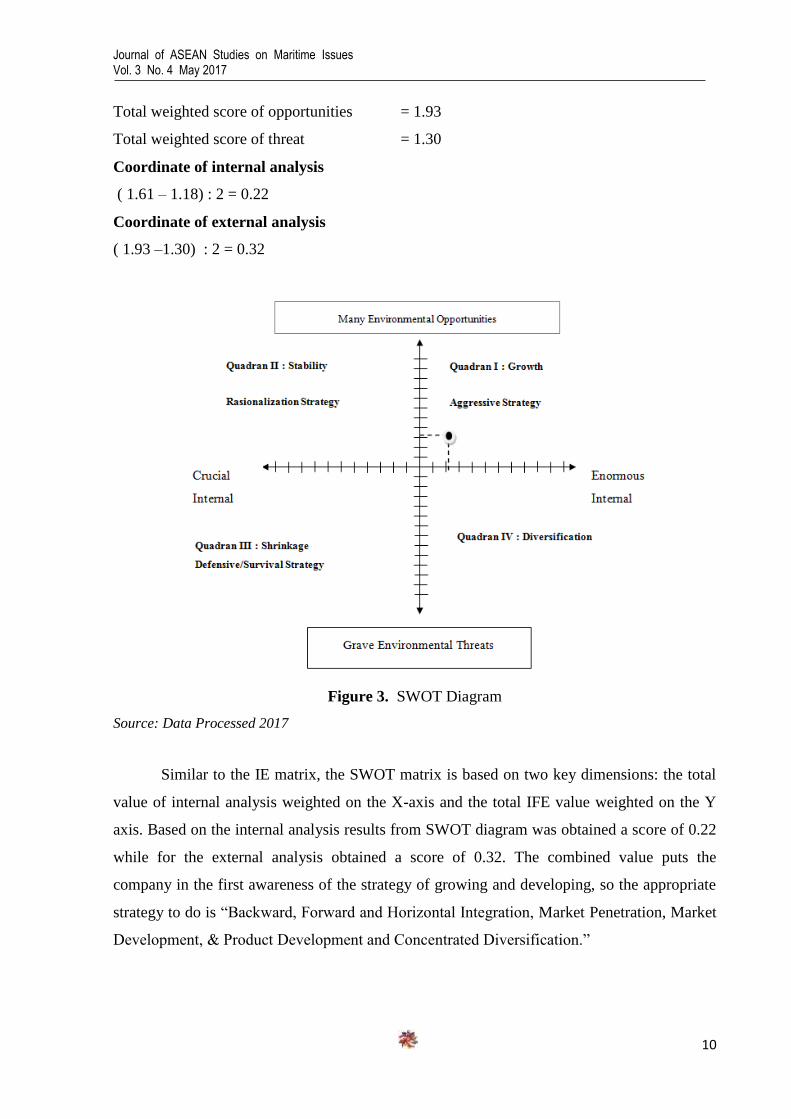
Total weighted score of opportunities = 1.93
Total weighted score of threat = 1.30
Coordinate of internal analysis
( 1.61 – 1.18) : 2 = 0.22
Coordinate of external analysis
( 1.93 –1.30) : 2 = 0.32
Figure 3. SWOT Diagram
Source: Data Processed 2017
Similar to the IE matrix, the SWOT matrix is based on two key dimensions: the total
value of internal analysis weighted on the X-axis and the total IFE value weighted on the Y
axis. Based on the internal analysis results from SWOT diagram was obtained a score of 0.22
while for the external analysis obtained a score of 0.32. The combined value puts the
company in the first awareness of the strategy of growing and developing, so the appropriate
strategy to do is “Backward, Forward and Horizontal Integration, Market Penetration, Market
Development, & Product Development and Concentrated Diversification.”

Journal of ASEAN Studies on Maritime Issues Vol. 3 No. 4 May 2017
11
Decision Stage
QSPM
Table 4. QSPM
STRATEGIC ALTERNATIVES
Market
Development
Market
penetration
Product
Development
Key Factors Weight AS TAS AS TAS AS TAS
Strengths
1. Good quality of product 0.091 4 0.364 2 0.182 3 0.273
2. Owner's persevering &
responsibility in a detailed
production of supervision process
0.088 3 0.264 1 0.088 2 0.176
3. The ability to give the
information to consumers
sincerely
0.075 4 0.3 2 0.15 3 0.225
4. Have a strong brand image 0.073 4 0.292 3 0.219 2 0.146
5. The strategic business location 0.067 3 0.201 4 0.268 2 0.134
6. Employees perceives as family 0.041 - - -
Weaknesses
7. Limited human resources 0.072 2 0.144 3 0.216 1 0.072
8. Low in the market research &
development 0.066 2 0.132 1 0.066 3 0.198
9. Limited access to capital /market
financing 0.083 2 0.166 3 0.249 1 0.083
10. Production technology and
supporting business tools that
need to be improved/renewed
0.075 - - -
11. Marketing inequality which is
only focused in some areas/ lack
of marketing area
0.077 4 0.308 2 0.154 3 0.231
12. Legality of raw material 0.064 - - -
13. Limited promotional media 0.073 - - -
14. Unorganized of business
accounting (Cash In-Out) 0.055 - - -
1
Opportunities
1. Large domestic markets. 0.088 3 0.264 1 0.088 2 0.176
2. Rapid development of North
Bolaang Mongondow 0.093 4 0.374 2 0.187 3 0.280
3. Structural change : The friction
of economic sector from
traditional economy to modern
economy (Agriculture -
Manufacture industry)
0.082 - - -

Journal of ASEAN Studies on Maritime Issues Vol. 3 No. 4 May 2017
12
4. National government support
through cross linked strategy
(Upstream-Downstream Strategy)
0.061 - - -
5. Depletion of oil : government
support on non oil and natural
gas
0.056 - - -
6. The Increasing of middle class
consumers 0.086 3 0.258 2 0.172 4 0.344
7. The enhancement of society‟s
awareness towards information
technology such as social media
0.062 4 0.249 3 0.187 1 0.062
8. Good relationship and high
credibility with the supplier. 0.062 - - -
Thretas
9. Inadequate of infrastructure in
North Bolaang Mongondow 0.073 - - -
10. The emergence of more
innovative common business,
supported by renewal technology
& extensive business capital.
0.080 2 0.160 3 0.240 4 0.320
11. The Increasing of substitute
product 0.087 1 0.087 3 0.262 4 0.349
12. The Development of global
business in the era of free trade 0.041 - - -
13. Customer are more demanding 0.067 2 0.134 3 0.201 4 0.268
14. Unavailability of supporting
business in North Bolaang
Mongondow
0.060 - - -
Total 1 3.697 2.929 3.338
Source : Data Processed 2017
Based on the QSPM matrix above, by the amount of total score is 3.697 market
development is the best alternatives strategy,that need to be adopted by North Bolaang
Mongondow‟s Furniture Industry. This strategy would be suggested for introducing the
present products into new geographic areas. This alternatives strategy are followed by the
condition of unsaturated market which is North Bolaang Mongondow‟s Furniture Industry is
consistent in the product quality by the strong brand image that has been preserved by North
Bolaang Mongondow‟s Furniture Industry for its sustainability of business. The second
position of alternatives strategy is product development by the total score of 3.338 , where in
adopting this business North Bolaang Mongondow‟s Furniture Industry should enhance the
sales of furniture product by improving or modifying present products so customer can easily
attracted by the new design, color, or any enhancement in product attribute with innovation
for the furniture that different from the usual product. The last alternatives strategy is market
penetration with the total score of 2.929 this strategy has the lowest score among others

Journal of ASEAN Studies on Maritime Issues Vol. 3 No. 4 May 2017
13
because North Bolaang Mongondow‟s Furniture Industry already have strong brand image in
its local area of marketing which indirectly states that it is not hard for the business involved
in pursuing customer awareness and loyalty in its area of marketing (Boroko, Bolangitang,
Iyok,Tuntung and Ollot).
Fuzzy TOPSIS Model
Application of a fuzzy multi-criteria decision making method is proposed in this
research with the goal of improving the output of conventional QSPM by allowing the experts
to employ linguistic terms (qualitative data) in its judgments. Namely, a multi-criteria
decision making index via the technique for Order Preference by Similarity to Ideal Solution
(TOPSIS) is finding the sum total attractive scores of strategies. As a case study, the proposed
method has been applied for strategy prioritization in North Bolaang Mongondow‟s Furniture
Industry. The results have been verified with expert knowledge and showed an improvement
compared to the non-fuzzy QSPM (conventional QSPM).
Figure 0 Linguistic variables of fuzzy TOPSIS
According to the linguistic fuzzy above then the membership function for each
variable is as follows:
={
…………………….. (1)
= {
…………………….. (2)
Journal of ASEAN Studies on Maritime Issues Vol. 3 No. 4 May 2017
14
={
………………………. (3)
={
…………………….(4)
={
………………………..(5)
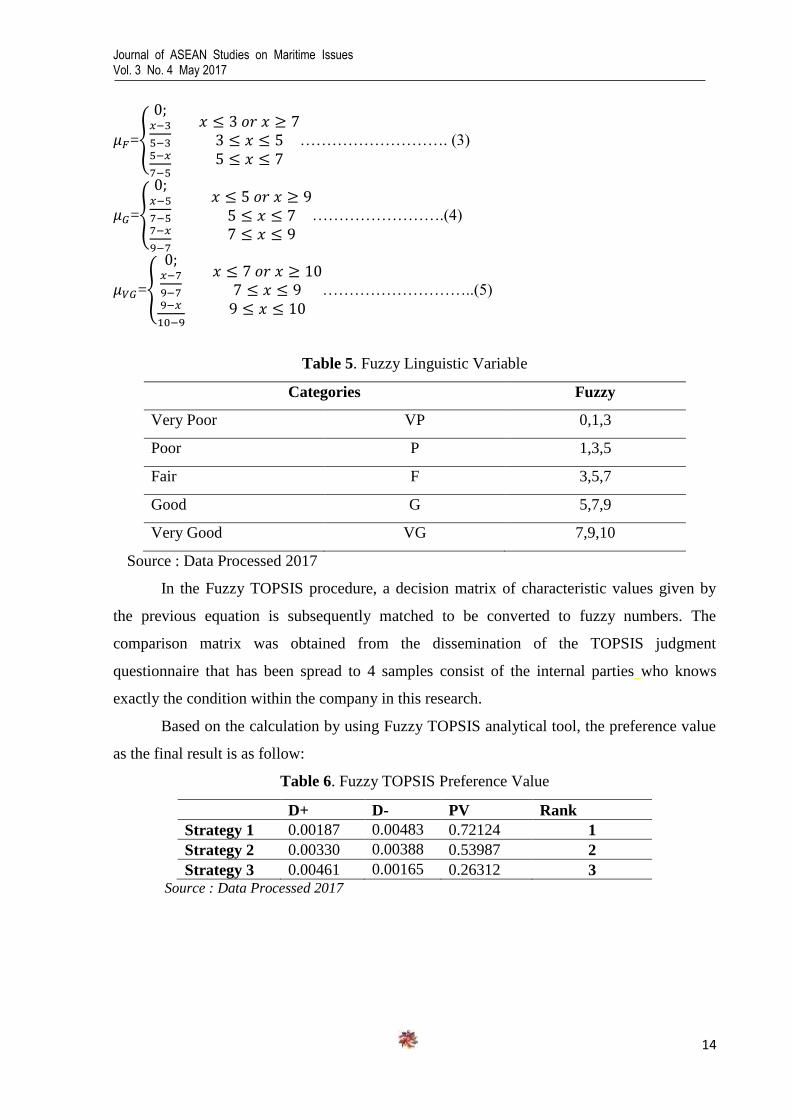
Table 5. Fuzzy Linguistic Variable
Categories Fuzzy
Very Poor VP 0,1,3
Poor P 1,3,5
Fair F 3,5,7
Good G 5,7,9
Very Good VG 7,9,10
Source : Data Processed 2017
In the Fuzzy TOPSIS procedure, a decision matrix of characteristic values given by
the previous equation is subsequently matched to be converted to fuzzy numbers. The
comparison matrix was obtained from the dissemination of the TOPSIS judgment
questionnaire that has been spread to 4 samples consist of the internal parties who knows
exactly the condition within the company in this research.
Based on the calculation by using Fuzzy TOPSIS analytical tool, the preference value
as the final result is as follow:
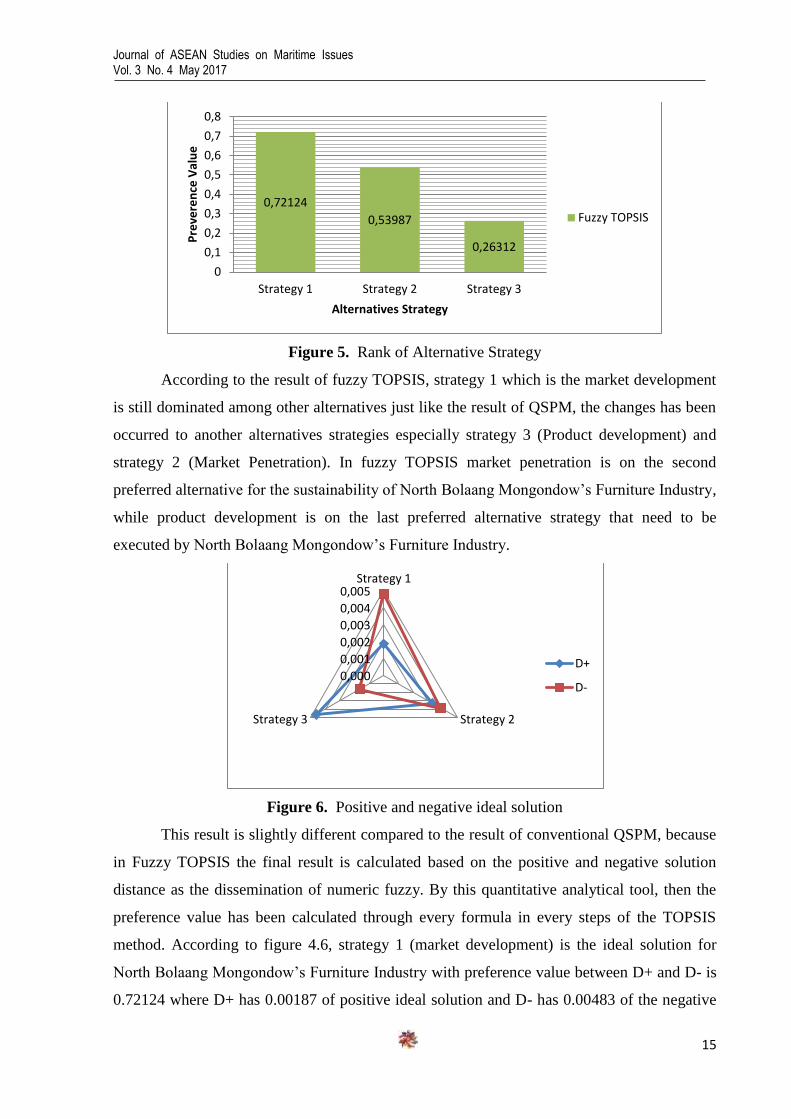
Table 6. Fuzzy TOPSIS Preference Value
D+ D- PV Rank
Strategy 1 0.00187 0.00483 0.72124 1
Strategy 2 0.00330 0.00388 0.53987 2
Strategy 3 0.00461 0.00165 0.26312 3 Source : Data Processed 2017
Journal of ASEAN Studies on Maritime Issues Vol. 3 No. 4 May 2017
15
Figure 5. Rank of Alternative Strategy
According to the result of fuzzy TOPSIS, strategy 1 which is the market development
is still dominated among other alternatives just like the result of QSPM, the changes has been
occurred to another alternatives strategies especially strategy 3 (Product development) and
strategy 2 (Market Penetration). In fuzzy TOPSIS market penetration is on the second
preferred alternative for the sustainability of North Bolaang Mongondow‟s Furniture Industry,
while product development is on the last preferred alternative strategy that need to be
executed by North Bolaang Mongondow‟s Furniture Industry.
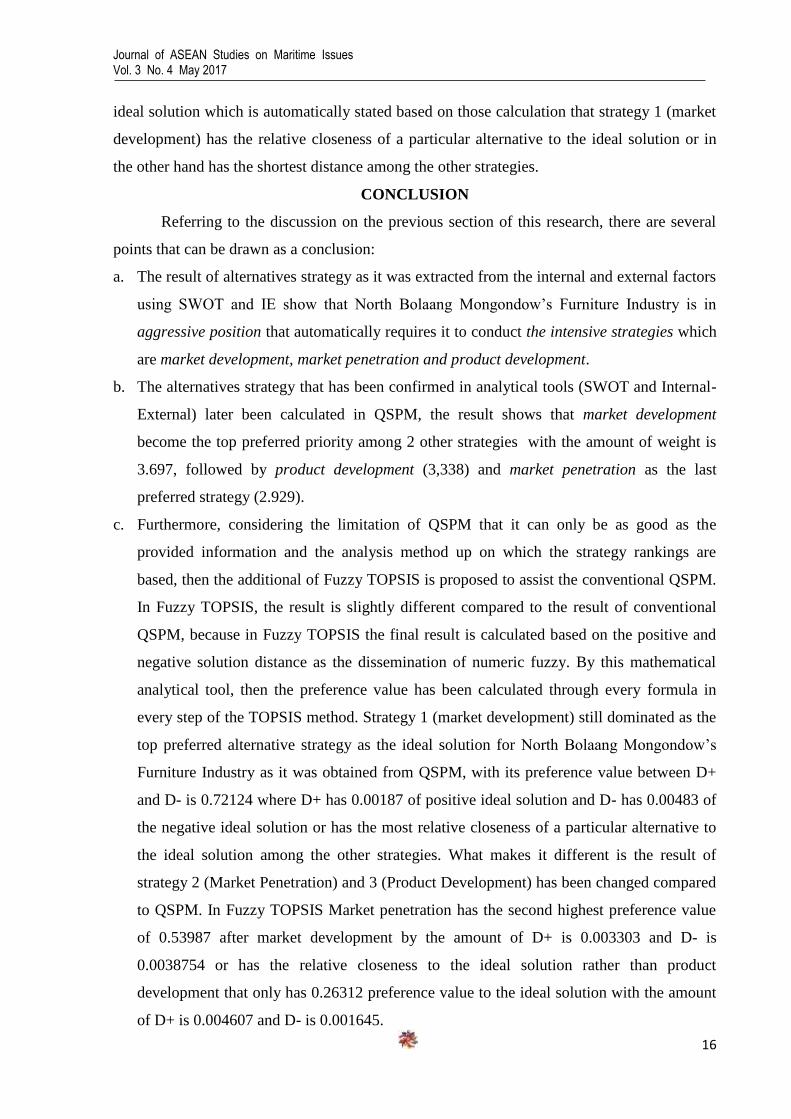
Figure 6. Positive and negative ideal solution
This result is slightly different compared to the result of conventional QSPM, because
in Fuzzy TOPSIS the final result is calculated based on the positive and negative solution
distance as the dissemination of numeric fuzzy. By this quantitative analytical tool, then the
preference value has been calculated through every formula in every steps of the TOPSIS
method. According to figure 4.6, strategy 1 (market development) is the ideal solution for
North Bolaang Mongondow‟s Furniture Industry with preference value between D+ and D- is
0.72124 where D+ has 0.00187 of positive ideal solution and D- has 0.00483 of the negative
0,72124
0,53987
0,26312
0
0,1
0,2
0,3
0,4
0,5
0,6
0,7
0,8
Strategy 1 Strategy 2 Strategy 3
Pre
vere
nce
Val
ue
Alternatives Strategy
Fuzzy TOPSIS
0,000
0,001
0,002
0,003
0,004
0,005Strategy 1
Strategy 2Strategy 3
D+
D-
Journal of ASEAN Studies on Maritime Issues Vol. 3 No. 4 May 2017
16
ideal solution which is automatically stated based on those calculation that strategy 1 (market
development) has the relative closeness of a particular alternative to the ideal solution or in
the other hand has the shortest distance among the other strategies.
CONCLUSION
Referring to the discussion on the previous section of this research, there are several
points that can be drawn as a conclusion:
a. The result of alternatives strategy as it was extracted from the internal and external factors
using SWOT and IE show that North Bolaang Mongondow‟s Furniture Industry is in
aggressive position that automatically requires it to conduct the intensive strategies which
are market development, market penetration and product development.
b. The alternatives strategy that has been confirmed in analytical tools (SWOT and Internal-
External) later been calculated in QSPM, the result shows that market development
become the top preferred priority among 2 other strategies with the amount of weight is
3.697, followed by product development (3,338) and market penetration as the last
preferred strategy (2.929).
c. Furthermore, considering the limitation of QSPM that it can only be as good as the
provided information and the analysis method up on which the strategy rankings are
based, then the additional of Fuzzy TOPSIS is proposed to assist the conventional QSPM.
In Fuzzy TOPSIS, the result is slightly different compared to the result of conventional
QSPM, because in Fuzzy TOPSIS the final result is calculated based on the positive and
negative solution distance as the dissemination of numeric fuzzy. By this mathematical
analytical tool, then the preference value has been calculated through every formula in
every step of the TOPSIS method. Strategy 1 (market development) still dominated as the
top preferred alternative strategy as the ideal solution for North Bolaang Mongondow‟s
Furniture Industry as it was obtained from QSPM, with its preference value between D+
and D- is 0.72124 where D+ has 0.00187 of positive ideal solution and D- has 0.00483 of
the negative ideal solution or has the most relative closeness of a particular alternative to
the ideal solution among the other strategies. What makes it different is the result of
strategy 2 (Market Penetration) and 3 (Product Development) has been changed compared
to QSPM. In Fuzzy TOPSIS Market penetration has the second highest preference value
of 0.53987 after market development by the amount of D+ is 0.003303 and D- is
0.0038754 or has the relative closeness to the ideal solution rather than product
development that only has 0.26312 preference value to the ideal solution with the amount
of D+ is 0.004607 and D- is 0.001645.
Journal of ASEAN Studies on Maritime Issues Vol. 3 No. 4 May 2017
17
REFERENCES
Amilia. 2016. Agrocraft as a Creative Economy Development: Woven Bamboo. KnE Life
Science , 3, 161-166.
Astuti. 2016. Development Strategy for Improving Local Economy Potential:A Case Study of
Binong Jati Knitting Industrial Center. Internatinal Journal of Basic and Apliied Science , 4
(3), 59-68.
Bappeda, K.B. 2016. Kajian Pengembangan Ekonomi Lokal (PEL) Kab. Bolaang Mongondow
Utara.
Bohatala. 2015. Bank Alfalah Strategic Management Project. Retrieved April 4, 2017, from
Bohatala: https://bohatala.com
Dumbu, C. 2012. Managerial deficiencies in the Small and Medium Enterprises (SMEs) in the
craft industry: An empirical evidence of SMEs at Great Zimbabwe in Chief Mugabe‟s area.
European Journal of Business and Management , 4 (10).
F. Ghaemi Nasab, M. R.-M. 2010. Extension of TOPSIS for Group Decision-Making. Int. J.
Industrial Mathematics , Vol. 2, No. 3, 199-213.
David, F.R. 2006, 2007, 2010. Strategic Management (Concept and Cases). New Jersey: Pearson.
Gertz, K.A. 2010. The emerging middle class in developing countries. OECD Development
Centre Institution, DC : Brookings , p. 285.
Gupta. 2015. Strategy Formulation for Performance Improvement of Indian Corrugated Industry
:An Application of SWOTAnalysis and QSPM Matrix. Journal of Applied Packaging
Research , 7 (3), 60-74.
Haichou, I. 2015. Research Gate. Retrieved April 4, 2017, from Research Gate Corporation:
https://www.researchgate.net/publication/293755672
Hasan Hosseini Nasaba, A. S. 2012. An improvement of quantitative strategic planning matrix
using multiple criteria decision making and fuzzy numbers. Applied Soft Computing, 2246–
2253.
Indonesia, B. 2010, 2011. Kata Sambutan Deputi Gubernur Bank Indonesia. Kajian Akademik
Pemeringkat Kredit Bagi Usaha Mikro, Kecil dan Menengah di Indonesia, pp. 1-147.
Jahangir, H. and Khan, A.K. 2012. Perception of SME Growth Constraints in Bangladesh: An
Empirical Examination from Institutional Perspective. European Journal of Business and
Management, 4 (7).
Janet, A. O. 2015. Small and Medium Scale Enterprises and National Development. European
Journal of Business and Management, 7 (13).
John, A. Pearce II, R.B. 2008. Strategic Management- Formulation, Implementation,Control.
New Delhi: McGraw Hill Companies .
John Pearce, R.R. 2002. Strategic Management. Boston: McGraw-Hil.
Nasution, M. 2005. Total Quality Management. Jakarta: PT.Gramedia Pustaka Utama.
Ogot, M. 2012. A Generic Competitiveness Business Strategy Typology for Micro Enterprise.
European Journal of Business and Management , 4 (2).
Mugenda, O.A. (999. Research Methods: Quantitative and Qualitative Approaches. Nairobi: Acts
Press.
Muhajir. 1996. Metode Penelitian Kualitatif. Yogyakarta: Rake Sarasia.
Murhadi. 2013. Business Research Methods. Retrieved from
www.wernermurhadi.wordpress.com: http://www.wernermurhadi.wordpress.com
Nasab, F. 2010. Extension of TOPSIS for Group Decision-Making Based on the Type-2 Fuzzy
Positive and Negative Ideal Solutions. Int. J. Industrial Mathematics , 99-213.
Nawas, G. 2015. Evaluating the Adoption of Enterprise Applications by Small and Medium
Enterprises in Sri Lanka. European Journal of Business and Management , 7 (4).
Journal of ASEAN Studies on Maritime Issues Vol. 3 No. 4 May 2017
18
Nuguna, O.O. 2015. The Contribution of Differentiation Strategy Adopted by SMEs to Their
Competitve Advantage: A Case Study of Small and Medium Sized Enterprises in
Nyahururu, Kenya. European Journal of Business and Management, 7 (29).
Nurhayati. 2011. Pengaruh Karakteristik UKM. Bogor: Institut Pertanian Bogor.
Pearce, J.A. 2008. Strategic Management Formulation, Implementation,Control. Boston:
Mc.Graw Hill.
Porter, L.W. 1991. Motivation and work behavior. Singapore: Mc Graw.
Porter, M.E. 1985. Competitive Advantage. New York: The Free Press.
Purnomo. 1999. Manajemen Strategi. Jakarta: Lembaga Penerbit Fakultas Ekonomi Universitas
Jakarta.
Purwanto, I. 2008. Manajemen Strategi (Jilid 2 ed.). Bandung: CV.Yrama Widya.
Resmi1, N.N. 2011. Strategi Meningkatkan Kualitas Produk Untuk Menang Dalam Kompetisi.
WIDYATECH Jurnal Sains dan Teknologi , Vol. 10 No. 3, 133-144.
Ross. 1999. Ways of approaching research. Retrieved April 4, 2017, from fortunecity.com:
http://fortunecity.com/greenfield/grizzly/432/rra3.htm
Sałabun, W. 2014. Normalization of attribute values in TOPSIS method. Research Gate , 1-8.
Sarma. 2015. Strategies of Beef Cattle Development Enterprise in Selected Areas of Bangladesh.
Advances in Economics and Business, 3(4), 124-132.
Sarwono. 2011. Penelitian Kualitatif dan Kuantitatif. Brilian International.
Sarwono, J. 2011. Metode Penelitian Kuantitatif dan Kualitatif. Yogyakarta: Graham Ilmu.
Setyosari, P. 2013. Metode Penelitian Pendidikan dan Pengembangan. Jakarta: Kencana
Prenadamedia Group.
Shah. 2010. Research Methodology. Journal of International University Research, 19-29.
Shojaei. 2010. Strategic planning for a food Industry Equipment manufacturing factory,Using
SWOT Analysis, QSPM, and MAUT models. Asian Journal Of Management Research ,
759-771.
Shojaie. 2014. Strategy Planning Using SWOT Analysis and QSPM Model A Case Study of
Baridsoft Company. International Journal of Scientific Management and Development , 2
(7), 252-257.
Statisitk, B. P. 2015. Produk Domestik Regional Bruto : Menurut Pengeluaran . 2010-2015.
Statisitk, B. P. 2015. Statistik Kesejahteraan Rakyat Kab.Bolaang Mongondow Utara tahun
2015.
Statistik, B.P. 2016. Kabupaten Bolaang Mongondow Utara dalam angka 2016. Katalog BPS:
1102001.7107.
Sugiyono. 2014. Memahami Penelitian Kualitatif. Bandung: Alfabeta.
Sujarweni. 2014. Metode Penelitian: Lengkap, Praktis dan Mudah Dipahami. Yogyakarta:
Pustaka Baru Press.
Sukirno, S. 2006. Teori Micro Ekonomi. Jakarta: Rajawali Press.
Sulistyastuti, D.R. 2004. Dinamika Usaha Kecil dan Menengah Analisis Konsentrasi Regional
UKM di Indonesia. Jurnal Ekonomi Pembangunan , 2(9).
Syauta. 2013. Determining Strategies Based on Strategic Position Analysis in Small and Medium
Enterprises. International Journal of Information and Education Technology , 3 (4), 442-
447.
Umar, H. 2008. Metode Riset Bisnis. Jakarta: PT Gramedia Pustaka Utama.

Journal of ASEAN Studies on Maritime Issues Vol. 3 No. 4 May 2017
19
PROGRAM OF PT TIRTA INVESTAMA (DANONE AQUA)
AIRMADIDI ADDRESSING MEA BY EVALUATING THE WELFARE
BY USING THE IMPORTANCE AND PERFORMANCE ANALYSIS
Stevie A. Lasut
Faculty of Economics, Manado State Univeristy, Tondano, North Sulawesi
email: [email protected]
ABSTRACT
Aqua is a brand of packaged water in Indonesia that is produced by PT Aqua Golden Mississippi Tbk
since 1973. It is a very well-known brand of packaged water and has become the generic brand of
packaged water in Indonesia. The objective of this research is to analyze the importance and
performance of Employee Welfare Program in PT Tirta Investama (Danone AQUA) Airmadidi. Based
on the data analysis this research found that Employee welfare programs that have high importance
and low performance or labeled as “concentrate here” are National Security for the workforce
(JAMSOSTEK)/BPJS membership and Economic Enterprise, “keep up the good work” are Outside
Workplace Accident Insurance, Life Insurance, Place of Worship and Recreation and employee
welfare program that have low importance and low performance or labeled as “low priority” is Sport
& Art. Another findings is there is no employee welfare program that have high performance but low
importance or labeled as “possible overkill”.
Keywords: Employee Welfare, Importance Performance Analysis
INTRODUCTION
Water is an essential part of life on earth, be it for plants, animals, and humans. The
human body itself consists of 70% water, and although a human being can survive a month or
more without food, a week without water can be fatal. Thus, it can be concluded that the
human body requires water to function and stay healthy. However, it is rather difficult for
people to find clean water these days. Since everyone wants to be healthy, they tend to look
for a guaranteed healthier lifestyle such as consuming packaged water. The rapid population
growth and the scarcity of clean water increase the potential of packaged water business in
Indonesia.
To address the ASEAN Economic Community, Indonesia has taken various
anticipatory steps. One of them is by preparing professional staffs and also improving the
competence of employees who have worked through one institution called Indonesian Water
Profession Certification Institution (LSP-AMI). Indonesia however must compete with
ASEAN countries in the face of the AEC. Aqua without exception must improve the ability of
him that is managed more professionally to compete. In this regard, it is imperative that strong
support from the government in its development and tariff increases without involving
political interests.
Journal of ASEAN Studies on Maritime Issues Vol. 3 No. 4 May 2017
20
Aqua‟s awards and achievements are the empiric evidence of the magnificent
company performance. To come to this point, a company should be able to manage all the
factors of production, which includes natural resources, human resources, capital, raw
materials, manufacturer equipment, and technology. These factors are very important because
they support the company performance. Furthermore, a company should pay more attention to
the human resources factor, because this factor holds the biggest role in company
performance, in this case, the employees.
Company performance is highly determined by the employee performance which is
affected by employee welfare program that is provided by the company. In order to maintain
the company‟s good performance, the company should always evaluate the welfare programs
that is specifically provided for the employees. Furthermore, PT Tirta Investama (Danone
AQUA) Airmadidi must keep on watching and evaluating their programs to make sure its
effectivity in making the employee perform well according to the company‟s expectations.
For that reason, the author interested in doing a research with titled “Evaluating the Welfare
Program of PT Tirta Investama (Danone AQUA) Airmadidi by Using the Importance and
Performance Analysis”
Research Objective
The objective of this research is analyze the importance and performance of Employee
Welfare Program in PT Tirta Investama (Danone AQUA) Airmadidi.
THEORETICAL FRAMEWORK
Human Resource Management
Human resource management (HRM) is defined as a strategic and coherent approach
to the management of an organization‟s most valued assets: the people working there who
individually and collectively contribute to the achievement of its objectives (Armstrong,
2006). Meanwhile, Storey (1989) believes that HRM can be regarded as a „set of interrelated
policies with an ideological and philosophical underpinning‟. He suggests four aspects that
constitute the meaningful version of HRM: particular constellation of beliefs and assumptions,
strategic thrust informing decisions about people management, the central involvement of line
managers, and reliance upon a set of „levers‟ to shape the employment relationship.
Employee Welfare Program
Journal of ASEAN Studies on Maritime Issues Vol. 3 No. 4 May 2017
21
Employee welfare program is a program that provide by the company to support its
employees apart from the salary and wages. It is a program that provide to make the employee
feel comfort working with company. Welfare is comfortable living and working conditions´.
Employee welfare means the efforts of company to make life worth living for workman
(Punekar, 1999).
Employee Performance
Armstrong (2006) defined employees as the organization‟s key resource and the
success or failure of organization center on the ability of the employees to attract, retain and
reward appropriately talented and competent employees. According to Bambang (2005)
performance is comparison about the result achieved by employees with a working standards.
Hameed and Waheed (2011) states that employee performance will ultimately affect the
organizational effectiveness. It can be concluded that employee performance is the output
result of how the employee behave in an organization.
RESEARCH METHODOLOGY
This research conducted at PT Tirta Investama (Danone AQUA) Airmadidi during
May 2017. Primary data is the data obtained directly from the original source, specifically the
primary data collected by researchers to answer the research questions. The primary data of
this study is acquired from the results of questionnaires. The questionnaires are distributed to
respondents so they can respond directly to the questionnaires. There are two sections in the
questionnaires that should be filled in by respondents. The first section asked about
respondents identities and the second section asked about things that related with the
variables. Secondary data is collected for some purpose other than the problem at hand. The
data is taken from company data, books, journals, articles, and relevant literatures from library
and internet. These secondary data is used in the background, literature review research
method, and discussions.
Population and Sample
Population is defined as all members of a defined group that possess some common
characteristic defined by the sampling criteria established by the researcher. The population in
this research is all employees who work for PT Tirta Investama (Danone AQUA) Airmadidi
which is a total of 466 employees.
This research will adopt a simple random sampling method. Simple random
sampling is a basic sampling technique where researchers select a group of subjects (a
sample) to understand the larger group (a population). Each individual is chosen entirely by
Journal of ASEAN Studies on Maritime Issues Vol. 3 No. 4 May 2017
22
chance and each member of the population has an equal chance of being included in the
sample. Every possible sample of a given size has the same chance of selection (Easton and
McColl, 1997).
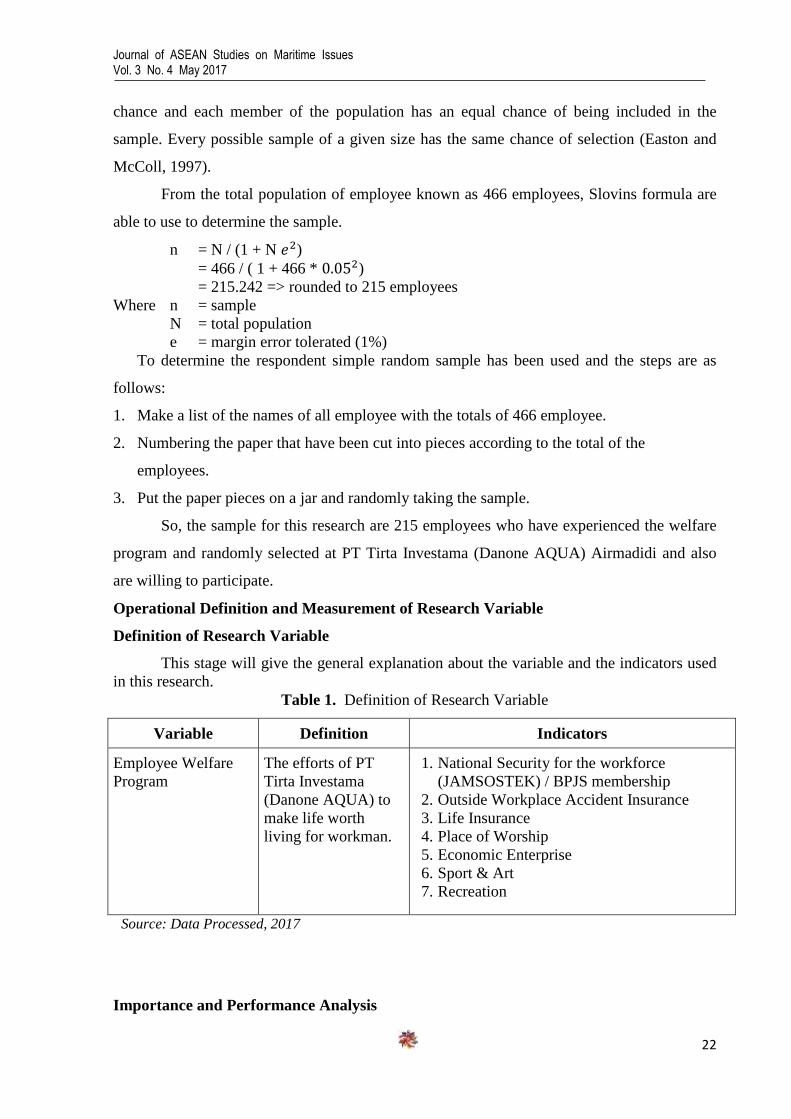
From the total population of employee known as 466 employees, Slovins formula are
able to use to determine the sample.
n = N / (1 + N )
= 466 / ( 1 + 466 * )
= 215.242 => rounded to 215 employees
Where n = sample
N = total population
e = margin error tolerated (1%)
To determine the respondent simple random sample has been used and the steps are as
follows:
1. Make a list of the names of all employee with the totals of 466 employee.
2. Numbering the paper that have been cut into pieces according to the total of the
employees.
3. Put the paper pieces on a jar and randomly taking the sample.
So, the sample for this research are 215 employees who have experienced the welfare
program and randomly selected at PT Tirta Investama (Danone AQUA) Airmadidi and also
are willing to participate.
Operational Definition and Measurement of Research Variable
Definition of Research Variable
This stage will give the general explanation about the variable and the indicators used
in this research.
Table 1. Definition of Research Variable
Variable Definition Indicators
Employee Welfare
Program The efforts of PT
Tirta Investama
(Danone AQUA) to
make life worth
living for workman.
1. National Security for the workforce
(JAMSOSTEK) / BPJS membership
2. Outside Workplace Accident Insurance
3. Life Insurance
4. Place of Worship
5. Economic Enterprise
6. Sport & Art
7. Recreation
Source: Data Processed, 2017
Importance and Performance Analysis
Journal of ASEAN Studies on Maritime Issues Vol. 3 No. 4 May 2017
23
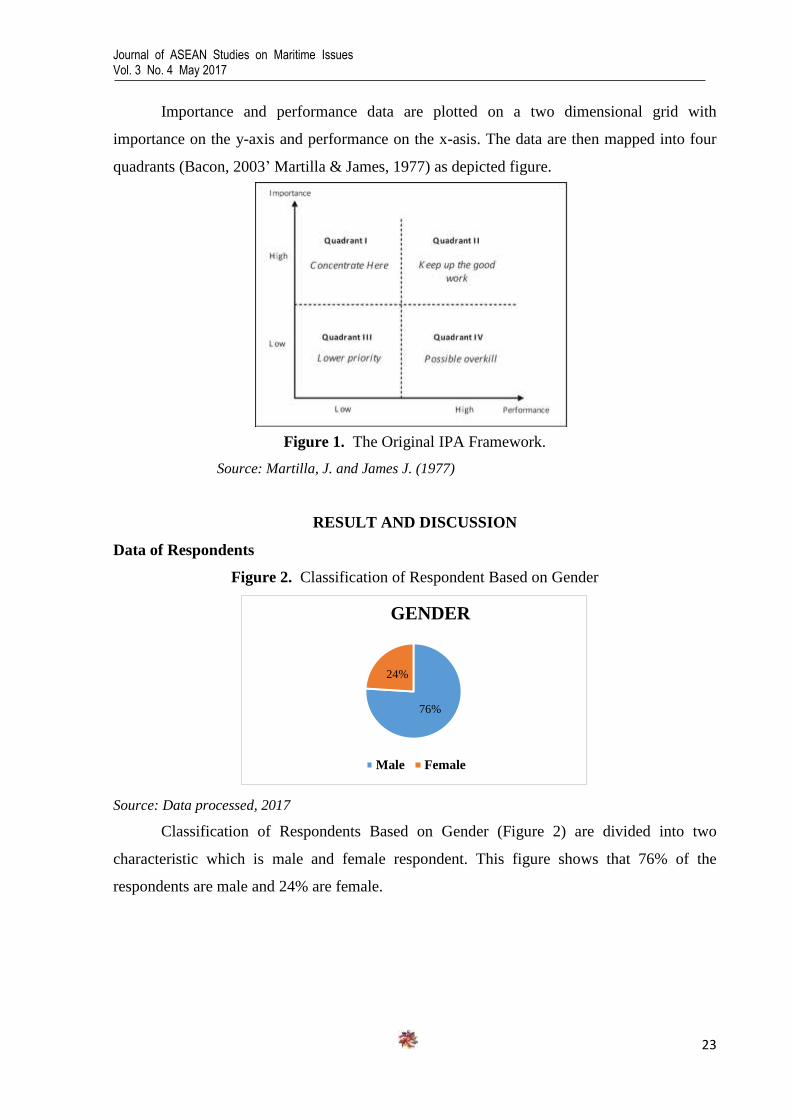
Importance and performance data are plotted on a two dimensional grid with
importance on the y-axis and performance on the x-asis. The data are then mapped into four
quadrants (Bacon, 2003‟ Martilla & James, 1977) as depicted figure.
Figure 1. The Original IPA Framework.
Source: Martilla, J. and James J. (1977)
RESULT AND DISCUSSION
Data of Respondents
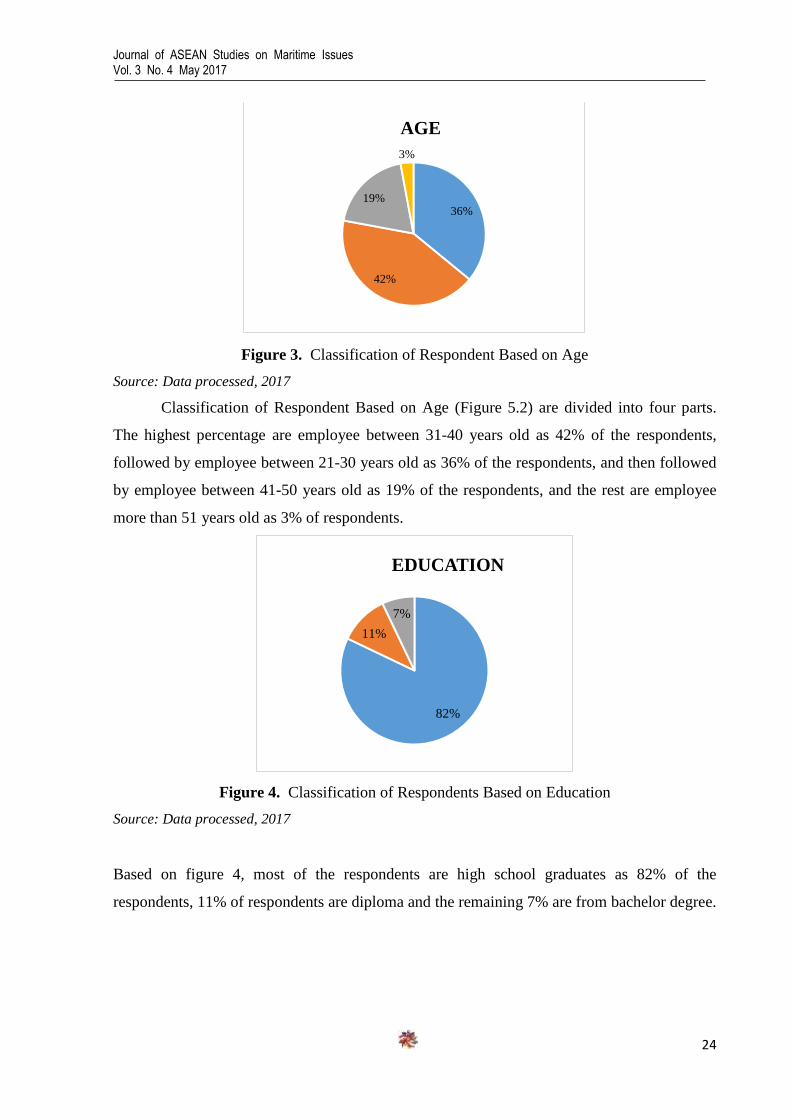
Figure 2. Classification of Respondent Based on Gender
Source: Data processed, 2017
Classification of Respondents Based on Gender (Figure 2) are divided into two
characteristic which is male and female respondent. This figure shows that 76% of the
respondents are male and 24% are female.
76%
24%
GENDER
Male Female
Journal of ASEAN Studies on Maritime Issues Vol. 3 No. 4 May 2017
24
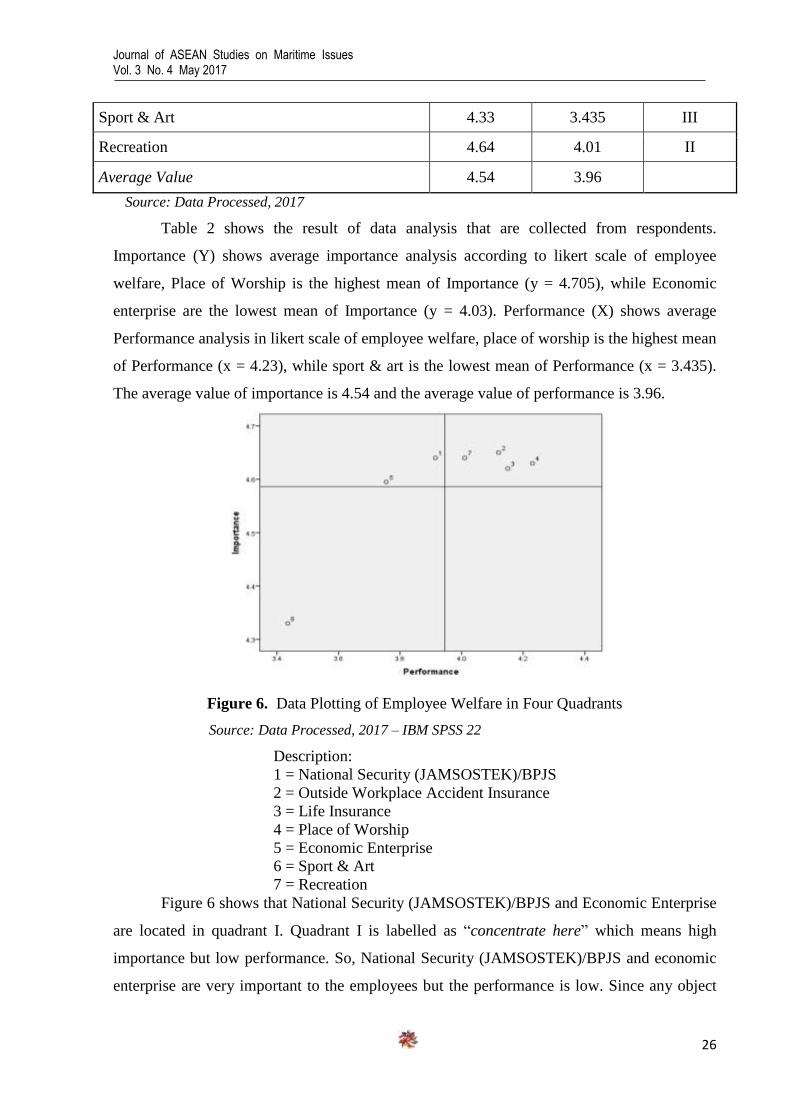
Figure 3. Classification of Respondent Based on Age
Source: Data processed, 2017
Classification of Respondent Based on Age (Figure 5.2) are divided into four parts.
The highest percentage are employee between 31-40 years old as 42% of the respondents,
followed by employee between 21-30 years old as 36% of the respondents, and then followed
by employee between 41-50 years old as 19% of the respondents, and the rest are employee
more than 51 years old as 3% of respondents.
Figure 4. Classification of Respondents Based on Education
Source: Data processed, 2017
Based on figure 4, most of the respondents are high school graduates as 82% of the
respondents, 11% of respondents are diploma and the remaining 7% are from bachelor degree.
36%
42%
19%
3%
AGE
82%
11%
7%
EDUCATION

Journal of ASEAN Studies on Maritime Issues Vol. 3 No. 4 May 2017
25
Figure 5. Classification of Respondent Based on Working Period
Source: Data processed, 2017
Based on figure 5, the majority of respondents are those who have been working for
less than 10 years and is followed by those who have been working for about 11 to 20 years.
From the chart it is obvious that 46% of the respondents have been working for about 11 to 20
years and 45% for the respondents have been working for around 10 years. The remaining 9%
of the respondents have been working more than 21 years.
Validity Test and Reliability Test
Based on the data analysis, the instruments of this research are valid and reliable
Importance and Performance Analysis of Employee Welfare
Problem of this research will be answered in this chapter‟s result analysis. These are
seven indicators of employee welfare on measuring the level of importance and performance,
which are: (1) National Security for the workforce (JAMSOSTEK)/BPJS membership; (2)
Outside workplace accident insurance; (3) Life insurance; (4) Place of worship; (5) Economic
enterprise; (6) Sport & Art; (7) Recreation.
Table 2. Importance and Performance Analysis
Employee Welfare Indicators Importance
(Y) Performance
(X) Quadrant
National Security for the workforce
(JAMSOSTEK)/BPJS membership 4.56 4.05 I
Outside Workplace Accident Insurance 4.65 4.12 II
Life Insurance 4.62 4.15 II
Place of Worship 4.705 4.23 II
Economic Enterprise 4.03 3.78 I
45%
46%
9%
WORKING PERIOD
Journal of ASEAN Studies on Maritime Issues Vol. 3 No. 4 May 2017
26
Sport & Art 4.33 3.435 III
Recreation 4.64 4.01 II
Average Value 4.54 3.96
Source: Data Processed, 2017
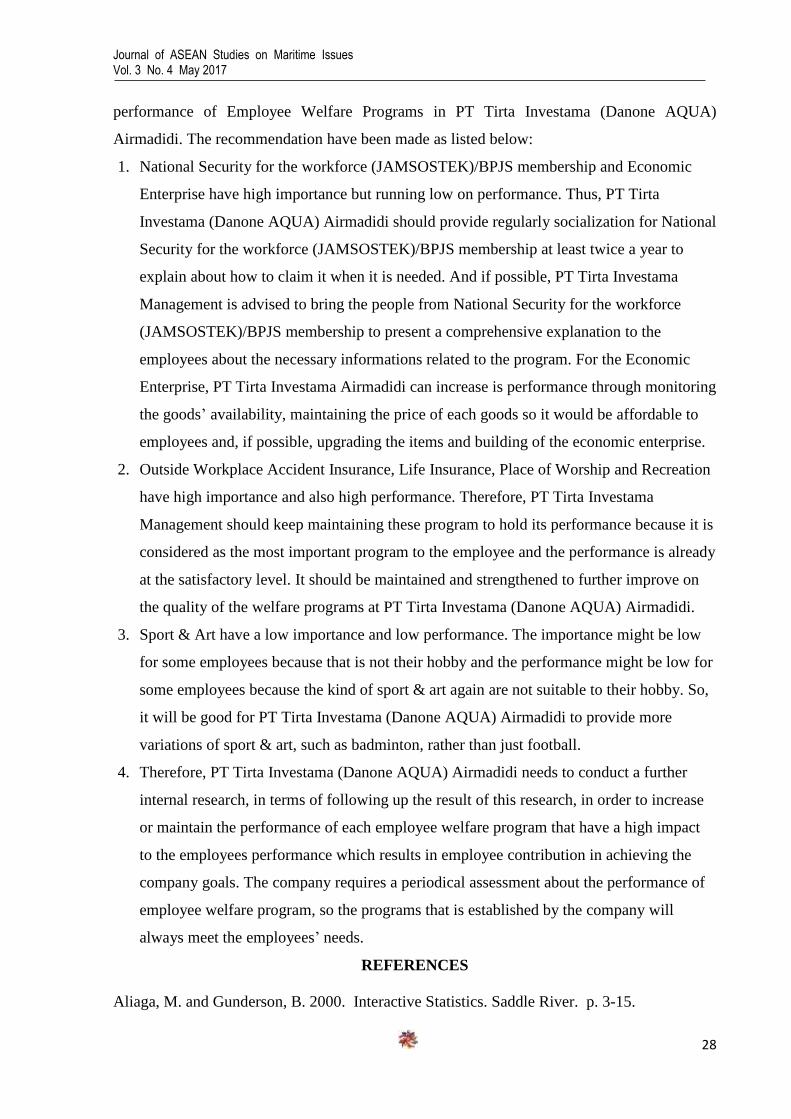
Table 2 shows the result of data analysis that are collected from respondents.
Importance (Y) shows average importance analysis according to likert scale of employee
welfare, Place of Worship is the highest mean of Importance (y = 4.705), while Economic
enterprise are the lowest mean of Importance (y = 4.03). Performance (X) shows average
Performance analysis in likert scale of employee welfare, place of worship is the highest mean
of Performance (x = 4.23), while sport & art is the lowest mean of Performance (x = 3.435).
The average value of importance is 4.54 and the average value of performance is 3.96.
Figure 6. Data Plotting of Employee Welfare in Four Quadrants
Source: Data Processed, 2017 – IBM SPSS 22
Description:
1 = National Security (JAMSOSTEK)/BPJS
2 = Outside Workplace Accident Insurance
3 = Life Insurance
4 = Place of Worship
5 = Economic Enterprise
6 = Sport & Art
7 = Recreation
Figure 6 shows that National Security (JAMSOSTEK)/BPJS and Economic Enterprise
are located in quadrant I. Quadrant I is labelled as “concentrate here” which means high
importance but low performance. So, National Security (JAMSOSTEK)/BPJS and economic
enterprise are very important to the employees but the performance is low. Since any object

Journal of ASEAN Studies on Maritime Issues Vol. 3 No. 4 May 2017
27
that is positioned in quadrant I is considered important by the employee, then the company
should be concerned about its performance.
Quadrant II is labelled as “keep up the good work” which means high importance and
high performance. Outside workplace accident insurance, life insurance, place of worship and
recreation are located in this quadrant. It means that the importance of these indicator is high
to the employees and the performance of each indicator that is provided by the company is
also high.
Sport & Art program is located in Quadrant III. This quadrant labelled as “low
priority” which means low importance and low performance. It means that both the level of
importance of the indicator to the employees and the performance according to the
respondents are relatively low.
Last one is Quadrant IV, which is labelled as “possible overkill” which means low
importance and high performance. This quadrant is where the importance of something is not
really high to the employees but the performance is high. None of the research indicator is
located in this quadrant.
CONCLUSION AND RECOMMENDATION
Conclusion
Based on the importance and performance analysis result of seven programs of
employee welfare, there are several things that can be concluded. The conclusions drawn from
this research are as follows:
1. Employee welfare programs that have high importance and low performance or labeled as
“concentrate here” are National Security for the workforce (JAMSOSTEK)/BPJS
membership and Economic Enterprise.
2. Employee welfare programs that have high importance and high performance or labelled
as “keep up the good work” are Outside Workplace Accident Insurance, Life Insurance,
Place of Worship and Recreation.
3. Employee welfare program that have low importance and low performance or labelled as
“low priority” is Sport & Art.
4. There is no employee welfare program that have high performance but low importance or
labelled as “possible overkill”.
Recommendation
These recommandations are proposed by the researcher based on the results and
discussion from the research. The primary aim of this recommendation is to improve the
Journal of ASEAN Studies on Maritime Issues Vol. 3 No. 4 May 2017
28
performance of Employee Welfare Programs in PT Tirta Investama (Danone AQUA)
Airmadidi. The recommendation have been made as listed below:
1. National Security for the workforce (JAMSOSTEK)/BPJS membership and Economic
Enterprise have high importance but running low on performance. Thus, PT Tirta
Investama (Danone AQUA) Airmadidi should provide regularly socialization for National
Security for the workforce (JAMSOSTEK)/BPJS membership at least twice a year to
explain about how to claim it when it is needed. And if possible, PT Tirta Investama
Management is advised to bring the people from National Security for the workforce
(JAMSOSTEK)/BPJS membership to present a comprehensive explanation to the
employees about the necessary informations related to the program. For the Economic
Enterprise, PT Tirta Investama Airmadidi can increase is performance through monitoring
the goods‟ availability, maintaining the price of each goods so it would be affordable to
employees and, if possible, upgrading the items and building of the economic enterprise.
2. Outside Workplace Accident Insurance, Life Insurance, Place of Worship and Recreation
have high importance and also high performance. Therefore, PT Tirta Investama
Management should keep maintaining these program to hold its performance because it is
considered as the most important program to the employee and the performance is already
at the satisfactory level. It should be maintained and strengthened to further improve on
the quality of the welfare programs at PT Tirta Investama (Danone AQUA) Airmadidi.
3. Sport & Art have a low importance and low performance. The importance might be low
for some employees because that is not their hobby and the performance might be low for
some employees because the kind of sport & art again are not suitable to their hobby. So,
it will be good for PT Tirta Investama (Danone AQUA) Airmadidi to provide more
variations of sport & art, such as badminton, rather than just football.
4. Therefore, PT Tirta Investama (Danone AQUA) Airmadidi needs to conduct a further
internal research, in terms of following up the result of this research, in order to increase
or maintain the performance of each employee welfare program that have a high impact
to the employees performance which results in employee contribution in achieving the
company goals. The company requires a periodical assessment about the performance of
employee welfare program, so the programs that is established by the company will
always meet the employees‟ needs.
REFERENCES
Aliaga, M. and Gunderson, B. 2000. Interactive Statistics. Saddle River. p. 3-15.
Journal of ASEAN Studies on Maritime Issues Vol. 3 No. 4 May 2017
29
Ankita, K. 2010. Evaluation of Employee welfare Facilities as an Intervention strategy of
Industrial Unrest on Organization Performance: Case of Mumias Sugar Company.
European Journal of Business and Management. ISSN 2222-1905 (Paper) ISSN 2222-
2839 (Online). Vol.6, No.29, 2014.
Armstrong, M. and Baron, A. 2006. Handbook of Human Resource Management Practice.
Kogan Page Publisher, 10th edition, 2006.
Atambo. 2012. Role of Employee Welfare Services on Performance of the National Police
Service in Kenya: A Case of Kisii Central District. International Journal of Art and
Commerce, Vol. 1 No. 7, December 2012.
Bacon, D. 2003. A Comparison of Approaches to Importance-Performance Analysis.
International Journal of Market Research, 45(1), 55-71, 2003.
Das, U.K. and Panda, J.K. 2015. A study on employees welfare measures with special
reference to Mahanadi Colafied limited, sambalpur, Odisha, India. International Journal
of Science, Technology & Management, Volume No.04, Issue No. 03.
Easton and McColl. 1997. Sampling. Article. Retrieved on
http://www.stat.yale.edu/Courses/1997-98/101/sample.htm. February 27th
, 2017.
Graf, L.A., Hemmasi, M. and Nielsen, W. 1992. Importance satisfaction analysis: A
diagnostic tool for organizational change. Leadership and Organization Development
Journal, 13(6), 8-12.
Hadinegoro P. 2015. Aqua tambah investasi Rp. 1 triliun di 2016. Article. Retrieved on
http://industri.kontan.co.id/news/aqua-tambah-investasi-rp-1-triliun-di-2016, February
27th
, 2017.
Hair, J., Money, A., Samouel, P., and Page, M. 2007. Research Methods for Business, Jhon
Wiley & Sons. Ltd.
Hameed, A. and Aamer, W. 2011. The effect of leadership style, organizational culture,
employee development and training on employee performance (Study of PT. PLN
(Persero) Suluttenggo Region). ISSN 2303-11, Jurnal EMBA Vol.3 No.3 Sept. 2015,
Hal.502-511.
Hasibuan. 2011. Manajemen Sumber Daya Manusia. Bumi Aksara. Jakarta.
Hidayat, R. 2016. Industri Air Minum Kemasan Indonesia Bisa Jadi yang Terbesar di
ASEAN. Article. Retrieved on
http://industri.bisnis.com/read/20160226/43/522798/industri-air-minum-kemasan-
indonesia-bisa-jadi-yang-terbesar-di-asean. February 27th
, 2017.
Imran, M. and Tanveer, A. 2015. Impact of Training and Development of Employees on
Employee Performance through Job Satisfaction: A Study of Telecom Sector of
Pakistan. Business Management and Strategy ISSN 2157-6068 2016, Vol. 7, No. 1.
International Journal of Market Research, 45(1), 55-71, 2003.
Kamkari, K., Ghafourian H., and Ghadami M.H. 2014. Impact Welfare Services and Benefits
on the Performance of Staff of the Inspector General Organization. Journal of Applied
Environmental and Biological Sciences, ISSN: 2090-4274, January 2014.
Likert. 1932. Research Methods for Business Students. Book. Pearson education limited, 5th
edition, England. 2009.
Manju, B. and Mishra, S. 2007. Role of employee welfare services on performance of the
national police service in Kenya: A case of Kisii Central district. International Journal
of Arts and Commerce Vol. 1, No. 7 December 2012.
Martilla, J. and James, J.1977. Importance-performance analysis, Journal of Marketing, vol.
41, no. 1, pp, 77-79.
Paauwe, J. 2009. HRM and performance: achievements, methodological issues and
prospects. Management Studies. 2009; 46(1):129–142.

Journal of ASEAN Studies on Maritime Issues Vol. 3 No. 4 May 2017
30
Punekar. 1999. A study on employees welfare measures with special reference to Mahanadi
Colafied limited, sambalpur, Odisha, India. International Journal of Science,
Technology & Management, Volume No.04, Issue No. 03, March 2015.
Purba, R. 1996. Analisis Pengaruh Kreativitas Iklan, daya Tarik Iklan dan Kredibilitas
Endorser terhadap Brand Attitude pada produk Handphone Android di Kota Pekanbaru.
Jurnal Ekonomi. Vol. 2, No. 1, March 2014.
Reenu and Panwar. 2013. A study on employee welfare facilities and its impact on employees
efficiency. Abhinav International Monthly Refreed Journal of Research in Management
and Technology. Volume 3, Issue 11, Online ISSN-2320-0073, November 2014.
Sabarirajan A. and Meharajan T., and Arun, B. 2010. A study on employee welfare facilities
and its impact on employees efficiency. Abhinav International Monthly Refreed Journal
of Research in Management and Technology. Volume 3, Issue 11, Online ISSN-2320-
0073, November 2014.
Sekaran, U. 2003. Research Methods for Business Students. Book. Pearson education
limited, 5th
edition, England. 2009.
Siregar, B. 2013. Manajemen Pemasaran Jasa, Salemba Empat, Jakarta. Pp. 15.
Storey, J. 1989. New Perspective on Human Resource Management. Routledge, London.
Sugiono. 2013. Metode Penelitian Pendidikan Pendekatan Kuantitatif, Kualitatif, dan R&D.
Alfabeta. Bandung.
Tilekar, P. 2016. To study the satisfaction of employees‟ regarding employee welfare
facilities provided to them by banking sector in Pune Region. American International
Journal of Research in Humanities, Arts and Social Sciences, ISSN (Print): 2328-3734,
ISSN (Online): 2328-3696, ISSN (CD-ROM): 2328-3688, September-November 2016.
Todd, A.J. 1993. Research Paper on Employee Retention in NGOS. International Journal of
Current Research and Academic Review. Vol. 2, No. 11 pp.213-216. ISSN: 2347-3215,
November 2014.
Vijayarani, K. 2015. Employees Welfare Measures towards Productivity of Neyveli Lignite
Corporation Limited. Asia Pasific Journal of Research, ISSN: 2320-5504, E-ISSN:
2347-4793, Vol. I, Issue XXIX, July 2015.

Journal of ASEAN Studies on Maritime Issues Vol. 3 No. 4 May 2017
31
ANALYZING CONSUMER ATTITUDE BETWEEN MALE AND
FEMALE TO PURCHASE INTENTION COUNTERFEIT WAKAI
SHOES
Michael Raintung
Faculty of Economics and Business, Sam Ratulangi University Manado, North Sulawesi, 95115.
Indonesia.
e-mail: [email protected]
ABSTRACT
This research aims to find out if there is significant difference in purchase intention based on social
influence and value consciousness between male and female customers of counterfeit wakai shoes.
Counterfeit products cause a considerable amount of damage in the free market economy. Moreover,
future investment in research and development is placed at risk from the unfair competition generated
by counterfeit products. The international trade of counterfeit product is enormous. Purchasing
intention of counterfeit wakai shoes are currently increasing because there are a lot of people who
become the buyers of this product. Counterfeit wakai shoes are easy to found because it is sold
everywhere. This research conducted by a quantitative method and this research population is the
buyers of wakai counterfeit shoes. By using an Independent Sample t-test, this research conducted a
hypothesis is significant difference in social influence and value consciousness between male and
female customers of counterfeit wakai shoes. Based on the result of this research, the data is normally
distributed and homogenous. The result shows that there are no significant differences in purchase
intention based on social influence and value consciousness between male and female customers of
counterfeit wakai shoes. Findings suggest that original manufactures have to make a mark or hologram
unable to imitate so there will be a significant differences between original and counterfeit.
Keywords: Counterfeiting, gender, social influence, value consciousness
INTRODUCTION
Research Background
Shoes are kind of footwear that accompany every step of our travel and activities.
Except for protective of the foot as footwear, the shoes also can make us look neat and good
looking. Students, teachers, employees, civil servants, security guards, police, president, the
minister and others often use shoes to carry out their duties.
Wakai until now still become a top brand and top search by Manadonese especially
young people. So, it will make Manadonese want to use Wakai as their footwear. Authentic
Wakai shoes product has expensive price for people who have medium below income. That
expensiveness of Wakai shoes then there are a bunch of irresponsible people counterfeiting
Wakai shoes. According to Ang (2001); Bloch (1993); Gentry (2006) Consumers often
knowingly purchase counterfeit products and are willing to pay for the visual attributes and
functions without paying for the associated quality. However, consumers prefer and purchase
counterfeit products with well-known brand names that confer some meaning or image
Journal of ASEAN Studies on Maritime Issues Vol. 3 No. 4 May 2017
32
indicating that consumers aim for an authentic image through the purchase of counterfeit
goods.
Counterfeit products have been found to be a serious problem around the world in
recent days where counterfeiting is associated with many problems that causes havoc not only
in economic activities but also affect social life as well. The international trade of counterfeit
product is enormous. According to an estimate provided by the „The World Customs
Organization‟ shows that counterfeiting accounts for 5 to 7 percent of the global merchandise
trade (Hendriana, Mayasari and Gunadi, 2013).
With the establishment of economic zones integrated in the region of Southeast Asia
known as the ASEAN Economic Community (AEC), Indonesia and nine other ASEAN
member entering the competition is very tight in the economic field. In this case makes
counterfeiting will be easier to enter into Indonesian market place. Counterfeiting will be
found a lot in Indonesia. It will make the customer of counterfeit product will be easy to get it.
Counterfeiting occurs across a wide spectrum of products. These include computer
software, music and movies, drugs and medicine, and even military products (Chaudhry and
Zimmerman, 2012). Within this broad range of goods, apparels including footwear and
headgears, are highly likely to be counterfeited (OECD, 2009). This is due primarily to two
factors. First of all, the technology used to manufacture apparels is cheap and widely
available. Secondly, given the high demand for branded apparels, there is a ready market for
counterfeiters of apparels (Shultz and Saporito, 1996).
Based on discussion above, this study will analyze the social influence and value
consciousness to people in Manado towards the counterfeit product by use Wakai shoes that
considered as the one of popular brand in Manado. Therefore, title of this research is
“Analyzing Consumer Attitude between Male and Female to Purchase Intention Counterfeit
Wakai Shoes”.
Research Objectives
Based on the research problem above, it can be stated formulation of the objective in this
study are as follows:
1. To find out if there is significant difference in purchase intention based on social influence
between male and female customers of counterfeit wakai shoes.
2. To find out if there is significant difference in purchase intention based on value
consciousness between male and female customers of counterfeit wakai shoes.

Journal of ASEAN Studies on Maritime Issues Vol. 3 No. 4 May 2017
33
LITERATURE REVIEW
Marketing
According to Kotler (2009) stated that “one of the shortest definitions of marketing is
meeting the needs of profitability”. There is also a sense of marketing, namely: The American
Marketing Association, in Kotler (2009), offer to follow the formal definition of marketing:
“Marketing is an organizational function and a set of processes for creating, communicating,
and delivering value to customers and for managing customer relationships in ways that
benefit the organization and its stakeholders”.
Consumer Purchase Intention
Purchase intention means a customer‟s decision about a specific product. This
decision takes on the stems of some measure for example the consumer will see the products
for purchasing and anticipating purchasing the products in the future (MacKenzie and Belch,
1986).
Attitude toward Counterfeits
Fishbein and Ajzen, (1975) defined attitude as the “psychological emotion and the
positive or negative evaluation which was caused as an individual engages in a certain
behavior”. According to Ajzen and Fishbein (1980), a person attitude is high correlated with a
person intention which in turn is a reasonable predictor of a specific behavior.
Social Influence
Turner (1991) defined social influence as “the processes whereby people directly or
indirectly influence the thoughts, feelings and actions of others”.
Value Consciousness
Value consciousness has been defined as “a concern for price paid relative to the
quality received”. Value-conscious consumers have great pleasure when able to purchase
items at lower prices because they feel like a “smart shopper” (Lichenstein, 1993).
Counterfeit Products versus Authentic Products
Bian and Moutinho (2009) defined counterfeits as products bearing a trademark that is
identical to a trademark registered to another party, which is very similar to the authentic
products. Counterfeits offers price advantage over the genuine brands and that is the key
determinant for the success for the counterfeits products (Bloch, 1993). Mostly the buyers of
genuine brands seek value, prestige and image benefits from brand (Bloch, 1993). In terms of
product perspective customers believes that genuine brands are more trustworthy and reliable
then counterfeit brands (Bian and Veloutsou, 2007).
Gender and Counterfeit Purchase Intention
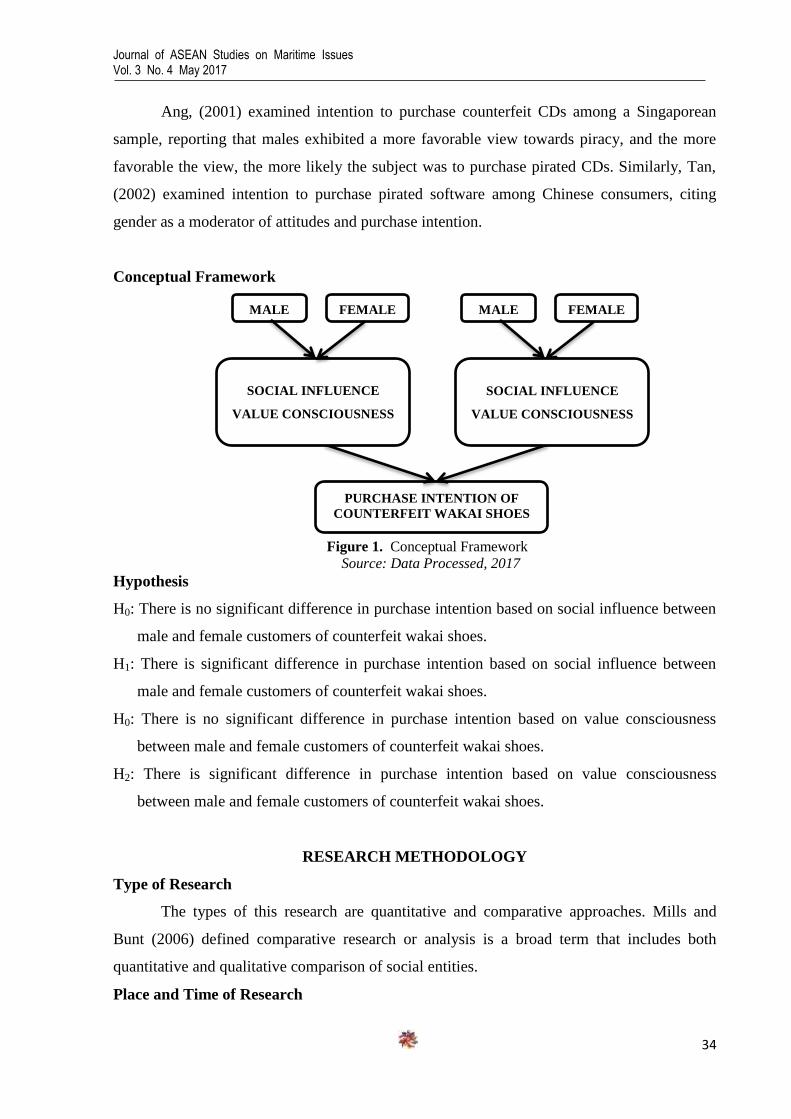
Journal of ASEAN Studies on Maritime Issues Vol. 3 No. 4 May 2017
34
Ang, (2001) examined intention to purchase counterfeit CDs among a Singaporean
sample, reporting that males exhibited a more favorable view towards piracy, and the more
favorable the view, the more likely the subject was to purchase pirated CDs. Similarly, Tan,
(2002) examined intention to purchase pirated software among Chinese consumers, citing
gender as a moderator of attitudes and purchase intention.
Conceptual Framework
Figure 1. Conceptual Framework
Source: Data Processed, 2017
Hypothesis
H0: There is no significant difference in purchase intention based on social influence between
male and female customers of counterfeit wakai shoes.
H1: There is significant difference in purchase intention based on social influence between
male and female customers of counterfeit wakai shoes.
H0: There is no significant difference in purchase intention based on value consciousness
between male and female customers of counterfeit wakai shoes.
H2: There is significant difference in purchase intention based on value consciousness
between male and female customers of counterfeit wakai shoes.
RESEARCH METHODOLOGY
Type of Research
The types of this research are quantitative and comparative approaches. Mills and
Bunt (2006) defined comparative research or analysis is a broad term that includes both
quantitative and qualitative comparison of social entities.
Place and Time of Research
MALE
PURCHASE INTENTION OF
COUNTERFEIT WAKAI SHOES
SOCIAL INFLUENCE
VALUE CONSCIOUSNESS
FEMALE MALE FEMALE
SOCIAL INFLUENCE
VALUE CONSCIOUSNESS

Journal of ASEAN Studies on Maritime Issues Vol. 3 No. 4 May 2017
35
The place of this research will be conducted in Manado for two months, May-June
2017.
Population and Sample
The population in this research is all buyers of counterfeit wakai shoes in Manado.
The sample in this research is 100 buyers (50 male and 50 female) of counterfeit wakai shoes
in Manado.
Data Collection Method
The primary data of this study gets from the results of questionnaires. The secondary
data collected in varied of sources and the sources are books, journals, articles, thesis, and
websites.
Operational Definition of Research Variable
Social Influence is the processes whereby people directly or indirectly influence the
thoughts, feelings and actions of others to have purchase intention of counterfeit wakai shoes.
Value consciousness is defined as a concern for paying lower prices, subject to some
quality constraint
Data Analysis Method
Validity Test
To analyze the validity of questionnaire, Pearson Product Moment was used. If
probabiility of correlation is less than 0.05 (5%) then the research instrument is considered
valid.
Reliability Test
Reliability tests in this study using Cronbach‟s Alpha formula. If Alpha is less than 0.6
the it is unreliable.
Normality Test
The distribution of data with normal distribution pattern (data distribution is not
skewed to the left or right). If the probability value > 0.05 then population is normally
distributed.
Homogeneity Test
The Levene‟s F test for Equality of Variances is the most commonly used statistic
used statistics to test the assumption of homogeneity of a variance. The criteria of Levene‟s
test is if the variance or value of significant higher than 0.05 it means homogeneous.
Independent Sample T-test

Journal of ASEAN Studies on Maritime Issues Vol. 3 No. 4 May 2017
36
The independent-samples t test evaluates the difference between the means of two
independent or unrelated groups. That is, we evaluate whether the means for two independent
groups are significantly different from each other. This t-test is to analyze the difference in
purchase intention based on consumer attitude between male and female customers of
counterfeit wakai shoes and to analyze the difference in purchase intention based on social
influence between male and female customers of counterfeit wakai shoes.
RESULT AND DISCUSSION
Validity Test Result
Source: SPSS 22, 2017
The value could be classified as a good variable when the significant level below
0.005 and the correlation values are above 0.30.
Reliability Test Result
Source: SPSS 22, 2017
Reliability test result in the Table 2 the Alpha Cronbach has a value 0.829, it proves
the data is reliable.
Normality Test Result
Table 1. Correlations Social
Influence
Value
Consciousness
TOTAL
Social Influence Pearson Correlation 1 .881**
.970**
Sig. (2-tailed) .000 .000
N 100 100 100
Value
Consciousness
Pearson Correlation .881**
1 .970**
Sig. (2-tailed) .000 .000
N 100 100 100
TOTAL Pearson Correlation .970**
.970**
1
Sig. (2-tailed) .000 .000
N 100 100 100
**. Correlation is significant at the 0.01 level (2-tailed).
Table 2. Reliability Statistics Cronbach's Alpha N of Items
.829 14
Table 3. One-Sample Kolmogorov-Smirnov Test Social
Influence
Value
Consciousness
N 100 100
Normal Parametersa,b
Mean 3.6686 3.4457
Std. Deviation .48949 .46542
Most Extreme Differences Absolute .076 .085

Journal of ASEAN Studies on Maritime Issues Vol. 3 No. 4 May 2017
37
Source: SPSS 22, 2017
Based on the Table 3 above further decisions are resulted as follows:
1. It appears that a significant column (Asymp. Sig (2-tailed)) for Consumer Attitude is
0.064 or more than 0.05 then the probability of H0 received population mean of Consumer
Attitude normally distributed.
2. It appears that a significant column (Asymp. Sig (2-tailed)) for Social Influence is 0.072
or more than 0.05 then the probability of H0 received population mean of Social Influence
normally distributed.
Independent Sample T-test
Independent Sample T-test for Social Influence and Value Consciousness Divided
between the Group Male and Female
Table 4. Group Statistics Gender N Mean Std. Deviation Std. Error Mean
Social Influence Male 50 3.7174 .50118 .07088
Female 50 3.6199 .47757 .06754
Value
Consciousness
Male 50 3.4627 .50645 .07162
Female 50 3.4287 .42494 .06010
Source: SPSS 22, 2017
The mean difference from male and female shows by table about social influence of
counterfeit wakai shoes at 3.7174 while female at 3.6199. In other words, male has on average
higher social influence than female.
The mean difference from male and female shows by table about value consciousness
of counterfeit wakai shoes at 3.4627 while female at 3.4287. In other words, male has on
average higher value consciousness than female.
Independent Sample T-test for Consumer Attitude between t Male and Female
Table 5. Independent Samples Test
Levene's Test for Equality of
Variances
t-test for Equality of Means
F Sig. t df Sig. (2-tailed)
Mean Difference
Social Influence
Equal variances assumed ,989 ,322 ,995 98 ,322 ,09746
Equal variances not assumed
,995 97,7 ,322 ,09746
Value Consciousness
Equal variances assumed 1,074 ,303 ,363 98 ,717 ,03397
Equal variances not assumed
,363 95,1 ,717 ,03397
Source: SPSS 22, 2017
Positive .064 .059
Negative -.076 -.085
Test Statistic .076 .085
Asymp. Sig. (2-tailed) .161c .072
c
a. Test distribution is Normal.
b. Calculated from data.
c. Lilliefors Significance Correction.

Journal of ASEAN Studies on Maritime Issues Vol. 3 No. 4 May 2017
38
In the table above for social influence can be seen that the value t=0.995 with a
significance of p=0.322 (p>0.05) indicates that H0 is accepted which means there is no
significant difference in purchase intention based on social influence between male and
female customers of counterfeit wakai shoes.
In the table above for value consciousness can be seen that the value t=0.363 with a
significance of p=0.717 (p>0.05) indicates that H0 is accepted which means there is no
significant difference in purchase intention based on value consciousness between male and
female customers of counterfeit wakai shoes.
Discussion
Purchasing intention of counterfeit Wakai shoes are currently increasing because there
are a lot of people who become the buyers of this product. Counterfeit Wakai shoes are easy
to found because it is sold everywhere and also people become more attracted because the
increasing of counterfeit Wakai shoes quality. By seeing this fact, government should be re-
educated about preventing the counterfeit.
Purchase Intention between Male and Female Measured by Social Influence and Value
Conciousness
Indicator of social influence and value consciousness mean of male bigger than female
shows that more positive perception of consumer attitude of purchase intention counterfeit
wakai shoes. This result also shows by the t value, which is group 1 (Male) better than group
2 (Female). But this compare means does not have proven by significant different between
male and female, means both of these groups are not significantly different. It seems that there
is a difference among the group mean but it can proved by an independent sample t-test.
Therefore, there is no significant difference in purchase intention between male and female
customers of counterfeit wakai shoes measured by social influence and value consciousness
Previous research also showed social influence has a strong influence on consumer‟s
impression and purchasing intention towards the counterfeit goods (Ang, Cheng, Lim and
Tambyah, 2001). Hence, it is proved that social influence positively affects consumers‟
purchase intention. This influence can sometimes outweigh personal conviction and peer
pressure may overrule integrity of oneself. This desire to maximize value, or the ratio of
quality to price, would make non-luxury items more attractive than luxury goods because they
offer the same functional quality at a much lower price. However, while counterfeits may
provide status at a lower price, they are often of lesser quality than either a non-luxury brand
or authentic luxury brand (Cohen 2005).

Journal of ASEAN Studies on Maritime Issues Vol. 3 No. 4 May 2017
39
Moreover, previous research also showed attitudes towards piracy influence the
purchase intention of counterfeit goods (Ang, Cheng, Lim and Tambya, 2001). Positive
attitudes toward buying counterfeits are expected to affect purchase intention of counterfeits
positively (Yoo and Lee, 2009). Prior research has revealed that purchase intention of
counterfeits is not influenced by low prices and that attitudes towards counterfeits directly
influence purchase intention of counterfeits (Yoo and Lee, 2009). Hence, consumer will tend
to purchase the counterfeit wakai shoes if they have a positive feeling towards it. This
research found there is no significant difference in purchase intention based on consumer
attitude between male and female customers of counterfeit wakai shoes.
This research also supported theory by Tan (2003) examined intention to purchase
pirated software among Chinese consumers, citing gender as a moderator of attitudes and
purchase intention. However, the specific of gender on social influence towards counterfeit
wakai shoes has no a significant difference.
CONCLUSION AND RECOMMENDATION
Conclusion
1. There is no significant difference in purchase intention between male and female
customers of counterfeit wakai shoes measured by Social Influence.
2. There is no significant difference in purchase intention between male and female
customers of counterfeit wakai shoes measured by Value Consciousness.
Recommendation
1. The original Wakai shoes have to make a mark or hologram that unable to remove. It
makes there will be a significant differences between authentic and counterfeit.
2. The rule and punishment of the counterfeiting who controlled by the government to
prevent counterfeit. Society keeps purchasing the counterfeit product because it is
available in the market.
3. The action of government to prevent counterfeits products entering the country. The
government has to obstruct every import counterfeit product. If there is no counterfeit
product in the market it means people will never try to look for the counterfeit product.
4. Local standards and International standards have to be developed to support the industry.
REFERENCES
Ajzen, I., Fishbein, M. 1980. Understanding Attitudes And Predicting Social Behaviour,
Prentice-Hall, Englewood Cliffs, NJ.
Journal of ASEAN Studies on Maritime Issues Vol. 3 No. 4 May 2017
40
Anas, H. and Ayu, H.A.D. 2013. Factors Influencing Attitudes and Intention to Purchase
Counterfeit Luxury Brands among Indonesian Consumers. International Journal of
Marketing Studies; Vol. 5, No. 4.
https://www.google.co.id/url?sa=t&rct=j&q=&esrc=s&source=web&cd=2&cad=rja&ua
ct=8&ved=0ahUKEwjEl_TP06TWAhUPTo8KHanzAHIQFgg0MAE&url=http%3A%2
F%2Fup.hamkarfile.ir%2F683.pdf&usg=AFQjCNER1cQDf5W3s3h2k2E-
C83XzwezRQ . Accessed March 17th
2017.
Ang, S.H., Cheng, P.S., Lim, E.A., and Tambyah, S.K. 2001. Spot the difference: consumer
responses towards counterfeits. Journal of Consumer Marketing, 18(3), 219-235.
https://search.proquest.com/docview/220117663/fulltextPDF/86A74E3E7C604E11PQ/1
?accountid=31731 . Accessed March 12th
2017.
Bian, X. and Moutinho, L. 2009. An investigation of determinants of counterfeit purchase
consideration. Journal of Business Research, 62(3), 368-378.
https://www.researchgate.net/publication/223363613_An_Investigation_of_Determinan
ts_of_Counterfeit_Purchase_Consideration . Accessed March 10th
2017.
Bian, X. and Veloutsou, C. 2007. Consumers' attitudes regarding non-deceptive counterfeit
brands in the UK and China. Journal of Brand Management, 14(3), 211-222.
https://search.proquest.com/docview/232485212/fulltextPDF/D17B8F85E3434F57PQ/1
?accountid=31731 . Accessed March 12th
2017
Bloch, P.H., Bush, R.F., and Campbell, L. 1993. Consumer “accomplices” in product
counterfeiting: a demand side investigation. Journal of Consumer Marketing, 10(4), 27-
36.
https://www.researchgate.net/profile/Peter_Bloch3/publication/235286981_Consumer_a
ccomplices_in_product_counterfeiting_a_demand_side_investigation/links/5538fa4f0cf
247b8587e3104/Consumer-accomplices-in-product-counterfeiting-a-demand-side-
investigation.pdf . Accessed March 11th
2017.
Cecilia, M. and Evelyn C. 2005. Attitudes toward Counterfeit Products: An Ethical
Perspective. Journal of Legal, Ethical and Regulatory Issues, Vol. 8 No. 2.
Chaudhry, P.E. and Zimmerman, A. 2009. The Economics of Counterfeit Trade:
Government, Consumers, Pirates and Intellectual Property Rights, Springer-Verlag
Berlin Heidelberg.
Eisend, M. and Schuchert-Güler, P. 2006. Explaining counterfeit purchases: a review and
preview. Academy of Marketing Science Review, 12(6), 1-25.
Fishbein, M. and Ajzen, I. 1975. Belief, Attitude, Intention, and Behavior: An Introduction to
Theory of Research, Addison-Wesley, Reading, MA.
Gentry, J.W., Putrevu, S., and Shultz, C.J.I. 2006. The Effects Of Counterfeiting On
Consumer Search, Journal Of Consumer Behaviour, 5(3): 245-56.
http://onlinelibrary.wiley.com/doi/10.1002/cb.176/epdf?r3_referer=wol&tracking_actio
n=preview_click&show_checkout=1&purchase_referrer=www.google.co.id&purchase_
site_license=LICENSE_DENIED . Accessed March 12th
2017.
Hendriana, E., Mayasari, A.P., and Gunadi, W. 2013. Why do college students buy
counterfeit movies. International Journal of e-Education, e-Business, e-Management and
e-Learning, 3, 1, 62-66.
https://www.google.co.id/url?sa=t&rct=j&q=&esrc=s&source=web&cd=2&cad=rja&ua
ct=8&ved=0ahUKEwjN9pHN-
5_WAhUHsI8KHWlNAIMQFgg9MAE&url=http%3A%2F%2Fwww.ijeeee.org%2FPa
pers%2F194-K00014.pdf&usg=AFQjCNFRcn8qfPYr3JvPeSGiUEmH9GBWwQ .
Accessed March 12th
2017.
Journal of ASEAN Studies on Maritime Issues Vol. 3 No. 4 May 2017
41
Ian, P., Min, T., and Agnes, L. 2008. Targeting buyers of counterfeit of luxury brands: A
study on attitudes of Singaporean consumers. Journal of Targeting, Measurement and
Analysis for Marketing. Vol.17, 1, 3-15.
Kotler, P. 2009. Marketing Management. Pearson Prentice Hall, Essex. 1st Europeaned
Lichtenstein, D., Ridgway, N. and Netemeyer, R. 1993. Price perceptions and consumer
shopping behaviour: a field study, Journal of Marketing Research, Vol. 30 No. 2, pp.
234-45.
MacKenzie, S. B., Lutz, R. J., and Belch, G. E. 1986. The role of attitude toward the ad as a
mediator of advertising effectiveness: A test of competing explanations. Journal of
marketing research, 130-143.
http://web.b.ebscohost.com/ehost/pdfviewer/pdfviewer?vid=1&sid=13a71585-5f79-
4fc5-bba3-8ee46cd24100%40sessionmgr101 . Accessed March 12th
2017.
Mills, M. and G, Bunt. 2006. Comparative Research: Persistent Problems and Promising
Solutions. International Sociology, Vol 21, No 5. 619-631.
https://www.google.co.id/url?sa=t&rct=j&q=&esrc=s&source=web&cd=3&cad=rja&ua
ct=8&ved=0ahUKEwjV5tm9_5_WAhXFKY8KHTkYA8AQFgg2MAI&url=https%3A
%2F%2Fwww.rug.nl%2Fresearch%2Fportal%2Ffiles%2F2861632%2F65-MillsM-
Comparative-2006.pdf&usg=AFQjCNHwyr1iczxqEq3z3Zap-aPqWrMP1Q . Accessed
March 12th
2017.
OECD (The Organization for Economic Co-operation and Development). 2009. Magnitude
of counterfeiting and piracy of tangible products: An update.
Penz, E. and Stöttinger, B. 2005. Forget the „ real ‟ thing – Take the copy! An explanatory
model for the volitional purchase of counterfeit products. Advances in Consumer
Research 32 : 568 – 575.
Shultz, C.J. and Saporito, B. 1996. Protecting intellectual property: strategies and
recommendations to deter counterfeiting and brand piracy in global market, The
Columbia Journal of World Business, Vol. 31 No. 1, pp. 18-28.
Tan, B. 2002. Understanding consumer ethical decision making with respect to purchase of
pirated software. Journal of Consumer Marketing, 19(2), 96-111.
https://search.proquest.com/docview/220124655/fulltextPDF/76A183F2FE3F454BPQ/1
?accountid=31731 . Accessed March 12th
2017.
Tom, G., Garibaldi, B., Zeng, Y., and Pilcher, J. 1998. Consumer demand for counterfeit
goods. Psychology and Marketing, 15 (5), 405–421.
Turner, J. C. 1991. Social Influence. In Brooks/Cole Mapping Social Psychology Series.
Maidenhead: Open University Press.
Yoo, B. and Lee, S. H. 2009. Buy genuine luxury fashion products or counterfeits? Advances
in Consumer Research, 36, 280-286.
http://web.b.ebscohost.com/ehost/pdfviewer/pdfviewer?vid=1&sid=4c55b6d0-2617-
4bea-ab60-3d639428caa4%40sessionmgr103 . Accessed March 12th
2017.
Journal of ASEAN Studies on Maritime Issues Vol. 3 No. 4 May 2017
42
PROFESI AKUNTAN DI ERA MASYARAKAT EKONOMI ASEAN
(MEA)
Princilvanno A. Naukoko
Fakultas Ekonomi dan Bisnis, Universitas Sam Ratulangi Manado, Sulawesi Utara, 95115, Indonesia.
email: [email protected]
ABSTRAK
MEA membuka peluang bagi tenaga professional ASEAN untuk bisa bekerja di antara negara-negara
ASEAN, hal ini telah disepakati bersama dalam Mutual Recognition Agreement (MRA). Sudah
terlambat bagi kita untuk mempertanyakan lagi mengenai kesepakatan tersebut, tetapi belum terlambat
bagi kita untuk menentukan sikap dalam mempersiapkan diri menghadapi MEA. Riset ini diharapkan
bisa memberikan pandangan kepada para professional akuntan dan mahasiswa akuntansi mengenai
persaingan profesi akuntan di era MEA. Indonesia memiliki kekuatan sebagai negara ASEAN dengan
jumlah akuntan ke empat terbanyak di negara ASEAN, namun memiliki tantangan akan kurangnya
jumlah profesi akuntan dibandingkan dengan banyaknya organisasi yang membutuhkan akuntan.
Ancaman bagi profesi akuntan di era MEA berasal dari negara-negara tetangga Thailand, Malaysia,
dan Singapura karena memiliki jumlah akuntan yang lebih banyak dari Indonesia.
______________________________________________________________________________
Kata kunci: Akuntan, MEA, MRA
PENDAHULUAN
Masyarakat Ekonomi ASEAN (MEA) atau Asean Economic Community (AEC) adalah
suatu realisasi integrasi ekonomi yang terkandung di dalam Visi ASEAN 2020. Di dalam Visi
ASEAN 2020 diatur suatu kerjasama yang mana salah satunya adalah untuk memperluas dan
memperdalam integrasi ekonomi lewat kerjasama yang sudah ada dan baru akan ada dengan
memiliki batasan yang jelas.
Salah satu dampak yang ditimbulkan oleh MEA adalah terbentuknya perdagangan bebas
bagi masyarakat ASEAN. Perdagangan bebas yang dihasilkan dari MEA membuat bebas
hambatan pada sektor jasa untuk akses pasar dan tidak ada peraturan diskriminatif bagi pelaku
MEA untuk bisa berpartisipasi dalam kawasan MEA.
Bagi akuntan, MEA memberikan peluang dan tantangan tersendiri. Hal ini didukung
dengan adanya Mutual Recognition Agreement (MRA). MRA adalah pengakuan bersama
antar anggota ASEAN akan jasa profesi, bagi professional yang terlisensi atau bersertifikat.
Salah satu profesi yang diakui dalam MRA adalah jasa akuntansi. Dengan berlakunya MEA,
adanya MRA, maka penting bagi kita sebagai masyarakat negara anggota ASEAN dalam
mempersiapkan diri kita guna menghadapi MEA.
Journal of ASEAN Studies on Maritime Issues Vol. 3 No. 4 May 2017
43
Riset yang sebelumnya dari Putri (2016) yang menggunakan metode penelitian pustaka
maka bahwa memenangkan persaingan di era MEA, akuntan tidak cukup mengandalkan
kompetensi yang dimiliki saat ini. Setidaknya perlu area pengembangan soft skills, terus
meningkatkan kompetensi, membangun networking, memiliki integritas tinggi dan persiapan
mental sebagai player. Selain itu juga perlu peranan dari IAI sebagai organisasi profesi
akuntan di Indonesia serta stakeholders utama akuntan yaitu Perguruan Tinggi, pemerintah
dan dunia bisnis. Akuntan tidak perlu takut menghadapi MEA, jika kompetensi bagus justru
MEA menjadi peluang emas bagi akuntan. Riset ini diharapkan bisa memberikan pandangan
kepada para professional akuntan dan mahasiswa akuntansi mengenai persaingan profesi
akuntan di era MEA.
TINJAUAN PUSTAKA
1. Profesi Akuntan
Sesuai dengan ketentuan Undang-undang no. 34 tahun 1954 tentang pemakaian gelar
akuntan, dalam pasal 1 UU no. 34 tahun 1954 disebutkan setiap orang yang memakai gelar
akuntan telah memiliki ijazah Pendidikan untuk akuntan. Ijazah yang dimaksud adalah ijazah
yang diberikan oleh suatu universitas atau perguruan tinggi yang diakui oleh pemerintah dan
ijazah yang diterima setelah lulus ujian dari panitia ahli (pasal 2).
Saat ini, ijazah akuntansi dapat diperoleh melalui Pendidikan Profesi Akuntansi (PPAk)
dan melalui ujian sertifikasi akuntan professional yang diselenggarakan oleh Ikatan Akuntan
Indonesia (IAI). Sebagaimana yang diatur dalam PMK No. 25 tahun 2014, Akuntan adalah
seseorang yang telah terdaftar pada Register Negara Akuntan yang diselenggarakan oleh
Menteri. Jadi sesuai dengan pasal 2 ayat (3) PMK No. 25 tahun 2014 untuk menggunakan
gelar Akuntan (Ak), seseorang harus memenuhi persyaratan lulus PPAk atau lulus ujian
sertifikasi akuntan professional, memiliki pengalaman di bidang akuntansi, dan sebagai
anggota Assosiasi Profesi Akuntan serta dalam pasal 2 ayat (4) menyebutkan seseorang yang
terdaftar dalam Register Negara Akuntan diberikan piagam Register Negara Akuntan dan
berhak menyandang gelar Akuntan. Secara garis besar dan dari bidang kerjanya, profesi
akuntan dapat digolongkan sebagai berikut (Triani dkk., 2015):
a. Akuntan Publik (Public Accountants)
Akuntan publik dikenal juga dengan akuntan eksternal adalah akuntan independen
yang memberikan jasa-jasanya atas dasar persetujuan pekerjaan dengan pembayaran
tertentu. Akuntan Publik bekerja bebas dan tidak terikat kepentingan dengan kliennya,
serta umumnya memiliki atau bekerja pada suatu kantor akuntan. Yang termasuk

Journal of ASEAN Studies on Maritime Issues Vol. 3 No. 4 May 2017
44
dalam kategori akuntan publik adalah akuntan yang bekerja pada kantor akuntan
publik (KAP) dan dalam prakteknya sebagai seorang akuntan publik dan mendirikan
kantor akuntan, dan KAP harus memperoleh izin dari Departemen Keuangan. Akuntan
publik dapat melakukan pemeriksaan (audit), misalnya terhadap jasa perpajakan, jasa
konsultasi manajemen, dan jasa penyusunan sistem manajemen.
b. Akuntan Internal (Internal Accountants)
Akuntan internal adalah akuntan yang bekerja dalam suatu perusahaan atau organisasi.
Akuntan internal ini disebut juga sebagai akuntan perusahaan atau akuntan
manajemen. Jabatan Akuntan internal dalam perusahaan dapat diduduki mulai dari
Staf biasa sampai dengan Kepala Bagian Akuntansi atau Direktur Keuangan. Tugas
mereka dapat berupa menyusun sistem akuntansi, menyusun laporan keuangan kepada
pihak-pihak eksternal, menyusun laporan keuangan kepada pemimpin perusahaan,
menyusun anggaran, penanganan masalah perpajakan dan melakukan pemeriksaan
internal atas laporan keuangan perusahaan atau organisasi.
c. Akuntan Pemerintah (Government Accountants)
Akuntan pemerintah adalah akuntan yang bekerja pada lembaga-lembaga pemerintah,
misalnya di kantor Badan Pengawas Keuangan dan Pembangunan (BPKP), Badan
Pengawas Keuangan (BPK), serta pada satuan kerja perangkat daerah yang bertugas
sebagai penyusun laporan keuangan ataupun sebagai pemeriksa laporan keuangan
pemerintah, sesuai dengan luas bidang kerja yang telah ditetapkan.
d. Akuntan Pendidik
Akuntan pendidik adalah akuntan yang bertugas dalam pendidikan akuntansi,
melakukan
penelitian dan pengembangan akuntansi, mengajar, dan menyusun kurikulum
pendidikan
akuntansi di perguruan tinggi.
2. Masyarakat Ekonomi ASEAN (MEA)
MEA merupakan suatu kesepakatan negara-negara ASEAN dalam rangka mewujudkan
visi ASEAN 2020 yang telah disusun sejak tahun 1997 di Kualalumpur (Avianti, 2015).
Dalam mewujudkan visi ASEAN 2020, terdapat 3 pilar komunitas ASEAN yang mana salah
satunya adalah ASEAN Economic Community (AEC) yang berfokus pada menjadikan negara-
negara ASEAN sebagai kawasan perdagangan bebas barang, jasa, investasi, tenaga kerja, dan
aliran modal.
Journal of ASEAN Studies on Maritime Issues Vol. 3 No. 4 May 2017
45
MEA ataupun AEC memberikan kawasan perdagangan bebas bagi negara-negara
ASEAN, serta menciptakan pasar regional bagi penduduk ASEAN. Hal ini didukung dengan
4 karakteristik MEA sebagai berikut (Avianti, 2015).
a. Single market and production base
Satu pasar dan basis produksi di ASEAN yang menyebabkan arus bebas barang, arus
bebas jasa, arus bebas investasi, arus permodalan lebih bebas, arus bebas tenaga
kerja terampil, serta pengembangan sektor-sektor ekonomi di negara-negara ASEAN.
b. Competitive economic region
Persaingan ekonomi regional yang berkompetensi, adanya perlindungan akan
konsumen, perlindungan Hak Kekayaan Intelektual, regulasi perpajakan yang tidak
memberatkan, dan hal lain yang mendukung adanya persaingan ekonomi regional
yang kompetitif dan adil bagi antar negara ASEAN.
c. Equitable economic development
Pembangunan ekonomi yang seimbang dari sektor usaha kecil dan menengah (UKM)
serta berupaya untuk mengurangi kesenjangan antar negara ASEAN dan dengan
negara lain di dunia.
d. Fully integrated region in the global economy
Kawasan ekonomi yang terintegrasi dengan perekonomian global, dimana negara-
negara ASEAN diharapkan dapat meningkatkan jaringan suplai terhadap antar negara
ASEAN dan negara lain di dunia.
Bagi Akuntan, MEA memiliki peluang dan tantangan tersendiri. Hal ini didukung
dengan adanya Mutual Recognition Agreement (MRA) Framework on Accountancy Services
yang disepakati pada 26 Februari 2009 dan kemudian menjadi MRA on Accountancy Services
yang disepakati pada tanggal 13 November 2014.
METODE PENELITIAN
Penelitian ini dilakukan dengan menggunakan pendekatan kualitatif positif. Pendekatan
kualitatif yang digunakan adalah tinjauan pustaka untuk memahami posisi akuntan Indonesia
dalam memasuki era MEA, khususnya memahami akan peluang dan tantangan yang akan
dihadapi oleh akuntan Indonesia di era MEA serta strategi yang bisa dilakukan bagi profesi
akuntan. Selain itu digunakan uji perbandingan rasio antara jumlah akuntan yang teraftar
dengan potensi lapangan kerja untuk mendapatkan data perbandingan mengenai keadaan
profesi akuntan di Indonesia dalam menghadapi MEA.
Journal of ASEAN Studies on Maritime Issues Vol. 3 No. 4 May 2017
46
HASIL PENELITIAN DAN PEMBAHASAN
Era MEA sudah berlangsung sejak tahun 2016, di era MEA akan ada pergerakan bebas
atas barang, jasa dan tenaga ahli, investasi, modal, dan harmonisasi peraturan, regulasi, dan
prosedur. Saat ini pergerakan barang sudah mulai diberlakukan dengan beberapa barang yang
mengalami perlakuan khusus dengan mendapatkan bebas bea masuk.
MEA membuat barang-barang dari negara ASEAN untuk masuk tanpa hambatan bea
masuk yang signifikan. Dampak dari arus bebas barang tanpa hambatan bea masuk, negara
yang memiliki kemampuan produksi barang berkualitas dan harga kompetitif akan mudah
untuk menang dalam persaingan. Arus barang ini dapat menjadi ancaman bagi hasil produksi
lokal, apalagi jika produk lokal tidak kompetitif dalam biaya produksinya. Dampak lainnya
adalah investasi akan mengalir diantara negara ASEAN. Investasi akan mengalir ke negara
yang membuka pintu investasi, siap secara infrastruktur, serta memiliki iklim investasi yang
mendukung investasi. Investasi melalui pasar modal maupun investasi langsung akan
bergerak antar negara ASEAN. Arus bebas juga terjadi untuk tenaga kerja professional.
Tenaga kerja di negara ASEAN akan mudah bekerja tanpa hambatan. Tidak semua tenaga
professional dibuka dalam pasar bebas ASEAN. Sesuai dengan MRA, saat ini tenaga kerja
professional yang akan diberikan kesempatan untuk pasar bebas baru dimulai untuk jasa
teknik, arsitek, jasa perawatan, praktisi medis, praktisi gigi, jasa akuntan dan survey (Martani,
2016).
MRA memberikan kesempatan kepada para tenaga professional untuk bisa bekerja di
antara negara-negara ASEAN. Kesempatan ini berlaku bagi tenaga professional Indonesia dan
negara-negara ASEAN lainnya. Sehingga kesempatan ini bisa menjadi boomerang yang dapat
menyerang tenaga professional kita jika tidak dimanfaatkan dengan baik oleh tenaga
professional kita. Jumlah akuntan yang tergabung dalam data asosiasi profesi akuntan di
negara-negara ASEAN, Indonesia menduduki peringkat keempat besar yang memiliki
akuntan, hal ini memberikan kita kesempatan akan peluang kita untuk bisa menguasai
kebutuhan akuntan di Indonesia sendiri. Persaingan ini bisa dibilang masih perlu lagi
ditingkatkan karena dengan melihat data akuntan yang terdaftar dalam asosiasi profesi
akuntan di negara-negara ASEAN, jumlah akuntan yang kita miliki masih kalah dengan
negara tetangga terdekat kita yaitu Thailand, Malaysia dan Singapura. Data selengkapnya
mengenai proporsi jumlah akuntan yang tergabung dalam data asosiasi profesi akuntan di
negara ASEAN adalah sebagai berikut.
Tabel 1. Akuntan yang Terdaftar dalam Asosiasi Profesi Akuntan di Negara-Negara ASEAN No Negara Jumlah Akuntan terdaftar 2015

Journal of ASEAN Studies on Maritime Issues Vol. 3 No. 4 May 2017
47
1 Thailand 62.739
2 Malaysia 31.815
3 Singapura 28.891
4 Indonesia 24.587
5 Philippines 18.214
6 Vietnam 9.800
7 Myanmar 1.948
8 Cambodia 291
9 Laos 176
10 Brunei 56 Sumber: IAI & Asean.org, 2017
Jumlah akuntan yang terdaftar di asosiasi profesi akuntan di Indonesia, masih terbilang
sedikit. Jumlah ini jika dibandingkan dengan jumlah penduduk Indonesia yang saat ini kira-
kira 250 juta jiwa, memberikan perbandingan yang tidak seberapa antara jumlah akuntan
dengan jumlah penduduk. Dikhawatirkan, dengan masih kurangnya jumlah akuntan di negara
Indonesia memberikan peluang besar bagi akuntan professional dari negara tetangga untuk
bisa menguasai permintaan pasar karena kurangnya kemampuan dari akuntan dalam negeri
Indonesia yang bisa memenuhi kebutuhan pasar.
Kebutuhan pasar akan profesi akuntan di Indonesia sebenarnya tidaklah sebatas pada
dunia bisnis saja. Karena adanya regulasi yang menuntut audit laporan keuangan dari
pemerintah pusat, pemda, dan Lembaga non kementrian memberikan peluang yang besar
untuk akuntan. Selain itu, era otonomi daerah mengharuskan pemerintah untuk menyajikan
laporan keuangan terpisah sesuai dengan Standar Akuntansi Pemerintahan (UU 32 tahun 2004
dan diubah dalam UU 23 tahun 2014 tentang Pemerintahan Daerah). Beberapa organisasi lain
non pemerintah maupun non bisnis juga memerlukan adanya pelaporan keuangan untuk
kebutuhan investasi, pengajuan pinjaman perbankan, serta di audit. Misalnya saja, UU no. 2
tahun 2011 tentang partai politik, UU no. 16 tahun 2001 tentang Yayasan, dan UU no. 25
tahun 1992 tentang Koperasi, semua peraturan tersebut mewajibkan adanya laporan keuangan
sebagai bentuk pertanggung jawaban, serta audit atas laporan keuangannya. Banyaknya
peluang pasar ini sebenarnya memberikan kesempatan yang besar buat akuntan Indonesia.
Indonesia sebenarnya merupakan negara berkembang yang sangat mendorong pertumbuhan
UMKM yang mana masih banyak belum tersentuh oleh Akuntan. Menurut data IAI (2015)
setidaknya terdapat 226.780 organisasi yang membutuhkan tenaga akuntan untuk menyusun
laporan keuangan dengan baik. Jumlah tersebut terbagi atas Lembaga-lembaga pemerintah,
dunia bisnis, dan organisasi-organisasi lain yang non pemerintah dan non bisnis di Indonesia.
Berikut adalah data mengenai Lembaga pemerintah, dunia bisnis, dan organisasi lain yang
membutuhkan akuntan.
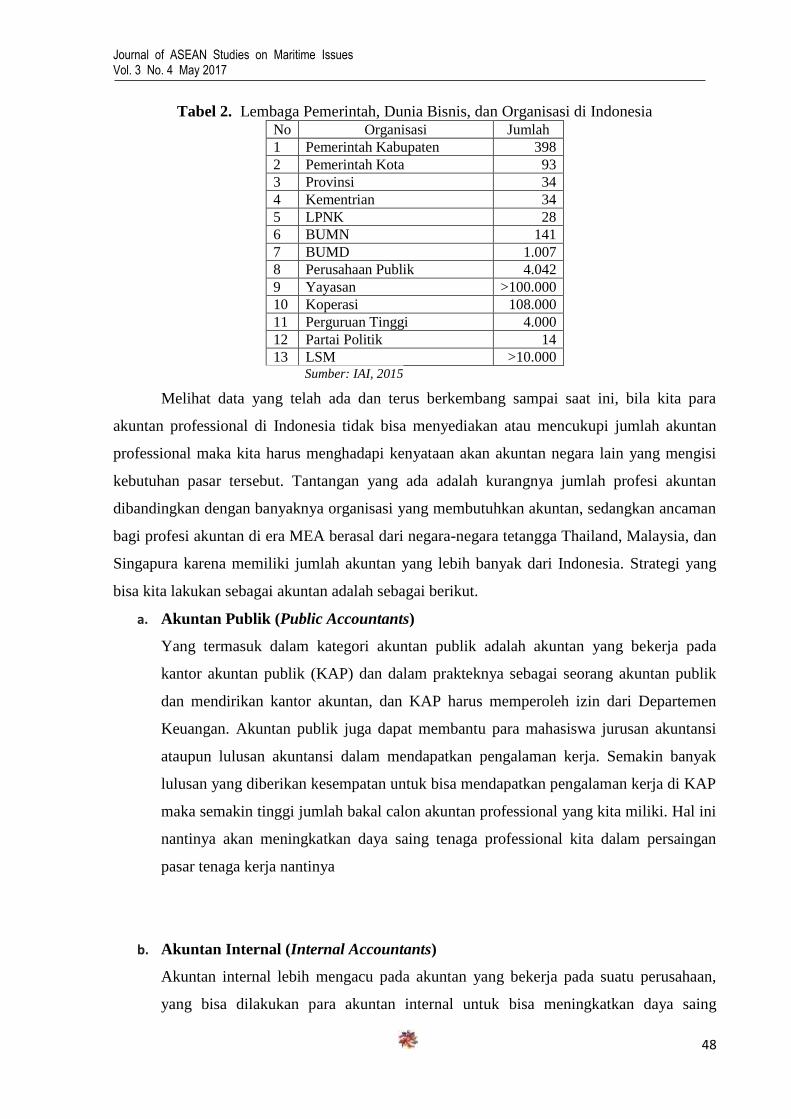
Journal of ASEAN Studies on Maritime Issues Vol. 3 No. 4 May 2017
48
Tabel 2. Lembaga Pemerintah, Dunia Bisnis, dan Organisasi di Indonesia No Organisasi Jumlah
1 Pemerintah Kabupaten 398
2 Pemerintah Kota 93
3 Provinsi 34
4 Kementrian 34
5 LPNK 28
6 BUMN 141
7 BUMD 1.007
8 Perusahaan Publik 4.042
9 Yayasan >100.000
10 Koperasi 108.000
11 Perguruan Tinggi 4.000
12 Partai Politik 14
13 LSM >10.000 Sumber: IAI, 2015
Melihat data yang telah ada dan terus berkembang sampai saat ini, bila kita para
akuntan professional di Indonesia tidak bisa menyediakan atau mencukupi jumlah akuntan
professional maka kita harus menghadapi kenyataan akan akuntan negara lain yang mengisi
kebutuhan pasar tersebut. Tantangan yang ada adalah kurangnya jumlah profesi akuntan
dibandingkan dengan banyaknya organisasi yang membutuhkan akuntan, sedangkan ancaman
bagi profesi akuntan di era MEA berasal dari negara-negara tetangga Thailand, Malaysia, dan
Singapura karena memiliki jumlah akuntan yang lebih banyak dari Indonesia. Strategi yang
bisa kita lakukan sebagai akuntan adalah sebagai berikut.
a. Akuntan Publik (Public Accountants)
Yang termasuk dalam kategori akuntan publik adalah akuntan yang bekerja pada
kantor akuntan publik (KAP) dan dalam prakteknya sebagai seorang akuntan publik
dan mendirikan kantor akuntan, dan KAP harus memperoleh izin dari Departemen
Keuangan. Akuntan publik juga dapat membantu para mahasiswa jurusan akuntansi
ataupun lulusan akuntansi dalam mendapatkan pengalaman kerja. Semakin banyak
lulusan yang diberikan kesempatan untuk bisa mendapatkan pengalaman kerja di KAP
maka semakin tinggi jumlah bakal calon akuntan professional yang kita miliki. Hal ini
nantinya akan meningkatkan daya saing tenaga professional kita dalam persaingan
pasar tenaga kerja nantinya
b. Akuntan Internal (Internal Accountants)
Akuntan internal lebih mengacu pada akuntan yang bekerja pada suatu perusahaan,
yang bisa dilakukan para akuntan internal untuk bisa meningkatkan daya saing

Journal of ASEAN Studies on Maritime Issues Vol. 3 No. 4 May 2017
49
akuntan professional di Indonesia adalah dengan mengikuti pengembangan
professional yang disediakan oleh asosiasi akuntan di Indonesia. Dengan memiliki soft
skill yang lebih maka akan memberikan mereka nilai lebih dalam perusahaan. Hal ini
guna mencegah perusahaan agar tidak menggunakan tenaga akuntan professional dari
negara lain. Selain itu, hubungan perusahaan dengan pihak luar perusahaan antar
negara bisa menjadi jembatan yang membuka relasi antar perusahaan dan bahkan bisa
membuka peluang bagi akuntan professional kita untuk bisa masuk ke dalam pasar
tenaga kerja professional negara lain.
c. Akuntan Pemerintah (Government Accountants)
Akuntan pemerintah adalah akuntan yang bekerja pada lembaga-lembaga pemerintah,
misalnya di kantor Badan Pengawas Keuangan dan Pembangunan (BPKP), Badan
Pengawas Keuangan (BPK), serta pada satuan kerja perangkat daerah yang bertugas
sebagai penyusun laporan keuangan ataupun sebagai pemeriksa laporan keuangan
pemerintah, sesuai dengan luas bidang kerja yang telah ditetapkan. Peran akuntan
pemerintah dalam strategi memenangkan persaingan adalah dengan mengembangkan
potensi yang dimiliki serta menjaga integritas dalam menjalankan tugasnya.
d. Akuntan Pendidik
Akuntan pendidik adalah akuntan yang bertugas dalam pendidikan akuntansi,
melakukan
penelitian dan pengembangan akuntansi, mengajar, dan menyusun kurikulum
pendidikan
akuntansi di perguruan tinggi. Akuntan pendidik memiliki peran yang sangat besar
bagi akuntan generasi selanjutnya, hal ini dikarenakan peran akuntan pendidik
sangatlah besar dalam mempersiapkan mahasiswa akuntansi untuk bisa menjadi
professional di bidangnya. Penanaman soft skills yang berkualitas di dalam diri
mahasiswa akuntansi, pembentukan karakter yang berintegritas, serta mempersiapkan
mental para mahasiswa untuk menjadi professional yang baik semuanya diawali dari
akuntan pendidik. Strategi yang bisa dilakukan oleh para akuntan pendidik adalah
dengan ikut mengembangkan kemampuan dirinya juga serta mentransferkannya
kepada anak didiknya.
Jika kita perhatikan kembali akan banyaknya jumlah akuntan yang ada, dibandingkan
dengan jumlah lapangan kerja potensional bagi profesi akuntan dalam Lembaga pemerintah,
dunia bisnis, dan organisasi. Perbandingannya adalah sebesar 24.587 : 226.780 atau 1 : 9. Hal
ini berarti, seorang akuntan professional memiliki peluang untuk bisa bekerja dalam Sembilan

Journal of ASEAN Studies on Maritime Issues Vol. 3 No. 4 May 2017
50
lapangan kerja potensional bagi profesi akuntan yang tersebar dalam Lembaga pemerintah,
dunia bisnis, dan organisasi. Potensi yang masih sangat besar ini akan sangat menarik bagi
akuntan professional yang berasal dari negara tetangga untuk masuk dalam persaingan kita
nantinya, jika saja kita tidak mempersiapkan diri kita sebaik mungkin untuk bersaing dalam
Era MEA.
Pengembangan diri, peningkatan soft skills, membangun jaringan kerja dengan
pengusaha, pemerintah, dan bahkan antara mahasiswa akuntansi dengan KAP dan organisasi
bisnis juga perlu kita kembangkan agar bisa meningkatkan jumlah akuntan professional di
Indonesia. Membangunkan generasi selanjutnya akan pentingnya mereka mempersiapkan diri
mereka dalam persaingan tenaga kerja nantinya juga perlu demi menjaga daya saing profesi
akuntan di Era MEA. Mahasiswa akuntansi adalah bibit akuntan professional Indonesia di
masa depan, kita tidak perlu khawatir akan persaingan profesi akuntan di era MEA jika kita
bisa menjamin bertambahnya lulusan akuntansi yang berkualitas dan memiliki mental yang
kuat serta berintegritas.
KESIMPULAN
MEA sudah disepakati, beberapa keputusannya membuka peluang bagi tenaga
professional ASEAN untuk bisa bekerja di antara negara-negara ASEAN. Sudah terlambat
bagi kita untuk mempertanyakan lagi mengenai kesepakatan tersebut, tetapi belum terlambat
bagi kita untuk menentukan sikap dalam mempersiapkan diri menghadapi MEA. Strategi-
strategi yang bisa kita lakukan untuk mempersiapkan diri dalam menghadapi MEA adalah
dengan mengembangkan kemampuan diri kita (soft skills), mengembangkan kompetensi yang
kita miliki, mengembangkan relasi kita (networking), memiliki integritas yang tinggi dalam
pekerjaan professional kita, serta membangun mental diri kita dalam menghadapi persaingan.
Semua ini harus dilakukan secara berkesinambungan antara pemerintah, pelaku bisnis,
professional, dan asosiasi profesi yang ada agar supaya bisa memenangkan persaingan di era
MEA.
Journal of ASEAN Studies on Maritime Issues Vol. 3 No. 4 May 2017
51
DAFTAR PUSTAKA
Avianti, I. 2015. Peluang dan Tantangan Akuntan di Era MEA. Simposium Nasional
Akuntansi (SNA) XVIII, Medan.
Triani, N., Nyoman, A., Erlina, D., dan Merlyana D.Y., 2015. Kesiapan Profesi Akuntan di
Indonesia dalam Menghadapi MEA. Syariah Paper Accounting FEB UMS, 612-625.
Martani, D. 2016. Profesi Akuntan dalam Menghadapi MEA. Majalah UI, Universitas
Indonesia, 36-39.
Putri, D.P.S. 2016. Akuntan dalam Memenangkan Persaingan di Era MEA. Prosiding
Seminar Ilmiah Nasional, 185-199.

Journal of ASEAN Studies on Maritime Issues Vol. 3 No. 4 May 2017
52
EVALUATING SERVICESCAPE OF THE PREMIERE CINEPLEX 21
GROUP IN MANADO TOWN SQUARE 3 USING IMPORTANCE AND
PERFORMANCE ANALYSIS
Farlane S. Rumokoy1 and George G. Sumampouw
2
International Business Administration, Management Program, Faculty of Economics and Business,
University of Sam Ratulangi Manado, North Sulawesi, 95115, Indonesia.
email: [email protected],
ABSTRACT
As a part of ASEAN, Indonesia should be ready to face the open competition in ASEAN Economic
Community. As a country with big number of population Indonesia of course considered as a
promising goal for foreign company that intent on expand their business. Appearanced of The
Premiere movie theaters in Manado become a phenomena although this kind of movie theater already
introduced by other company that provide premium movie theater. This research aims to evaluate the
servicescape of The Premiere Cineplex 21 Group in Manado Town Square 3. Type of this research is
descriptive with quantitative approach and IPA used as the measurement tool. The sample size of this
research is 100 respondents who already experience watching movie in The Premiere Cineplex 21
Group in Manado Town Square 3. Convenience sampling was used to collecting data through online
questionnaire.The result, the servicescape of The Premiere Cineplex 21 Group in Manado Town
Square 3 shows, the cleanliness of the toilet attribute located in Quadrant 2. On the other hand, electric
seats inside the studio attribute placed in Quadrant 3 on IPA chart about servicescape of The Premiere
Cineplex 21 Group in Manado Town Square 3. The Premiere needs to improve all of them in order to
keep the market share they have already created otherwise to keep satisfying their customers, and
creating further repatronage intention.
Keywords: Cineplex 21 group, importance and performance analysis, leisure service setting
servicescape, the premiere
INTRODUCTION
Research Background
As a part of ASEAN, Indonesia should be ready to face the open competition in
ASEAN Economic Community. As a country with big number of population Indonesia of
course considered as a promising goal for foreign company that intent on expand their
business. To survive in this global era local company should prepare to strengthen their
products or services in order to be more competitive and suitable to compete with foreign
company which bring their best product to expand their business in ASEAN Countries.
On movie theater industy Indonesia has Cineplex 21 Group as a local company that
entered this industry since 1987. Cineplex 21 Group bring new concept of movie theater that
was intoduced on 1987, Cineplex 21 group brought a concept that provide more than one
screen in one movie theater (cineplex). Lately, there are many company that enter this
industry and remove the opinion that Cineplex 21 Group monopolize this Industry.
Journal of ASEAN Studies on Maritime Issues Vol. 3 No. 4 May 2017
53
Appearanced of some movie theater group in Indonesia of course impacted the market share
distribution. Manado is one of the city that bordering with other country which is Philippines.
In manado there are three group of movie theater exist. Those three are Cineplex 21
Group, Cinemaxx, and the latest is CGV cinemas. Cineplex 21 Group be the first that entering
market in Manado by be the part of Manado Town Square (MANTOS) with the Cinema 21
and currently change into Cinema XXI, this group also be the part of MEGAMALL Manado
with the same product that is Cinema XXI. Not only Cinema XXI, Cineplex 21 Group once
again strenghtened their posistion in manado by joining the MANTOS 3 with Cinema XXI
and introducing new product that is The Premiere in local market. The Premiere is a premium
product of Cineplex 21 Group that targeting the premium customers that looking for luxury
facilities and have high level of satisfaction.
Servicescapes play an important role in determining whether or not spectators are
satisfied, which in turn may influence how long they desire to stay in the facility and whether
they intend to re-patronize the leisure facility (Dhurup, Mofoka, and Surujlal,
2010).According the statistical data there are a gap between the market share of the Cineplex
21 Group before and after the CGV Cinemas and Cinemaxx established their business in
Indonesia. The decreasing number of market share of Cineplex 21 Group of course comes
from their three products which are: XXI, The Premiere, and IMAX. The performance of the
servicescape is an important factor that can be measured to know.
Research Objective
1. To evaluate the importance of servicescape of The Premiere Cineplex 21 Group on
Manado Town Square 3.
2. To evaluate the performance of servicescape of The Premiere Cineplex 21 Group on
Manado Town Square 3.
THEORETICAL FRAMEWORK
Marketing
Marketing is about identifying and meeting human and social needs. Kotler and Keller
defined marketing as an organizational function and a set of processes for creating,
communicating, and delivering value to customer and for managing customer relationship in
ways that benefit the organization and its stakeholder (Kotler and Keller, 2009).
Servicescape
Servicescape is considered as “the environment in which the service is assembled and
in which the seller and customer interact, combined with tangible commodities that facilitate
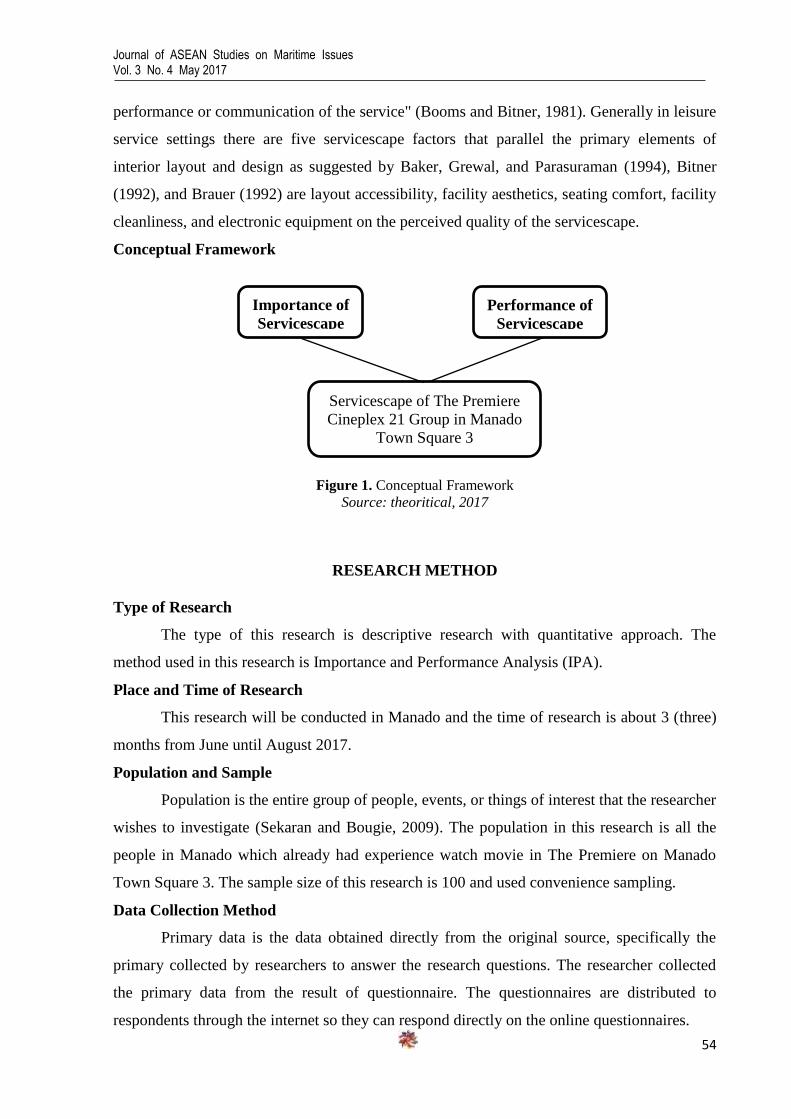
Journal of ASEAN Studies on Maritime Issues Vol. 3 No. 4 May 2017
54
performance or communication of the service" (Booms and Bitner, 1981). Generally in leisure
service settings there are five servicescape factors that parallel the primary elements of
interior layout and design as suggested by Baker, Grewal, and Parasuraman (1994), Bitner
(1992), and Brauer (1992) are layout accessibility, facility aesthetics, seating comfort, facility
cleanliness, and electronic equipment on the perceived quality of the servicescape.
Conceptual Framework
Figure 1. Conceptual Framework
Source: theoritical, 2017
RESEARCH METHOD
Type of Research
The type of this research is descriptive research with quantitative approach. The
method used in this research is Importance and Performance Analysis (IPA).
Place and Time of Research
This research will be conducted in Manado and the time of research is about 3 (three)
months from June until August 2017.
Population and Sample
Population is the entire group of people, events, or things of interest that the researcher
wishes to investigate (Sekaran and Bougie, 2009). The population in this research is all the
people in Manado which already had experience watch movie in The Premiere on Manado
Town Square 3. The sample size of this research is 100 and used convenience sampling.
Data Collection Method
Primary data is the data obtained directly from the original source, specifically the
primary collected by researchers to answer the research questions. The researcher collected
the primary data from the result of questionnaire. The questionnaires are distributed to
respondents through the internet so they can respond directly on the online questionnaires.
Servicescape of The Premiere
Cineplex 21 Group in Manado
Town Square 3
Importance of
Servicescape
Performance of
Servicescape
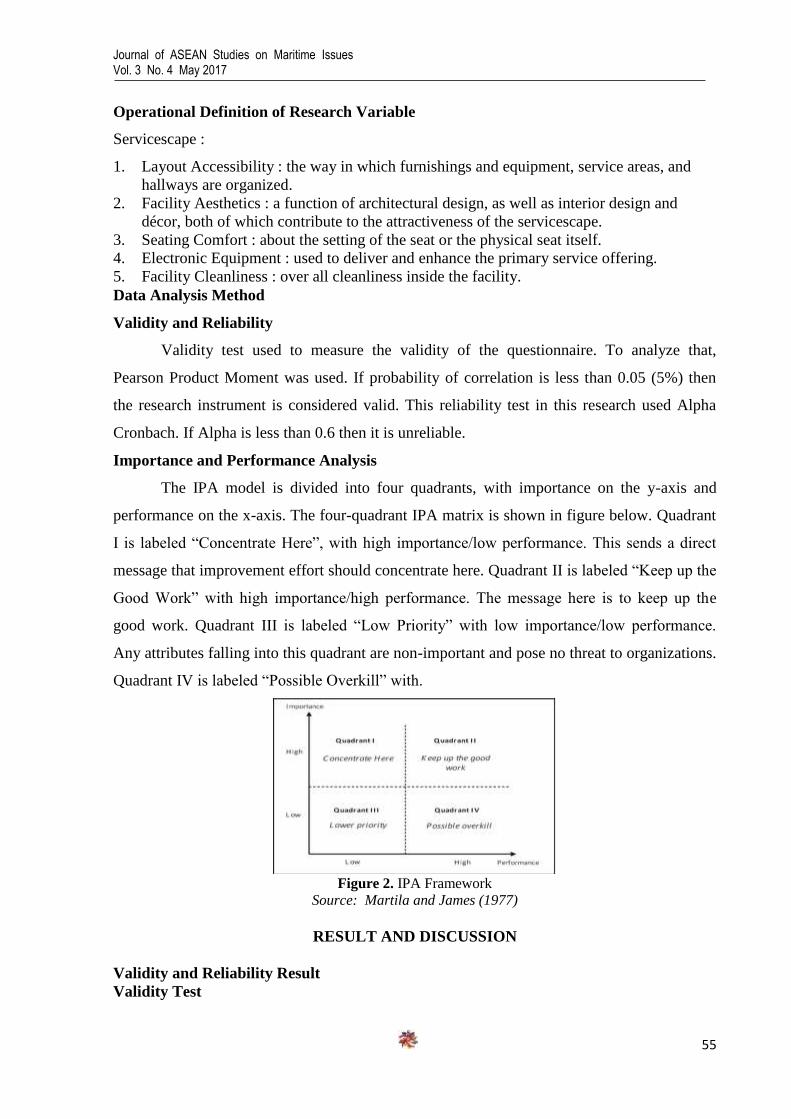
Journal of ASEAN Studies on Maritime Issues Vol. 3 No. 4 May 2017
55
Operational Definition of Research Variable
Servicescape :
1. Layout Accessibility : the way in which furnishings and equipment, service areas, and
hallways are organized.
2. Facility Aesthetics : a function of architectural design, as well as interior design and
décor, both of which contribute to the attractiveness of the servicescape.
3. Seating Comfort : about the setting of the seat or the physical seat itself.
4. Electronic Equipment : used to deliver and enhance the primary service offering.
5. Facility Cleanliness : over all cleanliness inside the facility.
Data Analysis Method
Validity and Reliability
Validity test used to measure the validity of the questionnaire. To analyze that,
Pearson Product Moment was used. If probability of correlation is less than 0.05 (5%) then
the research instrument is considered valid. This reliability test in this research used Alpha
Cronbach. If Alpha is less than 0.6 then it is unreliable.
Importance and Performance Analysis
The IPA model is divided into four quadrants, with importance on the y-axis and
performance on the x-axis. The four-quadrant IPA matrix is shown in figure below. Quadrant
Ι is labeled “Concentrate Here”, with high importance/low performance. This sends a direct
message that improvement effort should concentrate here. Quadrant II is labeled “Keep up the
Good Work” with high importance/high performance. The message here is to keep up the
good work. Quadrant III is labeled “Low Priority” with low importance/low performance.
Any attributes falling into this quadrant are non-important and pose no threat to organizations.
Quadrant IV is labeled “Possible Overkill” with.
Figure 2. IPA Framework
Source: Martila and James (1977)
RESULT AND DISCUSSION
Validity and Reliability Result
Validity Test
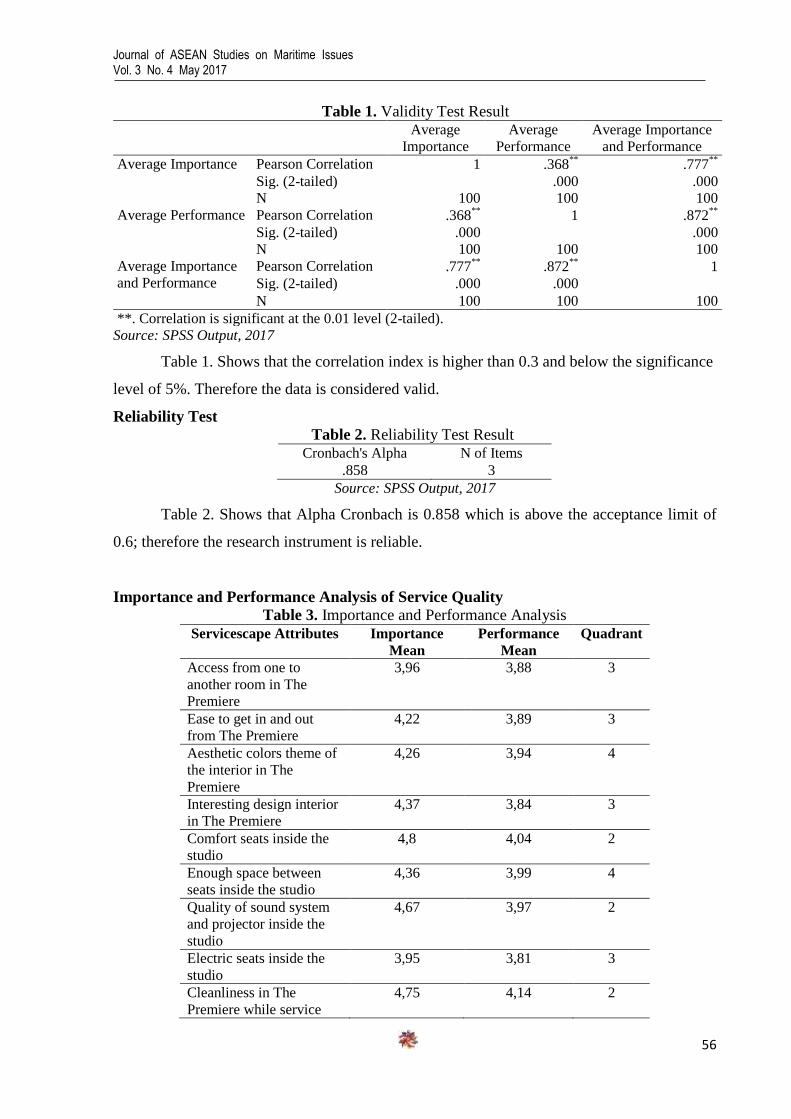
Journal of ASEAN Studies on Maritime Issues Vol. 3 No. 4 May 2017
56
Table 1. Validity Test Result
Average
Importance
Average
Performance
Average Importance
and Performance
Average Importance Pearson Correlation 1 .368**
.777**
Sig. (2-tailed) .000 .000
N 100 100 100
Average Performance Pearson Correlation .368**
1 .872**
Sig. (2-tailed) .000 .000
N 100 100 100
Average Importance
and Performance
Pearson Correlation .777**
.872**
1
Sig. (2-tailed) .000 .000
N 100 100 100
**. Correlation is significant at the 0.01 level (2-tailed).
Source: SPSS Output, 2017
Table 1. Shows that the correlation index is higher than 0.3 and below the significance
level of 5%. Therefore the data is considered valid.
Reliability Test Table 2. Reliability Test Result
Cronbach's Alpha N of Items
.858 3
Source: SPSS Output, 2017
Table 2. Shows that Alpha Cronbach is 0.858 which is above the acceptance limit of
0.6; therefore the research instrument is reliable.
Importance and Performance Analysis of Service Quality
Table 3. Importance and Performance Analysis
Servicescape Attributes Importance
Mean
Performance
Mean
Quadrant
Access from one to
another room in The
Premiere
3,96 3,88 3
Ease to get in and out
from The Premiere
4,22 3,89 3
Aesthetic colors theme of
the interior in The
Premiere
4,26 3,94 4
Interesting design interior
in The Premiere
4,37 3,84 3
Comfort seats inside the
studio
4,8 4,04 2
Enough space between
seats inside the studio
4,36 3,99 4
Quality of sound system
and projector inside the
studio
4,67 3,97 2
Electric seats inside the
studio
3,95 3,81 3
Cleanliness in The
Premiere while service
4,75 4,14 2

Journal of ASEAN Studies on Maritime Issues Vol. 3 No. 4 May 2017
57
activity going on
Cleanliness of the toilet 4,75 4,18 2
Average 4,4 4,0
Source: SPSS Output, 2017
Table 3 shows that the Importance (Y) of the comfort seats inside the studio is the
highest mean with = 4,8. And the lowest is importance of electric seats inside the studio with
= 3,95. Meanwhile the performance of cleanliness of the toilet has the highest mean which is
=4,18. and the lowest mean comes from the performance of electric seats inside the studio
= 3,81.
Discussion
This research has identified fifteen attributes for the servicescape at The Premiere
Cineplex 21 Group in Manado Town Square 3, those attributes are: access from one to
another room in The Premiere, ease to get in and out from The Premiere, aesthetics colors
theme of the interior in The Premiere, interesting design interior in The Premiere, comfort
seat inside the studio, enough space between seats inside the studio, quality of sound system
and projector inside the studio, electric seats inside the studio, cleanliness in The Premiere
while service activity is going on, and cleanliness of the toilet.
In this study, the result shows that the importance of the comfort seat inside the studio
is the most important compared to the other attributes, followed by cleanliness of the toilet,
cleanliness in The Premiere, quality of sound system and projector, the interesting design of
interior in The Premiere, space between seats inside the studio, aesthetic colors theme of the
interior in The Premiere, ease to get in and out of The Premiere, access from one to another
room, and importance of electic seats inside the studio is the lowest level of importance based
on the collected data.
While in terms of performance, the performance of cleanliness of the toilet it has the
highest level of performance, followed by the cleanliness in The Premiere, comfort seats in
the studio, enough space between seats inside the studio, quality of sound system and
projector inside the studio, aesthetic colors theme of the interior in The Premiere, ease to get
in and out from The Premiere, access from one to another room, interesting design interior of
The Premiere, and the lowest level of performance comes from the performance of electric
seats inside the studio
CONCLUSION AND RECOMMENDATION
Conclusion

Journal of ASEAN Studies on Maritime Issues Vol. 3 No. 4 May 2017
58
The conclusion below are drawn using IPA tools to link the importance and
performance value. The Result servicescape of The Premiere Cineplex 21 Group in Manado
Town Square 3 are Comfort seats inside the studio, cleanliness in The Premiere while service
activity going on, and cleanliness of the toilet was performed well by the management and it
was important attributes from customers point of view. In Quadrant 1 there is one attributes
located in this quadrant that is Quality of sound system and projector inside the studio. In
Quadrant 3 there are six attributes that has low importance and low performance, those are:
access from one to another room that support the service activity, ease to get in and out from
The Premiere, interesting design interior in The Premiere, enough space between seats,
aesthetic colors theme of the interior in The Premiere and electric seats inside the studio. And
in Quadrant 4 there is no attributes that has low importance and high performance.
Recommendation
The researcher provided recommendation to the company in order to improve the Service
Quality even deliver a worth price based on the result above. The recommendation is listed as
follows:
1. For the servicescape‟s attributes which got score lower the average, The Premiere needs
to improve all of them in order to keep the market share they have already created
otherwise to keep satisfying their customers, and creating further repatronage intention.
2. For all the servicescape attributes that have scored higher the average level of importance
and performance, means the company already provides good performance to the
customers but still need to maintain their good performance and be consistent.
REFERENCES
Baker, J., Grewal, D., and Parasuraman, A. 1994. The influence of the store environment on
quality inferences and store image”, Journal of the Academy of Marketing Science, Vol.
22, Fall, pp. 328-39.
Bitner, M.J. 1992. Servicescape: The impact of physical Surroundings on customers and
Employees. Journal of Marketing” 57.
Booms, B.H. and Bitner, M.J. 1981. Marketing strategies and organization structure for
service firms, in Donnelly, J. and George, (Eds), Marketing of Services,
Chicago: American Marketing, pp.47-51.
Brauer, R.L. 1992. Facilities Planning: The User Requirements Method, AMACOM, New
York, NY.
Dhurup, M., Mofoka, M.A., and Surujlal, J. 2010. The relationship between stadium
sportscapes dimensions, desire to stay and future attendance. African Journal for
Physical,Health Education, Recreation and Dance (AJPHERD) Vol. 16, No. 3
(September) 2010, pp. 475-490.
Journal of ASEAN Studies on Maritime Issues Vol. 3 No. 4 May 2017
59
Fernandes, T. and Neves, S. 2007. The role of servicescape as a driver of customers value in
experience-centric service organizations: the Dragon Football Staium case. Journal
of Strateguc Management.
Hooper, D., Coughlan, J. and Mullen, M.R. 2013. The servicescape as an antecedent to
service quality and behavioral intentions, Journal of Services Marketing Volume 27,
Number 4, 271–280.
Kotler, P. and Keller, K.L. 2009. Marketing Management. Third Ten Edition. PT. Gelora
Aksara Pratama, Jakarta.
Martilla, J. and James, J. 1977. Importance-Performance Analysis. Journal of Marketing,
41(1), 77-79.
Sekaran,U and Bougie, R. 2009. Research Method for Business: A skill building approach,
5th
edition, A John Wiley and Sons Ltd: United Kingdom.
Wakefield, K.L. and Blodgett, J.G. 1996. The effect of the servicescape on customers
behavioral intentions in leisure service settings. Journal of Service Marketing, Vol.
10 No.6, pp 45-61.
Journal of ASEAN Studies on Maritime Issues Vol. 3 No. 4 May 2017
60
RELATIONSHIPS OF CAUSALITY FROM LEVEL OF EDUCATION, REVENUES,
AND CONSUMPTION TO THE QUANTITIES OF POOR PEOPLE IN THE
COASTAL BEACH IN CITY OF BITUNG IN AEC FREE COMPETITION
Sifrid S. Pangemanan
International Business Administration, Faculty of Economics and Business
Sam Ratulangi University, Manado 95115, Indonesia
E-mail: [email protected]
ABSTRACT
Poverty is a complex issue that is influenced by various interrelated factors, including the level of
people's income, unemployment, health, education, access to goods and services, location, geography,
and environment. The high level of poverty in North Sulawesi, indicated by the large number of poor
people, shows the development process that has not been able to improve the welfare of its people.
This study aims to analyze the direct and indirect effects of the average length of schooling, per capita
GRDP, and per capita expenditure on the number of poor people in North Sulawesi City in 2017. The
method of analysis in this study using path analysis using cross-district data in North Sulawesi in 2017
with the help of SPSS program application. Based on the results of data analysis found that education
has a significant effect both directly and through income and consumption of the number of poor
people, although the influence is still weak.
Keywords: Consumption, education, income, poverty
INTRODUCTION
In order to enter the ASEAN Economic Community (MEA) where free competition
will be a challenge as well as opportunities for economic development. Like many nations and
countries in ASEAN, Indonesia makes poverty alleviation a priority program in the effort to
improve people's welfare. Various kinds of subsidies, village funding, rural infrastructure
development, MSME development, lending to agriculture and financial inclusion programs,
rice programs for the poor, and mission-aiming scholarships are among programs intended to
help alleviate poverty in Indonesia.
One way of alleviating poverty is with development aimed at improving people's
welfare. Measures of development success can be seen from economic growth, economic
structure, and the smaller income gap between populations, between regions and between
sectors. The main objectives of economic development efforts besides creating equal growth,
should also eliminate or reduce poverty, income disparities, and unemployment rates (Todaro,
2000). Therefore, the priority of development is to eliminate poverty. Poverty is a complex
issue that is influenced by various interrelated factors, including the level of people's income,
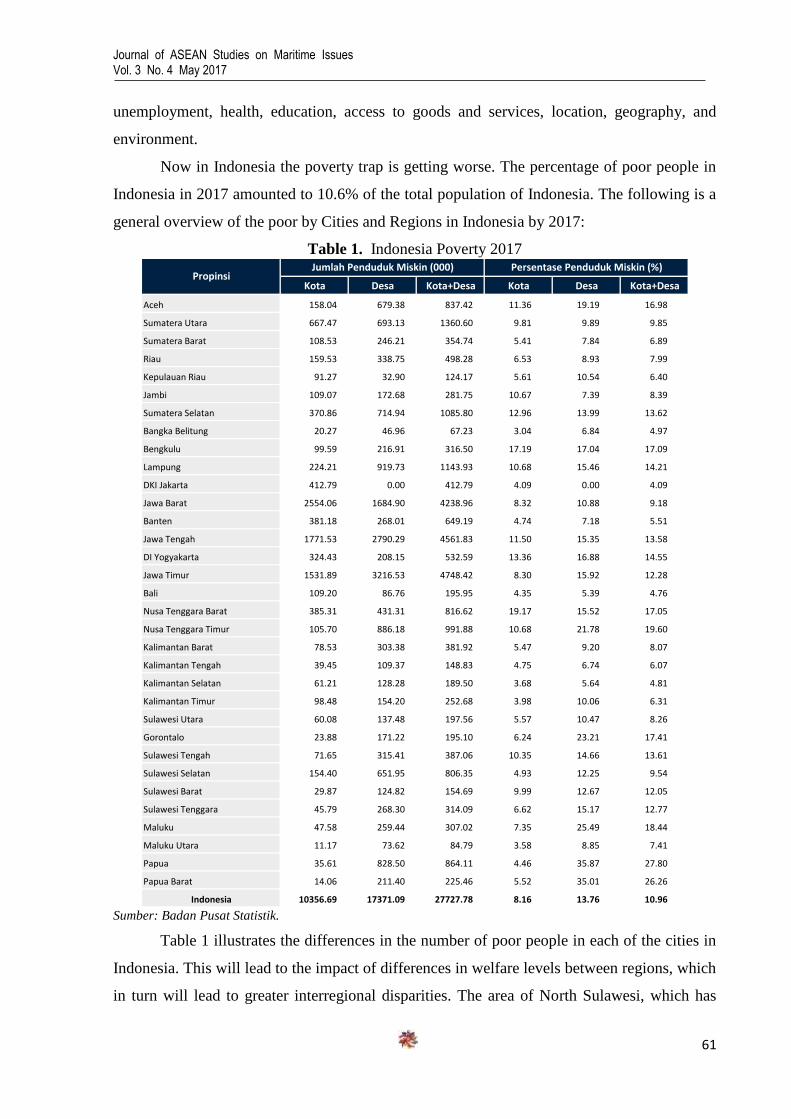
Journal of ASEAN Studies on Maritime Issues Vol. 3 No. 4 May 2017
61
unemployment, health, education, access to goods and services, location, geography, and
environment.
Now in Indonesia the poverty trap is getting worse. The percentage of poor people in
Indonesia in 2017 amounted to 10.6% of the total population of Indonesia. The following is a
general overview of the poor by Cities and Regions in Indonesia by 2017:
Table 1. Indonesia Poverty 2017
Kota Desa Kota+Desa Kota Desa Kota+Desa
Aceh 158.04 679.38 837.42 11.36 19.19 16.98
Sumatera Utara 667.47 693.13 1360.60 9.81 9.89 9.85
Sumatera Barat 108.53 246.21 354.74 5.41 7.84 6.89
Riau 159.53 338.75 498.28 6.53 8.93 7.99
Kepulauan Riau 91.27 32.90 124.17 5.61 10.54 6.40
Jambi 109.07 172.68 281.75 10.67 7.39 8.39
Sumatera Selatan 370.86 714.94 1085.80 12.96 13.99 13.62
Bangka Belitung 20.27 46.96 67.23 3.04 6.84 4.97
Bengkulu 99.59 216.91 316.50 17.19 17.04 17.09
Lampung 224.21 919.73 1143.93 10.68 15.46 14.21
DKI Jakarta 412.79 0.00 412.79 4.09 0.00 4.09
Jawa Barat 2554.06 1684.90 4238.96 8.32 10.88 9.18
Banten 381.18 268.01 649.19 4.74 7.18 5.51
Jawa Tengah 1771.53 2790.29 4561.83 11.50 15.35 13.58
DI Yogyakarta 324.43 208.15 532.59 13.36 16.88 14.55
Jawa Timur 1531.89 3216.53 4748.42 8.30 15.92 12.28
Bali 109.20 86.76 195.95 4.35 5.39 4.76
Nusa Tenggara Barat 385.31 431.31 816.62 19.17 15.52 17.05
Nusa Tenggara Timur 105.70 886.18 991.88 10.68 21.78 19.60
Kalimantan Barat 78.53 303.38 381.92 5.47 9.20 8.07
Kalimantan Tengah 39.45 109.37 148.83 4.75 6.74 6.07
Kalimantan Selatan 61.21 128.28 189.50 3.68 5.64 4.81
Kalimantan Timur 98.48 154.20 252.68 3.98 10.06 6.31
Sulawesi Utara 60.08 137.48 197.56 5.57 10.47 8.26
Gorontalo 23.88 171.22 195.10 6.24 23.21 17.41
Sulawesi Tengah 71.65 315.41 387.06 10.35 14.66 13.61
Sulawesi Selatan 154.40 651.95 806.35 4.93 12.25 9.54
Sulawesi Barat 29.87 124.82 154.69 9.99 12.67 12.05
Sulawesi Tenggara 45.79 268.30 314.09 6.62 15.17 12.77
Maluku 47.58 259.44 307.02 7.35 25.49 18.44
Maluku Utara 11.17 73.62 84.79 3.58 8.85 7.41
Papua 35.61 828.50 864.11 4.46 35.87 27.80
Papua Barat 14.06 211.40 225.46 5.52 35.01 26.26
Indonesia 10356.69 17371.09 27727.78 8.16 13.76 10.96
PropinsiJumlah Penduduk Miskin (000) Persentase Penduduk Miskin (%)
Sumber: Badan Pusat Statistik.
Table 1 illustrates the differences in the number of poor people in each of the cities in
Indonesia. This will lead to the impact of differences in welfare levels between regions, which
in turn will lead to greater interregional disparities. The area of North Sulawesi, which has

Journal of ASEAN Studies on Maritime Issues Vol. 3 No. 4 May 2017
62
been relatively more developed compared to other regions, is not separated from the problem
of poverty. In 2017, North Sulawesi has a fairly poor population of 8.26% of the population of
North Sulawesi.
Table 2. Povery Number in North Sulawesi Province Based on Region
Kabupaten/Kota Jumlah Penduduk Miskin menurut Kabupaten/Kota (Ribu Jiwa)
2003 2004 2005 2006 2007 2008 2010 2011 2012 2013
Bolaang Mongondow
50.4 45.4 52.9 65.1 39.6 32.5 20.8 18.6 17.1 20.2
Minahasa 41.4 45.96 23.8 29.7 30.5 27.1 27.9 24.9 22.9 28.5
Kepulauan Sangihe 25.5 24.85 29 33.8 23.2 18.4 16.7 14.9 13.6 15.7
Kepulauan Talaud 11.2 10.86 10.1 11.7 11.9 9.7 9.5 8.5 7.8 9
Minahasa Selatan 25.1 26.82 31.3 7.3 24.9 21.4 21 18.8 17.3 20.4
Minahasa Utara - - 12.8 17.5 17.5 14.7 15.8 14.1 12.9 15.7
Bolaang Mongondow Utara
- - - - 10.4 8.4 7.2 6.4 5.9 7.2
Kepulauan Sitaro - - - - 9.9 7.9 7.5 6.7 6.1 7.4
Minahasa Tenggara - - - - 21 17.5 17.7 15.8 14.6 16.6
Bolaang Mongondow Selatan
- - - - - - 10.7 9.6 - 9.2
Bolaang Mongondow Timur
- - - - - - 5 4.5 4.1 4.6
Kota Manado 17.5 17.25 21.2 28.1 23 28.5 25.1 22.4 20.5 20.5
Bitung 14.7 14.67 15 19 19.4 16.8 18 16.1 14.6 12.9
Kota Tomohon 5.9 6.35 5.3 7.1 7 6.3 6.8 6.1 5.6 6.4
Kota Kotamobagu - - - - 11.8 9 8.1 7.2 6.6 6.9
Sulawesi Utara 191.
6 192.2
201.4
249.4
250.1
218.2
217.8
194.7
177.4 201.
1 Sumber: Badan Pusat Statistik.
According to Table 2 the number and percentage of poor people in the period 2003 -
2013 has increased from year to year. In the period 2003-2010 the number of poor people
increased due to the economic crisis, from 191.6 million people in 2003 to 217.8 million
people in 2010.
Quality education will produce quality and reliable educated people in accordance
with the needs of the era. People with their own abilities are expected to increase their
participation in various activities, so that in the future they can live more worthy lives. In this
context, education is a means to achieve that goal. Education is an important element of socio-
economic development and development of society. Where the high education of a person
will be able to sustain his life to be more feasible ie higher levels of income earned. This

Journal of ASEAN Studies on Maritime Issues Vol. 3 No. 4 May 2017
63
means showing the direct correlation of the level of education to income, ie the higher the
level of education the higher the income.
Revenue of a region can be measured from GRDP per capita. GRDP per capita is
PDRB divided by population. GRDP per capita is often used as an indicator of development.
The higher the PDRB per capita of a region, the greater the potential of the region's revenue
source due to the greater income of the area (Thamrin, 2001). This also means that the higher
the per capita GRDP per population of a region can be demonstrated by the high level of
consumption as measured by per capita expenditure. In other words, the number of poor
people will decrease.
Then the relationship between education and consumption. One component of the total
cost of consumption is the cost of education, which is classified as non-food and beverage
consumption. This means that the higher the level of education, the higher the cost of
consumption to be spent, the lower. Therefore, it is clear that income and consumption have a
direct influence on poverty, it can be argued that education levels actually also have an
indirect effect on poverty levels through income and consumption factors.
Definition of Poverty
The poverty cycle is a series that interacts with each other in such a way that it
creates a state where a country will remain poor and will experience many difficulties to
achieve a better level of development. Low investment results in backwardness and so on.
This logic of thought was put forward by Ragnar Nurkse 1953 which states "a poor country is
poor because it is poor".
Figure 1. Poverty Cyrcle Baldwin dan Meier
Sumber: Mudrajat Kuncoro, 1997
According to Nurkse there are two circles of poverty trap, namely in terms of supply
(supply) low income levels caused by low productivity levels cause the ability of people to

Journal of ASEAN Studies on Maritime Issues Vol. 3 No. 4 May 2017
64
save low. The ability to save low, cause low capital formation rate, low capital formation
(investment) causes a lack of capital, and thus the level of productivity is also low and so on.
In terms of demand, in poor countries the incentive to invest is very low, as the market for
various goods is limited, due to the very low public income. Community income is very low
due to low productivity levels, as a form of limited capital formation in the past. Limited
capital formation due to lack of stimulus to invest capital and so on.
Education
For the development of education in the National Development Program
(PROPENAS), GBHN 1999-2004 set the direction of education development policy as
follows:
1) To strive for expansion and equality of opportunity to obtain high quality education for all
Indonesian people towards the creation of high quality Indonesian human with significant
improvement of education budget.
2) Improving academic and professional skills and improve the welfare of educational
personnel so that educators are able to function optimally, especially in improving the
education of character and character in order to restore the authority of institutions and
educational personnel.
3) Renewal of the education system including curriculum renewal, in the form of curriculum
diversification to serve the diversity of learners, the preparation of curriculum applicable
nationally and locally in accordance with local interests, as well as diversify the type of
education in a professional manner.
4) Empowering educational institutions both schools and outside schools as a center for the
culture of values, attitudes, and abilities, and increase the participation of families and
communities supported by adequate facilities and infrastructure.
5) Reform and strengthen the national education system based on the principles of
decentralization, scientific autonomy and management.
6) Improving the quality of educational institutions organized by both the public and the
government to establish effective and efficient education system in facing the
development of science, technology, and art.
7) To develop the quality of human resources as early as possible directed, integrated and
comprehensive through various proactive and reactive efforts by all components of the
nation so that the young generation can develop optimally accompanied by the right of
support and protection in accordance with its potential.
RESEARCH METHOD

Journal of ASEAN Studies on Maritime Issues Vol. 3 No. 4 May 2017
65
Variable of Research and Definition of Operational Variable
This research uses two variables that are exogenous variable (exogenous variable) and
endogenous variable (endogenous variable).
1. Endogenous variable (endogenous variable)
Endogenous variables in this study is the number of poor people in the District/City
Coastal Coast Area in Bitung City North Sulawesi City in 2017.
2. Exogenous variable (exogenous variable)
Exogenous variables in this study are education level, income level, and consumption.
While the operational definition of each variable is as follows:
1. Poverty
According to the Central Bureau of Statistics (2010), the poor are residents who have
average per capita spending per month below the poverty line. For minimum food needs is
equalized with 2,100 kilo calories per capita per day. Non-food poverty line is minimum
requirement for housing (building floor area, use of clean water, and big sewer facility);
education (literacy rate, 9-year compulsory education, and drop-out rate); and health (low
consumption of nutritious food, lack of health facilities and inadequate sanitary and
environmental conditions). In this study the data used is the data of the number of poor people
in the Regency / City in the Coastal Coast in Bitung City, North Sulawesi City in 2017 (in
soul units).
2. Education
Education is measured from the average length of school. The average length of
school describes the number of years used by people aged 15 years and over in formal
education. The data used in this study is the average data on school length in the Regency /
City in the Coastal Coast in Bitung City, North Sulawesi City in 2017 (in years).
3. Revenue
Revenue is measured from GRDP per capita. GRDP per capita is PDRB divided by
population. The per capita GRDP data used is PDRB per capita in Kabuapaten / KotaDaerah
Coastal Coast in Bitung City of North Sulawesi City in 2017 based on 2000 constant prices
(in rupiah units).
4. Consumption
Consumption is measured from per capita expenditure. Per capita expenditure is
household expenditure consisting of food and non-food expenditure that can illustrate how the
population allocates household needs. Although the price between regions is different, but the

Journal of ASEAN Studies on Maritime Issues Vol. 3 No. 4 May 2017
66
value of household expenditure can still show differences in the level of welfare of the
inhabitants between cities, especially in terms of economy. The data used in this research is
per capita expenditure data in Regency / City of Coastal Area in Bitung City of North
Sulawesi City in 2017 (in rupiah units).
Types and Data Sources
The data in this study is secondary data in the form of cross section data from the
Regency / City in North Sulawesi 2017. Secondary data obtained from various related
agencies namely the Central Bureau of Statistics (BPS) and other sources of the journals and
the results research.
Analysis Method
To identify the factors affecting poverty in North Sulawesi in 2017 an analysis was
performed using the Path Analysis Model. The path analysis model is to analyze the pattern of
causal relationships between variables with the aim to determine the direct and indirect
influence, simultaneously or independently of several causal variables to the variables.
Figure 2. Path Analysis.
RESULT AND DISCUSSION
Data processing performed by SPSS program application yields correlation matrix
between variables and the magnitude of path coefficients as shown in Tables 3 and 4.
Interrelated Correlation Matrix
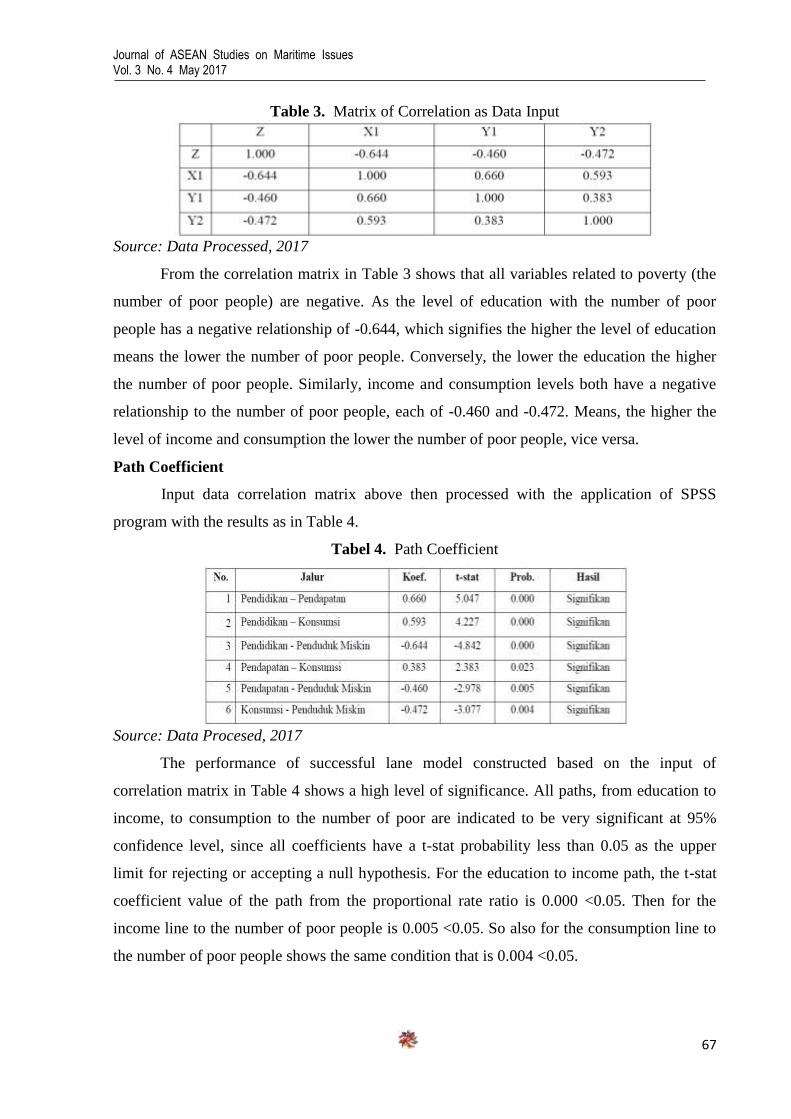
Journal of ASEAN Studies on Maritime Issues Vol. 3 No. 4 May 2017
67
Table 3. Matrix of Correlation as Data Input
Source: Data Processed, 2017
From the correlation matrix in Table 3 shows that all variables related to poverty (the
number of poor people) are negative. As the level of education with the number of poor
people has a negative relationship of -0.644, which signifies the higher the level of education
means the lower the number of poor people. Conversely, the lower the education the higher
the number of poor people. Similarly, income and consumption levels both have a negative
relationship to the number of poor people, each of -0.460 and -0.472. Means, the higher the
level of income and consumption the lower the number of poor people, vice versa.
Path Coefficient
Input data correlation matrix above then processed with the application of SPSS
program with the results as in Table 4.
Tabel 4. Path Coefficient
Source: Data Procesed, 2017
The performance of successful lane model constructed based on the input of
correlation matrix in Table 4 shows a high level of significance. All paths, from education to
income, to consumption to the number of poor are indicated to be very significant at 95%
confidence level, since all coefficients have a t-stat probability less than 0.05 as the upper
limit for rejecting or accepting a null hypothesis. For the education to income path, the t-stat
coefficient value of the path from the proportional rate ratio is 0.000 <0.05. Then for the
income line to the number of poor people is 0.005 <0.05. So also for the consumption line to
the number of poor people shows the same condition that is 0.004 <0.05.
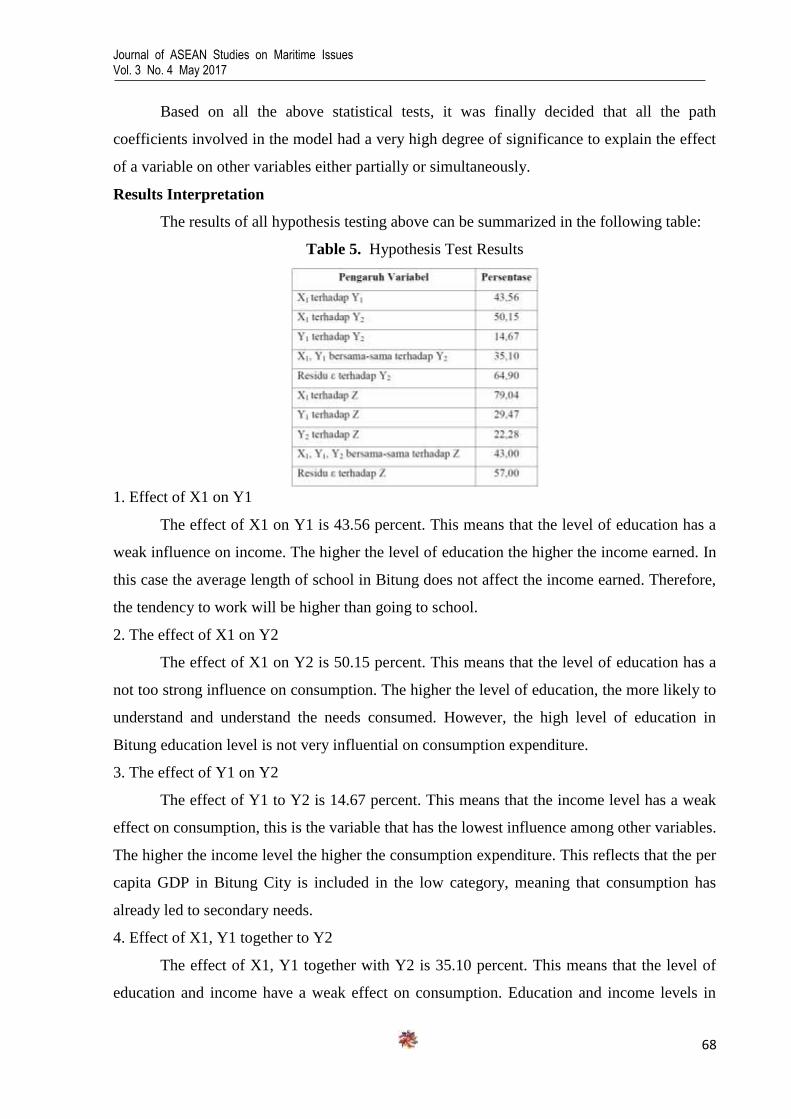
Journal of ASEAN Studies on Maritime Issues Vol. 3 No. 4 May 2017
68
Based on all the above statistical tests, it was finally decided that all the path
coefficients involved in the model had a very high degree of significance to explain the effect
of a variable on other variables either partially or simultaneously.
Results Interpretation
The results of all hypothesis testing above can be summarized in the following table:
Table 5. Hypothesis Test Results
1. Effect of X1 on Y1
The effect of X1 on Y1 is 43.56 percent. This means that the level of education has a
weak influence on income. The higher the level of education the higher the income earned. In
this case the average length of school in Bitung does not affect the income earned. Therefore,
the tendency to work will be higher than going to school.
2. The effect of X1 on Y2
The effect of X1 on Y2 is 50.15 percent. This means that the level of education has a
not too strong influence on consumption. The higher the level of education, the more likely to
understand and understand the needs consumed. However, the high level of education in
Bitung education level is not very influential on consumption expenditure.
3. The effect of Y1 on Y2
The effect of Y1 to Y2 is 14.67 percent. This means that the income level has a weak
effect on consumption, this is the variable that has the lowest influence among other variables.
The higher the income level the higher the consumption expenditure. This reflects that the per
capita GDP in Bitung City is included in the low category, meaning that consumption has
already led to secondary needs.
4. Effect of X1, Y1 together to Y2
The effect of X1, Y1 together with Y2 is 35.10 percent. This means that the level of
education and income have a weak effect on consumption. Education and income levels in
Journal of ASEAN Studies on Maritime Issues Vol. 3 No. 4 May 2017
69
Bitung City have no effect on consumption expenditure. High level of education and income
earned, consumption expenditure fixed for daily needs.
5. Effect of X1 on Z
The effect of X1 on Z is 79.04 percent, this is the variable that has the greatest
influence. This means that the level of education becomes the most dominant variable affect
the rise and fall of the number of poor people in the city of Bitung. Thus education in Bitung
is very important in poverty alleviation programs, because it is considered the most influential
factor on poverty in Bitung.
6. The effect of Y1 on Z
The effect of Y1 to Z is 29.47 percent. This means that the income level has a weak
influence on the number of poor people in Bitung. In Kota Bitung, income levels do not affect
the number of poor people. GDP per capita in Bitung is included in the low category, this
means the number of poverty is still high.
7. The effect of Y2 on Z
The effect of Y2 on Z is 22.28 percent. This means that the level of consumption has a
weak effect on the number of poor people in Bitung. The high level of consumption
expenditure does not affect the number of poor people.
8. The effect of X1, Y1, Y2 together on Z
The effect of X1, Y1, Y2 together on Z is 43.00 percent. This means that the level of
education, income, and consumption have a weak influence on the number of poor people in
Bitung. The higher the level of education the higher the income and the level of consumption
expenditure will increase, but the number of poor people is still high. Thus the level of
education, income and consumption together do not affect the number of poor people in the
city of Bitung.
CONCLUSIONS AND RECOMMENDATIONS
Conclusion
Based on the analysis that has been done in Chapter VI, the following conclusions are
obtained:
1. The hypothesis proposed completely can be accepted, because based on the path coefficient
test from X1 to Y1, X1 to Y2, Y1 to Y2, X1 to Z, Y1 to Z, and Y2 to Z are statistically
significant. This information gives an indication that:
- The average length of school affects GRDP per capita,
Journal of ASEAN Studies on Maritime Issues Vol. 3 No. 4 May 2017
70
- The average length of school affects per capita expenditure,
- GRDP per capita affects per capita expenditure,
- The average length of school affects the number of poor people,
- GDP per capita affect the number of poor people,
- Per capita expenditure affects the number of poor people.
2. Partially the strength of X1 determining Y1 changes is 43.56%. The strength of X1 which
directly determines Y2 changes is 35.16%, which through its relationship with Y1 is 14.99%.
Thus the effect of X1 to Y2 in total is 50.15%. Partially the Y1 power that determines Y2
changes is 14.67%. Together X1 and Y1 affect Y2 by 35.10%. The strength of X1 which
directly determines Z changes is 41.47%, which by its relationship with Y1 is 19.55%, and
which by its relationship with Y2 is 18.02%. Thus the effect of X1 to Z in total is 79.04%.
The power of Y1 which directly determines Z changes is 21.16%, which by its
relationship with Y2 is 8.31%. Thus the effect of Y1 to Z in total is 29.47%. Partially the
power Y2 determining Z changes is 22.28%. Together X1, Y1 and Y2 affect Z by 43%. Based
on the above analysis it is known that the variables that have a relatively large influence on
the number of poor people (Z) is the average of the average length of school (X1) or
education level, while the relatively small influence is the variable per capita expenditure
(Y2) or the level of consumption.
REFERENCES
Prasetyo, A.A. 2010. Analysis of Factors Affecting Poverty Level, Thesis, Faculty of
Economics, Diponegoro University of Semarang.
Daryanto, A. and Hafizrianda, Y. 2010. Quantitative Models for Regional Economic
Development Planning: Concepts and Applications, IPB Press.
Widiastuti, A. 2010. Analysis of Factors Affecting Poverty in Bitung in 2004-2008, Thesis,
Faculty of Economics, Diponegoro University, Semarang.
Somantri, A. and Ali Muhidin, A.A. 2006. Statistics application in research, Loyal Pustaka,
Bandung.
BPS of Bitung City. 2011. Poverty Profile in Bitung City Year 2011, Official News Statistics
No.37 / 07/33 / Th.5, July 1, 2011, Bitung. http //: www.bps.go.id.
Central Bureau of Statistics. 2010. Bitung In Figures 2010, Central Bureau of Statistics
Bitung, Semarang.
Central Bureau of Statistics. 2011. Poverty Profile in Indonesia March 2011, Official News
Statistics No.45 / 07 / Th.XIV, July 1, 2011, Jakarta. http //: www.bps.go.id
Central Bureau of Statistics. 2011. Progress of Some Key Social and Economic Indicators of
Indonesia May 2011, Jakarta. http //: www.bps.go.id
Suryawati, C. 2005. Understanding Poverty Multidimensional. http://www.jmpk-
online.net/Volume 8 / Vol 08 No 03 2005.pdf
Wijayanti, D. and Wahono, H. 2005. Analysis of Poverty Concentration in Indonesia Period
Tahin 1999 - 2003, Journal of Economics Pemb. Vol.10 No.3, Dec 2005, pp. 215-225.

Journal of ASEAN Studies on Maritime Issues Vol. 3 No. 4 May 2017
71
Sunyoto, D. 2011. Business Research with SPSS Path Analysis, Print I, Publisher GAVA
MEDIA, Yogyakarta.
Arsyad, L. 1997. Economic Development, Third Edition, Publisher BP STIE YKPN,
Yogyakarta.
Kuncoro, M. 1997. Development Economics, Theory, Problems, and Policy, Third Edition,
Publisher UPP AMP YKPN, Yogyakarta.
Muljana, B.S. 2001. National Development Planning, Publisher University of Indonesia (UI-
Press), Jakarta.
Samuelson, P.A. and Nordhaus, W.D. 1995. Micro Economy, Erland, Jakarta.
Sitepu, R.K. and Sinaga, B.M. 2004. The Impact of Human Resource Investment on
Economic Growth and Poverty in Indonesia: A Computable General Equilibrium
Model Approach.
http://ejournal.unud.ac.id/?module=detailpenelitian&idf=7&idj=48&idv=181&i at =
48 & idr = 191
Wijayanto, R.D. 2010. Analysis of the Influence of PDRB, Education and Unemployment on
Poverty in Kabupaten / Kota Bitung 2005-2008,
Sukirno, S. 1981. Development Economics, Process, Problems, and Policy Basis, Second
Edition, Revised, Publisher BORTA GORAT Medan. Thesis. Faculty of Economics,
Diponegoro University, Semarang.
Muhidin, S.A. and Maman Abdurahman, M. 2009. Correlation Analysis, Regression, and
Track in Research, Loyal Library, Bandung.
Saleh, S. 2002. Determinants of Regional Poverty Rate in Indonesia, Journal of Development
Economics, Vol.7 No.2, 2002.
Suparmono. 2004. Introduction Macro Economics, First Edition, Publisher UPP AMP
YKPN, Yogyakarta.
Todaro, Michael P (1993), Economic Development in the Third World, Haris Munandar
Translation, Third Edition, Volume 1, Erlangga, Jakarta.
Todaro, Michael P, 2000, Economic Development in the Third World, Haris Munandar,
Erlangga, Jakarta.
Wahyuni Apri Astuti & Muhammad Musiyam, Poverty and Regional Development in
Kab.Boyolali (2009), Geography Forum Vol.23 No.1, July 2009.
Wongdesmiwati, 2009, Economic Growth and Poverty Alleviation in Indonesia, available:
http://www.wordpress.com.
http://faulinaangelia.wordpress.com/2011/04/16/indikator-yang-perlu-detik-to avoid -poverty
/
www.bps.go.id