penetration vs. shear wave velocity for evaluation of ... the open civil engineering journal, 2010,...
TRANSCRIPT

16 The Open Civil Engineering Journal, 2010, 4, 16-37
1874-1495/10 2010 Bentham Open
Open Access
Penetration vs. Shear Wave Velocity for Evaluation of Liquefaction Potential in Northeast Arkansas
Ashraf Elsayeda,* and Shahram Pezeshkb
aDepartment of Civil Engineering, Arkansas State University, Box 1740, State University, AR 72467, USA bDepartment of Civil & Environmental Engineering, The University of Memphis, Memphis, TN 38152, USA
Abstract: Shear wave velocity profiles at 16 bridge sites in Northeast Arkansas (NEA) were determined using a hybrid, non-invasive technique. These profiles were used to evaluate the liquefaction resistance at the selected sites using the simplified procedure by Seed and Idriss (Vs approach). The liquefaction resistance was also evaluated using the Standard Penetration Test (SPT approach) results from the geotechnical investigations at these sites that were conducted by the Arkansas State Highway and Transportation Department (AHTD). The Liquefaction Potential Index (LPI), as introduced by Iwasaki, was used to evaluate the severity of liquefaction. The results of both approaches were then compared. Recommendations were made to AHTD personnel for liquefaction evaluation of future bridge projects based on the results of this research.
Keywords: Earthquake; Liquefaction; Northeast Arkansas; NMSZ; Shear Wave Velocity.
1. INTRODUCTION
NEA is considered part of the Mississippi embayment. The embayment is a trough-like depression that plunges southward along an axis that approximates the course of the Mississippi River. The embayment is filled with sediments of clay, silt, sand, and gravel to depths reaching 500 meters to 1000 meters. According to Broughton, Arsdale, and Broughton [1], most of the study area has surficial deposits, which include Holocene artificial fill, alluvium Holocene deposits along river channels, Pleistocene Loess and Terrace deposits, and Lafayette Gravel. Based on the work by Rix and Romero [2], many of these deposits are susceptible to liquefaction. NEA is also expected to experience significant damage from earthquakes in the New Madrid seismic zone (NMSZ). The NMSZ, which extends from southeastern Missouri to northwestern Tennessee and northeastern Arkansas, gener-ated three large events in 1811-1812. According to Bakun and Hopper [3], the best estimates of the moment magni-tudes for the three large events range from 7.5 to 7.8. The recurrence interval for events similar to 1811-1812 is esti-mated by Tuttle, Schweig, Sims, Lafferty, Wolf, and Haynes [4] to be 500± 30 years based on geologic data. Liquefaction is the result of excess porewater pressure generated in saturated granular soils from ground shaking during earthquakes. Several cases of liquefaction-induced damage to bridges and other structures have been docu-mented by Kramer [5]. The method referred to as the simpli-fied procedure, which was introduced by Seed and Idriss [6], *Address correspondence to this author at the Department of Civil Engineering, Arkansas State University, Box 1740, State University, AR 72467, USA; Tel: +1-87972-3426; Fax: +1-870-972-3948; E-mail: [email protected]
is typically used for evaluating the occurrence of liquefaction based on SPT results. The method was revised several times (Youd, Idriss, Andrus, et al. [7]) and it now includes a method based on shear wave velocity (Vs) measurements. The objective of this research was to obtain site-specific Vs profiles to depths of at least 30-meters at selected bridge locations in Northeast Arkansas. The Vs profiles were to be used to determine the soil liquefaction potential at each bridge location using the simplified Vs procedure. These Vs liquefaction evaluations were to be compared with Standard Penetration Test (SPT) liquefaction evaluation procedures using blow count (N) data already available from the AHTD.
2. SITE CHARACTERIZATION AND SURVEY PROCEDURE
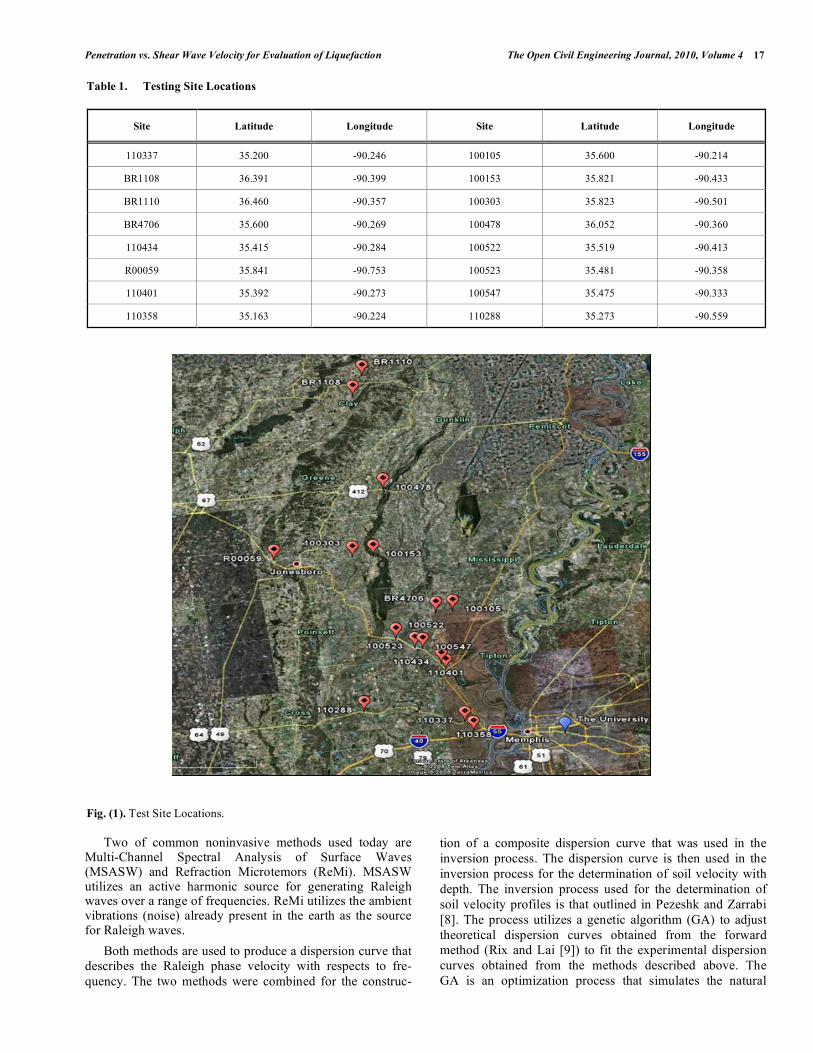
Surface wave tests were performed on 16 sites located throughout NEA. Sites were selected based primarily on their proximity to pre-existing highway bridges. All of these sites are north of Latitude 35.0° and west of Longitude 90.0°. The test site locations are summarized in Table 1 below. The test locations are shown in Fig. (1).
Noninvasive methods for determining in situ soil velocity profiles are rapidly becoming popular in the engineering field. Their low cost when compared to that of traditional invasive methods, such as downhole and Crosshole, make them attractive in today’s economy. Surface wave methods take advantage of the dispersive nature of Raleigh waves. By measuring the wavelength and velocity of propagating Ral-eigh waves, the stiffness properties of a soil profile can be characterized with respects to depth. These properties can then be utilized in evaluating site response, soil-structure interaction, and liquefaction potential.
Penetration vs. Shear Wave Velocity for Evaluation of Liquefaction The Open Civil Engineering Journal, 2010, Volume 4 17
Two of common noninvasive methods used today are Multi-Channel Spectral Analysis of Surface Waves (MSASW) and Refraction Microtemors (ReMi). MSASW utilizes an active harmonic source for generating Raleigh waves over a range of frequencies. ReMi utilizes the ambient vibrations (noise) already present in the earth as the source for Raleigh waves. Both methods are used to produce a dispersion curve that describes the Raleigh phase velocity with respects to fre-quency. The two methods were combined for the construc-
tion of a composite dispersion curve that was used in the inversion process. The dispersion curve is then used in the inversion process for the determination of soil velocity with depth. The inversion process used for the determination of soil velocity profiles is that outlined in Pezeshk and Zarrabi [8]. The process utilizes a genetic algorithm (GA) to adjust theoretical dispersion curves obtained from the forward method (Rix and Lai [9]) to fit the experimental dispersion curves obtained from the methods described above. The GA is an optimization process that simulates the natural
Table 1. Testing Site Locations
Site Latitude Longitude Site Latitude Longitude
110337 35.200 -90.246 100105 35.600 -90.214
BR1108 36.391 -90.399 100153 35.821 -90.433
BR1110 36.460 -90.357 100303 35.823 -90.501
BR4706 35.600 -90.269 100478 36.052 -90.360
110434 35.415 -90.284 100522 35.519 -90.413
R00059 35.841 -90.753 100523 35.481 -90.358
110401 35.392 -90.273 100547 35.475 -90.333
110358 35.163 -90.224 110288 35.273 -90.559
Fig. (1). Test Site Locations.

18 The Open Civil Engineering Journal, 2010, Volume 4 Elsayed and Pezeshk
evolution process using global search methods based on a stochastic approach, which relies on survival of the best fit (Holland [10]). An example of the experimental dispersion
curves along with their theoretical convergence is displayed in Fig. (2). The resulting soil velocity profiles are displayed in Figs. (3, 4, and 5).
Fig. (2). Dispersion Curves for 2 sites. Open circles denote experimental data; solid lines denote theoretical relationship
Fig. (3). Shear-wave velocity profiles for sites tested.
110337 BR1108 BR1110
BR4706 R00059110434
Penetration vs. Shear Wave Velocity for Evaluation of Liquefaction The Open Civil Engineering Journal, 2010, Volume 4 19
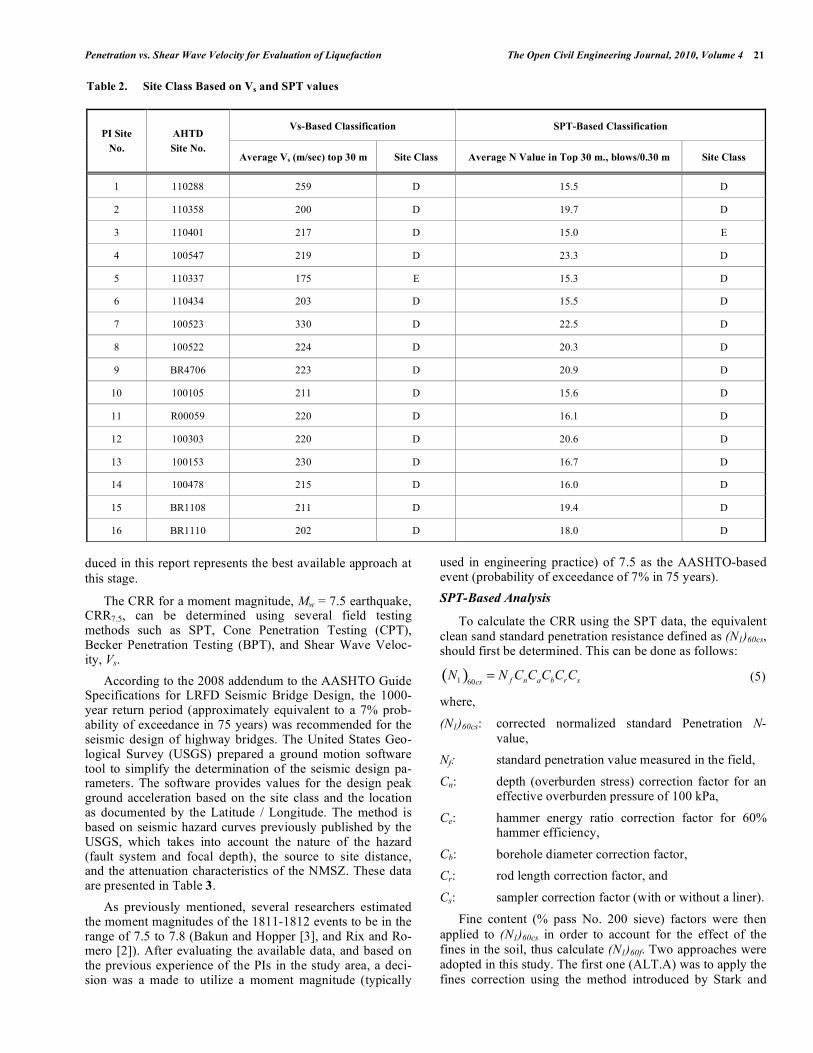
The Site Class was determined for each test site based on the definitions introduced in the AASHTO Guideline Speci-fications for LRFD Seismic Bridge Deign. The determina-tions were based on the Vs values and a SPT values from a representative boring. The results are presented in Table 2. The data in Table 2 indicates consistent results, except for sites 110337 and 110401. The results from these two sites were considered “borderline” between site classes D and E. It is imperative to recognize the difference between the two methods, as each of the 2 methods has its advan-tages, disadvantages, and sources of errors.
3. COMPUTATIONAL METHODS
The liquefaction analyses were performed using both Vs profiles and SPT blow counts as discussed below.
Method of Analysis
Seed and Idriss [6] developed a “simplified procedure” that can determine the safety factor against liquefaction. The simplified procedure was developed from evaluation of field observation and field and laboratory test data. The procedure uses two variables to evaluate for liquefaction of soils. These variables are the seismic demand induced by the design earthquake and expressed in terms of cyclic stress ratio (CSR), and the capacity of soil to resist liquefaction, ex-pressed in terms of cyclic resistance ratio (CRR). The CSR is calculated as follows:
max0.65
av VDd
VD VD
aCSR r
g
! "" "
# $# $= = % &% &' '( )( )
(1)
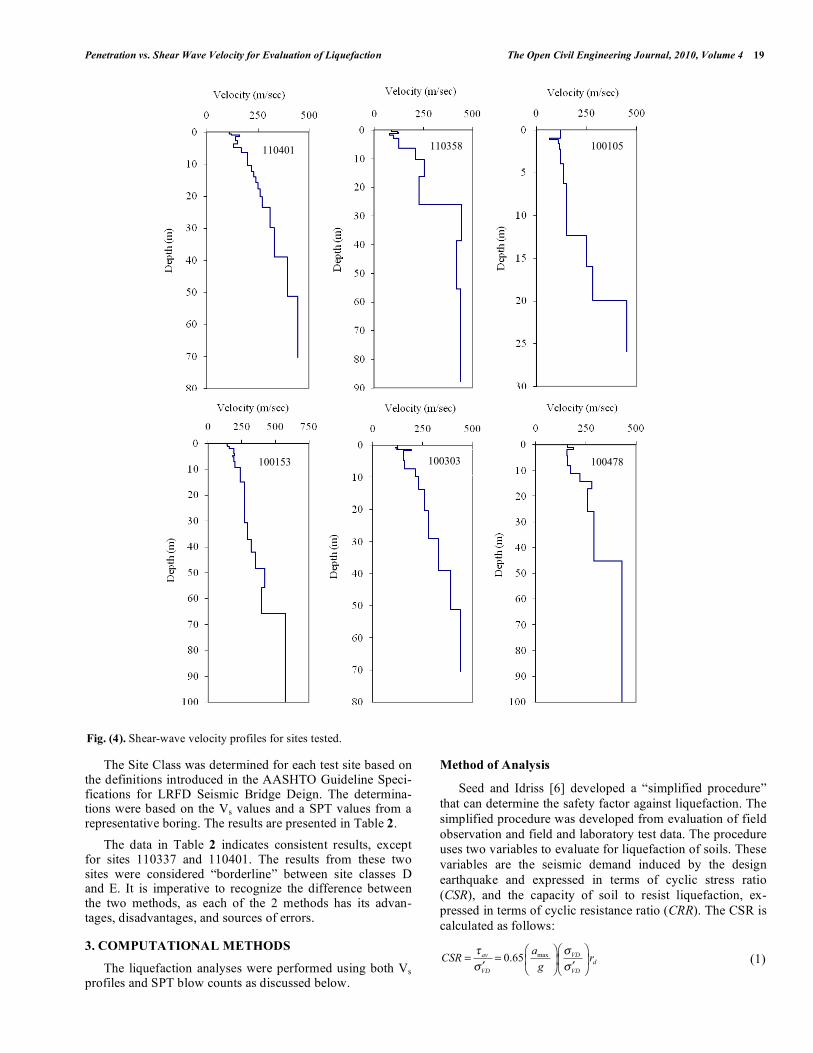
Fig. (4). Shear-wave velocity profiles for sites tested.
110358 100105
100153 100303 100478
110401

20 The Open Civil Engineering Journal, 2010, Volume 4 Elsayed and Pezeshk
where,
0.65: a weighing factor introduced by Seed to account for the average equivalent cyclic shear stress caused by the earthquake (assumed to be 0.65 of the maximum induced stress).
amax: peak horizontal ground acceleration.
VD! : total vertical overburden pressure.
VD! " : effective vertical overburden pressure.
rd: shear stress reduction coefficient to adjust for the flexibility of the soil profile.
Values of rd are commonly estimated from a chart intro-duced by Seed and Idriss [6]. The participants of the 1996 National Center for Earthquake Engineering Research, known as NCEER [Youd., Idriss, Andrus, et al. [7]) recom-mended the following equations to estimate the average rd values for noncritical projects (z is the depth below ground surface):
1.0 0.000765 9.15dr z z m= ! " # 1.0 0.000765 9.15
dr z z m= ! " # (2)
1.174 0.0267 9.15 23dr z m z m= ! " # # 1.174 0.0267 9.15 23
dr z m z m= ! " # # (3)
0.744 0.008 23 30dr z m z m= ! " # # 0.744 0.008 23 30
dr z m z m= ! " # # (4)
The first 2 equations were proposed by Liao and Whit-man [11], and the third equation was proposed Robertson and Wride [7]. Revised average values were proposed by Idriss [12] based on analytical work by Golesorkhi [13]. The revised values were magnitude dependent (Andrus and Sto-koe [14]). It is important to note that the workshop partici-pants indicated that the certainty with which CSR can be calculated decreases with depth when the mean rd values are used to simplify the calculations. Moreover, the simplified procedure is not well verified with case history data for depths greater than 15 m. However, they agreed that for con-venience in programming, rd values presented by Equations (2) through (4) above are suitable for routine engineering practice. Therefore, the method of calculating CSR intro-
Fig. (5). Shear-wave velocity profiles for sites tested.
100522 100523 100547
110228
Penetration vs. Shear Wave Velocity for Evaluation of Liquefaction The Open Civil Engineering Journal, 2010, Volume 4 21
duced in this report represents the best available approach at this stage.
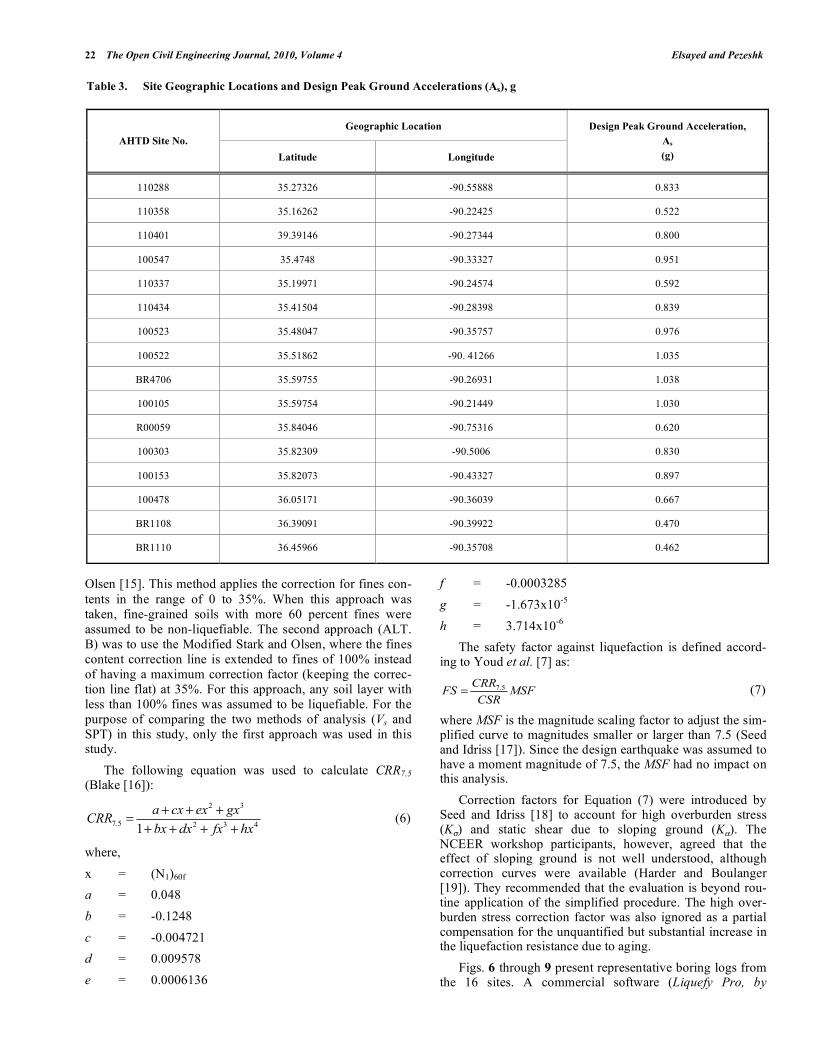
The CRR for a moment magnitude, Mw = 7.5 earthquake, CRR7.5, can be determined using several field testing methods such as SPT, Cone Penetration Testing (CPT), Becker Penetration Testing (BPT), and Shear Wave Veloc-ity, Vs. According to the 2008 addendum to the AASHTO Guide Specifications for LRFD Seismic Bridge Design, the 1000-year return period (approximately equivalent to a 7% prob-ability of exceedance in 75 years) was recommended for the seismic design of highway bridges. The United States Geo-logical Survey (USGS) prepared a ground motion software tool to simplify the determination of the seismic design pa-rameters. The software provides values for the design peak ground acceleration based on the site class and the location as documented by the Latitude / Longitude. The method is based on seismic hazard curves previously published by the USGS, which takes into account the nature of the hazard (fault system and focal depth), the source to site distance, and the attenuation characteristics of the NMSZ. These data are presented in Table 3. As previously mentioned, several researchers estimated the moment magnitudes of the 1811-1812 events to be in the range of 7.5 to 7.8 (Bakun and Hopper [3], and Rix and Ro-mero [2]). After evaluating the available data, and based on the previous experience of the PIs in the study area, a deci-sion was a made to utilize a moment magnitude (typically
used in engineering practice) of 7.5 as the AASHTO-based event (probability of exceedance of 7% in 75 years). SPT-Based Analysis
To calculate the CRR using the SPT data, the equivalent clean sand standard penetration resistance defined as (N1)60cs, should first be determined. This can be done as follows:
( )1 60 f n a b r scsN N C C C C C= (5)
where,
(N1)60cs: corrected normalized standard Penetration N-value,
Nf: standard penetration value measured in the field,
Cn: depth (overburden stress) correction factor for an effective overburden pressure of 100 kPa,
Ce: hammer energy ratio correction factor for 60% hammer efficiency,
Cb: borehole diameter correction factor, Cr: rod length correction factor, and
Cs: sampler correction factor (with or without a liner).
Fine content (% pass No. 200 sieve) factors were then applied to (N1)60cs in order to account for the effect of the fines in the soil, thus calculate (N1)60f. Two approaches were adopted in this study. The first one (ALT.A) was to apply the fines correction using the method introduced by Stark and
Table 2. Site Class Based on Vs and SPT values
Vs-Based Classification SPT-Based Classification PI Site
No. AHTD Site No.
Average Vs (m/sec) top 30 m Site Class Average N Value in Top 30 m., blows/0.30 m Site Class
1 110288 259 D 15.5 D
2 110358 200 D 19.7 D
3 110401 217 D 15.0 E
4 100547 219 D 23.3 D
5 110337 175 E 15.3 D
6 110434 203 D 15.5 D
7 100523 330 D 22.5 D
8 100522 224 D 20.3 D
9 BR4706 223 D 20.9 D
10 100105 211 D 15.6 D
11 R00059 220 D 16.1 D
12 100303 220 D 20.6 D
13 100153 230 D 16.7 D
14 100478 215 D 16.0 D
15 BR1108 211 D 19.4 D
16 BR1110 202 D 18.0 D
22 The Open Civil Engineering Journal, 2010, Volume 4 Elsayed and Pezeshk
Olsen [15]. This method applies the correction for fines con-tents in the range of 0 to 35%. When this approach was taken, fine-grained soils with more 60 percent fines were assumed to be non-liquefiable. The second approach (ALT. B) was to use the Modified Stark and Olsen, where the fines content correction line is extended to fines of 100% instead of having a maximum correction factor (keeping the correc-tion line flat) at 35%. For this approach, any soil layer with less than 100% fines was assumed to be liquefiable. For the purpose of comparing the two methods of analysis (Vs and SPT) in this study, only the first approach was used in this study. The following equation was used to calculate CRR7.5 (Blake [16]):
2 3
7.5 2 3 41
a cx ex gxCRR
bx dx fx hx
+ + +=
+ + + + (6)
where, x = (N1)60f a = 0.048 b = -0.1248 c = -0.004721 d = 0.009578 e = 0.0006136
f = -0.0003285 g = -1.673x10⁻⁵ h = 3.714x10⁻⁶ The safety factor against liquefaction is defined accord-ing to Youd et al. [7] as:
7.5CRR
FS MSFCSR
=
(7)
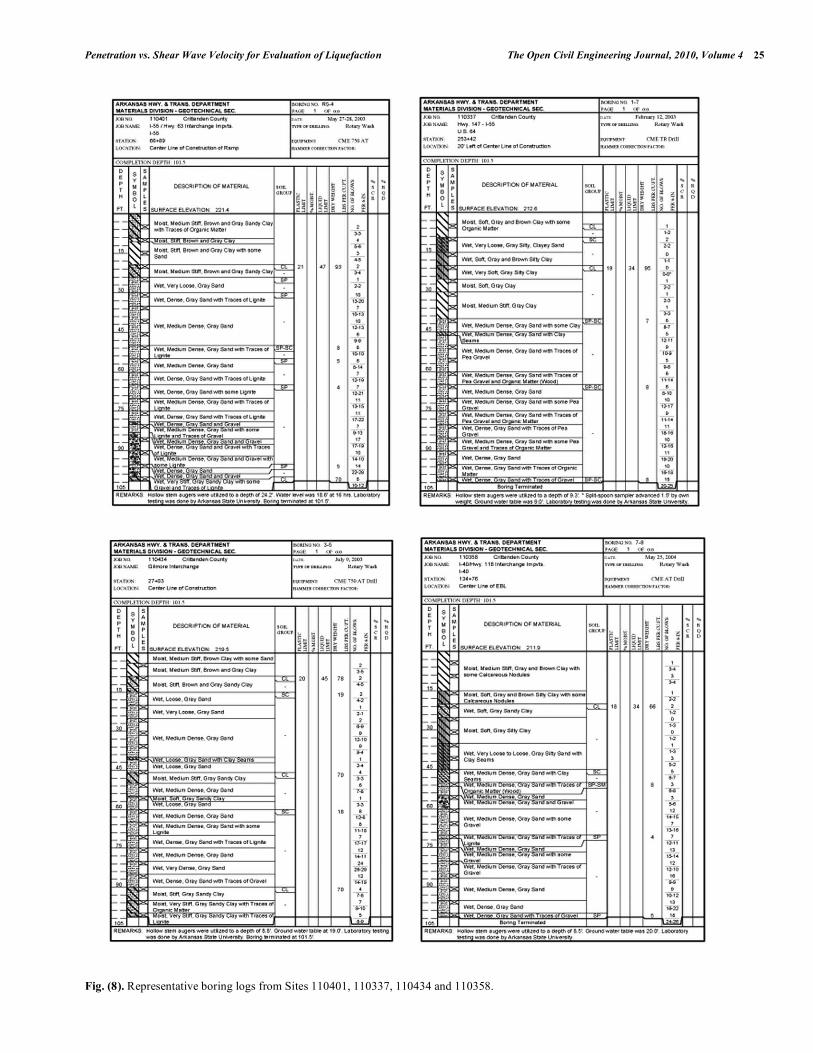
where MSF is the magnitude scaling factor to adjust the sim-plified curve to magnitudes smaller or larger than 7.5 (Seed and Idriss [17]). Since the design earthquake was assumed to have a moment magnitude of 7.5, the MSF had no impact on this analysis. Correction factors for Equation (7) were introduced by Seed and Idriss [18] to account for high overburden stress (Kσ) and static shear due to sloping ground (Kα). The NCEER workshop participants, however, agreed that the effect of sloping ground is not well understood, although correction curves were available (Harder and Boulanger [19]). They recommended that the evaluation is beyond rou-tine application of the simplified procedure. The high over-burden stress correction factor was also ignored as a partial compensation for the unquantified but substantial increase in the liquefaction resistance due to aging. Figs. 6 through 9 present representative boring logs from the 16 sites. A commercial software (Liquefy Pro, by
Table 3. Site Geographic Locations and Design Peak Ground Accelerations (As), g
Geographic Location AHTD Site No.
Latitude Longitude
Design Peak Ground Acceleration, As (g)
110288 35.27326 -90.55888 0.833
110358 35.16262 -90.22425 0.522
110401 39.39146 -90.27344 0.800
100547 35.4748 -90.33327 0.951
110337 35.19971 -90.24574 0.592
110434 35.41504 -90.28398 0.839
100523 35.48047 -90.35757 0.976
100522 35.51862 -90. 41266 1.035
BR4706 35.59755 -90.26931 1.038
100105 35.59754 -90.21449 1.030
R00059 35.84046 -90.75316 0.620
100303 35.82309 -90.5006 0.830
100153 35.82073 -90.43327 0.897
100478 36.05171 -90.36039 0.667
BR1108 36.39091 -90.39922 0.470
BR1110 36.45966 -90.35708 0.462

Penetration vs. Shear Wave Velocity for Evaluation of Liquefaction The Open Civil Engineering Journal, 2010, Volume 4 23
Fig. (6). Representative boring logs from Sites 100153, 100105, 100478 and 100303.

24 The Open Civil Engineering Journal, 2010, Volume 4 Elsayed and Pezeshk
Fig. (7). Representative boring logs from Sites 100522, 100523, 100547 and 110288.
Penetration vs. Shear Wave Velocity for Evaluation of Liquefaction The Open Civil Engineering Journal, 2010, Volume 4 25
Fig. (8). Representative boring logs from Sites 110401, 110337, 110434 and 110358.

26 The Open Civil Engineering Journal, 2010, Volume 4 Elsayed and Pezeshk
Fig. (9). Representative boring logs from Sites BR1110, BR1108, BR4706, and R00059.

Penetration vs. Shear Wave Velocity for Evaluation of Liquefaction The Open Civil Engineering Journal, 2010, Volume 4 27 Civiltech Software, 2007) was used to perform the SPT-based liquefaction analysis using the available boring logs and soil data for each site. Table 4 presents the results from 2 sites. Shear Wave Velocity-Based Analysis
The shear wave velocity-based liquefaction analysis, re-ferred to herein as the Vs analysis, required the following information:
Peak ground acceleration and earthquake magnitude.
Depth to groundwater.
Soil unit weights, soil classifications, fine contents, and Plasticity Indices.
Shear wave velocity profiles, which were determined using the field testing.
In addition, the following assumptions were made to perform the analysis:
The slope of the ground surface is 6% or less. This assumption is accurate, since the area tested at each site were basically flat.
The approximate age of the soil deposits at the test sites is 2000 years. This is considered a conservative assumption to some extent. The geologic maps of the sites indicated that the surficial soils are of Holocene age, which is measured in terms of thousands of years (< 10,000 years).
The method presented by Andrus and Stokoe [20] was used to perform the analysis. First, the stress-based or normalized shear wave velocity was calculated as follows:
0.25
1
a
s s
vo
PV V
!" #
= $ %&' ( (8)
where Pa is a reference stress of 100 kPa (2000 psf), ap-proximately the atmospheric pressure, and
vo! " is effective
overburden pressure in the same units. In applying the above equation, two assumptions were made (Andrus, Stokoe, and Juang [21]). These assumptions were that the initial effective horizontal stress is a constant factor of the effective vertical stress. The second assumption is the factor mention above is equal to 0.50. These assumptions were considered accurate for the level, normally consolidation deposits of the study area. The CRR is calculated as follows (Andrus and Stokoe
[20]): CRR = (a (Ka1Vs1/100)2 + b {1/(V*s1 – Vs1) – 1/V*s1}
Ka2) MSF (9) where, V*s1: limiting upper value of Vs1 for liquefaction occur-
rence. = 215 m/sec for sands and gravels
with fines contents ≤ 5%
=215 – 0.5 (FC – 5) for sands with 5% < FC <35%
= 200 m/sec for sands and gravels with fines contents ≥35%
a,b: curve fitting parameters taken as 0.022 and 2.80, respectively
MSF: magnitude scaling factor as previously described (equal to 1.0 in this study)
Andrus, Stokoe, and Juang [21] introduced two factors (Ka1 and Ka2) to account for the effect of aging. The first fac-tor is to correct for high Vs1 caused by aging, and the second factor is to correct for the influence of aging on CRR. They
Table 4. SPT-Based Liquefaction Analysis Results – Sites 110288 / 100547
Site No. Borehole No./Depth, m Approach Zones (ft. below Ground surface) that Indicated SF < 1.0
110288 B-1/30 ALT. A 4.6-20.0/22.6-30.0
B-2 / 30 5.2-10.0/17.7- >30.0
B-3 / 21 3.0-5.5/10.0-15.2/16.8
B-4 / 20 3.0-6.0/6.4-8.5/9.8-12.8/16.8
B-5 / 30 35-45 16.8-20.0/24.4-25.0
B-6 / 23 8.5-11.6/13.1-17.4
100547 B-1 / 30 ALT. A 6.1-48/19.2-21.0/21.9-22.9/26.8-29.0
B-2 / 30 6.0-15.8/17.7-22.3/24.4-29.0
B-3 / 30 7.0-20.1/23.2-27.4/27.7/30.0
B-4 / 30 7.0-9.8/11.9-13.4/15.5-24.4/24.7-30.0
B-5 / 30 7.0-7.6/9.8-14.9/15.5-18.9/22.3-23.2
B-6 / 30 7.6-8.8
B-7 / 30 7.6-7.9/13.7-14.4
28 The Open Civil Engineering Journal, 2010, Volume 4 Elsayed and Pezeshk
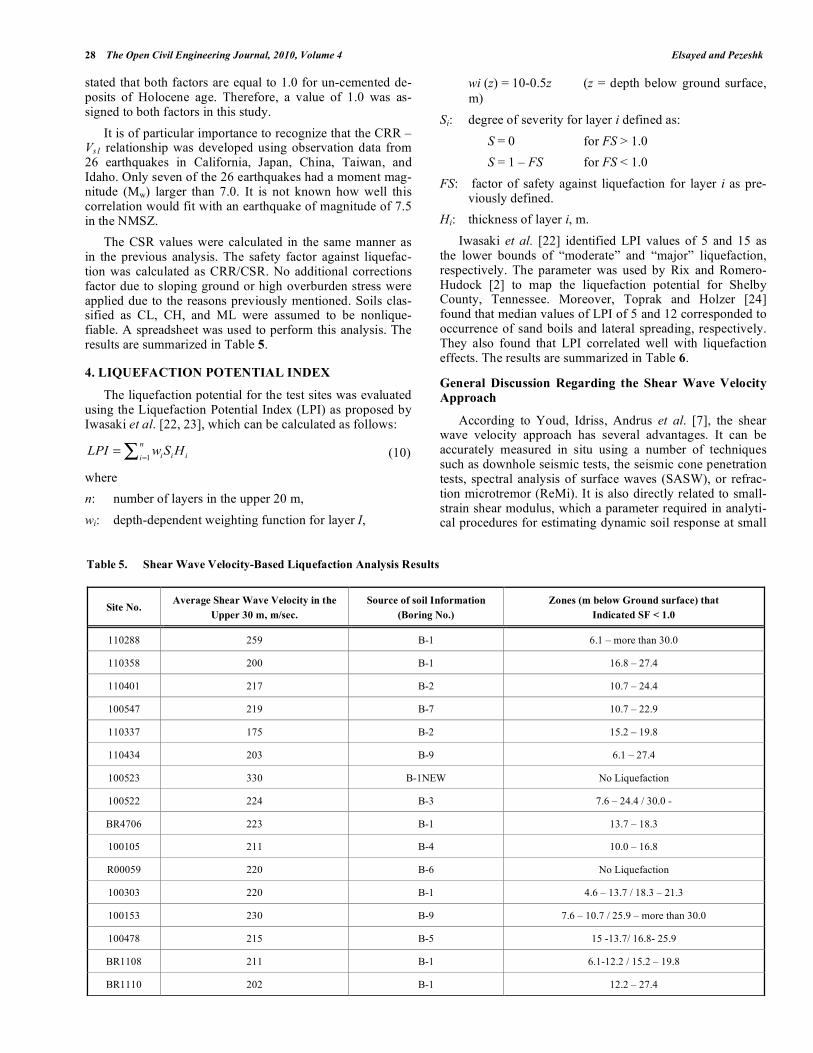
stated that both factors are equal to 1.0 for un-cemented de-posits of Holocene age. Therefore, a value of 1.0 was as-signed to both factors in this study. It is of particular importance to recognize that the CRR – Vs1 relationship was developed using observation data from 26 earthquakes in California, Japan, China, Taiwan, and Idaho. Only seven of the 26 earthquakes had a moment mag-nitude (Mw) larger than 7.0. It is not known how well this correlation would fit with an earthquake of magnitude of 7.5 in the NMSZ. The CSR values were calculated in the same manner as in the previous analysis. The safety factor against liquefac-tion was calculated as CRR/CSR. No additional corrections factor due to sloping ground or high overburden stress were applied due to the reasons previously mentioned. Soils clas-sified as CL, CH, and ML were assumed to be nonlique-fiable. A spreadsheet was used to perform this analysis. The results are summarized in Table 5.
4. LIQUEFACTION POTENTIAL INDEX
The liquefaction potential for the test sites was evaluated using the Liquefaction Potential Index (LPI) as proposed by Iwasaki et al. [22, 23], which can be calculated as follows:
1
n
i i iiLPI w S H
==! (10)
where n: number of layers in the upper 20 m, wi: depth-dependent weighting function for layer I,
wi (z) = 10-0.5z (z = depth below ground surface, m)
Si: degree of severity for layer i defined as: S = 0 for FS > 1.0 S = 1 – FS for FS < 1.0 FS: factor of safety against liquefaction for layer i as pre-
viously defined. Hi: thickness of layer i, m. Iwasaki et al. [22] identified LPI values of 5 and 15 as the lower bounds of “moderate” and “major” liquefaction, respectively. The parameter was used by Rix and Romero-Hudock [2] to map the liquefaction potential for Shelby County, Tennessee. Moreover, Toprak and Holzer [24] found that median values of LPI of 5 and 12 corresponded to occurrence of sand boils and lateral spreading, respectively. They also found that LPI correlated well with liquefaction effects. The results are summarized in Table 6.
General Discussion Regarding the Shear Wave Velocity Approach
According to Youd, Idriss, Andrus et al. [7], the shear wave velocity approach has several advantages. It can be accurately measured in situ using a number of techniques such as downhole seismic tests, the seismic cone penetration tests, spectral analysis of surface waves (SASW), or refrac-tion microtremor (ReMi). It is also directly related to small-strain shear modulus, which a parameter required in analyti-cal procedures for estimating dynamic soil response at small
Table 5. Shear Wave Velocity-Based Liquefaction Analysis Results
Site No. Average Shear Wave Velocity in the
Upper 30 m, m/sec. Source of soil Information
(Boring No.) Zones (m below Ground surface) that
Indicated SF < 1.0
110288 259 B-1 6.1 – more than 30.0
110358 200 B-1 16.8 – 27.4
110401 217 B-2 10.7 – 24.4
100547 219 B-7 10.7 – 22.9
110337 175 B-2 15.2 – 19.8
110434 203 B-9 6.1 – 27.4
100523 330 B-1NEW No Liquefaction
100522 224 B-3 7.6 – 24.4 / 30.0 -
BR4706 223 B-1 13.7 – 18.3
100105 211 B-4 10.0 – 16.8
R00059 220 B-6 No Liquefaction
100303 220 B-1 4.6 – 13.7 / 18.3 – 21.3
100153 230 B-9 7.6 – 10.7 / 25.9 – more than 30.0
100478 215 B-5 15 -13.7/ 16.8- 25.9
BR1108 211 B-1 6.1-12.2 / 15.2 – 19.8
BR1110 202 B-1 12.2 – 27.4

Penetration vs. Shear Wave Velocity for Evaluation of Liquefaction The Open Civil Engineering Journal, 2010, Volume 4 29
and intermediate shear strains. In addition, shear wave veloc-ity measurements are possible in soils that are difficult to penetrate and in sites where drilling is not permitted. Youd et al. [7] pointed several limitations to the approach. Seismic wave velocity measurements are made in small strain, where as liquefaction is a large strain phenomenon. The testing does not provide samples. The Vs analysis may indicate liq-uefaction potential in soft, non-liquefiable clay-rich deposits. A Vs–based analysis may indicate high safety factors in weakly-cemented sands that may be liquefiable. Andrus, Stokoe, and Juang [21] stated that site-specific liquefaction evaluation using only or mainly the Vs method should be limited to situations where: Crosshole, downhole, suspension logger, or SASW tests are conducted such that high-quality Vs values are deter-mined at intervals of at least ¼ of the critical layer (the layer most likely to liquefy). The limitations they stated in their paper regarding these methods are considered. Sufficient borings are conducted to identify materials type and to insure that thin, liquefiable strata are not present. The critical layer is of Holocene age and contains no or little carbonate (considered as a cementing agent). Andrus, Piratheepan, Ellis, Zhang, and Juang [25] com-pared the Vs-based CRR approach to the penetration-based one using data from 43 Holocene-age sand layers in Califor-nia, South Carolina, Canada, and Japan. They stated that the
Vs-based CRR curves are more conservative than the SPT-based curves.
5. EVALUATION OF THE RESULTS
It is of particular importance that the hammers utilized to perform SPT testing be calibrated in a regular basis to obtain accurate hammer efficiencies, thus reducing potential equipment-based variability. AHTD personnel provided hammer efficiencies for the hammers used during the site investigations of the tested bridge sites. The safety factors against liquefaction using the Vs were plotted against three different sets of safety factor values using the SPT approach at all 16 sites. These sets are as fol-lows: The safety factors using a representative boring at each site. The representative boring was chosen as the closest bor-ing to the center of the MSASW array. The lower bound values of the safety factors using data from the available borings at each site. These plots were cre-ated by using the lowest safety factors from the analyzed borings at comparable depths. The average values of the safety factors. These plots were created in a similar manner to the ones above, except the average values were used instead of the lowest ones. The variability among the borings at each site was as-sessed by calculating the standard deviation of the safety factors at each depth then calculating the average standard
Table 6. LPI Evaluation Results
SPT Analysis Site No.
Boring No. LPI Value Vs Analysis
110288 B-2 47.1 14.7
110358 B-7 15.5 2.3
110401 B-5 24.8 14.4
100547 B-3 22.3 19.5
110337 B-1 16.1 4.7
110434 B-3 31.1 39.9
100523 B-1 43.8 0
100522 B-3 29.3 28.0
BR4706 B-1 5.7 1.8
100105 B-4A 25.5 21.9
R00059 B-7 10.0 0
100303 B-1 27.5 29.4
100153 B-5 48.7 10.5
100478 B-5A 48.4 30.5
BR1108 B-1 11.8 23.9
BR1110 B-1 19.7 7.8

30 The Open Civil Engineering Journal, 2010, Volume 4 Elsayed and Pezeshk
deviation (STDEV) for the entire profile. The variability was considered significant when the STDEV value exceeded 1.0. The safety factors from both approaches below 20 m were also evaluated, since liquefaction below a depth of 20 m has not been previously documented. Figs. 10 through 13 show the plots mentioned above. Please note that the plots were truncated at a safety factor value of 2.0. The comparison of these plots is summarized in Table 7 below.
Results Comparison
The liquefaction analyses and the LPI calculations indi-cated the following: Both the SPT and Vs analyses indicated significant lique-faction may occur at the test sites during the design seismic event. This is due to the combined effect of the nature of the soil deposits and the relatively large peak horizontal ground acceleration required by the latest AASHTO LRFD design guide. Significant variability was noted within each site using the SPT approach, as the STDEV values exceeded 1.0 in 11 of the 16 sites. This can be attributed to the nature of the soil deposits, as the alluvial materials are expected to vary in both the horizontal and vertical directions. Another source of variability is the test procedure. The SPT results are highly dependent on the equipment used, procedure, as well as the operator’s experience and consistency, even when the test standard (ASTM D 1586) is closely followed. The effect of soil variability could not be verified in the Vs approach, as only one test was performed at each site.
Comparing the LPI values, the Vs approach in general results in lower a degree of liquefaction. The LPI values us-ing SPT results indicated that 13 of the 16 sites, or 81%, have LPI values above 15. On the other hand, the Vs ap-proach indicated that only 44% of the sites (7 of the 16 sites) have LPI values above 15. Table 7 shows that only 3 out of 16 sites indicated lower Vs –based safety factors when compared to the safety factors indicated by the representative borings. When compared to the average SPT, 5 sites indicated lower Vs –based safety factors, 6 sites indicated lower average SPT safety factors, and 5 sites indicated similar results.
Uncertainty of the Approach
It is important to note the uncertainties regarding the depth of liquefiable zones. The analysis indicated soil that may liquefy at significant depths (30 m or deeper). The authors do not have any knowledge of sites in the NMSZ that indicated liquefaction at such a significant depth. The lack of recent large earthquakes in the NMSZ adds to the uncertainty. It is of particular importance to recognize that the CRR – Vs1 relationship was developed using case history data from 26 earthquakes in California, Japan, China, Taiwan, and Idaho. Only seven of the 26 earthquakes had a moment mag-nitude (Mw) larger than 7.0 (Andrus and Stokoe [20]). The data were limited to average depths of less than 10 m. It is not known how well this correlation would fit with an earth-
quake of magnitude of 7.5 in the NMSZ. Andrus and Stokoe advised that care should be exercised when applying this approach where site conditions are different from the general characteristics of the case history data. This also should be applied upon performing the analysis using the SPT method. It is not known how suitable the upper (limiting) values for Vs1 would be for the study area, as they were developed us-ing data from shallower depths and mainly smaller earth-quake magnitudes.
Safety Factor Discussion
Andrus, Stokoe, and Juang [21] stated that it is possible that liquefaction could occur when the safety factor is larger than 1.0 (outside the region of predicted liquefaction). Juang, Andrus, Jiang, and Chin, [26, 27] developed the concept of probability of liquefaction (PL), which can be used to quantify and to establish an important link between the deterministic and probabilistic methods for determining the potential for liquefaction. According to Andrus, stoke, and Juang [21], the CRR- Vs curves (Andrus and Stokoe [20]) correspond to PL of approximately 0.26, and the SPT-based procedure (Seed, Tokimatsu, Harder, and Chung [28]) corre-sponds to PL of approximately 0.31. This means that if the safety factor against liquefaction is equal to 1.0, the prob-ability of liquefaction will be 26% for the Vs method and 31% for the SPT-based method of analysis. Moreover, the Building Seismic Safety Council [29] has suggested a safety factor of 1.20 to 1.50 when the simplified procedure is ap-plied in engineering practice. These safety factors are equivalent to PL values of 0.16 and 0.08 when applying the Vs-based procedure (Andrus, Stokoe, and Juang [21]).
6. CONCLUSION
The results of the liquefaction analyses indicated that the tested bridge sites in northeast Arkansas may experience significant liquefaction problems during a seismic event that approaches the magnitude of the AASHTO LRFD design earthquake. Comparing the 2 methods of liquefaction poten-tial analysis indicated that the Vs-based is less conservative. This is based on the higher safety factors; lower LPI values, and the lower evidence of liquefaction below a depth of 20 m. Evaluation of the SPT-based analyses indicated signifi-cant variability when several SPT profiles are considered. This was reflected by the STDEV parameter shown in Table 7.
7. RECOMMENDATIONS
The following was recommended upon conducting a liq-uefaction hazard analysis for bridge sites in Northeast Ar-kansas. Great emphasis should be put on regularly calibrat-ing the SPT hammers to obtain accurate efficiencies and minimize the equipment-based variability.
A. Noncritical or Nonessential Bridges:
Perform a geotechnical investigation at the bridge site. The investigation should include boreholes drilled to a mini-mum depth of 30 m. Perform in-situ testing (SPT or combination of SPT and CPT). Perform a liquefaction analy-sis using the SPT approach. Use a minimum safety factor of 1.20 to determine the potential liquefiable zones.

Penetration vs. Shear Wave Velocity for Evaluation of Liquefaction The Open Civil Engineering Journal, 2010, Volume 4 31
Fig. (10). Shear wave velocity vs. SPT plots from sites 1001105, 100478, 100303 and 1003.
� ��� ��� ��� ��� � ��� ��� ��� ��� �
� ��� ��� ��� ��� � ��� ��� ��� ��� �
� ��� ��� ��� ��� � ��� ��� ��� ��� �� ��� ��� ��� ��� � ��� ��� ��� ��� �
������������ ���������������������������������� !!"!"
#�������������$�����������������
�� ���
��������������
����������
�������� ���������������������������������� !! %"
#�������������$�����������������
�� ����
��������������
����������
&�'
��()*
�
�
�
�
�
��
��
��
��
��
��
��
��
��
��
��
������������ ���������������������������������� !!+,-
#�������������$�����������������
�� ���
��������������
����������
&�'
��()*
�
�
�
�
�
��
��
��
��
��
��
��
��
��
��
��
������������ ���������������������������������� !! !%
#�������������$�����������������
�� ���
��������������
����������
�
�
�
�
�
��
��
��
��
��
��
��
��
��
��
��
&�'
��()*
&�'
��()*
�
�
�
�
�
��
��
��
��
��
��
��
��
��
��
��

32 The Open Civil Engineering Journal, 2010, Volume 4 Elsayed and Pezeshk
Fig. (11). Shear wave velocity vs. STP plots from sites 100522, 100523, 100547 and 110288.
������������ ���������������������������������� !!%..
#�������������$�����������������
�� ���
��������������
����������
� ��� ��� ��� ��� � ��� ��� ��� ��� � � ��� ��� ��� ��� � ��� ��� ��� ��� ��
�
�
�
�
��
��
��
��
��
��
��
��
��
��
��
&�'
��()*
������������ ���������������������������������� !!%+,
#�������������$�����������������
�� ��
��������������
����������
������������ ���������������������������
������� !!.--#�������������$�����������������
�� ���
��������������
����������
� ��� ��� ��� ��� � ��� ��� ��� ��� ��
�
�
�
�
��
��
��
��
��
��
��
��
��
��
��
� ��� ��� ��� ��� � ��� ��� ��� ��� �
�
�
�
�
�
��
��
��
��
��
��
��
��
��
��
��
&�'
��()*
�
�
�
�
�
��
��
��
��
��
��
��
��
��
��
��
������������ ���������������������������������� !!%."
#�������������$�����������������
�� ���!
��������������
����������
&�'
��()*
&�'
��()*

Penetration vs. Shear Wave Velocity for Evaluation of Liquefaction The Open Civil Engineering Journal, 2010, Volume 4 33
Fig. (12). Shear wave velocity vs. SPT plots from sites 110337, 110358, 110401 and 110434.
&�'
��()*
������������ ���������������������������������� !"",
#�������������$�����������������
�� ���
��������������
����������
������������ ���������������������������������� !"%-
#�������������$�����������������
�� ����
��������������
����������
&�'
��()*
�
�
�
�
�
��
��
��
��
��
��
��
��
��
��
��
������������ ���������������������������������� !+!
#�������������$�����������������
�� ���
��������������
����������
� ��� ��� ��� ��� � ��� ��� ��� ��� �
&�'��()*
��
�
�
�
��
��
��
��
��
��
��
��
��
��
��
������������ ���������������������������������� !+"+
#�������������$�����������������
�� ���
��������������
����������
� ��� ��� ��� ��� � ��� ��� ��� ��� �
� ��� ��� ��� ��� � ��� ��� ��� ��� ��
�
�
�
�
��
��
��
��
��
��
��
��
��
��
��
&�'
��()*
� ��� ��� ��� ��� � ��� ��� ��� ��� �
�
�
�
�
�
��
��
��
��
��
��
��
��
��
��
��

34 The Open Civil Engineering Journal, 2010, Volume 4 Elsayed and Pezeshk
Fig. (13). Shear wave velocity vs. SPT plots from sites BR1108, BR1110, BR4706 and R00059.
������������ ����������������������������������/� !
#�������������$�����������������
�� ���
��������������
����������
������������ ����������������������������������/� !-
#�������������$�����������������
�� ���
��������������
����������
� ��� ��� ��� ��� � ��� ��� ��� ��� �
&�'
��()*
�
�
�
�
�
��
��
��
��
��
��
��
��
��
��
��
&�'
��()*
�
�
�
�
�
��
��
��
��
��
��
��
��
��
��
��
������������ ����������������������������������/�+,!0
#�������������$�����������������
�� ���
��������������
����������
� ��� ��� ��� ��� � ��� ��� ��� ��� �
&�'
��()*
�
�
�
�
�
��
��
��
��
��
��
��
��
��
��
��
������������ ���������������������������
��������!!!%1#�������������$�����������������
�� ���
��������������
����������
� ��� ��� ��� ��� � ��� ��� ��� ��� �
� ��� ��� ��� ��� � ��� ��� ��� ��� �
&�'
��()*
�
�
�
�
�
��
��
��
��
��
��
��
��
��
��
��

Penetration vs. Shear Wave Velocity for Evaluation of Liquefaction The Open Civil Engineering Journal, 2010, Volume 4 35
Table 7. Comparison of Safety Factors – SPT vs. Vs
Vs versus SPT - Safety Factor Comparison (Source of Lower Value Noted)
Site No. No. of
Borings Vs versus Rep. Boring (RB)
Vs versus Lower Bound SPT (LB)
Vs versus Average SPT (AVG)
Level of Variability Within SPT Analysis
Evidence of Liquefaction Below 20 m
110288 10 RB LB AVG Significant
STDEV=1.472 All SPT analyses indicated SF
<1.0
110358 10 RB LB Vs Significant
STDEV=1.222 Both Vs and SPT analyses from all
borings indicated SF <1.0
110401 14 RB LB Similar Slight
STDEV=0.911 Both Vs and SPT analyses from all
borings indicated SF <1.0
100547 7 Vs LB Vs Significant
STDEV=1.256 Both Vs and SPT analyses from 5
borings indicated SF <1.0
110337 3 RB LB AVG Significant
STDEV=1.419 All SPT analyses indicated SF <1.0
110434 9 Similar LB Similar Significant
STDEV=1.172 Both Vs and SPT analyses from all
borings indicated SF <1.0
100523 9 RB LB AVG Significant
STDEV=1.206 SPT analyses from 5 borings
indicated SF <1.0
100522 5 Similar LB Vs Slight
STDEV=0.932 Both Vs and SPT analyses from all
borings indicated SF <1.0
BR4706 2 RB LB Similar Negligible
STDEV=0.165 SPT analyses from one boring indicated SF <1.0 below 20 m
100105 8 Vs LB Vs Slight
STDEV=0.896 All SPT analyses indicated SF
<1.0
R00059 8 RB LB AVG Significant
STDEV=1.369 SPT analyses from 4 borings
indicated SF <1.0
100303 4 RB LB AVG Slight
STDEV=0.817 All SPT analyses indicated SF
<1.0
100153 8 Vs LB Vs Significant
STDEV=1.337 Both Vs and SPT analyses from 4
borings indicated SF <1.0
100478 8 Similar LB Similar Significant
STDEV=1.420 Both Vs and SPT analyses from all
borings indicated SF <1.0
BR1108 2 RB LB AVG Significant
STDEV=1.006 All SPT analyses indicated SF
<1.0
BR1110 2 Similar Similar Similar Significant
STDEV=1.250 Both Vs and SPT analyses from all
borings indicated SF <1.0
B. Critical or Essential Bridges:
Prior to performing the geotechnical investigation, per-form a sufficient number (a minimum of 2, depending on the total length of the bridge) of non-invasive testing, such as MSASW, to determine the shear wave velocity profile along the route of the proposed bridge. Obtain the design peak horizontal ground acceleration using the AASHTO design guide and the latitude/longitude
coordinates of the midpoint of the array. Perform prelimi-nary liquefaction analyses using Vs-based approach. Make reasonable assumptions regarding the soil unit weights, fine contents, and depth to groundwater table based on past experience. Calculate the corresponding LPI values using the safety factors produced by the analysis. If the LPI values exceed 15 on a consistent basis, performing invasive tests (such as crosshole or downhole testing) during the geotech-

36 The Open Civil Engineering Journal, 2010, Volume 4 Elsayed and Pezeshk
nical investigation and verify the profiles already obtained from the noninvasive tests.
Perform a geotechnical investigation at the bridge site. The investigation should include boreholes at a minimum depth of 30 m. The SPT intervals should not exceed 1.5 m. Obtain representative samples and perform sufficient classi-fication tests in the laboratory.
Once the laboratory test results are available, re-run the Vs-based analysis and perform SPT-based liquefaction analy-sis to confirm the findings. Use a minimum safety factor of 1.20. Calculate the corresponding LPI values. If the signifi-cantly high LPI previously calculated from the preliminary Vs-based analyses are confirmed, proceed with the invasive testing.
If the liquefiable layer extends to a great depth (24 m or more), perform a site-specific seismic study using the results of the invasive or the noninvasive tests. The invasive test results are preferred. Such a study may result in reducing the design seismic acceleration to 2/3 of their published values within a certain range of periods per the AASHTO design guide. Revise the liquefaction analyses using the results of the site-specific study.
ACKNOWLEDGEMENTS
The authors would like to thank the Arkansas State Highway and Transportation Department (AHTD) for pro-viding the funds for this project. Special thanks go to the project subcommittee for their guidance and review of the report, Mr. Marc Maurer, the project manager, from the Re-search Division for his continuing support, and Mr. David Ross from the Geotechnical Section for providing the geo-technical data used in the analysis.
REFERENCES [1] A. T. Broughton, R. B Van Arsdale, and J. H Broughton, “Lique-
faction susceptibility mapping in the City of Memphis and Shelby County, Tennessee”, Engineering Geology, vol. 62, pp. 201-222, 2001.
[2] G. J. Rix, and S. Romero-Hudock, “Liquefaction potential mapping in Memphis and Shelby County, Tennessee”, United States Geological Survey Report, 2006.
[3] W. H. Bakun, M. G. Hopper, “Magnitude and locations of the 1811-1812 New Madrid, Missouri and the 1886 Charleston, South Carolina, Earthquakes”, Bulletin of the Seismological Society of America, vol. 94, no. 1, pp. 64-75, 2004.
[4] M. P. Tuttle, E. S. Schweig, J.D. Sims, R.H. Lafferty, L.W. Wolf, and M. L. Haynes, “The earthquake potential of the New Madrid seismic zone”, Bulletin of the Seismological Society of America, vol. 92, pp. 2080-2089, 2002.
[5] S. L Kramer, Geotechnical Earthquake Engineering, Prentice Hall, Upper Saddle River, New Jersey, 1996.
[6] H. B. Seed, and I. M. Idriss, “Simplified procedure for evaluating soil liquefaction potential”, Journal of the Soil Mechanics and Foundations, Division 97, pp. 1249-1273, 1971.
[7] L. T. Youd, I. M. Idriss, R. D. Andrus, I. Arango, G. Castro, J. T. Christian, R. Dobry, W. D. L. Finn, L. F. Jr. Harder, M. E. Hynes, K. Ishihara, J. P. Koester, S. S. C. Liao, W. F. III Marcuson, G. R. Martin, J. K. Mitchell, Y. Moriwaki, M. S. Power, P. K. Robertson, R. B. Seed, and K. H. Stokoe, “Liquefaction resistance of soils: summary report from the 1996 NCEER and 1998 NCEER/NSF workshop on evaluation of liquefaction resistance of soils”, Journal of Geotechnical and Geoenvironmental Engineering, vol. 127, pp. 817-833, 2001.
[8] S. Pezeshk, S. and M. Zarrabi, “A New inversion procedure for spectral analysis of surface waves using a genetic algorithm”, Bulletin of the Seismological Society of America, vol. 95, no. 5, pp. 1801-1808, 2005.
[9] G. J. Rix, and C. G. Lai, “Simultaneous inversion of surface wave velocity and attenuation. Geotechnical Site Characterization”, P.K. Robertson and P.W. Mayne, Eds., Vol. no. 1, pp. 503-508, Proceedings of the First International Conference on Site Charac-terization – ISC ’98, Atlanta, Georgia, 19-22 April, 1998.
[10] J. H. Holland, “Adaptation in natural and artificial systems”, Ann Arbor: The University of Michigan Press, 1975.
[11] S. S. C. Liao, and R. V. Whitman, “Catalogue for a Liquefaction and non-liquefaction occurrences during earthquakes”, Research Report, Department of Civil Engineering, MIT, Cambridge, MA, 1986b.
[12] I. M. Idriss, “An update of the Seed-Idriss simplified procedure for evaluating liquefaction potential” TRB Workshop on New Approaches to Liquefaction Analysis, Proceeding, Transportation Research Board, Washington, D.C, 1999.
[13] R. Golesorkhi, “Factors influencing the computational determina-tion of earthquake-induced shear stress in sandy soils”, Ph.D. Dissertation, University of California, Berkeley, 1989.
[14] R. D. Andrus, and K. H. Stokoe, “Liquefaction resistance based on shear wave velocity”, NCEER Workshop on Evaluation of Lique-faction Resistance of Soils, Salt Lake City, UT. Technical Report NCEER-97-0022. T. L. Youd and I. M. Idriss, Eds., National Center for Earthquake Engineering Research, Buffalo, NY, 1997, pp. 89-128,.
[15] T. D. Stark, and S. M. Olson, “Liquefaction resistance using CPT and field case histories”, Journal of Geotechnical Engineering, ASCE, vol. 121, no. 12, pp. 856-869, 1995.
[16] T. F. Blake, “Summary report of proceedings of the NCEER work-shop on evaluation of liquefaction resistance of soils”, Technical Report NCEER, 1997-0022.
[17] H. B. Seed, and I. M. Idriss, “Ground motions and soil liquefac- tion Earthquakes”, Earthquake Engineering Research Institute, Berkeley, CA, vol. 109, no. 3, pp. 134, 1982.
[18] H. B. Seed, and I. M. Idriss, “Evaluation of liquefaction potential using field performance data”, Journal of Geotechnical Engineer-ing, ASCE, vol.109, no. 3, pp. 458-482, 1983.
[19] L. F. Harder, L. F, and R. W. Boulanger, “Application of Ks and Ka correction factors”, Proceedings of NCEER Workshop on Evaluation of Liquefaction Resistance of Soils, Rep. NCEER-97-0022, National Center for Earthquake Engineering Research, SUNY Buffalo, Buffalo, N.Y., 1997; pp. 167-190.
[20] R. D. Andrus, and K. H. Stokoe, “Liquefaction resistance of soils from shear-wave velocity”, Journal of Geotechnical and Geoenvi-ronmental Engineering, ASCE, vol. 126, issue 11, pp. 1015-1025, 2000.
[21] R. D. Andrus, K. H. Stokoe, and C. H. Juang, “Guide for shear-wave based liquefaction potential evaluation”, Earthquake Spectra, vol. 20, no. 2, pp. 285-308, 2004.
[22] T. Iwasaki, F. Tatsuoka, K. Tokida, and S. Yasuda, “A practical method for assessing soil liquefaction potential based on case stud-ies at various sites in Japan”, Proceedings of 2nd International Conference on Microzonation, 1978, pp. 885-896.
[23] T. Iwasaki, K. Tokida, F. Tatsuoka, S. Watanabe, S. Yasuda, and H. Sato, “Microzonation for soil liquefaction potential using sim-plified methods”, Proceedings, 3rd International Conference on Microzonation, 1982, pp. 1319-1330.
[24] S. Toprak, and T. L. Holzer, “Liquefaction potential index: field assessment”, Journal of Geotechnical and Geoenvironmental En-gineering, vol. 129, no.4, pp. 315-322, 2003.
[25] R. D. Andrus, P. Piratheepan, B. S. Ellis, J. Zhang, and C. H. Juang, “Comparing liquefaction evaluation methods using penetra-tion-Vs relationships”, Soil Dynamics and Earthquake Engineering, vol. 24, no. 9-10, pp. 713-721, 2004.
[26] C. H. Juang, R. D. Andrus, T. Jiang, and C. J. Chin, “Probability-based liquefaction evaluation using shear wave velocity measure-ments”, 4th International Conference on Recent Advances in Geotechnical Engineering and Soil Dynamics, San Diego,

Penetration vs. Shear Wave Velocity for Evaluation of Liquefaction The Open Civil Engineering Journal, 2010, Volume 4 37
California, S. Prakash, Ed., University of Missouri-Rolla, Paper 4.24, 200.
[27] C. H. Juang, and R. D. Andrus, “Assessing probability-based methods for liquefaction potential evaluations”, Journal of Geotechnical & Geoenvironmental Engineering, ASCE, vol. 128, no. 7, pp. 580-589, 2002.
[28] H. B. Seed, K. Tokimatsu, L. F. Harder, and R. M. Chung, “Influence of SPT procedures in soil liquefaction resistance evalua-
tions”, Journal of Geotechnical Engineering, ASCE, vol. 111, no. 12, pp. 1425-1445, 1985.
[29] The Building Seismic Safety Council (BSSC), “NEHERP Recom-mended provisions for seismic regulation for new buildings and other structures”, FEMA 368, Federal Emergency Management Agency, Washington, D.C., Part 2, 2000; p. 196.
Received: August 30, 2009 Revised: October 18, 2009 Accepted: December 22, 2009 © Elsayed and Pezeshk; Licensee Bentham Open.
This is an open access article licensed under the terms of the Creative Commons Attribution Non-Commercial License (http://creativecommons.org/licenses/by-nc/3.0/) which permits unrestricted, non-commercial use, distribution and reproduction in any medium, provided the work is properly cited.