penetration of anti infective agents into.3
DESCRIPTION
ยาเข้าปอดTRANSCRIPT
Penetration of Anti-Infective Agents intoPulmonary Epithelial Lining FluidFocus on Antibacterial Agents
Keith A. Rodvold,1 Jomy M. George2 and Liz Yoo1
1 University of Illinois at Chicago, Chicago, IL, USA
2 Philadelphia College of Pharmacy, Philadelphia, PA, USA
Contents
Abstract. . . . . . . . . . . . . . . . . . . . . . . . . . . . . . . . . . . . . . . . . . . . . . . . . . . . . . . . . . . . . . . . . . . . . . . . . . . . . . . . . . . . . . . . . . . . . . . . . . . . . . . . . . . 637
1. Epithelial Lining Fluid (ELF) . . . . . . . . . . . . . . . . . . . . . . . . . . . . . . . . . . . . . . . . . . . . . . . . . . . . . . . . . . . . . . . . . . . . . . . . . . . . . . . . . . . . . . . . . 638
1.1 Collection of ELF and Limitations of Methodology . . . . . . . . . . . . . . . . . . . . . . . . . . . . . . . . . . . . . . . . . . . . . . . . . . . . . . . . . . . . . . . . 639
1.2 Factors Influencing Penetration of Antimicrobials into ELF and Comparison with Plasma Concentrations . . . . . . . . . . . . . . . . . 640
1.3 Pharmacokinetic-Pharmacodynamic Parameters of Efficacy . . . . . . . . . . . . . . . . . . . . . . . . . . . . . . . . . . . . . . . . . . . . . . . . . . . . . . 640
2. b-Lactams . . . . . . . . . . . . . . . . . . . . . . . . . . . . . . . . . . . . . . . . . . . . . . . . . . . . . . . . . . . . . . . . . . . . . . . . . . . . . . . . . . . . . . . . . . . . . . . . . . . . . . 641
2.1 Oral Penicillins and Cephalosporins . . . . . . . . . . . . . . . . . . . . . . . . . . . . . . . . . . . . . . . . . . . . . . . . . . . . . . . . . . . . . . . . . . . . . . . . . . . . 641
2.2 Parenteral Penicillins and Cephalosporins . . . . . . . . . . . . . . . . . . . . . . . . . . . . . . . . . . . . . . . . . . . . . . . . . . . . . . . . . . . . . . . . . . . . . . . 643
2.3 Carbapenems . . . . . . . . . . . . . . . . . . . . . . . . . . . . . . . . . . . . . . . . . . . . . . . . . . . . . . . . . . . . . . . . . . . . . . . . . . . . . . . . . . . . . . . . . . . . . . 643
3. Macrolides, Azalides and Ketolides . . . . . . . . . . . . . . . . . . . . . . . . . . . . . . . . . . . . . . . . . . . . . . . . . . . . . . . . . . . . . . . . . . . . . . . . . . . . . . . . . 645
3.1 Erythromycin, Roxithromycin, Dirithromycin and Modithromycin . . . . . . . . . . . . . . . . . . . . . . . . . . . . . . . . . . . . . . . . . . . . . . . . . . . . 645
3.2 Clarithromycin . . . . . . . . . . . . . . . . . . . . . . . . . . . . . . . . . . . . . . . . . . . . . . . . . . . . . . . . . . . . . . . . . . . . . . . . . . . . . . . . . . . . . . . . . . . . . . 649
3.3 Azithromycin. . . . . . . . . . . . . . . . . . . . . . . . . . . . . . . . . . . . . . . . . . . . . . . . . . . . . . . . . . . . . . . . . . . . . . . . . . . . . . . . . . . . . . . . . . . . . . . . 649
3.4 Ketolides . . . . . . . . . . . . . . . . . . . . . . . . . . . . . . . . . . . . . . . . . . . . . . . . . . . . . . . . . . . . . . . . . . . . . . . . . . . . . . . . . . . . . . . . . . . . . . . . . . . 650
4. Fluoroquinolones . . . . . . . . . . . . . . . . . . . . . . . . . . . . . . . . . . . . . . . . . . . . . . . . . . . . . . . . . . . . . . . . . . . . . . . . . . . . . . . . . . . . . . . . . . . . . . . . 650
4.1 Ciprofloxacin . . . . . . . . . . . . . . . . . . . . . . . . . . . . . . . . . . . . . . . . . . . . . . . . . . . . . . . . . . . . . . . . . . . . . . . . . . . . . . . . . . . . . . . . . . . . . . . 650
4.2 Moxifloxacin . . . . . . . . . . . . . . . . . . . . . . . . . . . . . . . . . . . . . . . . . . . . . . . . . . . . . . . . . . . . . . . . . . . . . . . . . . . . . . . . . . . . . . . . . . . . . . . . 651
4.3 Levofloxacin . . . . . . . . . . . . . . . . . . . . . . . . . . . . . . . . . . . . . . . . . . . . . . . . . . . . . . . . . . . . . . . . . . . . . . . . . . . . . . . . . . . . . . . . . . . . . . . . 652
5. Aminoglycosides . . . . . . . . . . . . . . . . . . . . . . . . . . . . . . . . . . . . . . . . . . . . . . . . . . . . . . . . . . . . . . . . . . . . . . . . . . . . . . . . . . . . . . . . . . . . . . . . 652
6. Glycopeptides and Lipoglycopeptides . . . . . . . . . . . . . . . . . . . . . . . . . . . . . . . . . . . . . . . . . . . . . . . . . . . . . . . . . . . . . . . . . . . . . . . . . . . . . 654
6.1 Vancomycin. . . . . . . . . . . . . . . . . . . . . . . . . . . . . . . . . . . . . . . . . . . . . . . . . . . . . . . . . . . . . . . . . . . . . . . . . . . . . . . . . . . . . . . . . . . . . . . . 654
6.2 Teicoplanin . . . . . . . . . . . . . . . . . . . . . . . . . . . . . . . . . . . . . . . . . . . . . . . . . . . . . . . . . . . . . . . . . . . . . . . . . . . . . . . . . . . . . . . . . . . . . . . . . 655
6.3 Telavancin . . . . . . . . . . . . . . . . . . . . . . . . . . . . . . . . . . . . . . . . . . . . . . . . . . . . . . . . . . . . . . . . . . . . . . . . . . . . . . . . . . . . . . . . . . . . . . . . . 655
6.4 Oritavancin . . . . . . . . . . . . . . . . . . . . . . . . . . . . . . . . . . . . . . . . . . . . . . . . . . . . . . . . . . . . . . . . . . . . . . . . . . . . . . . . . . . . . . . . . . . . . . . . 656
7. Miscellaneous Antibacterial Agents . . . . . . . . . . . . . . . . . . . . . . . . . . . . . . . . . . . . . . . . . . . . . . . . . . . . . . . . . . . . . . . . . . . . . . . . . . . . . . . . 656
7.1 Linezolid . . . . . . . . . . . . . . . . . . . . . . . . . . . . . . . . . . . . . . . . . . . . . . . . . . . . . . . . . . . . . . . . . . . . . . . . . . . . . . . . . . . . . . . . . . . . . . . . . . . 657
7.2 Tigecycline . . . . . . . . . . . . . . . . . . . . . . . . . . . . . . . . . . . . . . . . . . . . . . . . . . . . . . . . . . . . . . . . . . . . . . . . . . . . . . . . . . . . . . . . . . . . . . . . . 658
7.3 Iclaprim . . . . . . . . . . . . . . . . . . . . . . . . . . . . . . . . . . . . . . . . . . . . . . . . . . . . . . . . . . . . . . . . . . . . . . . . . . . . . . . . . . . . . . . . . . . . . . . . . . . . 658
8. Conclusions . . . . . . . . . . . . . . . . . . . . . . . . . . . . . . . . . . . . . . . . . . . . . . . . . . . . . . . . . . . . . . . . . . . . . . . . . . . . . . . . . . . . . . . . . . . . . . . . . . . . . 658
Abstract The exposure-response relationship of anti-infective agents at the site of infection is currently being re-
examined. Epithelial lining fluid (ELF) has been suggested as the site (compartment) of antimicrobial
activity against lung infections caused by extracellular pathogens. There have been an extensive number of
studies conducted during the past 20 years to determine drug penetration into ELF and to compare plasma
REVIEW ARTICLEClin Pharmacokinet 2011; 50 (10): 637-664
0312-5963/11/0010-0637/$49.95/0
ª 2011 Adis Data Information BV. All rights reserved.
and ELF concentrations of anti-infective agents. The majority of these studies estimated ELF drug con-
centrations by the method of urea dilution and involved either healthy adult subjects or patients undergoing
diagnostic bronchoscopy. Antibacterial agents such as macrolides, ketolides, newer fluoroquinolones and
oxazolidinones have ELF to plasma concentration ratios of >1. In comparison, b-lactams, aminoglycosides
and glycopeptides have ELF to plasma concentration ratios of £1. Potential explanations (e.g. drug
transporters, overestimation of the ELF volume, lysis of cells) for why these differences in ELF penetration
occur among antibacterial classes need further investigation. The relationship between ELF concentrations
and clinical outcomes has been under-studied. In vitro pharmacodynamic models, using simulated ELF and
plasma concentrations, have been used to examine the eradication rates of resistant and susceptible pa-
thogens and to explainwhy selected anti-infective agents (e.g. thosewith ELF to plasma concentration ratios
of >1) are less likely to be associated with clinical treatment failures. Population pharmacokinetic modelling
and Monte Carlo simulations have recently been used and permit ELF and plasma concentrations to be
evaluated with regard to achievement of target attainment rates. These mathematical modelling techniques
have also allowed further examination of drug doses and differences in the time courses of ELF and plasma
concentrations as potential explanations for clinical and microbiological effects seen in clinical trials.
Further studies are warranted in patients with lower respiratory tract infections to confirm and explore the
relationships between ELF concentrations, clinical and microbiological outcomes, and pharmacodynamic
parameters.
Plasma drug concentrations in relation to the minimum in-
hibitory concentration (MIC) for the bacterial pathogen of
interest have traditionally been used as a predictive marker of
the efficacy of antibacterial agents.[1] In vitro models and clin-
ical trials during the past two decades have dramatically ex-
panded our knowledge of exposure-effect relationships and
have established pharmacokinetic-pharmacodynamic indices
for many antibacterial agents.[2-4] Hence more attention has
been placed on the importance of anti-infective concentrations,
not only in plasma but also at the site of infection.[5-7]
Pulmonary epithelial lining fluid (ELF) and alveolar
macrophages (AMs) have been advocated as important sites of
infection with common extracellular and intracellular respira-
tory pathogens, respectively. For community-acquired pneu-
monia, Streptococcus pneumoniae, Moraxella catarrhalis and
Haemophilus influenzae are the predominant extracellular pa-
thogens, and Mycoplasma pneumoniae, Chlamydophila (Chla-
mydia) pneumoniae andLegionella pneumophila are the primary
intracellular pathogens. Thus knowledge of the location of the
respective pathogens, drug penetration and drug concentra-
tions in different compartments of the lung should assist in
selection of appropriate antibacterial therapy and design of
dosing regimens to effectively treat lower respiratory tract
infections.[8-11]
The aim of this review is to provide a comprehensive sum-
mary of the concentrations of antibacterial agents in ELF and
the extent of their penetration. A brief overview has been in-
cluded to describe the common methodologies that are used in
collecting samples from ELF, the limitations associated with
these methods and interpretation of the data that are obtained.
Also discussed are the physicochemical and host-related factors
that may influence penetration of anti-infective agents at the
site of lung infections, comparison of ELF to plasma (or
serum) concentration ratios, and correlation of pharmacokinetic-
pharmacodynamic parameters that are specific for each class of
antibacterial agents.
1. Epithelial Lining Fluid (ELF)
Awide variety of different methodologies have been used for
measuring concentrations of anti-infective agents and drug dis-
tribution patterns within the lungs. Commonly employedmethods
have included whole-tissue homogenates, sputum, respiratory
secretions, bronchial mucosa, pleural fluid, bronchoalveolar
lavage (BAL), ELF, microdialysis, positron emission tomo-
graphy and magnetic resonance spectroscopy.[12] It remains
unclear which of these techniques is the most appropriate.[11-15]
Historically, anti-infective drug concentrations were mea-
sured by obtaining lung tissue during a surgical procedure.
Although this is one of the oldest methods for measuring drug
concentrations in the lung, whole-tissue concentrations are
no longer recommended.[14] In addition, methods that include
measurement of antibacterial concentrations in sputum or bron-
chial secretions have been considered less than optimal.[11,12,16]
For example, the shortcomings of using sputum concentrations
as an indicator of lung penetration include the possibility of
falsely low saliva drug concentrations (indicating poor lung
penetration) because of a dilutional effect caused by saliva, or
638 Rodvold et al.
ª 2011 Adis Data Information BV. All rights reserved. Clin Pharmacokinet 2011; 50 (10)
falsely elevated saliva drug concentrations (suggesting high
lung penetration) if the antibacterial is extensively distributed
into saliva but not into other pulmonary fluids or tissues. The
major drawback of drug concentrations reported from whole
lung tissue, bronchial tissues and/or secretions is the assump-
tion that anti-infective agents are uniformly distributed across
all lung compartments (e.g. extracellular, intracellular). Thus
the reported drug concentration represents a mixture from all
compartments versus a value for a specific site of activity.
Methods that measure concentrations of anti-infective agents
in specific compartments of the lung (e.g. ELF, interstitial fluid,
AMs) are currently preferred and are considered to provide
further insight into the significance of drug concentrations at
the site of pulmonary infections.[5,11-14,16] ELF has been con-
sidered the likely site of extracellular respiratory micro-organisms
in bacterial pneumonia and acute bacterial exacerbation of
chronic bronchitis. However, one must understand that no
method or sampling site is perfect, and each has its advantages,
potential limitations and methodological issues.[11-16]
1.1 Collection of ELF and Limitations of Methodology
Currently, the combination of bronchoscopy and BAL has
become a safe and effective method for obtaining samples from
the bronchoalveolar surface of the lower respiratory tract. The
procedure involves a fibre-optic bronchoscope being passed
and wedged into a subsegment of the middle or lower lung lobe.
BAL is performed by instillations of three or four aliquots of
sterile 0.9% normal saline solution into the lung lobe, with the
fluid being immediately aspirated and placed on ice after each
aliquot. The aspirate from the first instillation is usually col-
lected separately and discarded because of significant con-
tamination with cells from the proximal airways. The aspirates
recovered from the subsequent instillations are pooled, the
volume is measured and recorded, and removal of a sample for
other testing (e.g. a total cell count and a differential cell count)
is sent to the laboratory. The remaining volume of BAL is
immediately centrifuged, the supernatant and cell pellet are
separated, and samples from the supernatant for determining
urea and drug concentrations are collected and frozen until the
assays can be performed. A blood sample to determine urea and
drug concentrations is also obtained at the time of the sched-
uled bronchoscopy and BAL procedure.
The recovered BAL fluid is a mixture of saline, ELF and
cellular components of the ELF. In order to determine the anti-
infective drug concentration, the ‘apparent’ volume of ELF
must be estimated. Urea (or albumin or creatinine) has been
commonly used as an endogenous marker to estimate the vol-
ume of ELF.[17] Urea concentrations are normally the same in
plasma and in ELF, since urea is non-polar and has a low
molecular weight that allows it to rapidly diffuse and establish
an equilibrium across the capillary-alveolar membrane. By
measuring the urea in BAL aspirate and plasma, a ratio can be
calculated and the dilution of the apparent volume of ELF can
be estimated (equation 1):
ELF volume¼Volume aspirated � Urea ðBAL aspirateÞ
Urea ðplasmaÞ
(Eq: 1Þ
Using the calculated value of the ELF volume, the drug
concentration in ELF (CELF) can be estimated as follows
(equation 2):
CELF¼Volume of BAL
ELF volume� CBAL (Eq. 2)
where CBAL is the drug concentration measured in BAL.
The techniques of bronchoscopy and BAL are associated
with a low level of technical complexity.[12] However, our re-
view of the literature indicates that the technique for perform-
ing BAL differs among investigators, with the main variations
being the dwell time, the aspiration pressure, the volume of fluid
injected and the number of BAL aspirates collected.[11,15,16,18] In
addition, different assay methodologies and analytical kits are
used to measure urea in BAL and plasma. Each of these vari-
ables may influence the correction for ELF dilution and the
apparent volume of ELF. It has been suggested by some re-
searchers that overestimation of the ELF volume (and thus
underestimation of drug concentrations) can range from 100%to 300%.[9,11,13,16] It has also been suggested that lysis of cells
(e.g. AMs) in the collected BAL fluid increases the measured
concentrations of anti-infective agents in ELF.[12,13,15] Finally,
alterations in the ELF volume, cell counts and protein con-
centrations in BAL have been associated with subjects who
smoke and/or have interstitial lung disease.[19,20] Therefore it isrecommended that a standardized BAL procedure be estab-
lished and used consistently to ensure that technical errors are
minimized and that distal ELF samples are obtained. The as-
says for urea in plasma and BAL need to be precise and reliable.
Subject recruitment needs to be carefully considered in order to
minimize unexpected variability. Accurate understanding of
the methodology and strict adherence to the procedures are
crucial to minimize known sources of error.
Other shortcomings include the difficulty of obtaining
multiple ELF samples from the same subject at several sam-
pling timepoints, because of the nature of the BAL proce-
dure.[12,13] As a result, clinical studies require a larger number of
subjects who are randomized to a single BAL sampling time.
Penetration of Antibacterial Agents into Pulmonary ELF 639
ª 2011 Adis Data Information BV. All rights reserved. Clin Pharmacokinet 2011; 50 (10)
Several studies from Japan have been able to overcome this
issue by using bronchoscopy with bronchoscopic microsampl-
ing (BMS) probes.[21-25] This technique obtains samples of ELF
from the bronchial space (whereas BAL samples are obtained
from the alveolar space) and does not require measurement of
urea concentrations. Differences in methodology and sampling
sites explain, in part, why anti-infective drug concentrations
have not always been similar when BMS and BAL were per-
formed in the same subjects.
1.2 Factors Influencing Penetration of Antimicrobials into
ELF and Comparison with Plasma Concentrations
There are many factors that influence antimicrobial pene-
tration into the pulmonary compartments.[8,9,11-13,15,16] Anti-
infective agents must cross the blood-bronchus barrier to reach
the alveolar ELF and the lung interstitium in order to achieve
adequate concentrations. This barrier is composed of an
alveolar-capillary membrane. The capillary endothelium is re-
latively permeable; however, the alveolar membrane is virtually
impermeable because of the presence of tight junctions. The
major mode of transport between membranes occurs through
passive diffusion. Protein binding determines the amount of the
unbound drug that is present to diffuse through membranes,
explaining why antimicrobials with a high degree of protein
binding do not penetrate well into lung tissue. The degree of
lipophilicity, as well as administration of the drug in an un-
ionized form, determine how well the antimicrobial will pene-
trate tissue.[8,9,11-13,15,16] Other factors that favour penetration
include the pHat the site of infection and other dynamic processes
such as bronchial inflammation at the site of infection.[5,8,11]
Concentrations of anti-infective agents in ELF are con-
sidered to provide useful and accurate estimates for determin-
ing extracellular drug penetration in the lungs. Various methods
have been suggested to compare plasma and ELF concentra-
tions of anti-infective agents. Nearly all studies report com-
parisons of concentrations (e.g. ELF and plasma concentrations)
that were simultaneously obtained at both sites. In fact, that is
how the data are reported in our tables for the various classes of
antibacterial agents. However, since the concentration-time
profiles of drugs in plasma and ELF can increase and decrease
at different paces from each other (known as system hysteresis),
penetration ratios will vary in magnitude with the sampling
time(s) chosen. To overcome this issue, it is recommended that
research studies determine penetration ratios from estimates of
the area under the concentration-time curve (AUC) values of
plasma and ELF data.[26,27] Accurate estimates of the AUC can
be obtained even when drug concentrations are only sparsely
sampled. Where ratios based on AUC estimates have been re-
ported, we have incorporated them into the text of our review.
1.3 Pharmacokinetic-Pharmacodynamic Parameters
of Efficacy
Our knowledge and understanding of the pharmacokinetic-
pharmacodynamic parameters of anti-infective agents have
grown substantially over the past 30 years.[2-4]Application of these
parameters has had a major influence on the dose selection, the
dosing interval and/or mode of administration, development of
in vivo susceptibility breakpoint determinations, assessment of
bacterial resistance and the clinical drug development process.
This information has had an impact on how anti-infective agents
are used at the bedside and developed in research.
Pharmacokinetic-pharmacodynamic parameters that cor-
relate with the efficacy of specific anti-infective agents include
(i) the percentage of time during which unbound (free) drug
concentrations remain above the MIC of an infecting micro-
organism (fT>MIC) [in the case of b-lactams (e.g. penicillins,
cephalosporins, carbapenems, monobactams), linezolid or ori-
tavancin];[2-4,7] (ii) the ratio of the maximum unbound con-
centration (fCmax) to the MIC of an infecting micro-organism
(fCmax/MIC) [in the case of aminoglycosides, fluoroquinolones,
daptomycin, oritavancin ormetronidazole];[2-4,7] and (iii) the ratio
of the unbound AUC during a 24-hour time period (fAUC24)
to the MIC of an infecting micro-organism (fAUC24/MIC) [in
the case of fluoroquinolones, aminoglycosides, azithromycin,
clarithromycin, telithromycin, doxycycline, tigecycline, van-
comycin, daptomycin, telavancin, linezolid, clindamycin or
quinupristin/dalfopristin].[2-4,6,7]
The concepts and categorization of the pharmacokinetic-
pharmacodynamic parameters of anti-infective agents have
been based on relationships established from plasma or serum
concentrations.[2-4] We are unaware of any clinical studies that
have evaluated and documented similar correlations with con-
centrations at the site of infection (e.g. ELF) for community- or
hospital-acquired lower respiratory tract infections.[6,7] While
many of the reports that are included in this review have de-
scribed pharmacokinetic-pharmacodynamic parameters by
using ELF concentration-time data, caution must be applied in
presuming that the magnitude of exposure required in ELF
and/or the relationship between parameters and outcomes are
the same or even similar to those observed in plasma. Studies
are needed in patients with lower respiratory tract infections to
confirm and explore the relationships between ELF con-
centrations, clinical and microbiological outcomes, and phar-
macodynamic parameters.
640 Rodvold et al.
ª 2011 Adis Data Information BV. All rights reserved. Clin Pharmacokinet 2011; 50 (10)
2. b-Lactams
Intrapulmonary penetration studies have been conducted with
b-lactam agents since the early 1990s. Oral and intravenous
cephalosporins have accounted for the majority of these studies
(tables I and II).[28-41] b-lactam–b-lactamase inhibitor combina-
tions (e.g. amoxicillin/clavulanic acid, piperacillin/tazobactam)
have been evaluated for the penicillin class. Several carbapenem
agents (e.g. meropenem, ertapenem, biapenam) have been studied.
NoELF data have been reported for themonobactam aztreonam.
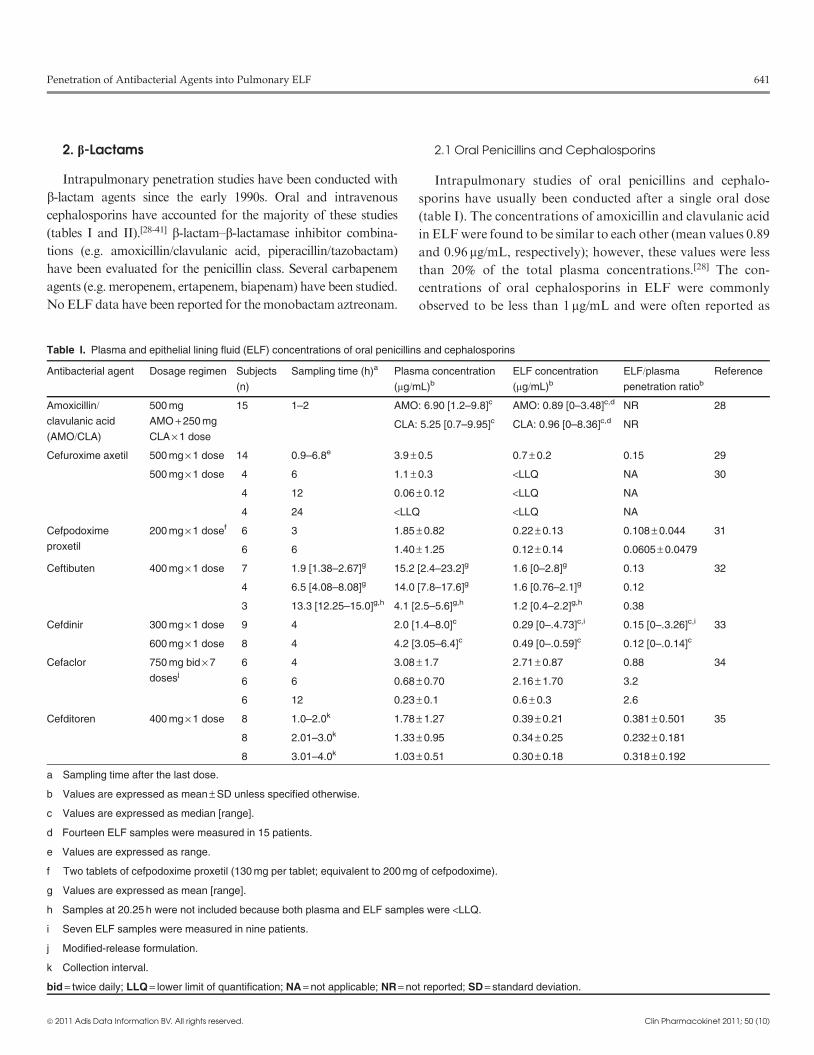
2.1 Oral Penicillins and Cephalosporins
Intrapulmonary studies of oral penicillins and cephalo-
sporins have usually been conducted after a single oral dose
(table I). The concentrations of amoxicillin and clavulanic acid
in ELFwere found to be similar to each other (mean values 0.89
and 0.96 mg/mL, respectively); however, these values were less
than 20% of the total plasma concentrations.[28] The con-
centrations of oral cephalosporins in ELF were commonly
observed to be less than 1 mg/mL and were often reported as
Table I. Plasma and epithelial lining fluid (ELF) concentrations of oral penicillins and cephalosporins
Antibacterial agent Dosage regimen Subjects
(n)
Sampling time (h)a Plasma concentration
(mg/mL)bELF concentration
(mg/mL)bELF/plasma
penetration ratiob
Reference
Amoxicillin/clavulanic acid
(AMO/CLA)
500 mg
AMO + 250 mg
CLA · 1 dose
15 1–2 AMO: 6.90 [1.2–9.8]c AMO: 0.89 [0–3.48]c,d NR 28
CLA: 5.25 [0.7–9.95]c CLA: 0.96 [0–8.36]c,d NR
Cefuroxime axetil 500 mg · 1 dose 14 0.9–6.8e 3.9 – 0.5 0.7 – 0.2 0.15 29
500 mg · 1 dose 4 6 1.1 – 0.3 <LLQ NA 30
4 12 0.06 – 0.12 <LLQ NA
4 24 <LLQ <LLQ NA
Cefpodoxime
proxetil
200 mg · 1 dosef 6 3 1.85 – 0.82 0.22 – 0.13 0.108 – 0.044 31
6 6 1.40 – 1.25 0.12 – 0.14 0.0605 – 0.0479
Ceftibuten 400 mg · 1 dose 7 1.9 [1.38–2.67]g 15.2 [2.4–23.2]g 1.6 [0–2.8]g 0.13 32
4 6.5 [4.08–8.08]g 14.0 [7.8–17.6]g 1.6 [0.76–2.1]g 0.12
3 13.3 [12.25–15.0]g,h 4.1 [2.5–5.6]g,h 1.2 [0.4–2.2]g,h 0.38
Cefdinir 300 mg · 1 dose 9 4 2.0 [1.4–8.0]c 0.29 [0–.4.73]c,i 0.15 [0–.3.26]c,i 33
600 mg · 1 dose 8 4 4.2 [3.05–6.4]c 0.49 [0–.0.59]c 0.12 [0–.0.14]c
Cefaclor 750 mg bid · 7
dosesj
6 4 3.08 – 1.7 2.71 – 0.87 0.88 34
6 6 0.68 – 0.70 2.16 – 1.70 3.2
6 12 0.23 – 0.1 0.6 – 0.3 2.6
Cefditoren 400 mg · 1 dose 8 1.0–2.0k 1.78 – 1.27 0.39 – 0.21 0.381 – 0.501 35
8 2.01–3.0k 1.33 – 0.95 0.34 – 0.25 0.232 – 0.181
8 3.01–4.0k 1.03 – 0.51 0.30 – 0.18 0.318 – 0.192
a Sampling time after the last dose.
b Values are expressed as mean – SD unless specified otherwise.
c Values are expressed as median [range].
d Fourteen ELF samples were measured in 15 patients.
e Values are expressed as range.
f Two tablets of cefpodoxime proxetil (130 mg per tablet; equivalent to 200 mg of cefpodoxime).
g Values are expressed as mean [range].
h Samples at 20.25 h were not included because both plasma and ELF samples were <LLQ.
i Seven ELF samples were measured in nine patients.
j Modified-release formulation.
k Collection interval.
bid = twice daily; LLQ = lower limit of quantification; NA = not applicable; NR = not reported; SD = standard deviation.
Penetration of Antibacterial Agents into Pulmonary ELF 641
ª 2011 Adis Data Information BV. All rights reserved. Clin Pharmacokinet 2011; 50 (10)
undetectable.[29-35,42] The ratios of ELF concentrations to total
plasma concentrations ranged from 0.1 to 0.38, suggesting low
to moderate penetration into the ELF. The exception to this oc-
curred followingmultiple doses of a modified-release formulation
of cefaclor 750mg.[34] The ELF concentrations of cefaclor were
similar to the total plasma concentrations (mean values 2.71 and
3.08mg/mL, respectively, at 4 hours) or exceeded the total plasma
concentrations (mean values 2.16 and 0.68mg/mL, respectively, at
6 hours; and 0.60 and 0.23mg/mL, respectively, at 12 hours).
Several methodological limitations of the intrapulmonary
studies of oral penicillins and cephalosporins should be noted.
Sampling times were often restricted in number and were often
limited to the first few hours after antimicrobial administration,
thus they did not include the entire dosing interval. The ratios of
ELF concentrations to plasma concentrations were based on
concentrations at these specific sampling times as opposed to a
more accurate comparison being made by estimating AUCs for
ELF and plasma. These issues probably contributed to the
large difference between plasma and ELF concentrations,
secondary to system hysteresis (e.g. concentrations in plasma
and ELF often increase and decrease at different paces from
each other). In addition, the ratios of ELF to plasma con-
centrations were based on total (versus unbound) plasma drug
concentrations. Finally, the lower level of detection for mea-
suring drug concentrations was limited, since two-thirds of the
studies used microbiological assays. While a few recent studies
Table II. Plasma and epithelial lining fluid (ELF) concentrations of parenteral penicillins and cephalosporins
Antibacterial
agent
Dosage regimen Subjects
(n)
Sampling
time (h)aPlasma concentration
(mg/mL)bELF concentration
(mg/mL)bELF/plasma
penetration ratiob
Reference
Piperacillin/tazobactam
(PIP/TAZ)
4 g PIP + 500 mg TAZ IV
0.5 h infusion q8h
10 Steady statec PIP: 24.0 – 13.8 PIP: 13.6 – 9.4 PIP: 0.568 – 0.336 36
TAZ: 2.4 – 1.2 TAZ: 2.1 – 1.1 TAZ: 0.913 – 0.277
Cefpirome 1 g IV 0.5 h infusion · 1 dose 37 0.5–7d 34.5 – 3.3e 7.2 – 1.1e,f 0.359 – 0.074e,f 37
Ceftazidime 1 g IM · 1 dose 5 1 39.89 – 10.42 2.71 – 0.88 NR 38
5 2 36.04 – 9.21 2.66 – 0.64 NR
5 4 13.34 – 4.12 1.32 – 0.64 NR
5 8 6.08 – 1.71 0.66 – 0.36 NR
5 12 1.07 – 0.45 0.12 – 0.15 NR
2 g 0.5 h IV infusion · 1 dose
then continuous IV infusion
of 4 g/d
15 8, 12, 18g 39.6 – 15.2 8.2 – 4.8 0.206 – 0.089 39
Cefepime 2 g IV 0.5 h infusion · 1 dose
then continuous IV infusion
of 4 g/d
7 8g 13.5 – 3.2h 13.7 – 3.0 1.01 40
7 12g 13.7 – 3.5h 13.5 – 3.3 0.99
6 18g 13.3 – 3.6h 14.9 – 2.3 1.12
Ceftobiprole 500 mg IV 2 h infusion
q8h · 4 doses
6 2.5 17.68 – 4.48 2.55 – 0.99 0.255 – 0.366i 41
6 4 12.77 – 2.26 2.00 – 1.07
6 6 6.91 – 4.58 4.58 – 5.82
6 8 3.65 – 1.05 1.51 – 0.39
a Sampling time after the start of the infusion unless specified otherwise.
b Values are expressed as mean – SD unless specified otherwise.
c Samples were collected at steady state after 2 d of therapy and at 5 h after a dose.
d Values are expressed as range.
e Values are expressed as mean – SEM.
f Eight samples were available.
g Serum and ELF concentrations were sampled after 2 d of therapy at 8, 12 and 18 h during a continuous infusion.
h Twenty concentrations were available at each sampling time.
i The penetration ratio was calculated from AUC values for ELF and plasma.
AUC = area under the concentration-time curve; IM = intramuscularly; IV = intravenous; NR = not reported; q8h = every 8 h; SD = standard deviation;
SEM = standard error of the mean.
642 Rodvold et al.
ª 2011 Adis Data Information BV. All rights reserved. Clin Pharmacokinet 2011; 50 (10)
have overcome most of these limitations, the ELF concentra-
tions of cefuroxime were still undetectable throughout the en-
tire dosing interval, and the percentages of penetration by
ceftibuten and cefdinir into ELFwere still less than 40%.[30,32,33]
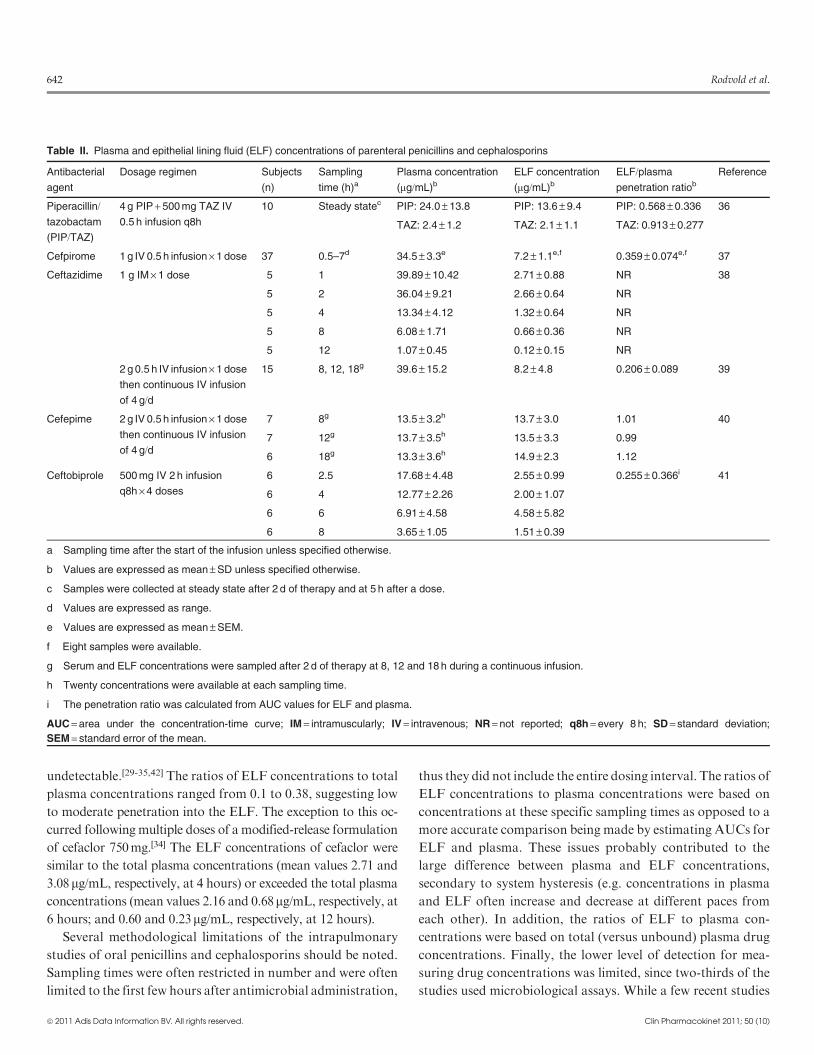
2.2 Parenteral Penicillins and Cephalosporins
Intrapulmonary studies of parenteral penicillins and ceph-
alosporins have included a variety of subject types, modes of
drug administration and differences in BAL collection tech-
niques (table II). In critically ill patients with severe nosocomial
pneumonia, three studies have been conducted using micro-
lavage to determine ELF and plasma concentrations of
piperacillin-tazobactam, ceftazidime and cefepime.[36,38,39] The
mean (– standard deviation [SD]) concentrations of piperacillin
and tazobactam following at least 2 days of therapy with an
intravenous dosage regimen of 4 and 0.5 g every 8 hours were
13.6 – 9.4 and 2.1 – 1.1 mg/mL, respectively, which were ap-
proximately 57% and 91%, respectively, of the total plasma
concentrations.[36] The same researchers used a similar study
design and methods to evaluate the intrapulmonary penetra-
tion of ceftazidime and cefepime in critically ill patients re-
ceiving continuous intravenous infusions of 4 g/day.[38,39] Themean (– SD) concentrations of ceftazidime and cefepime were
8.2 – 4.8 and 14.1 – 2.8 mg/mL, respectively. However, the re-
spective ratios of ELF to total plasma concentrations were
0.21 and 1.04. Unlike those of other parenteral cephalosporins
whose ELF to total plasma concentration ratios range between
7% and 36%, the concentrations of cefepime in ELF were
similar to or exceeded the total and unbound plasma con-
centrations (protein binding of cefepime is approximately
20%).[40,43] The discordance in penetration among the par-
enteral cephalosporins does not seem to be related to differ-
ences in structure or protein binding (range 10–20%).
A novel study design was used to evaluate drug exposure in
ELF of ceftobiprole for the treatment of pneumonia caused by
meticillin (methicllin)-resistant Staphylococcus aureus.[41] Pop-
ulation pharmacokinetic modelling of ELF and plasma con-
centrations from both animal and human data were used in
Monte Carlo simulations to evaluate the probabilities of achiev-
ing a desired target attainment based on bacterial killing rates
obtained from a preclinical pneumonia model in neutropenic
mice.[44] For a dosage regimen of ceftobiprole 500mg every
8 hours as a 2-hour intravenous infusion, the probabilities of
achieving 1-log and 2-log cell kill rates were 85.6% and 79.7%,
respectively, over the MIC distribution of 4958 isolates. This
study provided a logical approach for evaluating dosage regi-
mens for the treatment of lower respiratory tract infections,
based on preclinical infection models, the pharmacokinetic-
pharmacodynamic characteristics of the agent being studied
and drug exposure information at the site of infection (e.g. the
lung). In addition, this study allowed differences in ELF pe-
netration in mice versus man (68.8% vs 25.5%) to be accounted
for and dosage selection in humans to be evaluated.[41,44]
2.3 Carbapenems
Single- and multiple-dose studies have evaluated the in-
trapulmonary penetration of meropenem and ertapenem
(table III).[45-48] The mean concentrations of meropenem in
ELF and the penetration ratios ranged from 7.07 to 0.59 mg/mL
and from 0.51 to 1.04, respectively, in 30 subjects administered
a single 1 g dose intravenously over 30 minutes.[45] A similar
range of ELF and plasma concentrations was observed fol-
lowing multiple doses of 1 g every 8 hours in healthy adult
subjects.[46] In both studies, concentrations of meropenem in
ELF at 8 hours were undetectable or extremely low (mean
0.03 mg/mL). While plasma concentrations increased pro-
portionally as doses of meropenem were increased, concentra-
tions in ELF tended to decrease as meropenem doses increased.
The ratios of ELF concentrations to total plasma concentra-
tions ranged from 0.49 to 0.80 for the 500mg dose, from 0.32 to
0.53 for the 1 g dose and from 0.048 to 0.219 for the 2 g dose.[46]
It is unclear why this disproportionate percentage change in
ELF concentrations occurred. In contrast to these findings, a
mean penetration ratio (based on ratios of the AUC) of 0.72%was observed in critically ill patients with ventilator-associated
pneumonia receiving 3-hour infusions of meropenem 2 g ad-
ministered every 8 hours.[49] Subsequently, pharmacokinetic
simulations based on the mean parameter vector of these data
suggested that ELF concentrations of meropenem are main-
tained aboveMICvalues of£1mg/mL for nearly 30%of the dosing
interval.[50] Similar median penetration ratios were observed with
Bayesian parameter estimates of patients with ELF sampling
(0.264) and a 9999-subject Monte Carlo simulation (0.254).
Two studies have evaluated the penetration of ertapenem
into ELF.[47,48] In 15 adult patients undergoing thoracotomy,
the mean ELF concentrations of ertapenem ranged from 2.11
to 4.06 mg/mL during the first 5 hours after a single periopera-
tive dose of 1 g.[47] The mean ratios of ELF concentrations to
total plasma concentrations ranged from 0.062 to 0.094. In
comparison, adult patients treated for early-onset ventilator-
associated pneumonia had median ELF concentrations of
9.4 and 0.3 mg/mL at 1 and 24 hours, respectively, after multiple
doses of ertapenem 1 g once daily.[48] The ratios of ELF con-
centrations to total plasma concentrations ranged from 0.21 to
Penetration of Antibacterial Agents into Pulmonary ELF 643
ª 2011 Adis Data Information BV. All rights reserved. Clin Pharmacokinet 2011; 50 (10)
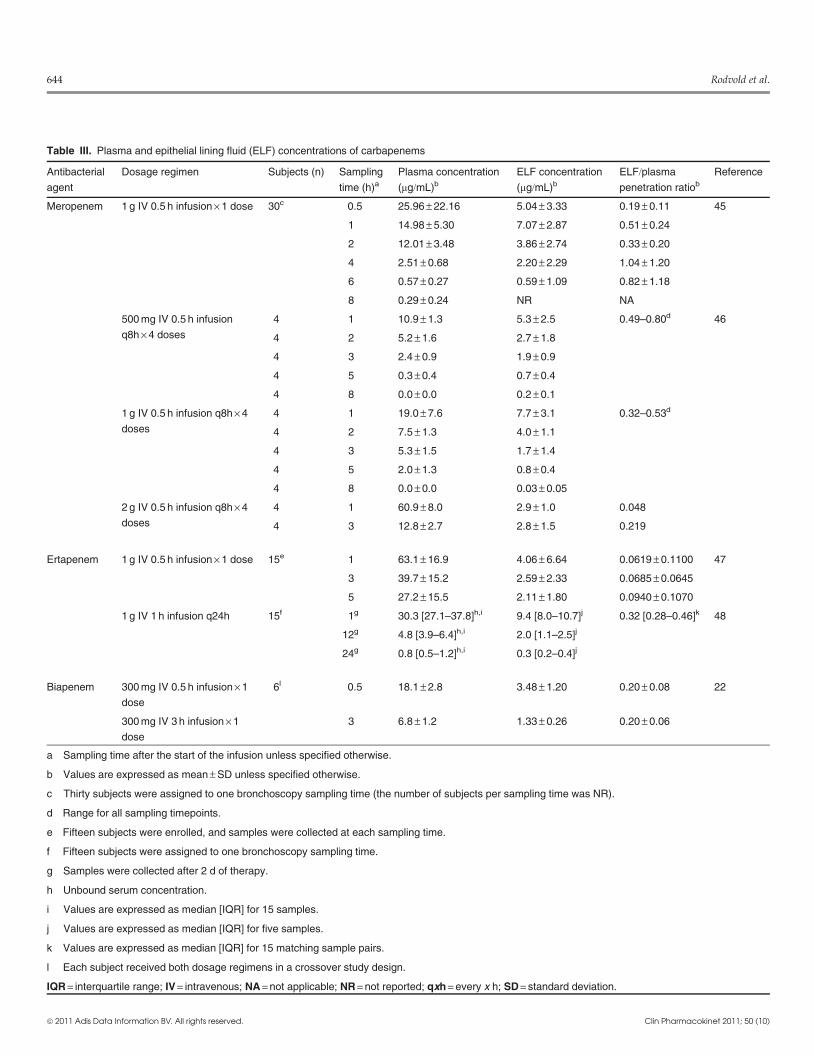
Table III. Plasma and epithelial lining fluid (ELF) concentrations of carbapenems
Antibacterial
agent
Dosage regimen Subjects (n) Sampling
time (h)aPlasma concentration
(mg/mL)bELF concentration
(mg/mL)bELF/plasma
penetration ratiob
Reference
Meropenem 1 g IV 0.5 h infusion · 1 dose 30c 0.5 25.96 – 22.16 5.04 – 3.33 0.19 – 0.11 45
1 14.98 – 5.30 7.07 – 2.87 0.51 – 0.24
2 12.01 – 3.48 3.86 – 2.74 0.33 – 0.20
4 2.51 – 0.68 2.20 – 2.29 1.04 – 1.20
6 0.57 – 0.27 0.59 – 1.09 0.82 – 1.18
8 0.29 – 0.24 NR NA
500 mg IV 0.5 h infusion
q8h · 4 doses
4 1 10.9 – 1.3 5.3 – 2.5 0.49–0.80d 46
4 2 5.2 – 1.6 2.7 – 1.8
4 3 2.4 – 0.9 1.9 – 0.9
4 5 0.3 – 0.4 0.7 – 0.4
4 8 0.0 – 0.0 0.2 – 0.1
1 g IV 0.5 h infusion q8h · 4
doses
4 1 19.0 – 7.6 7.7 – 3.1 0.32–0.53d
4 2 7.5 – 1.3 4.0 – 1.1
4 3 5.3 – 1.5 1.7 – 1.4
4 5 2.0 – 1.3 0.8 – 0.4
4 8 0.0 – 0.0 0.03 – 0.05
2 g IV 0.5 h infusion q8h · 4
doses
4 1 60.9 – 8.0 2.9 – 1.0 0.048
4 3 12.8 – 2.7 2.8 – 1.5 0.219
Ertapenem 1 g IV 0.5 h infusion · 1 dose 15e 1 63.1 – 16.9 4.06 – 6.64 0.0619 – 0.1100 47
3 39.7 – 15.2 2.59 – 2.33 0.0685 – 0.0645
5 27.2 – 15.5 2.11 – 1.80 0.0940 – 0.1070
1 g IV 1 h infusion q24h 15f 1g 30.3 [27.1–37.8]h,i 9.4 [8.0–10.7]j 0.32 [0.28–0.46]k 48
12g 4.8 [3.9–6.4]h,i 2.0 [1.1–2.5]j
24g 0.8 [0.5–1.2]h,i 0.3 [0.2–0.4]j
Biapenem 300 mg IV 0.5 h infusion · 1
dose
6l 0.5 18.1 – 2.8 3.48 – 1.20 0.20 – 0.08 22
300 mg IV 3 h infusion · 1
dose
3 6.8 – 1.2 1.33 – 0.26 0.20 – 0.06
a Sampling time after the start of the infusion unless specified otherwise.
b Values are expressed as mean – SD unless specified otherwise.
c Thirty subjects were assigned to one bronchoscopy sampling time (the number of subjects per sampling time was NR).
d Range for all sampling timepoints.
e Fifteen subjects were enrolled, and samples were collected at each sampling time.
f Fifteen subjects were assigned to one bronchoscopy sampling time.
g Samples were collected after 2 d of therapy.
h Unbound serum concentration.
i Values are expressed as median [IQR] for 15 samples.
j Values are expressed as median [IQR] for five samples.
k Values are expressed as median [IQR] for 15 matching sample pairs.
l Each subject received both dosage regimens in a crossover study design.
IQR = interquartile range; IV = intravenous; NA = not applicable; NR = not reported; qxh = every x h; SD = standard deviation.
644 Rodvold et al.
ª 2011 Adis Data Information BV. All rights reserved. Clin Pharmacokinet 2011; 50 (10)
0.64 (median 0.32). Since ertapenem is highly protein bound
(e.g. 96% at 10 mg/mL and 84% at 300 mg/mL), the penetration
ratios in both studies are closer to or greater than 1 if unbound
plasma concentrations are considered.
Kikuchi et al.[22] compared ELF concentrations in six healthy
adult subjects administered a single dose of biapenem 300mg as
0.5-hour and 3-hour intravenous infusions. Themean (– SD)ELF
concentrations were 3.48– 1.20mg/mL at the end of the 0.5-hour
infusion and 1.33– 0.26mg/mL at the end of the 3-hour infusion.
The mean penetration ratios of ELF concentrations to total
plasma concentrations were 0.20 for both infusion periods. These
authors also evaluated a BMS technique, which used a polyester
fibre rod probe to repeatedly obtain ELF concentrations at the
surface of a bronchus (termed ‘bronchial ELF’). In contrast to the
BAL sampling technique, bronchial ELF concentrations were
higher with the 3-hour infusion (4.36– 2.07mg/mL) than with the
0.5-hour infusion (2.35– 1.06mg/mL). No explanations were
provided for the discrepancies between the two techniques.
3. Macrolides, Azalides and Ketolides
Intrapulmonary studies have been commonly conducted for
agents from the antibacterial classes of macrolides, azalides and
ketolides (tables IV–VII).[23,24,30,51-68] The majority of reported
studies have evaluated clarithromycin, azithromycin and teli-
thromycin. Although the number of studies is small, data are
available for older macrolide agents such as erythromycin,
roxithromycin and dirithromycin, as well as the investigational
ketolide cethromycin.
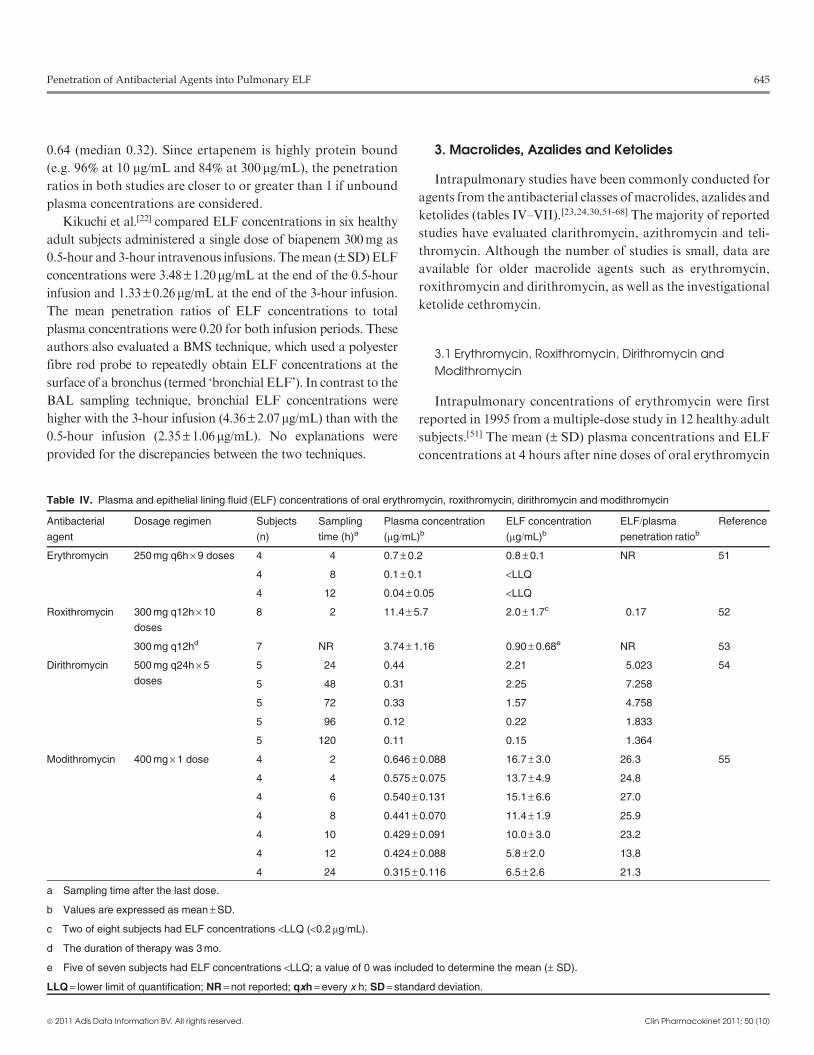
3.1 Erythromycin, Roxithromycin, Dirithromycin and
Modithromycin
Intrapulmonary concentrations of erythromycin were first
reported in 1995 from a multiple-dose study in 12 healthy adult
subjects.[51] The mean (– SD) plasma concentrations and ELF
concentrations at 4 hours after nine doses of oral erythromycin
Table IV. Plasma and epithelial lining fluid (ELF) concentrations of oral erythromycin, roxithromycin, dirithromycin and modithromycin
Antibacterial
agent
Dosage regimen Subjects
(n)
Sampling
time (h)aPlasma concentration
(mg/mL)bELF concentration
(mg/mL)bELF/plasma
penetration ratiob
Reference
Erythromycin 250 mg q6h · 9 doses 4 4 0.7 – 0.2 0.8 – 0.1 NR 51
4 8 0.1 – 0.1 <LLQ
4 12 0.04 – 0.05 <LLQ
Roxithromycin 300 mg q12h · 10
doses
8 2 11.4 – 5.7 2.0 – 1.7c 0.17 52
300 mg q12hd 7 NR 3.74 – 1.16 0.90 – 0.68e NR 53
Dirithromycin 500 mg q24h · 5
doses
5 24 0.44 2.21 5.023 54
5 48 0.31 2.25 7.258
5 72 0.33 1.57 4.758
5 96 0.12 0.22 1.833
5 120 0.11 0.15 1.364
Modithromycin 400 mg · 1 dose 4 2 0.646 – 0.088 16.7 – 3.0 26.3 55
4 4 0.575 – 0.075 13.7 – 4.9 24.8
4 6 0.540 – 0.131 15.1 – 6.6 27.0
4 8 0.441 – 0.070 11.4 – 1.9 25.9
4 10 0.429 – 0.091 10.0 – 3.0 23.2
4 12 0.424 – 0.088 5.8 – 2.0 13.8
4 24 0.315 – 0.116 6.5 – 2.6 21.3
a Sampling time after the last dose.
b Values are expressed as mean – SD.
c Two of eight subjects had ELF concentrations <LLQ (<0.2 mg/mL).
d The duration of therapy was 3 mo.
e Five of seven subjects had ELF concentrations <LLQ; a value of 0 was included to determine the mean (– SD).
LLQ = lower limit of quantification; NR = not reported; qxh = every x h; SD = standard deviation.
Penetration of Antibacterial Agents into Pulmonary ELF 645
ª 2011 Adis Data Information BV. All rights reserved. Clin Pharmacokinet 2011; 50 (10)

250mg every 6 hours were similar: 0.7 – 0.2 and 0.8 – 0.1 mg/mL,
respectively. Unfortunately, the two other sampling times
(8 and 12 hours) in this study were outside the dosing interval,
and the concentrations of erythromycin were reported as un-
detectable (assay sensitivity = 0.05 mg/mL). Patients treated
with oral erythromycin 250mg every 6 hours for 28 days had
measurable ELF concentrations at 2, 4 and 8 hours after the last
dose administration.[69] Themean 2-hour ELF concentration of
erythromycin was 0.97 mg/mL, and a similar 4-hour concen-
tration was observed in the healthy subject study.
In eight patients with mild chronic bronchitis treated with
oral roxithromycin 300mg every 12 hours for 5 days, the ELF
concentration (mean –SD 2.0 – 1.7 mg/mL) was only 17% of
the simultaneously measured plasma concentration (mean–SD 8.1 – 4.0 mg/mL).[52] In comparison, the concentration of
roxithromycin in AMs was significantly higher (mean– SD
Table V. Plasma and epithelial lining fluid (ELF) concentrations of oral clarithromycin
Dosage regimen Subjects (n) Sampling time (h)a Plasma concentration
(mg/mL)bELF concentration
(mg/mL)bELF/plasma
penetration ratiob
Reference
200 mg · 1 dose 5 3 0.36 – 0.07 4.84 – 3.39 14 23
500 mg · 1 dose 4 6 1.0 – 0.6 39.6 – 41.1 NR 30
4 12 0.25 – 0.21 <LLQ NR
4 24 0.07 – 0.05 <LLQ NR
4 48 <LLQ <LLQ NR
500 mg bid · 7 doses 10 4.25 – 0.27c 3.96 – 1.19c 20.46 – 6.7c NR 56
500 mg q12h · 9 doses 3 4 2.2 – 0.9 29.3 – 12.4 NR 51
4 8 2.6 – 0.5 72.1 – 73.0 NR
4 12 0.8 – 0.3 48.6 – 46.8 NR
3 24 0.5 – 0.07 11.9 – 3.6 NR
4 48 0.01 – 0.03 23.4 – 19.2 NR
500 mg q12h · 9 doses 5 4 3.29 – 0.94 34.02 – 5.16 11 57
5 8 1.58 – 0.50 20.36 – 4.49 14
5 12 0.91 – 0.59 23.01 – 11.90 28
5 24 0.19 – 0.09 4.17 – 0.29d 31
500 mg q12h · 9 doses 5 4 2.00 – 0.60 34.5 – 29.3 NR 58
5 8 1.55 – 0.42 26.1 – 7.2 NR
5 12 1.22 – 0.35 15.1 – 11.1 NR
5 24 0.23 – 0.11 4.6 – 3.7 NR
1000 mg q24h · 5 dosese 7 3 1.54 – 0.60 6.38 – 3.92 NR 59
7 6 1.43 – 0.42 6.89 – 4.19 NR
7 9 2.22 – 0.60 11.50 – 6.65 NR
7 12 1.04 – 0.42 7.14 – 7.29 NR
7 24 0.75 – 0.35 6.80 – 3.39f NR
7 48 0.156g 6.08g NR
a Sampling time after the last dose.
b Values are expressed as mean – SD unless specified otherwise.
c Values are expressed as mean – SEM.
d Three of five subjects had concentrations <LLQ.
e The clarithromycin formulation used in this study was an extended-release tablet.
f Five of seven subjects had concentrations <LLQ.
g Six of seven subjects had concentrations <LLQ.
bid = twice daily; LLQ = lower limit of quantification; NR = not reported; qxh = every x h; SD = standard deviation; SEM = standard error of the mean.
646 Rodvold et al.
ª 2011 Adis Data Information BV. All rights reserved. Clin Pharmacokinet 2011; 50 (10)
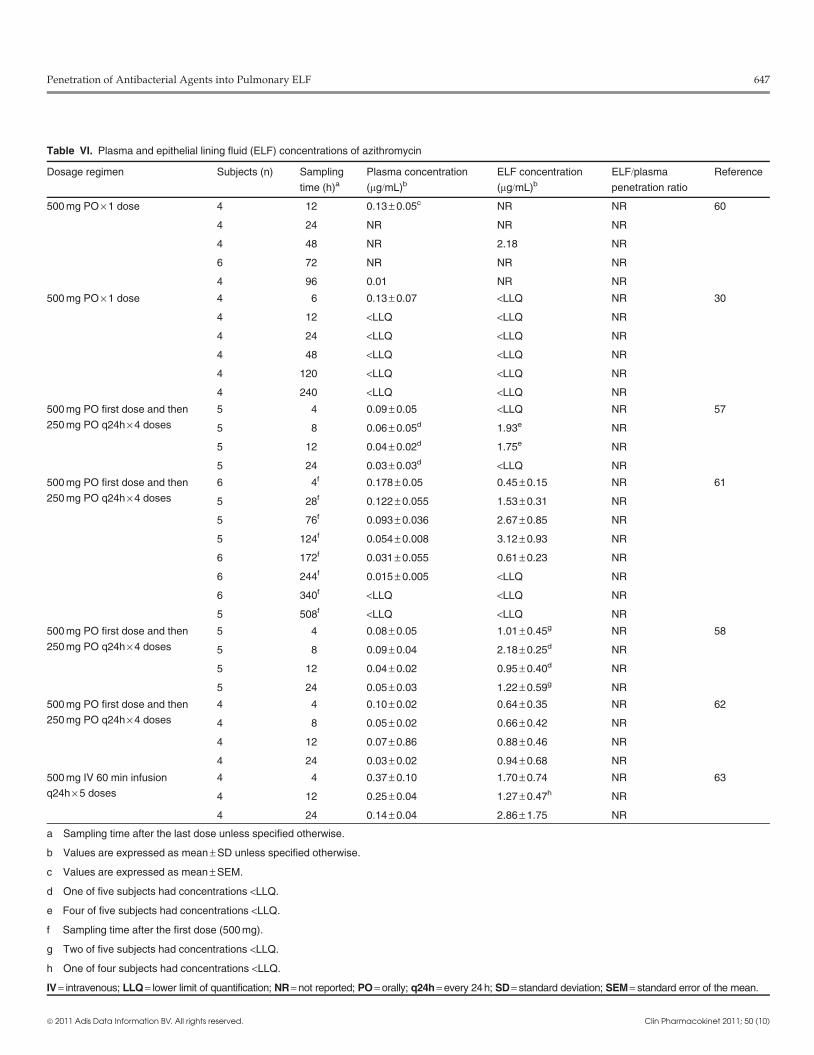
Table VI. Plasma and epithelial lining fluid (ELF) concentrations of azithromycin
Dosage regimen Subjects (n) Sampling
time (h)aPlasma concentration
(mg/mL)bELF concentration
(mg/mL)bELF/plasma
penetration ratio
Reference
500 mg PO · 1 dose 4 12 0.13 – 0.05c NR NR 60
4 24 NR NR NR
4 48 NR 2.18 NR
6 72 NR NR NR
4 96 0.01 NR NR
500 mg PO · 1 dose 4 6 0.13 – 0.07 <LLQ NR 30
4 12 <LLQ <LLQ NR
4 24 <LLQ <LLQ NR
4 48 <LLQ <LLQ NR
4 120 <LLQ <LLQ NR
4 240 <LLQ <LLQ NR
500 mg PO first dose and then
250 mg PO q24h · 4 doses
5 4 0.09 – 0.05 <LLQ NR 57
5 8 0.06 – 0.05d 1.93e NR
5 12 0.04 – 0.02d 1.75e NR
5 24 0.03 – 0.03d <LLQ NR
500 mg PO first dose and then
250 mg PO q24h · 4 doses
6 4f 0.178 – 0.05 0.45 – 0.15 NR 61
5 28f 0.122 – 0.055 1.53 – 0.31 NR
5 76f 0.093 – 0.036 2.67 – 0.85 NR
5 124f 0.054 – 0.008 3.12 – 0.93 NR
6 172f 0.031 – 0.055 0.61 – 0.23 NR
6 244f 0.015 – 0.005 <LLQ NR
6 340f <LLQ <LLQ NR
5 508f <LLQ <LLQ NR
500 mg PO first dose and then
250 mg PO q24h · 4 doses
5 4 0.08 – 0.05 1.01 – 0.45g NR 58
5 8 0.09 – 0.04 2.18 – 0.25d NR
5 12 0.04 – 0.02 0.95 – 0.40d NR
5 24 0.05 – 0.03 1.22 – 0.59g NR
500 mg PO first dose and then
250 mg PO q24h · 4 doses
4 4 0.10 – 0.02 0.64 – 0.35 NR 62
4 8 0.05 – 0.02 0.66 – 0.42 NR
4 12 0.07 – 0.86 0.88 – 0.46 NR
4 24 0.03 – 0.02 0.94 – 0.68 NR
500 mg IV 60 min infusion
q24h · 5 doses
4 4 0.37 – 0.10 1.70 – 0.74 NR 63
4 12 0.25 – 0.04 1.27 – 0.47h NR
4 24 0.14 – 0.04 2.86 – 1.75 NR
a Sampling time after the last dose unless specified otherwise.
b Values are expressed as mean – SD unless specified otherwise.
c Values are expressed as mean – SEM.
d One of five subjects had concentrations <LLQ.
e Four of five subjects had concentrations <LLQ.
f Sampling time after the first dose (500 mg).
g Two of five subjects had concentrations <LLQ.
h One of four subjects had concentrations <LLQ.
IV = intravenous; LLQ = lower limit of quantification; NR = not reported; PO = orally; q24h = every 24h; SD = standard deviation; SEM = standard error of the mean.
Penetration of Antibacterial Agents into Pulmonary ELF 647
ª 2011 Adis Data Information BV. All rights reserved. Clin Pharmacokinet 2011; 50 (10)
21.0– 10.0mg/mL). In a study evaluating the immunoregulatory
effects of roxithromycin in patients with chronic respiratory
tract infections, the ELF concentrations were measurable in
only two of seven patients (1.56 and 4.77 mg/mL) who had re-
ceived 3 months of oral roxithromycin 300mg every 12 hours.[53]
The plasma concentrations in these two patients were 2.55 and
8.78 mg/mL, respectively.
Dirithromycin was one of the first macrolide agents for
which ELF concentrations were reported to be significantly
higher than concurrent plasma concentrations.[54] In 25 patients
Table VII. Plasma and epithelial lining fluid (ELF) concentrations of oral ketolides
Antibacterial agent Dosage regimen Subjects (n) Sampling
time (h)aPlasma concentration
(mg/mL)bELF concentration
(mg/mL)bELF/plasma
penetration ratiob
Reference
Telithromycin 600 mg · 1 dose 5 3 0.36 – 0.19 2.94 – 2.64 NR 24
600 mg od · 5 doses 5 3 0.63 – 0.11 7.51 – 4.54 12 24
600 mg od · 5 doses 6 2 NR 4.91 – 4.00 NR 64
6 8 NR 2.26 – 1.17 NR
800 mg od · 5 doses 6 2 NR 4.24 – 3.14 NR 64
6 8 NR 4.31 – 1.87 NR
800 mg od · 5 doses 7 2 1.86 – 0.31 14.89 – 11.35c 8.57 65
6 12 0.23 – 0.05d 3.27 – 1.68d 13.58
7 24 0.08 – 0.03 0.97 – 0.60c 16.77
800 mg od · 5 doses 6 2 1.97 – 1.64e 5.22 – 2.79 3 66
1 8 0.48 1.09 2
5 12 0.70 – 0.55 3.47 – 3.88 5
5 24 0.14 – 0.06 0.84 – 0.54 7
800 mg od · 5 doses 5 2 1.14f 5.5f NR 67
6 8 0.63f 3.7f 6.4
6 24 0.055f 0.82d,f 12.7
6 48 <0.03 0.17f,g NA
Cethromycin 150 mg od · 5 doses 5 2 0.12 – 0.08 0.9 – 1.0 NR 68
5 4 0.09 – 0.06 0.9 – 0.2 NR
5 8 0.04 – 0.02 0.8 – 0.5 NR
5 12 0.02 – 0.01 0.3 – 0.3 NR
5 24 0.01 – 0.11 0.1 – 0.1 NR
300 mg od · 5 doses 5 2 0.25 – 0.15 2.5 – 1.6 NR 68
5 4 0.38 – 0.21 2.7 – 2.0 NR
5 6 0.18 – 0.07 1.6 – 0.8 NR
5 8 0.09 – 0.03 0.9 – 0.8 NR
5 12 0.10 – 0.06 0.8 – 0.4 NR
5 24 0.01 – 0.01 0.1 – 0.1 NR
5 48 0.00 – 0.00 0.0 – 0.0 NR
a Sampling time after the last dose.
b Values are expressed as mean – SD unless specified otherwise.
c One of seven subjects had concentrations <LLQ.
d One of six subjects had concentrations <LLQ.
e Five of six subjects had plasma samples available.
f Values are expressed as median.
g Three of six subjects had concentrations <LLQ.
LLQ = lower limit of quantification; NA = not applicable; NR = not reported; od = once daily; SD = standard deviation.
648 Rodvold et al.
ª 2011 Adis Data Information BV. All rights reserved. Clin Pharmacokinet 2011; 50 (10)
treated for acute exacerbation of chronic bronchitis, the mean
ELF concentrations during the first 24–72 hours after five oral
doses of dirithromycin 500mg once daily ranged from 1.57
to 2.25 mg/mL. Subsequent mean ELF concentrations were
0.22 mg/mL at 96 hours and 0.15 mg/mL at 120 hours. In com-
parison, the mean plasma concentrations ranged from
0.44 mg/mL at 24 hours to 0.11 mg/mL at 120 hours. A similar
range of ELF concentrations was observed between 2 and
24 hours (approximately 2.37 mg/mL) after the last oral dose of
dirithromycin 500mg once daily in 20 patients treated for acute
exacerbation of mild chronic obstructive pulmonary disease.[69]
The investigational bridged bicyclic macrolide (bicyclolide)
modithromycin (also known as S-013420 and EDP-420) has
recently been studied in healthy Japanese subjects.[55] Follow-
ing a single oral dose of 400mg, the mean concentrations
of modithromycin in ELF between 2 and 24 hours ranged from
5.8 to 16.7 mg/mL. The mean plasma concentrations during this
same time period ranged from 0.315 to 0.646 mg/mL. As with
other newer agents, themean concentrations ofmodithromycin
in AMs (range 61–176 mg/mL) were well above those observed
in plasma and ELF.
3.2 Clarithromycin
Two single-dose studies of clarithromycin have suggested
that ELF concentrations are measurable only within the first
6 hours after administration of oral doses of 200 and 500mg
(table V).[23,30] Four multiple-dose studies of the immediate-
release formulation of clarithromycin have reported plasma
and intrapulmonary concentrations following the oral dosage
regimen of 500mg twice daily.[51,56-58] Themean concentrations
of clarithromycin in ELF ranged between 20.46 and 32.4 mg/mL
at 4 hours and between 15.1 and 48.6 mg/mLat 12 hours. Plasma
concentrations were 10- to 60-fold lower and ranged between
2.0 and 3.96 mg/mL at 4 hours and between 0.8 and 1.22 mg/mL
at 12 hours. The reported concentrations were fairly consistent
between studies. Plasma and ELF concentrations of the active
metabolite, 14-hydroxy-clarithromycin, were also reported in
two studies. Concentrations of 14-hydroxy-clarithromycin in
ELF (range 1.2–15.09 mg/mL) were greater than concurrent
plasma concentrations (0.4–6.41mg/mL), but the difference (1.1-
to 7.45-fold) was less than that observed with clarithromycin.
One study evaluated the intrapulmonary disposition of the
extended-release formulation of clarithromycin 1000mg once
daily.[59] Following five doses, the mean concentrations in ELF
were 11.50 mg/mL at 9 hours and 6.80 mg/mL at 24 hours, and
they remained constant throughout the 24-hour dosing inter-
val. The mean plasma concentrations were 2.22 mg/mL at
9 hours and 0.75 mg/mL at 24 hours. The concentrations of
clarithromycin in AMs ranged between 43 and 1087 mg/mL
(mean 303 mg/mL) andwere comparable to values reportedwith
the immediate-release formulation of clarithromycin. Maximum
concentration (Cmax) values in plasma, ELF andAMsoccurred at
9 hours with the extended-release formulation, which was later
than with the immediate-release formulation.
In vitro and in vivo murine pharmacodynamic models have
made use of clinically observed plasma andELF concentrations
to evaluate the bactericidal activity and/or postantibacterial
effect of clarithromycin against isolates ofH. influenzae and/orS. pneumoniae.[70-73] In addition,Monte Carlo simulations have
been used to assess the ability of pharmacodynamic parameters
(e.g. an AUC/MIC ratio of ‡25) to determine susceptibility
breakpoints and target attainment rates against penicillin-
susceptible and -resistant strains of S. pneumoniae.[74,75] Over-
all, these studies support the concept that the higher concen-
trations of clarithromycin in ELF contribute to the potential
efficacy of clarithromycin against S. pneumoniae strains with
MIC values up to 8 mg/mL.
3.3 Azithromycin
Six studies (two single-dose studies and four multiple-dose
studies) have evaluated the intrapulmonary disposition of oral
azithromycin (table VI). Interestingly, the single-dose studies
provided minimal information, since most plasma and ELF
samples had undetectable concentrations.[30,60] The multiple-
dose studies indicated that the mean ELF concentrations
ranged between 0.64 and 3.12 mg/mL during the first 24 hours
after the last dose of the standard oral dosing regimen of azi-
thromycin.[57,58,61,62] The concentrations of azithromycin in
ELF were fairly stable and demonstrated minimal fluctuations
throughout the 24-hour dosing interval. The mean plasma
concentrations during this same time period ranged from 0.03
to 0.1 mg/mL. No study has reported ELF to plasma concen-
tration ratios. However, the ELF concentrations were ap-
proximately 10- to 20-fold higher than the concurrent plasma
concentrations.
Single oral doses of azithromycin in the immediate-release
and extended-release formulations were compared in 64 pa-
tients who had been diagnosed with lung cancer and required
open-chest surgery for lung resection.[76] For the immediate-
release formulation, a single 500mg dose resulted in AUC from
0 to 24 hours (AUC24) values in serum and ELF of 3.1 and
2.3mg�h/mL, respectively. Following a 2g dose of the extended-
release formulation, the AUC24 values in serum and ELF were
10.0 and 17.6 mg�h/mL, respectively. Higher exposure was also
Penetration of Antibacterial Agents into Pulmonary ELF 649
ª 2011 Adis Data Information BV. All rights reserved. Clin Pharmacokinet 2011; 50 (10)

observed in AMs and whole lung tissues with the extended-
release formulation.
Only one study has reported plasma and ELF concentra-
tions following multiple intravenous doses of azithromycin
500mg once daily.[63] The plasma concentrations at the time of
bronchoscopy were comparable (range 0.09–0.49 mg/mL) to
those associated with oral dosing once the differences in the
dose and oral bioavailability were taken into account. Con-
centrations in ELF ranged from 0.79 to 5.86 mg/mL and were
slightly higher than the values associated with oral dosing. The
estimated AUC24 of azithromycin in ELF (45.8 mg�h/mL) was
approximately 5.6-fold higher than the AUC24 in plasma
(8.2 mg�h/mL) following intravenous dosing.
The observed azithromycin concentrations in ELF and
plasma have been used to investigate in vitro bactericidal ac-
tivity and pharmacodynamic target attainment rates against
clinical isolates of S. pneumoniae and H. influenzae. In ELF,
azithromycin demonstrated greater potency, killing rates and
postantibacterial effects than clarithromycin against H. influ-
enzae and tended to be adequate for eradication of macrolide-
susceptible S. pneumoniae (suggested susceptibility breakpoint
£2mg/mL).[73,74,77-80] The probability of achieving target attainment
rates was lower with azithromycin than with clarithromycin.[74]
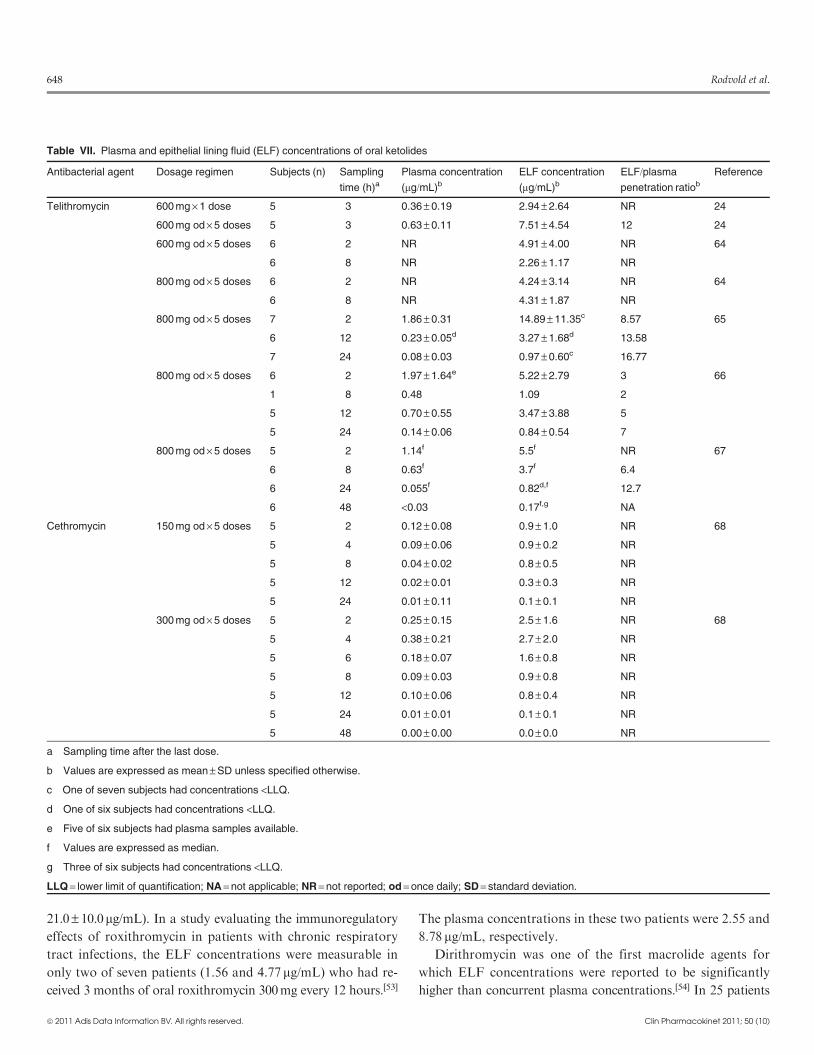
3.4 Ketolides
Several intrapulmonary studies have reported ELF con-
centrations for oral telithromycin dosage regimens of 600 and
800mg once daily (table VII).[24,64-68] Like clarithromycin and
azithromycin, telithromycin achieves higher and sustained ex-
tracellular concentrations (2- to 17-fold) in ELF than in plas-
ma. The mean ELF concentrations following telithromycin
800mg once daily for 5 days were approximately 5.0 and
0.9mg/mL at 2 hours and 24 hours, respectively. The total plasma
concentrations at these same sampling times averaged 1.9 and
0.1 mg/mL, respectively. The reported mean ratios for ELF to
total plasma concentrations at individual sampling times
ranged from 2 to 14.9. A mean penetration ratio of 7.95 (with
AUC values of 83.73 and 10.53 mg�h/mL for ELF and plasma,
respectively) has been reported, based on a population phar-
macokinetic analysis and a 10 000-subject Monte Carlo simu-
lation.[81] These ratios would be greater if unbound plasma
concentrations are considered (telithromycin plasma protein
binding: 60–70%). Intracellular concentrations of telithromycin
are even higher in AMs than in ELF and can range from 50- to
>500-fold greater than total plasma concentrations.[64-67]
For the investigational ketolide antibacterial cethromycin,
the ELF concentrations between 2 and 24 hours ranged from
0.1 to 0.9 mg/mL after the 150mg once-daily dosage regimen
and from 0.1 to 2.7 mg/mL after the 300mg once-daily dosage
regimen (table VII).[68] In comparison, the plasma concentra-
tions were approximately 10-fold lower than the ELF concen-
trations, whereas the AM concentrations were 10-fold higher
than the ELF concentrations.
Several pharmacodynamic studies have evaluated the in vitro
activity and target attainment potential of telithromycin against
pathogens commonly associated with community-acquired pneu-
monia (e.g. macrolide-susceptible and -resistant S. pneumoniae,
and b-lactamase-positive and -negative H. influenzae).[73,82-85]
Using simulated total and unbound serum and ELF concen-
trations of telithromycin, these studies have provided recom-
mendations for potential pharmacokinetic-pharmacodynamic
parameter values of the Cmax/MIC and AUC24/MIC ratios
associated with bacteriostatic and bactericidal activity, as
well as no regrowth of telithromycin-susceptible bacteria over
24–48 hours.[73,82,83]
4. Fluoroquinolones
Most fluoroquinolones that have been developed during the
past 25 years have been studied to determine the degree of lung
penetration. Ciprofloxacin, moxifloxacin and levofloxacin are
currently the most commonly recommended fluoroquinolones
for the treatment of lower respiratory tract infections.With that
in mind, our review focuses on intrapulmonary penetration
studies of those three fluoroquinolones only. However, a list of
references has been provided for those readers who have an
interest in similar studies of other fluoroquinolones.[86-100]
4.1 Ciprofloxacin
Several single- and multiple-dose studies have evaluated in-
trapulmonary penetration of oral ciprofloxacin in healthy adult
subjects and patients undergoing diagnostic bronchoscopy
(table VIII).[96,98-101] The concentration-time profile following
a single oral dose of 500mg suggests that ciprofloxacin does not
achieve adequate ELF concentrations throughout the dosing
interval. Although the mean plasma and ELF concentrations
were similar (2.33 and 2.13 mg/mL, respectively) at 2.5 hours,
subsequent ELF concentrations (range 5–48 hours) were below
the lower limit of quantification (LLQ).[99,100] When multiple
oral doses of ciprofloxacin 500mg were administered every
12 hours, the mean concentrations were slightly lower in ELF
than in plasma throughout the dosing interval (2.11 vs 1.87mg/mL
at 4 hours and 0.55 vs 0.41 mg/mL at 12 hours).[101] Two studies
that measured ELF concentrations of ciprofloxacin between
650 Rodvold et al.
ª 2011 Adis Data Information BV. All rights reserved. Clin Pharmacokinet 2011; 50 (10)
3 and 6 hours after multiple doses of an oral regimen of 250mg
every 12 hours reported that ELF concentrations (2.0 and
3.0 mg/mL at 3 and 6 hours, respectively) were higher than
concurrent plasma concentrations (1.1 and 1.19 mg/mL at 3 and
6 hours, respectively).[96,98]
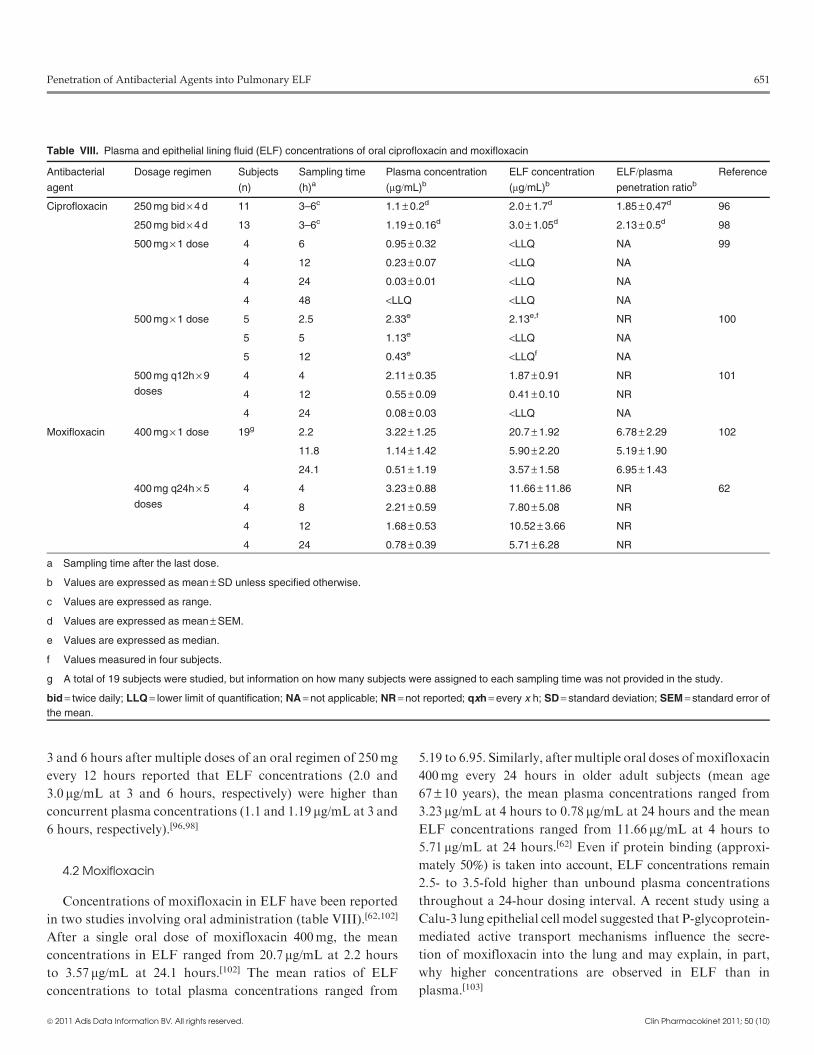
4.2 Moxifloxacin
Concentrations of moxifloxacin in ELF have been reported
in two studies involving oral administration (table VIII).[62,102]
After a single oral dose of moxifloxacin 400mg, the mean
concentrations in ELF ranged from 20.7 mg/mL at 2.2 hours
to 3.57 mg/mL at 24.1 hours.[102] The mean ratios of ELF
concentrations to total plasma concentrations ranged from
5.19 to 6.95. Similarly, after multiple oral doses of moxifloxacin
400mg every 24 hours in older adult subjects (mean age
67 – 10 years), the mean plasma concentrations ranged from
3.23 mg/mL at 4 hours to 0.78 mg/mL at 24 hours and the mean
ELF concentrations ranged from 11.66 mg/mL at 4 hours to
5.71 mg/mL at 24 hours.[62] Even if protein binding (approxi-
mately 50%) is taken into account, ELF concentrations remain
2.5- to 3.5-fold higher than unbound plasma concentrations
throughout a 24-hour dosing interval. A recent study using a
Calu-3 lung epithelial cell model suggested that P-glycoprotein-
mediated active transport mechanisms influence the secre-
tion of moxifloxacin into the lung and may explain, in part,
why higher concentrations are observed in ELF than in
plasma.[103]
Table VIII. Plasma and epithelial lining fluid (ELF) concentrations of oral ciprofloxacin and moxifloxacin
Antibacterial
agent
Dosage regimen Subjects
(n)
Sampling time
(h)aPlasma concentration
(mg/mL)bELF concentration
(mg/mL)bELF/plasma
penetration ratiob
Reference
Ciprofloxacin 250 mg bid · 4 d 11 3–6c 1.1 – 0.2d 2.0 – 1.7d 1.85 – 0.47d 96
250 mg bid · 4 d 13 3–6c 1.19 – 0.16d 3.0 – 1.05d 2.13 – 0.5d 98
500 mg · 1 dose 4 6 0.95 – 0.32 <LLQ NA 99
4 12 0.23 – 0.07 <LLQ NA
4 24 0.03 – 0.01 <LLQ NA
4 48 <LLQ <LLQ NA
500 mg · 1 dose 5 2.5 2.33e 2.13e,f NR 100
5 5 1.13e <LLQ NA
5 12 0.43e <LLQf NA
500 mg q12h · 9
doses
4 4 2.11 – 0.35 1.87 – 0.91 NR 101
4 12 0.55 – 0.09 0.41 – 0.10 NR
4 24 0.08 – 0.03 <LLQ NA
Moxifloxacin 400 mg · 1 dose 19g 2.2 3.22 – 1.25 20.7 – 1.92 6.78 – 2.29 102
11.8 1.14 – 1.42 5.90 – 2.20 5.19 – 1.90
24.1 0.51 – 1.19 3.57 – 1.58 6.95 – 1.43
400 mg q24h · 5
doses
4 4 3.23 – 0.88 11.66 – 11.86 NR 62
4 8 2.21 – 0.59 7.80 – 5.08 NR
4 12 1.68 – 0.53 10.52 – 3.66 NR
4 24 0.78 – 0.39 5.71 – 6.28 NR
a Sampling time after the last dose.
b Values are expressed as mean – SD unless specified otherwise.
c Values are expressed as range.
d Values are expressed as mean – SEM.
e Values are expressed as median.
f Values measured in four subjects.
g A total of 19 subjects were studied, but information on how many subjects were assigned to each sampling time was not provided in the study.
bid = twice daily; LLQ = lower limit of quantification; NA = not applicable; NR = not reported; qxh = every x h; SD = standard deviation; SEM = standard error of
the mean.
Penetration of Antibacterial Agents into Pulmonary ELF 651
ª 2011 Adis Data Information BV. All rights reserved. Clin Pharmacokinet 2011; 50 (10)
The intrapulmonary data generated from these two studies
have been used in numerous evaluations to compare the
pharmacodynamic characteristics of moxifloxacin with those
of other antibacterial agents that are commonly used in lower
respiratory tract infections.[77,79,104-110] Most investigations
have used simulated plasma and ELF concentrations in vivo
to link in vitro bactericidal killing activity, eradication rates
against various genotypes and/or resistant patterns of
S. pneumoniae and S. aureus, prevention of selection or emer-
gence of resistance, and achievement of AUC/MIC target at-
tainment rates. These studies have provided further support for
the concept that ELF concentrations contribute to the efficacy
of moxifloxacin against pathogens associated with lower res-
piratory tract infections.
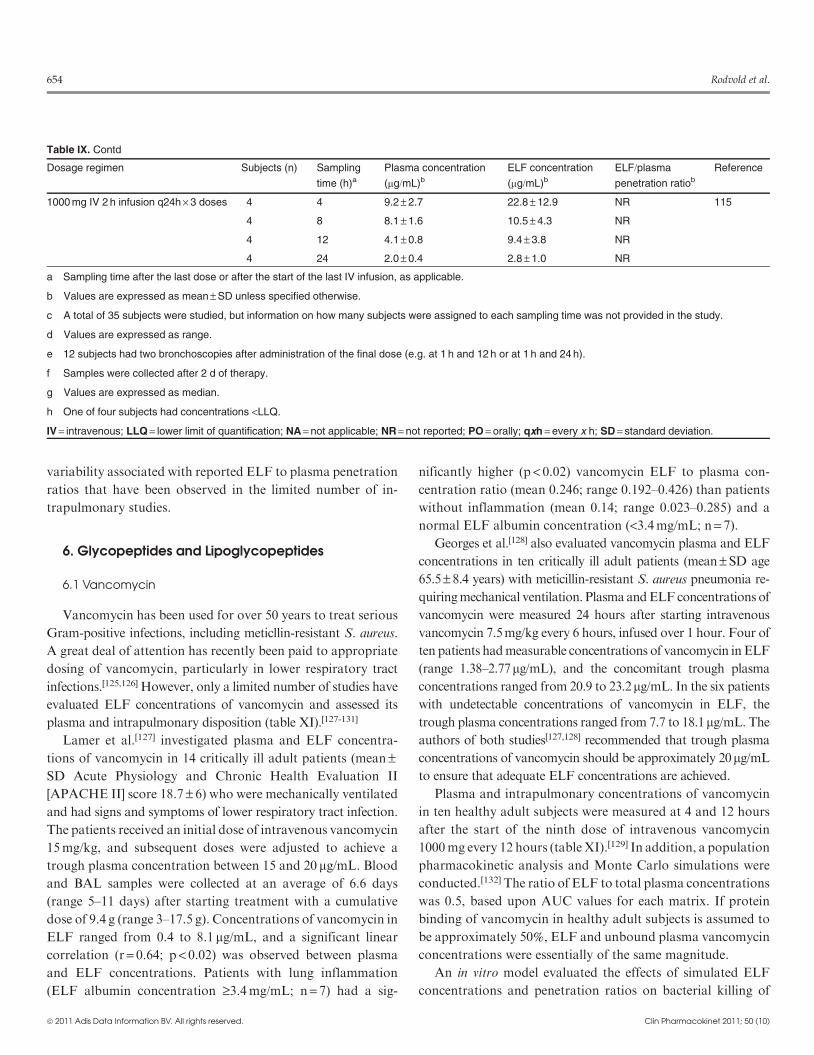
4.3 Levofloxacin
Concentrations of levofloxacin in ELF have been in-
vestigated extensively (table IX).[25,62,63,101,111-115] Studies have
included single and multiple doses of levofloxacin administered
both orally and intravenously at a wide range of dosages (e.g.
100–1000mg). The individuals who were studied included
healthy adult subjects, patients undergoing diagnostic fibre-
optic bronchoscopy, critically ill patients with severe community-
acquired pneumonia and outpatients with a clinical diagnosis of
mild to moderate chronic bronchitis, chronic obstructive pul-
monary disease or lower respiratory tract infection.
Eleven of 13 studies used plasma and ELF sampling over a
24-hour interval.[62,63,101,111-115] The mean ratios of ELF con-
centrations to total plasma concentrations at individual sam-
pling times ranged from 1.0 to 4.9 when the samples were
obtained between 4 and 24 hours after dosing. Several studies
reported AUC24 values in plasma and in ELF. For the
500mg dose, the mean AUC24 values ranged from 34.5 to
180 mg�h/mL in ELF, compared with 50.1–86.7 mg�h/mL in
plasma.[62,63,112] For the 750mg dose, the mean AUC24 values
in ELF and in plasma were 151.4 and 95.4 mg�h/mL, respec-
tively.[63] A 1000mg dose resulted in mean AUC24 values of
260–279.1 mg�h/mL in ELF and 103.6–130 mg�h/mL in plas-
ma.[114,115] The ratios of ELF concentrations to plasma con-
centrations that were estimated from these AUC values ranged
from 1.59 to 2.69.
Drusano et al.[116] performed population pharmacokinetic
modelling and Monte Carlo simulations based on steady-state
concentrations in plasma and ELF after oral doses of levo-
floxacin 500 and 750mg were administered to healthy adult
subjects. The penetration ratio based on the AUC values in
ELF and in plasma, derived from the mean parameter vector,
was 1.16. The mean and median ratios were 3.18 (SD 5.71) and
1.43 (95% confidence interval [CI] 0.143, 19.12), respectively,
when calculations were based on 1000-subject Monte Carlo
simulations. The penetration ratio was greater than 1 in 61% of
simulations.
Other investigators have also evaluated pharmacodynamic
target attainment rates using estimates of ELF concentrations
of levofloxacin in hospitalized patients with community-
acquired pneumonia and in a murine pneumonia model of
Pseudomonas aeruginosa infection.[117,118]
5. Aminoglycosides
Aminoglycosides such as gentamicin, tobramycin and ne-
tilmicin are most often used intravenously or via inhalation for
the treatment of serious respiratory infections involving Gram-
negative organisms. Aminoglycosides are known for poor lung
penetration and varied concentrations in the lung tissue de-
pending on the anatomical site that is sampled. Intrapulmonary
penetration and ELF concentrations of aminoglycosides in
critically ill patients with lower respiratory tract infections have
been evaluated following intravenous and intramuscular ad-
ministration of single and multiple doses (table X).[119-124]
Sampling of ELF concentrations in aminoglycoside studies
has been limited to the first 8 hours after drug administration,
and no estimation of exposure throughout the dosing interval
has been provided. In general, concentrations of aminoglyco-
sides in ELF are significantly lower than plasma concentrations
during the first 1.5 hours after administration. Subsequently,
the concentrations in ELF become similar to those in plasma at
approximately 2 or 3 hours after administration. For example,
the mean concentrations of tobramycin in ELF were 2.7 mg/mL
(approximately 12% of the plasma concentration [22.4 mg/mL])
at 0.5 hours following a 30-minute intravenous infusion of
7–10mg/kg.[122] Similar ELF concentrations (e.g. <3 mg/mL)
were observed at 1 hour after a single dose of gentamicin 240mg
(mean– SD 3.5 – 0.1mg/kg) and during the first 2 hours of
adjusted doses of tobramycin.[119,121] Although the mean con-
centrations of netilmicin in ELF were higher at 1 and 1.5 hours
(7.5 and 9.6 mg/mL, respectively) after a single dose of 450mg,
these ELF concentrations were only 35% and 62% of the con-
current mean plasma concentrations (21.4 and 15.3 mg/mL,
respectively).[124] Once the Cmax values of gentamicin and ne-
tilmicin in ELF occurred at 2 hours (4.24 and 14.7 mg/mL, re-
spectively), the ELF to plasma concentration ratios were 0.85
and >1, respectively.[119,124] Subsequently, ELF and plasma
concentrations of the aminoglycosides became similar to each
other. Thus system hysteresis has greatly influenced the large
652 Rodvold et al.
ª 2011 Adis Data Information BV. All rights reserved. Clin Pharmacokinet 2011; 50 (10)
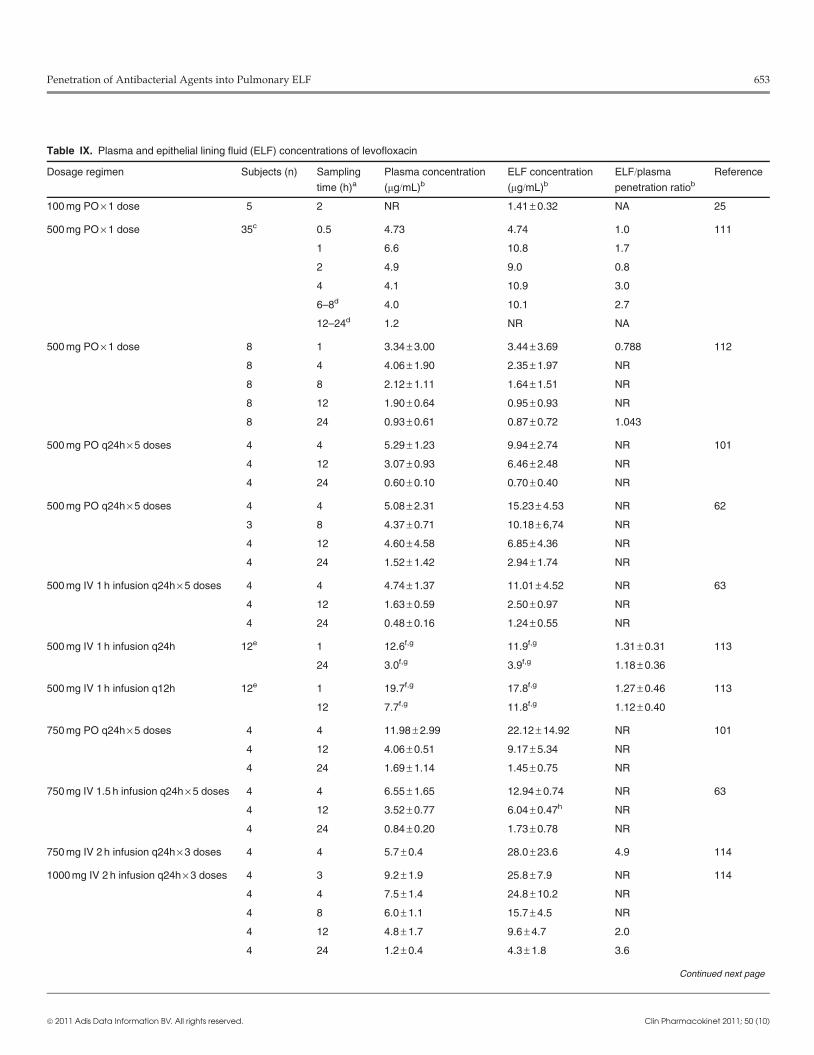
Table IX. Plasma and epithelial lining fluid (ELF) concentrations of levofloxacin
Dosage regimen Subjects (n) Sampling
time (h)aPlasma concentration
(mg/mL)bELF concentration
(mg/mL)bELF/plasma
penetration ratiob
Reference
100 mg PO · 1 dose 5 2 NR 1.41 – 0.32 NA 25
500 mg PO · 1 dose 35c 0.5 4.73 4.74 1.0 111
1 6.6 10.8 1.7
2 4.9 9.0 0.8
4 4.1 10.9 3.0
6–8d 4.0 10.1 2.7
12–24d 1.2 NR NA
500 mg PO · 1 dose 8 1 3.34 – 3.00 3.44 – 3.69 0.788 112
8 4 4.06 – 1.90 2.35 – 1.97 NR
8 8 2.12 – 1.11 1.64 – 1.51 NR
8 12 1.90 – 0.64 0.95 – 0.93 NR
8 24 0.93 – 0.61 0.87 – 0.72 1.043
500 mg PO q24h · 5 doses 4 4 5.29 – 1.23 9.94 – 2.74 NR 101
4 12 3.07 – 0.93 6.46 – 2.48 NR
4 24 0.60 – 0.10 0.70 – 0.40 NR
500 mg PO q24h · 5 doses 4 4 5.08 – 2.31 15.23 – 4.53 NR 62
3 8 4.37 – 0.71 10.18 – 6,74 NR
4 12 4.60 – 4.58 6.85 – 4.36 NR
4 24 1.52 – 1.42 2.94 – 1.74 NR
500 mg IV 1 h infusion q24h · 5 doses 4 4 4.74 – 1.37 11.01 – 4.52 NR 63
4 12 1.63 – 0.59 2.50 – 0.97 NR
4 24 0.48 – 0.16 1.24 – 0.55 NR
500 mg IV 1 h infusion q24h 12e 1 12.6f,g 11.9f,g 1.31 – 0.31 113
24 3.0f,g 3.9f,g 1.18 – 0.36
500 mg IV 1 h infusion q12h 12e 1 19.7f,g 17.8f,g 1.27 – 0.46 113
12 7.7f,g 11.8f,g 1.12 – 0.40
750 mg PO q24h · 5 doses 4 4 11.98 – 2.99 22.12 – 14.92 NR 101
4 12 4.06 – 0.51 9.17 – 5.34 NR
4 24 1.69 – 1.14 1.45 – 0.75 NR
750 mg IV 1.5 h infusion q24h · 5 doses 4 4 6.55 – 1.65 12.94 – 0.74 NR 63
4 12 3.52 – 0.77 6.04 – 0.47h NR
4 24 0.84 – 0.20 1.73 – 0.78 NR
750 mg IV 2 h infusion q24h · 3 doses 4 4 5.7 – 0.4 28.0 – 23.6 4.9 114
1000 mg IV 2 h infusion q24h · 3 doses 4 3 9.2 – 1.9 25.8 – 7.9 NR 114
4 4 7.5 – 1.4 24.8 – 10.2 NR
4 8 6.0 – 1.1 15.7 – 4.5 NR
4 12 4.8 – 1.7 9.6 – 4.7 2.0
4 24 1.2 – 0.4 4.3 – 1.8 3.6
Continued next page
Penetration of Antibacterial Agents into Pulmonary ELF 653
ª 2011 Adis Data Information BV. All rights reserved. Clin Pharmacokinet 2011; 50 (10)
variability associated with reported ELF to plasma penetration
ratios that have been observed in the limited number of in-
trapulmonary studies.
6. Glycopeptides and Lipoglycopeptides
6.1 Vancomycin
Vancomycin has been used for over 50 years to treat serious
Gram-positive infections, including meticllin-resistant S. aureus.
A great deal of attention has recently been paid to appropriate
dosing of vancomycin, particularly in lower respiratory tract
infections.[125,126] However, only a limited number of studies have
evaluated ELF concentrations of vancomycin and assessed its
plasma and intrapulmonary disposition (table XI).[127-131]
Lamer et al.[127] investigated plasma and ELF concentra-
tions of vancomycin in 14 critically ill adult patients (mean–SD Acute Physiology and Chronic Health Evaluation II
[APACHE II] score 18.7 – 6) who were mechanically ventilated
and had signs and symptoms of lower respiratory tract infection.
The patients received an initial dose of intravenous vancomycin
15mg/kg, and subsequent doses were adjusted to achieve a
trough plasma concentration between 15 and 20 mg/mL. Blood
and BAL samples were collected at an average of 6.6 days
(range 5–11 days) after starting treatment with a cumulative
dose of 9.4 g (range 3–17.5 g). Concentrations of vancomycin in
ELF ranged from 0.4 to 8.1 mg/mL, and a significant linear
correlation (r = 0.64; p< 0.02) was observed between plasma
and ELF concentrations. Patients with lung inflammation
(ELF albumin concentration ‡3.4mg/mL; n= 7) had a sig-
nificantly higher (p < 0.02) vancomycin ELF to plasma con-
centration ratio (mean 0.246; range 0.192–0.426) than patients
without inflammation (mean 0.14; range 0.023–0.285) and a
normal ELF albumin concentration (<3.4mg/mL; n= 7).
Georges et al.[128] also evaluated vancomycin plasma and ELF
concentrations in ten critically ill adult patients (mean–SD age
65.5– 8.4 years) with meticillin-resistant S. aureus pneumonia re-
quiringmechanical ventilation. Plasma andELFconcentrations of
vancomycin were measured 24 hours after starting intravenous
vancomycin 7.5mg/kg every 6 hours, infused over 1 hour. Four of
ten patients hadmeasurable concentrations of vancomycin in ELF
(range 1.38–2.77mg/mL), and the concomitant trough plasma
concentrations ranged from 20.9 to 23.2mg/mL. In the six patients
with undetectable concentrations of vancomycin in ELF, the
trough plasma concentrations ranged from 7.7 to 18.1mg/mL. The
authors of both studies[127,128] recommended that trough plasma
concentrations of vancomycin should be approximately 20mg/mL
to ensure that adequate ELF concentrations are achieved.
Plasma and intrapulmonary concentrations of vancomycin
in ten healthy adult subjects were measured at 4 and 12 hours
after the start of the ninth dose of intravenous vancomycin
1000mg every 12 hours (tableXI).[129] In addition, a population
pharmacokinetic analysis and Monte Carlo simulations were
conducted.[132] The ratio of ELF to total plasma concentrations
was 0.5, based upon AUC values for each matrix. If protein
binding of vancomycin in healthy adult subjects is assumed to
be approximately 50%, ELF and unbound plasma vancomycin
concentrations were essentially of the same magnitude.
An in vitro model evaluated the effects of simulated ELF
concentrations and penetration ratios on bacterial killing of
Table IX. Contd
Dosage regimen Subjects (n) Sampling
time (h)aPlasma concentration
(mg/mL)bELF concentration
(mg/mL)bELF/plasma
penetration ratiob
Reference
1000 mg IV 2 h infusion q24h · 3 doses 4 4 9.2 – 2.7 22.8 – 12.9 NR 115
4 8 8.1 – 1.6 10.5 – 4.3 NR
4 12 4.1 – 0.8 9.4 – 3.8 NR
4 24 2.0 – 0.4 2.8 – 1.0 NR
a Sampling time after the last dose or after the start of the last IV infusion, as applicable.
b Values are expressed as mean – SD unless specified otherwise.
c A total of 35 subjects were studied, but information on how many subjects were assigned to each sampling time was not provided in the study.
d Values are expressed as range.
e 12 subjects had two bronchoscopies after administration of the final dose (e.g. at 1 h and 12 h or at 1 h and 24 h).
f Samples were collected after 2 d of therapy.
g Values are expressed as median.
h One of four subjects had concentrations <LLQ.
IV = intravenous; LLQ = lower limit of quantification; NA = not applicable; NR = not reported; PO = orally; qxh = every x h; SD = standard deviation.
654 Rodvold et al.
ª 2011 Adis Data Information BV. All rights reserved. Clin Pharmacokinet 2011; 50 (10)

meticillin-resistant S. aureus and development of resistance.[133]
Bactericidal activity could not be demonstrated for dosage re-
gimens that achieved an unbound AUC24/MIC ratio of 350
with a penetration ratio of 1.0. Development of resistance was
suppressedwhen the unboundAUC24/MIC ratiowas ‡280witha penetration ratio of ‡0.8. These findings suggest that currentdosage regimens, which recommend trough plasma vancomy-
cin concentrations of 15–20 mg/mL, are not adequate for bac-
tericidal activity, even when the ELF penetration ratio is equal
to 1.0. Development of resistance (e.g. heterogeneous) is likely
to occur ifMIC values are >1 mg/mL, the unboundAUC24/MIC
ratio is <280 and/or the ELF penetration ratio is <0.8.
6.2 Teicoplanin
Teicoplanin is another glycopeptide that is commercially
available in many countries other than the US. One study
compared steady-state serum and ELF concentrations of in-
travenous teicoplanin in 13 critically ill patients with ventilator-
associated pneumonia who received 12mg/kg twice daily for
2 days followed by 12mg/kg once daily (table XI).[130] The total
and unbound serum concentrations ranged from 8.8 to
29.9 mg/mL and from 2.0 to 5.4 mg/mL, respectively. The con-
centrations of teicoplanin in ELF ranged from 2.0 to
11.8 mg/mL, and the ratio of ELF to unbound serum con-
centrations ranged from 0.48 to 3.32 (median 1.46).
6.3 Telavancin
Telavancin is a lipoglycopeptide developed for the treatment
of serious Gram-positive infections, including meticillin-
resistant S. aureus. Steady-state plasma and intrapulmonary
concentrations of telavancin were evaluated in 20 healthy adult
subjects who were administrated 10mg/kg intravenously once
daily for 3 days (table XI).[131] The mean concentrations of
telavancin in ELF at 8 and 24 hours after the last dose were 3.73
and 0.89 mg/mL, respectively. The mean plasma concentrations
at 12 and 24 hours were 22.9 and 7.28 mg/mL, respectively.
Table X. Plasma and epithelial lining fluid (ELF) concentrations of aminoglycosides
Antibacterial
agent
Dosage regimen Subjects
(n)
Sampling
time (h)aPlasma concentration
(mg/mL)bELF concentration
(mg/mL)bELF/plasma
penetration ratiob
Reference
Gentamicin 240 mg IV 30 min infusion · 1
dose
6 1 8.79 – 0.64c 2.95 – 0.37c 0.30 – 0.05c 119
6 2 6.37 – 0.50c 4.24 – 0.42c 0.85 – 0.10c
6 4 4.70 – 0.49c 3.10 – 0.39c 1.14 – 0.26c
6 6 4.70 – 0.57c 2.65 – 0.35c 0.74 – 0.18c
Tobramycin 150 mg IM · 1 or more doses 5 6 4.1 – 1.5 5.3 – 2.9 1.4 – 0.8 120
300 mg IM · 1 or more doses 5 6 4.3 – 2.4 5.5 – 2.1 1.6 – 0.6 120
IV doses adjusted to achieve
serum Cmax ~8 mg/mL and Cmin
<2 mg/mL while maintaining
q8h dosing intervald
4 0.5e 6.90 – 1.44 2.33 – 0.50 0.30 – 0.03 121
4 2e 4.08 – 1.30 1.67 – 0.60 0.42 – 0.16
4 4e 2.14 – 0.85 1.62 – 1.19 0.64 – 0.37
4 8e 0.79 – 0.38 0.77 – 0.38 1.53 – 0.76
7–10 mg/kg IV 30 min infusion
q24he
12 1 22.4 – 5.9 2.7 – 0.7 0.119 – 0.019 122
300 mg inhalation · 1 dose 12 NA NA 90 – 54 NA 123
Netilmicin 450 mg IV 30 min infusion · 1
dose
5 1 21.4 – 1.19c 7.5 – 1.0c NR 124
5 1.5 15.3 – 0.85c 9.6 – 0.3c NR
5 2 12.0 – 0.71c 14.7 – 2.2c NR
5 3 8.3 – 0.64c 9.3 – 0.6c NR
a Sampling time after the last dose or after the start of the last IV infusion, as applicable.
b Values are expressed as mean – SD unless specified otherwise.
c Values are expressed as mean – SEM.
d The mean number of doses (– SD) administered before BAL fluid collection was 21.25 – 6.42.
e Samples were collected at steady state after 2 d of therapy.
BAL = bronchoalveolar lavage; Cmax = maximum concentration; Cmin = minimum concentration; IM = intramuscularly; IV = intravenous; NA = not applicable;
NR = not reported; qxh = every x h; SD = standard deviation; SEM = standard error of the mean.
Penetration of Antibacterial Agents into Pulmonary ELF 655
ª 2011 Adis Data Information BV. All rights reserved. Clin Pharmacokinet 2011; 50 (10)
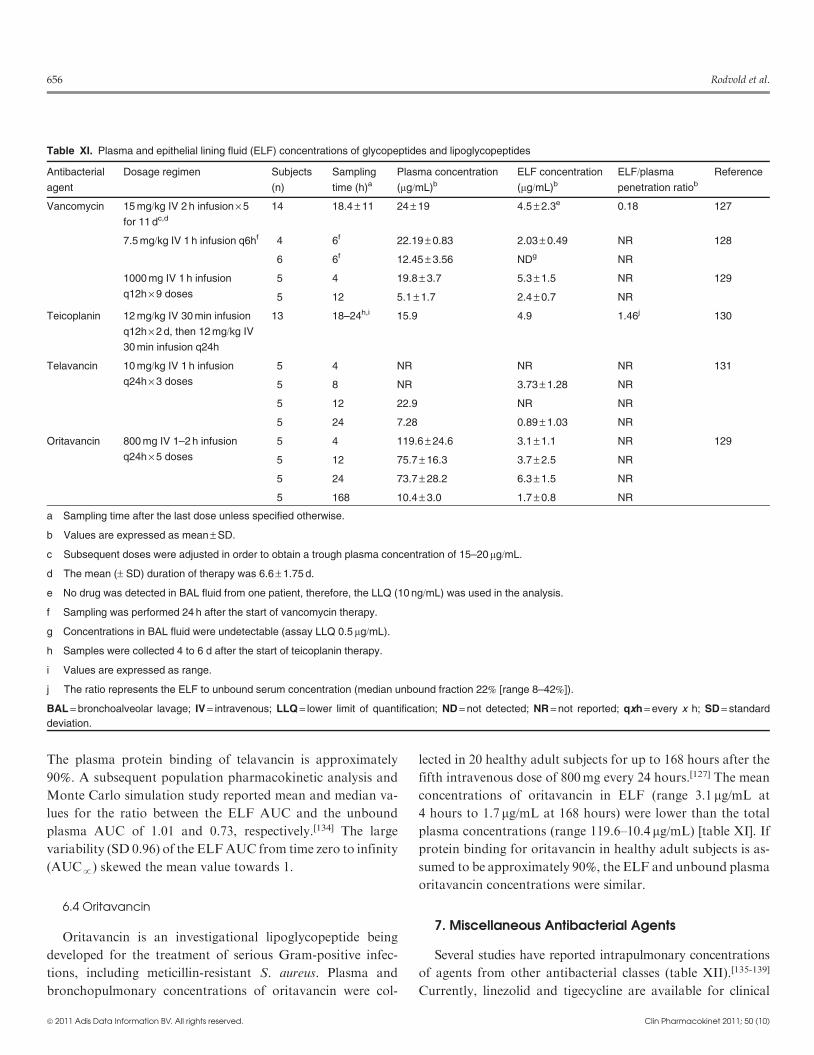
The plasma protein binding of telavancin is approximately
90%. A subsequent population pharmacokinetic analysis and
Monte Carlo simulation study reported mean and median va-
lues for the ratio between the ELF AUC and the unbound
plasma AUC of 1.01 and 0.73, respectively.[134] The large
variability (SD 0.96) of the ELFAUC from time zero to infinity
(AUCp) skewed the mean value towards 1.
6.4 Oritavancin
Oritavancin is an investigational lipoglycopeptide being
developed for the treatment of serious Gram-positive infec-
tions, including meticillin-resistant S. aureus. Plasma and
bronchopulmonary concentrations of oritavancin were col-
lected in 20 healthy adult subjects for up to 168 hours after the
fifth intravenous dose of 800mg every 24 hours.[127] The mean
concentrations of oritavancin in ELF (range 3.1 mg/mL at
4 hours to 1.7 mg/mL at 168 hours) were lower than the total
plasma concentrations (range 119.6–10.4 mg/mL) [table XI]. If
protein binding for oritavancin in healthy adult subjects is as-
sumed to be approximately 90%, the ELF and unbound plasma
oritavancin concentrations were similar.
7. Miscellaneous Antibacterial Agents
Several studies have reported intrapulmonary concentrations
of agents from other antibacterial classes (table XII).[135-139]
Currently, linezolid and tigecycline are available for clinical
Table XI. Plasma and epithelial lining fluid (ELF) concentrations of glycopeptides and lipoglycopeptides
Antibacterial
agent
Dosage regimen Subjects
(n)
Sampling
time (h)aPlasma concentration
(mg/mL)bELF concentration
(mg/mL)bELF/plasma
penetration ratiob
Reference
Vancomycin 15 mg/kg IV 2 h infusion · 5
for 11 dc,d
14 18.4 – 11 24 – 19 4.5 – 2.3e 0.18 127
7.5 mg/kg IV 1 h infusion q6hf 4 6f 22.19 – 0.83 2.03 – 0.49 NR 128
6 6f 12.45 – 3.56 NDg NR
1000 mg IV 1 h infusion
q12h · 9 doses
5 4 19.8 – 3.7 5.3 – 1.5 NR 129
5 12 5.1 – 1.7 2.4 – 0.7 NR
Teicoplanin 12 mg/kg IV 30 min infusion
q12h · 2 d, then 12 mg/kg IV
30 min infusion q24h
13 18–24h,i 15.9 4.9 1.46j 130
Telavancin 10 mg/kg IV 1 h infusion
q24h · 3 doses
5 4 NR NR NR 131
5 8 NR 3.73 – 1.28 NR
5 12 22.9 NR NR
5 24 7.28 0.89 – 1.03 NR
Oritavancin 800 mg IV 1–2 h infusion
q24h · 5 doses
5 4 119.6 – 24.6 3.1 – 1.1 NR 129
5 12 75.7 – 16.3 3.7 – 2.5 NR
5 24 73.7 – 28.2 6.3 – 1.5 NR
5 168 10.4 – 3.0 1.7 – 0.8 NR
a Sampling time after the last dose unless specified otherwise.
b Values are expressed as mean – SD.
c Subsequent doses were adjusted in order to obtain a trough plasma concentration of 15–20mg/mL.
d The mean (– SD) duration of therapy was 6.6 – 1.75 d.
e No drug was detected in BAL fluid from one patient, therefore, the LLQ (10 ng/mL) was used in the analysis.
f Sampling was performed 24 h after the start of vancomycin therapy.
g Concentrations in BAL fluid were undetectable (assay LLQ 0.5 mg/mL).
h Samples were collected 4 to 6 d after the start of teicoplanin therapy.
i Values are expressed as range.
j The ratio represents the ELF to unbound serum concentration (median unbound fraction 22% [range 8–42%]).
BAL = bronchoalveolar lavage; IV = intravenous; LLQ = lower limit of quantification; ND = not detected; NR = not reported; qxh = every x h; SD = standard
deviation.
656 Rodvold et al.
ª 2011 Adis Data Information BV. All rights reserved. Clin Pharmacokinet 2011; 50 (10)
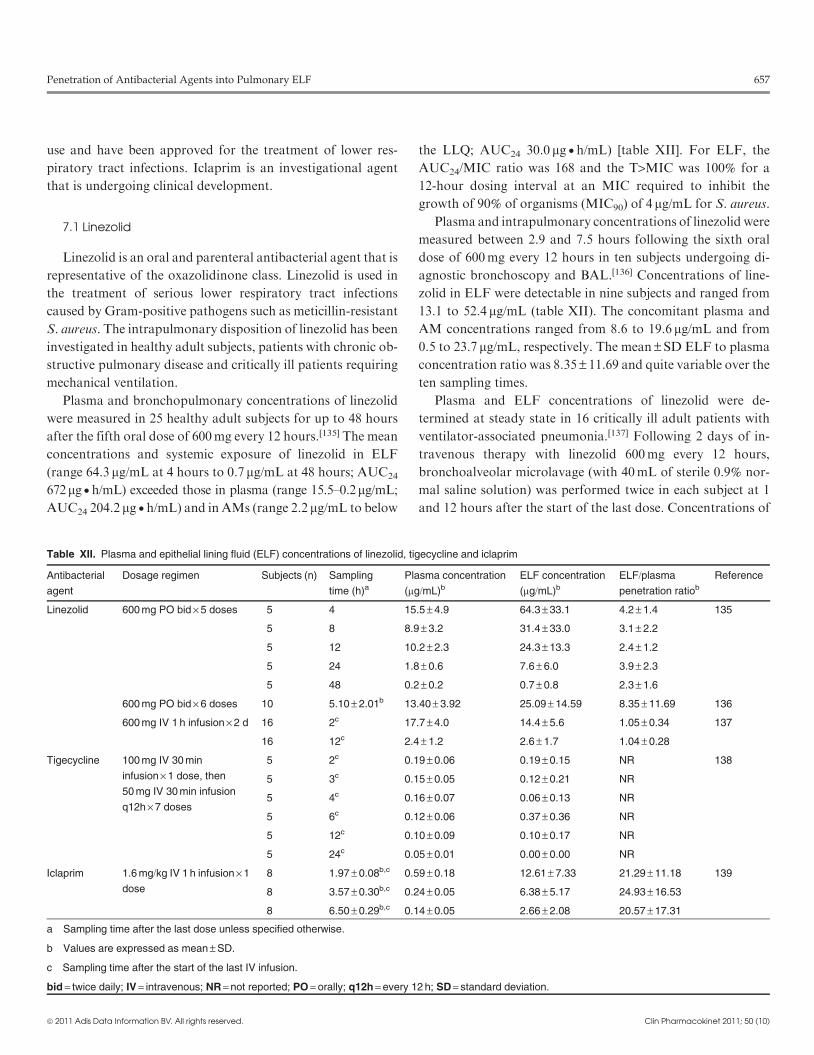
use and have been approved for the treatment of lower res-
piratory tract infections. Iclaprim is an investigational agent
that is undergoing clinical development.
7.1 Linezolid
Linezolid is an oral and parenteral antibacterial agent that is
representative of the oxazolidinone class. Linezolid is used in
the treatment of serious lower respiratory tract infections
caused by Gram-positive pathogens such as meticillin-resistant
S. aureus. The intrapulmonary disposition of linezolid has been
investigated in healthy adult subjects, patients with chronic ob-
structive pulmonary disease and critically ill patients requiring
mechanical ventilation.
Plasma and bronchopulmonary concentrations of linezolid
were measured in 25 healthy adult subjects for up to 48 hours
after the fifth oral dose of 600mg every 12 hours.[135] The mean
concentrations and systemic exposure of linezolid in ELF
(range 64.3 mg/mL at 4 hours to 0.7 mg/mL at 48 hours; AUC24
672mg�h/mL) exceeded those in plasma (range 15.5–0.2mg/mL;
AUC24 204.2 mg�h/mL) and in AMs (range 2.2 mg/mL to below
the LLQ; AUC24 30.0 mg�h/mL) [table XII]. For ELF, the
AUC24/MIC ratio was 168 and the T>MIC was 100% for a
12-hour dosing interval at an MIC required to inhibit the
growth of 90% of organisms (MIC90) of 4 mg/mL for S. aureus.
Plasma and intrapulmonary concentrations of linezolid were
measured between 2.9 and 7.5 hours following the sixth oral
dose of 600mg every 12 hours in ten subjects undergoing di-
agnostic bronchoscopy and BAL.[136] Concentrations of line-
zolid in ELF were detectable in nine subjects and ranged from
13.1 to 52.4 mg/mL (table XII). The concomitant plasma and
AM concentrations ranged from 8.6 to 19.6 mg/mL and from
0.5 to 23.7 mg/mL, respectively. The mean –SD ELF to plasma
concentration ratio was 8.35 – 11.69 and quite variable over the
ten sampling times.
Plasma and ELF concentrations of linezolid were de-
termined at steady state in 16 critically ill adult patients with
ventilator-associated pneumonia.[137] Following 2 days of in-
travenous therapy with linezolid 600mg every 12 hours,
bronchoalveolar microlavage (with 40mL of sterile 0.9% nor-
mal saline solution) was performed twice in each subject at 1
and 12 hours after the start of the last dose. Concentrations of
Table XII. Plasma and epithelial lining fluid (ELF) concentrations of linezolid, tigecycline and iclaprim
Antibacterial
agent
Dosage regimen Subjects (n) Sampling
time (h)aPlasma concentration
(mg/mL)bELF concentration
(mg/mL)bELF/plasma
penetration ratiob
Reference
Linezolid 600 mg PO bid · 5 doses 5 4 15.5 – 4.9 64.3 – 33.1 4.2 – 1.4 135
5 8 8.9 – 3.2 31.4 – 33.0 3.1 – 2.2
5 12 10.2 – 2.3 24.3 – 13.3 2.4 – 1.2
5 24 1.8 – 0.6 7.6 – 6.0 3.9 – 2.3
5 48 0.2 – 0.2 0.7 – 0.8 2.3 – 1.6
600 mg PO bid · 6 doses 10 5.10 – 2.01b 13.40 – 3.92 25.09 – 14.59 8.35 – 11.69 136
600 mg IV 1 h infusion · 2 d 16 2c 17.7 – 4.0 14.4 – 5.6 1.05 – 0.34 137
16 12c 2.4 – 1.2 2.6 – 1.7 1.04 – 0.28
Tigecycline 100 mg IV 30 min
infusion · 1 dose, then
50 mg IV 30 min infusion
q12h · 7 doses
5 2c 0.19 – 0.06 0.19 – 0.15 NR 138
5 3c 0.15 – 0.05 0.12 – 0.21 NR
5 4c 0.16 – 0.07 0.06 – 0.13 NR
5 6c 0.12 – 0.06 0.37 – 0.36 NR
5 12c 0.10 – 0.09 0.10 – 0.17 NR
5 24c 0.05 – 0.01 0.00 – 0.00 NR
Iclaprim 1.6 mg/kg IV 1 h infusion · 1
dose
8 1.97 – 0.08b,c 0.59 – 0.18 12.61 – 7.33 21.29 – 11.18 139
8 3.57 – 0.30b,c 0.24 – 0.05 6.38 – 5.17 24.93 – 16.53
8 6.50 – 0.29b,c 0.14 – 0.05 2.66 – 2.08 20.57 – 17.31
a Sampling time after the last dose unless specified otherwise.
b Values are expressed as mean – SD.
c Sampling time after the start of the last IV infusion.
bid = twice daily; IV = intravenous; NR = not reported; PO = orally; q12h = every 12 h; SD = standard deviation.
Penetration of Antibacterial Agents into Pulmonary ELF 657
ª 2011 Adis Data Information BV. All rights reserved. Clin Pharmacokinet 2011; 50 (10)
linezolid in ELF ranged from 4.5 to 25.4 mg/mL (mean
14.4 mg/mL) at 1 hour and from 0.3 to 5.8 mg/mL (mean
2.6 mg/mL) at 12 hours (table XII). The ELF to plasma con-
centration ratio was approximately 1 at both sampling times,
and the mean AUC24 in plasma was 154.6 mg�h/mL.
7.2 Tigecycline
Tigecycline is a parenteral glycylcycline and belongs to the
tetracycline class of anti-infective agents. Tigecycline has shown
activity against a wide spectrum of pathogens, including Gram-
positive, Gram-negative, atypical and anaerobic pathogens.
Steady-state plasma and intrapulmonary concentrations of
tigecycline weremeasured in 30 healthy adult subjects following
the last dose of an intravenous regimen, which included a
loading dose of 100mg followed by 50mg every 12 hours for a
total of seven doses.[138] The mean concentrations of tigecycline
in serum andELFwere similar during the entire 12-hour dosing
interval and ranged from 0.10 to 0.19 mg/mL and from 0.06 to
0.37 mg/mL, respectively (table XII). In contrast, the mean
concentrations in AMs were significantly higher (p < 0.05)
and ranged from 10.7 to 15.2 mg/mL. A population phar-
macokinetic analysis and Monte Carlo simulations were sub-
sequently conducted to determine systemic exposure (based on
AUC24 values) and penetration ratios.[140] The median ELF
to serum concentration ratio was 1.15 and was associated
with wide variability (5th and 95th percentiles 0.561 and 5.23,
respectively).
It is worth noting that the protein binding of tigecycline in
humans ranges from 71% to 89%, and the data reported above
used total serum concentrations from uninfected subjects. Two
recent studies in animal models have suggested that (i) a sig-
nificantly higher penetration ratio is seen when protein binding
is accounted for and unbound serum concentrations are used;
(ii) ELF to unbound serum concentration ratios are sig-
nificantly higher in mice with a pulmonary infection (12.9 and
23.3 at doses of 25 and 50mg/kg, respectively) than in those
without a pulmonary infection (6.2 and 8.1 at doses of 25 and
50mg/kg, respectively); and (iii) the penetration ratio is dose
dependent and tends to increase with larger doses.[141,142]
Further studies are needed to confirm these observations in
patients with lower respiratory tract infections.
7.3 Iclaprim
Iclaprim is a dihydrofolate reductase inhibitor and a mem-
ber of the diaminopyrimidine class of anti-infective agents.
Iclaprim has potent in vitro activity against Gram-positive pa-
thogens, including meticillin-resistant S. aureus and Strepto-
coccus species.
Plasma and intrapulmonary concentrations of iclaprim were
measured in 24 healthy male subjects from 1.8 to 7.08 hours
after the start of a 1-hour intravenous infusion of 1.6mg/kg of
bodyweight.[139] The concentrations of iclaprim in ELF (range
0.5–25.3 mg/mL) exceeded the concomitant plasma concentra-
tions at all sampling times with the ratios of ELF to total
plasma concentrations ranging from 6 to 51.2 (table XII). The
MIC90 values for Gram-positive pathogens such as penicillin-
susceptible and -intermediate S. pneumoniae (0.06 and 2 mg/mL,
respectively) and meticillin-resistant S. aureus (0.12 mg/mL)
were exceeded by the concentrations of iclaprim in ELF for up
to 7 hours. The concentrations of iclaprim in AMs were similar
to or higher than those in ELF.
8. Conclusions
The penetration of antibacterial agents into the ELF of the
lung has been extensively evaluated during the past 20 years.
This review includes more than 80 studies that have reported
ELF concentrations and extracellular penetration ratios of
antibacterial agents that are used to treat lower respiratory
tract infections. More studies (e.g. >100) would have been in-
cluded in the review if we had elected to include all reports on
fluoroquinolones instead of just those on ciprofloxacin, moxi-
floxacin and levofloxacin.[25,62,63,86-102,111-115] In spite of this,
fluoroquinolones still accounted for approximately 25% of the
studies that we reviewed.
A wide variety of penetration ratios and patterns of ELF
disposition have been observed for agents from various anti-
bacterial classes. Aminoglycosides, b-lactams and glycopep-
tides tend to have ELF to total plasma concentration ratios of
£1. Aminoglycosides tend to have ELF concentrations that are
fairly constant and significantly lower than plasma concentra-
tions in the first few hours after drug administration, with
subsequent ELF concentrations being similar to or slightly
lower than plasma concentrations during the last half of the
dosing interval. A wide range of penetration ratios has been
reported for b-lactam agents. Even when protein binding
and differences in the characteristics of the molecule are taken
into account, the discordance in penetration could not be pre-
dicted for various agents from the b-lactam classes. Although
the number of studies of glycopeptide or lipoglycopeptide agents
(e.g. vancomycin, telavancin, oritavancin) is limited, once protein
binding is accounted for, the pattern of disposition and the
ratios of ELF to unbound plasma concentrations are similar
and approach values closer to 1.
658 Rodvold et al.
ª 2011 Adis Data Information BV. All rights reserved. Clin Pharmacokinet 2011; 50 (10)
In comparison, antibacterial agents such as macrolides, ke-
tolides, fluoroquinolones (e.g. levofloxacin and moxifloxacin)
and linezolid have ELF to total plasma concentration ratios of
>1. Why agents from these antibacterial classes tend to have
higher concentrations in ELF than in plasma remains un-
known. Recent studies have suggested that active transporter
systems in epithelial cells may be involved and may influence
the secretion of these agents in the lung.[103,143-145] On the other
hand, technical issues associated with the collection of BAL
samples and measurement of ELF concentrations have been
raised as other potential explanations for these observa-
tions.[12,13,15] Some authors have provided rationales as to why
these confounding variables may not explain the higher ob-
served ELF concentrations. Obviously, more research is needed
to understand the underlying mechanisms of drug transporters
in the lung, and strict adherence to sample collection proce-
dures is required in order to minimize known sources of error.
The majority of studies have been conducted in adults
who were healthy or outpatients undergoing an elective diag-
nostic fibre-optic bronchoscopy. The BAL procedure has
usually consisted of 150–200mL of 0.9% normal saline solution
being instilled as three or four aliquots. A few recent studies
have targeted older outpatients or patients with a clinical
diagnosis of mild to moderate chronic bronchitis, chronic ob-
structive pulmonary disease or lower respiratory tract infec-
tion.[53,54,62,69,112,115] The reported ELF concentrations were
similar to or slightly higher than those observed in healthy
subjects. An increasing number of studies have provided ELF
data in critically ill patients who were in an intensive care unit,
receiving mechanical ventilation and being treated for severe
pneumonia.[36,39,40,49,113,118,119,121,122,124,126-128,130,137] In these
patients, microlavage or minilavage (e.g. 20mL of 0.9% nor-
mal saline solution instilled as one or two aliquots per sampl-
ing time) has commonly been used for the BAL procedure.[18]
Despite differences in study procedures and patient popula-
tions, the data on the antibacterial agents that have been
studied so far (e.g. piperacillin/tazobactam, ceftazidime, cefe-
pime, meropenem, levofloxacin, aminoglycosides, vancomycin,
teicoplanin, linezolid) have shown that ELF concentrations
were similar to those observed in healthy subjects and out-
patients. Thus antibacterial concentrations in ELF from non-
infected subjects tend to serve as conservative estimates of
the likely drug concentrations at extracellular sites of lung in-
fection. However, further studies are still warranted in pa-
tients with pulmonary infections to explore the importance
of intrapulmonary concentrations with respect to establish-
ing relationships between pharmacokinetic-pharmacodynamic
parameters and clinical or microbiological outcomes.
The interpretation of antibacterial concentrations in ELF is
greatly influenced by the study design, sample collection and
timing, analytical methods and data analysis. Our review of the
literature and our work as investigators in these types of studies
have provided us with an appreciation of the following key
issues that need to be considered when reviewing and/or de-
signing intrapulmonary penetration studies: (i) multiple-dose
studies are more likely to provide meaningful information
and measurable ELF concentrations; (ii) serial sampling times
should be spaced throughout a dosing interval in order to
provide accurate estimates of AUCs in plasma and in ELF;
(iii) procedures for collection, handling and storage of BAL
samples are required, including careful separation of ELF and
cell components; (iv) studies should involve experienced per-
sonnel using established bronchoscopy and BAL procedures
that are individualized to the type of subjects being studied;
(v) analytical methodologies must be sensitive and specific
for measurement of urea and drug concentrations in plasma
and in ELF; and (vi) pharmacokinetic-pharmacodynamic data
analysis and mathematical modelling should take into account
protein binding, systemic exposure, simulations of drug con-
centration profiles and evaluation of target attainment rates.
Ideally, a logical approach for evaluating dosage regimens –
based on preclinical infection models, the pharmacokinetic-
pharmacodynamic characteristics of the agent being studied
and drug exposure information at the site of infection (e.g. ELF
in the lung) – should be incorporated into the study design.[41]
All of these considerations are important to the understanding
of ELF penetration and appropriate decision-making to guide
dosage regimen designs for patients with lower respiratory tract
infections.[7]
This review has focused on human studies that have mea-
sured ELF concentrations of antibacterial agents. An increas-
ing number of intrapulmonary penetration studies have been
conducted in animals. Antibacterial agents that have and have
not been studied in humans have been evaluated for applica-
tions in veterinary medicine for foals, horses and dogs.[146-155]
In addition, animal studies evaluating different modes of ad-
ministration or formulations of current and investigational
antibacterial agents have been reported.[156-160] These studies
are also providing further insights into the penetration of an-
tibacterial agents into ELF.
Acknowledgements
No sources of funding were used in the preparation of this review. The
authors have no conflicts of interest that are directly relevant to the content
of this review.
Penetration of Antibacterial Agents into Pulmonary ELF 659
ª 2011 Adis Data Information BV. All rights reserved. Clin Pharmacokinet 2011; 50 (10)

References1. Siegel RE. The significance of serum versus tissue concentrations of anti-
biotics in the treatment of penicillin-resistant Streptococcus pneumoniae and
community-acquired pneumonia: are we looking in the wrong place? Chest
1999; 116: 535-8
2. Craig WA. Pharmacokinetic-pharmacodynamic parameters: rationale for
antibacterial dosing of mice and men. Clin Infect Dis 1998; 26: 1-10
3. Rodvold KA. Pharmacodynamics of antiinfective therapy: taking what we
know to the patient’s bedside. Pharmacotherapy 2001; 11 (Pt 2): 319S-330S
4. Ambrose PG, Bhavnani SM, Rubino CM, et al. Pharmacokinetics-
pharmacodynamics of antimicrobial therapy: it’s not just for mice anymore.
Clin Infect Dis 2007; 44: 78-86
5. Muller ML, dela Pena A, Derendorf H. Issues in pharmacokinetics and
pharmacodynamics of anti-infective agents: distribution in tissue. Anti-
microb Agents Chemother 2004; 48: 1441-53
6. Drusano GL. Infection site concentrations: their therapeutic importance and
the macrolide and macrolide-like class of antibiotics. Pharmacotherapy
2005; 25 (Pt 2): 150S-158S
7. Ambrose PG, Bhavnani SM, Ellis-Grosse EJ, et al. Pharmacokinetic-
pharmacodynamic considerations in the design of hospital-acquired or
ventilator-associated bacterial pneumonia studies: look before you leap! Clin
Infect Dis 2010; 51 Suppl. 1: S103-10
8. Honeybourne D. Antibiotic penetration in the respiratory tract and im-
plications for the selection of antimicrobial therapy. Curr Opin Pulm Med
1997; 3: 170-4
9. Nix DE. Intrapulmonary concentrations of antimicrobial agents. Infect Dis
Clin North Am 1998; 12: 631-46
10. Fish DN. Bronchoscopic sampling of drug concentrations: penetration to
tissue is the issue. Am J Respir Crit Care Med 2003; 168: 1263-5
11. Baldwin DR, Honeybourne D, Wise R. Pulmonary disposition of anti-
microbial agents: in vivo observations and clinical relevance. Antimicrob
Agents Chemother 1992; 36: 1176-80
12. Dhanani J, Roberts JA, ChewM, et al. Antimicrobial chemotherapy and lung
microdialysis: a review. Int J Antimicrob Agents 2010; 36: 491-500
13. ZeitlingerM,MullerM, JoukhadarC. Lungmicrodialysis: a powerful tool for
the determination of exogenous and endogenous compounds in the lower
respiratory tract (mini-review). AAPS J 2005; 7: E600-8
14. Mouton JW, Theuretzbacher U, Craig WA, et al. Tissue concentrations: do
we ever learn? J Antimicrob Chemother 2008; 61: 235-7
15. Kiem S, Schentag JJ. Interpretation of antibiotic concentration ratios mea-
sured in epithelial lining fluid. Antimicrob Agents Chemother 2008; 52: 24-36
16. Baldwin DR, Honeybourne D, Wise R. Pulmonary disposition of anti-
microbial agents: methodological considerations. Antimicrob Agents Che-
mother 1992; 36: 1171-5
17. Rennard SI, Basset G, Lecossier D, et al. Estimation of volume of epithelial
lining fluid recovered by lavage using urea as marker of dilution. J Appl
Physiol 1986; 60: 532-8
18. Mimoz O, Dahyot-Fizelier C. Mini-broncho-alveolar lavage: a simple and
promising method for assessment of antibiotic concentration in epithelial
lining fluid. Intensive Care Med 2007; 33: 1495-7
19. Burke WMJ, Roberts CM, Bryant DH, et al. Smoking-induced changes in epi-
thelial lining fluid volume, cell density and protein. Eur Respir J 1992; 5: 780-4
20. Roberts CM, Cairns D, Bryant DH, et al. Changes in epithelial lining fluid
albumin associated with smoking and interstitial lung disease. Eur Respir J
1993; 6: 110-5
21. HasegawaN,Nishimura T,WatabnabeM, et al. Concentrations of clarithromycin
and activemetabolite in the epithelial lining fluid of patients withMycobacterium
avium complex pulmonary disease. Pulm Pharmacol Ther 2009; 22: 190-3
22. Kikuchi E, Kikuchi J, Nasuhara Y, et al. Comparison of the pharmaco-
dynamics of biapenem in bronchial epithelial lining fluid in healthy volun-
teers given half-hour and three-hour intravenous infusions. Antimicrob
Agents Chemother 2009; 53: 2799-803
23. Kikuchi E, Yamazaki K, Kikuchi J, et al. Pharmacokinetics of clarithromycin
in bronchial epithelial lining fluid. Respirology 2008; 13: 221-6
24. Kikuchi J, Yamazaki K, Kikuchi E, et al. Pharmacokinetics of telithromycin
using bronchoscopic microsampling after single and multiple oral doses.
Pulm Pharmacol Ther 2007; 20: 549-55
25. Yamazaki K, Ogura S, Ishizaka A, et al. Bronchoscopic microsampling
method for measuring drug concentration in epithelial lining fluid. Am J
Respir Crit Care Med 2003; 168: 1304-7
26. Bamberger DM, Foxworth JW, Bridwell DL, et al. Extravascular anti-
microbial distribution and the respective blood and urine concentrations in
humans. In: Lorain V, editor. Antibiotics in laboratory medicine. 5th ed.
Philadelphia (PA): Lippincott Williams & Wilkins, 2005: 719-809
27. Chu H-M, Ette EI. Analysis of quantic pharmacokinetic study: robust esti-
mation of tissue-to-plasma ratio. In: Ette EI, Williams PJ, editors. Phar-
macometrics: the science of quantitative pharmacology. Hoboken (NJ):
John Wiley & Sons, Inc., 2007: 1035-68
28. Cook PJ, Andrews JM, Woodcock J, et al. Concentration of amoxycillin and
clavulanate in lung compartments in adults without pulmonary infection.
Thorax 1994; 49: 1134-8
29. Baldwin DR, Andrews JM, Wise R, et al. Bronchoalveolar distribution of
cefuroxime axetil and in-vitro efficacy of observed concentrations against
respiratory pathogens. J Antimicrob Chemother 1992; 30: 377-85
30. Conte Jr JE, Golden J, Duncan S, et al. Single-dose intrapulmonary phar-
macokinetics of azithromycin, clarithromycin, ciprofloxacin, and cefurox-
ime in volunteer subjects. Antimicrob Agents Chemother 1996; 40: 1617-22
31. Muller-Serieys C, Bancal C, Dombret MC, et al. Penetration of cefpodoxime
proxetil in lung parenchyma and epithelial lining fluid of noninfected
patients. Antimicrob Agents Chemother 1992; 36: 2099-103
32. Andrews JM, Wise R, Baldwin DR, et al. Concentrations of ceftibuten in
plasma and the respiratory tract following a single 400mg oral dose. Int J
Antimicrob Agents 1995; 5: 141-4
33. Cook PJ, Andrews JM, Wise R, et al. Distribution of cefdinir, a third gen-
eration cephalosporin antibiotic, in serum and pulmonary compartment.
J Antimicrob Chemother 1996; 37: 331-9
34. Mazzei T, Novelli A, Esposito S, et al. New insight into the clinical phar-
macokinetics of cefaclor: tissue penetration. J Chemother 2000; 12: 53-62
35. Lodise TP, Kinzig-Schippers M, Drusano GL, et al. Use of population
pharmacokinetic modeling and Monte Carlo simulation to describe the
pharmacodynamic profile of cefditoren in plasma and epithelial lining fluid.
Antimicrob Agents Chemother 2008; 52: 1945-51
36. Boselli E, Breilh D, Cannesson M, et al. Steady-state plasma and in-
trapulmonary concentrations of piperacillin/tazobactam 4 g/0.5 g adminis-
tered to critically ill patients with severe nosocomial pneumonia. Intensive
Care Med 2004; 30: 976-9
37. Baldwin DR, Maxwell SRJ, Honeybourne D, et al. The penetration of cef-
pirome into the potential sites of pulmonary infection. J Antimicrob Che-
mother 1991; 28: 79-86
38. Cazzola M, Matera MG, Polverino M, et al. Pulmonary penetration of cef-
tazidime. J Chemother 1995; 7: 50-4
39. Boselli E, Breilh D, Rimmele T, et al. Plasma and lung concentrations of
ceftazidime administered in continuous infusion to critically ill patients with
severe nosocomial pneumonia. Intensive Care Med 2004; 30: 989-91
40. Boselli E, Breilh D, Duflo F, et al. Steady-state plasma and intrapulmonary
concentrations of cefepime administered in continuous infusion in critically
ill patients with severe nosocomial pneumonia. Crit Care Med 2003; 31:
2102-6
41. Rodvold KA, Nicolau DP, Lodise TP, et al. Identifying exposure target for
treatment of staphylococcal pneumonia with ceftopibrole. Antimicrob
Agents Chemother 2009; 53: 3294-301
660 Rodvold et al.
ª 2011 Adis Data Information BV. All rights reserved. Clin Pharmacokinet 2011; 50 (10)
42. Krumpe P, Lin C-C,Radwanski E, et al. The penetration of ceftibuten into the
respiratory tract. Chest 1999; 116: 369-74
43. Bayat S, Louchahi K, Verdiere B, et al. Comparison of 99mTc-DTPA and urea
for measuring cefepime concentrations in epithelial lining fluid. Eur Respir J
2004; 24: 150-6
44. Laohavaleeson S, Tessier PR, Nicolau DP. Pharmacodynamic characteriza-
tion of ceftobiprole in experimental pneumonia caused by phenotypically
diverse Staphylococcus aureus strains. Antimicrob Agents Chemother 2008;
52: 2389-94
45. Allegranzi B, Cazzadori A, Di Perri G, et al. Concentrations of single-dose
meropenem (1 g iv) in bronchoalveolar lavage and epithelial lining fluid.
J Antimicrob Chemother 2000; 46: 319-22
46. Conte Jr JE, Golden JA, KelleyMG, et al. Intrapulmonary pharmacokinetics
and pharmacodynamics of meropenem. Int J Antimicrob Agents 2005; 26:
449-56
47. Burkhardt O,Majcher-Peszynska J, BornerK, et al. Penetration of ertapenem
into different pulmonary compartments of patients undergoing lung surgery.
J Clin Pharmacol 2005; 45: 659-65
48. Boselli E, Breilh D, Saux M-C, et al. Pharmacokinetics and lung concentra-
tions of ertapenem in patients with ventilator-associated pneumonia. In-
tensive Care Med 2006; 32: 2059-62
49. Drusano GL, Sorgel F, Ma L, et al. Pharmacokinetics and penetration
of meropenem into epithelial lining fluid in patients with ventilator-
associated pneumonia [abstract no. A-222]. 45th Interscience Conference
on Antimicrobial Agents and Chemotherapy (ICAAC); 2005 Dec 16-19;
Washington, DC
50. Lodise TP, Sorgel F, Melnick D, et al. Penetration of meropenem into epi-
thelial lining fluid of patients with ventilator-associated pneumonia. Anti-
microb Agents Chemother 2011; 55: 1606-10
51. Conte Jr JE, Golden JA, Duncan S, et al. Intrapulmonary pharmacokinetics
of clarithromycin and erythromycin. Antimicrob Agents Chemother 1995;
39: 334-8
52. Chastre J, Brun P, Fourtillan JB, et al. Pulmonary disposition of roxithro-
mycin (RU 28965), a new macrolide antibiotic. Antimicrob Agents Che-
mother 1987; 31: 1312-6
53. Nakamura H, Fujishima S, Inoue T, et al. Clinical and immunoregulatory
effects of roxithromycin therapy for chronic respiratory tract infection. Eur
Resp J 1999; 13: 1371-9
54. Cazzola M, Matera MG, Tufano MA, et al. Pulmonary penetration of diri-
thromycin in patients suffering from acute exacerbations of chronic bron-
chitis. Pul Pharmacol 1994; 7: 377-81
55. Furuie H, Saisho Y, Yoshikawa T, et al. Intrapulmonary pharmacokinetics of
S-013420, a novel bicyclolide antibacterial, in healthy Japanese subjects.
Antimicrob Agents Chemother 2010; 54: 866-70
56. Honeybourne D, Kees F, Andrews JM, et al. The levels of clarithromycin and
its 14-hydroxy metabolite in the lung. Eur Respir J 1994; 7: 1275-80
57. Patel KB, Xuan D, Tessier PR, et al. Comparison of bronchopulmonary
pharmacokinetics of clarithromycin and azithromycin. Antimicrob Agents
Chemother 1996; 40: 2375-9
58. Rodvold KA, GotfriedMH, Danziger LH, et al. Intrapulmonary steady-state
concentrations of clarithromycin and azithromycin in healthy adult volun-
teers. Antimicrob Agents Chemother 1997; 41: 1399-402
59. Gotfried MH, Danziger LH, Rodvold KA. Steady-state plasma and bron-
chopulmonary characteristics of clarithromycin extended-release tablets in
normal healthy adult subjects. J Antimicrob Chemother 2003; 52: 450-6
60. Baldwin DR,Wise R, Andrews JM, et al. Azithromycin concentrations at the
sites of pulmonary infection. Eur Resp J 1990; 3: 886-90
61. Olsen KM, San Pedro GS, Gann LP, et al. Intrapulmonary pharmacokinetics
of azithromycin in healthy volunteers given five oral doses. Antimicrob
Agents Chemother 1996; 40: 2582-5
62. Capitano B, Mattoes HM, Shore E, et al. Steady-state intrapulmonary con-
centrations of moxifloxacin, levofloxacin, and azithromycin in older adults.
Chest 2004; 125: 965-73
63. Rodvold KA, Danziger LH, Gotfried MH. Steady-state plasma and bron-
chopulmonary concentrations of intravenous levofloxacin and azithromycin
in healthy adults. Antimicrob Agents Chemother 2003; 47: 2450-7
64. Kadota J-I, Ishimatsu Y, Iwashita T, et al. Intrapulmonary pharmacokinetics
of telithromycin, a new ketolide, in healthy Japanese volunteers. Antimicrob
Agents Chemother 2002; 46: 917-21
65. Khair OA, Andrews JM, Honeybourne D, et al. Lung concentrations of teli-
thromycin after oral dosing. J Antimicrob Chemother 2001; 47: 837-40
66. Ong CT, Dandekar PK, Sutherland C, et al. Intrapulmonary concentrations
of telithromycin: clinical implications for respiratory tract infections due to
Streptococcus pneumonia. Chemotherapy 2005; 51: 339-46
67. Muller-Serieys C, Soler P, Cantalloube C, et al. Bronchopulmonary disposi-
tion of the ketolide telithromycin (HMR 3647). Antimicrob Agents Che-
mother 2001; 45: 3104-8
68. Conte Jr JE, Golden JA, Kipps J, et al. Steady-state plasma and in-
trapulmonary pharmacokinetics and pharmacodynamics of cethromycin.
Antimicrob Agents Chemother 2004; 48: 3508-15
69. Matera MG, Tufano MA, Polverino M, et al. Pulmonary concentrations of
dirithromycin and erythromycin during acute exacerbation of mild chronic
obstructive pulmonary disease. Eur Resp J 1997; 10: 98-103
70. Bergman KL, Olsen KM, Peddicord TE, et al. Antimicrobial activities and
postantibiotic effects of clarithromycin, 14-hydroxy-clarithromycin, and
azithromycin in epithelial cell lining fluid against clinical isolates of Hae-
mophilus influenzae and Streptococcus pneumoniae. Antimicrob Agents
Chemother 1999; 43: 1291-3
71. Noreddin AM, Roberts D, Nichol K, et al. Pharmacodynamic modeling of
clarithromycin against macrolide-resistant [PCR-positive mef(A) or erm(B)]
Streptococcus pneumoniae simulating clinically achievable serum and epi-
thelial lining fluid free-drug concentrations. Antimicrob Agents Chemother
2002; 46: 4029-34
72. Maglio D, Capitano B, Banevicius MA, et al. Differential efficacy of clarithro-
mycin in lung versus thigh infection models. Chemotherapy 2004; 50: 63-6
73. Noreddin AM, El-Khatib WF, Aolie J, et al. Pharmacodynamic target at-
tainment potential of azithromycin, clarithromycin, and telithromycin in
serum and epithelial lining fluid of community-acquired pneumonia patients
with penicillin-susceptible, intermediate, and resistant Streptococcus
pneumoniae. Int J Antimicrob Agents 2009; 13: 483-7
74. Kays MB, Denys GA. In vitro activity and pharmacodynamics of azi-
thromycin and clarithromycin against Streptococcus pneumoniae based on
serum and intrapulmonary pharmacokinetics. Clin Ther 2001; 23: 413-24
75. Ambrose PG. Antimicrobial susceptibility breakpoints: PK-PD and suscep-
tibility breakpoints. Treat Respir Med 2005; 4 Suppl. 1: 5-11
76. Lucchi M, Damle B, Fang A, et al. Pharmacokinetics of azithromycin in
serum, bronchial washings, alveolar macrophages and lung tissue following
a single oral dose of extended or immediate release formulations of azi-
thromycin. J Antimicrob Chemother 2008; 61: 884-91
77. Alou L, Gimenez M-J, Sevillano D, et al. A pharmacodynamic approach to
antimicrobial activity in serum and epithelial lining fluid against in vivo-
selected Streptococcus pneumoniae mutants and association with clinical
failure in pneumonia. J Antimicrob Chemother 2006; 58: 349-58
78. Sevillano D, Alou L, Aguilar L, et al. Azithromycin IV pharmacodynamic
parameters predicting Streptococcus pneumoniae killing in epithelial lining
fluid versus serum: an in vitro pharmacodynamic simulation. J Antimicrob
Chemother 2006; 57: 1128-33
79. Cafini F, Alou L, Sevillano D, et al. Bactericidal activity of moxifloxacin
against multidrug-resistant Streptococcus pneumoniae at clinically achiev-
able serum and epithelial lining fluid concentrations compared with three
other antimicrobials. Int J Antimicrob Agents 2004; 24: 334-8
Penetration of Antibacterial Agents into Pulmonary ELF 661
ª 2011 Adis Data Information BV. All rights reserved. Clin Pharmacokinet 2011; 50 (10)

80. Zhanel GG, DeCorby M, Noreddin A, et al. Pharmacodynamic activity of
azithromycin against macrolide-susceptible and -resistant Streptococcus
pneumoniae simulating clinically achievable free serum, epithelial lining
fluid andmiddle ear fluid concentrations. J Antimicrob Chemother 2003; 52:
83-8
81. Lodise TP, Preston S, BhargavaV, et al. Pharmacodynamics of an 800-mg dose of
telithromycin in patients with community-acquired pneumonia caused by ex-
tracellular pathogens. Diagn Microbiol Infect Dis 2005; 52: 45-52
82. Zhanel GG, Johanson C, Laing N, et al. Pharmacodynamic activity of teli-
thromycin at simulated clinically achievable free-drug concentrations in
serum and epithelial lining fluid against efflux (mefE)-producing macrolide-
resistant Streptococcus pneumoniae for which telithromycin MICs vary.
Antimicrob Agents Chemother 2005; 49: 1943-8
83. Zhanel GG, Johanson C, Hisanaga T, et al. Pharmacodynamic activity of
telithromycin against macrolide-susceptible and macrolide-resistant Strep-
tococcus pneumoniae simulating clinically achievable free serum and epi-
thelial lining fluid concentrations. J Antimicrob Chemother 2004; 54: 1072-7
84. De Vecchi E, Nicola L, Larosa M, et al. In vitro activity of telithromycin
against Haemophilus influenzae at epithelial lining fluid concentrations.
BMC Microbiol 2008; 8: 23
85. Al-Lahham A, Reinert RR. Time-kill kinetics of Streptococcus pneumoniae
with reduced susceptibility to telithromycin. Chemotherapy 2007; 53: 190-3
86. Chierakul N, Klomsawat D, Chulavatnatol S, et al. Intrapulmonary
pharmacokinetics of ofloxacin in drug-resistant tuberculosis. Int J Tuberc
Lung Dis 2001; 5: 278-82
87. Andrews JM, Honeybourne D, Brenwald NP, et al. Concentrations of trova-
floxacin in bronchial mucosa, epithelial lining fluid, alveolar macrophages and
serumafter administration of single ormultiple oral doses to patients undergoing
fibre-optic bronchoscopy. J Antimicrob Chemother 1997; 39: 797-802
88. Peleman RA, Van De Velde V, Germonpre PR, et al. Trovafloxacin con-
centrations in airway of patients with severe community-acquired pneu-
monia. Antimicrob Agents Chemother 2000; 44: 178-80
89. Honeybourne D, Banerjee D, Andrews J, et al. Concentrations of gatifloxacin
in plasma and pulmonary compartments following a single 400mg oral dose
in patients undergoing fibre-optic bronchoscopy. J Antimicrob Chemother
2001; 48: 63-6
90. Kikuchi J, Yamazaki K, Kikuchi E, et al. Pharmacokinetics of gatifloxacin
after a single oral dose in healthy young adult subjects and adult patients
with chronic bronchitis, with a comparison of drug concentrations obtained
by bronchoscopic microsampling and bronchoalveolar lavage. Clin Ther
2007; 29: 123-30
91. Andrews J, Honeybourne D, Jevons G, et al. Concentrations of garenoxacin
in plasma, bronchial mucosa, alveolar macrophages and epithelial lining
fluid following a single oral 600mg dose in healthy adult subjects. J Anti-
microb Chemother 2003; 51: 727-30
92. Panteix G, Harf R, Desnottes JR, et al. Accumulation of pefloxacin in the
lower respiratory tract demonstrated by bronchoalveolar lavage. J Anti-
microb Chemother 1994; 33: 979-85
93. WiseR,Andrews J, ImbimboBP, et al. The penetration of rufloxacin into sites
of potential infection in the respiratory tract. J Antimicrob Chemother 1993;
32: 861-6
94. Honeybourne D, Andrews JM, Cunningham B, et al. The concentrations of
clinafloxacin in alveolar macrophages, epithelial lining fluid, bronchial
mucosa and serum after administration of single 200mg oral doses to
patients undergoing fibre-optic bronchoscopy. J Antimicrob Chemother
1999; 43: 153-5
95. Baldwin DR, Wise R, Andrews JM, et al. The distribution of temafloxacin in
bronchial epithelial lining fluid, alveolar macrophages and bronchial mu-
cosa. Eur Respir J 1992; 5: 471-6
96. Wise R, Baldwin DR, Andrews JM, et al. Comparative pharmacokinetic
disposition of fluoroquinolones in the lung. J Antimicrob Chemother 1991;
28 Suppl. C: 65-71
97. Cazzola M, Matera MG, Tufano MA, et al. Pulmonary disposition of lo-
mefloxacin in patients with acute exacerbations of chronic obstructive pul-
monary disease: a multiple-dose study. J Chemother 2001; 13: 407-12
98. Baldwin DR, Wise R, Andrews JM, et al. Comparative bronchoalveolar
concentrations of ciprofloxacin and lomefloxacin following oral adminis-
tration. Respir Med 1993; 87: 595-601
99. Schuller P, Zemper K, Borner K, et al. Penetration of sparfloxacin and
ciprofloxacin into alveolar macrophages, epithelial lining fluid, and poly-
morphonuclear leucocytes. Eur Respir J 1997; 10: 1130-8
100. Honeybourne D, Greaves I, Baldwin DR, et al. The concentrations of spar-
floxacin in lung tissues after single and multiple oral doses. Int J Antimicrob
Agents 1994; 4: 151-5
101. Gotfried MH, Danziger LH, Rodvold KA. Steady-state plasma and in-
trapulmonary concentrations of levofloxacin and ciprofloxacin in healthy
adult subjects. Chest 2001; 119: 1114-22
102. Soman A, Honeybourne D, Andrews J, et al. Concentrations of moxifloxacin
in serum and pulmonary compartments following a single 400mg oral dose
in patients undergoing fibre-optic bronchoscopy. J Antimicrob Chemother
1999; 44: 835-8
103. Brillault J, De Castro WV, Harnois T, et al. P-glycoprotein-mediated trans-
port of moxifloxacin in a Calu-3 lung epithelial cell model. Antimicrob
Agents Chemother 2009; 53: 1457-62
104. Morrissey I, George JT. Measurement of the bactericidal activity of fluoro-
quinolones against Streptococcus pneumonia using the bactericidal index
method. Int J Antimicrob Agents 2001; 17: 33-7
105. Florea NR, Tessier PR, Zhang C, et al. Pharmacodynamics of moxifloxacin and
levofloxacin at simulated epithelial lining fluid drug concentrations against
Streptococcus penumoniae. Antimicrob Agents Chemother 2004; 48: 1215-21
106. Schubert S, Dalhoff A, StassH, et al. Pharmacodynamics of moxifloxacin and
levofloxacin simulating human serum and lung concentrations. Infection
2005; 33 Suppl. 2: 15-21
107. Lee SY, Fan HW, Sutherland C, et al. Antibacterial effects of moxifloxacin
and levofloxacin simulating epithelial lining fluid concentrations against
community-acquired methicillin-resistant Staphylococcus aureus. Drugs R
D 2007; 8: 69-77
108. Deryke CA, Du X, Nicolau DP. Evaluation of bacterial kill when modeling
the bronchopulmonary pharmacokinetic profile of moxifloxacin and levo-
floxacin against parC-containing isolates of Streptococcus pneumoniae.
J Antimicrob Chemother 2006; 58: 601-9
109. Noreddin AM, Reese AA, Ostroski M, et al. Comparative pharmaco-
dynamics of garenoxacin, gemifloxacin, and moxifloxacin in community-
acquired pneumonia caused by Streptococcus pneumoniae: a Monte Carlo
simulation analysis. Clin Ther 2007; 29: 2685-9
110. De Vecchi E, Nicola L, Ossola F, et al. In vitro selection of resistance in
Streptococcus pneumoniae at in vivo fluoroquinolone concentrations.
J Antimicrob Chemother 2009; 63: 721-7
111. Andrews JM, Honeybourne D, Jevons G, et al. Concentrations of levo-
floxacin (HR 355) in the respiratory tract following a single oral dose in
patients undergoing fibre-optic bronchoscopy. J Antimicrob Chemother
1997; 40: 573-7
112. Zhang J, Xie X, ZhouX, et al. Permeability and concentration of levofloxacin
in epithelial lining fluid in patients with lower respiratory tract infections.
J Clin Pharmacol 2010; 50: 922-8
113. Boselli E, Breilh D, Rimmele T, et al. Pharmacokinetics and intrapulmonary
diffusion of levofloxacin in critically ill patients with severe community-
acquired pneumonia. Crit Care Med 2005; 33: 104-9
114. Conte Jr JE, Golden JA, McIver M, et al. Intrapulmonary pharmacokinetics
and pharmacodynamics of high-dose levofloxacin in healthy volunteer
subjects. Int J Antimicrob Agents 2006; 28: 114-21
115. Conte Jr JE, Golden JA, McIver M, et al. Intrapulmonary pharmaco-
dynamics of high-dose levofloxacin in subjects with chronic bronchitis or
662 Rodvold et al.
ª 2011 Adis Data Information BV. All rights reserved. Clin Pharmacokinet 2011; 50 (10)
chronic obstructive pulmonary disease. Int J Antimicrob Agents 2007; 30:
422-7
116. Drusano GL, Preston SL, Gotfried MH, et al. Levofloxacin penetration into
epithelial lining fluid as determined by population pharmacokinetic mod-
eling andMonte Carlo simulation. Antimicrob Agents Chemother 2002; 46:
586-9
117. Noreddin AM, Marras TK, Sanders K, et al. Pharmacodynamic target at-
tainment analysis against Streptococcus pneumoniae using levofloxacin
500mg, 750mg, and 1000mg once daily in plasma (P) and epithelial lining
fluid (ELF) of hospitalized patients with community acquired pneumonia.
Int J Antimicrob Agents 2004; 24: 479-84
118. Louie A, Fregeau C, Liu W, et al. Pharmacodynamics of levofloxacin in a
murine pneumonia model of Pseudomonas aeruginosa infection: determi-
nation of epithelial lining fluid targets. Antimicrob Agents Chemother 2009;
53: 3325-30
119. Panidis D, Markantonis SL, Boutzouka E, et al. Penetration of gentamicin
into the alveolar lining fluid of critically ill patients with ventilator-
associated pneumonia. Chest 2005; 128: 545-52
120. Mazzei T, Novelli A, De Lalla F, et al. Tissue penetration and pulmonary
disposition of tobramycin. J Chemother 1995; 7: 363-70
121. Carcas AJ, Garcia-Satue JL, Zapater P, et al. Tobramycin penetration into
epithelial lining fluid of patients with pneumonia. Clin Pharmacol Ther 1999;
65: 245-50
122. Boselli E, Breilh D, Djabarouti S, et al. Reliability of mini-bronchoalveolar
lavage for the measurement of epithelial lining fluid concentrations of to-
bramycin in critically ill patients. Intensive Care Med 2007; 33: 1519-23
123. Rosenfeld M, Gibson R, McNamara S, et al. Serum and lower respiratory
tract drug concentrations after tobramycin inhalation in young children with
cystic fibrosis. J Pediatr 2001; 139: 572-7
124. Valcke VJ, Vogelaers DP, Colardyn FA, et al. Penetration of netilmicin in the
lower respiratory tract after once-daily dosing. Chest 1992; 101: 1028-32
125. Rybak M, Lomaestro B, Rotschafer JC, et al. Therapeutic monitoring of
vancomycin in adult patients: a consensus review of the American Society of
Health-System Pharmacists, the Infectious Diseases Society of America, and
the Society of Infectious Diseases Pharmacists. Am J Health Syst Pharm
2009; 66: 82-98
126. Scheetz MH, Wunderink RG, Postelnick MJ, et al. Potential impact of van-
comycin pulmonary distribution on treatment outcomes in patients with
methicillin-resistant Staphylococcus aureus pneumonia. Pharmacotherapy
2006; 26: 539-50
127. Lamer C, De Beco V, Soler P, et al. Analysis of vancomycin entry into pul-
monary lining fluid by bronchoalveolar lavage in critically ill patients. An-
timicrob Agents Chemother 1993; 37: 281-6
128. Georges H, Leroy O, Alfandari S, et al. Pulmonary disposition of vancomycin
in critically ill patients. Eur J Clin Microbiol Infect Dis 1997; 16: 385-8
129. Rodvold KA, Gotfried MH, Loutit JS, et al. Plasma and intrapulmonary
concentrations of oritavancin and vancomycin in normal healthy adults
[abstract no. O-254]. Clin Microbiol Infect 2004; 10 Suppl. 3: 44
130. Mimoz O, Rolland D, Adoun M, et al. Steady-state trough serum and epi-
thelial lining fluid concentrations of teicoplanin 12mg/kg per day in patients
with ventilator-associated pneumonia. Intensive Care Med 2006; 32: 775-9
131. Gotfried MH, Shaw J-P, Benton BM, et al. Intrapulmonary distribution of
intravenous telavancin in healthy subjects and effects of pulmonary surfac-
tant on in vitro activities of telavancin and other antibiotics. Antimicrob
Agents Chemother 2008; 52: 92-7
132. Drusano GL, Rubino CM, Ambrose PG, et al. Penetration of vancomycin
into epithelial lining fluid [abstract no. A-11]. 47th Interscience Conference
for Antimicrobial Agents and Chemotherapy (ICAAC); 2007 Sep 17-20;
Chicago (IL)
133. HarigayaY, Bulitta JB, Forrest A, et al. Pharmacodynamics of vancomycin at
simulated epithelial lining fluid concentrations against methicillin-resistant
Staphylococcus aureus (MRSA): implications for dosing in MRSA pneu-
monia. Antimicrob Agents Chemother 2009; 53: 3894-901
134. Lodise TP, Gotfried M, Barriere S, et al. Telavancin penetration into human
epithelial lining fluid determined by population pharmacokinetic model-
ing and Monte Carlo simulation. Antimicrob Agents Chemother 2008; 52:
2300-4
135. Conte Jr JE, Golden JA, Kipps J, et al. Intrapulmonary pharmacokinetics of
linezolid. Antimicrob Agents Chemother 2002; 46: 1475-80
136. Honeybourne D, Tobin C, Jevons G, et al. Intrapulmonary penetration of
linezolid. J Antimicrob Chemother 2003; 51: 1431-4
137. Boselli E, Breilh D, Rimmele T, et al. Pharmacokinetics and intrapulmonary
concentrations of linezolid administered to critically ill patients with venti-
lator-associated pneumonia. Crit Care Med 2005; 33: 1529-33
138. Conte Jr JE, Golden JA, Kelly MG, et al. Steady-state serum and in-
trapulmonary pharmacokinetics and pharmacodynamics of tigecycline. Int J
Antimicrob Agents 2005; 25: 523-9
139. Andrews J, Honeybourne D, Ashby J, et al. Concentrations in plasma, epi-
thelial lining fluid, alveolarmacrophages and bronchial mucosa after a single
intravenous dose of 1.6mg/kg of iclaprim (AR-100) in healthy men. J An-
timicrob Chemother 2007; 60: 677-80
140. Rubino CM,Ma L, Bhavnani SM, et al. Evaluation of tigecycline penetration
into the colon wall tissue and epithelial lining fluid using a population
pharmacokinetic model and Monte Carlo simulation. Antimicrob Agents
Chemother 2007; 51: 2085-9
141. Crandon JL, KimA, Nicolau DP. Comparison of tigecycline penetration into
the epithelial lining fluid of infected and uninfected murine lungs. J Anti-
microb Chemother 2009; 64: 837-9
142. Koomanachai P, Crandon JL, Banevicius MA, et al. Pharmacodynamic
profile of tigecycline against methicillin-resistant Staphylococcus aureus in
an experimental pneumoniamodel. AntimicrobAgents Chemother 2009; 53:
5060-3
143. Deguchi Y, Sun J, Tauchi Y, et al. Distribution characteristics of grepa-
floxacin, a fluoroquinolone antibiotic, in lung epithelial lining fluid and
alveolar macrophage. Drug Metab Pharmacokinet 2003; 18: 319-26
144. Sun J, Deguchi Y, Tauchi Y, et al. Distribution characteristics of orally ad-
ministered olamufloxacin, a newly synthesized fluoroquinolone antibacter-
ial, in lung epithelial lining fluid and alveolar macrophage in rats. Eur J
Pharm Biopharm 2006; 64: 238-45
145. AokiM, Iguchi M, Hayashi H, et al. Active uptake of ulifloxacin in plasma to
lung that controls its concentrations in epithelial lining fluid. Biol Pharm
Bull 2009; 32: 1095-100
146. Winther L, Guardabassi L, Baptiste KE, et al. Antimicrobial disposition in
pulmonary epithelial lining fluid of horses: part I. Sulfadiazine and tri-
methoprim. J Vet Pharmacol Ther 2011; 34: 277-84
147. Winther L, Honore Hansen S, Baptiste KE, et al. Antimicrobial disposition in
pulmonary epithelial lining fluid of horses: part II. Doxycycline. J Vet
Pharmacol Ther 2011; 34: 285-9
148. Winther L, Baptiste KE, Friis C. Antimicrobial disposition in pulmonary
epithelial lining fluid of horses: part III. Cefquinome. J Vet Pharmacol Ther.
Epub 2010 Nov 18
149. Winther L, Baptiste KE, Friss C. Pharmacokinetics in pulmonary epithelial
lining fluid and plasma of ampicillin and pivampicillin administered to
horses. Res Vet Sci. Epub 2010 Dec 6
150. Javsicas LH, Giguere S, Womble AY. Disposition of oral telithromycin in
foals and in vitro activity of the drug against macrolide-susceptible and
macrolide-resistant Rhodococcus equi isolates. J Vet Pharmacol Ther 2010;
33: 383-8
151. Womble A, Giguere S, Lee EA. Pharmacokinetics of oral doxycycline and
concentrations of body fluids and bronchoalveolar cells of foals. J Vet
Pharmacol Ther 2007; 30: 187-93
Penetration of Antibacterial Agents into Pulmonary ELF 663
ª 2011 Adis Data Information BV. All rights reserved. Clin Pharmacokinet 2011; 50 (10)
152. Womble AY, Giguere S, Lee EA, et al. Pharmacokinetics of clarithromycin
and concentrations in body fluids and bronchoalveolar cells of foals. Am J
Vet Res 2006; 67: 1681-6
153. Jacks S, Giguere S, Gronwall RR, et al. Pharmacokinetics of azithromycin
and concentrations in body fluids and bronchoalveolar cells of foals. Am J
Vet Res 2001; 62: 1870-5
154. Suarez-Mier G, Giguere S, Lee EA. Pulmonary disposition of erythromycin,
azithromycin, and clarithromycin in foals. J Vet Pharmacol Ther 2007; 30:
109-55
155. Hawkins EC, Boothe DM, Guinn A, et al. Concentrations of enrofloxacin
and its active metabolite in alveolar macrophages and pulmonary epithelial
lining fluid in dogs. J Vet Pharmacol Ther 1998; 21: 18-23
156. Togami K, Chono S, Seki T, et al. Aerosol-based efficient delivery of teli-
thromycin, a ketolide antimicrobial agent, to lung epithelial lining fluid and
alveolar macrophages for treatment of respiratory infections. Drug Dev Ind
Pharm 2010; 36: 861-6
157. Togami K, Chono S, Seki T, et al. Distribution characteristics of teli-
thromycin, a novel ketolide antimicrobial agent applied for treatment of
respiratory infection, in lung epithelial lining fluid and alveolar macro-
phages. Drug Metab Pharmacokinet 2009; 24: 411-7
158. Chono S, Tanino T, Seki T, et al. Efficient drug delivery to alveolar macro-
phages and lung epithelial lining fluid following pulmonary administration
of liposomal ciprofloxacin in rats with pneumonia and estimation of its
antibacterial effects. Drug Dev Ind Pharm 2008; 34: 1090-6
159. Chono S, SuzukiH,TogamiK, et al. Efficient drug delivery to lung epithelial lining
fluid by aerosolization of ciprofloxacin incorporated into PEGylated liposomes
for treatment of respiratory infections. Drug Dev Ind Pharm 2011; 37: 367-72
160. Chono S, Tanino T, Seki T, et al. Pharmacokinetic and pharmacodynamic
efficacy of intrapulmonary administration of ciprofloxacin for the treatment
of respiratory infections. Drug Metab Pharmacokinet 2007; 22: 88-95
Correspondence: Professor Keith A. Rodvold, University of Illinois at
Chicago, College of Pharmacy, m/c 886, 833 South Wood Street, Room
# 164, Chicago, IL 60612, USA.
E-mail: [email protected]
664 Rodvold et al.
ª 2011 Adis Data Information BV. All rights reserved. Clin Pharmacokinet 2011; 50 (10)