penetrability for cementitious injection grouts7510/fulltext01.pdf · licentiate thesis...
TRANSCRIPT

PENETRABILITY FOR CEMENTITIOUS INJECTION GROUTS
Daniel Eklund
Licentiate Thesis
Division of Soil and Rock Mechanics
Royal Institute of Technology
2003

Licentiate Thesis
PENETRABILITY FOR CEMENTITIOUS INJECTION GROUTS
Daniel Eklund
Stockholm 2003
Division of Soil and Rock Mechanics
Royal Institute of Technology
Stockholm, Sweden


i
Summary
Grouting as a method of strengthening and sealing rock, soil and concrete is widely spread. The possibilities of sealing structures are of great importance in both economical and environmental point of view. The costs of grouting have in certain projects been as high as the cost for the blasting and excavation of the tunnel. To improve the technique of grouting with cement based material, it is necessary to focus on the properties of the used grout mixture. The ability of a grout to penetrate cavities, channels and porous material, the penetrability, depends on two things, the rheology and the filtration stability. Extensive laboratory tests on stable, low w/c-ratio, injection grouts show that the most significant limitation to their penetrability is the tendency of cement grains to agglomerate into an impermeable filter cake. The ability of a grout to pass constrictions of the flow path without clogging can be designated filtration stability. An inert material is used for the investigations in this work. The inert material, which is crushed dolomite stone, does not react with the added water in the suspension.
Performed tests show that the grain size distribution is of great importance for the filtration phenomenon. According to performed experiments with inert material, it seems to be advantageous for the penetrability to have a grain size distribution not containing too much fine grains and not too much coarser grains. It reasonable to believe that the grain size distribution should be relatively steep (narrow grain size range) between minimum and maximum grain size. Correlations between different parameters have been studied in order to identify possible connections. No clear correlation between the filtration stability (FS) and measured values as for example grain size distribution or volumetric concentration of grains has so far been identified. The best correlation for filtration stability is found between the grain size distribution parameter d´ and filtration stability (FS). d´ [µm] is a grain size which corresponds to a amount of grains, normally about 50- 60 % of the total grain size content for grouting cements. d´ is an output parameter from the Rosin Rammler Sperling Bennet (RRSB) distribution. Plotting the RRSB grain distribution is a way of describing the distribution of different grain sizes in a mixture.

ii

iii
Preface This licentiate Thesis has been carried out in co-operation between the Department of Soil and Rock Mechanics at the Royal Institute of Technology (KTH) and Vattenfall Utveckling. The work has been generously financed by SveBeFo, Elforsk, SKB and Cementa. The research presented in this thesis was initiated by Professor Jan Alemo, Vattenfall Utveckling. The supervisors for this work have been Professor Håkan Stille, KTH and Jan Alemo, to whom I want to express my appreciation and gratitude for their encouragement, advice and belief in me. The reference group of the project consists of Lars Hammar, Elforsk, Tomas Franzén, SveBeFo, Magnus Eriksson, KTH, Gunnar Gustavsson, CTH, Stig Pettersson, SKB, Ann Emmelin, SKB, Anders Bodén, SwedPower, Sten-Åke Pettersson, Atlas Copco, Staffan Hjertström, Cementa, Tommy Ellison, BESAB. Their participation is gratefully acknowledged. Many people have been connected to this work during the past two years. Special thanks to: • Professor Jan Alemo for all the help and support during these years.
• MSc Pär Hansson, Ericsson Radio Access. Pär Hansson started this research work of filtration stability for cementitious injection grouts, in the early 1990. He finished his employment at Vattenfall in the year of 2000 and handed over an excellent platform for further research within this subject field.
• The laboratory staff Sven Isaksson and Kjell Fransson at Vattenfall Utveckling for the performance of laboratory testing.
• Anders Birgersson at Scancem Research in Slite for sieving dolomite powder.
• Erik Viggh at Cementa AB for supporting in cement chemistry.
• The colleagues at Vattenfall Utveckling for a pleasant work environment.
Finally, I would like to thank my family for great support during this work.

iv

v
Table of Contents Page
1 INTRODUCTION VII
1.1 Background 1 1.2 Objective 3 1.3 Hypothesis 4 1.4 Limitations 5 1.5 Disposition of the thesis 5
2 PENETRABILITY 7
2.1 General 7 2.2 Filtration stability 7 2.3 Concentration and packing of grains 8
2.3.1 Theory of plug formation 11 2.4 Rheology 14
2.4.1 Crack width dependent rheology 16 2.4.2 Filter pump and other measuring devices 18
3 PERFORMED FILTRATION EXPERIMENTS 21
3.1 Inert material 21 3.1.1 Air sieving 22
3.2 Measuring device for filtration stability. 23 Filter geometry 25
3.3 Scanning electron microscopy (SEM) 26 3.4 Characterisation of grain curves 26
3.4.1 Rosin-Rammler-Sperling-Bennet (RRSB) distribution 26 3.5 Rheological measurement system 28 3.6 Bleeding measurement standard 28 3.7 Correlation between measuring properties and results 28
4 RESULTS OF FILTRATION EXPERIMENTS 31
4.1 General 31 4.2 Influence of grain size distribution and grain size 32
4.2.1 Conclusions 35 4.3 Influence of concentration 36
4.3.1 Conclusions 38 4.4 Influence of crack aperture 39
4.4.1 Conclusions 41 4.5 Correlation of measured values 42
4.5.1 Conclusions 45

vi
4.6 Comprehensive conclusions 46 4.6.1 Grain size distribution and grain size 46 4.6.2 Concentration 47 4.6.3 Crack aperture 47 4.6.4 Correlation of measurements 47
5 DISCUSSION OF CEMENT BASED MATERIAL 49
5.1 Cement chemistry and early cement reactions 49 5.2 Superplasticizer and Surface chemistry 51
5.2.1 DLVO- theory 52 5.3 Pore water 53 5.4 Conclusions 54
6 INTRODUCTORY INVESTIGATION OF CEMENTITIOUS GROUTING MATERIAL 55
6.1 Conclusions 57
7 CONCLUSIONS AND PROPOSAL TO CONTINUED RESEARCH 59
7.1 Compilation of grouting research 59 7.2 Simulation of plug formation 59 7.3 Improvement of grouting cement 59 7.4 Mixer design 60 7.5 Development of test equipment for field use 60 7.6 Field tests 60
8. REFERENCES 61

vii
Nomenclature F Force between grains [N] FS Filtration stability [%] L Length between obstacles [m] KOV (x,y) Covariance of matrix x and y [-] R2 Deviation according to the least square method [-] T External force on the arch [N] W/ C Water/ Cement ratio [-] W/ S Water/ Solid ratio [-] a Grain surface distance [µm] d Grain diameter [µm] d´ Parameter in the RRSB- distribution [µm] h Slot width [µm] hcr Critical slot width [µm] kdµ Factor for the viscosity dependency of the slot width [m] kdτ Factor for the yield values dependency of the slot width [Pa*m] α Slope of a regular arch formation [rad] β Slope angel of plug formation [rad.] δxy Coefficient of correlation [-] φ Volumetric concentration [%] γ Arch angel of plug formation [rad.]
.γ Shear rate [1/s] µ Viscosity [Pas] µ∞ Viscosity at indefinite slot width [Pas] ρc Compact density [kg/m3] ρs Density of suspension [kg/m3] ρw Density of water [kg/m3] σx Standard deviation of matrix x [-] σy Standard deviation of matrix y [-] τ Yield value [Pa] τ∞ Yield value at indefinite slot width [Pa]

viii

1
1 Introduction
1.1 Background
This licentiate thesis is a part of a project that started in the beginning of the year 2001 and is planned to be finished in the end of the year 2004. The work presented in this thesis is a result of the first two years of research. Grouting as a method of strengthening and sealing rock and concrete is widely spread. A historical review of the grouting technology on an international level has been made by A.C Houlsby, 1990. Generally, holes are drilled into the structure of rock/concrete mass in order to make the cracks or leached channels accessible to pump a fluid grout into the same. Possibilities of sealing structures are of great importance in both economical and environmental point of view. For example, the demands of closeness on a rock structure affect both the functions as achieving a dry tunnel and the influence on the surrounding environment (Palmqvist K, 1983). Settlement of the surrounding ground surface around a tunnel, caused by insufficient sealing of the tunnel is a problem caused by an insufficient grouting operation. Knowledge about the grouting technique and grouting material is to a high extent founded on empirical relations and improvisation. Penetrability is a summarised term for the grout ability to penetrate crack apertures, cracks and channels. The limiting factor can be rheology if the grout is characterised as a homogeneous fluid or plug formation when the grains stick together. Influence of drilling method and cleaning of the drillhole is of great importance for the penetrability. Concerning the drilling method (hammer drill) it is likely to believe that the design of the drillhead and drilling rod influence the shape of the crossing between drillhole and crack. The texture of the drill cuttings is also a possible critical parameter to avoid initialisation of plug formation at the crack entrance. Regarding the texture of the drill cuttings, cleaning of the drillhole and cracks is of importance for the result. Cleaning the drillhole with a water jet or similar device has in certain grouting project been a determining factor for penetrability. Description of grouting equipment and grouting procedures can be found in Pettersson S Å (1999). There exists no model that describes the penetrability of the grout, which makes the composition of the grout mixture difficult. Work has been done by Eriksson M, (2002) to develop a model for prediction of grout spread and sealing effect. Even lack of accurate testing methods is a consequence of the lack of fundamental understanding of the performance of the grouting material. One of the major difficulties when measuring the grout properties is that the properties are changing with time.

2
The crack system and crack apertures are often relatively unknown (Fransson Å, 2001). Above all these uncertainties is the fact that it is difficult to evaluate the grouting result and attempts are seldom performed. Several demands have to be fulfilled for a good grouting result. The demands can be divided into two groups, first the demands of the grouting operation (short run) and second the long term demands (long run). The short run demands are for example to avoid hydraulic cracking, rewind pressure and to avoid washout of the grout in the borehole. It is here necessary to control the setting time of the grout and the design of the packers. In the long run one has to secure the sealing effect when the construction has been taken into use. To achieve a resistant grouting result one has to know the grouts bleeding during setting, hardening time and even its solubility in the surrounding water environment (chemical stability). Of course, also the penetrability of small cracks is of certain interest to achieve a resistant grouting result. More about performance and demands of grouting can be read in Nonveiller E (1989). To fulfil the demands of more water tight tunnels with demands of limited ingress of water in urban areas of 1-4 l/ min/ 100 m tunnel, cracks with an aperture of approximately 50 µm has to be sealed against ingress of water. Experiences from several tunnelling projects are that one can reduce the inflow of water to approximately 10-7 m/s with the first pregrouting operation. It is then only possible to reduce the permeability to approximately 0,3*10-7 m/s with normally existing regrouting technique (Stille H, 2001). The conclusion is clear, one has to via pregrouting seal the whole tunnel in order to keep the costs at an acceptable level. The costs of grouting have in certain projects been as high as the cost for the blasting and excavation of the tunnel. To improve the technique of pregrouting with cement based material it is necessary to focus on the properties of the used grout mixture. Other types of structures, which are a subject for grouting, are hydropower structures. Hydropower structures are often subjected to internal damage that can impair both structural integrity and water tightness. The most common types of damage are cracks due to thermal movement shortly after pouring and porous areas due to leaching, the latter often caused by the former or by pervious concrete. Injection grouting is often an economically advantageous method to repair this kind of damage. Grouting is in this case a method for rejuvenation of the concrete structure (VAST, 1991). The grouting material can be based on solutions of e.g. alkali-silicate-hydrate, epoxy or polyurethane or it can consist of cement and other mineral binders. This classification is rough concerning the chemical grouts which only common denominator is that they are all solutions. On the contrary the cementitious ones are suspensions of particles in water. Each category of grouts has its advantages and disadvantages. The main advantages of cementitious injection grouts are their low cost, compatibility with the environment and predictable durability.

3
Other benefits are the environmental friendliness and that they can be handled without special safety equipment for the workers. The disadvantages, compared to the solution grouts, are the limited penetration ability. To obtain a durable and high strength hardened cementitious grout it is necessary that the grout is stable in terms of bleeding and sedimentation. Sedimentation and bleeding can cause incomplete filling of the crack volume, which creates paths for leach through to grouted crack. Furthermore, the w/c-ratio has to be kept as low as possible to avoid a hardened cement paste with an extensive pore system. A hardened cement paste with an originally low w/c-ratio has few capillary pores in connection to each other. Few connected pores make the paste more insensitive to leach of binder material in the paste. Regarding crack injection, it is said that it is possible to grout a crack when its width exceeds three times the maximum particle size of the cement (A.M Crawford, 1984). A similar rule of a thumb for soil grouting is that the soil can be grouted if the quotient of the soil's grain size at 15 percent passing to the cement's grain size at 85 percent passing (D15/d85) is more than 20 to 25 (Mitchell J, 1970). A summarise of different authors views of a groutable crack aperture can be found in Brantberger et al, 1998. None of these established rules-of-thumb concerning the filtration effect is applicable to predict penetration ability for grouts with low w/c-ratio. These kind of thumb rules are probably more valid for older types of grout mixes with high W/C ratio and no superplasticizer agent added. These older types of grouting cements were generally also containing a coarser grain size distribution then what is used today. Laboratory work at Vattenfall Utveckling AB has showed that a quotient between groutable crack width and maximum grain diameter is about 10, for modern types of micro cements with a grain diameter <30 µm. (Alemo J, Hansson P 1997). Extensive laboratory tests at Vattenfall Utveckling AB on stable, low w/c-ratio, injection grouts show that the most significant limitation to their penetrability is the tendency of cement grains to agglomerate into an impermeable filter cake. Grout refusal due to inappropriate rheology, can often be avoided by using superplasticizer. (Hansson P, Eklund D, 2001)
1.2 Objective
The main target with this project is to improve the knowledge about how to compose grout mixtures to fulfil the demands of penetrability and durability. Relevant parameters that describe the function of the grout will be identified and methods of measuring them will be developed. An important work to achieve this is to describe and characterise the different components in the grout, like binder agent, additives and added material. The interactions between these are essential to outline. To improve the penetrability of cementitious grouts, even the mixer design has to be developed. In the end of this project, mixer design will also be studied. Parameters like the rate of dispersion of the grout will be analysed in order to investigate the mixing efficiency.

4
Alt. 1 Alt. 2
The work here presented, is a first part of the project, which focuses on the influence of the physical properties of the grout like the grain size distribution, maximum and minimum grain sizes and grain concentration. The purpose of the work is to find essential correlation’s between these physical parameters and the penetrability of the tested suspension (Eklund D, 2001).
1.3 Hypothesis
The ability of a grout to penetrate cavities, channels and porous material, the penetrability, depends on two things, the rheology and the filtration stability. The ability of a grout to pass constrictions of the flow path without clogging has been designated filtration stability (FS), see figure 1.1.
Figure 1.1. Arches and agglomerates are formed at the entrances of cracks (Alt.
1) and at changes of crack width (Alt. 2), which obstruct further penetration of the grout. Hansson P. (1994).
The hypothesis of this thesis is that the filtration stability of a grout is not solely governed by the maximum particle size of the cement, neither by a single point of the particle size distribution curve. The maximum grain size of the cement (d100), d95 or d85, is not as influential on the penetrability as it was considered earlier. The appearance of the entire grain size distribution curve contributes to the behaviour of the grout as well as pore water chemistry, physiochemical aspects and practical issues such as mixing efficiency. Filtration stability becomes the property that dominates the penetration ability of the grout when the aperture width is in the range of 0.3 mm or less, according to performed tests at Vattenfall Utveckling (Hansson P, 1996).

5
1.4 Limitations
An inert material is used for the investigations in this work. Inert material is used in order to eliminate the time dependent and chemical changes in ordinary cement based grout mixture. The inert material, which is crushed dolomite stone, does not react with the added water in the suspension. This work also mainly includes suspensions with a limited maximum bleeding of approximately 5-10 %. The grouted mediums that are considered are cracks in hard rock and concrete structures.
1.5 Disposition of the thesis
In order to get an overview of the structure of this thesis, a short description of each chapters content is given below. Chapter 2 contains a fundamental description of the mechanisms and parameters, which obstruct grout penetration of crack volumes. Attempts to develop theoretical models for filtration stability has been made. Chapter 3 is a description of the performed experiments. Used material, test equipment and test methods are described in detail. A concept to quantify filtration stability has been developed. Chapter 4, results of the performed experiments are presented. Tables and figures of the measuring results are listed. Conclusions are drawn and summarised from the tests. Chapter 5 introduces cementitious grout. Three main areas are identified as being of certain interest when studying their penetrability. The areas are cement chemistry and early cement reactions, the influence of superplasticizers and surface chemistry and finally pore water chemistry. Chapter 6 is describing some introductory tests with cement based grouting materials. Test results with grouting cements like Injektering 30 and Ultrafint cement 12 are compared to the test results with inert material. Chapter 7 deals with a proposal to further research based on the conclusions made in chapter 4. Five different fields for further research are identified.

6

7
2 Penetrability
2.1 General
A method of assessing the penetrability of a grout by measuring the filtration stability has been developed in this project. The testing is performed on fresh mixed grout and properties as cement quality, admixtures and mixing efficiency that affect the penetrability are considered. Filtration tests give a more reliable prediction of the penetrability than traditional rheological measurements. Exactly which the properties are that influence the penetrability, and the magnitude of the influence, are still not entirely understood.
2.2 Filtration stability
When dealing with stable grouts there are commonly two approaches, the old- and the new one. The old one says that you should first grout with a thin and unstable suspension. The unstable grout will then be dewatered and create a stable plug in the crack. The new one recommends a stable suspension from the beginning. The approach of dewatering the grout to create a sealing plug is not acceptable, because one can not control where the plug is formed. If the sealing effect is dependent on a tight plug and the rest of the crack volume is filled badly, small movements in the structure can cause seepage through the plug. This old approach is in some sense a paradox because thin grouts are more difficult to dewater than stable ones. This has been showed in several studies (Hansson, P 1995), (Eriksson, M 2002). When grouting fine cracks or channels one has to take into account the fact that cement grouts contain solid particles. The cement particles can clog channels of roughly ten times the particles maximum size although the particles initially are well dispersed by an effective mixer. Since many parameters influence the filtration stability and since their influence is not yet fully investigated, FS is in this study measured on the fresh mixed grout.
8
ratioCement Water / waterDensity,
cement density,Compactcement ion,concentrat olumetric
:där
/1
1
===
=
⋅+
=
CWwc
V
w
CWc
ρρφ
ρρφ
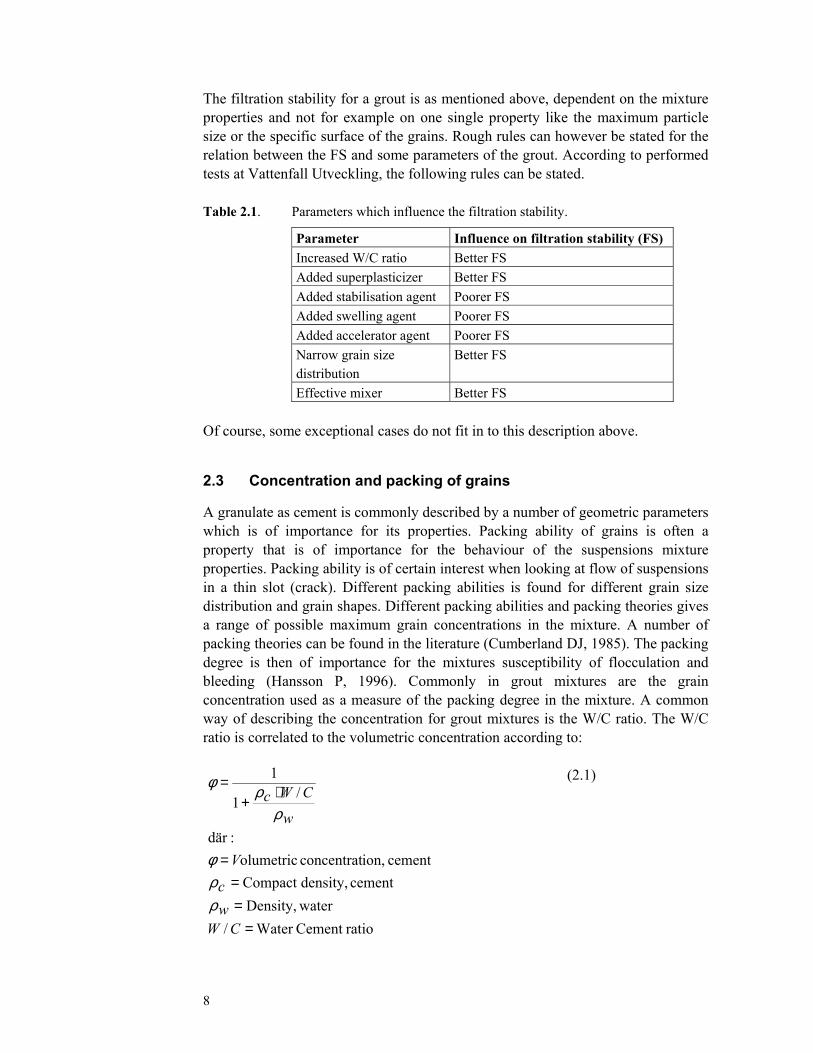
The filtration stability for a grout is as mentioned above, dependent on the mixture properties and not for example on one single property like the maximum particle size or the specific surface of the grains. Rough rules can however be stated for the relation between the FS and some parameters of the grout. According to performed tests at Vattenfall Utveckling, the following rules can be stated. Table 2.1. Parameters which influence the filtration stability.
Parameter Influence on filtration stability (FS) Increased W/C ratio Better FS Added superplasticizer Better FS Added stabilisation agent Poorer FS Added swelling agent Poorer FS Added accelerator agent Poorer FS Narrow grain size distribution
Better FS
Effective mixer Better FS Of course, some exceptional cases do not fit in to this description above.
2.3 Concentration and packing of grains
A granulate as cement is commonly described by a number of geometric parameters which is of importance for its properties. Packing ability of grains is often a property that is of importance for the behaviour of the suspensions mixture properties. Packing ability is of certain interest when looking at flow of suspensions in a thin slot (crack). Different packing abilities is found for different grain size distribution and grain shapes. Different packing abilities and packing theories gives a range of possible maximum grain concentrations in the mixture. A number of packing theories can be found in the literature (Cumberland DJ, 1985). The packing degree is then of importance for the mixtures susceptibility of flocculation and bleeding (Hansson P, 1996). Commonly in grout mixtures are the grain concentration used as a measure of the packing degree in the mixture. A common way of describing the concentration for grout mixtures is the W/C ratio. The W/C ratio is correlated to the volumetric concentration according to:
(2.1)

9
[-] ion,concentrat Volumetricm diameter, Particle
m distance, surface Particle
1323
===
−
⋅⋅⋅=
φ
φπ
µdµa
da
A typical value for grain concentration in cement based grout suspensions is W/C 0,7, which corresponds to a volumetric concentration of 33 %. This is a high concentrated suspension. Most industrially used suspensions have as a maximum grain concentration of approximately 5 % (pulp slurry, mineral slurry etc) (Lohmander S, 2000). The susceptibility for the suspension to flocculate is also dependent of the surface distances (free distance) between the grains. The surface distance is both influenced by the characteristic diameter of the grain and volumetric concentration of grains. According to the FCC- model (Face Centered Cube) for packing of mono sized spheres, is the surface distance between adjacent spheres given by:
(2.2)
This model gives the maximum volumetric concentration of 74 % (when a=0), which corresponds to a W/C ratio of 0,11. A way of illustrating the difference in surface distances with changed grain diameter is to plot the surface distance versus grain diameter.
Figure 2.3. Correlation between surface distance and particle diameter.
0
5
10
15
20
0 5 10 15 20 25
Grain diameter [µm]
Surf
ace
dist
ance
[µm
]
0,500,701,001,52
W/C ratio
10
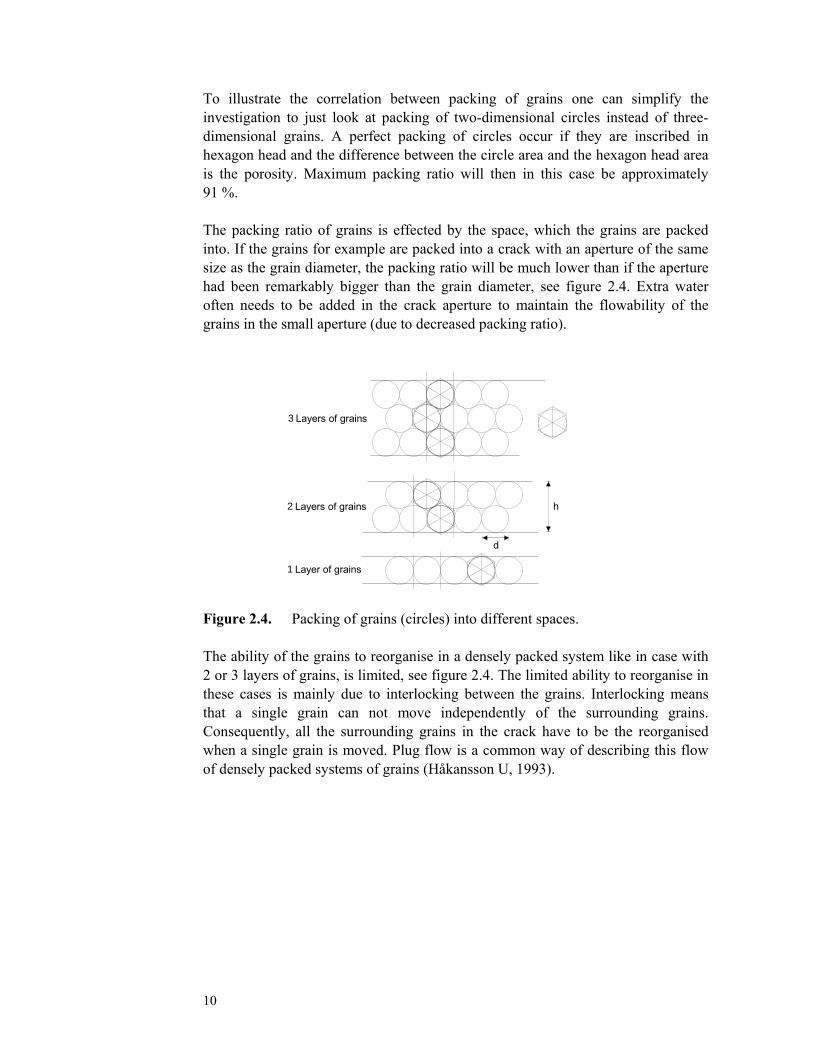
To illustrate the correlation between packing of grains one can simplify the investigation to just look at packing of two-dimensional circles instead of three- dimensional grains. A perfect packing of circles occur if they are inscribed in hexagon head and the difference between the circle area and the hexagon head area is the porosity. Maximum packing ratio will then in this case be approximately 91 %. The packing ratio of grains is effected by the space, which the grains are packed into. If the grains for example are packed into a crack with an aperture of the same size as the grain diameter, the packing ratio will be much lower than if the aperture had been remarkably bigger than the grain diameter, see figure 2.4. Extra water often needs to be added in the crack aperture to maintain the flowability of the grains in the small aperture (due to decreased packing ratio).
Figure 2.4. Packing of grains (circles) into different spaces. The ability of the grains to reorganise in a densely packed system like in case with 2 or 3 layers of grains, is limited, see figure 2.4. The limited ability to reorganise in these cases is mainly due to interlocking between the grains. Interlocking means that a single grain can not move independently of the surrounding grains. Consequently, all the surrounding grains in the crack have to be the reorganised when a single grain is moved. Plug flow is a common way of describing this flow of densely packed systems of grains (Håkansson U, 1993).
3 Layers of grains
2 Layers of grains
1 Layer of grains
h
d
11
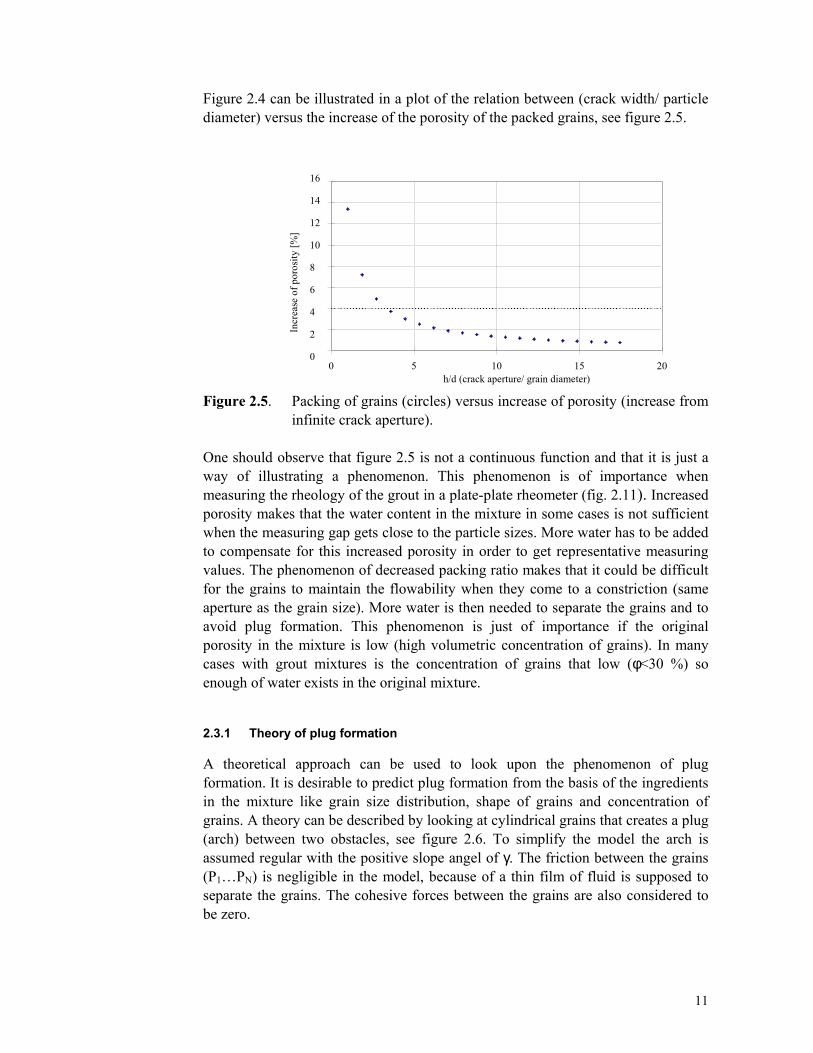
Figure 2.4 can be illustrated in a plot of the relation between (crack width/ particle diameter) versus the increase of the porosity of the packed grains, see figure 2.5.
Figure 2.5. Packing of grains (circles) versus increase of porosity (increase from infinite crack aperture).
One should observe that figure 2.5 is not a continuous function and that it is just a way of illustrating a phenomenon. This phenomenon is of importance when measuring the rheology of the grout in a plate-plate rheometer (fig. 2.11). Increased porosity makes that the water content in the mixture in some cases is not sufficient when the measuring gap gets close to the particle sizes. More water has to be added to compensate for this increased porosity in order to get representative measuring values. The phenomenon of decreased packing ratio makes that it could be difficult for the grains to maintain the flowability when they come to a constriction (same aperture as the grain size). More water is then needed to separate the grains and to avoid plug formation. This phenomenon is just of importance if the original porosity in the mixture is low (high volumetric concentration of grains). In many cases with grout mixtures is the concentration of grains that low (φ<30 %) so enough of water exists in the original mixture.
2.3.1 Theory of plug formation
A theoretical approach can be used to look upon the phenomenon of plug formation. It is desirable to predict plug formation from the basis of the ingredients in the mixture like grain size distribution, shape of grains and concentration of grains. A theory can be described by looking at cylindrical grains that creates a plug (arch) between two obstacles, see figure 2.6. To simplify the model the arch is assumed regular with the positive slope angel of γ. The friction between the grains (P1…PN) is negligible in the model, because of a thin film of fluid is supposed to separate the grains. The cohesive forces between the grains are also considered to be zero.
0
2
4
6
8
10
12
14
16
0 5 10 15 20 h/d (crack aperture/ grain diameter)
Incr
ease
of p
oros
ity [%
]

12
0
5
10
15
20
0 0,2 0,4 0,6 0,8 1 1,2
γ
F/T
∑
∑−
=
−
=
=−+
=−+
1
11
1
11
0))1(cos(
))1(sin(
N
i
N
i p
i
dLi
γβ
γβ
The only forces that acts on the grains is the stress F, due to the external strain T. The obstacle C1 is cylindrical. The arch is assumed to be stable if the condition β1≥γ is fulfilled (stable if β1-β0 ≥ 0 is true, because β1-β0= γ). The length between the obstacles can be assumed L and the diameter of the grain is dp. A simple equation can be set for the formation of a stable arch (Martinet, P 1998).
(2.3)
Figure 2.6. Regular arches in contact with cylindrical obstacle (P Martinet, 1998).
A more flattened arch is associated to decreasing forces F between the grains. Smaller forces F mean that the arch is more sensible for movements of individual grains within the arch. Small movements of grains can then cause collapse of the arch (plug). The relation of the F/T can be written as: (2.4)
Figure 2.7. Relation between interparticular force F and external force T.
=
2sin*2 λ
TF
Stable β1≥ γ Unstable β1< γ

13
∑
∑
=
=
−++=
−+++=
n
i
n
i
idL
idL
...7,5,3
..6,4,2
))1(sin(2sin
))2(sin(2sin1
βαα
βαα
20;
2παβπα ppn−=
A similar way of describing arch formation is to look at the relation between the number of grains (n) with diameter d and the distance L between two obstacles.
Figure 2.8. Regular arch of cylindrical grains between two obstacles. The relation L/d can be written by the equations:
(2.5)
(2.6)
(2.7)
Equation 2.5 is valid for even numbers of grains and 2.6 is valid for odd numbers. The solution of equation 2.5 and 2.6 describes the number of grains that is necessary for a stable arch. The solution can be plotted as:
Figure 2.9. Number of grains in a stable arch between two obstacles spaced with
the distance L.
α
β
L
d
0
2
4
6
8
0 2 4 6L/d
Num
ber o
f gra
ins
in a
rch
n=1n=2n=3n=4n=5n=6
14
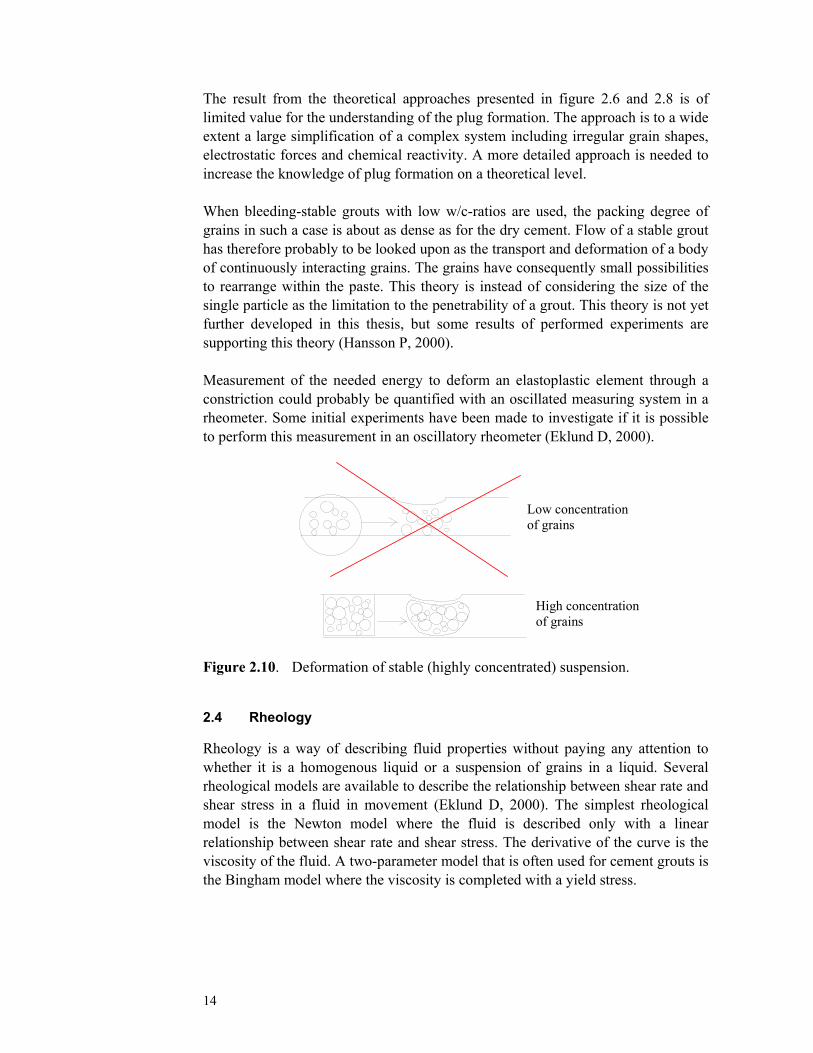
The result from the theoretical approaches presented in figure 2.6 and 2.8 is of limited value for the understanding of the plug formation. The approach is to a wide extent a large simplification of a complex system including irregular grain shapes, electrostatic forces and chemical reactivity. A more detailed approach is needed to increase the knowledge of plug formation on a theoretical level. When bleeding-stable grouts with low w/c-ratios are used, the packing degree of grains in such a case is about as dense as for the dry cement. Flow of a stable grout has therefore probably to be looked upon as the transport and deformation of a body of continuously interacting grains. The grains have consequently small possibilities to rearrange within the paste. This theory is instead of considering the size of the single particle as the limitation to the penetrability of a grout. This theory is not yet further developed in this thesis, but some results of performed experiments are supporting this theory (Hansson P, 2000). Measurement of the needed energy to deform an elastoplastic element through a constriction could probably be quantified with an oscillated measuring system in a rheometer. Some initial experiments have been made to investigate if it is possible to perform this measurement in an oscillatory rheometer (Eklund D, 2000).
Figure 2.10. Deformation of stable (highly concentrated) suspension.
2.4 Rheology
Rheology is a way of describing fluid properties without paying any attention to whether it is a homogenous liquid or a suspension of grains in a liquid. Several rheological models are available to describe the relationship between shear rate and shear stress in a fluid in movement (Eklund D, 2000). The simplest rheological model is the Newton model where the fluid is described only with a linear relationship between shear rate and shear stress. The derivative of the curve is the viscosity of the fluid. A two-parameter model that is often used for cement grouts is the Bingham model where the viscosity is completed with a yield stress.
Low concentrationof grains
High concentrationof grains

15
The yield stress is a shear strength that has to be exceeded before the fluid begins to flow (the ketchup effect). The Bingham model can be refined with a parameter describing a non-linear viscosity relationship, which gives us the Herschel-Bulkley model (Mork, J H, 1994).The Herschel-Bulkley model also covers the two other models. The Newton model applies for very thin grouts with high water content and/or high dosage of superplasticisers where the yield value often can be neglected. For slightly thicker mixes the Bingham model can be used. Grouts with high grain concentrations can be described by the Herschel-Bulkley model since the shear thinning behaviour begins to be more pronounced with higher grain concentration (Schwarz L G, 1997). The parameter in the Bingham and the Herschel-Bulkley models that determines the potential penetration of a grout is the yield value. At a certain penetration length the yield value will balance the grouting pressure at which the flow will stop. The viscosity determines the rate of penetration. The validity of the yield value as a determinant of penetrability is limited to quite open channels without sharp obstructions in the flow path. Down to a channel width of about 0.5 mm one can regard the yield value as a valid penetrability determinant (Q.D Nguyen, 1986). Non Newtonian suspensions have been subject for several different industrial applications. Many authors have also discussed the importance of the right grout rheology like Håkansson, U (1993), Hässler, L (1991) and Eriksson, M (2002). Some special difficulties concerning rheology measurements of cementitious grout has to be made. Håkansson (1993) stated some important parameters for good grout rheology: • The rheology of a grout mixture is strongly influenced by chemically dependent
factors during hydration of the cement. • Cementitious grout has a thixotropic behaviour when measuring in short cycle
times. • The shape and concentration of the suspended grains is of importance. • The fluid property of the medium that surrounds the grains is essential to
prevent flocculation of grains.
Figure 2.11. Rheological behaviour. 1) Newtonian fluid, 2) Bingham fluid.
(De Paoli et al 1992).

16
rateShearp
valueYield
valueYieldp
slot width "indefinite"y when viscousitPlastic
slot width "indefinite" when 0
0
=
=∞
=∞
=
⋅∞+∞=
γ
µττ
γµττ
&
&
2.4.1 Crack width dependent rheology
The available today’s models for prediction of flow of suspension, like the Bingham- or Herschel- Bulkley model, are not taking into account that the flow resistance is increasing when the crack aperture is close to the grains diameter. The Bingham model is valid for flow of suspension in cracks with an aperture of approximately 5 to 10 times the maximum grain size (Mezger T, 2000). An effort has been made (Hansson, P 1997) to modify the Bingham model to even be valid for prediction of flow in cracks, with an aperture in the same region as the maximum grain diameter. The Bingham model is written as:
(2.8)
The modified Bingham model aim to introduce size dependent factors in the model. The size dependency aim to take into account that the yield value approaches infinity when the slot width approaches a critical value. The fact that the yield value approaches infinity when the measuring gap approaches the maximum grain diameter introduced the thought of an inverse function as the modified Bingham model. The measuring device that was used to measure the yield value of the suspension was a rotating plate-plate rheometer, see figure 2.12.
Figure 2.12. The plate-plate measuring system, h is the measuring gap and R is
the radius of the probe.
17
[m]widthslottheofdependencysviscousitytheFactor dµk
m][Paslot width theof dependency valuesyield for the Factor dτk[m]value)(asyptotewidthslitCritical crh
[m]width Sloth :Där
pµcrh
dµk10τcrh
dτkτ
=
⋅==
=
⋅∞⋅
−++∞+
−= γ&
hh
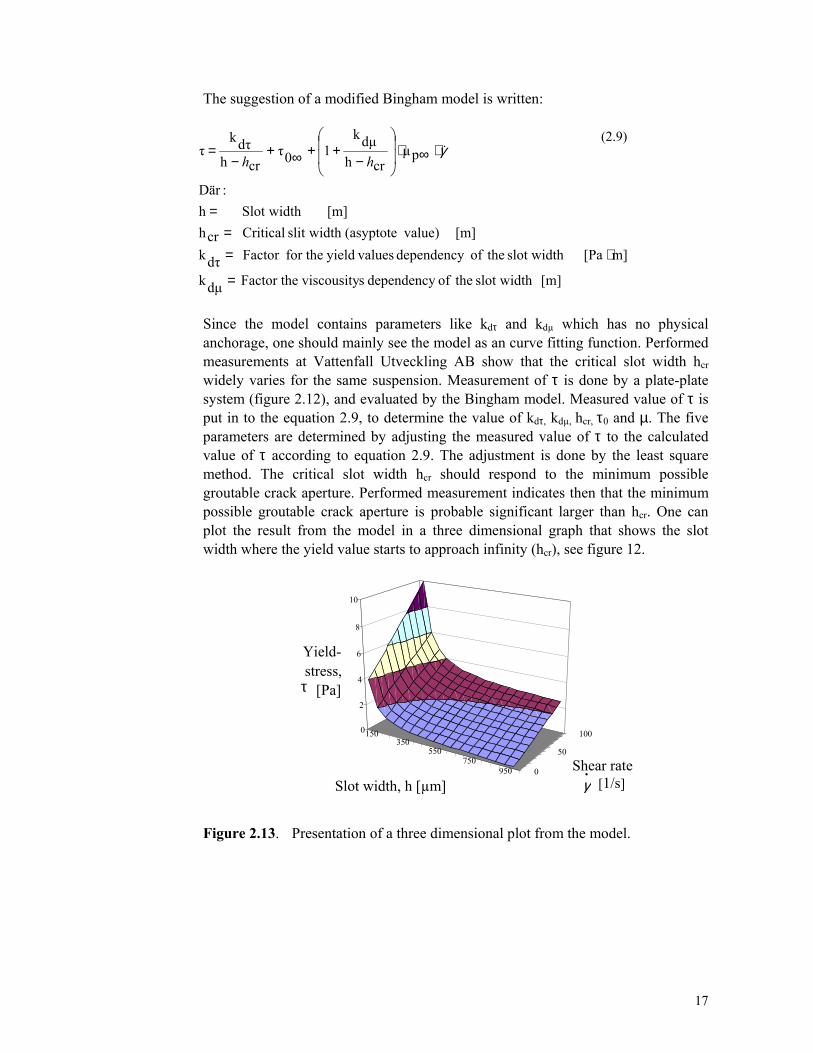
The suggestion of a modified Bingham model is written:
(2.9)
Since the model contains parameters like kdτ and kdµ which has no physical anchorage, one should mainly see the model as an curve fitting function. Performed measurements at Vattenfall Utveckling AB show that the critical slot width hcr widely varies for the same suspension. Measurement of τ is done by a plate-plate system (figure 2.12), and evaluated by the Bingham model. Measured value of τ is put in to the equation 2.9, to determine the value of kdτ, kdµ, hcr, τ0 and µ. The five parameters are determined by adjusting the measured value of τ to the calculated value of τ according to equation 2.9. The adjustment is done by the least square method. The critical slot width hcr should respond to the minimum possible groutable crack aperture. Performed measurement indicates then that the minimum possible groutable crack aperture is probable significant larger than hcr. One can plot the result from the model in a three dimensional graph that shows the slot width where the yield value starts to approach infinity (hcr), see figure 12.
Figure 2.13. Presentation of a three dimensional plot from the model.
150350
550750
950 0
50
1000
2
4
6
8
10
Shear rate[1/s]
•γ
Yield-stress,
[Pa] τ
Slot width, h [µm]

18
Performed correlation’s between filtration measurements (filter pump) and the calculated parameter hcr, from the model, show no great correlation (Eklund D, 2000 b). The reasons to the bad correlation can be of different kinds. First, the measurement set up (plate-plate system) can cause problems with not reproducible measurements of yield values. A problem that can occur during this kind of measurements is bleeding of the mixture. Bleeding in the measurement cause that a thin layer of water is created on top of the mixture’s volume between the two plates. The water film causes that a not representable and irreproducible value of τ is measured. Second, the parameter that governs plug formation is not measurable/ significant in the rheology measurement. The model can maybe serve as an evaluation tool for characterisation of a suspension with good or bad filtration stability. The work had so far mainly been focused on to find key parameters that have the greatest influence on the formation of plugs.
2.4.2 Filter pump and other measuring devices
Since it is desirable to be able to check the quality of the grout on site, Vattenfall Utveckling AB have developed test equipment (VU-SC: 27) suitable for measuring filtration stability both in laboratory and on site. An outline of the equipment can be found in figure 2.14.
Figure 2.14. Measuring device for Filtration stability. The grout is drawn into the device by pulling the handle to full stroke during five seconds. The device is kept immersed in the grout for ten seconds. The grout is then pressed out into a measuring vessel. The amount of grout that was able to pass the sieve is measured and used as a relative measure of filtration stability. This measurement gives a fair assessment of the grouts penetrability. This is a far more informative measurement than the Marsh-cone viscosity, which does not say anything about the penetrability.
Stroke = 583 mm
Ø = 25.6 mm
Woven metal wire cloth Stop nut
20 mm
Handle
Rubber pistonMetal tubePiston rod
Detachable end caps

19
It is of great importance that one pull up the grout in the pump with a representable pressure gradient through the filter. The pressure gradient over the filter in the pump can never exceed the atmospheric pressure (0,1 MPa). This is important of two reasons, first to avoid cavitation or release of air in the mixture, second to avoid pressing a plug through the filter. Although the absolute grouting pressure is much higher than 0,1 MPa, is probably the pressure gradient when the dewatering process starts, in the region of this pressure. It is probably unlikely to believe that a plug formation would be pressed through a constriction in a real grouting case (Hansson 1995). The filter pump has been compared with other devices like the NES apparatus for measurements of filtration stability (Brantberger & Nelsson, 1998). In Eriksson, M (1999) it was stated that no difference could be noticed between the filter pump and the NES apparatus. Sand column test is another method, primarily a test method for grouts aimed for porous medium. Dalmalm, T (2001) found that it was a difference in the passed amount of mixtures between this sand column test and the other two methods. Other device that has been used for measuring filtration stability is a pressure chamber that contains a volume of grout suspension. The suspension is pressed through a filter with a specific aperture. The filtercake can then be saved and different filter widths can be tested (Eriksson, M 2002, Eklund, D 2001). Due to that, no major differences can be identified between the NES apparatus, pressure chamber and filterpump, the pressure chamber has been chosen in this thesis. The measuring device (pressure chamber) is further discussed in chapter 3.2.

20

21
3 Performed filtration experiments
3.1 Inert material
The geometrical properties (maximum and minimum grain size, grain size distribution, grain shape and W/C ratio) which influence the penetrability are investigated by the use of inert grains. The reason of using inert grains is to avoid influences from chemical reactions and time dependent properties of cement. The inert material that is used is crushed dolomite stone, in the fraction of 0- 30 µm. The trading name of the powder is Myanit. Dolomite is a mineral of mainly Calcium, Magnesium and Carbonate with the formula CaMg(CO3)2. It has a grain density of 2850 kg/m3 and a pH value of approximately 9,5- 10,5. The influence from the particle size distribution is investigated by mixing three different fraction intervals of the powder, into a number of new mixes with different grain size distributions, see figure 3.1. The original fraction intervals are Mix 1, 2 and 3. The fraction mixes are then mixed with different amount of water before penetrability analyse.
Figure 3.1. Grain size distribution curves for different mixtures.
Table 4.1. Characteristic data for used mixtures, see also figure 3.1.
The meaning of d´ is further discussed in section 3.4.
0,0
10,0
20,0
30,0
40,0
50,0
60,0
70,0
80,0
90,0
100,0
0,1 1 10 100
Sieve with [µm]
Pass
ed a
mou
nt [%
]
Fine, Mix 1
Middle, Mix 2
Coarse, Mix 3
Mix 4
Mix 5
Mix 6
Mixture d95 d10 d´ Std. dev1 4,7 0,6 2,0 36,32 10,2 0,9 5,2 39,23 11,7 3,5 10,6 37,24 9,7 1,2 10,0 36,85 11,2 0,7 3,7 34,86 11,4 0,8 7,0 36,5

22
3.1.1 Air sieving
Sieving the raw material (dolomite powder) produces the powder mixtures 1, 2 and 3. The basic idea of sieving the material was to divide the raw material into four different groups, dependent of their minimum and maximum grain size. The grain size limits were set to 0-2, 2-5, 5-10 and 10-30 µm. It is desirable to get as sharp fraction intervals as possible when to investigate the influence of the grain size distribution. Due to some problems with splitting the grains into different fraction intervals, the results can be seen in figure 3.1 (mix 1, 2 and 3). 95 % of the grain sizes in mix 1 are between 0-5 µm, mix 2 is a middle fraction containing 40 % of grain sizes between 5-10 µm and mix 3 is a coarser fraction with 80 % of the grains between 10-30 µm. The air stream separator that was used is Alpine 100 MZR. The problem with incomplete splitting of grains can both be explained by the sieving technology and the combination of sieved material and the material in the sieving device. Air stream separation is associated with that one has to calibrate the device so one theoretically would get a powder with narrower grain size distribution then actually received. The overlapping of grain limits is associated with the difficulties in splitting the powder into narrow adjacent grain fraction. Electrostatic charge of the small grains in the powder makes the small grains to adhere to larger ones (flocculation). The electrostatic charging of grains is mainly due to electron transport from the metal in the sieving device to the dolomite powder. The flocculation phenomenon makes it difficult to separate the small grains from the larger grains.
Figure 3.2. Pictures taken in 1000x magnification. To the left, mix 3 (coarse
grains) and to the right mix 1 (fine grains).

23
3.2 Measuring device for filtration stability.
Filtration stability is quantified in this work by a measuring device that presses the mixture through a net or slot with a specific mesh width or aperture, see figure 3.3. The first idea of using this test equipment was from Pär Hansson, Vattenfall Utveckling, in the beginning of the 90´th. The equipment is further developed by Eriksson, M, 2002a. The reason why not the filter pump was used is that the pump needs a relative big amount of suspension for each test. The available amount of the sieved material (dolomite powder) is limited, due to that it is very expensive and time consuming to produce these fraction intervals in the air separator.
Figure 3.3. Measuring device for filtration stability. A pressure gradient is applied over the filter. The amount of mixtures that passes the filter is a measure of filtration stability. When a large amount is passing the filter, then the mixture is said to have good filtration stability. A small amount indicates that a filter cake is being built up at the filter, which after a while makes it impossible for the mixture to pass through the filter. To evaluate different mixture’s filtration stability a measuring procedure has been set up. The results from the filtration experiments with this test equipment are dependent of the amount (volume) of mixture that passes the filter. The available original amount of mixture is therefore of importance. Performed filtration tests with different available amount of mixture will therefore probably generate different passed amount through the filter (different quantification of filtration stability). In this work, approximately 100- 110 cm3 of mixture is used in each test (depending of the desired volumetric concentration of grains in the mixture).
Preasure chamber
Filter
Collecting chamber
Manometer
2 00 80
80
1 5 7
1 50

24
Each mixture consists of 100 g dolomite powder and a different amount of water, depending of the desired volumetric concentration of grains. The powder was first mixed in a paddle mixer during one minute then in a blender (Ultra Turrax) at approximately 20 000 rpm during two minutes. The ready mixed mixture was then placed in the pressure chamber. The mixture was put under pressure (30 kPa) and continuos stirring while pressing the suspension through the filter. The maximum pressure time was set to one minute. The passed mixture through the filter was collected and weighted in a collecting chamber. Some mixture will always adhere to walls in the collecting chamber, hose and the filter. A measuring scale has been defined to quantify the difference in filtration stability between the mixtures. bStop, bFiltration and bAll refer to the filter width that cause or not cause plug formation at the filter.
Figure 3.4. Measuring scale for filtration stability. bstop indicates that a very small and filtrated amount of suspension (almost pure water) has passed the filter. bFiltrering means that an obvious filtration of grains has occurred. bAll indicates that the mixture has good filtration stability and no significant filtration has occurred. For mixtures with an passed amount of more than 75 %, should the presented percentage be expressed as a relative measure, not as a absolute measuring value (relative to other measuring values of < 75 %). The signification of the measuring values < 75 % is that the passed amount of mixture, could have been larger or minor, if the total amount of mixture had been increased. Values below 50 % passed amount can be expressed as absolute measuring values. Earlier work done by Eriksson, M, 2002 uses the slot width bmin and bcrit to evaluate the filtration properties of the grout. bmin indicates the minimum slot width below which no grout can pass, and bcrit is the slot width when the plug formation (filtration) starts to get significant for the passed amount of grout through the slot. To quantify good filtration properties one also has to look at the concentration of grains in the passed mixture. A large passed amount (big weight) of mixture is not necessarily equal with a big amount of passed grains. Grains could be stuck in the filter and the passing suspension is then mainly water. Check of change in grain concentration has to be made. The ratio between amount of water and grains could be determined by the following relationship;
0 %
bStop bFiltration bAll
100 %75 %50 %
Passed amount

25
ratio SolidWater/ W/S
powder dolomite density,Compactcρ
suspensionDensity,sρ
waterDensity,wρ:där
)sρw(ρcρ
)cρs(ρwρW/S
=
=
=
=
−⋅
−⋅=
(3.1)
W/S-ratio (Water/ Solid) is used in this work for the mixtures content of dolomite powder and W/C-ratio is used for mixtures of cement and water. Equation 3.1 is valid for both these cases.
3.2.1 Filter geometry
The plug is considered to being built up in different ways due to the geometry of the filter. Two types of filter geometry have been tested. First geometry, a net of thin woven steel wires makes a filter with quadratic mesh design. Second geometry, a thin steel plate in which a thin slot has been cut by a laser beam, see figure 3.5.
Figure 3.5. Two types of filter geometries. The net area in the first geometry has in some experiments been reduced by a 5*65 mm opening in a steel plate, which was placed upon the net. The filter area is reduced in order to see the influence of the filtration area relative the passed volume.
Quadratic net mesh design Wire thickness ~35µm
TrådtjocklekG rain
Plate thickness ~500µm
Grain
Slot in a steel plate
65 0
00 µ
m
~ 500 µm
~ 35 µm
~ 50- 120 µm
Filter areasNet [cm2]
36 µm 9,145 µm 10,675 µm 13,9
Net/ slot 45 µm 1,0475 µm 1,56
Slot 45 µm 0,02975 µm 0,0488
125 µm 0,0813

26
The filter area is of importance for the investigation of how many grains per filter area that passes. Many passed grains per area unit increase the probability that some of the grains get stuck and a plug is initialised. The principle of how a plug can be initialised is different dependent on the design of the filtration geometry. Filter of a net with quadratic mesh design makes that the grain can build an arch (plug) from four sides around a mesh opening in the filter. Filter of a single slot is associated to that the grain just can build an arch from two sides of the slot.
3.3 Scanning electron microscopy (SEM)
Some investigations have been made to visually analyse filter cakes with SEM-technology. The idea was to see if any certain type of grain was initialising the plug and if some significant strata of grains could be seen. Small pieces of the filter cake was cut out and put in the vacuum chamber in the microscopy. Different adjustments of the microscopy were tested, in order to get a detailed picture of the grain sizes and the distribution of the grain sizes.
3.4 Characterisation of grain curves
3.4.1 Rosin-Rammler-Sperling-Bennet (RRSB) distribution
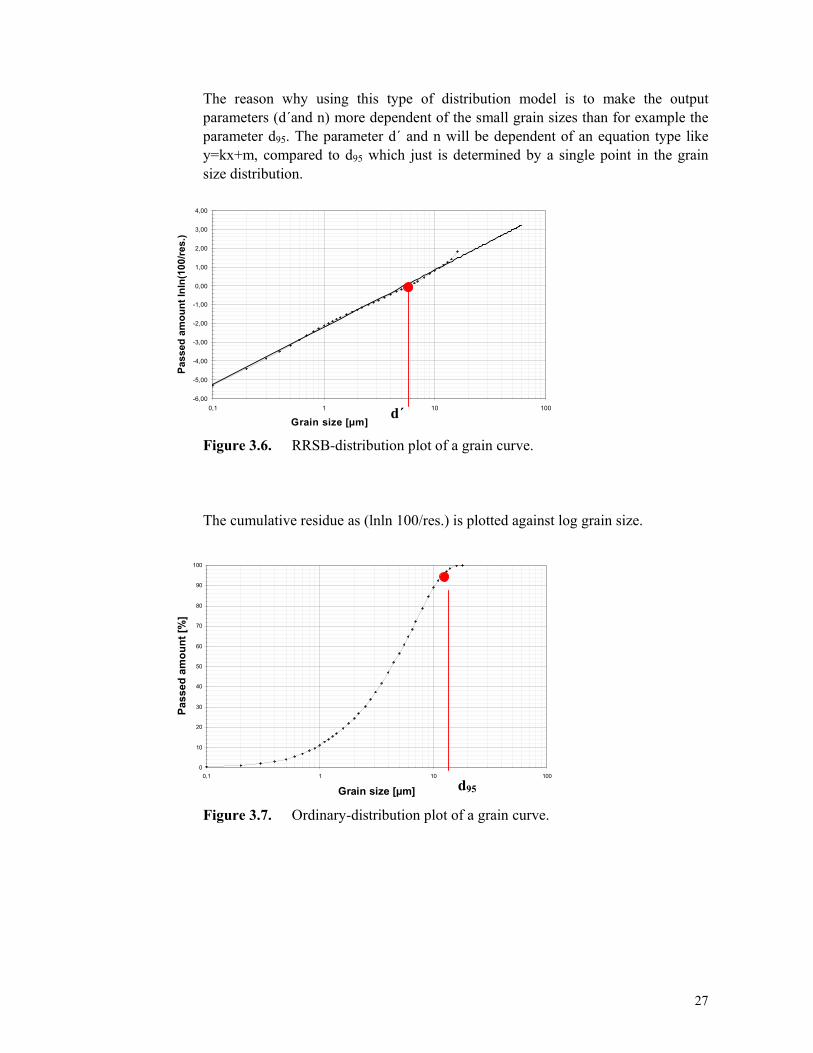
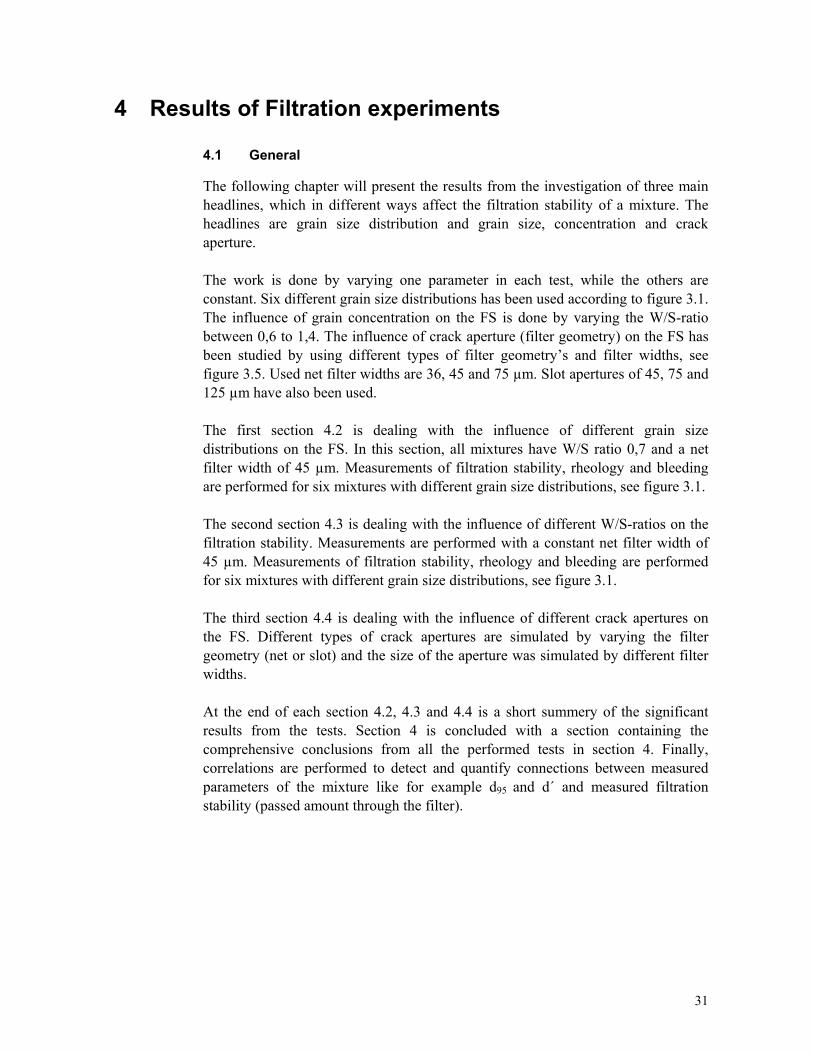
This way of describing the distribution of grains differs from the traditional way in terms of plotting the grain sizes against the amount of it. The RRSB distribution (Taylor, 1990) is more influenced by the amount of small sized grains. The output parameter from the distribution are d´ and n, see figure 3.6. d´ is a grain size in µm which corresponds to a amount of grains, normally about 50- 60 % of the total amount of grain sizes in grouting cements. n is a measure that describes the spread of the grain sizes and is presented as an slope of the line of best fit, between the min. and max. grain size. d´ is evaluated as the grain size which corresponds to the intersection between the straight line (adjusted line) and the cumulative residue value of zero. The RRSB- distribution is a commonly used method for describing the grain content in powders with a wide range of grain sizes and special consideration has to be taken to the small grain sizes. A passed amount of 50-60 % corresponds to d50-d60 if the grain size distribution is considered as normal distributed, with the standard deviation of σ and mean value µ. The plot in figures 3.6 and 3.7 illustrates the difference between RRSB- distribution and the ordinary way of plotting grain size distribution.
27
The reason why using this type of distribution model is to make the output parameters (d´and n) more dependent of the small grain sizes than for example the parameter d95. The parameter d´ and n will be dependent of an equation type like y=kx+m, compared to d95 which just is determined by a single point in the grain size distribution.
Figure 3.6. RRSB-distribution plot of a grain curve. The cumulative residue as (lnln 100/res.) is plotted against log grain size.
Figure 3.7. Ordinary-distribution plot of a grain curve.
d95
0
10
20
30
40
50
60
70
80
90
100
0,1 1 10 100
Grain size [µm]
Pass
ed a
mou
nt [%
]
-6,00
-5,00
-4,00
-3,00
-2,00
-1,00
0,00
1,00
2,00
3,00
4,00
0,1 1 10 100
Grain size [µm]
Pass
ed a
mou
nt ln
ln(1
00/re
s.)
d´

28
yxxy
)Y,X(Kovσ×σ
=δ
yandxmatrixfordeviationStandardyx,σYandXmatrixofCovarianseY)Kov(X,
1xyδ1n,CorrelatioofCoefficientxyδ
==
≤≤−=
3.5 Rheological measurement system
Viscosity and yield value has been measured in a plate-plate rheometer. The measuring loop consists of shear rates from 0 to 50 s-1 and back to 0 again. The duration of the loop is approximately 5 minutes. Rheology measurements are performed in order to investigate if there are some correlations between the passed amount of suspension in the filter device (filtration stability) and viscosity and yield value. Rheology measurements also serve as a check of the mixing quality of each suspension. Varying mixing quality means also varying viscosity and yield value. It is certainly of importance to have the mixing procedure as equal as possible between different mixtures.
3.6 Bleeding measurement standard
Bleeding tests of mixtures have been performed in order to investigate the influence of grain size distribution and concentration of grains. The bleed tests have been performed according to the principles of SS-EN 445, but the amount of available mixture volume is just between 100-110 cm3 (used volume according to SS-EN 445 is approximately 390 cm3). The limited volume of mixture causes that the measured bleeding is estimated to a lower value than if the measurement have been performed with a larger volume. The used measure vessel has the same diameter but a lower height, approximately 125 mm (ordinary height is 200 mm).
3.7 Correlation between measuring properties and results
The work of finding essential parameters from the grain size distribution, that influence the filtration stability is probably much a work of finding representable parameters for characterize the grain size distribution. Attempts has been made to correlate certain parameters of the grain curve like for example d95, d50 and d10 to the passed amount of suspension through the filter device, see equation 3.2. Even quotes or differences of mentioned parameters have been used for correlation. The correlation method that was used is written as: (3.2)
The parameter δxy is a measure of how well two series of data correlate to each other. Good correlation is associated to a δxy near 1.0. Presented correlation values in the diagrams in chapter 4.4 is R2, which is the squared value of δ. Change in the grain size distribution curve would then affect for example the passed amount of suspension in a certain way.

29
If the relation between two measuring values are strongly divergent from a linear relationship, the coefficient of correlation δxy is not that good estimation of the relation. δxy correlation can identify linear relations and relations nearby a linear relation. According to the relative few measuring values presented in section 4.4 it is acceptable to just make linear correlations. More measuring values are needed to make relevant non-linear correlations.

30
31
4 Results of Filtration experiments
4.1 General
The following chapter will present the results from the investigation of three main headlines, which in different ways affect the filtration stability of a mixture. The headlines are grain size distribution and grain size, concentration and crack aperture. The work is done by varying one parameter in each test, while the others are constant. Six different grain size distributions has been used according to figure 3.1. The influence of grain concentration on the FS is done by varying the W/S-ratio between 0,6 to 1,4. The influence of crack aperture (filter geometry) on the FS has been studied by using different types of filter geometry’s and filter widths, see figure 3.5. Used net filter widths are 36, 45 and 75 µm. Slot apertures of 45, 75 and 125 µm have also been used. The first section 4.2 is dealing with the influence of different grain size distributions on the FS. In this section, all mixtures have W/S ratio 0,7 and a net filter width of 45 µm. Measurements of filtration stability, rheology and bleeding are performed for six mixtures with different grain size distributions, see figure 3.1. The second section 4.3 is dealing with the influence of different W/S-ratios on the filtration stability. Measurements are performed with a constant net filter width of 45 µm. Measurements of filtration stability, rheology and bleeding are performed for six mixtures with different grain size distributions, see figure 3.1. The third section 4.4 is dealing with the influence of different crack apertures on the FS. Different types of crack apertures are simulated by varying the filter geometry (net or slot) and the size of the aperture was simulated by different filter widths. At the end of each section 4.2, 4.3 and 4.4 is a short summery of the significant results from the tests. Section 4 is concluded with a section containing the comprehensive conclusions from all the performed tests in section 4. Finally, correlations are performed to detect and quantify connections between measured parameters of the mixture like for example d95 and d´ and measured filtration stability (passed amount through the filter).

32
4.2 Influence of grain size distribution and grain size
Influence of different grain size distributions on filtration stability has been investigated for six suspensions with different distributions. The filtration geometry was set to a net mesh with a quadratic width of 45 µm. Reproducible measuring values were obtained with this geometry and a distinction between different passed amounts of mixtures through this net width was seen. The W/ S ratio was set to 0.7, which corresponds to a volumetric concentration of approximately 33 %. Mix 1 is not tested because of its bad rheological properties at the tested W/ S ratio. Too much fine grains caused a too high yield value and viscosity of the mixture. Table 4.1. Result of filtration measurements. Net mesh width 45 µm and
mixtures with W/ S 0,7. No. corresponds to number of performed measurements and Dev. is the standard deviation of the measured values .
Passed
Amount
Mixture Mean No. Dev. [%] 2 81 4 6,3 3 11 3 3,1 4 52 3 7,7 5 20 3 4,4 6 8 3 1,4
The related rheological measurements of the mixtures are presented in table 4.2. Because of the limited amount of inert material (myanit) is the volume of passed amount relatively small. If a larger amount of mixture had been available, some passed amounts could have been different.

33
Table 4.2. Result of rheology measurements. W/ S ratio 0,7. No. corresponds to number of performed measurements and Dev. is the standard deviation of the measures.
Yield
value Viscosity
Mixture Mean No. Dev. Mean No. Dev. [Pa] [Pas]
2 1,95 8 0,46 0,087 8 0,011 3 1,3 3 0,52 0,002 3 0,002 4 10,35 4 2,8 0,255 4 0,071 5 2,19 4 0,95 0,139 4 0,011 6 0,68 3 0,17 0,029 3 0,006
To check the passed amount of grains through the filter the difference in density before and after filtration of the mixtures has been measured. The original W/S ratio of 0,7 (before filtration) corresponds to a volumetric grain concentration φ of approximately 33 %. The results in table 4.3 illustrate the difference between different mixtures content of grains after filtration. Table 4.3. Result of density measurements. Original W/ S ratio is 0,7. V is total
passed mixture volume, φ is volumetric concentration of grains and Vp is passed volume of grains.
V W/ S φ Vp
Mixture [ml] [%] [ml] 2 72,2 0,79 31 22,2 3 - - - - 4 51,9 0,73 33 16,8 5 10,8 3,01 10 1,1 6 19,3 11,82 3 0,6
Calculated W/ S ratio according to equation 3.1. Mixture number 3 showed no passed volume of suspension through the filter. The passed volume of mixture no. 3 presented in table 4.1, just consists of water.

34
Figure 4.1. Result of bleed measurements. W/ S ratio is 0,7.
Experimental work has also been done to simulate the grain size distribution of the grouting cements (Injektering 30 and Ultrafin 12) with dolomite powder, see figure 4.2.
Figure 4.2. Result of filtration measurements. Net mesh width 45 µm and mixtures with W/ S and W/ C 0,7.
The correspondence between the simulated grain curve and grain curve of Inj. 30 is within the difference of ± 10 %. The correspondence of the simulation of Uf. 12 differs approximately 10 to 20 % in the grain sizes range between 1-5 µm. The simulated grain curve is containing too small amount of grains between 1-5 µm. There were no significant change of W/ S ratio before and after filtration, when testing the grain curve adjusted to Uf .12. Three measurements each are performed with the grain curve adjusted to Inj. 30 and Uf 12, see table 4.4. The standard deviations of the passed amounts are approximately the same as in table 4.1.
0
10
20
30
40
50
60
70
80
90
100
0,1 1 10 100
Grain size [µm]
Pass
ed a
mou
nt [%
] Mix 2
Mix 4
Adj. to Uf 12
Adj. to Inj 3014 % Passed
65 % Passed
81 % Passed
52 % Passed
0
5
10
15
20
25
0 0,5 1 1,5Time [h]
Ble
ed [%
]
Mix 2Mix 3Mix 4Mix 5Mix 6

35
Table 4.4. Result of rheology measurements. W/ S ratio 0,7. Yield
value Viscosity
Mixture Mean No. Dev. Mean No. Dev. [Pa] [Pas] Adj. to Uf 12 5,9 3 0,41 0,17 3 0,008 Adj. to Inj 30 1,3 3 0,55 0,04 3 0,010
4.2.1 Conclusions (grain size distribution)
A relatively small change in the mixtures grain size distribution, strongly affects the passed amount through the filter. Table 4.3 indicates that a significant filtration of grains occurs in certain mixtures like no. 5 and 6. Less than 10 % of the total passed mixture volume is grain volume. Mixtures like no. 2 and 4 indicates a more or less unaffected grain concentration in the passed volume. In the performed experiments it is shown that mixture no. 2 has the largest passed amount of mixture, while mixture no. 4 has the highest volumetric concentration of grains in the passed mixture. The passed amount of mixture no. 4 show that all the passed amount of mixture is unaffected of filtration (same φ before and after filtration), but plug formation has occurred which has obstruct the flow through the net. Mixture no. 2 shows a slightly lowerφ after filtration compared to no. 4, but the volume of passed grains is approximately 30 % higher than in no. 4. Good FS is according to this performed tests, both a question of total passed amount of mixture and the quality of the passed mixture (concentration of grains in the mixture after filtration). Figure 4.2 indicates that the simulated grain curves of Injektering 30 and Ultrafin 12 has a grain size distribution which not generate the highest passed amount of mixture through the filter. Some grain size distributions like mix 1 and 3 causes an unfavourable rheology in terms of too high or low viscosity and yield value. Wrong rheology cause problems with flowability. Measured viscosity and yield value of those inert mixtures which show good flowability, varies within the range of 2-5 times between the lower and upper value. A rule of a thumb for good rheology is a yield value between 2- 10 Pa and a viscosity between 0,10- 0,25 Pas (applicable to these inert mixtures without any addition of superplasticizer). Commercial available cement based grout mixtures with addition of superplasticizer can achieve a yield value and viscosity of less than 2 Pa or 0,10 Pas, with an acceptable bleeding of less than 5 %. The bleeding increases significant when the grain size distribution consists of mainly coarser grains (for example mixture 3 with d95 of approximately 12µm which cause a bleed of < 20%), see figure 4.1.

36
4.3 Influence of concentration
The influence of varied grain concentration is investigated by varying the W/ S ratio of the mixtures. The net mesh width is set to 45 µm. Table 4.5. Result of filtration measurements. Net mesh width 45 µm. No.
corresponds to number of performed measurements and Dev. is the standard deviation of the measures.
W/ S ratio 0,6 0,7 0,8 1,4 Mixture Passed No. Dev. No. Dev. No. Dev. No. Dev.
Mean No. Dev. Mean No. Dev. Mean No. Dev. Mean No. Dev. [%] [%] [%] [%]
1 - - 63 1 - 2 60 3 5,2 81 8 5,7 86 1 99 2 3 11 3 2,9 11 3 3,1 8 1 - 4 29 3 6,1 52 4 7,7 81 1 97 2 5 - 18 4 6,2 14 1 - 6 - 8 3 1,4 16 1 -
Table 4.6. Result of rheology measurements. Mixture with grain size
distribution curve no. 2. W/ S ratio Yield
value Viscosity
Mean No. Dev. Mean No. Dev. [Pa] [Pas]
0,5 15,3 1 - 0,425 1 - 0,6 6,68 3 3,06 0,187 3 0,048 0,7 1,95 8 0,46 0,087 8 0,011 0,8 1,59 1 - 0,062 1 - 1,4 0,23 1 - 0,010 1 -
Figure 4.3. Influence of W/ S ratio on to the yield value and viscosity for grain
curve no. 2.
W/ S ratio- Yield value
0
5
10
15
20
0 0,5 1 1,5
W/ S ratio
Yiel
d va
lue
[Pa]
W/ S ratio- Viscosity
00,10,20,30,40,5
0 0,5 1 1,5
W/ S ratio
Visc
osity
[Pas
]
37
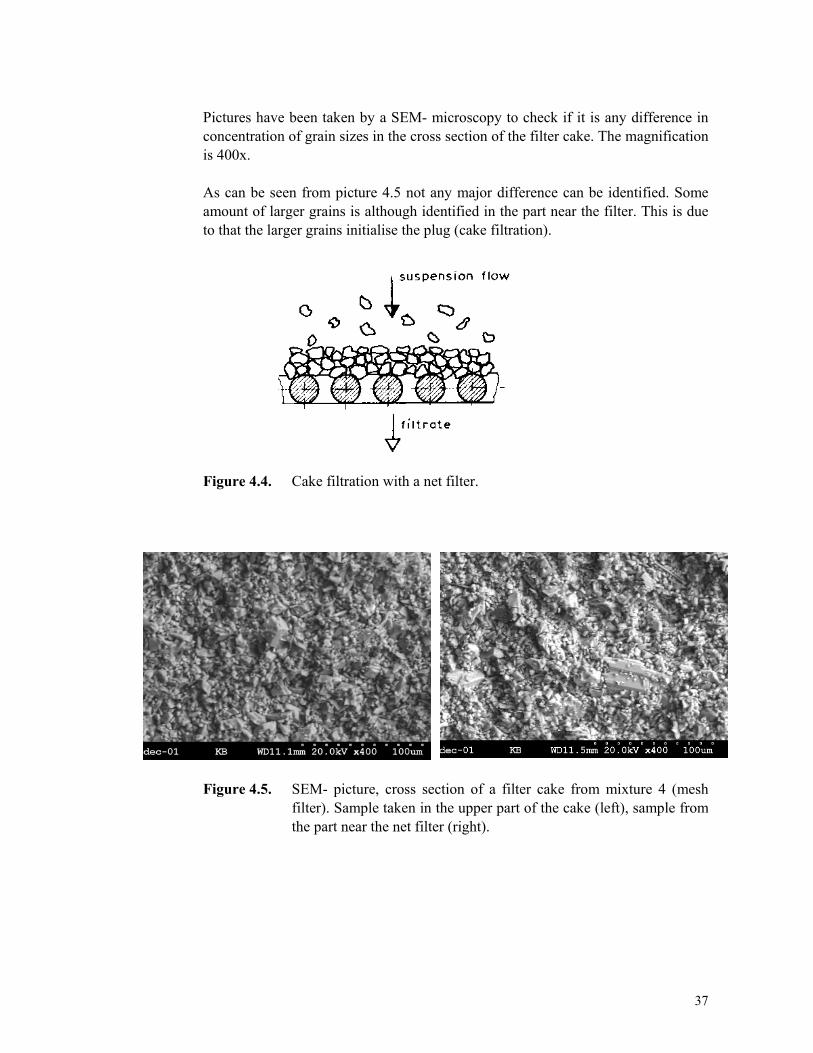
Pictures have been taken by a SEM- microscopy to check if it is any difference in concentration of grain sizes in the cross section of the filter cake. The magnification is 400x. As can be seen from picture 4.5 not any major difference can be identified. Some amount of larger grains is although identified in the part near the filter. This is due to that the larger grains initialise the plug (cake filtration).
Figure 4.4. Cake filtration with a net filter.
Figure 4.5. SEM- picture, cross section of a filter cake from mixture 4 (mesh
filter). Sample taken in the upper part of the cake (left), sample from the part near the net filter (right).

38
Variation of the grain concentration in the mixture resulted in the following variation in bleeding of the mixtures.
Figure 4.6. Result of bleed measurements. Mixture number 2.
4.3.1 Conclusions
According to this work is the mixture influenced in different ways due to changes in W/S ratio. The magnitude of the influence of a change in W/S ratio, is to a large extent dependent of the grain size distribution in the mixture. As an example it can be mentioned that mixture no 4´th filtration property is far more influenced by an increase of W/ S ratio than mixture no 2, see table 4.5. Generally is the past amount of mixture strongly increasing when the volumetric concentration of grains is decreased, see table 4.5. The rheology is also in a high extent dependent of the W/ S ratio. The experiments show that the viscosity and yield value approaches infinity when the W/ S ratio goes under 0,5 to 0,6, see figure 4.3. The difference in bleeding when changing the W/ S ratio is also relatively remarkable. A variation from 0,5 to 0,7 in W/ S ratio causes a four times higher bleeding with W/ S 0,7 compared to W/ S 0,5, with mixture number 2, see figure 4.6.
0
5
10
15
20
25
0 0,5 1 1,5 2 2,5 3Time [h]
Blee
d [%
]
W/ S ratio 0,5
W/ S ratio 0,6
W/ S ratio 0,7

39
4.4 Influence of crack aperture
The influence of the filter width/ crack aperture has been investigated by using different filter widths and slot apertures in the filtration experiments, see section 3.2.1. Table 4.7. Result of filtration measurements. Different net mesh widths. No.
corresponds to number of performed measurements and Dev. is the standard deviation of the measures. W/ S ratio is 0,7.
Mesh width
36 µm 45 µm 75 µm
Passed Passed Passed Mean No. Dev. Mean No. Dev. Mean No. Dev.
Mixture [%] [%] [%] 2 79 1 - 81 4 6,3 83 3 1,0 3 - 0 - 11 3 3,1 34 3 15,3 4 69 1 - 52 3 7,7 68 3 2,6 5 5 1 - 20 3 4,4 72 3 9,2 6 11 1 - 8 3 1,4 51 3 20,8
Table 4.7 indicates that the filter mesh width influences the passed amount of suspension in different ways. Some suspensions are strongly influenced by an increased mesh width (3, 5 and 6), while others like 2 and 4 are not that influenced. The net area has in the experiments presented in table 4.8 been reduced by a 5*65 mm opening in a steel plate, which was placed upon the net. Table 4.8. Result of filtration measurements. Different net mesh/ slot widths.
No. corresponds to number of performed measurements and Dev. is the standard deviation of the measures. W/ S ratio is 0,7.
Mesh/ slot 45 µm 75 µm Width Passed Passed
Mean No. Dev. Mean No. Dev. Mixture [%] [%]
2 72 2 - 81 2 - 3 0 2 - 15 2 - 4 32 2 - 51 2 - 5 17 2 - 56 2 - 6 11 2 - 42 2 -
40
TBVL•
=
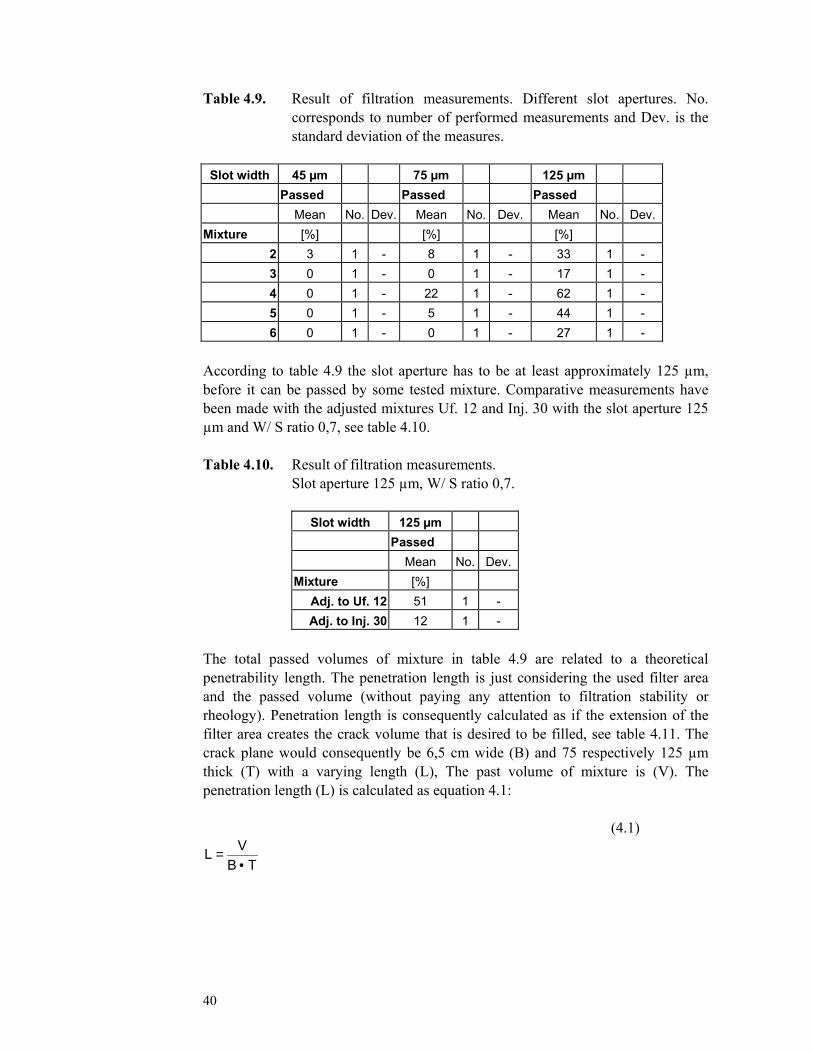
Table 4.9. Result of filtration measurements. Different slot apertures. No. corresponds to number of performed measurements and Dev. is the standard deviation of the measures.
Slot width 45 µm 75 µm 125 µm
Passed Passed Passed Mean No. Dev. Mean No. Dev. Mean No. Dev.
Mixture [%] [%] [%] 2 3 1 - 8 1 - 33 1 - 3 0 1 - 0 1 - 17 1 - 4 0 1 - 22 1 - 62 1 - 5 0 1 - 5 1 - 44 1 - 6 0 1 - 0 1 - 27 1 -
According to table 4.9 the slot aperture has to be at least approximately 125 µm, before it can be passed by some tested mixture. Comparative measurements have been made with the adjusted mixtures Uf. 12 and Inj. 30 with the slot aperture 125 µm and W/ S ratio 0,7, see table 4.10. Table 4.10. Result of filtration measurements. Slot aperture 125 µm, W/ S ratio 0,7.
Slot width 125 µm Passed
Mean No. Dev.Mixture [%]
Adj. to Uf. 12 51 1 - Adj. to Inj. 30 12 1 -
The total passed volumes of mixture in table 4.9 are related to a theoretical penetrability length. The penetration length is just considering the used filter area and the passed volume (without paying any attention to filtration stability or rheology). Penetration length is consequently calculated as if the extension of the filter area creates the crack volume that is desired to be filled, see table 4.11. The crack plane would consequently be 6,5 cm wide (B) and 75 respectively 125 µm thick (T) with a varying length (L), The past volume of mixture is (V). The penetration length (L) is calculated as equation 4.1: (4.1)

41
Table 4.11. Relation between passed amount of suspension and theoretical penetration lenght, W/ S ratio 0,7. Total passed amount of mixture, see table 4.9.
Necessary penetration length (grouted zone) around a tunnel structure is varying between 5 to 25 meters dependent of the desired sealing effect and originally inflow and pressure of water (Eriksson M, 2002). The presented theoretical penetration length in table 4.11 refers just to the smallest apertures up to 125 µm. The grouted zone contains a large amount of crack apertures much wider than 125 µm. These apertures are easily penetrated by the grout.
4.4.1 Conclusions
Table 4.7 to 4.9 indicates that the crack aperture is a critical parameter for the passed amount of mixture through the filter. What is remarkable when looking at the filtration tests in table 4.7 to 4.9 is that mixture 2 and maybe even no. 4, shows a relatively small variation in the past amount compared to the other mixtures when the filter width is changed. When using a slot aperture in the filtration tests, the slot has to be approximately 125 µm before any major amount (< 50 %) of mixture is passing the filter. It is hard to say from the performed experiments which of the presented theoretical penetration lengths (in table 4.11) that creates an acceptable sealing effect. Mixture no 4 with W/S ratio 0,7 show in this experiments a penetration length of nearly 2,5 m in a crack aperture of 125 µm. According to table 4.7 and 4.9, mixture no. 2 has the largest passed amount through the filter of mesh design, while using a slot filter mixture no. 4 has the largest passed amount. The phenomenon can be caused by the limited amount of original mixture volume or by some difference in their grain size distribution. The phenomenon is subject for further research. According to table 4.7 and 4.8, it seems that no significant difference can be seen between the total passed amount of mixture through the net mesh and the mesh with reduced filter area, reduced by a 5 mm wide slot.
Penetration lenghtFilter width 75 µm 125 µm
Slot SlotMixture no. [m] [m]
2 0,41 1,153 0,04 0,384 1,35 2,445 0,29 1,676 - 1,03

42
4.5 Correlation of measured values
A number of correlations have been made in purpose to illustrate connections between filtration stability and grain size distribution, grain concentration and crack aperture. Many combinations have been investigated and the ones which show good correlation has been further investigated.
Figure 4.7. Relation between passed amount of mixture and d95. W/ S ratio 0,7.
Figure 4.8. Relation between passed amount of suspension and d` of grain size
distribution in the mixture. W/ S ratio 0,7.
75 µm mesh width
R2 = 0,59
0,0
20,0
40,0
60,0
80,0
100,0
0,0 10,0 20,0 30,0d95
Pass
ed a
mou
nt[%
]
45 µm mesh width
R2 = 0,82
0,0
20,0
40,0
60,0
80,0
100,0
0,0 10,0 20,0 30,0d95
Pass
ed a
mou
nt[%
]
45 µm mesh width
R2 = 0,64
0,0
20,0
40,0
60,0
80,0
100,0
0,0 5,0 10,0 15,0d` [µm]
Pass
ed a
mou
nt[%
]
75 µm mesh width
R2 = 0,68
0,0
20,0
40,0
60,0
80,0
100,0
0,0 5,0 10,0 15,0d` [µm]
Pass
ed a
mou
nt[%
]

43
Figure 4.9. Relation between passed amount of suspension and standard
deviation (Std. Dev.) of grain size distribution in the mixture. W/ S ratio 0,7.
The standard deviation of the grain size distribution is calculated as if the grain sizes were normal frequency distributed in the mixture. The standard deviation is a measure of the spread of different grain sizes in the mixture.
Figure 4.10. Relation between passed amount of suspension and d` of the grain
size distribution in the mixture. W/ S ratio 0,7. As been mentioned earlier in table 4.9 was the passed amount of mixture through the slot width 45 and 75 µm so small that a correlation was useless to perform. The difference in passed amount of mixture through a filter of a net mesh compared to a slot filter is of importance to study as early discussed in section 3.2.1. Three types of filters were as mentioned earlier used, net mesh, net mesh with a delimited steel plate and slot geometry. No significant difference in the passed amount of mixture was seen between the two types of filters with mesh design. A large difference in the passed amount of mixture was observed between the mesh filter and the slot filter, as can be seen in section 4.3. The results presented in figure 4.11 to 4.13 are the passed total mixture volume per unit filter area and the volume of grains per unit filter area.
75 µm mesh width
R2 = 0,03
0,0
20,0
40,0
60,0
80,0
100,0
34,0 36,0 38,0 40,0Std.Dev.
Pass
ed a
mou
nt[%
]
45 µm mesh w idth
R2 = 0,48
0,0
20,0
40,0
60,0
80,0
100,0
34,0 36,0 38,0 40,0Std. Dev.
Pass
ed a
mou
nt[%
]
Slot aperture 125 µm
R2 = 0,74
0,0
20,0
40,0
60,0
80,0
100,0
0,0 5,0 10,0 15,0d` [µm]
Pass
ed a
mou
nt [%
]

44
Figure 4.11. Left figure, relation between total volume per unit area and d´. Right figure,
relation between passed volume of grains and d´. W/ S ratio 0,7 and filter width 75 µm.
Figure 4.12. Left figure, relation between total volume per unit area and d95. Right figure,
relation between passed volume of grains and d95 W/ S ratio 0,7 and filter width 75 µm.
Figure 4.13. Left figure, relation between total volume per unit area and d´. Right figure,
relation between passed volume of grains and d´. W/ S ratio 0,7 and filter width 125 µm.
0
10
20
0 5 10 15
d' [µm]
Pass
ed to
tal v
olum
e [v
olum
e/ a
rea]
Mesh
Mesh/ Slot
Slot
0
10
20
0 5 10 15
d' [µm]
Pass
ed g
rain
vol
ume
[vol
ume/
are
a]
Mesh
Mesh/ Slot
Slot
0
10
20
0 10 20 30
d95 [µm]
Pass
ed to
tal v
olum
e [v
olum
e/ a
rea]
Mesh
Mesh/ Slot
Slot
0
10
20
0 10 20 30d95 [µm]
Pass
ed g
rain
vol
ume
[vol
ume/
are
a]
Mesh
Mesh/ Slot
Slot
0
500
1000
0 5 10 15
d' [µm]
Pass
ed to
tal v
olum
e [v
olum
e/ a
rea]
Slot
0
500
1000
0 5 10 15
d' [µm]
Pass
ed g
rain
vol
ume
[vol
ume/
are
a]
Slot
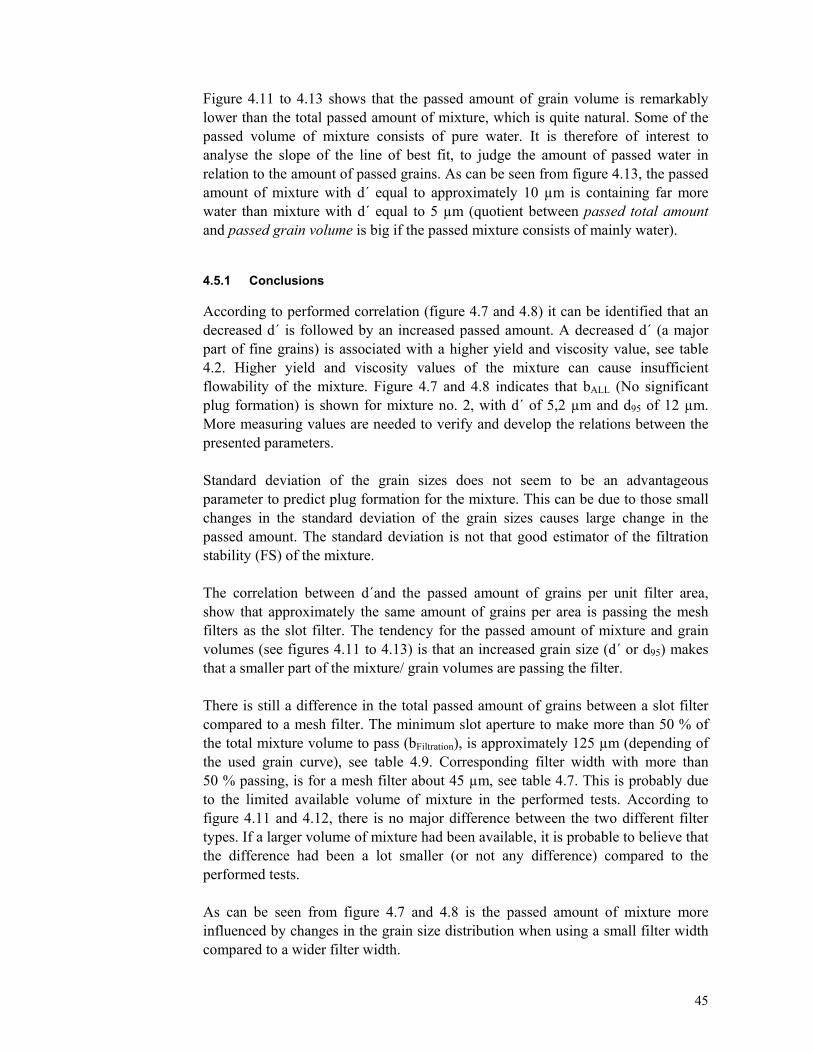
45
Figure 4.11 to 4.13 shows that the passed amount of grain volume is remarkably lower than the total passed amount of mixture, which is quite natural. Some of the passed volume of mixture consists of pure water. It is therefore of interest to analyse the slope of the line of best fit, to judge the amount of passed water in relation to the amount of passed grains. As can be seen from figure 4.13, the passed amount of mixture with d´ equal to approximately 10 µm is containing far more water than mixture with d´ equal to 5 µm (quotient between passed total amount and passed grain volume is big if the passed mixture consists of mainly water).
4.5.1 Conclusions
According to performed correlation (figure 4.7 and 4.8) it can be identified that an decreased d´ is followed by an increased passed amount. A decreased d´ (a major part of fine grains) is associated with a higher yield and viscosity value, see table 4.2. Higher yield and viscosity values of the mixture can cause insufficient flowability of the mixture. Figure 4.7 and 4.8 indicates that bALL (No significant plug formation) is shown for mixture no. 2, with d´ of 5,2 µm and d95 of 12 µm. More measuring values are needed to verify and develop the relations between the presented parameters. Standard deviation of the grain sizes does not seem to be an advantageous parameter to predict plug formation for the mixture. This can be due to those small changes in the standard deviation of the grain sizes causes large change in the passed amount. The standard deviation is not that good estimator of the filtration stability (FS) of the mixture. The correlation between d´and the passed amount of grains per unit filter area, show that approximately the same amount of grains per area is passing the mesh filters as the slot filter. The tendency for the passed amount of mixture and grain volumes (see figures 4.11 to 4.13) is that an increased grain size (d´ or d95) makes that a smaller part of the mixture/ grain volumes are passing the filter. There is still a difference in the total passed amount of grains between a slot filter compared to a mesh filter. The minimum slot aperture to make more than 50 % of the total mixture volume to pass (bFiltration), is approximately 125 µm (depending of the used grain curve), see table 4.9. Corresponding filter width with more than 50 % passing, is for a mesh filter about 45 µm, see table 4.7. This is probably due to the limited available volume of mixture in the performed tests. According to figure 4.11 and 4.12, there is no major difference between the two different filter types. If a larger volume of mixture had been available, it is probable to believe that the difference had been a lot smaller (or not any difference) compared to the performed tests. As can be seen from figure 4.7 and 4.8 is the passed amount of mixture more influenced by changes in the grain size distribution when using a small filter width compared to a wider filter width.
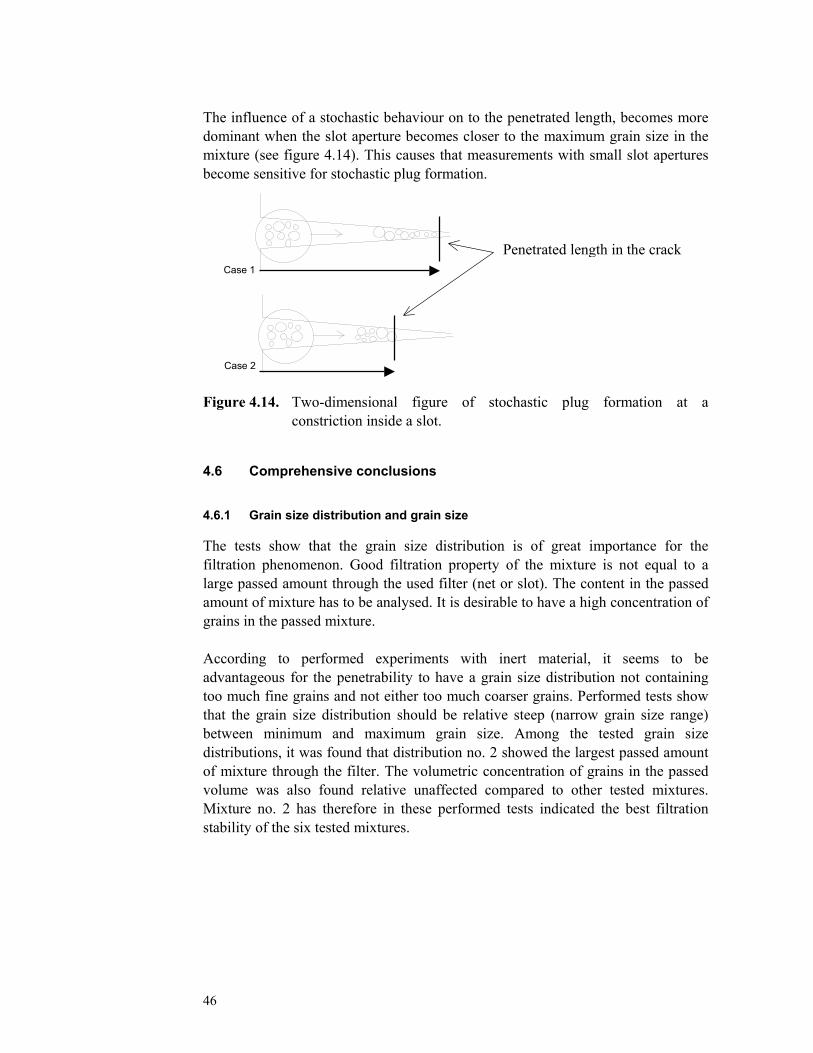
46
The influence of a stochastic behaviour on to the penetrated length, becomes more dominant when the slot aperture becomes closer to the maximum grain size in the mixture (see figure 4.14). This causes that measurements with small slot apertures become sensitive for stochastic plug formation.
Figure 4.14. Two-dimensional figure of stochastic plug formation at a
constriction inside a slot.
4.6 Comprehensive conclusions
4.6.1 Grain size distribution and grain size
The tests show that the grain size distribution is of great importance for the filtration phenomenon. Good filtration property of the mixture is not equal to a large passed amount through the used filter (net or slot). The content in the passed amount of mixture has to be analysed. It is desirable to have a high concentration of grains in the passed mixture. According to performed experiments with inert material, it seems to be advantageous for the penetrability to have a grain size distribution not containing too much fine grains and not either too much coarser grains. Performed tests show that the grain size distribution should be relative steep (narrow grain size range) between minimum and maximum grain size. Among the tested grain size distributions, it was found that distribution no. 2 showed the largest passed amount of mixture through the filter. The volumetric concentration of grains in the passed volume was also found relative unaffected compared to other tested mixtures. Mixture no. 2 has therefore in these performed tests indicated the best filtration stability of the six tested mixtures.
Case 1
Case 2
Penetrated length in the crack
47
4.6.2 Concentration
A critical parameter to achieve a good filtration stability of the mixture is the grain concentration. As mentioned before in this work the concentration is one of the most important parameters for achieving a resistant sealing effect of the grout. According to performed tests regarding the influence of the grain concentration on to the filtration stability, tests indicate that a stable mixture with bleeding < 5 %, is important for good filtration stability of the mixture. Stable mixtures can be achieved with different W/ S ratio dependent on the grain size distribution.
4.6.3 Crack aperture
In this work two types of filtration geometry’s has been used. The performed tests shows that it is a difference between plug formation in slot geometry compared to a filter with quadratic mesh design. The experiments show that the same filter width (slot and mesh) generates different passed amount of mixtures. The total passed amount of mixture through the net filter is between 2 to 10 times (due to used grain size distribution) bigger compared to the correspondent slot filter width. Passed volume of mixture per unit filter area is approximately the same for net filter compared to a slot filter. The minimum slot width that can be passed by any major amount of mixture is 125 µm.
4.6.4 Correlation of measurements
Correlations between different parameters have been made in order to identify possible connections. The best correlation for filtration stability is found between the parameter d´ and the passed amount of mixture. The correlation show a coefficient of correlation (δ) of about 0,7. The correlation is both valid for filter with mesh and slot design. A slightly weaker correlation is found between d95 and the passed amount, concerning filtration through the 75 µm filter. As early discussed in section 4.5.1 the measurements with 45 µm filter width is more sensitive to other disturbances like stochastic plug formation. The main reason to why d´ in these tests are better correlated to the passed amount of mixture, is because of that d´ is more influenced by the amount of small grains (0- 5 µm) than the value of d95. As can be seen from table 3.1 the d95 for mixture no. 3, 5 and 6 are almost the same, but the d´ values are different due to the difference in their content of finer grain sizes.

48

49
5 Discussion of cement based material The experiments were carried out with an inert material consistent of crystalline limestone called dolomite. Experiments with inert material can be performed repeatedly with approximately the same result, which is not the case with cement materials. The intention of using inert material was to reduce the influence of the surface chemistry, but even grains of dolomite stone have a small surface charge. The charge induces forces between the grains, which act repellent between grains of pure minerals. Another difference between these two types of material (cement and dolomite) is the thixotropic behaviour. Thixotropic behaviour of the cement suspension will often make the evaluation of the measurements more complex (Ferraris C F, 1992). There are mainly five areas which one has to consider when to measure and evaluate the measurements of cement based suspensions. The areas are cement chemistry and early cement reactions, influence of superplasticizer, surface chemistry and pore water chemistry.
5.1 Cement chemistry and early cement reactions
There is still after more than 100 years of use, some uncertainties about the mechanism of hydration of Portland cement. The main reason for this is that it takes place at a solid –liquid interface and produces solids of variable composition which are either amorphous or, if crystalline, adopt more than one morphology. This makes the reaction difficult to study experimentally. Today’s more sophisticated measuring equipment’s have made it possible to better understand the reactions. Dissolution of components and chemical reactions start immediately after that cement has been exposed to water. The free lime and sulphate dissolve and surface skins of hydrated minerals form on the other constituents. Reactions then proceeds very slowly for the next 2-5 hours (the dormant period) before accelerating when the surface skins break. Hydration products grow away from the surfaces into the spaces between grains and finally resulting in development of strength in the cement paste. During approximately one hour after mixing has the chemical reaction that mainly governs the filtration stability occurred. The reaction between the tricalciumaluminate and gypsum is among the first reaction that starts. This reaction creates ettringite and slows the rapid hydration of the aluminate phase. The ettringite covers the cement grains and creates what usually is called false setting (Bradley G, 1986). The governing factor for the fresh properties of cement based grout is probably the gypsum reaction. Gypsum is added to the cement powder in the manufacturing process.
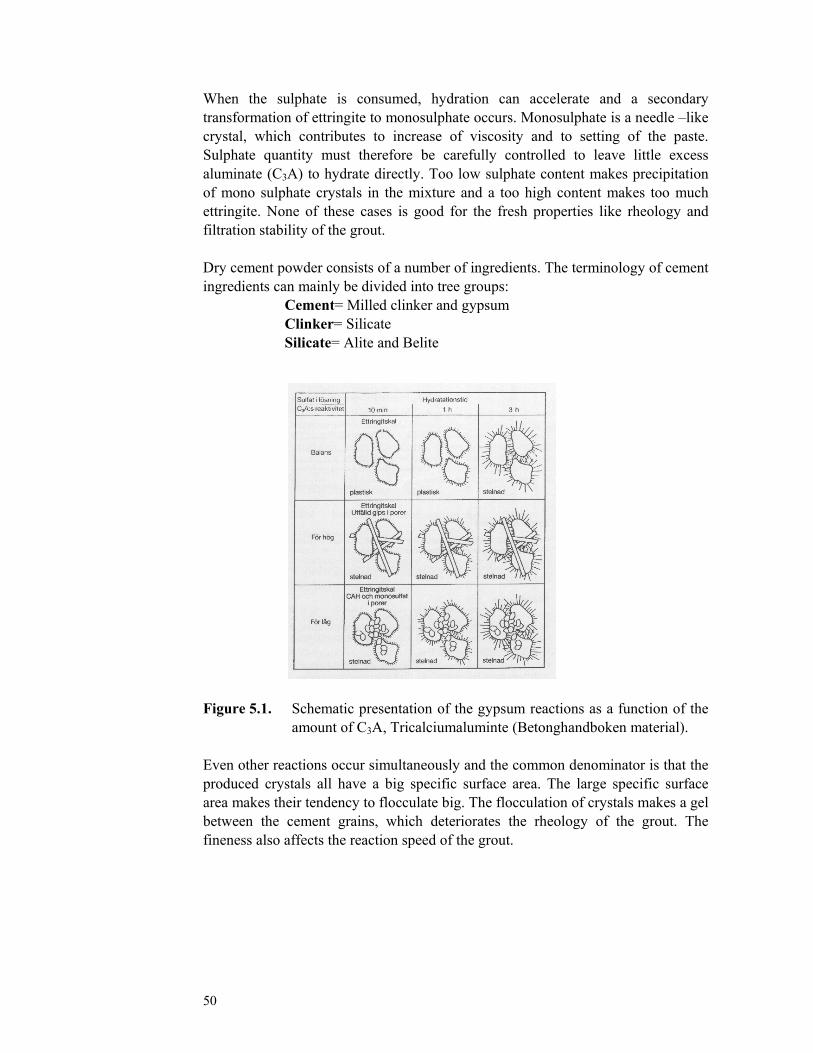
50
When the sulphate is consumed, hydration can accelerate and a secondary transformation of ettringite to monosulphate occurs. Monosulphate is a needle –like crystal, which contributes to increase of viscosity and to setting of the paste. Sulphate quantity must therefore be carefully controlled to leave little excess aluminate (C3A) to hydrate directly. Too low sulphate content makes precipitation of mono sulphate crystals in the mixture and a too high content makes too much ettringite. None of these cases is good for the fresh properties like rheology and filtration stability of the grout. Dry cement powder consists of a number of ingredients. The terminology of cement ingredients can mainly be divided into tree groups:
Cement= Milled clinker and gypsum Clinker= Silicate Silicate= Alite and Belite
Figure 5.1. Schematic presentation of the gypsum reactions as a function of the
amount of C3A, Tricalciumaluminte (Betonghandboken material).
Even other reactions occur simultaneously and the common denominator is that the produced crystals all have a big specific surface area. The large specific surface area makes their tendency to flocculate big. The flocculation of crystals makes a gel between the cement grains, which deteriorates the rheology of the grout. The fineness also affects the reaction speed of the grout.

51
A cement with smaller grains reacts faster than coarser ones, due to that more calcium silica hydroxide and ettringite is created (the total surface area to cover is larger when the grains are small). The final setting of the paste is caused principally by the growth and interlocking of the calcium silica hydroxide (C-S-H) gel. The composition of typical Swedish cement for grouting purpose consists of a number of clinker minerals. Table 5.1. Approximate amount of mineral content of a typical Portland
cement. (for example Injekteringscement 30)
Alite Belite Ferrit Aluminate Gypsum [%] [%] [%] [%] [%] 53 23 14 1 5
One of the governing factors when dealing with early cement reactions is the W/C ratio in the mixture. The setting time (change from a viscous to a solid material) is largely governed by the distance between the grains in the mixture. The chemical reactivity in the mixture is often measured as a raising of the temperature. Raising of the temperature is an indication of that the silicate (mainly alite) reactions have started in the mixture. A high W/C ratio is associated to that it takes a longer time before this reaction start (setting time is delayed).
5.2 Superplasticizer and Surface chemistry
A cement paste consists in its simplest case of cement grains suspended in water. The grains are then affected by attracting London-van der Waals forces (LvdW) and electrostatic forces that can both be attractive and repulsive. The LvdW forces are always present and can not be manipulated or eliminated. Cement consists of several minerals with different surface potentials and even different polarity. Therefore, cement paste without addition of superplasticizer (SP) is a strongly flocculated system (Gu Ping, 1994). The purpose of a SP, or using the physiochemical term, a stabilising agent, is to counteract the van der Waahls attraction forces between grains. The attraction forces tend to bring grains together into agglomerates even if they initially were dispersed. (Yang M, 1997). The SP also lowers the friction between grains, which results in decreased viscosity and yield value of the suspension. The most common types of superplasticizer are melamine and naphthalene, both act in an electrostatic manner. That is, the surfaces of the cement grains become equally charged by the SP and the particles are repelled by the electrostatic forces. The negative charge of the cement grains is created by an anionic sulphate group, which adhere to the grain surface. The electrostatic stabilisers increase the magnitude of the surface potentials. It is possible to measure the surface potential with a ξ (zeta) - potential measuring system.
52
A new type of SP has come out on the market, the copolymer type, whose mode of action is different from the traditional SP. The copolymer SP consists of two or more types of polymers chained together at their ends. In the simplest case, with two polymers chained, one polymer is hydrophilic and one is hydrophobic. This brings that the hydrophobic parts of the copolymer will adhere to the surfaces of the cement grains while the hydrophilic parts will extend from the surfaces in loops and tails. This gives the surface a "hairy" texture. When two particles approach each other the polymer layers begin to interact which brings the freedom of movement and thereby the entropy of the system to decrease and a repelling force arises. (Vovk A I, 1989)
5.2.1 DLVO- theory
The different modes of action give different distance-force relationships according to the DLVO-theory (Gu Ping, et al, 1994). The electrostatic stabilisers suffer from two equilibrium along the curve, the primary and the secondary minimum of energy. The secondary minimum causes loose flocculation that is noticed by a thixotropic behaviour of the suspension. The primary minimum gives a rather stable bond between particles, which can form hard cakes on the bottom of a container. The particles have to be submitted to certain forces exceeding the electrostatic repulsion forces to come within the minima. For the secondary minimum, it can be sufficient with the natural Brownian movement of the particles, or the suspension is so highly concentrated that the particles are already in reach of each other. In order to be trapped in the primary minimum the particles have to be affected by greater forces, e.g. gravity or mechanical forces by filtration (Shaw D J, 1980 and Bradley G et al, 1986). The steric stabilisers should not exhibit corresponding equilibrium along the force-distance curve. The interparticle force should be repelling regardless of the distance. This indicates that a grout with a steric stabiliser, i.e. a copolymer SP, should allow a more severe filtration stress without the particles flocculating.

53
Electrostatic:Repulsion dueto equal surfacecharges
Repulsion
Attraction
Distance
Force
Repulsion
Attraction
Distance
Force
Steric:Repulsion dueto decrease inentropy
1
2
1. Primary minimum2. Secondary minimum of surface potential
Figure 5.2. Principles of electrostatic and steric stabilisation of suspensions.
5.3 Pore water
The properties of the pore water are of importance for the suspensions rheology. The interaction of forces between the grains in the suspension is dependent of the electrical properties of the pore water. The composition of the pore water is difficult to influence, but there are some possibilities. If one discover that some specific type of ion is contributing with bad properties, it is possible to neutralize the ion by a complex binder. There are some ideas that a lower ionic strength is associated to a better penetrability of the grout. (Yang M, et al, 1997). However, a low ionic strength is probably also associated to a lower reactivity of the cement. The ion strength in the water has a small effect on the LvdW forces, while the electrostatic forces are strongly affected. The release of alkali sulphates in the grout mixture during the first twenty-four hours makes the pore water saturated with ions as K+, Ca2+, SO4- and OH-. Alkali consists of Natrium (Na) and Potassium (K). The amount of alkali affects the amount of water that can be kept in the mixture. High amount of alkali makes that a larger amount of water can be kept in the mixture. Cement with high alkali amount requires a large amount of mixing water.

54
The amount of alkali is measured by the equivalent amount of Na2O: (Na2O)ekv.= 0,66K2O+ Na2O (5.1) The amount of alkali consequently affects the rheology of the fresh grout mixture. High alkali amount > 1 %, commonly gives a high concentration of easy soluble sulphates, which can react with the easy soluble gypsum and give problems with rapid increase of viscosity of the paste (false setting). The pore water pH value in a grout mixture is normally around 13.
5.4 Conclusions
The cause of plug formation becomes more complicated when looking at cement based material compared to the inert materials. The chemical reactions of interest for the filtration stability occur during the first one-hour after mixing. The gypsum reactions are one of the dominant early cement reactions for the influence of plug formation. Other early cement reactions of interest are the silicate reactions, which affects the setting time of the mixture. W/C ratio is the most influential parameter on to the setting time. Surface chemistry property is significant to prevent flocculation of grains in the mixture. Flocculation of grains is important to avoid in order getting a mixture with good filtration properties. A common way to avoid flocculation is to use superplasticizer. The ion content in the mixing water is of importance for the suspensions rheology.
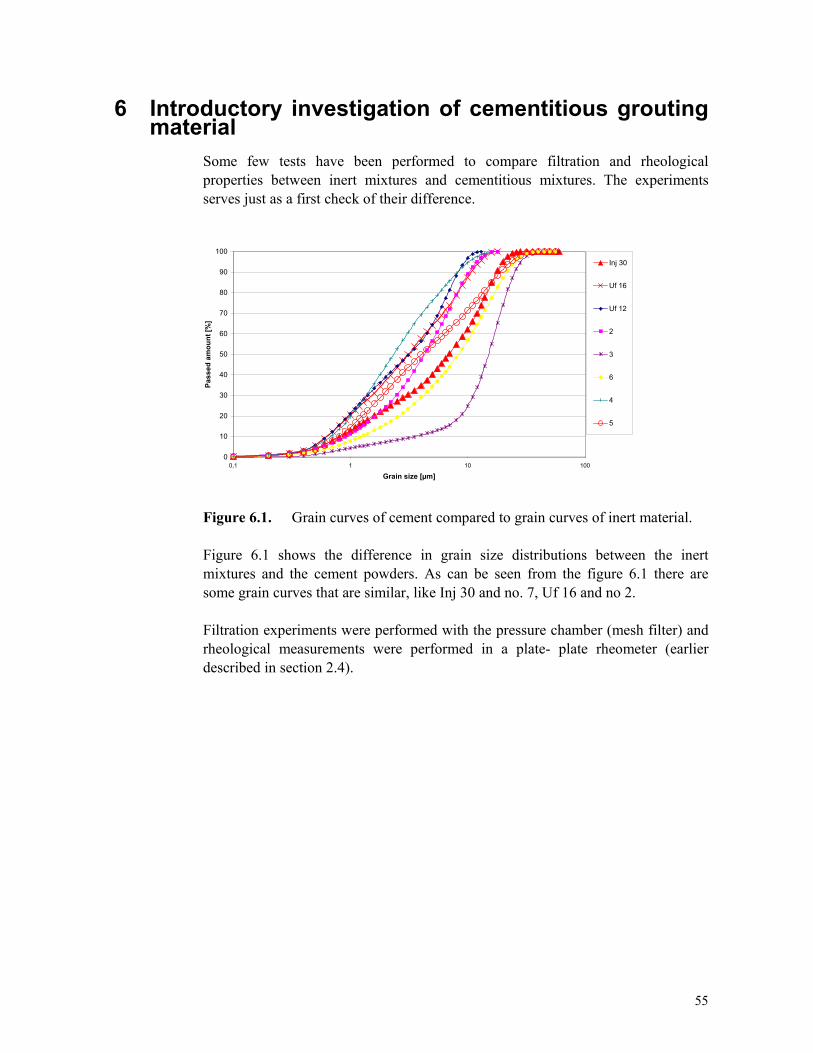
55
6 Introductory investigation of cementitious grouting material
Some few tests have been performed to compare filtration and rheological properties between inert mixtures and cementitious mixtures. The experiments serves just as a first check of their difference.
Figure 6.1. Grain curves of cement compared to grain curves of inert material. Figure 6.1 shows the difference in grain size distributions between the inert mixtures and the cement powders. As can be seen from the figure 6.1 there are some grain curves that are similar, like Inj 30 and no. 7, Uf 16 and no 2. Filtration experiments were performed with the pressure chamber (mesh filter) and rheological measurements were performed in a plate- plate rheometer (earlier described in section 2.4).
0
10
20
30
40
50
60
70
80
90
100
0,1 1 10 100
Grain size [µm]
Pass
ed a
mou
nt [%
]
Inj 30
Uf 16
Uf 12
2
3
6
4
5

56
Table 6.1. Comparison between inert and cement based mixture, W/ S and W/ C-ratio of 0,7.
The cement mixtures in table 6.1 are not containing any superplasticizer. The filtration tests are performed three times (repeated) in order to roughly evaluate the standard deviation of the results from the measurement (passed amount of mixture). The big variation of the standard deviation of the yield value and viscosity (table 6.1) can mainly be explained by the time dependent properties in the cement (chemical reactivity) in combination with the measuring system (plate-plate). Due to that, no superplasticizer was added to the mixture, uncontrolled flocculation of the cement grains started immediately after water was added to the cement powder. Flocculation makes that smaller grains adhere to bigger ones and the rheological properties are therefore radically changed. The measuring system is sensitive to these changes in rheology and the measuring values (yield value and viscosity) will therefore change with time during the measurement period of 5 minutes. The standard deviation of the filtration experiments (cement mixture, table 6.1) indicates relative to the rheological measurements a smaller variation. The smaller deviation can mainly be explained by that filtration measurement takes place in a shorter period. The duration of the filtration experiment is approximately 30 s to 1 minute, compared to the rheological measurements of 5 minutes.
Mesh widht 45 µmINERT
Rheology FiltrationYield value Viscosity Passed
Grain curve [Pa] [Pas] [%]2 1,88 0,083 743 1,19 0,004 06 0,68 0,030 134 10,52 0,286 55
5 2,06 0,135 9
CEMENTReologi FiltrationYield value Std. Dev. Viscosity Std. Dev. Passed Std. Dev.
Grain curve [Pa] [Pas] [%]IC 30 0,82 0,44 0,037 0,011 11 1,15
UF 16 12,52 11,54 0,107 0,091 9 1,15UF 12 12,22 9,94 0,078 0,025 12 2,89
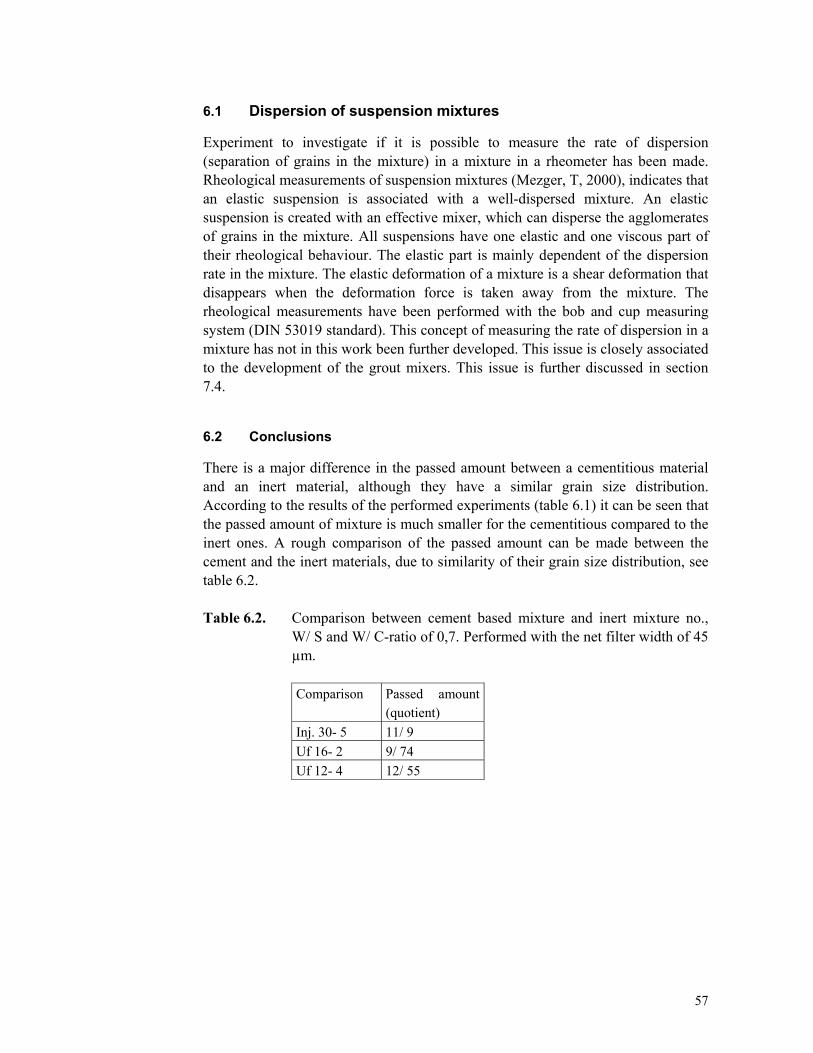
57
6.1 Dispersion of suspension mixtures
Experiment to investigate if it is possible to measure the rate of dispersion (separation of grains in the mixture) in a mixture in a rheometer has been made. Rheological measurements of suspension mixtures (Mezger, T, 2000), indicates that an elastic suspension is associated with a well-dispersed mixture. An elastic suspension is created with an effective mixer, which can disperse the agglomerates of grains in the mixture. All suspensions have one elastic and one viscous part of their rheological behaviour. The elastic part is mainly dependent of the dispersion rate in the mixture. The elastic deformation of a mixture is a shear deformation that disappears when the deformation force is taken away from the mixture. The rheological measurements have been performed with the bob and cup measuring system (DIN 53019 standard). This concept of measuring the rate of dispersion in a mixture has not in this work been further developed. This issue is closely associated to the development of the grout mixers. This issue is further discussed in section 7.4.
6.2 Conclusions
There is a major difference in the passed amount between a cementitious material and an inert material, although they have a similar grain size distribution. According to the results of the performed experiments (table 6.1) it can be seen that the passed amount of mixture is much smaller for the cementitious compared to the inert ones. A rough comparison of the passed amount can be made between the cement and the inert materials, due to similarity of their grain size distribution, see table 6.2. Table 6.2. Comparison between cement based mixture and inert mixture no.,
W/ S and W/ C-ratio of 0,7. Performed with the net filter width of 45 µm.
Comparison Passed amount
(quotient) Inj. 30- 5 11/ 9 Uf 16- 2 9/ 74 Uf 12- 4 12/ 55

58

59
7 Conclusions and Proposal to continued research
7.1 Compilation of grouting research
Experiments performed at Vattenfall Utveckling suits well with the experiments done by Royal Institute of Technology, division of Soil & Rock Mechanics. Future important work within this field of improvement of cementitious grouts is to synthesise these works into a unit. It is important to use the same terminology but even though work with different angel of approach onto the problem. Some examples of topics to cooperate around can be development of a uniform measuring system for filtration stability, standardisation of used nomenclature and other issues, which are of interest to improve the grouting cement.
7.2 Simulation of plug formation
A common problem with the theories presented in figure 2.6 and 2.8 is that they are hard to practice. It is of limited interest to simulate formation of regular arches with mono sized grains. Cohesive and frictional forces are also neglected, which probably is of big importance for the plug formation. These types of models starts to get valuably when one can make the connection between the mixtures ingredients and the potential risk of plug formation.
7.3 Improvement of grouting cement
Experiences from the filtration experiments with inert material would serve as a base for adjustment of the cement based materials grain curve. It is possible in some extent to mill the cement powder into certain fraction intervals with laboratory mill equipment. Investigation of the influence of replacing the fine cement grains between 0-5 µm with inert grains is planned to be performed. Experiments performed at Vattenfall Utveckling AB on cement based material has shown that the fine fraction (0- 5 µm) of grains often deteriorate the filtration properties. The poorer filtration property is probably due to big initial chemical reactivity of the small cement grains. As been mentioned in chapter 5.4 a number (five) of areas has been identified as of special interest to further investigate, when looking at the filtration stability of cementitious materials. These are: • Cement chemistry • Early cement reactions • Superplasticizer • Surface chemistry • Pore water

60
The influence of different gypsum additives is an interesting area to investigate. The rate of soluble and sparingly soluble gypsum is an important parameter to analyse when producing cement with good filtration properties. The soluble gypsum is commonly consistent of CaSO4*2H2O (semi hydrated gypsum) and the sparingly soluble gypsum can be CaSO4 (Anhydrite). Experiments should be made when varying the amount of these two gypsum types. The other areas (superplasticizer, surface chemistry and pore water) are also supposed to be performed during the coming work.
7.4 Mixer design
Further investigation has to be made to analyse the influence of the mixer design on to the filtration stability. It is of importance for the rheology and filtration stability to quantify the rate of dispersion of the grout. A measuring system for dispersion rate would certainly make it easier to optimise the mixer design.
7.5 Development of test equipment for field use
Sampling of grout mixture on site is of importance to secure the quality of the used grout. Robust methods for sampling are a subject for further development. It is desirable in many aspects to use in situ measurement systems in the mixing procedure of the grout. Measurement systems for filtration stability and rheology can for example be placed on the outlet of the stirring chamber. The design of the measurement systems is not that easy to predict. The systems should both measure representative parameters like the passed amount through a filter (FS), yield value and viscosity, on a representative grout sample. Co-operation with the manufacturer of the mixing device is in this case important to succeed.
7.6 Field tests
This work is planned to be finished with a field test when the concepts of grout with different properties are used. The field test is planned to be performed in a tunnelling project. Parameters of the grout mixture like grain size distribution and grain concentration will be tested at different grouting situations. The testing methods for filtration stability like the filter pump and the filter press will be evaluated in their significans for achieving a good grouting result (sealing effect and resistance).

61
8. References
1. Alemo J, Hansson P. (1997) Cementitious injection grouts - penetration ability. Selected research studies from scandinavia – Dedicated to professor Göran Fagerlund on his 60th anniversary. Lund Institute of Tech. Report TVBM-3078. pp 1-4.
2. Crawford A.M, G. Graskopf, (1984) Groutability ratio for filter blocking of joints in rock, Department of Civil Engineering University of Toronto, Canada
3. Betonghandboken, Material, utgåva 2 (1994), Svensk Byggtjänst, Stockholm
4. Bradley G, Howarth I M. (1986). Action and rate to cement hydration. Cement Concrete Aggregates. pp 68-75
5. Brantberger & Nelson, (1998) Hallandsås Ridge Railway Tunnels- Development of pre-grouting methology, proc. Underground Constructions in Modern Infrastructure, Stockholm, Sweden, (Franzé, Bergdahl & Nordmark eds.), Balkema, Rotterdam, ISBN 90 5410 964 5.
6. Brandberger M, Dahlmalm T, Eriksson M, Stille H (1998) Styrande faktorer för täthet kring en förinjekterad tunnel, Division of Soil and Rock Mechanics, Department of Civil and Environmental Engineering, Royal Institute of Technology, Stockholm, Sweden.
7. Cumberland D.J., Crawford R.J. Handbook of powder technology, Volume 6, The Packing of particles, , Elsevier, 1985.
8. Dalmalm, T., (2001), Grouting Prediction Systems for Hard Rock- based on active design. Lic. Thesis, Division of Soil and Rock Mechanics, Department of Civil and Environmental Engineering, Royal Institute of Technology, Stockholm, Sweden.
9. De Paoli, B Bosco, B Granata and Bruce D.A, (1992). Fundamental observations on cement based grouts, Proc. ASCE Conferance, Grouting Soil Improvement and Geosynthetics, New Orleans, L.A, Feb. 25-28, 2 Volumes, pp. 474-485.
10. Eklund D, (2000), Reologisk mätmetodik för injekteringsbruk, Vattenfall Utveckling AB, Älvkarleby.
11. Eklund D (2000 b), Försök med modifierad mätgeometri, Vattenfall Utveckling AB, Älvkarleby.

62
12. Eklund, D., Alemo, J.,(2001). Penetration Ability of Cementitous Grouts. Proc.
to the 4´th Nordic Rock Grouting Symposium, Sweden Rock Engineering Research (SveBeFo), Stockholm, Sweden. pp 41-50. ISSN 1104-1773.
13. Eriksson, M, Stille, H (2002a), A Method for measuring and evaluating the penetrability of grouts, Royal Institute of Technology, Stockholm, Sweden.
14. Eriksson, M, (2002) Prediction of grout spread and sealing effect, a
probabilistic approach, Doctoral Thesis, Royal Institute of Technology, Stockholm, Sweden.
15. Eriksson, M. (1999). Model for Prediction of Grouting Results- Spreading Sealing Efficiency and Inflow. Lic. Thesis, Division of Soil and Rock Mechanics, Department of Civil and Environmental Engineering, Royal Institute of Technology, Stockholm, Sweden.
16. Ferraris C F, Gaidis J M. (1992) Connection between the Rheology of Concrete and Rheology of Cement Paste. ACI Materials Journal., vol 88, no 4, pp 388-393.
17. Fransson Å (2001) Grouting Predictions Based on Hydraulic Tests of Short Duration, PhD thesis, Department of Geology, Chalmers university of technology, Göteborg, Sweden.
18. Gu Ping, Xie Ping, (1994) Beaudoin JJ, Jolicoeur C. Investigation of the retarding effect of superplasticizers on cementhydration by impedance spectroscopy and other methods. Cement and Concrete Research. v 24 n 3, pp 433-442
19. Hansson P, Eklund D, (2001) Filtreringsstabilitet –State of the art, Vattenfall Utveckling AB, Älvkarleby.
20. Hansson P, (2000) Ny proportioneringsmetodik för betong, Vattenfall Utveckling AB, Älvkarleby.
21. Hansson P. (1997). Cementbaserade injekteringsmedels inträngningsförmåga – mätning och modellering. Nordiskt symposium i berginjektering, 1998, Finland.
22. Hansson P. (1996). Filtration Stability of Cementitious Injection Grouts with Low W/C-Ratio. Conference paper of " Concrete in the Service of Mankind - Concrete Repair, Rehabilitation and Protection" Dundee, Scotland. pp 303-311.
23. Hansson P, (1995) Provningsmetoder för cementbaserade injekteringsmedel och deras användning, Vattenfall Utveckling AB, proc. of Vann og frostsikring av trafiktunneler- Injektion og kledning, Trondheim.
63
24. Hansson P. (1994). Cementinjektering- Handbok för injekterare, Elforsk rapport 94:12, Sweden
25. Houlsby A.C (1990). Construction and design of cement grouting, John Wiley and Sons, Inc.
26. Håkansson U. (1993). Rheology of Fresh Cement-Based Grouts. Ph D Thesis, Dept. Of Soil and Rock Mechanics, Royal Institute of Technology, Stockholm
27. Hässler, L. (1991). Grouting of Rock- Simulation and Classification. Ph D Thesis, Dept. Of Soil and Rock Mechanics, Royal Institute of Technology, Stockholm
28. International Federation of Societies of Cosmetic Chemists (1997), IFFSCC, Monograph Number 3, An Introduction to Rheology, Weymouth, England
29. Lohmander, S (2000), The influence of Particle Shape of Coating Pigments on their Packing Ability and on the Flow Properties of Coating Colours, Ph D Thesis, Dept. Of Pulp and Chemistry and Technology, Royal Institute of Technology, Stockholm
30. Marinet P (1998), Flow and clogging mechanisms in porous media with application to dams, Doctoral Thesis, Royal Institute of Technology, Stockholm, Sweden.
31. Mezger, T, (2000), Proc. Rheo-Workshop 2000, Paar Physica, Stuttgart, Germany.
32. Mitchell J, (1970) In-place treatment of foundation soils. Proc. ASCE Jour. of SMFE, paper 7035, pp 117- 152
33. Mork, J H (1994), Effekt av sementens forhold mellom gips og hemihydrat på den ferske betongens reologi, Dr.Ing. Avhandling 1994:04, Norges Tekniska Högskole, Trondheim, Norge.
34. Nguyen Q.D (1986), Measuring the flow properties of yield stress fluids, Department of Chemical Engineering, the University of Adelaide, Adelaide, South Australia 5001, Australia.
35. Nonveiller E (1989), Grouting Theory and Practice, Elsevier Science Publishers B.V, ISBN 0-444-87400-3, Amsterdam, Netherlands.
36. Palmqvist K (1983), Tätning av bergtunnlar –Injekteringsutförande och resultat, BeFo 66:1/83, Sweden

64
37. Pettersson S Å, Molin H (1999) Grouting & Drilling for grouting, Atlas Copco
Craelius AB, Sweden.
38. Shaw D J (1980). Introduction to Colloid and Surface Chemistry. Third Edition. Butterworth-Heinemann Ltd..
39. Schwarz, L.G., (1997), Roles of rheology and chemical filtration on injectability of microfine cement grouts, Doctoral Thesis, Northwestern University, Evanstone, Illinois, UMI number 9814310.
40. Stille H, (2001). Grouting- Research work and practical application, Proc. “4 th. Rock grouting symposium”, Stockholm, Sweden, 2001
41. Taylor H.F.W, (1990). Cement Chemistry, Academic Press, ISBN 0-12-683900-X, Great Britain.
42. VAST (Kraftverksföreningens Utvecklingsstiftelse) (1991) Betong i vattenkraftsanläggningar, Stockholm, Sweden.
43. Vovk A I, Osenkova N N, Usherov Marshak A -V, Falikman V R. (1989).
Kinetics of the evolution of heat and structure-making during hydration of 3CaO·SiO2 in the presence of polymethylenepolynaphthalenesulfonates. Colloid J USSR., pp 492-495.
44. Yang M, Neubauer C M, Jennings H M. (1997). Interparticle Potential and Sedimentation Behaviour of Cement Suspensions. Advanced Cement Based Materials 1997;5:1-7. pp 1-6