penang second bridge - jambatan keduajambatankedua.com.my/webv1/images/stories/isdc2012/tp10.pdf ·...
TRANSCRIPT

Penang Second Bridge
Marine Bridge Substructure Construction Spun Pile Main Span Pilecap Construction by
Ir. Cheng Kim Bong
Senior Resident Engineer MMSB Consult Sdn. Bhd.

Content • Penang Second Bridge Alignment
• Type Of Piles
• Summary of Piles
• Pile Testing Locations
• Pile Testing of Spun Pile, Steel Pile & Bored Pile
Spun Pile • Spun Pile Detail
• Spun Pile Length
• Spun Pile PDA Test
• Spun Pile Test For BHT11 (P163)
• Mobilization Factor of Spun Pile
• Pile Head Damage Analysis
• Validation of Spun Pile
Main Span Pilecap Construction

Penang Second Bridge
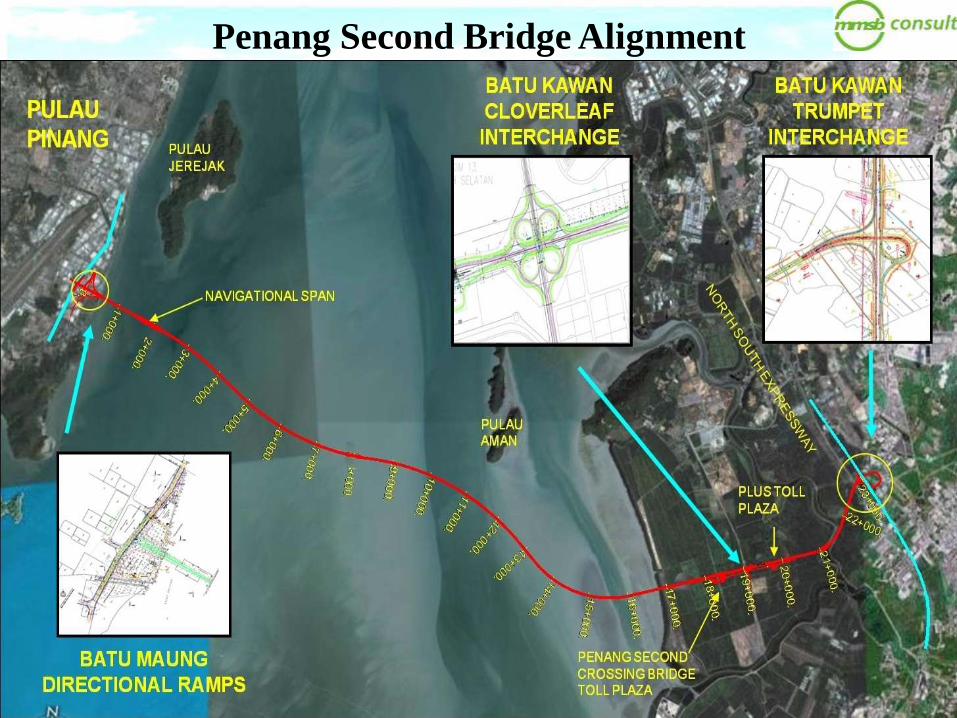
Penang Second Bridge Alignment

Type Of Piles
P292 P000 P023 P024 P027 P028 P144 P145
P0-P11 : Spun Pile
P12-P23 : Steel Pile
P24-P27 :
Bored Pile
P28-P43 : Steel Pile
P44-P144 : Spun Pile
P145-P282 : Spun Pile
P283-P292 : Bored Pile
Approach Span Main Span Approach Span Approach Span
Batu Maung Batu Kawan
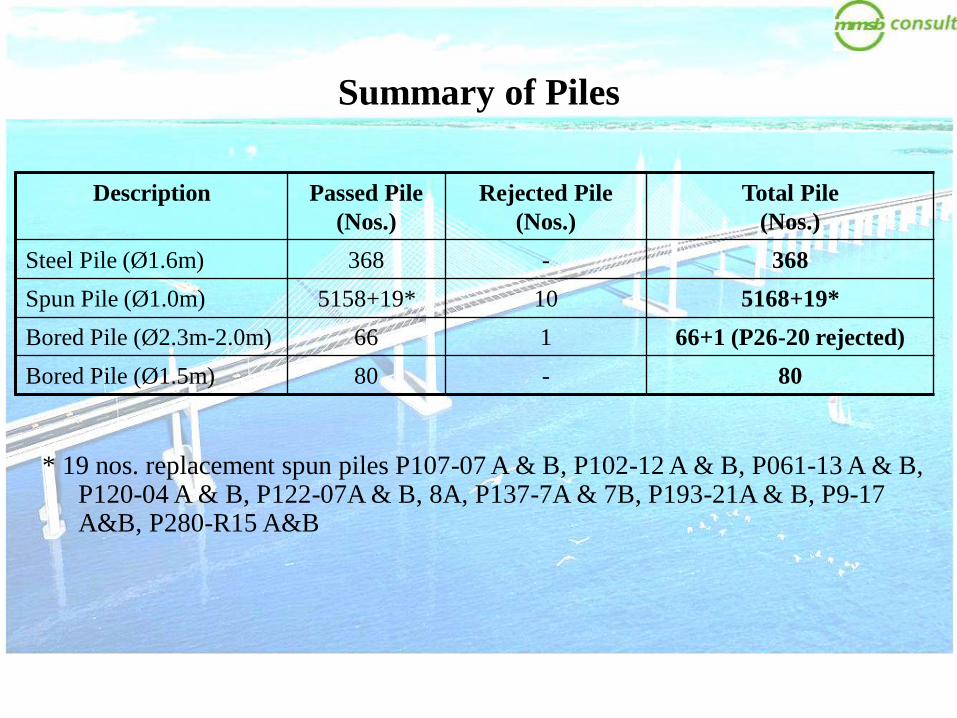
Summary of Piles
Description Passed Pile
(Nos.)
Rejected Pile
(Nos.)
Total Pile
(Nos.)
Steel Pile (Ø1.6m) 368 - 368
Spun Pile (Ø1.0m) 5158+19* 10 5168+19*
Bored Pile (Ø2.3m-2.0m) 66 1 66+1 (P26-20 rejected)
Bored Pile (Ø1.5m) 80 - 80
* 19 nos. replacement spun piles P107-07 A & B, P102-12 A & B, P061-13 A & B, P120-04 A & B, P122-07A & B, 8A, P137-7A & 7B, P193-21A & B, P9-17 A&B, P280-R15 A&B
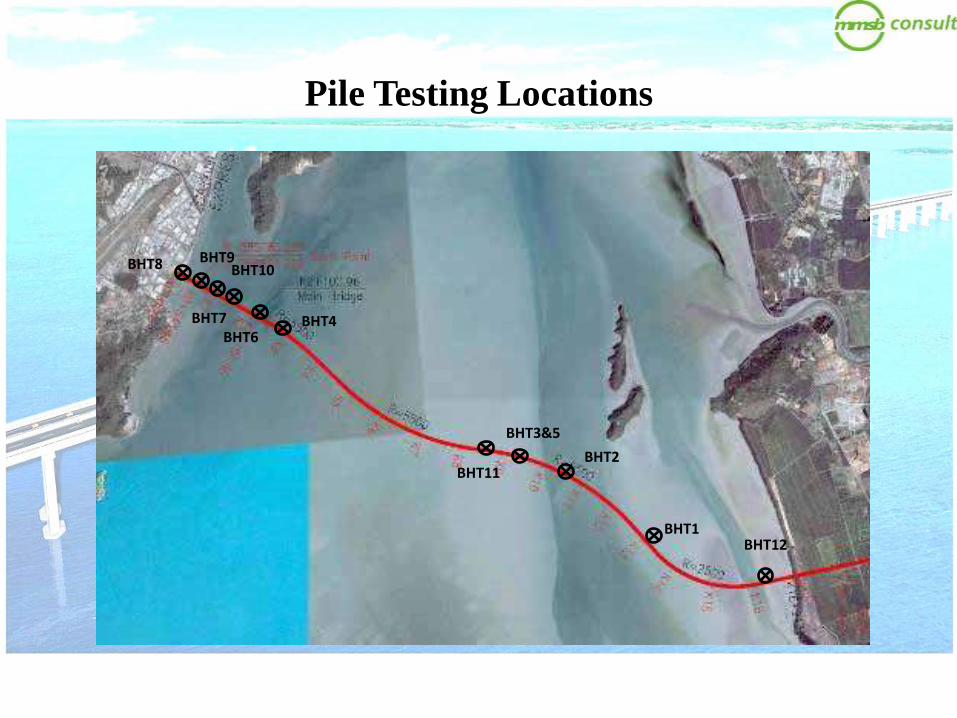
BHT7 BHT6
BHT4
BHT3&5
BHT2
BHT1
BHT9 BHT10 BHT8
BHT11
BHT12
Pile Testing Locations
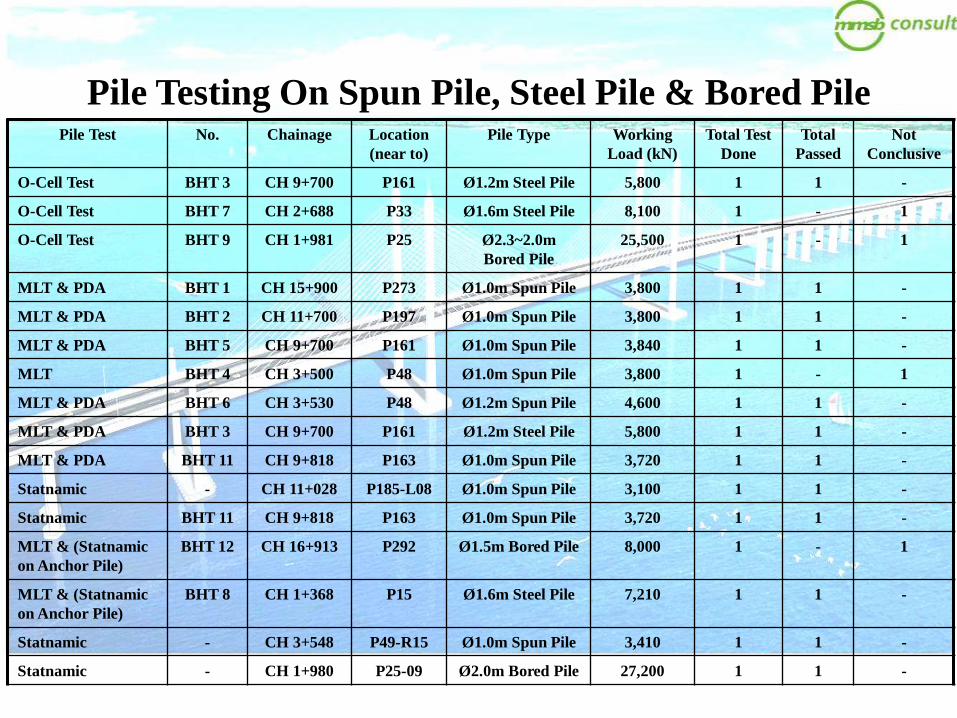
Pile Test No. Chainage Location
(near to)
Pile Type Working
Load (kN)
Total Test
Done
Total
Passed
Not
Conclusive
O-Cell Test BHT 3 CH 9+700 P161 Ø1.2m Steel Pile 5,800 1 1 -
O-Cell Test BHT 7 CH 2+688 P33 Ø1.6m Steel Pile 8,100 1 - 1
O-Cell Test BHT 9 CH 1+981 P25 Ø2.3~2.0m
Bored Pile
25,500 1 - 1
MLT & PDA BHT 1 CH 15+900 P273 Ø1.0m Spun Pile 3,800 1 1 -
MLT & PDA BHT 2 CH 11+700 P197 Ø1.0m Spun Pile 3,800 1 1 -
MLT & PDA BHT 5 CH 9+700 P161 Ø1.0m Spun Pile 3,840 1 1 -
MLT BHT 4 CH 3+500 P48 Ø1.0m Spun Pile 3,800 1 - 1
MLT & PDA BHT 6 CH 3+530 P48 Ø1.2m Spun Pile 4,600 1 1 -
MLT & PDA BHT 3 CH 9+700 P161 Ø1.2m Steel Pile 5,800 1 1 -
MLT & PDA BHT 11 CH 9+818 P163 Ø1.0m Spun Pile 3,720 1 1 -
Statnamic - CH 11+028 P185-L08 Ø1.0m Spun Pile 3,100 1 1 -
Statnamic BHT 11 CH 9+818 P163 Ø1.0m Spun Pile 3,720 1 1 -
MLT & (Statnamic
on Anchor Pile)
BHT 12 CH 16+913 P292 Ø1.5m Bored Pile 8,000 1 - 1
MLT & (Statnamic
on Anchor Pile)
BHT 8 CH 1+368 P15 Ø1.6m Steel Pile 7,210 1 1 -
Statnamic - CH 3+548 P49-R15 Ø1.0m Spun Pile 3,410 1 1 -
Statnamic - CH 1+980 P25-09 Ø2.0m Bored Pile 27,200 1 1 -
Pile Testing On Spun Pile, Steel Pile & Bored Pile

SPUN PILE

Spun Pile Detail
ICP Spun Pile Sectional Details
SEE DETAIL “X”
Revised pile shoe detail as per next slide

Spun Pile Detail
Pile Shoe Details
DETAILS OF PILESHOE

Spun Pile Detail
Extension Joint

Spun Pile Detail
Extension Joint

Spun Pile Detail
4 Lifting Points of Spun Pile
L1 L2 L3 L4 L5
L
L= Pile Length L1 = 0.05L L2 = 0.28L L3 = 0.31L L4 = 0.23L L5 = 0.13L * Average Pile Length is about 58.5m

Spun Pile Length
Design Pile Length vs Actual Pile Length
Difference Between Design Pile Length & Actual
Pile Length
Description Total Pile
(Nos.)
0 to 2m 2 to 5m > 5m
Spun Pile
(Ø1.0m)
5187 4744 (92%) 329 (6%) 114 (2%)
Average Design Length = 58.67m
Average Nett Length = 57.28m
Average Cut-off Length = 1.38m (2.4%)
Spun Pile Length
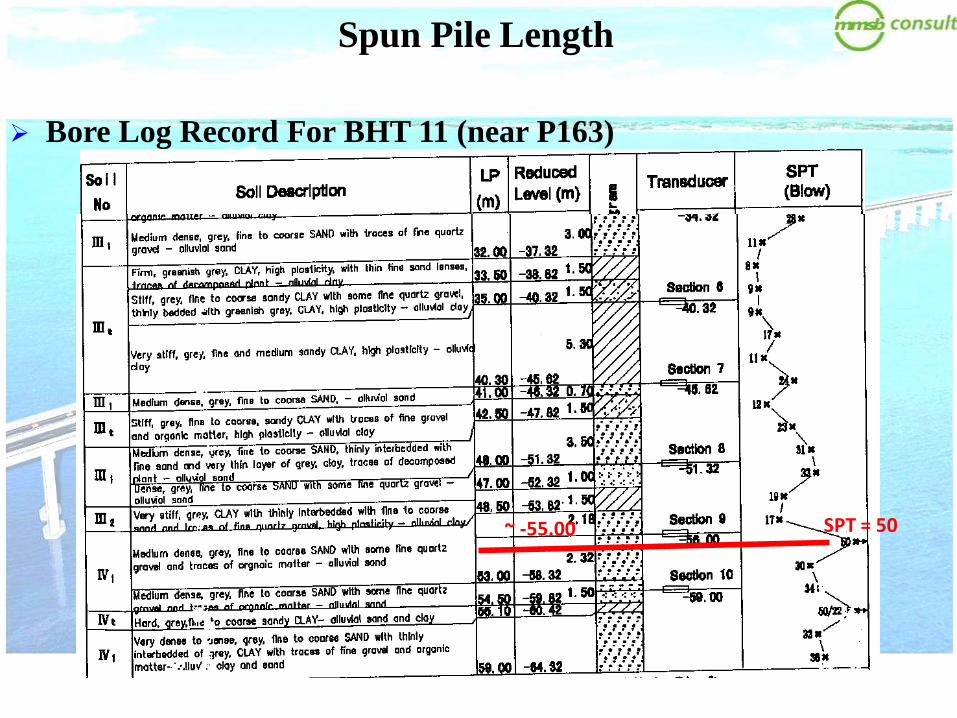
Bore Log Record For BHT 11 (near P163)
SPT = 50 ~ -55.00

Spun Pile Length
Design Pile Length vs Actual Pile Length
Pier Design Pile
Length (m)
Design Toe
Level (m)
Actual Toe
Level (m)
Differences
P161 59 -57.62 to -58.42 -56.14 to -57.02 <2m
P162 58 -56.63 to -57.42 -55.13 to -55.95 <2m
P163 56 -54.66 to -55.42 -53.20 to -54.49 <2m
P164 55 -53.67 to -54.42 -52.17 to -52.97 <2m
P165 53 -51.70 to -52.42 -49.71 to -51.09 <2m
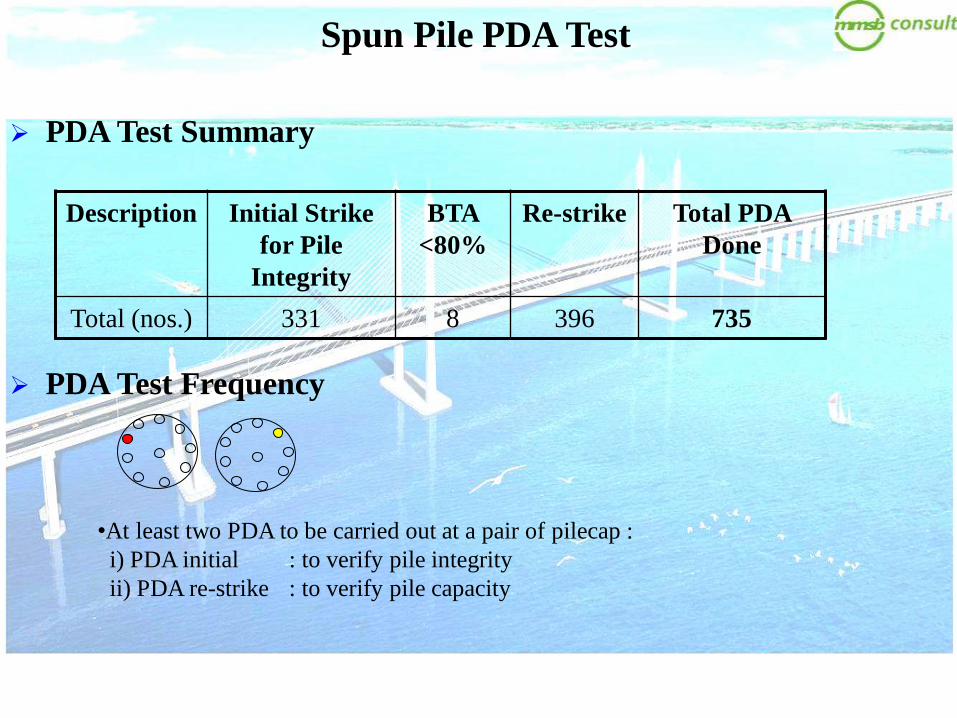
Spun Pile PDA Test
PDA Test Summary
Description Initial Strike
for Pile
Integrity
BTA
<80%
Re-strike Total PDA
Done
Total (nos.) 331 8 396 735
•At least two PDA to be carried out at a pair of pilecap :
i) PDA initial : to verify pile integrity
ii) PDA re-strike : to verify pile capacity
PDA Test Frequency

Spun Pile Test For BHT11 (P163)
Objective Of Pile Load Test
• To determine the pile ultimate bearing capacity
• To determine the pile ultimate resistance at pile base
• To determine pile shaft skin friction parameter at each soil layer
• To determine correlation between Static Load Test, PDA & Statnamic
• To provide the basis for the revision of pile final set criteria
• To provide parameters for verification or modification basis for working pile
PDA analysis
• To obtain Load vs Settlement relationship


BHT 11 (P 163) Setting Up
Test Pile, S2 Reference Pile,
J2-2
Reference Pile,
J2-1
Anchor Pile,
M2-3 Anchor Pile,
M2-4
Anchor Pile,
M2-2
Anchor Pile,
M2-1
4m 4m
4m
4m
Pile Spun Pile Pile
Length
Design Toe
Level
Actual Toe
Level
M2-1 Ø1000mm 59m -57.0 -56.98
M2-2 Ø1000mm 59m -56.0 -56.00
M2-3 Ø1000mm 59m -56.0 -55.97
M2-4 Ø1000mm 59m -56.0 -55.95
J2-1 Ø1000mm 50m -46.5 -46.43
J2-2 Ø1000mm 50m -46.5 -46.41
S2 Ø1000mm 61m -57.0 -56.88
* Working load = 3720kN
Spun Pile Test For BHT11 (P163)

Spun Pile Test For BHT11 (P163)
Anchor Pile, M2-1
PDA (EOD)
Statnamic
w/o instrumentation
Test Pile, S2
PDA (EOD)
PDA (Restrike)
Min. 7 days after pile installation
Min. 28 days after pile installation
MLT
Min. 15 days after MLT
Statnamic
BHT 11 (P 163) Testing Process

Spun Pile Test For BHT11 (P163)
Comparison of Static 2nd Cycle Static and Statnamic Load Test Results

Spun Pile Test For BHT11 (P163)
Comparison of Static 2nd Cycle Nett Static and Statnamic Load Test Results

Spun Pile Test For BHT11 (P163)
Comparison of Static and Statnamic Load Test Displacement
Table 1 : Comparison of Static & Statnamic Load Test Displacement
Table 2 : Comparison of 2nd Cycle Nett Static & Statnamic Load Test Displacement
• From Table 1, settlement recorded from Statnamic test for M2-1 at 2.0 WL is 5.14mm less than
Static test for S2
• From Table 2, settlement recorded from Statnamic test for M2-1 at 2.0 WL is 2.38mm less than
Static test for S2

Spun Pile Test For BHT11 (P163)
Summary – Comparison Between Statnamic & Static Load Test

Spun Pile Test For BHT11 (P163)
Comparison Between PDA & Static Load Test
Test
Pile
Pile
Length
(m)
Penetrated
Length
(m)
Set
(mm)
Ultimate
Capacity of
MLT(kN)
Initial
PDA
(kN)
Restrike
PDA
(kN)
Restrike /
Initial
MLT / PDA
Initial
S2 64 54.68 5.9 > 11,160 5150 10,800 2.10 >2.17
• It can be observed the analytical results of PDA test are accurate verified by BHT11’s MLT
test result and can be concluded that the PDA test procedures are in order.
- Summary – Comparison Between PDA & Static Load Test

Mobilization Factor of Spun Pile
M-Factor of Spun Pile Using PDA
• Major objective of PDA restrike test is to verify the pile capacity to satisfy the required
design capacity (2.5 times of working load)
• In order to verify the capacity of piles which no restrike test but only end of drive test
(EOD) was performed, recommended mobilization factor is proposed based on :
i) pile embedment
ii) pile toe founding layer
iii) total number of blow
• Mobilization factor of bearing capacity of a given pile can be obtained by dividing restrike
test capacity (Q2) by EOD test capacity (Q1)

Mobilization Factor of Spun Pile
M-Factor vs Pile Embedment
0
0.5
1
1.5
2
2.5
3
40 45 50 55 60
Relationship Diagram Between Pile Embedment & Mobilization
Factor
LP (m)
Mob
iliz
ati
on
Fact
or

Mobilization Factor of Spun Pile
M-Factor vs Blow Count
0
0.5
1
1.5
2
2.5
3
0 1000 2000 3000 4000 5000
Relationship Diagram Between Blow Count & Mobilization Factor
Blow Count
Mob
iliz
ati
on
Fact
or

Mobilization Factor of Spun Pile
Mobilization vs Set
0
0.5
1
1.5
2
2.5
3
0 2 4 6 8 10 12 14
Relationship Diagram Between SET & Mobilization Factor
SET (mm)
Mob
iliz
ati
on
Fact
or

Mobilization Factor of Spun Pile
Mobilization vs Period
0
0.5
1
1.5
2
2.5
3
0 5 10 15
Relationship Diagram Between Period & Mobilization Factor
Period (Day)
Mob
iliz
ati
on
Fact
or

Mobilization Factor of Spun Pile
Recommended M-Factor of Spun Pile Using PDA
Conservative Considering
•According to the statistical result of comparison between M-factor and pile embedment,
final set and period, it is found that the effect of EOD set to M-factor is most dominant and
relatively obvious among the three factors considered.
• 98% of the restriked piles have penetration of 0.0mm. It is understood that most piles did
not achieve its maximum capacity during restrike test due to limited energy.
• From the data collected from tested working piles, the average M-factor is 1.77. On the
other hand, the M-factor for BHT 11 test pile is 2.17.
• Therefore, M-factor of 1.77 to 2.00 is a conservative engineering selection.
Recommended M-Factor
• Based on the abovementioned analysis and statistics, it is recommended to use M-factor
of 1.7 for spun pile.

Pile Head Damage Analysis
Pile Head Damage Cases vs Month
0123456789
1011121314
May
09
June
09
July
09
Aug
09
Sep
09
Oct
09
Nov
09
Dec
09
Jan
10
Feb
10
Mar
10
Apr
10
May
10
June
10
July
10
Aug
10
Sep
10
Oct
10
Nov
10
Dec
10
Jan
11
Feb
11
Mar
11
Apr
11
May
11
June
11
July
11
Aug
11
Sep
11
Pile Head
Damage Cases
Total cases = 55
Case
s
Month

Pile Head Damage Analysis
% Pile Head Damage vs Monthly Progress
0%
1%
2%
3%
4%
5%
6%
7%
8%
220
90
225
94
112
73
145
169
185
226
327
247
270
208
209
195
252
256
68
175
148
156
160
244
279
177
125
150 2
% P
ile H
ead
Dam
ag
e
Monthly Progress (nos.)
May
09
June
09
July
09
Aug
09
Sep
09
Oct
09
Nov
09
Dec
09
Jan
10
Feb
10
May
10
Apr
10
Mar
10
July
10
June
10
Aug
10
Sep
10
Oct
10
Nov
10
Dec
10
Jan
11
Feb
11
Mar
11
Apr
11
May
11
June
11
July
11
Aug
11
Sep
11

Pile Head Damage Analysis
% Pile Head Damage vs Cumulative Piles Driven
0.00%
0.23%
0.46%
0.68%
0.91%
1.14%
1.37%
1.59%220
310
535
629
741
814
959
1128
1313
1539
1866
2113
2383
2591
2800
2995
3247
3503
3571
3746
3894
4050
4210
4454
4733
4910
5035
5185
5187
% P
ile H
ead
Dam
ag
e
Cumulative Piles Driven (nos.)
May
09
June
09
July
09
Aug
09
Sep
09
Oct
09
Nov
09
Dec
09
Jan
10
Feb
10
May
10
Apr
10
Mar
10
July
10
June
10
Aug
10
Sep
10
Oct
10
Nov
10
Dec
10
Jan
11
Feb
11
Mar
11
Apr
11
May
11
June
11
July
11
Aug
11
Sep
11

List of Preventive Actions
No Actions Taken Remarks
1 QC on standard operating procedure
with introduction of additional
checklist (Spun pile production)
•Mould inspection
•Concrete feeding process
•Spinning process
•Steam curing
•Staking yard
•More frequent checking on raw material
•Concrete cubes & cores strength
•Calibration certificates
2 QC on standard operating procedure
(Piling Operation)
•To replace hammer cushion once worn out
•Provide sufficient cushion materials
•Ensure hammer hits pile evenly and axially
•Reduce pile driving stresses by controlling hammer drop
height during hard driving
3 Factory visit, inspection and QAQC
procedure auditing at ICP factory
Pile Head Damage Analysis

– Other Stringent QAQC Measures
Pile Head Damage Analysis
• Production data for each produced pile is recorded in In-process checklist.
• 2 hours waiting time was set aside for pile which has undergone spinning
process. On top of that, 8 hours of steam curing time is above the usual practice
of 5 hours.
• Audit to supplier raw material suppliers (sand, aggregate) was conducted on a
regular basis to ensure the conformity of material supplied.
• The allowable gap between end plates is only 2mm, which is much more
stringent than 5mm tolerance stated in MS1314: Part4:2004.
• Monthly inspection from CHEC & MMSB to ensure all piles produced to the
highest standard as stipulated in the Technical Requirements for Spun Pile.

Other Stringent QAQC Measures
Pile Head Damage Analysis
Welding facilities at ICP factory enable
us to overcome constraints of on-site
welding and reduce the possibility of
pile damage, which usually associate
with on-site welding. MIG wire was
used to ensure top quality welding work
was performed.
The welding quality of jointed pile was
further inspected with the use of
Magnetic Particle Test.

Other Stringent QAQC Measures
Pile Head Damage Analysis
Support Support
Jack
Top Beam Of Jacking Frame
Test Pile
Dial Gauges
Pile Bending Test (MS1314 Part 2:2004)

Other Stringent QAQC Measures
Pile Head Damage Analysis
Pile Bending Test

List of Investigation Actions
No. Actions Taken Remarks
1 Thorough investigation involving ICP’s
R&D department
2 Additional tests been carried out •Petrographic examination
•X-ray diffraction (XRD)
3 Additional PDA tests been carried out •P160 (10 nos)
•P121-P123 (18 nos)
Pile Head Damage Analysis

Comments On Additional Test Results
•Raw material testing found comply to requirement
•Petrographic examination & XRD found satisfactory except
some air and water voids
•Additional PDA test results shown no pile integrity problem
Pile Head Damage Analysis

Carry out pile head strengthening work (with carbon fiber & ICP method)
PDA Test
Coring Test
Pile considered acceptable
PDA & coring test result found satisfactory
Pile Head Damage Analysis
Repair Method For Pile Head Damage

Validation of Spun Pile
Validation Process
Piling work done in accordance with :
- Approved construction drawing
- Set criteria
- HPDI revised pile length confirmation
- Shop drawing (if any changes)
Pile Driving Record
Pile Certification Report
-PDA test report
- PDAR if required
- SOR / NCR closure if any
Pile Cutting
Validation of Spun Pile
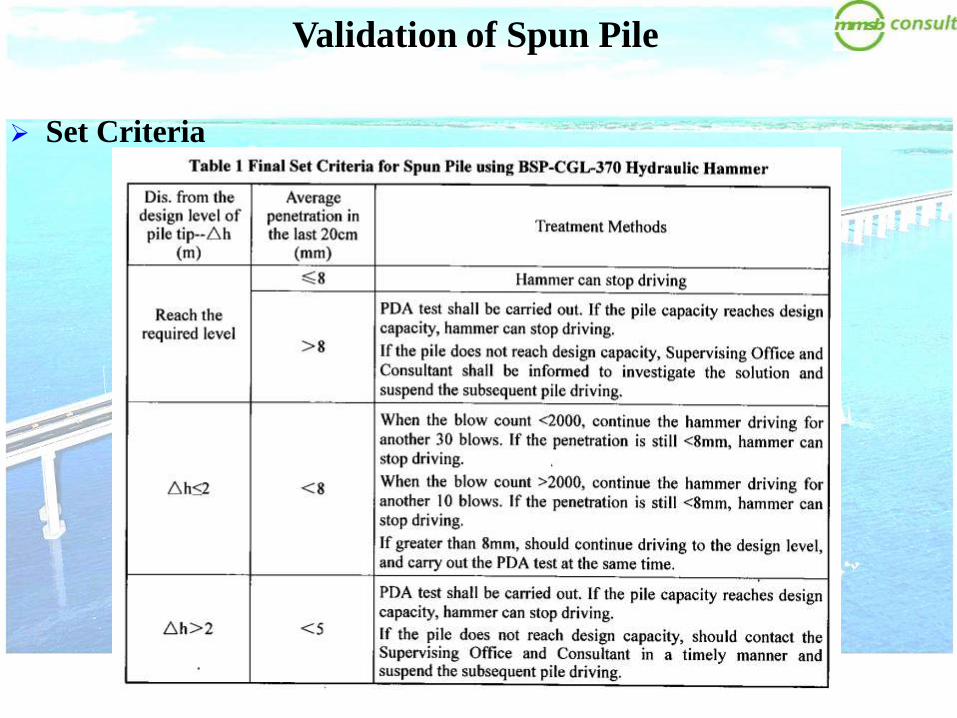
Set Criteria
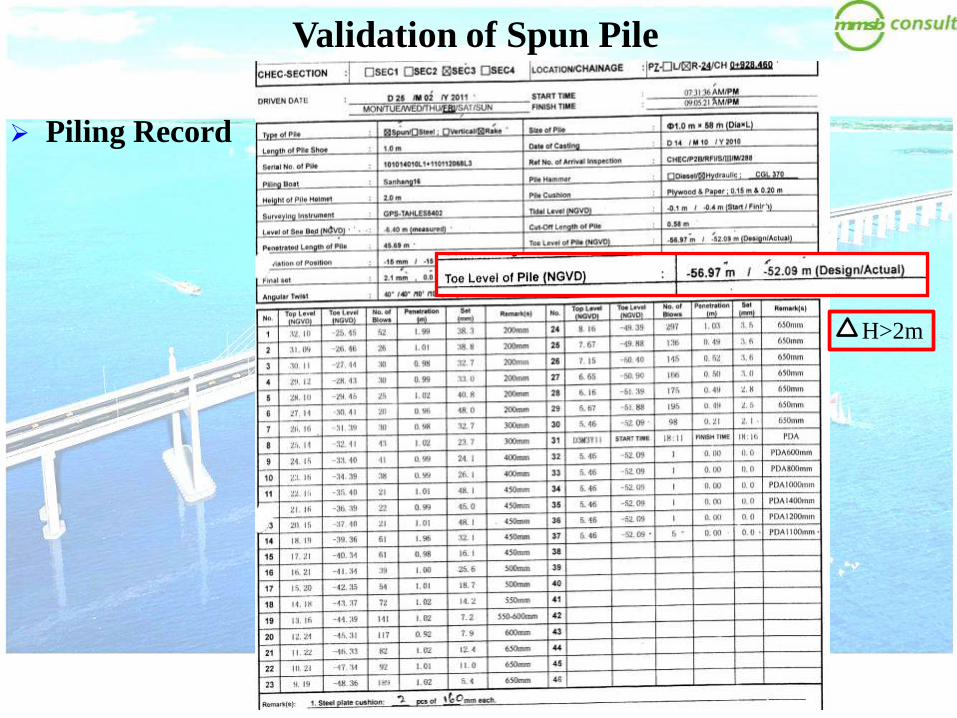
Validation of Spun Pile
Piling Record
H>2m

Validation of Spun Pile
PDA Result
> 80%
> 2.5 x WL

Validation of Spun Pile
Pile Driving Acceptance Record (PDAR)
• PDAR is required when the different between design toe level and actual toe level
> 2m.
• The pile is considered acceptable if :
- Pile capacity shown in PDA test > 2.5WL
- Pile integrity, BTA value in PDA test > 80%
BTA value classification:
i) 100 % : Uniform. No apparent anomaly was detected
ii) 80-99% : Minor anomaly. Relatively minor impedance reduction detected
iii) 60-79% : Moderate anomaly. Relatively moderate impedance reduction detected
iv) <60% : Major anomaly. Relatively major impedance reduction detected

Validation of Spun Pile
Pile Driving Acceptance Record (PDAR)

Validation of Spun Pile
Pile Certification Report

Pile Type Diameter
Average
Length
Number /
Pier
Economic
Rate
(m) (m) - -
PHC
Driven
Spun Pile
1.0 53m 10 1.00
Driven
Steel Pile
1.6 83m 6 2.87
Bored Pile 1.5 105m 4 3.62
Cost Comparison For Different Types Of Pile Foundation

Main Span
Pilecap Construction
Main Span Pilecap Construction
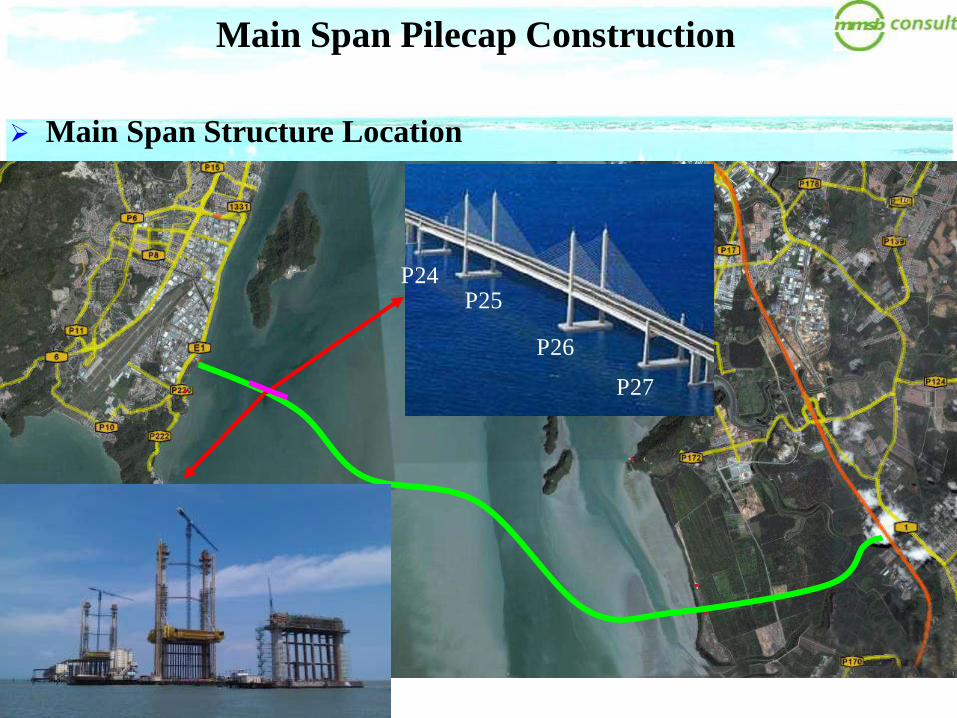
Main Span Structure Location
P24 P25
P26
P27

Main Navigation Span
Span Length
Navigation Channel
240 m
117.5 m
117.5 m
150 m
p24
p25
p26
p27
Navigation Channel

5m
30m
Main Navigation Span
Pylon Detail
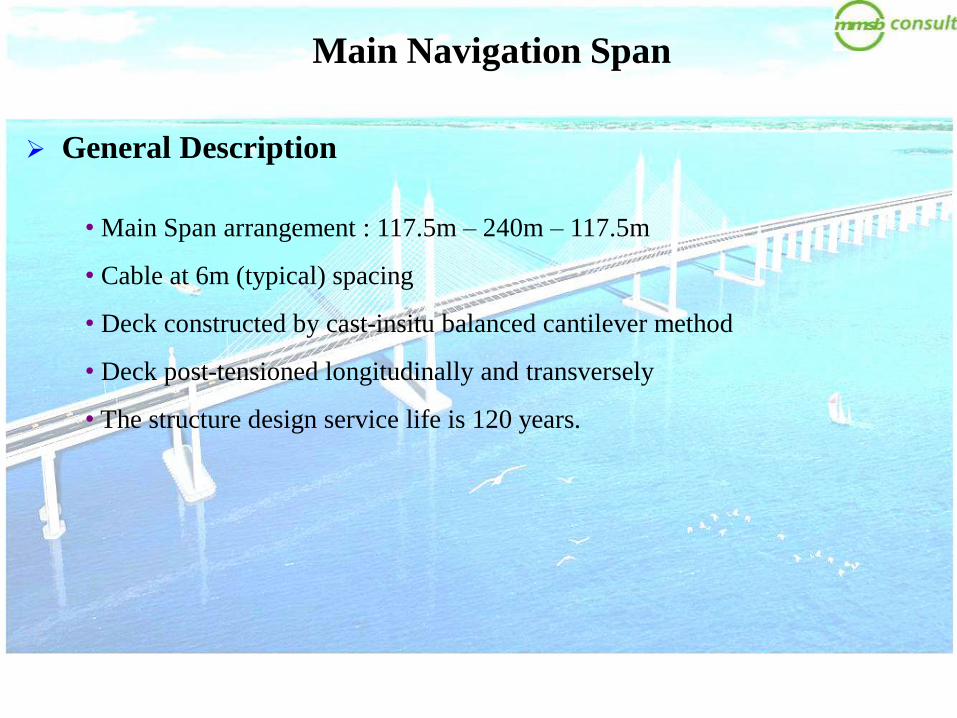
• Main Span arrangement : 117.5m – 240m – 117.5m
• Cable at 6m (typical) spacing
• Deck constructed by cast-insitu balanced cantilever method
• Deck post-tensioned longitudinally and transversely
• The structure design service life is 120 years.
Main Navigation Span
General Description

48.1m
17.5m
6m
Main Span Pilecap Construction
P25 & P26 Pilecap Layout

Main Span Pilecap Construction
P25 & P26 Steel Fender Layout
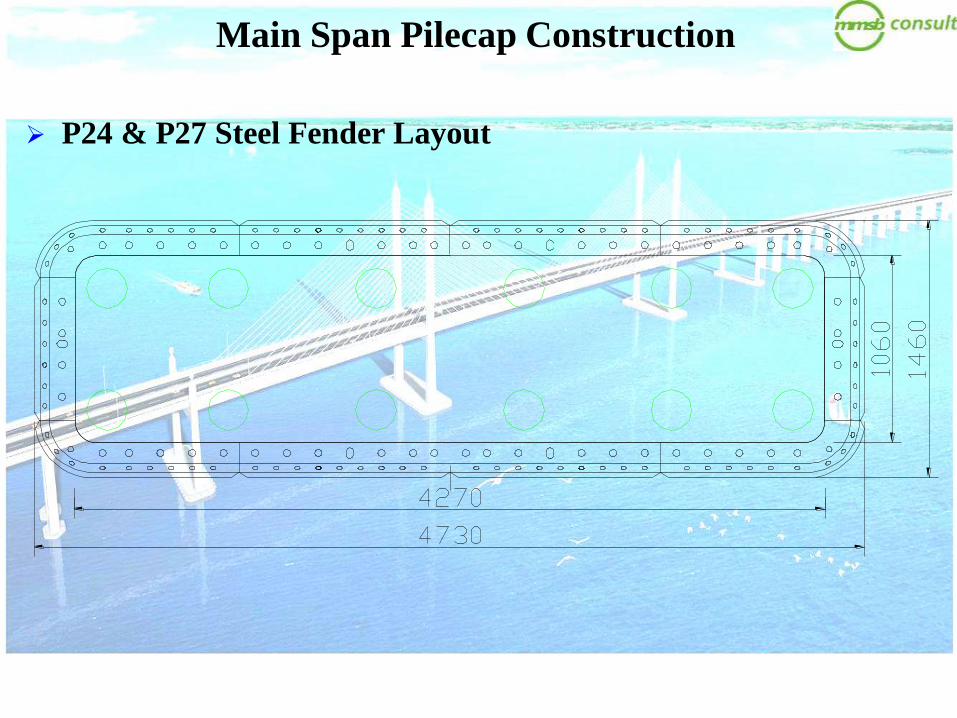
Main Span Pilecap Construction
P24 & P27 Steel Fender Layout
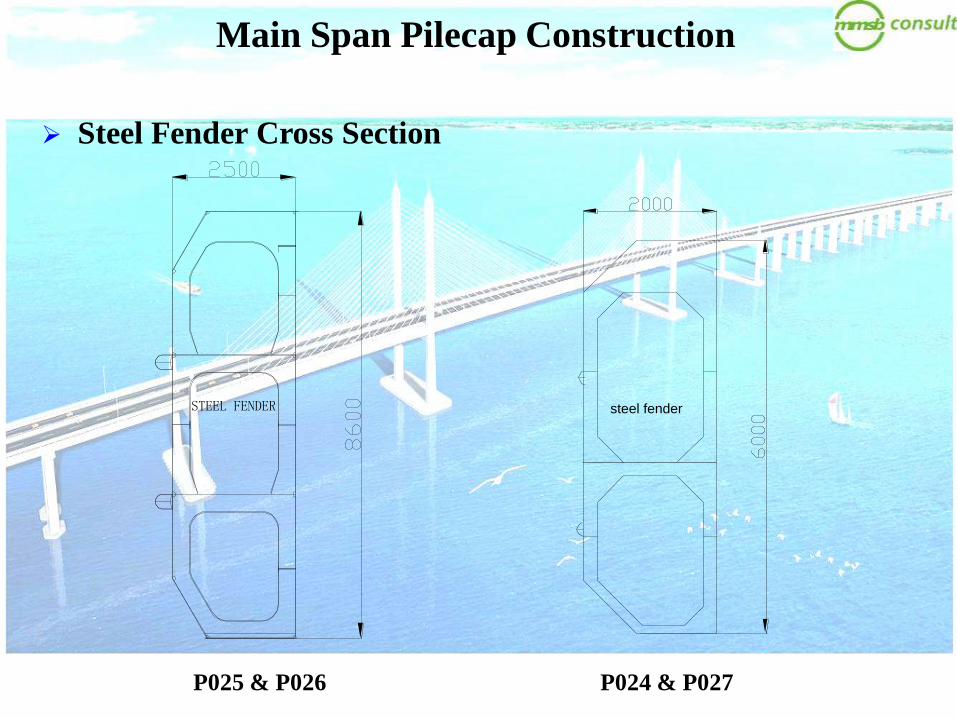
Main Span Pilecap Construction
Steel Fender Cross Section
STEEL FENDER steel fender
P024 & P027 P025 & P026
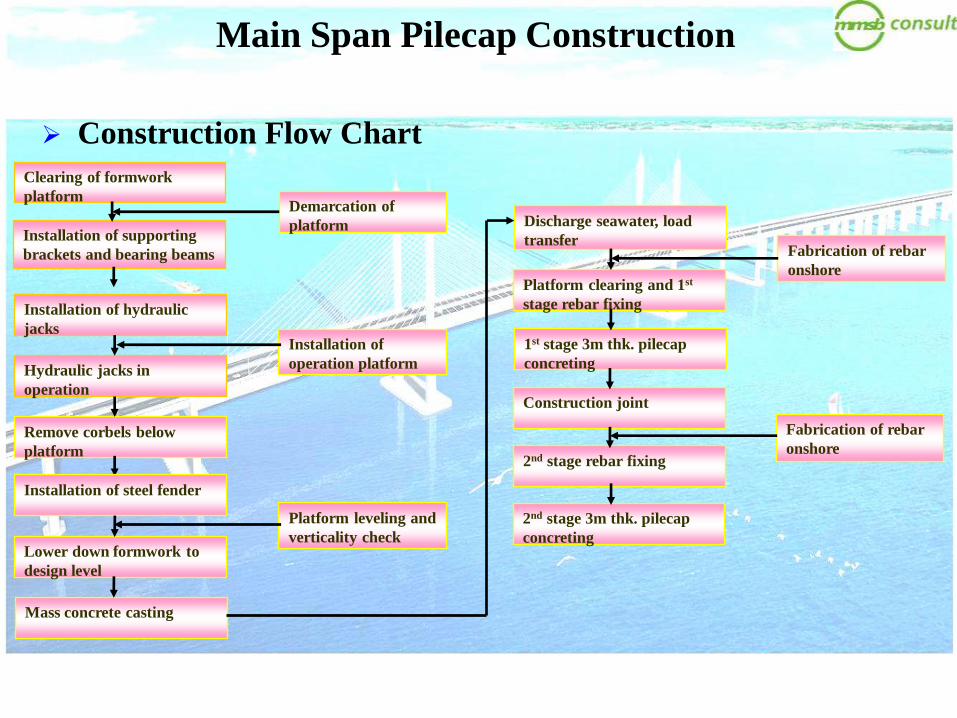
Remove corbels below
platform
Clearing of formwork
platform
Installation of steel fender
Lower down formwork to
design level
Mass concrete casting
Platform clearing and 1st
stage rebar fixing
Discharge seawater, load
transfer
1st stage 3m thk. pilecap
concreting
Construction joint
2nd stage rebar fixing
Fabrication of rebar
onshore
Fabrication of rebar
onshore
Installation of supporting
brackets and bearing beams
Hydraulic jacks in
operation
Installation of hydraulic
jacks
2nd stage 3m thk. pilecap
concreting
Demarcation of
platform
Installation of
operation platform
Platform leveling and
verticality check
Main Span Pilecap Construction
Construction Flow Chart

Main Span Pilecap Construction
Mechanism Of Lowering Down Steel Fender

Main Span Pilecap Construction
Mechanism Of Lowering Down Steel Fender

Main Span Pilecap Construction
Hydraulic Jack Arrangement
St eel caseSt eel case
Steel Casing Steel Casing

Main Span Pilecap Construction
Steel Fender Installation

Main Span Pilecap Construction
Lowering Mechanism Installation

Main Span Pilecap Construction
Steel Fender At Design Level

Main Span Pilecap Construction
Lean Concrete Casting

Main Span Pilecap Construction
Transferring Of Support System
The transferring of supporting system will be carried out after water is
pumped out from mass concrete and before proceeding for installation
of 1st layer pilecap reinforcement. +3.48m
-5.12m
-3.32m-3.32m
Corbels as loading transferring points of hanging rods
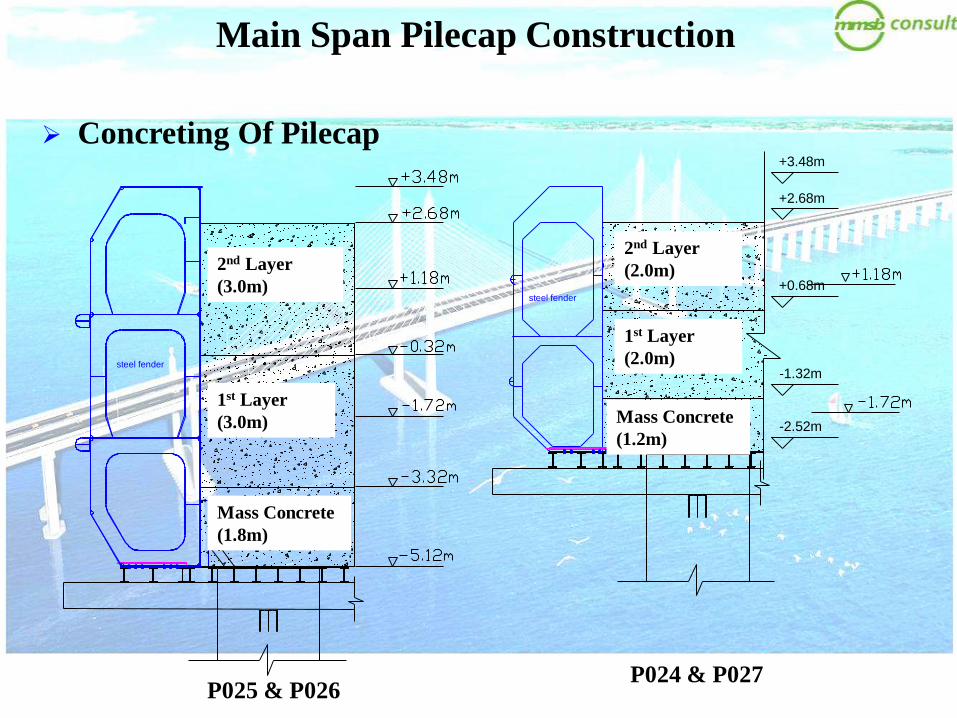
Main Span Pilecap Construction
Concreting Of Pilecap
P024 & P027 P025 & P026
steel fender
mass concrete(1.2m)
the first layer concrete ofthe pilecap(2.0m)
the second layer concreteof the pilecap(2.0m)
+2.68m
+3.48m
+0.68m
-1.32m
-2.52m
the second layer concreteof the pilecap(3.0m)
the second layer concreteof the pilecap(3.0m)
mass concrete(1.8m)
steel fender
Mass Concrete
(1.8m)
Mass Concrete
(1.2m)
1st Layer
(3.0m)
2nd Layer
(3.0m)
1st Layer
(2.0m)
2nd Layer
(2.0m)
Main Span Pilecap Construction
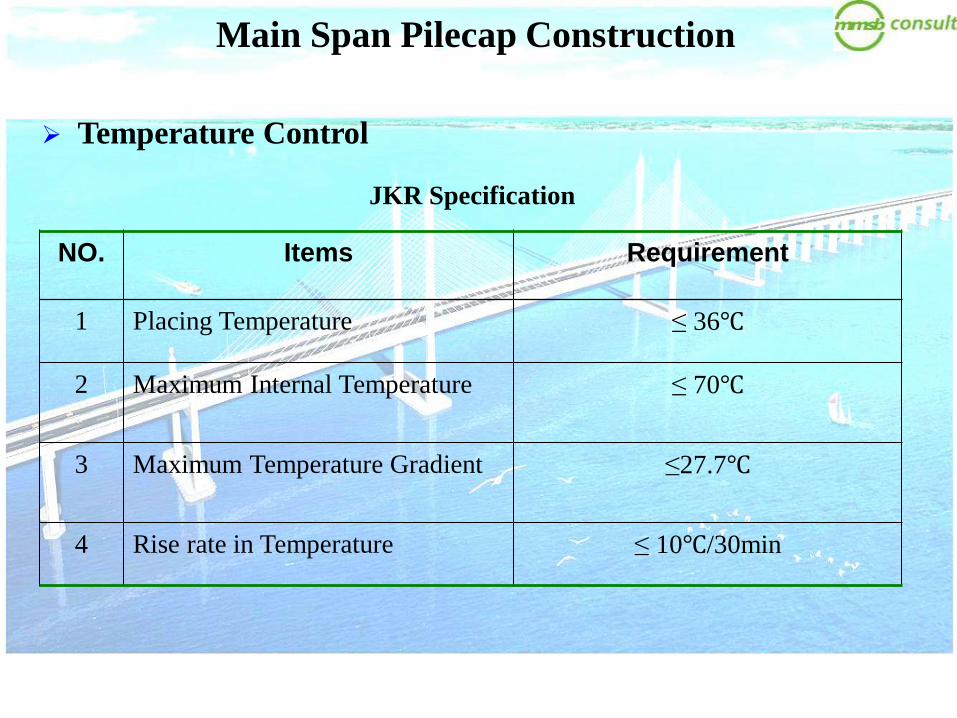
Temperature Control
NO. Items Requirement
1 Placing Temperature ≤ 36℃
2 Maximum Internal Temperature ≤ 70℃
3 Maximum Temperature Gradient ≤27.7℃
4 Rise rate in Temperature ≤ 10℃/30min
JKR Specification

Main Span Pilecap Construction
Temperature Control Measures
• Low heat cement (Portland Pulverised-Fuel Ash Cement) to be
used
• Additive like GGBS and silica fume are added to the design mix
to minimize the cement content
• Water cooling pipe with cycling of ice water and thermocoupler
to be embedded in the concrete

Main Span Pilecap Construction
Cooling Pipe System
Water boat
Thermocoupler
Cooling pipe

Main Span Pilecap Construction
Temperature Monitoring For P24 & P27

Main Span Pilecap Construction
Temperature Monitoring For P25 & P26

0
10
20
30
40
50
60
70
80
0 20 40 60 80 100 120 140 160 180
Time/h
Tem
pera
ture/℃
1 2 3 4 5 6 7 8 9 10 11 Ambient Tempt.
Peak Temperature
Main Span Pilecap Construction
Temperature Monitoring For P25 & P26

Thank You