pelikan holding ag financial statements · analysis, the us market stood firmly in the forefront....
TRANSCRIPT
01
Pelikan Holding AG
FinancialStatements

1
Report of the Board of Directors
Dreadful events shocked the world in
2001. On September 11, terrorists
attacked the USA in New York and
Washington and killed numerous inno-
cent victims. Also Switzerland was
affected as 14 persons were killed in
the parliament of Zug. These tragedies
have sincerely pained and moved us.
Many questions remain unanswered.
However, new questions are also
chances in a promising new future.
These unexpected tragedies, the
recessions in the major economies
and the related negative conse-
quences on the financial markets had
serious impacts on the worldwide
economy. These events have also
temporarily impacted our plans for a
further development of the PBS-
business.
The sales development in 2001 was
characterized by the uncertainties
in the global marketplace. Neverthe-
less, encompassing cost control and
product management measures
ensured that the operating result was
maintained at the prior year’s level.
The consolidated net result of the year
2001 shows again a profit.
Positive is the signing of a new
distribution co-operation agreement
for the US market as well as the first
positive successes in the joint-venture
QUADRIGA plus. However, we are
well aware that this is only a start that
has to be continued in the current
year.
The current program to improve our
structure and processes will be conti-
nued. In addition, we are also running
extensive cost reduction projects.
The economy shows signs of improve-
ments since September 11, 2001,
especially in the USA. We are there-
fore confident for the new business
year. It is our goal to achieve a much
better group result for the year 2002.
We would like to thank all our
employees and management for their
contribution in 2001.
On behalf of the Board of Directors
Loo Hooi Keat

3
Contents
1 Report of the Board of Directors
4 Key Figures
6 Management Report
13 Pelikan - a Brand Name unites the Generations
33 Pelikan GroupFinancial Statements 2001
34 Consolidated Balance Sheet as at December 31, 2001
36 Financial Structure as at December 31, 2001
37 Consolidated Profit and Loss Account for 2001
38 Consolidated Statement of Cash Flows for 2001
39 Notes to the Consolidated Financial Statements 2001
48 Movements in Fixed Assets
50 Group and Associated Companies
52 Report of the Group Auditors to the General Meeting
53 Pelikan Holding AG, BaarFinancial Statements 2001
54 Balance Sheet as at December 31, 2001
56 Profit and Loss Account for 2001
57 Notes to the Financial Statements 2001
59 Proposal of the Board of Directors for the Distributionof available Retained Earnings as at December 31, 2001
60 Report of the Statutory Auditors to the General Meeting
61 Institutions
62 Pelikan Companies

4
Key Figures
Pelikan Group Figures in CHF million
2001 2000 1999 1998 1997
Net sales 190,1 203,9 195,4 219,9 230,2
Result from operations 11,2 12,1 6,9 7,5 17,7Result before non-operating and extraordinary items 11,5 13,2 6,7 8,9 17,7
Result before taxation 3,7 0,5 1,7 2,3 16,3Net result for the year 1,2 -1,7 1,1 1,4 14,5Consolidated net result for the year 0,2 -3,0 0,2 0,4 13,7
Fixed assets 43,9 44,2 47,3 46,6 47,0Shareholders’ equity 19,5 18,0 18,2 10,1 16,5Long-term liabilities 105,2 110,0 115,4 114,4 121,9 *
Balance sheet total 169,3 177,2 183,9 187,8 217,3
Share of the balance sheet total in %Fixed assets 25,9% 24,9% 25,7% 24,8% 21,6%Shareholders’ equity 11,5% 10,2% 9,9% 5,4% 7,6%Long-term liabilities 62,2% 62,1% 62,8% 60,9% 56,1% *
Tangible and intangible assetsInvestments 7,4 5,6 4,5 17,5 8,2Depreciation 6,8 7,0 8,0 7,7 7,8
Number of employees 830 933 821 871 998Personnel expense 51,7 49,0 46,6 48,7 48,7
* Long-term liabilities including long-term portion of deferred income
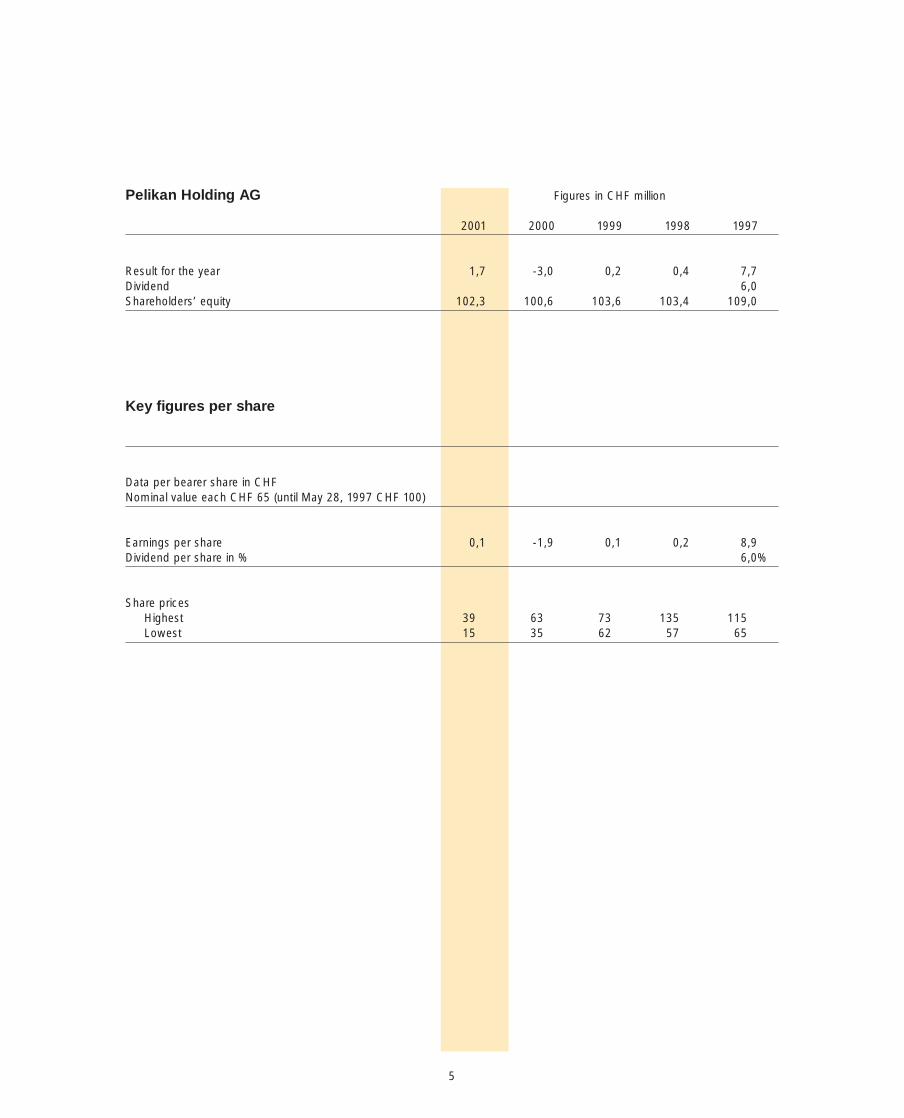
Pelikan Holding AG Figures in CHF million
2001 2000 1999 1998 1997
Result for the year 1,7 -3,0 0,2 0,4 7,7Dividend 6,0Shareholders’ equity 102,3 100,6 103,6 103,4 109,0
Key figures per share
Data per bearer share in CHFNominal value each CHF 65 (until May 28, 1997 CHF 100)
Earnings per share 0,1 -1,9 0,1 0,2 8,9Dividend per share in % 6,0%
Share pricesHighest 39 63 73 135 115Lowest 15 35 62 57 65
5

6
Relationship with the parent company
Pelikan Holding Sdn. Bhd., Malaysia, is still the parent
company of Pelikan Holding AG holding 64,9% of the
Pelikan shares as of December 31, 2001.
The recoverability of the loans with debt warrant from
German companies in the amount of EUR 73 million
(prior year EUR 93 million) is guaranteed by an irrevocable
guarantee from Pelikan Holding Sdn. Bhd. Due to repay-
ments in 2001 by the German companies in the amount of
EUR 20 million, the guarantee could be reduced by the
same amount.
As of December 31, 2001, CHF 23 million (prior year
CHF 22 million) loans were receivable from the parent
company. These loans are partially secured by assets in
Singapore and Malaysia. In March 2002, an amount of
CHF 1,8 million was repaid.
Management Report
Business in 2001
The environment of an economic stagnation marked the
business year 2001 in the office stationery business. In this
environment, also the Pelikan Group had to endure a sales
stagnation. In order to improve the ability to compete in the
market and as a reaction to changed conditions, all func-
tional costs of the Group have been reassessed. The goal
to identify potential cost savings and to realize these was
achieved and the cost structure was improved in many
areas. In addition, the long-term project to reduce the num-
ber of product lines together with an optimization of the
margin contributions showed the expected success.
Distribution co-operations
In spite of start-up losses, the joint-venture company
QUADRIGA plus GmbH, Hanover, incorporated in 2000
together with three other well-known partners, has shown
the first successes. However, additional investments will
be required to secure and further improve sales in this
important distribution channel.
In addition to the investment in this distribution channel, the
Pelikan Group sees further growth potential in the worldwide
export business to improve the utilization of the German
production factories. After a distribution and product
analysis, the US market stood firmly in the forefront. In 2001,
the Pelikan Group signed a distribution co-operation agree-
ment with a new partner in the USA to supply the whole of
the US market. The first successes from this association
have been able to be realized in 2001 and will be continued
in the future.
Further distribution co-operation agreements are being
evaluated.

7
Sales by region 2001
Last year’s figures in brackets
Germany51,1% (53,2%)
Switzerland5,3% (4,9%)
Rest of Europe22,4% (22,3%)
Others5,0% (5,4%)
Latin-America16,2% (14,2%)
Sales by product group 2001
Last year’s figures in brackets
Others1,1% (1,0%)
Hardcopy5,7% (5,3%)
Writing instruments31,8% (32,8%)
School/Leisure time34,7% (34,1%)
General office supplies
26,7% (26,8%)
Sales
In 2001, the Pelikan Group achieved sales of CHF 190 million
(prior year CHF 204 million). After taking account of the
decline due to changes in currency rates, the operational
decline amounts CHF 10 million or 4,8%.
79% of the sales equal to CHF 150 million (prior year
CHF 164 million) relate to Europe. The most important
market in Europe is Germany where sales amounted to
CHF 97 million (prior year CHF 108 million). Other
significant countries are Italy with sales of CHF 20 million,
Austria CHF 7 million and Switzerland CHF 10 million.
Outside of Europe, sales reached a total of CHF 40 million
(prior year CHF 40 million). The major portion relates to
Latin-America with sales of CHF 31 million. Of this amount,
CHF 28 million derive from Mexico.
Total sales is generated by approximately one third from the
product group «Writing instruments», another third from
«School/Leisure time» and a remaining third from «General
office supplies», «Hardcopy» and «Others».
The product group «Writing instruments» includes «School
and Youth writing», «Higher priced writing», «Office writing»
and «Others» (ink, ink eradicators etc.). At constant currency
rates sales in this product group declined by 7% compared
to the prior year.
In the product group «School/Leisure time» sales are 5%
below prior year and the decline is spread accross the whole
assortment.
The product group «General office supplies» also includes
Henkel products which are distributed in Germany, Austria
and Switzerland.
«Hardcopy» includes sales in Germany and Greece of
products from Pelikan Hardcopy.

8
Results
The result from operations in the amount of CHF 11,2 million
is slightly below last year’s result of CHF 12,1 million. The
decrease is mainly due to a lower sales volume during 2001.
The resulting decrease of the gross margin could not be fully
compensated with cost savings.
The good liquidity situation resulted in a positive net interest
income of CHF 0,4 million (prior year CHF 0,7 million).
The result from unconsolidated companies shows a loss of
CHF 0,1 million (prior year profit of CHF 0,4 million).
The result before non-operating and extraordinary items
decreased in 2001 from CHF 13,2 million to CHF 11,5 million.
The expenses for pensioners in the amount of CHF 7,8 million
are below the prior year’s expense of CHF 9,5 million and
include the remaining extraordinary costs in respect of the
adjustments to the new life tables in Germany amounting to
CHF 2,7 million (prior year CHF 2,8 million).
The extraordinary expenses of the year 2000 in the amount
of CHF 3,2 million include an extraordinary charge relating to
an unconsolidated company in Latin-America.
The net result for the year shows a profit of CHF 1,2 million
(prior year loss of CHF 1,7 million). After deduction of the
profit due to minority interests, the consolidated net result
for the year shows a profit of CHF 0,2 million (prior year
loss of CHF 3,0 million).
The financial statements of Pelikan Holding AG show a net
profit for the year of CHF 1,7 million (prior year loss of
CHF 3,0 million). The Board of Directors will not propose the
payment of a dividend to the Annual General Shareholders
Meeting.
Result from operations
12
10
8
6
4
2
0
CHF million
1999 20012000

9
Personnel Dec. 31, 2001
Germany444
Switzerland16
Latin-America305
Rest of Europe65
Personnel
In 2001, the total number of employees reduced by 103 to
830. This decline is due to a reduction of 125 people in
Mexico. The increase in the territory «Rest of Europe» is due
to the fact that Pelikan Italy has an own operation again.
Personnel as at Dec. 31, 2001 Dec. 31, 2000 Dec. 31, 1999
Germany 444 449 440
Switzerland 16 16 16
Rest of Europe 65 38 39
Total Europe 525 503 495
Latin-America 305 430 326
Total Group 830 933 821

10
Research and development
For research and development CHF 2,4 million (prior year
CHF 2,7 million) were expensed. The significant projects
were:
• New development of the Limited Edition «1935» in blue
• New development of Special Editions «Xuan Wu»,
«Ikarus», «Berlin» and «Stockholm»
• New development Paint box «K12» and «K24»
• New development of a modular concept of paint boxes
Investments in fixed assets
The investments in fixed assets amounted to CHF 7 million
(prior year CHF 6 million).
The major portion of the 2001 investments in fixed assets
relates to Germany with the following investment projects:
• Tools for the new paint box for different markets as well as
for the «pocket paint box»
• Automation of sleeve assembling «Future»
• Modernization of the factory in the area warehousing,
manufacturing of ink, Indian ink and wax crayons.
Quality Management System DIN EN ISO 9001
Pelikan Hanover manufactures according to DIN EN ISO
9001:94 certification awarded by SGS-ICS Gesellschaft für
Zertifizierungen, Hamburg.
The certification and its audit confirm that an efficient
and well documented Quality Management System is
implemented, which ensures reliability and highest quality.
This is a prerequisite in order to reach the highly
ambitious targets set by Pelikan.
In the year 2001, Pelikan Mexico received the certification
CLASS A awarded by Buker Inc., a Management Education
and Consulting Firm, which confirms the excellence and
quality of the business processes at a world class level.
11
Risks of future development
The Pelikan Group offers an encompassing product assort-
ment in the areas school and leisure time, high value writing
instruments as well as office products and is operative
worldwide. The globalization and concentration process as
well as the structure changes, mainly in the market, are a
continuous challenge with numerous risks.
In the operation of the Group these risks are unavoidable.
Pelikan regards an efficient and anticipative risk manage-
ment as an important and adding-value duty. The primary
goal is not the avoidance of all risks but their identification
and, based thereon, an active control based on the risk
strategy.
The objective is to take only those risks involved with the
operation in order to increase value and improve, or at
least maintain, the market position. The shareholders of the
Pelikan Group are interested that the Group only takes
those risks where, through focused management, com-
petitive advantages and accordingly adequately higher
profits can be attained.
For the companies in Germany the German law for control
and transparency in business (KonTraG) has clarified the
commitment of the management to build-up a control
system in order to recognize risks in advance which might
endanger the Group. This requirement has for many years
been regarded by Pelikan as a prerequisite for a successful
business. Thereby Pelikan aims to improve the risk manage-
ment and controlling system continuously.
Outlook
Consolidated sales of the 1st quarter 2002 amount to
CHF 42 million. After taking account of the changes in
currency rates, this represents an increase of 1,4%.
The operational result of the 1st quarter 2002 improved
slightly compared to the prior year.
In Austria, the distribution co-operation with Faber-Castell
had a positive start, the corresponding co-operation
in Switzerland is planned to commence in July 2002.
According to the market and sales forecasts, the Group
expects a slightly improved business development for 2002
compared to the prior year.
The statements in this business report relating to matters that are not historical facts are forward-looking statements that are not guarantees forfuture performance and involve risks and uncertainties, including but not limited to: future global economic conditions, foreign exchange rates, regulatory rules, market conditions, the actions of competitors and other factors beyond the control of the Group.
33
Pelikan Group
Financial Statements 2001
34
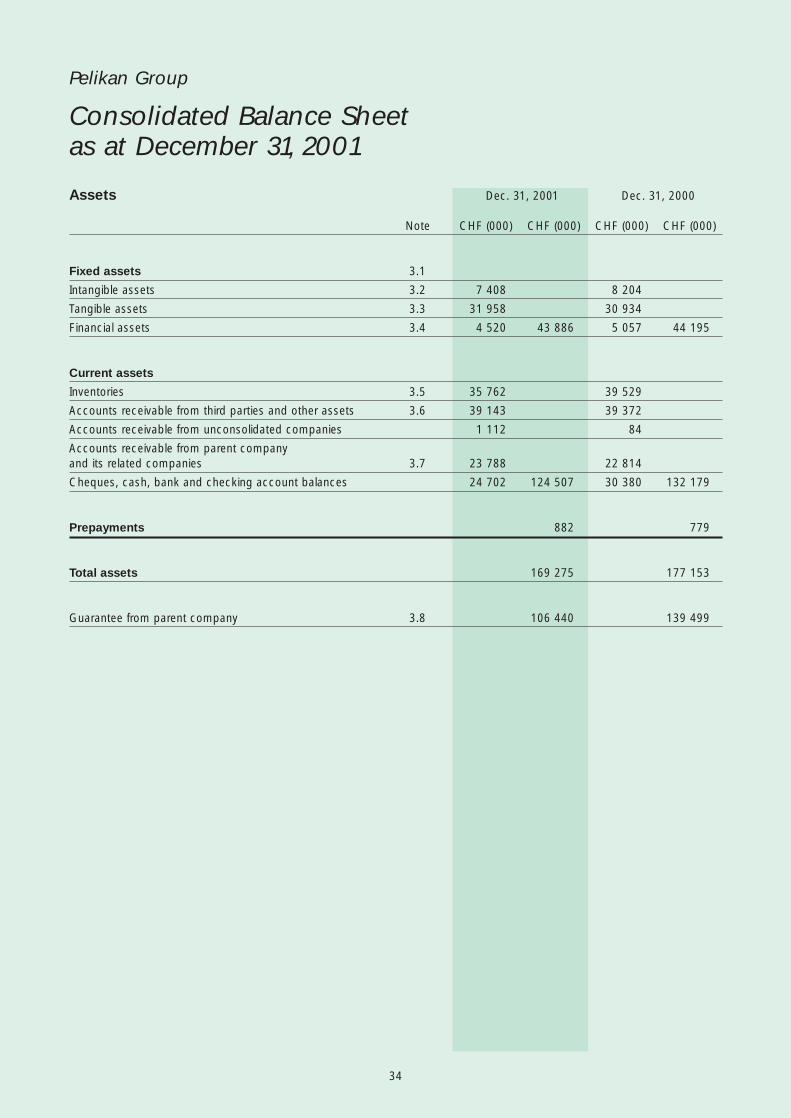
Pelikan Group
Consolidated Balance Sheet as at December 31, 2001
Assets Dec. 31, 2001 Dec. 31, 2000
Note CHF (000) CHF (000) CHF (000) CHF (000)
Fixed assets 3.1
Intangible assets 3.2 7 408 8 204
Tangible assets 3.3 31 958 30 934
Financial assets 3.4 4 520 43 886 5 057 44 195
Current assets
Inventories 3.5 35 762 39 529
Accounts receivable from third parties and other assets 3.6 39 143 39 372
Accounts receivable from unconsolidated companies 1 112 84
Accounts receivable from parent companyand its related companies 3.7 23 788 22 814
Cheques, cash, bank and checking account balances 24 702 124 507 30 380 132 179
Prepayments 882 779
Total assets 169 275 177 153
Guarantee from parent company 3.8 106 440 139 499

35
Equity and liabilities Dec. 31, 2001 Dec. 31, 2000
Note CHF (000) CHF (000) CHF (000) CHF (000)
Shareholders’ equity
Capital stock 3.9 100 100 100 100
Accumulated deficit brought forward 3.10 -97 062 -94 504
Net result for the year 224 -2 979
Minority interests 3.11 16 191 19 453 15 401 18 018
Provisions
Provisions for pensions and similar commitments 3.12 97 424 101 197
Tax provisions 3.13 10 268 12 626
Other provisions 3.14 18 580 126 272 21 361 135 184
Liabilities 3.15
Bank liabilities 7 186 5 375
Accounts payable 9 765 12 670
Payables to unconsolidated companies 109 18
Payables to companies related to the parent company 759 1 536
Other liabilities 5 639 23 458 4 349 23 948
Deferred income 92 3
Total equity and liabilities 169 275 177 153
36
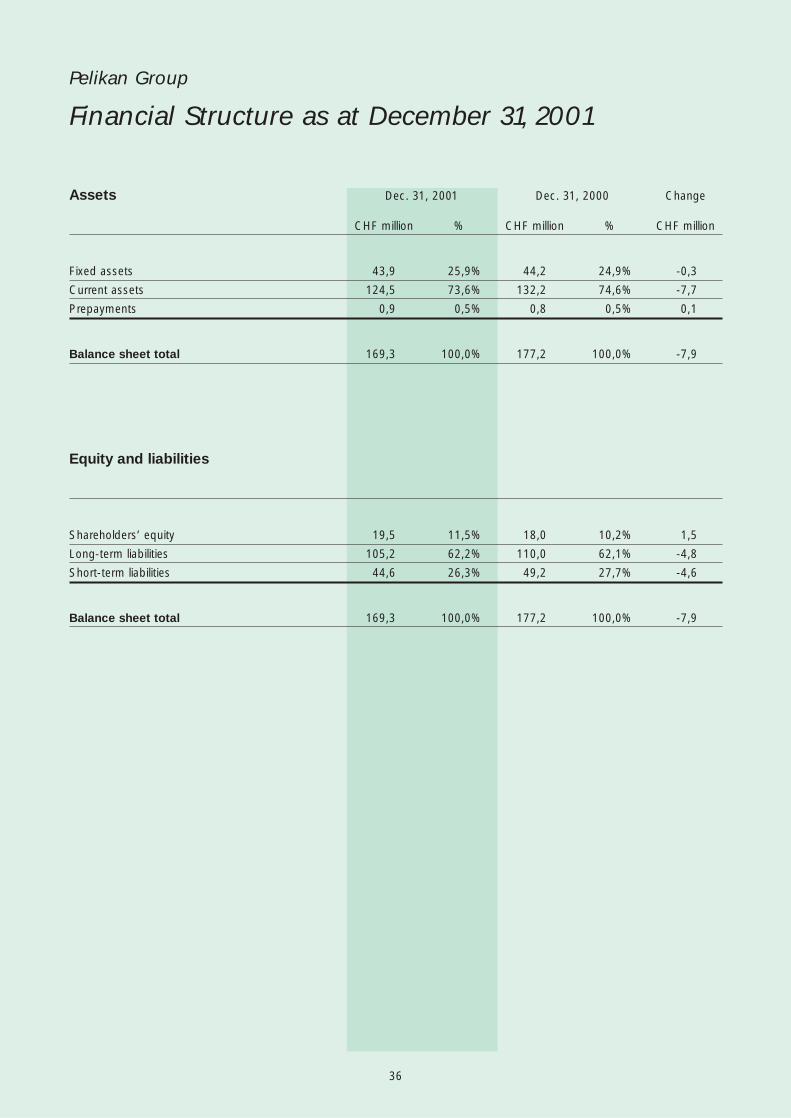
Pelikan Group
Financial Structure as at December 31, 2001
Assets Dec. 31, 2001 Dec. 31, 2000 Change
CHF million % CHF million % CHF million
Fixed assets 43,9 25,9% 44,2 24,9% -0,3
Current assets 124,5 73,6% 132,2 74,6% -7,7
Prepayments 0,9 0,5% 0,8 0,5% 0,1
Balance sheet total 169,3 100,0% 177,2 100,0% -7,9
Equity and liabilities
Shareholders’ equity 19,5 11,5% 18,0 10,2% 1,5
Long-term liabilities 105,2 62,2% 110,0 62,1% -4,8
Short-term liabilities 44,6 26,3% 49,2 27,7% -4,6
Balance sheet total 169,3 100,0% 177,2 100,0% -7,9

37
Pelikan Group
Consolidated Profit and Loss Account for 2001
2001 2000
Note CHF (000) CHF (000) CHF (000) CHF (000)
Net sales 4.1 190 067 203 937
Change in the level of finished goods and work in process -39 -342
Other expenses capitalized 898 1 107
Other operating income 4.2 10 733 201 659 10 771 215 473
Materials purchased -83 750 -94 215
Personnel expenses 4.3 -51 734 -48 997
Depreciation 4.4 -6 770 -7 207
Other operating expenses 4.5 -48 212 -190 466 -52 985 -203 404
Result from operations 11 193 12 069
Result from unconsolidated companies 4.6 -103 442
Interest and similar income 1 747 1 989
Interest and similar expenses -1 353 291 -1 278 1 153
Result before non-operating and extraordinary items 11 484 13 222
Expenses for pensioners 4.7 -7 758 -9 500
Extraordinary expenses 4.8 -7 758 -3 238 -12 738
Result before taxation 3 726 484
Taxes 4.9 -2 537 -2 212
Net result for the year 1 189 -1 728
Profit due to minority interests -965 -1 251
Consolidated net result for the year 224 -2 979
38
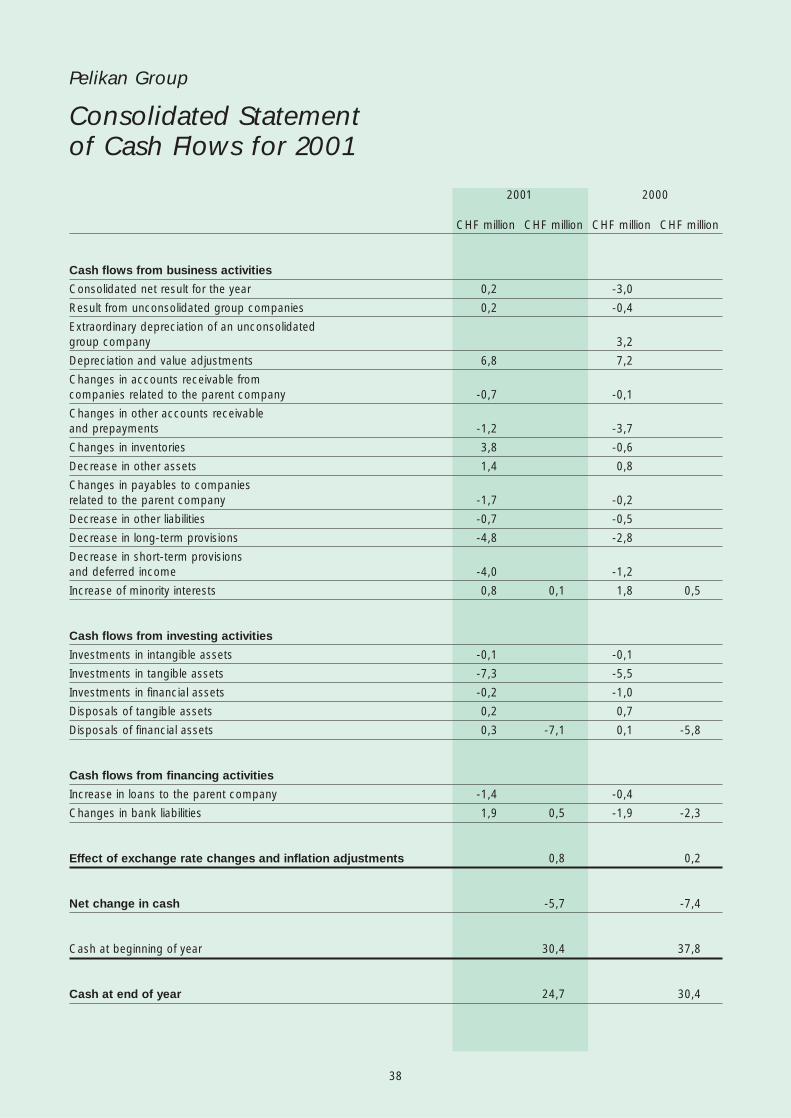
Pelikan Group
Consolidated Statementof Cash Flows for 2001
2001 2000
CHF million CHF million CHF million CHF million
Cash flows from business activities
Consolidated net result for the year 0,2 -3,0
Result from unconsolidated group companies 0,2 -0,4
Extraordinary depreciation of an unconsolidated group company 3,2
Depreciation and value adjustments 6,8 7,2
Changes in accounts receivable fromcompanies related to the parent company -0,7 -0,1
Changes in other accounts receivable and prepayments -1,2 -3,7
Changes in inventories 3,8 -0,6
Decrease in other assets 1,4 0,8
Changes in payables to companiesrelated to the parent company -1,7 -0,2
Decrease in other liabilities -0,7 -0,5
Decrease in long-term provisions -4,8 -2,8
Decrease in short-term provisionsand deferred income -4,0 -1,2
Increase of minority interests 0,8 0,1 1,8 0,5
Cash flows from investing activities
Investments in intangible assets -0,1 -0,1
Investments in tangible assets -7,3 -5,5
Investments in financial assets -0,2 -1,0
Disposals of tangible assets 0,2 0,7
Disposals of financial assets 0,3 -7,1 0,1 -5,8
Cash flows from financing activities
Increase in loans to the parent company -1,4 -0,4
Changes in bank liabilities 1,9 0,5 -1,9 -2,3
Effect of exchange rate changes and inflation adjustments 0,8 0,2
Net change in cash -5,7 -7,4
Cash at beginning of year 30,4 37,8
Cash at end of year 24,7 30,4

39
Pelikan Group
Notes to the ConsolidatedFinancial Statements 2001
1. General
The consolidated financial statements are prepared in
accordance with the 4th and 7th Directives of the European
Community (EC) as applied in the Federal Republic of
Germany and are in agreement with the provisions of the
Swiss Code of Obligations.
2. Consolidation principles
2.1 Companies consolidated
The consolidated financial statements include those com-
panies in which the parent company, Pelikan Holding AG,
holds directly or indirectly at least 50% of the voting rights.
The companies included in the consolidation are shown in
the list of group companies on pages 50 to 51.
One group company, Pelikan Mexico, in which the parent
company holds an investment of less than 50%, but
which is under its management control, has also been
consolidated.
Investments of between 20% and 50% are accounted for
under the equity method. The respective portions of the
equity and of the profit or loss for the year of such invest-
ments are included in the consolidated financial statements.
Investments of less than 20% are carried at cost less
necessary valuation provisions.
During the year under review no material changes in the
group of consolidated companies took place.
2.2 Consolidation period
The consolidation period is the calendar year.
2.3 Accounting and valuation principles
The individual financial statements included in the consolida-
tion have been prepared according to the group’s standard
accounting and valuation principles. For this purpose, the
companies prepare a second statement (Financial State-
ment II), besides the regular financial statements prepared
according to the laws of the respective countries. This
Financial Statement II shows a true and fair view of the
financial position and results of operations of the companies
and is also examined and reported on by the companies’
auditors. Details as to the valuation principles applied are
given below under «Notes to the Consolidated Balance
Sheet».
2.4 Currency translation
The balance sheets of the foreign companies have been
translated at year-end exchange rates. The profit and loss
accounts have been translated at the average exchange
rates ruling during the year. The differences which result
from the utilization of differing exchange rates for the trans-
lation of balance sheets and profit and loss accounts are
credited or debited to the balance sheet item «Accumulated
deficit brought forward».
2.5 Consolidation method
The consolidation is based on the purchase method. The
shares of third parties in the equity and in the result for the
year of the consolidated companies have been calculated at
the balance sheet date and are shown separately in the
balance sheet and profit and loss account.
2.6 Consolidation adjustments
The sales, expenses/ income and receivables/payables
between the consolidated companies and the profits arising
from the intercompany transactions have been eliminated.
In those cases where group companies have given
guarantees in respect of the liabilities of other consolidated
companies, the contingent liabilities shown in the individual
balance sheets become irrelevant in view of the disclosure
of the primary liabilities in the consolidated financial
statements.
40
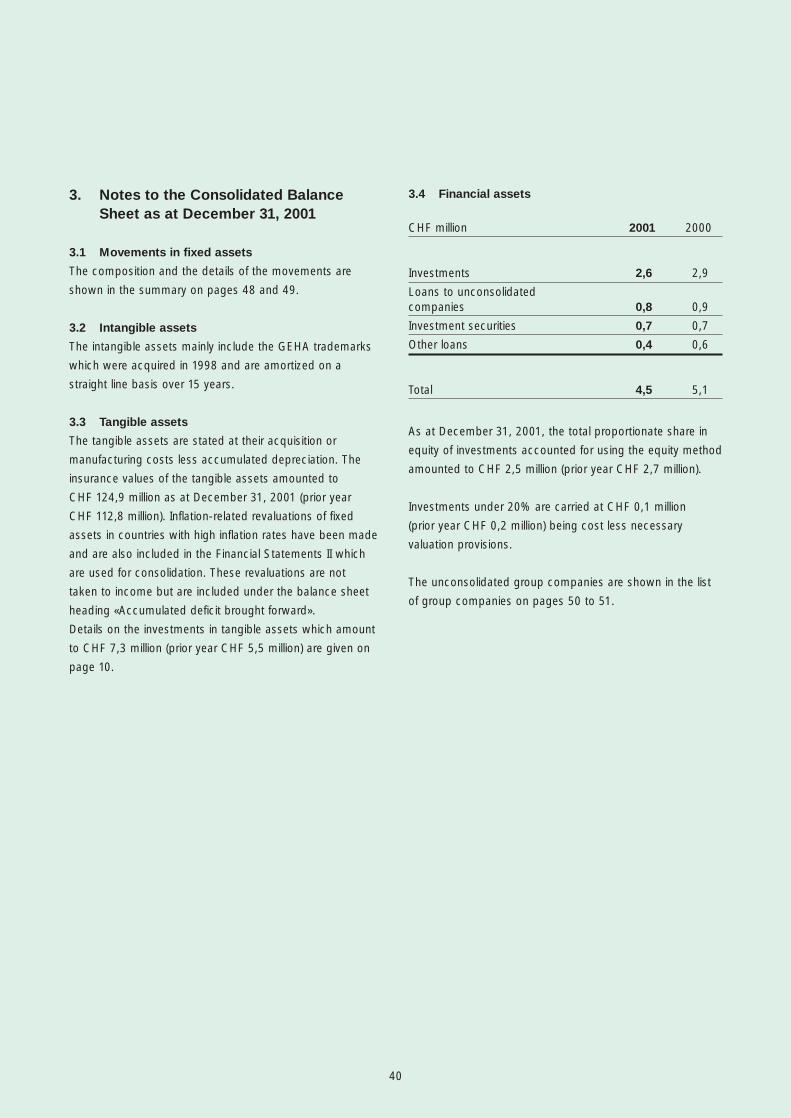
3. Notes to the Consolidated BalanceSheet as at December 31, 2001
3.1 Movements in fixed assets
The composition and the details of the movements are
shown in the summary on pages 48 and 49.
3.2 Intangible assets
The intangible assets mainly include the GEHA trademarks
which were acquired in 1998 and are amortized on a
straight line basis over 15 years.
3.3 Tangible assets
The tangible assets are stated at their acquisition or
manufacturing costs less accumulated depreciation. The
insurance values of the tangible assets amounted to
CHF 124,9 million as at December 31, 2001 (prior year
CHF 112,8 million). Inflation-related revaluations of fixed
assets in countries with high inflation rates have been made
and are also included in the Financial Statements II which
are used for consolidation. These revaluations are not
taken to income but are included under the balance sheet
heading «Accumulated deficit brought forward».
Details on the investments in tangible assets which amount
to CHF 7,3 million (prior year CHF 5,5 million) are given on
page 10.
3.4 Financial assets
CHF million 2001 2000
Investments 2,6 2,9
Loans to unconsolidated companies 0,8 0,9
Investment securities 0,7 0,7
Other loans 0,4 0,6
Total 4,5 5,1
As at December 31, 2001, the total proportionate share in
equity of investments accounted for using the equity method
amounted to CHF 2,5 million (prior year CHF 2,7 million).
Investments under 20% are carried at CHF 0,1 million
(prior year CHF 0,2 million) being cost less necessary
valuation provisions.
The unconsolidated group companies are shown in the list
of group companies on pages 50 to 51.

41
3.5 Inventories
The inventories are valued primarily at the lower of average
purchase or manufacturing costs and net realizable
value and are stated net of deduction of provisions for
obsolescence risks.
CHF million 2001 2000
Raw material, stores andoperating supplies 5,4 5,6
Work in process 7,1 7,4
Finished products andmerchandise 22,3 24,8
Goods in transit 0,4 1,2
Payments on account 0,6 0,5
Total 35,8 39,5
3.6 Accounts receivable from third parties and
other assets
CHF million 2001 2000
Trade accounts receivable 36,2 34,0
Other assets 2,9 5,4
Total 39,1 39,4
The accounts receivable are stated at their nominal values
less provisions of CHF 3,0 million (prior year CHF 4,8 million).
The other assets comprise primarily receivables from tax
reclaims, license fees and short-term loans.
3.7 Accounts receivable from parent company
and its related companies
The receivables from the parent company Pelikan Holding
Sdn. Bhd., Malaysia, are secured partly by assets in
Malaysia. The increase results mainly from interest for the
year 2001.
3.8 Guarantee from parent company
In connection with the waivers of claim with debt warrants
granted by Pelikan Holding AG to two German Pelikan com-
panies, the parent company has guaranteed the recover-
ability of receivables of EUR 93,0 million (DEM 181,9 million)
despite the waivers of claim. This contingent receivable
will crystallize when it is determined that the two German
Pelikan companies are not able to make payment of
the amounts due under the debt warrants and therefore,
that Pelikan Holding AG will not recover such amounts.
During the year under review the German companies repaid
EUR 20,1 million of the loans. As a consequence the
guarantee could be reduced from EUR 93,0 million to
EUR 72,9 million.
3.9 Capital stock
At December 31, 2001, the capital stock of
CHF 100,1 million comprises the following shares:
539 000 Registered shares of nominal CHF 65
1 001 000 Bearer shares of nominal CHF 65

42
3.10 Accumulated deficit brought forward
The movements during the year were:
CHF million 2001 2000
Balance January 1 -94,5 -95,7
Consolidated net result of prior year -3,0 0,2
Revaluations due to inflationand translation differences 0,4 1,0
Total -97,1 -94,5
The translation differences comprise the adjustments arising
from the translation of group companies’ balance sheet
items as at December 31, 2000 to the year-end exchange
rates as at December 31, 2001 and also include the
difference resulting from the translation of the result for the
year at average rates and at year-end rates.
3.11 Minority interests
This heading includes the minority shareholders’ share of
CHF 1,0 million (prior year CHF 1,3 million) profit in the net
result for the year.
3.12 Provisions for pensions and similar
commitments
The provisions for pensions amounting to CHF 97,4 million
(prior year CHF 101,2 million) are included in the consolidated
balance sheet at 100% of the actuarial value. The decrease
compared to prior year relates mainly to changes in foreign
currencies.
Of the balance sheet figure at December 31, 2001,
CHF 93,4 million (prior year CHF 98,1 million) relates to
pension provisions of German companies which are
based on the actuarial calculations from Höfer Vorsorge-
management using an interest rate of 6%.
The provisions are based on the net present value of the
future pension payments and require a yearly increase for
the interest element which is charged to the profit and loss
account. In addition, the annual payments to pensioners as
well as the actuarial adjustments are booked to these
provisions.
As a result of the adoption of new life expectancy tables in
Germany in 1998, the total pension provision required to be
increased by CHF 10,0 million over a period of four years.
At December 31, 2000, the provision had been increased
by CHF 7,3 million. The remaining CHF 2,7 million was
charged to income in 2001.

43
3.13 Tax provisions
The provisions are for income and capital taxes plus the
non-recoverable withholding taxes on future dividends to be
distributed by group companies. Provisions for deferred
taxes resulting from the valuation differences between the
tax accounts prepared according to local rules and the
Financial Statements II used for the consolidation are also
included under tax provisions. However, deferred tax assets
relating to tax loss carry-forwards are not capitalized.
The amount in the balance sheet comprises:
CHF million 2001 2000
Provision for:
- taxes payable 7,7 8,8
- deferred taxes 2,6 3,8
Total 10,3 12,6
The decrease of the provision for deferred taxes mainly
relates to Pelikan Mexico.
3.14 Other provisions
The other provisions reduced from CHF 21,4 million to
CHF 18,6 million and cover all remaining recognizable risks
such as termination payments, restructuring costs,
early retirement arrangements, legal risks, holiday pay,
guarantees, etc.
This heading also includes the provision for early retirement
in the amount of CHF 3,2 million (prior year CHF 1,6 million).
3.15 Liabilities
The following liabilities are payable within one year:
CHF million 2001 2000
Bank liabilities 7,2 5,4
Accounts payable 9,8 12,7
Payables to related companies 0,9 1,5
Other liabilities 5,6 4,3
Total 23,5 23,9
The liabilities are partially secured by the following liens
and charges:
CHF million 2001 2000
Receivables and inventories 5,3 0,5
44
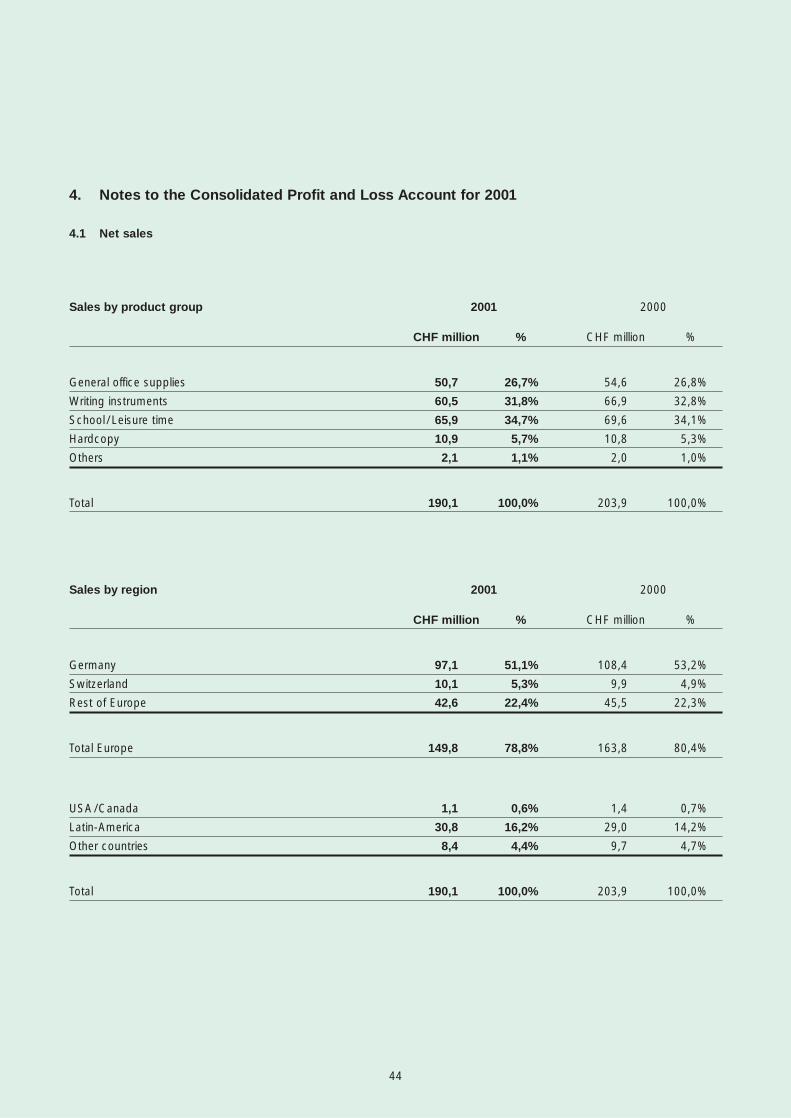
Sales by product group 2001 2000
CHF million % CHF million %
General office supplies 50,7 26,7% 54,6 26,8%
Writing instruments 60,5 31,8% 66,9 32,8%
School /Leisure time 65,9 34,7% 69,6 34,1%
Hardcopy 10,9 5,7% 10,8 5,3%
Others 2,1 1,1% 2,0 1,0%
Total 190,1 100,0% 203,9 100,0%
Sales by region 2001 2000
CHF million % CHF million %
Germany 97,1 51,1% 108,4 53,2%
Switzerland 10,1 5,3% 9,9 4,9%
Rest of Europe 42,6 22,4% 45,5 22,3%
Total Europe 149,8 78,8% 163,8 80,4%
USA/Canada 1,1 0,6% 1,4 0,7%
Latin-America 30,8 16,2% 29,0 14,2%
Other countries 8,4 4,4% 9,7 4,7%
Total 190,1 100,0% 203,9 100,0%
4. Notes to the Consolidated Profit and Loss Account for 2001
4.1 Net sales

45
4.2 Other operating income
CHF million 2001 2000
Income from the releaseof provisions 1,2 1,4
Income relating toprior years 1,6 0,4
Exchange rate gains 2,5 2,6
Other 5,4 6,4
Total 10,7 10,8
4.3 Personnel expenses
CHF million 2001 2000
Salaries and wages 41,3 39,3
Social security contributionsand other welfare expenses 9,3 8,9
Pension contributions 1,1 0,8
Total 51,7 49,0
The changes in the number of employees is shown on
page 9.
Pension expenses for retired employees are shown
separately below the result before non-operating and
extraordinary items.
Personnel expenses for the year 2001 include a
CHF 1,8 million (prior year CHF 1,4 million) allocation to the
early retirement provision related to the German companies.
4.4 Depreciation
Depreciation on tangible assets, intangible assets
and inventory amounted to CHF 6,8 million (prior year
CHF 7,2 million).
4.5 Other operating expenses
CHF million 2001 2000
Occupancy costs 5,9 5,6
Outwards freight, packing 3,5 3,0
Energy, other operating expenses 3,0 2,8
Licenses and commissions 2,0 2,6
External costs for logistics,administration, sales 10,2 14,8
Sales promotion 9,7 10,7
Travel expenses 2,2 1,8
Communication, EDP 1,3 1,2
Administration costs 6,4 5,7
Losses on disposal of fixed assets 0,2 0,2
Expenses relating to prior years 0,8 0,7
Provision for doubtful debts 0,2 0,1
Other 2,8 3,8
Total 48,2 53,0
External costs for logistics, administration and sales relate
to distribution expenses in the joint-venture companies with
Henkel in Italy (until the end of 2000) and Greece and also
include the external logistic expenses in Hanover.

46
4.6 Result from unconsolidated companies
The proportionate share in the 2001 results of the invest-
ments accounted for under the equity method amounted
to a net loss of CHF 0,1 million (prior year profit of
CHF 0,4 million).
4.7 Expenses for pensioners
The pension expenses for retired employees amounted to
CHF 7,8 million compared to CHF 9,5 million in the prior
year. These expenses relate mainly to pensioners in
Germany and include the last portion of CHF 2,7 million
(prior year CHF 2,8 million) for the extraordinary adjustment
to new life-tables.
4.8 Extraordinary expenses
In 2000, the book value of CHF 3,2 million of an investment
in Latin-America which had been accounted under the
equity method was fully written-off as an extraordinary
expense.
4.9 Taxes
The tax expense comprises the income and capital taxes
of the current business year, tax adjustments in respect of
prior years and changes in the provision for deferred taxes.
Non-recoverable withholding taxes on distributions by group
companies are also included under this heading.

47
5. Other information
5.1 Other financial commitments
The following commitments existed at December 31, 2001,
from rental and leasing contracts:
at nominal values Motor Land andin CHF million vehicles buildings
Commitments in thenext 5 years 0,7 11,5
- Portion falling duewithin the next year 0,4 3,5
The rental periods for land and buildings extend up
to the year 2010.
No material capital commitments existed at
December 31, 2001.
5.2 Remuneration of/advances to the
Board of Directors
The Board of Directors of Pelikan Holding AG received for
its function as such (without executive functions) a fee of
less than CHF 0,1 million as in the prior year. No advances
or credits were granted to the members of the Board of
Directors. There are no pension commitments in respect of
current or former members of the Board of Directors of
Pelikan Holding AG.
5.3 Contingent liabilities
CHF million 2001 2000
Discounted bills 1,3 0,5

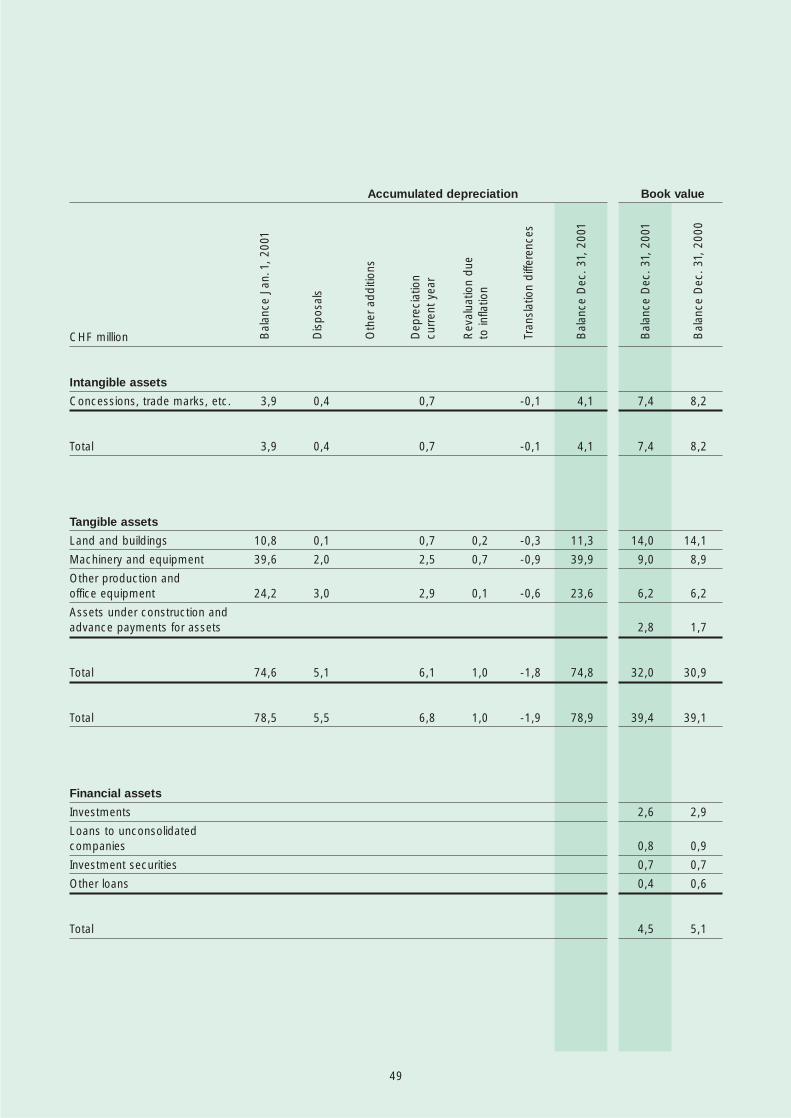
48
Pelikan Group
Movements in Fixed Assets
Acquisition or manufacturing costs
CHF million
Intangible assets
Concessions, trade marks, etc. 12,1 0,1 0,4 -0,3 11,5
Total 12,1 0,1 0,4 -0,3 11,5
Tangible assets
Land and buildings 24,9 0,2 0,1 0,1 0,7 -0,5 25,3
Machinery and equipment 48,5 1,4 1,0 1,9 0,9 -1,0 48,9
Other production and office equipment 30,4 2,8 0,6 3,3 0,1 -0,8 29,8
Assets under construction andadvance payments for assets 1,7 2,9 -1,7 -0,1 2,8
Total 105,5 7,3 5,3 1,7 -2,4 106,8
Total 117,6 7,4 5,7 1,7 -2,7 118,3
Financial assets
Investments 2,9 0,2 0,5 2,6
Loans to unconsolidated companies 0,9 0,1 0,8
Investment securities 0,7 0,7
Other loans 0,6 0,2 0,4
Total 5,1 0,2 0,8 4,5
Bal
ance
Dec
. 31,
200
1
Tran
slat
ion
diffe
renc
es
Rev
alua
tion
due
to in
flatio
n
Dis
posa
ls
Oth
er a
dditi
ons
Inve
stm
ents
Bal
ance
Jan
.1, 2
001
49
Book value
CHF million
Intangible assets
Concessions, trade marks, etc. 3,9 0,4 0,7 -0,1 4,1
Total 3,9 0,4 0,7 -0,1 4,1
Tangible assets
Land and buildings 10,8 0,1 0,7 0,2 -0,3 11,3
Machinery and equipment 39,6 2,0 2,5 0,7 -0,9 39,9
Other production and office equipment 24,2 3,0 2,9 0,1 -0,6 23,6
Assets under construction andadvance payments for assets
Total 74,6 5,1 6,1 1,0 -1,8 74,8
Total 78,5 5,5 6,8 1,0 -1,9 78,9
Financial assets
Investments
Loans to unconsolidated companies
Investment securities
Other loans
Total
Accumulated depreciation
7,4 8,2
7,4 8,2
14,0 14,1
9,0 8,9
6,2 6,2
2,8 1,7
32,0 30,9
39,4 39,1
2,6 2,9
0,8 0,9
0,7 0,7
0,4 0,6
4,5 5,1
Bal
ance
Dec
. 31,
200
1
Bal
ance
Dec
. 31,
200
0
Bal
ance
Dec
. 31,
200
1
Tran
slat
ion
diffe
renc
es
Rev
alua
tion
due
to in
flatio
n
Dep
reci
atio
n cu
rren
t ye
ar
Dis
posa
ls
Oth
er a
dditi
ons
Bal
ance
Jan
.1, 2
001
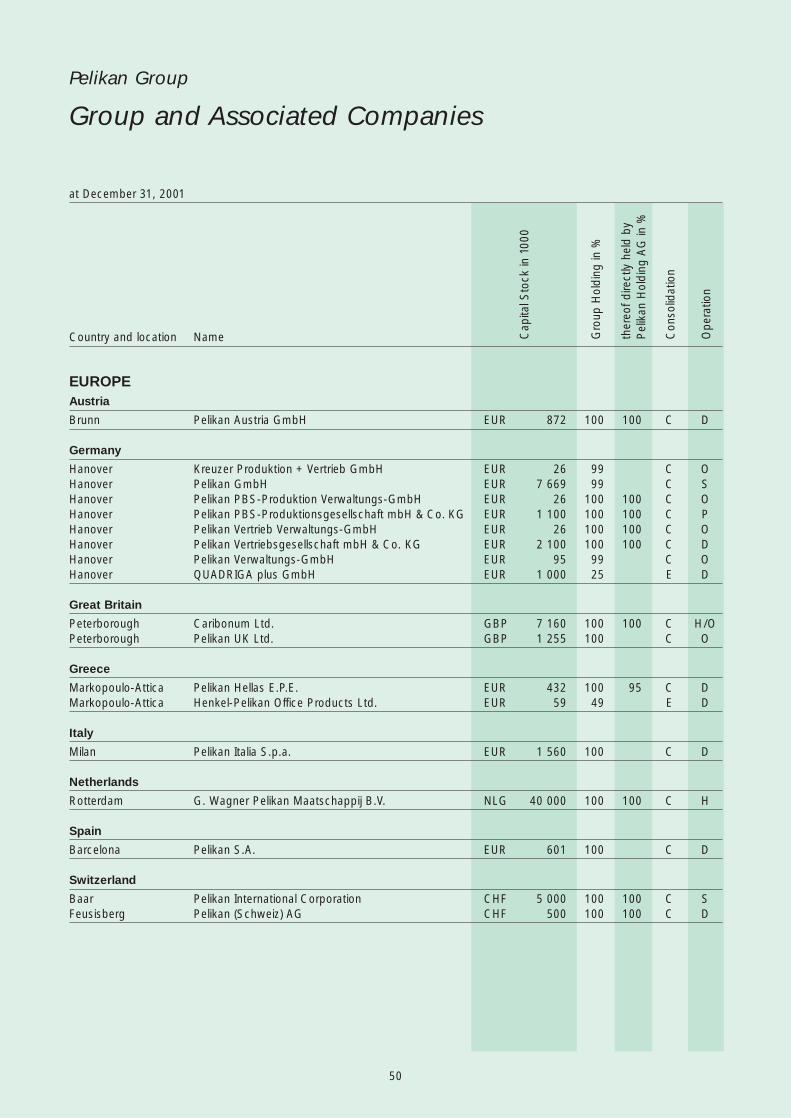
50
Pelikan Group
Group and Associated Companies
Country and location Name
EUROPEAustria
Brunn Pelikan Austria GmbH EUR 872 100 100 C D
Germany
Hanover Kreuzer Produktion + Vertrieb GmbH EUR 26 99 C OHanover Pelikan GmbH EUR 7 669 99 C SHanover Pelikan PBS-Produktion Verwaltungs-GmbH EUR 26 100 100 C OHanover Pelikan PBS-Produktionsgesellschaft mbH & Co. KG EUR 1 100 100 100 C PHanover Pelikan Vertrieb Verwaltungs-GmbH EUR 26 100 100 C OHanover Pelikan Vertriebsgesellschaft mbH & Co. KG EUR 2 100 100 100 C DHanover Pelikan Verwaltungs-GmbH EUR 95 99 C OHanover QUADRIGA plus GmbH EUR 1 000 25 E D
Great Britain
Peterborough Caribonum Ltd. GBP 7 160 100 100 C H/OPeterborough Pelikan UK Ltd. GBP 1 255 100 C O
Greece
Markopoulo-Attica Pelikan Hellas E.P.E. EUR 432 100 95 C DMarkopoulo-Attica Henkel-Pelikan Office Products Ltd. EUR 59 49 E D
Italy
Milan Pelikan Italia S.p.a. EUR 1 560 100 C D
Netherlands
Rotterdam G. Wagner Pelikan Maatschappij B.V. NLG 40 000 100 100 C H
Spain
Barcelona Pelikan S.A. EUR 601 100 C D
Switzerland
Baar Pelikan International Corporation CHF 5 000 100 100 C SFeusisberg Pelikan (Schweiz) AG CHF 500 100 100 C D
at December 31, 2001
Cap
ital S
tock
in 1
000
Gro
up H
oldi
ng in
%
ther
eof d
irect
ly h
eld
by
Pel
ikan
Hol
ding
AG
in %
Con
solid
atio
n
Ope
ratio
n
51
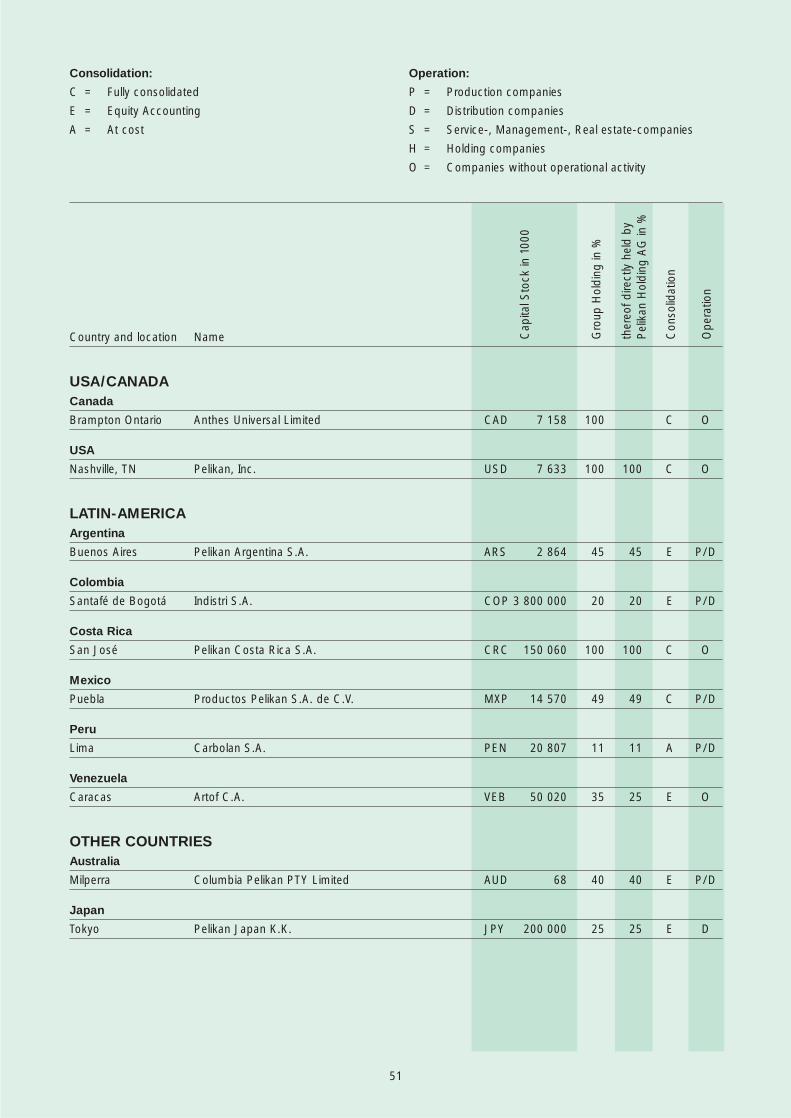
Consolidation:
C = Fully consolidated
E = Equity Accounting
A = At cost
Operation:
P = Production companies
D = Distribution companies
S = Service-, Management-, Real estate-companies
H = Holding companies
O = Companies without operational activity
Country and location Name
USA/CANADACanada
Brampton Ontario Anthes Universal Limited CAD 7 158 100 C O
USA
Nashville, TN Pelikan, Inc. USD 7 633 100 100 C O
LATIN-AMERICAArgentina
Buenos Aires Pelikan Argentina S.A. ARS 2 864 45 45 E P/D
Colombia
Santafé de Bogotá Indistri S.A. COP 3 800 000 20 20 E P/D
Costa Rica
San José Pelikan Costa Rica S.A. CRC 150 060 100 100 C O
Mexico
Puebla Productos Pelikan S.A. de C.V. MXP 14 570 49 49 C P/D
Peru
Lima Carbolan S.A. PEN 20 807 11 11 A P/D
Venezuela
Caracas Artof C.A. VEB 50 020 35 25 E O
OTHER COUNTRIESAustralia
Milperra Columbia Pelikan PTY Limited AUD 68 40 40 E P/D
Japan
Tokyo Pelikan Japan K.K. JPY 200 000 25 25 E D
Cap
ital S
tock
in 1
000
Gro
up H
oldi
ng in
%
ther
eof d
irect
ly h
eld
by
Pel
ikan
Hol
ding
AG
in %
Con
solid
atio
n
Ope
ratio
n

52
Pelikan Group
Report of the Group Auditorsto the General Meeting
As auditors of the group, we have
audited the accompanying consoli-
dated financial statements (consoli-
dated balance sheet, consolidated
profit and loss account, consolidated
statement of cash flows and notes)
of Pelikan Holding AG for the year
ended December 31, 2001.
These consolidated financial state-
ments are the responsibility of the
Board of Directors. Our responsibility
is to express an opinion on these
consolidated financial statements
based on our audit. We confirm that
we meet the legal requirements
concerning professional qualification
and independence.
Our audit was conducted in accord-
ance with International Standards on
Auditing issued by the International
Federation of Accountants, which
require that an audit be planned and
performed to obtain reasonable assu-
rance about whether the consolidated
financial statements are free from
material misstatement. We have
examined on a test basis evidence
supporting the amounts and disclo-
sures in the consolidated financial
statements. We have also assessed
the accounting principles used,
significant estimates made and the
overall consolidated financial
statement presentation. We believe
that our audit provides a reasonable
basis for our opinion.
In our opinion, the consolidated
financial statements give a true and
fair view of the financial position, the
results of operations and the cash
flows in accordance with the 4th and
7th European Directives, as implemen-
ted in the Federal Republic of
Germany, and comply with Swiss law.
We recommend that the consolidated
financial statements submitted to you
be approved.
Zurich, March 28, 2002
Ernst & Young Ltd.
K. McCabe M. Schneider
Chartered Accountant Certified Accountant(in charge of the audit)
53
Pelikan Holding AG, Baar
Financial Statements 2001
54
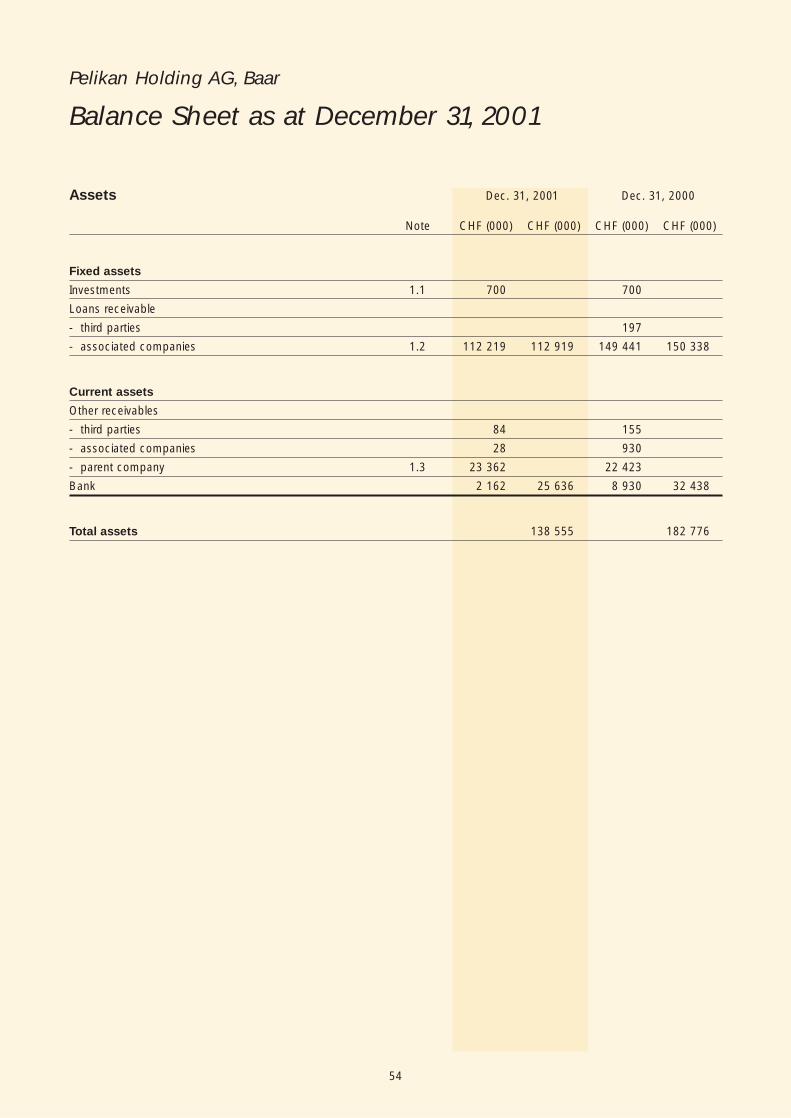
Pelikan Holding AG, Baar
Balance Sheet as at December 31, 2001
Assets Dec. 31, 2001 Dec. 31, 2000
Note CHF (000) CHF (000) CHF (000) CHF (000)
Fixed assets
Investments 1.1 700 700
Loans receivable
- third parties 197
- associated companies 1.2 112 219 112 919 149 441 150 338
Current assets
Other receivables
- third parties 84 155
- associated companies 28 930
- parent company 1.3 23 362 22 423
Bank 2 162 25 636 8 930 32 438
Total assets 138 555 182 776
55
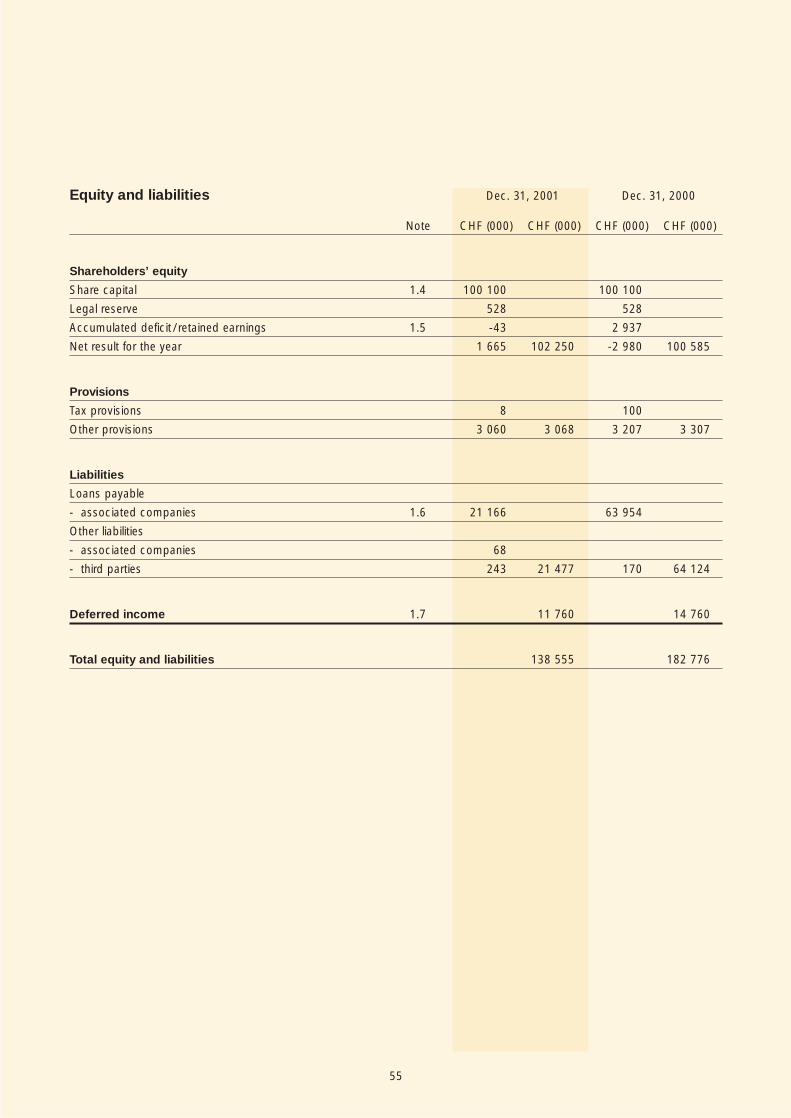
Equity and liabilities Dec. 31, 2001 Dec. 31, 2000
Note CHF (000) CHF (000) CHF (000) CHF (000)
Shareholders’ equity
Share capital 1.4 100 100 100 100
Legal reserve 528 528
Accumulated deficit / retained earnings 1.5 -43 2 937
Net result for the year 1 665 102 250 -2 980 100 585
Provisions
Tax provisions 8 100
Other provisions 3 060 3 068 3 207 3 307
Liabilities
Loans payable
- associated companies 1.6 21 166 63 954
Other liabilities
- associated companies 68
- third parties 243 21 477 170 64 124
Deferred income 1.7 11 760 14 760
Total equity and liabilities 138 555 182 776

56
Pelikan Holding AG, Baar
Profit and Loss Account for 2001
2001 2000
Note CHF (000) CHF (000) CHF (000) CHF (000)
Income from investments 1 656 1 697
Other income 445 2 101 89 1 786
Administration expenses -2 829 -2 809
Exchange differences 67 -2 762 -4 833 -7 642
Interest income 1 102 1 159
Interest expense -2 512 -1 410 -2 534 -1 375
Extraordinary income 2.1 5 057 10 294
Extraordinary expenses 2.2 -1 140 3 917 -5 947 4 347
Result before taxation 1 846 -2 884
Taxes -181 -96
Net result for the year 1 665 -2 980
57
Pelikan Holding AG, Baar
Notes to the Financial Statements 2001
1. Notes to the Balance Sheet as atDecember 31, 2001
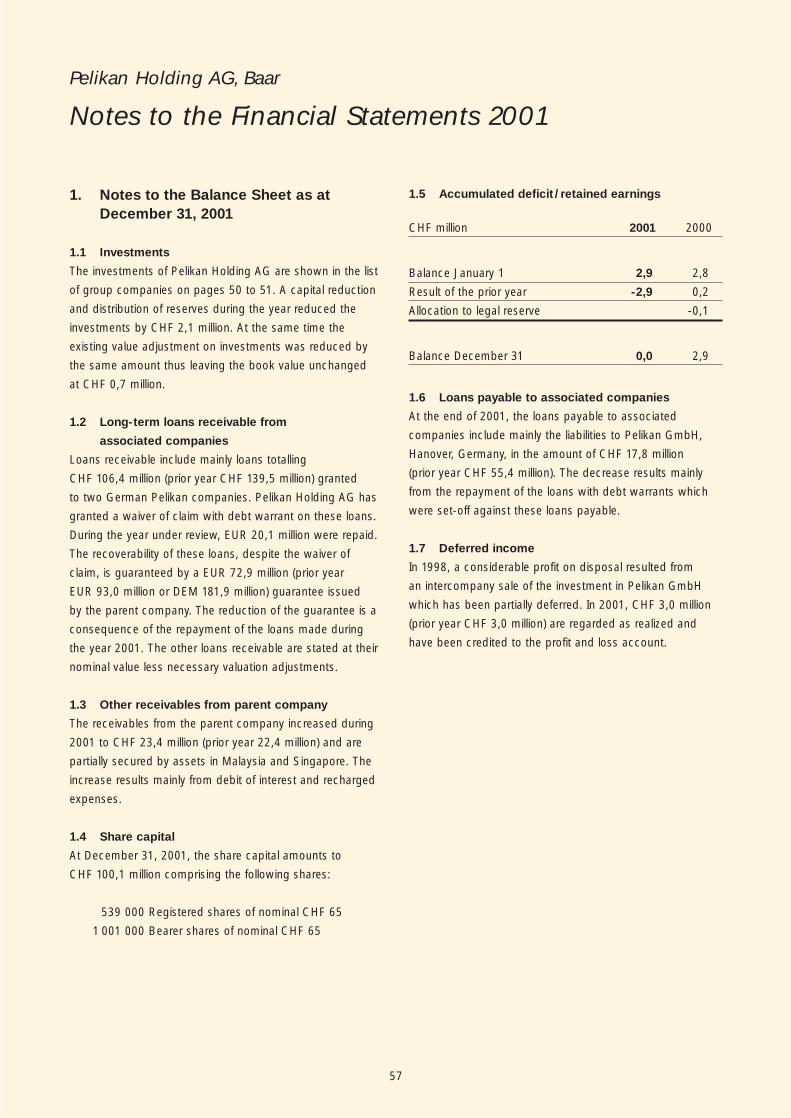
1.1 Investments
The investments of Pelikan Holding AG are shown in the list
of group companies on pages 50 to 51. A capital reduction
and distribution of reserves during the year reduced the
investments by CHF 2,1 million. At the same time the
existing value adjustment on investments was reduced by
the same amount thus leaving the book value unchanged
at CHF 0,7 million.
1.2 Long-term loans receivable from
associated companies
Loans receivable include mainly loans totalling
CHF 106,4 million (prior year CHF 139,5 million) granted
to two German Pelikan companies. Pelikan Holding AG has
granted a waiver of claim with debt warrant on these loans.
During the year under review, EUR 20,1 million were repaid.
The recoverability of these loans, despite the waiver of
claim, is guaranteed by a EUR 72,9 million (prior year
EUR 93,0 million or DEM 181,9 million) guarantee issued
by the parent company. The reduction of the guarantee is a
consequence of the repayment of the loans made during
the year 2001. The other loans receivable are stated at their
nominal value less necessary valuation adjustments.
1.3 Other receivables from parent company
The receivables from the parent company increased during
2001 to CHF 23,4 million (prior year 22,4 million) and are
partially secured by assets in Malaysia and Singapore. The
increase results mainly from debit of interest and recharged
expenses.
1.4 Share capital
At December 31, 2001, the share capital amounts to
CHF 100,1 million comprising the following shares:
539 000 Registered shares of nominal CHF 65
1 001 000 Bearer shares of nominal CHF 65
1.5 Accumulated deficit /retained earnings
CHF million 2001 2000
Balance January 1 2,9 2,8
Result of the prior year -2,9 0,2
Allocation to legal reserve -0,1
Balance December 31 0,0 2,9
1.6 Loans payable to associated companies
At the end of 2001, the loans payable to associated
companies include mainly the liabilities to Pelikan GmbH,
Hanover, Germany, in the amount of CHF 17,8 million
(prior year CHF 55,4 million). The decrease results mainly
from the repayment of the loans with debt warrants which
were set-off against these loans payable.
1.7 Deferred income
In 1998, a considerable profit on disposal resulted from
an intercompany sale of the investment in Pelikan GmbH
which has been partially deferred. In 2001, CHF 3,0 million
(prior year CHF 3,0 million) are regarded as realized and
have been credited to the profit and loss account.
58
2. Notes to the Profit and Loss Account for 2001
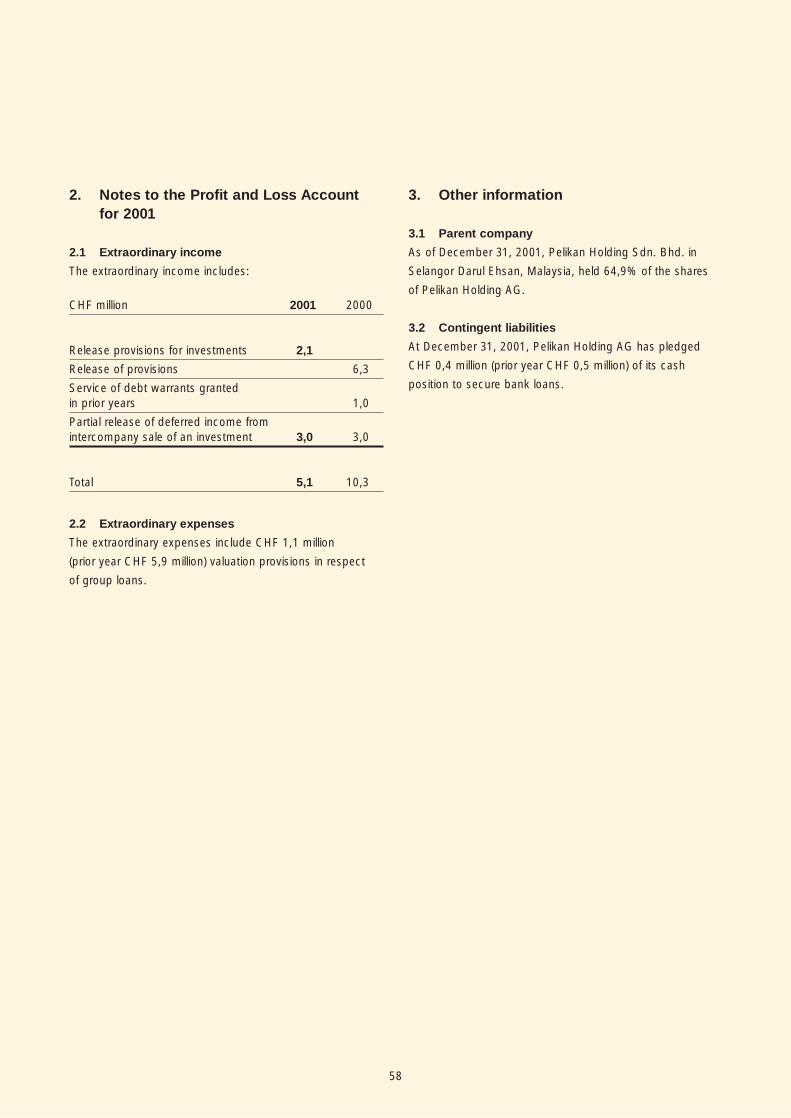
2.1 Extraordinary income
The extraordinary income includes:
CHF million 2001 2000
Release provisions for investments 2,1
Release of provisions 6,3
Service of debt warrants granted in prior years 1,0
Partial release of deferred income fromintercompany sale of an investment 3,0 3,0
Total 5,1 10,3
2.2 Extraordinary expenses
The extraordinary expenses include CHF 1,1 million
(prior year CHF 5,9 million) valuation provisions in respect
of group loans.
3. Other information
3.1 Parent company
As of December 31, 2001, Pelikan Holding Sdn. Bhd. in
Selangor Darul Ehsan, Malaysia, held 64,9% of the shares
of Pelikan Holding AG.
3.2 Contingent liabilities
At December 31, 2001, Pelikan Holding AG has pledged
CHF 0,4 million (prior year CHF 0,5 million) of its cash
position to secure bank loans.
59
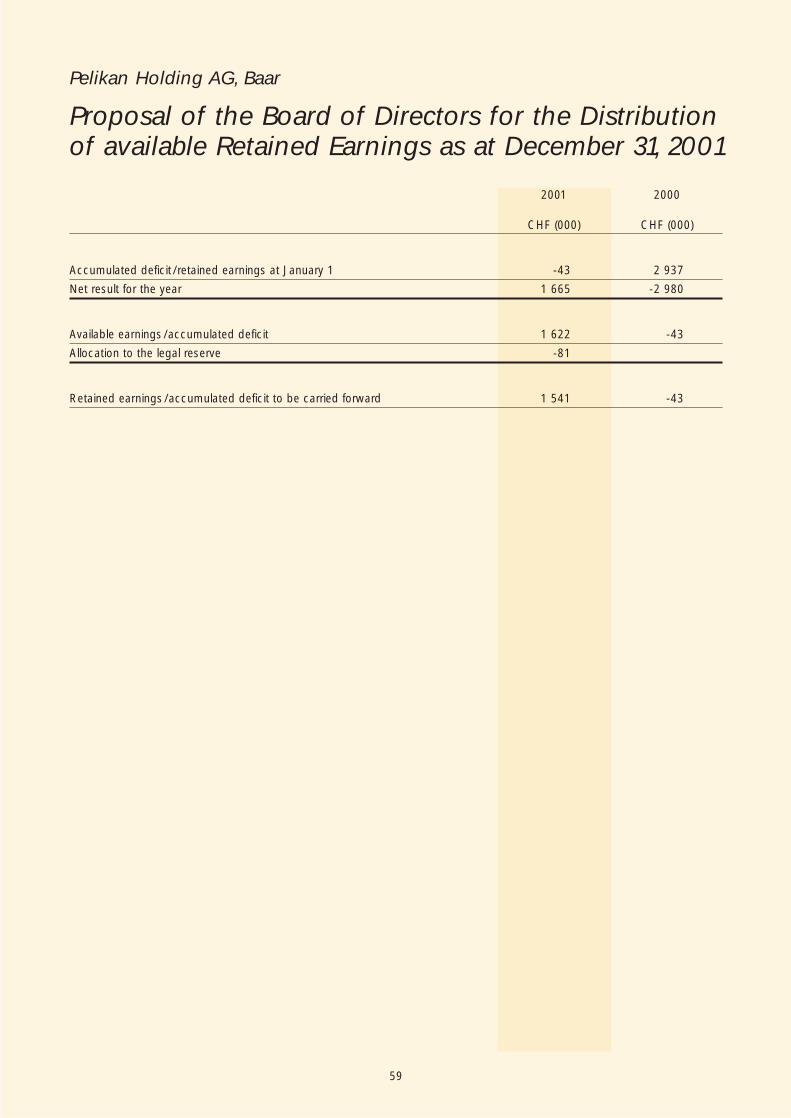
Pelikan Holding AG, Baar
Proposal of the Board of Directors for the Distributionof available Retained Earnings as at December 31, 2001
2001 2000
CHF (000) CHF (000)
Accumulated deficit /retained earnings at January 1 -43 2 937
Net result for the year 1 665 -2 980
Available earnings/accumulated deficit 1 622 -43
Allocation to the legal reserve -81
Retained earnings/accumulated deficit to be carried forward 1 541 -43
60
Pelikan Holding AG, Baar
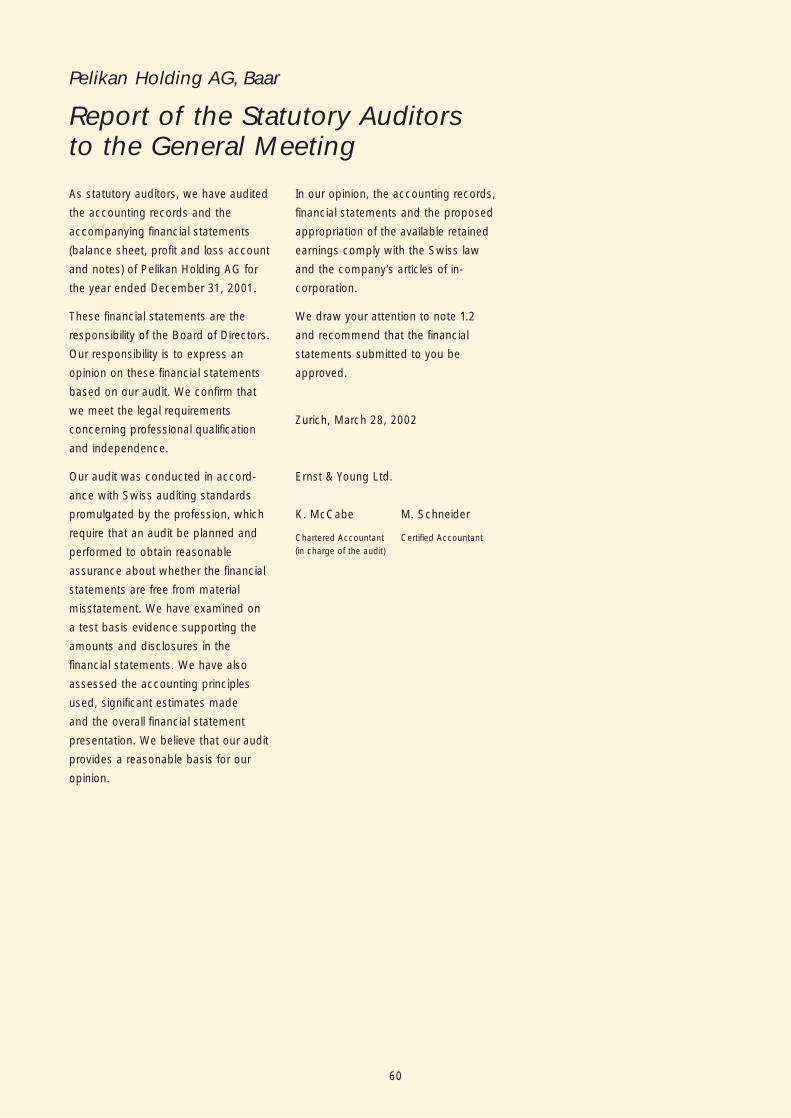
Report of the Statutory Auditorsto the General Meeting
As statutory auditors, we have audited
the accounting records and the
accompanying financial statements
(balance sheet, profit and loss account
and notes) of Pelikan Holding AG for
the year ended December 31, 2001.
These financial statements are the
responsibility of the Board of Directors.
Our responsibility is to express an
opinion on these financial statements
based on our audit. We confirm that
we meet the legal requirements
concerning professional qualification
and independence.
Our audit was conducted in accord-
ance with Swiss auditing standards
promulgated by the profession, which
require that an audit be planned and
performed to obtain reasonable
assurance about whether the financial
statements are free from material
misstatement. We have examined on
a test basis evidence supporting the
amounts and disclosures in the
financial statements. We have also
assessed the accounting principles
used, significant estimates made
and the overall financial statement
presentation. We believe that our audit
provides a reasonable basis for our
opinion.
In our opinion, the accounting records,
financial statements and the proposed
appropriation of the available retained
earnings comply with the Swiss law
and the company’s articles of in-
corporation.
We draw your attention to note 1.2
and recommend that the financial
statements submitted to you be
approved.
Zurich, March 28, 2002
Ernst & Young Ltd.
K. McCabe M. Schneider
Chartered Accountant Certified Accountant(in charge of the audit)
61
Pelikan Holding AG, Baar
Institutions
Board of Directors
Hooi Keat Loo
President
Selangor Darul Ehsan / Malaysia
Benno Zehnder
Vice President
Remetschwil / Switzerland
Markus Kündig
Member
Zug / Switzerland
Mirzan Bin Mahathir
Member
Selangor Darul Ehsan / Malaysia
Secretary of the Board
of Directors
Dr. Rico Jenny
Zurich / Switzerland
Auditors
Ernst & Young Ltd.
Zurich / Switzerland
62
Pelikan Companies
EUROPE
AustriaFaber-Castell Pelikan Austria Ges.mbHIndustriestrasse B16A-2345 Brunn am GebirgeTel. +43 2236 3010Fax +43 2236 33655E-Mail [email protected] www.pelikan.at
GermanyPelikan GmbHPodbielskistrasse 141D-30177 Hanover Tel. +49 511 6969 1Fax +49 511 6969 212E-Mail [email protected]
Pelikan PBS-Produktionsgesellschaft mbH & Co. KGFactory VöhrumPelikanstrasse 11D-31228 PeineTel. +49 517 1299 0Fax +49 517 1299 205E-Mail [email protected]
Pelikan Vertriebsgesellschaft mbH & Co. KGPodbielskistrasse 141D-30177 Hanover Tel. +49 511 6969 0Fax +49 511 6969 212E-Mail [email protected] (domestic sales)E-Mail [email protected] (international sales)Website www.pelikan.de
GreecePelikan Hellas E.P.E.8 Km of Vari-Koropi AvenueP.O. Box 235GR-194 00 Koropi /AtticaTel. +30 1 6625 129Fax +30 1 6626 232E-Mail [email protected] www.henkel-pelikan.gr
ItalyPelikan Italia S.p.A.Via Stephenson 43/AI-20157 MilanTel. +39 02 39016 312Fax +39 02 39016 361E-Mail [email protected]
SpainPelikan S.A.Valencia, 307- 313E-08009 BarcelonaTel. +34 93 476 2600Fax +34 93 459 1867E-Mail [email protected] www.pelikan.es
SwitzerlandPelikan (Schweiz) AGChaltenbodenstrasse 8CH-8834 SchindellegiTel. +41 1 786 70 20Fax +41 1 786 70 21E-Mail [email protected] www.pelikan.ch
Pelikan Holding AGZugerstrasse 76bCH-6340 BaarTel. +41 41 768 50 90Fax +41 41 768 50 95E-Mail [email protected] www.pelikan.ch
LATIN-AMERICA
ArgentinaPelikan Argentina S.A.Av. Belgrano 1586 8° PisoC1093AAQ Buenos Aires/ArgentinaTel. +54 11 4124 3100Fax +54 11 4124 3199E-Mail [email protected] www.pelikan.com.ar
ColombiaIndistri S.A.Carrera 65b, no. 19-17Santafé de Bogotá, ColombiaTel. +57 1 2611 711Fax +57 1 2905 550E-Mail [email protected] www.indistripen.com

63
MexicoProductos Pelikan S.A. de C.V.Carretera a Tehuacán No. 1033Col. MaravillasMéx-C.P. 72225 Puebla, Pue.Tel. +52 222 282 6230Fax +52 222 282 6520E-Mail [email protected] www.pelikan.com.mx
PeruCarbolan S.A.Ave. Raul Haya de la Torre 2230Apartado 1730PE-Lima 3Tel. +51 1 326 1471Fax +51 1 326 1476E-Mail [email protected]
REST OF THE WORLD
AustraliaColumbia Pelikan PTY Ltd./Pelikan Quartet PTY Ltd.91 Ashford AvenueMilperra, NSW 2214, AustraliaTel. +61 2 9774 4144Fax +61 2 9774 2610E-Mail [email protected] www.pelikan.com.au
JapanPelikan Japan K.K.Ishida Bldg. 3F3-14-1, UenoTaito-ku, Tokyo 110-0005, JapanTel. +81 3 3836 6541Fax +81 3 3836 6545E-Mail [email protected]
PARENT COMPANY AND ITS RELATED COMPANIES
MalaysiaPelikan Holding Sdn. Bhd.Lot 3410 Jalan Mukim Petaling12 1/2 Miles Puchong47100 Selangor Darul Ehsan, MalaysiaTel. +603 8062 1223Fax +603 8062 3407E-Mail [email protected]
SingaporePelikan Singapore-Malaysia Pte. Ltd.41, Jalan Pemimpim # 92-94Kong Beng Ind. Bldg.Tel. +65 2585 231Fax +65 2584 157E-Mail [email protected]
TaiwanPelikan Singapore-Malaysia Pte. Ltd.Taiwan Branch1F, 32, Lane 21, Hwang Chi StreetTaipei, Taiwan 111Tel. +886 2 8866 5818Fax +886 2 8866 3102E-Mail [email protected]
ThailandPelikan (Thailand) Co. Ltd.91 Ratchadapisek-Thonburi Road (thapra Taksin)Bukkalo, Thonburi, Bangkok 10800, ThailandTel. +662 876 5730 4Fax +662 477 9810E-Mail [email protected]
A list of all group and associated companies of the
Pelikan Group is shown on pages 50 to 51.
Further information as well as representatives
in other countries are listed in the Internet at
www.pelikan.com.
Publisher:Pelikan Holding AGCH-6340 Baar
Photography:Rolf & Sales NussbaumerCH-6315 Oberägeri
Design/realization:messerli werben aswCH-8913 Ottenbach
Printing:Multicolor Print AG/Kündig DruckCH-6341 Baar