pelagic organism decline (pod): acute and chronic ... · contents page i. executive summary 1 ii....
TRANSCRIPT

Aquatic Toxicology Laboratory School of Veterinary Medicine
University of California Davis, California
Pelagic Organism Decline (POD): Acute and Chronic Invertebrate and Fish Toxicity Testing in
the Sacramento-San Joaquin Delta 2008-2010
Final Report
Submitted to the California Department of Water Resources July 24, 2010
Inge Werner, Dan Markiewicz, Linda Deanovic, Richard Connon, Sebastian Beggel, Swee Teh, Marie Stillway, Charissa Reece

ACKNOWLEDGMENTS
We would like to thank the staff of the UC Davis Aquatic Toxicology Laboratory for their hard work. We are grateful for the services provided by the California Department of Fish and Game, in particular the assistance of their boat operators and use of boats for the collection of water samples. The UC Davis Fish Conservation and Culture Laboratory, Byron, CA, supplied delta smelt and a wealth of advice for our laboratory studies with this species. Funding was provided by the Interagency Ecological Program, Sacramento, California (Contract No. 4600008070 to I. Werner). A postgraduate scholarship of the Bayerische Forschungsstiftung (Bavarian Research Foundation), Germany, provided funding for S. Beggel. We gratefully acknowledge the contribution of the California Urban Water Agencies which funded part of the analytical chemistry for our species sensitivity studies. The Central Valley Regional Water Quality Control Board provided support for part of the copepod tests, and for producing the manuscript “Evaluating the Suitability of Hyalella azteca Water Column Tests for the Detection of Insecticide Toxicity” (Deanovic et al.).
ii

CONTENTS
Page
I. Executive Summary 1 II. Background and Approach 6 III. Toxicity Monitoring in the Sacramento-San Joaquin Delta 8
III.1 Study Design 8
III.1.1 Sampling Sites 8 III.1.2 Collection of Water Samples 10
III.1.3 Water Quality at Sampling Sites 11
III.2 Toxicity Monitoring with Hyalella azteca 11
III.2.1 Methods 11
III.2.1.1 Toxicity Testing 11
III.2.1.2 Toxicity Identification Evaluations 12
III.2.1.3 Statistical Analysis 13
III.2.1.4 Analytical Chemistry 13
III.2.1.5 Quality Assurance/Quality Control 14
III.2.2 Results 14
III.2.2.1 Acute Toxicity – Effects on 10-d Survival 21
III.2.2.2 Toxicity Identification Evaluations 21
III.2.2.3 Chronic Toxicity – Effects on 10-d Growth 21
III.2.2.4 Analytical Chemistry 28
III.3 Toxicity Monitoring with Delta Smelt (Hypomesus 36 transpacificus) III.3.1 Methods 36
III.3.1.1 Toxicity Testing 36
III.3.1.2 Statistical Analysis 36
III.3.2 Results 37
III.4 In Situ Monitoring on the Sacramento & 41 San Joaquin Rivers III.4.1 Methods 41
III.4.1.1 System Design 41
iii

Page III.4.1.2 Exposure Experiments 42
III.4.1.3 Statistical Analysis 45
III.4.2 Results 45
III.4.3 Discussion 48
III.5 Toxicity Monitoring with Copepods 49
III.5.1 Methods 49
III.5.1.1 Collection and Culturing 49
III.5.1.2 Disease and Treatment 50
III.5.1.3 Toxicity Testing 50
III.5.1.4 Statistical Analysis 52
III.5.2 Results 52
III.6 Quality Assurance / Quality Control 53
III.7 References 57
IV. Comparative Sensitivity of Resident Species to Chemical 58 Stressors
IV.1 Methods 58 IV.1.1 Hypomesus transpacificus 58
IV.1.2 Pimephales promelas 59
IV.1.3 Hyalella azteca 60
IV.1.4 Ceriodaphnia dubia 60
IV.1.5 Eurytemora affinis 61
IV.1.5 Statistical Analysis 61
IV.1.6 Analytical Chemistry 62
IV.2 Results 62 IV.2.1 H. transpacificus 62
IV.2.2 P. promelas 63
IV.2.3 H. azteca 68
IV.2.4 C. dubia 73
IV.2.5 E. affinis 78
IV.2.6 Interspecies Comparison 80
IV.2.6.1 Fish 80
IV.2.6.2 Invertebrates 81
iv

Page
IV.3 Acute Toxicity of Ammonia, Copper, and Pesticides to 84 Eurytemora affinis, of the San Francisco Estuary. S. J. Teh, S. Lesmeister, I. Flores, M. Kawaguchi and C. Teh
IV.4 Evaluating the suitability of Hyalella azteca water column 92 tests for the detection of insecticide toxicity. L. A. Deanovic,
D. Markiewicz, M. Stillway, S. Fong and I. Werner. Manuscript in preparation.
V. Sublethal Indicators of Contaminant Effects 116
V.1 Linking mechanistic and behavioral responses to sublethal esfenvalerate exposure in the endangered delta smelt; Hypomesus transpacificus (Fam. Osmeridae). R. E. Connon, J. Geist, J. Pfeiff, A. V. Loguinov, L. S. D'Abronzo, H.Wintz, C. D. Vulpe and I. Werner. BMC Genomics 2009, 10:608.
V.2 Linking molecular biomarkers with higher level condition 134 indicators to identify effects of copper exposures on the endangered delta smelt (Hypomesus transpacificus). Connon R.E., Pfeiff J., Loguinov A.S., D’Abronzo L.S., Vulpe C.D., Werner I. Environmental Toxicology and Chemistry, Manuscript accepted pending revision.
V.3 Sublethal responses to ammonia in the endangered delta smelt; 164 Hypomesus transpacificus (Fam. Osmeridae). R. E. Connon, L. S. D’Abronzo, L. Deanovic and I. Werner. Manuscript in preparation.
V.4 Cytochrome P450 induction in the striped bass (Morone 176 saxatilis): signature biomarkers of past and present xenobiotic exposure. R. E. Connon, E.D.H. Durieux, L. S. D’Abronzo, D. J. Ostrach and I. Werner. Manuscript in preparation.
V.5 Molecular evaluation of environmental contaminant extracts in 186 striped bass (Morone saxatilis) collected from semi permeable membrane devices deployed in the San Francisco Estuary. Connon R.E., D’Abronzo L.S., Ostrach D. J., Werner I.
V.6 Toxicity of commercial insecticide formulations and their active 191 ingredients to larval fathead minnow (Pimephales promelas). Beggel S., Werner I., Connon R.E., Geist J. Science of the Total Environment 2010, 408:3169–3175.
V.7 Changes in gene expression in larval fathead minnow 198 (Pimephales promelas) following short-term exposure to two insecticides, bifenthrin and fipronil. Beggel S., Connon R.E., Geist J., Werner I. Manuscript in preparation.
v

vi
Page
APPENDIX 212
A. Analytical Chemistry and Laboratory Control Water Types 213
B. Summary Tables: H. azteca Ambient Toxicity Tests 218
C. Summary Tables: Delta Smelt Ambient Toxicity Tests 545
D. Summary Tables: In Situ Toxicity Tests 580
E. Summary Tables: E. affinis Ambient Toxicity Test 595
F. Summary Tables: Delta Smelt Sensitivity Tests 598
G. Summary Tables: Fathead Minnow Sensitivity Tests 610
H. Summary Tables: H. azteca Sensitivity Tests 625
I. Summary Tables: E. affinis Sensitivity Tests 643
J. Summary Tables: C. dubia Sensitivity Tests 648
K. Quality Assurance/Quality Control: Relative Percent Differences 671

2008-2010: Final Report
I. Executive Summary
The study described here encompasses (1) a 2-year toxicity monitoring program in the Sacramento-San Joaquin (SSJ) Delta, including several sites in Suisun Bay and the Napa River; (2) laboratory investigations on the comparative sensitivity of important fish and aquatic invertebrate species to chemical contaminants of concern in the Delta; and (3) studies to develop biomarker tools for fish species of special interest.
1. Toxicity Monitoring
From January 1, 2008 to December 31, 2009, the UC Davis Aquatic Toxicology Laboratory and California Department of Fish and Game collected (biweekly) 752 water samples from 16 sites in the Northern Sacramento-San Joaquin Estuary. Toxicity tests were performed using Hyalella azteca, an amphipod species resident in the Delta, with survival and growth as acute and chronic endpoints, respectively. Routine partial toxicity identification evaluation (TIE) tests were conducted on all water samples with piperonyl-butoxide (PBO), a chemical synergist/antagonist, to provide early evidence for the presence of two classes of toxic insecticides: pyrethroids and organophosphates. During spring (March – May), water samples from five sites (340, Cache-Lindsay, Hood, Light 55, and Suisun) were tested for toxicity to larval delta smelt (Hypomesus transpacificus). Exposure systems for in situ monitoring (continuous flow toxicity testing on-location at field sites) were designed and tested at two DWR water quality monitoring stations (Rough & Ready Island - San Joaquin River; Hood - Sacramento River). Test organisms were H. transpacificus, fathead minnows (Pimephales promelas), and H. azteca. Laboratory test methods were developed for the calanoid copepod, Eurytemora affinis.
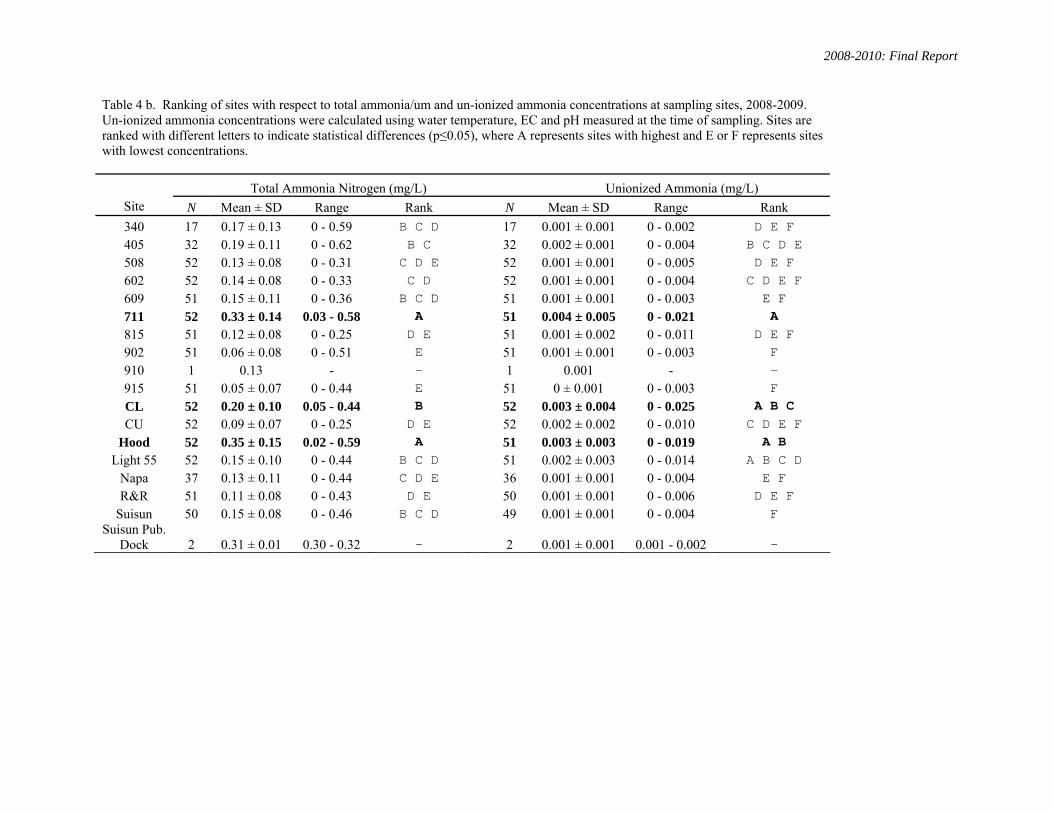
Water Quality at Field Sites: Water quality parameters were routinely monitored in ambient water samples. Field water temperature ranged from 6.8 (Cache-Ulatis) to 29.8oC (Rough & Ready Island), dissolved oxygen from 5.1 (Suisun Slough at Rush Ranch) to 14.9 mg/L (site 711 – Rio Vista), electrical conductivity from 101 (site 711) to 24,965 µS/cm (Napa River), pH from 6.43 (site 405 - Carquinez Strait) to 8.70 (Napa River) and turbidity from 2 (multiple sites) to 713 NTU (Napa River). Highest total ammonia/um concentrations were 0.62 mg/L at site 405; 0.59 mg/L at Hood and 0.58 mg/L at site 711 (Rio Vista). Un-ionized ammonia concentrations were highest at stations Cache-Lindsey and 711 with maximum concentrations of 0.025 and 0.021 mg/L, respectively. During the project period, water at Hood, 711 and Cache-Lindsey had significantly higher total ammonia/um and un-ionized ammonia concentrations than all other study sites, overall.
Toxicity Monitoring with H. azteca: Four water samples (0.5% of total) from sites 711, Light 55, 405 and Suisun Slough at Rush Ranch, were acutely toxic to the amphipods. Two of these (site 711 and Suisun Slough) had less than 50% survival. Addition of PBO increased acute toxicity in seven ambient samples (0.9% of total) suggesting the presence of pyrethroid insecticides. Three of these contained detectable concentrations of pyrethroids: cypermethrin (site 902 – Old River, Aug. 28, 2008); bifenthrin and lambda-cyhalothrin (Cache-Ulatis, Feb. 28, 2008); and permethrin (Hood, Jun. 23, 2009). Although toxicity identification evaluation indicated that pyrethroid insecticides were the dominant toxicants in other samples from Cache-Ulatis (collected Jan. 31, 2008 and Oct. 15, 2009), and from Suisun Slough (collected on August 12,
1

2008-2010: Final Report
2008), pyrethroids were below detection limits. We conclude that loss of pyrethroid pesticides due to degradation and adsorption poses problems for the confirmation of toxicity testing results by analytical chemistry at concentrations that can cause toxic effects in sensitive invertebrates (for details see Chapter IV.4).
Chronic toxicity in the form of reduced amphipod growth compared to controls was detected in 7 samples (0.9 % of total) without apparent seasonal or geographic patterns. Amphipods exposed to a sample from Cache-Ulatis (collected Jan. 31, 2008) not only grew significantly less than control animals, but PBO addition also synergized acute toxicity of the ambient sample (see above). This shows that effects seen after PBO addition (“PBO effects”) can signal the presence of pyrethroid insecticides at concentrations that cause sublethal toxicity. A total of 100 samples (13.3 %) showed significant PBO effects on amphipod growth, 45 in 2008 and 55 in 2009. Of these, 36 (4.8% of total samples tested) showed an increase in weight with PBO addition (“antagonistic PBO effect”), and 64 (8.5% of total) a decrease (“synergistic PBO effect”). Overall, Cache-Ulatis had the greatest number of samples demonstrating PBO effects on survival suggested the presence of pyrethroid insecticides. Sites Hood, Cache-Ulatis, Rough and Ready Island, Suisun Slough at Rush Ranch, Light 55, 915 and 508 had the greatest number of samples with PBO effects on amphipod growth.
A total of 113 water samples were submitted for chemical analysis. Pyrethroids, in particular cyfluthrin (≤20 ng/L), permethrin (≤35 ng/L), cypermethrin (≤16 ng/L), bifenthrin (≤117 ng/L) and esfenvalerate (≤9 ng/L), were detected in 24 samples, organophosphates, in particular chlorpyrifos (≤10 ng/L), diazinon (≤12 ng/L) and disulfoton (≤17 ng/L), were detected in 13 samples, and the herbicide diuron (≤86 ng/L) was detected in all ten samples it was analyzed in. Relatively high concentrations of dissolved copper (4.4-4.9 µg/L) were detected in water samples from Cache-Lindsey and Rough and Ready Island, both freshwater sites. Numerous samples contained more than one contaminant.
Effect of ammonia/um on amphipod survival and growth: Correlation analysis of data collected over a 4-year monitoring period (2006-2010) revealed significant relationships between amphipod survival and growth at several sites. Total ammonia/um concentrations were negatively correlated with amphipod survival at Cache-Ulatis. Amphipod growth negatively correlated with total ammonia/um at sites 405, 609, 711, Light 55, Napa and Rough and Ready Island, and with un-ionized ammonia at Rough and Ready Island.
Toxicity Monitoring with larval delta smelt: Results of tests conducted in March – May, 2008, suggest that among six sampling sites (340 - Napa River, Cache-Lindsey, Hood, Light 55, and Rough & Ready Island), water quality at Hood was least favorable for larval delta smelt. Water from Hood generally had the lowest EC and turbidity. Even though control treatments included water adjusted to the lowest EC or low turbidity, these two parameters combined may have caused or contributed to the high mortality observed in water samples from Hood. Overall, survival was highest in water from Suisun Slough, the Napa River and Light 55.
In 2009, antibiotics were added to all tests due to concerns regarding disease compromising control survival. This measure improved delta smelt control survival in
2

2008-2010: Final Report
2009 tests. Additional control treatments were added to account for turbidity and/or EC effects, which showed that the combination of these two stress factors was more stressful to fish than each factor by itself. Survival was significantly lower than controls in three samples collected from the San Joaquin River at Rough & Ready Island. This was attributed to toxic contaminants in the sample collected on May 14, 2009, however, low turbidity as a contributing stress factor cannot be ruled out in the other two. In addition, samples from Hood and Cache Lindsey on April 29, 2009, were acutely toxic to larval delta smelt. As in 2008, water from Suisun Slough had the highest survival, overall.
We conclude that water quality in the Sacramento River at Hood, in the San Joaquin River at Rough & Ready Island, and near the confluence of Cache and Lindsey Sloughs is at times unfavorable for larval delta smelt. This may in some cases be partly attributable to low turbidity stress. Turbidity, and to a lesser degree salinity/EC, are extremely important parameters influencing larval delta smelt survival. All testing therefore requires controls matching the salinity/EC and turbidity of each sample to obtain conclusive data on water toxicity.
In Situ Monitoring: A sophisticated exposure system was designed and installed for simultaneous in situ exposures of multiple fish and invertebrate species at two DWR water quality monitoring stations located in Hood, (Sacramento River) and Rough & Ready Island in Stockton (San Joaquin River). During March - May, 2009, six exposure experiments were conducted using larval delta smelt, larval fathead minnow, and the amphipod H. azteca, concurrently with ambient delta smelt toxicity testing at UCD-ATL. Larval H. transpacificus survival was poor both in the control and ambient water. No toxicity to H. azteca or P. promelas was detected.
Toxicity Monitoring with Copepods: One 7-d toxicity pilot test using juvenile E. affinis was conducted in May 2009 with samples from sites 711, Cache-Ulatis, Hood, and Light 55, and a series of low EC controls (100, 250, 500, 1000, 1900 µS/cm). Results showed that EC can significantly affect copepod survival. Survival was highest in the 1900 µS/cm control and decreased with decreasing conductivity. Survival was low in ambient samples with the exception of Cache-Ulatis (100% survival) possibly due in part to the available food and/or higher turbidity.
2. Comparative Species Sensitivity
Toxic effect concentrations for larval delta smelt, larval fathead minnow, the amphipod H. azteca, the waterflea Ceriodaphia dubia, and the copepod E. affinis were determined for a series of chemical contaminants of interest in the Sacramento-San Joaquin Delta, including organophosphate (chlorpyrifos, diazinon) and pyrethroid (bifenthrin, cyfluthrin, esfenvalerate, permethrin) insecticides, copper, and ammonia.
Larval delta smelt were 1.8 to >11-fold more sensitive than fathead minnow to ammonia/um, copper, and all insecticides tested with the exception of permethrin.
E. affinis and C. dubia were most sensitive to ammonia/um, and C. dubia was most sensitive to copper. Waterfleas were the most sensitive, and copepods the least sensitive species with respect to the organophosphates, chlorpyrifos and diazinon. Amphipods were the most sensitive to all pyrethroid insecticides tested.
3

2008-2010: Final Report
Among toxicity test endpoints and species, C. dubia reproduction was the most sensitive with regard to copper and organophosphate insecticides, while H. azteca 10-d survival and growth were the most sensitive for detecting pyrethroid toxicity. The C. dubia chronic endpoint (reproduction) was far less sensitive than the acute endpoint (96-h survival) for pyrethroid toxicity, likely due to the differences in test protocols. An in-depth analysis of test methods is provided by Deanovic et al. (Chapter IV.4).
3. Sublethal Indicators of Contaminant Effects
Molecular biomarkers were developed to examine changes in gene expression after exposure to ambient water or known sublethal concentrations of contaminants. A cDNA microarray for delta smelt was developed with 8,448 Expressed Sequence Tags (ESTs) to study the effects of individual chemical stressors and exposure to Delta water samples; and to select mechanism-based biomarker genes for inclusion in mRNA-arrays. Biomarker responses were linked to ecologically relevant physiological effects. To date, gene responses were measured in larval and juvenile fish exposed to the pyrethroid insecticide esfenvalerate, copper and ammonia/um. Results from these studies support the use of functionally characterized suites of molecular biomarkers (mRNA arrays) to assess the effects of contaminants on aquatic species.
Biomarker Development for Delta Smelt - Esfenvalerate: Exposure to esfenvalerate affected swimming behavior of larval delta smelt at concentrations as low as 0.063 μg.L-1, and significant differences were seen in expression in genes involved in neuromuscular activity (Connon et al. 2009; Chapter V.1). Genes associated with immune responses, apoptosis, redox, osmotic stress, detoxification, and growth and development were also affected. Swimming impairment correlated significantly with expression of aspartoacylase (ASPA), an enzyme involved in brain cell function and associated with numerous neurological diseases in humans. Selected genes were investigated for their use as molecular biomarkers, and strong links were determined between measured downregulation in ASPA and observed behavioral responses in fish exposed to environmentally relevant pyrethroid concentrations.
Biomarker Development for Delta Smelt - Copper: Differences in sensitivity to copper were measured between juvenile and larval delta smelt (LC50-96h= 25.2 and 80.4 μg.Cu2+.L-1 respectively; Connon et al., Chapter V.2). Swimming velocity declined on exposure in a dose dependent manner. Genes encoding for ASPA, hemopexin, alpha-actin and calcium regulation proteins were significantly affected by exposure and were functionally linked with measured swimming responses. Effects on digestion were measured by upregulation of chitinase and downregulation of amylase. Downregulation of tumor necrosis factor indicated a compromised immune system.
Biomarker Development for Delta Smelt - Ammonia/um: A four-day exposure of 57-day old larvae resulted in a measured un-ionized ammonia (NH3) LC50 of 147µg.L-1, a NOEC of 66 µg.L-1 and LOEC 105 µg.L-1. Genome-wide gene expression was measured at 105 µg.L-1 and selected genes of interest were further investigated using quantitative PCR analyses. Genes predominantly encoding for membrane bound proteins responded significantly to ammonia exposure, however, neurological and muscular activity were also impaired (Connon et al., Chapter V.3).
4

2008-2010: Final Report
5
Biomarker Development for Striped Bass: To develop biomarker tools for striped bass (Morone saxatilis), the dynamics of CYP1A induction at different biological levels (gene expression / protein level / catalytic activity) were investigated (Connon et al., Chapter V.4). Specific objectives were to define the respective ranges of utilization as biomarkers of PAH contamination in this species, and to better understand the relationship of CYP1A gene expression with higher level cellular effects. Cytochrome P4501A (CYP1A) is a monooxygenase involved in xenobiotic biotransformation and detoxification.
Results showed that CYP1A gene expression responded rapidly to PAH exposure, and corresponding biotransformation and detoxification proteins were synthesized within the first few hours of exposure. CYP1A mRNA transcription was significantly upregulated in a dose response manner following 24 h post BNF injection, reaching a plateau at 25 mg.kg-1 at 180-fold change induction. Significant differences were measured at concentrations as low as 0.1 mg.kg-1, resulting in a 12-fold change in gene expression. This study demonstrated that methods used to measure the effect of PAH exposure at the molecular, protein and catalytic activity levels were successful in detecting CYP1A induction in striped bass. Models utilizing the differences in responses measured by each of the three biomarkers could be used to detect, in field situations, signatures of past and/or current exposure.
In addition, tissue samples from juvenile striped bass exposed to extracts of SPMD membranes deployed at several sites in the SSJ Delta were analyzed for expression of four stress-responsive genes, vitellogenin, CYP1A, metallothionein and hsp70 (Connon et al., Chapter V.5). Results provide preliminary indication of general stress and immune system responses at Boynton Slough and Sherman Lake sites.
Linking Molecular Biomarkers to Higher Level Effects in Fathead Minnow: Beggel et al. (2010; Chapter V.6) describe a study on the lethal and sublethal toxicity of commercial pesticide formulations and their active ingredients to larval fathead minnow (P. promelas). This study compared toxicity of two current-use insecticides, the pyrethroid bifenthrin, and the phenylpyrazole fipronil, to their commercial formulations, Talstar®
and Termidor®. Effect thresholds were determined for survival, growth and
swimming performance after short-term (24 h) exposure to insecticides. Results show that both formulation products were more toxic than their pure active ingredients. Detrimental effects on swimming performance were observed at 50% (142 μg.L-1
fipronil) and 20% (0.14 μg.L-1 bifenthrin) of the 24-h LC10. Detrimental effects on 7-d growth were observed following 24 h exposure to 53 μg.L-1 (10% LC10) fipronil.
Observed responses in a suite of biomarker genes demonstrate stress-related cellular effects in exposed fathead minnow larvae at 0.07 (bifenthrin) and 53 (fipronil) µg/L (Beggel et al., Chapter V.7). The initial response at very low concentrations likely indicates disturbance in cell homeostasis leading, with increasing concentration, to adaptive and compensatory responses. Effect concentrations for swimming abnormalities correspond to the onset of the second phase molecular responses, which tend to be dose-dependent. Recovery from insecticide-induced stress was reflected in expression levels of ASPA. Comparisons of biomarker expression data using “heatmaps” were able to distinguish between chemical type and exposure concentration, demonstrating the significant promise these tools hold for toxicity monitoring in field surveys.

POD 2008-2010: Final Report
6
II. Background and Approach
In the last several years, abundance indices of numerous pelagic fish species residing in the Sacramento-San Joaquin Delta of California, USA, have shown marked declines and record lows for the endemic delta smelt (Hypomesus transpacificus), age-0 striped bass (Morone saxatilis), longfin smelt (Spirinchus thaleichthys) and threadfin shad (Dorosoma petenense)(Stevens and Miller, 1983; Stevens et al., 1985; Moyle et al., 1992; Moyle and Williams, 1990).While several of these species have shown evidence of long-term declines, there appears to have been a precipitous “step-change” to very low abundance during the period 2002-2004 (Sommer et al. 2007). It is presently unclear what might have caused this critical population decline, but toxic contaminants may be one of several factors acting individually or in concert to lower pelagic productivity.
The goal of this study was to assess the role of chemical contaminants in the observed decline of pelagic species in the Delta. We approached this goal from multiple angles, including (i) monitoring of water column toxicity using single-species tests with the amphipod Hyalella azteca; (ii) laboratory toxicity tests of ambient samples using larval delta smelt (Hypomesus transpacificus); (iii) in situ toxicity tests using fathead minnow (Pimephales promelas), H. azteca and delta smelt; (iv) determination of comparative sensitivity to select contaminants of model species and important resident species; and (v) the development of sensitive biomarker tools for delta smelt and fathead minnow.
Toxicity monitoring with Hyalella azteca: The design of this study built on results of our 2006-2007 Delta-wide monitoring project to investigate toxicity of Delta water samples (Werner et al., 2008, Werner et al., in press). From January 1, 2006 to December 31, 2007, significant amphipod mortality was observed in 5.6 % of ambient samples. Addition of PBO significantly affected survival or growth in 1.1 % and 10.1 % of ambient samples, respectively. Sites in the Lower Sacramento River had the largest number of acutely toxic samples, high occurrence of PBO effects on amphipod growth (along with sites in the South Delta), and the highest total ammonia/um concentrations (0.28 ± 0.15 mg.L-1). It was concluded that ammonia/um and/or contaminants occurring in mixture with these, likely contributed to the observed toxicity. Pyrethroid insecticides were detected at potentially toxic concentrations. The 2008-10 study intensified toxicity testing in some ecologically important areas (Cache Slough/lower Sacramento, Suisun Marsh and Bay) of the Delta where acute toxicity was detected in 2007. Water samples were collected bi-weekly from 16 sites located in large delta channels and main-stem rivers, selected based on prevalent distribution patterns of fish species of concern. Ten-day laboratory tests with H. azteca survival and relative growth as toxicity endpoints were conducted. The enzyme inhibitor, piperonyl butoxide (PBO, 25 µg.L-1) was added to synergize or antagonize pyrethroid or organophosphate (OP) insecticide toxicity, respectively. When acute toxicity to the amphipod H. azteca (≥50 % mortality within 7 d) or significant PBO effects were detected, toxicity identification evaluations and/or chemical analysis were used in order to identify toxicant(s). If a sample causes ≥50 % mortality within 96 h, follow-up samples were collected in an attempt to identify the sources of toxicity. Appropriate sites for follow-up sampling were determined early in 2008 using land use and point source information. In addition, laboratory toxicity tests with larval delta smelt were performed in late April-July on water samples from select locations of special ecological interest such as Cache Slough, lower Sacramento and San Joaquin Rivers, and Suisun Marsh.
Toxicity monitoring with larval delta smelt (H. transpacificus): Toxicity tests using surrogate species are valuable first tier assessments, however, because of their limitations such tests should only be used as a first tier investigation. Sources of uncertainty when extrapolating from surrogate species tests to ecological effects include: variation among species and different life-stages in sensitivity to
POD 2008-2010: Final Report
7
chemical stressors, and effects of exposure duration and scenario. This study addressed the above limitations by developing laboratory toxicity tests for one of the resident species of special interest, the delta smelt, and by exposing multiple species in the field, using specially designed in situ systems. These in situ tests were conducted with fish (delta smelt and fathead minnows) and the invertebrate H. azteca at suitable locations (Hood, Rough & Ready Island) in the Delta.
Comparative sensitivity of aquatic species to chemical stressors: The lack of information on the toxic effects of contaminants on resident Delta species, among them delta smelt and important copepod prey species, so far prevents an estimation of the risk of chemical contamination to pelagic organisms of concern. This study addressed an urgent need for information on the comparative sensitivity of these ecologically important species relative to standard test species. Effect concentrations in the form of 96-h LC50, EC50, no observed effect level (NOEC), and lowest observed effect level (LOEC) were generated for several important resident species as well as standard test species. Testing included the copepod, Eurytemora affinis, the waterflea, Ceriodaphnia dubia, H. azteca, delta smelt, and fathead minnow. For standard test species, experiments were performed using laboratory control water as well as Delta water (“hatchery water”) to ensure environmental relevance of the test results. Delta smelt was tested in Delta (hatchery) water only. Copepods were tested in laboratory control water. The chemicals were selected based on their known presence in the Delta, recent past or present. They are copper, ammonia, the organophosphate (OP) insecticides chlorpyrifos and diazinon, and the pyrethroid insecticides cyfluthrin, bifenthrin, and permethrin (diazinon was replaced with esfenvalerate for fish testing). Copper is used as a pesticide in various forms, is a common chemical in stormwater runoff, and is ubiquitous in the aquatic environment. Ammonia is released from wastewater treatment plants. Chlorpyrifos is one of the most heavily used agricultural insecticides, and has recently been shown to be present at toxic concentrations in Ulatis Creek (Werner & Kuivila, 2004, unpublished data) and agricultural drains (California Regional Water Quality Control Board Agricultural Waiver Program, 2007). Diazinon, cyfluthrin, bifenthrin and permethrin were detected in 2007 in water column samples from various sites in the Delta (Werner et al., 2008). Bifenthrin has also commonly been detected in sediment samples from the region (K. Larsen, CVRWQCB, personal communication).
Development of biomarker tools for resident fish species of special interest: Sublethal effects of aquatic contaminants are difficult to detect, quantify and interpret in an ecological context. Traditional toxicity tests cannot detect the chronic, sublethal effects of modern contaminants, e.g. endocrine disrupting chemicals, immune suppressants and others, whose effects can have far-reaching deleterious consequences for fish and invertebrate populations in the wild. Approaches involving sensitive and mechanism-based biomarkers of toxic effects therefore need to be developed for future integration in monitoring programs to assess organism health and identify sublethal contaminant effects in fish species of concern. Changes in the gene transcription of stress response genes in resident fish can be powerful biomarkers for the identification of sublethal impacts of environmental stressors on aquatic organisms, and can provide information on the causative agents. Molecular biomarkers have been developed for striped bass (Geist et al., 2007, Chapter V), and for delta smelt (Chapter V). A complementary study focused on linking cellular biomarker responses detected in delta smelt and striped bass to ecologically relevant effects such as swimming ability, growth and survival using a model species, the fathead minnow (Chapter V).

POD 2008-2010: Final Report
8
III. Toxicity Monitoring in the Sacramento-San Joaquin Delta
III.1. Study Design
III.1.1 Sampling Sites
Water samples for ambient toxicity testing with H. azteca were collected bi-weekly from 1 January, 2008 to 31 December, 2009 from 16 sites in the Delta (Tables 1, 2, Figure 1). Water samples for tests with larval delta smelt were collected during spring and early summer from six sites: Suisun, Light 55, Hood, Cache-Lindsey, Rough and Ready and Napa.
Table 1. Site locations and sampling schedule during the 2008-20010 monitoring period.
Station Location Latitude Longitude Collection Day
340 Napa River, at the seawall 38-05’-51”N 122-15’-43.9”W Wednesday 405 Carquinez Straight, just west
of Benicia army dock 38-02’-22.9”N 122-09’-01.8”W Wednesday
Suisun DS Suisun Slough at Rush Ranch
38-12’-28.2”N 122-01’56.9”W Tuesday
508 Suisun Bay, off Chipps Island, opposite Sac. North Ferry Slip
38-02’-43.8”N 121-55’-07.7”W Wednesday
602 Grizzly Bay, northeast of Suisun Slough at Dolphin
38-06’-50.4”N 122-02’-46.3”W Wednesday
609 Montezuma Slough at Nurse Slough
38-10’-01.9”N 121.56’-16.8”W Wednesday
711 Sacramento River at the tip of Grand Island
38-10’-43.7”N 121-39’-55.1”W Thursday PM
Light 55 DS Sacramento River Deep Water Channel at Light 55
38-16’-26.5”N 121-39’-13.6”W Thursday AM
Hood DS DWR water quality monitoring station
38-22’-03.6”N 121-31’-13.6”W Tuesday
Cache-Lin DS Confluence of Lindsey Slough/Cache Slough
38-14’-39.2”N 121-41’-19.5”W Thursday AM
Cache-Ulatis
Upper Cache Slough, mouth of Ulatis Creek
38-17’-02.7”N 121-43’-04.3”W Thursday AM
815 San Joaquin, Confluence of Potato Slough
38-05’-06.4”N 121-34’-20.4”W Thursday PM
902 Old River at mouth of Holland Cut
38-01’-09.1”N 121-34’-55.9”W Thursday PM
915 Old River, western arm at Railroad Bridge
37-56’-33”N 121-33’-48.6”W Thursday PM
R&R DS San Joaquin, Rough & Ready Island
37-57’45.4”N 121-21’55.9”W Tuesday
Napa DS Napa River, Napa City at end of River Park Blvd.
38-16’-39.7”N 122-16’-56.9”W Tuesday
DS Sites sampled for both H. azteca and larval delta smelt tests.
POD 2008-2010: Final Report
9
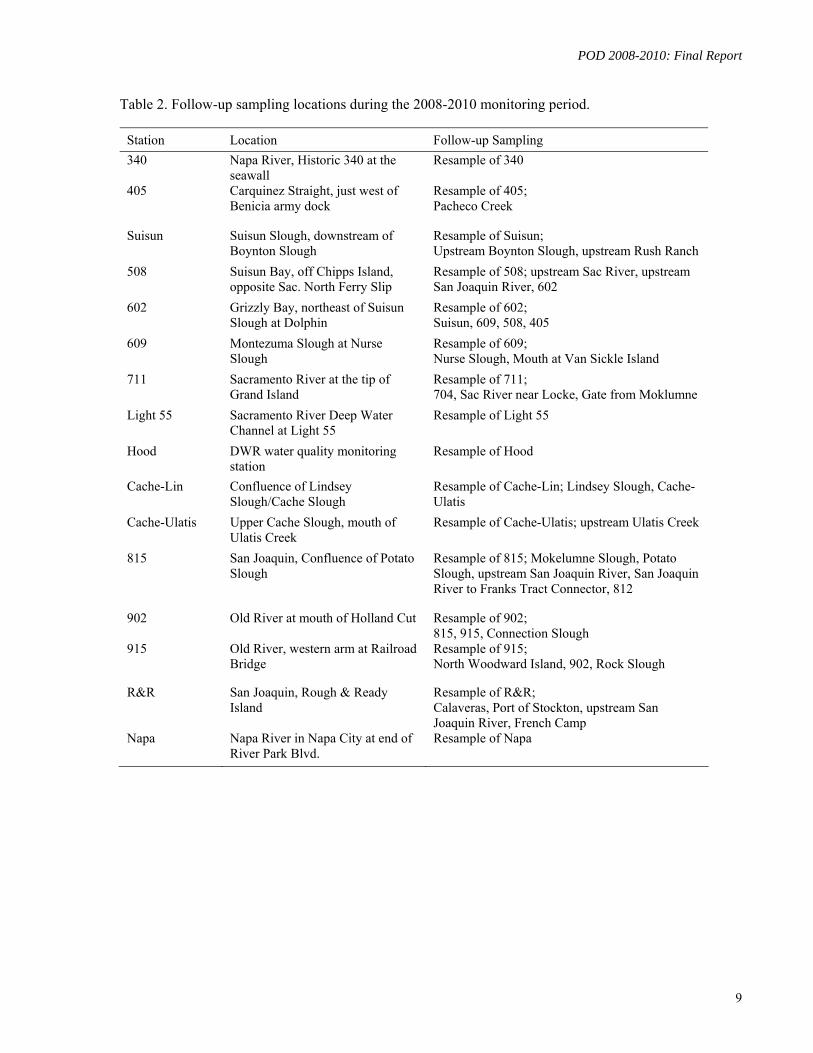
Table 2. Follow-up sampling locations during the 2008-2010 monitoring period.
Station Location Follow-up Sampling
340 Napa River, Historic 340 at the seawall
Resample of 340
405 Carquinez Straight, just west of Benicia army dock
Resample of 405; Pacheco Creek
Suisun Suisun Slough, downstream of Boynton Slough
Resample of Suisun; Upstream Boynton Slough, upstream Rush Ranch
508 Suisun Bay, off Chipps Island, opposite Sac. North Ferry Slip
Resample of 508; upstream Sac River, upstream San Joaquin River, 602
602 Grizzly Bay, northeast of Suisun Slough at Dolphin
Resample of 602; Suisun, 609, 508, 405
609 Montezuma Slough at Nurse Slough
Resample of 609; Nurse Slough, Mouth at Van Sickle Island
711 Sacramento River at the tip of Grand Island
Resample of 711; 704, Sac River near Locke, Gate from Moklumne
Light 55 Sacramento River Deep Water Channel at Light 55
Resample of Light 55
Hood DWR water quality monitoring station
Resample of Hood
Cache-Lin Confluence of Lindsey Slough/Cache Slough
Resample of Cache-Lin; Lindsey Slough, Cache-Ulatis
Cache-Ulatis Upper Cache Slough, mouth of Ulatis Creek
Resample of Cache-Ulatis; upstream Ulatis Creek
815 San Joaquin, Confluence of Potato Slough
Resample of 815; Mokelumne Slough, Potato Slough, upstream San Joaquin River, San Joaquin River to Franks Tract Connector, 812
902 Old River at mouth of Holland Cut Resample of 902; 815, 915, Connection Slough
915 Old River, western arm at Railroad Bridge
Resample of 915; North Woodward Island, 902, Rock Slough
R&R San Joaquin, Rough & Ready Island
Resample of R&R; Calaveras, Port of Stockton, upstream San Joaquin River, French Camp
Napa Napa River in Napa City at end of River Park Blvd.
Resample of Napa

POD 2008-2010: Final Report
10
Figure 1. Water sampling locations in 2008-2009, selected based on Interagency Ecological
Program summer townet survey stations.
III.1.2 Collection of Water Samples
Staff from the UC Davis Aquatic Toxicology Laboratory (UCD ATL) and the California Department of Fish and Game (CDFG) collected water samples by boat from the following sites: 340, 405, 508, 602, 609, 711, Light 55, Cache-Lindsey, Cache-Ulatis, 815, 902, and 915. Water samples from Hood, Rough & Ready, Suisun, and Napa were collected from shore. If the salinity exceeded the H. azteca tolerance limit of 15 ppt, samples were not collected. Subsurface grab samples were pumped from a depth of approximately 0.5 m using a standard water pump into clean, 1-gal amber LDPE cubitainers for invertebrate tests and 5-gal clear LDPE cubitainers for delta smelt tests.
In addition, site water was also collected in 1-gal clear LDPE cubitainers and 1-L amber-glass bottles for analytical chemistry. Water samples were transported, stored and preserved following
POD 2008-2010: Final Report
11
protocols outlined in the UCD ATL standard operating procedures (SOP), nos. 5-1 and 5-2 (UCD ATL, 2009). All cubitainers used for water collections were labeled with the site ID, collection date and time, and the initials of the sampler and then rinsed three times with ambient sample water prior to filling. Eight gallons of water were collected from each site for invertebrate testing along with two liters for analytical chemistry. During the spring, an additional 35 gallons were collected from selected sites for delta smelt toxicity testing. All samples were placed into an ice chest on wet ice for transport to the UCD ATL and ice was renewed as needed to keep the sample temperature at 0-6ºC (USEPA, 2002). Upon receipt at UCD ATL, water samples were stored in an environmental chamber at 0-6ºC.
III.1.3 Field Water Quality
Field water quality measurements including pH, specific conductivity (SC), electrical conductivity (EC), dissolved oxygen (DO) and temperature were recorded for each site and sampling time. DO and SC were measured using YSI 85 meters, and pH was measured with a Beckman 240 pH meter. Meters for DO/SC/EC and pH measurements were calibrated according to the manufacturer’s instructions at the start of each field day. Turbidity and ammonia nitrogen were measured within 24 hours of sample receipt at UCD ATL using a Hach 2100P Turbidimeter and a Hach AmVer Ammonia Test'N Tube Reagent Set, respectively. For ammonia measurements the “low range” test kit (0-2.5 mg/L N) was used first. If the maximum value was exceeded the “high range” test kit (0-50 mg/L N) was used. Unionized ammonia concentrations for all samples were calculated using measured total ammonia-N, field temperature, field EC and field pH. General weather conditions and GPS coordinates were recorded for each site and sampling event. Tables 3-3 and 3-4 summarize minimum and maximum water quality data by site. III.2. Monitoring with Hyalella azteca
III.2.1. Methods
III.2.1.1 10-Day Acute and Chronic Water Column Toxicity Tests
H. azteca were purchased from Aquatic Research Organisms (Hampton, NH, USA). Upon receipt, amphipods were moved to 10-L aquaria, fed, and acclimated to laboratory test conditions for 48 h. The 10-d testing procedure used in this study was based on protocols described in the Quality Assurance Management Plan for the State of California's Surface Water Ambient Monitoring Program (California State Water Resources Control Board, http://www.waterboards.ca.gov/water_issues/ programs/swamp/qamp.shtml#appendixf). At test initiation, water samples were shaken vigorously in original sampling containers, and sub-samples were filtered through a 53-m screen to remove debris and larger organisms. Water was then warmed to test temperature (23 ± 1oC) in 600 ml beakers using a water bath maintained at 25±2oC, and aerated at a rate of 100 bubbles per minute until DO concentration was 4.9-8.9 mg.L-1. De-ionized water amended to US EPA moderately hard specifications (hardness: 90-100 mg.L-1 CaCO3, alkalinity: 50-70 mg.L-1 CaCO3, electrical conductivity (EC): 330-360 µS.cm-1, pH, 7.8-8.2; US EPA, 2002) was used for controls. One or multiple high-conductivity controls were added when the SC of an ambient sample was >10,000 µS.cm-1. A low conductivity control was added when the SC of an ambient sample was <100 µS.cm-1. Filtered (1 µm A/E glass fiber filter) Pacific Ocean seawater from Bodega Bay Marine Laboratory, Bodega Bay, CA, or de-ionized water was used to increase or decrease the conductivity of control water.
Tests were initiated with 9-14 d old H. azteca. Each of four replicate 250-ml glass beakers contained 100 ml of water, a small piece of nitex screen (approx. 6 cm2) for use as substrate for H.

POD 2008-2010: Final Report
12
azteca, and 10 organisms. Animals were fed a mixture of yeast, organic alfalfa and trout chow (1 ml per replicate) at test initiation and on days 2, 4, 5, 6, and 8 after water renewal. Tests were conducted at 23 ± 2°C with a 16h:8h L:D photoperiod. Mortality was recorded daily, and 80% of water was renewed every second day. On day 10, the surviving organisms were dried to constant weight at 103-105 °C, and weighed using a Mettler AE 163 balance.
Because the test protocol was changed from one water renewal on day 5 in our 2006-2008 monitoring study, to four water renewals on days 2, 4, 6 and 8 during the 2008-2010 study presented here, a methods comparison test was conducted at the beginning of the project to determine which method provided the greatest sensitivity to contaminants. Three different methods were tested concurrently using permethrin concentrations ranging from 30 to120 ng/L. Methods tested included the following: 1) day 5 renewal with 250 ml beakers; 2) every other day renewal with 250 ml beakers; and 3) every other day renewals with 20 ml scintillation vials. The 250 ml beakers contained 100 ml of sample and 10 organisms per replicate, whereas the scintillation vials contained 15 ml of sample and five animals per replicate. One-inch square piece of nitex screen were added to each test container as artificial substrate. Organisms were fed YCT at 1000 µl per 250 ml beaker or 150 µl per scintillation vial, on days 0, 2, 4, 6, and 8, regardless of water renewal frequency. Results showed that the 10-day LC50 was lowest for the “every other day renewal method” compared to the other two methods (Table 3). This most sensitive method was used as of January 1, 2008, for the entire duration of the 2008-2010 monitoring project.
Table 3. Effect concentrations derived from three H. azteca test methods using permethrin as toxicant.
Method Endpoint NOEC ng/L
LOEC ng/L
LC50 ng/L
Day 5 Renewal – 250 ml beakers 96 h 30 60 57.9 Day 5 Renewal – 250 ml beakers 10 d 30 60 53.8 Every other day Renewal – 250 ml beakers 96 h 30 60 53.7 Every other day Renewal – 250 ml beakers 10 d 30 60 36.2 Every other day Renewal –20 ml scintillation vials 96 h 30 60 50.8 Every other day Renewal – 20 ml scintillation vials 10 d 30 60 46.8
Addition of PBO: All tests were conducted with and without PBO to synergize (Amweg and Weston, 2007) or antagonize (Bailey et al., 1996) toxicity of pyrethroid or OP insecticides, respectively, due to concerns that toxicity may be lost during sampling, transport and storage, and to guide subsequent chemical analyses. Tests were conducted with 25 µg.L-1 PBO. This concentration does not affect amphipod survival or growth (Werner et al., in press).
III.2.1.2 Toxicity Identification Evaluation
Phase I toxicity identification evaluations (TIEs) involve procedures to either remove or inactivate specific classes of chemicals (US EPA 1991). In this study, phase I TIEs were conducted on samples that caused at least 50% mortality within 7 d. Samples that met these criteria were collected at site “711” (Sacramento River at Rio Vista) on June 25, 2009, and at site “Suisun” (Suisun Slough) on August 12, 2008. Additional, pyrethroid-focused TIEs were conducted on two samples that showed significantly reduced survival after PBO addition compared to the ambient sample. These were two samples collected from site “Cache-Ulatis” on January 31, 2008 and October 15, 2009.
Toxicity identification evaluation treatments included: air stripping (aeration at 150 bubbles per

POD 2008-2010: Final Report
13
min for 2 h) to reduce or remove toxicity due to volatile chemicals such as surfactants, chlorine and ammonia; low test temperature (15oC) to increase toxicity due to pyrethroid insecticides; addition of EDTA (3 concentrations) to chelate metals, making them unavailable to biota; addition of PBO (25 µg.L-1, see above); (v) removal of non-polar organic chemicals by solid phase extraction columns (Varian Bond Elut C8, Varian Inc., Harbor City, CA, USA). Appropriate control and method blank treatments were included for all TIE manipulations. Improved organism performance after TIE manipulation is defined as the absence or a delay of mortality by greater than or equal to 24 h.
III.2.1.3 Statistical Analysis
All statistical analyses were performed using JMP 5.0.1 (SAS Institute Inc., Cary, NC, USA; 1989-2003). Survival and final weight data obtained for ambient samples were compared to their PBO-containing counterpart, and to controls using the U.S. Environmental Protection Agency standard statistical procedures for single concentration static renewal toxicity tests (US EPA, 2002). Shapiro-Wilk's test and Bartlett's test were used to examine normality of distributions and homogeneity of variances (alpha = 0.01). Each sample was compared individually to the appropriate electrical conductivity (EC) control. A one-tailed Wilcoxon (Mann-Whitney) test was used (alpha = 0.05) when data distribution was non-normal in either treatment. When distributions were normal, a homoschedastic or heteroschedastic one-tailed t-test was performed (alpha= 0.05), depending on the presence or absence of homogeneity of variance. Comparisons between sample and sample with PBO used the same approach with two-tailed tests (alpha= 0.05).
Field ammonia/um site-by-site analysis and effects on H. azteca: Data of measured total ammonia/um and un-ionized ammonia concentrations were analyzed in more detail. Total ammonia/um as well as unionized ammonia “field” concentrations (calculated using pH, SC and temperature measured in the field) were compared between sampling sites using ANOVA with Tukey’s multiple comparison procedure (p≤0.05). The relationships between ammonia/um in ambient water samples (calculated using pH, EC and temperature measured at test initiation) and H. azteca survival and final weight were examined using multivariate regression models with linear and quadratic terms for EC effects, and ammonia/um concentration as a linear effect. Models were examined using data from each site individually as well as from all sites combined.
III.2.1.4 Analytical Chemistry
Water samples for analytical chemistry were collected at each sampling site during each sampling event using two acid-cleaned, 1-L amber-glass bottles. These samples were transported on ice and stored in an environmental chamber maintained at 4oC upon receipt at the UCD ATL. Samples for organic chemical analysis were preserved by addition of 10 ml/l dichloromethylene immediately upon receipt at the laboratory due to concerns that labile organic chemicals could break down during storage. Samples were submitted to the California Department of Fish and Game Water Pollution Laboratory, Rancho Cordova, CA for organic chemical analysis. Samples submitted for total and/or dissolved metals analysis were analyzed at the California Department of Fish and Game – Moss Landing Marine Laboratory, Moss Landing, CA.
Samples that showed significant differences in survival or growth between PBO-treated and ambient samples based on US EPA standard statistics were analyzed for either pyrethroids (bifenthrin, cyfluthrin, cypermethrin, deltamethrin, esfenvalerate/fenvalerate, fenpropathrin, lambda-cyhalothrin, cis/trans permethrin) and/or 41 OP insecticides (Appendix A, Table A1) by gas chromatography (Agilent 6890 plus, Agilent Technologies Inc., Santa Clara, CA, USA) with dual columns (DB5 and

POD 2008-2010: Final Report
14
DB17) and dual flame photometric detectors in phosphorous mode (OP insecticides), or dual micro-electron capture detectors (pyrethroid insecticides). Pyrethroids were confirmed using GC-MS or GC-MSMS. When the possible cause of toxicity was less apparent, water samples were analyzed for a “comprehensive” suite of chemicals including metals (dissolved and total), PAHs, pyrethroids, organophosphates, carbamates, and fipronil and degradates following standard methods. Analytes and respective detection/reporting limits are provided in Appendix A, Table A1.
III.2.1.5 Quality Assurance/Quality Control
Test acceptability criteria for H. azteca toxicity tests required 90% control survival California State Water Resources Control Board, (http://www.waterboards.ca.gov/water_ issues/programs/swamp/qamp.shtml#appendixf). To evaluate whether organism sensitivity was consistent throughout the project period, positive control reference toxicant tests were performed once a month using NaCl as the toxicant. If an effect concentration, LC50 or EC25, was outside the 95% confidence interval, test organism sensitivity was considered atypical and results of tests conducted during that month were considered suspect. To assess laboratory testing precision, 48 duplicate ambient water samples were collected and tested. In addition, 30 bottle blanks and 24 trip blanks were tested to ascertain the cleanliness of the sampling container, and detect potential contamination of water samples during collection and transport. Any deviations from test protocols were recorded.
III.2.2 Results
Water quality parameters measured at field sites are shown as mean (+/- SD), and maximum-minimum ranges in Table 4 a. Sites were ranked with respect to their ammonia/um concentrations for the study periods 2008-2010 and 2006-2010 (Tables 4 b, c). Sites 711, Cache-Lindsey and Hood had the highest concentrations of ammonia/um.

POD 2008-2010: Final Report
15
Table 4 a. Water quality at sites sampled during January 2008 – December 2009.
SC (uS/cm) EC (uS/cm) Temp (°C) Year Site N
Mean ± SD Range Mean ± SD Range Mean ±
SD Range
2008 340 8 17579 ± 5151 10250 - 23250 13321 ± 4325 7470 - 18510 12.0 ± 2.3 8.7 - 15.1 405 15 16688 ± 4315 8980 - 23070 13728 ± 4481 6750 - 20840 15.0 ± 4.0 8.5 - 20.2 508 26 6244 ± 3875 386.2 - 13000 5221 ± 3115 272.8 - 10550 15.8 ± 4.6 7.8 - 22.2 602 26 13447 ± 6799 364.4 - 22140 11347 ± 5862 262.3 - 18580 16.0 ± 4.3 8.3 - 21.8 609 26 9204 ± 3996 3497 - 15420 7805 ± 3661 2559 - 13900 16.3 ± 4.8 8.4 - 23.2 711 25 218 ± 66 146 - 385.7 181 ± 48 101.1 - 311.1 16.6 ± 5.7 7.5 - 24.5 815 25 328 ± 101 217.7 - 722 273 ± 70 177.9 - 488 16.8 ± 5.6 7.9 - 24.9 902 25 579 ± 292 293.4 - 1444 481 ± 226 218.9 - 1030 16.8 ± 6.0 6.9 - 24.9 910 1 610 - 406 - 7.4 - 915 25 519 ± 159 315.2 - 888 430 ± 123 238 - 656 17.2 ± 6.1 6.9 - 25.3 CL 26 262 ± 75 167.2 - 459.4 214 ± 53 159.1 - 371.9 16.3 ± 5.3 7.6 - 25.0 CU 26 389 ± 160 197.1 - 826 313 ± 116 182.5 - 668 16.0 ± 5.1 6.8 - 24.7 Hood 26 214 ± 58 151.8 - 392.8 182 ± 48 124.1 - 291.1 17.6 ± 5.6 7.9 - 27.7 Light 55 25 304 ± 56 212.2 - 436.2 253 ± 50 172.2 - 392.2 16.2 ± 5.3 7.9 - 23.6 Napa 16 9827 ± 9291 260 - 25790 8717 ± 8604 199.7 - 24965 16.3 ± 4.5 9.2 - 23.4 R&R 25 710 ± 161 398.6 - 1045 626 ± 147 282.2 - 883 19.1 ± 5.8 9.0 - 29.8
Suisun @
RR 24 9993 ± 4765 3089 - 16070 8411 ± 4360 2391 - 15320 16.2 ± 4.3 7.1 - 24.5
Suisun
Pub. Dock 2 4424 ± 2173 2887 - 5960 3006 ± 1322 2071 - 3941 8.9 ± 2.3 7.3 - 10.5 2009 340 9 18661 ± 5367 9460 - 24360 15117 ± 4660 7100 - 20060 14.8 ± 2.9 10.0 - 18.6
405 17 17559 ± 5934 6510 - 24290 14932 ± 5356 4880 - 22110 16.8 ± 3.2 10.2 - 20.6 508 26 6609 ± 3772 358.3 - 12810 5299 ± 2720 279 - 9260 15.6 ± 4.5 8.3 - 21.7 602 26 13934 ± 6629 424.9 - 23550 11399 ± 5209 333 - 17440 15.9 ± 4.5 8.6 - 22.1 609 25 8221 ± 4381 2229 - 15450 6887 ± 3701 1711 - 12960 16.6 ± 4.8 9.2 - 22.8 711 26 191 ± 69 110.7 - 416.5 156 ± 48 100.6 - 302.6 16.4 ± 5.3 7.9 - 23.2 815 26 300 ± 122 159.8 - 572 247 ± 89 145.5 - 433 17.0 ± 5.4 7.8 - 23.3 902 26 507 ± 236 204 - 854 422 ± 192 194.3 - 835 17.3 ± 5.7 7.6 - 24.5 915 26 487 ± 193 216.8 - 846 410 ± 162 209 - 834 17.6 ± 6.0 7.6 - 25.1 CL 26 241 ± 65 154.6 - 417.3 197 ± 54 142 - 388 15.9 ± 4.8 7.9 - 22.1 CU 26 363 ± 157 135.6 - 674 288 ± 109 122.6 - 545 15.6 ± 4.7 7.3 - 21.2 Hood 25 184 ± 41 116.3 - 303.3 151 ± 28 100.7 - 220 16.5 ± 5.2 8.2 - 23.9 Light 55 26 292 ± 53 214.5 - 408.8 241 ± 46 172.5 - 342 16.2 ± 5.1 7.9 - 22.0 Napa 20 12696 ± 8610 237.2 - 24240 10212 ± 6772 178.4 - 19780 15.7 ± 4.7 9.6 - 23.9 R&R 25 694 ± 218 395.3 - 1107 580 ± 127 322.5 - 811 18.2 ± 6.4 8.2 - 26.9
Suisun @
RR 25 8952 ± 3705 2673 - 14660 7049 ± 2847 2038 - 12100 15.2 ± 4.3 7.8 - 22.1

POD 2008-2010: Final Report
16
Table 4 a, continued. Water quality at sites sampled during January 2008 – December 2009.
Year Site N pH DO (mg/L) Turbidity (NTU)
Mean ± SD Range Mean ±
SD Range Mean ± SD Range
2008 340 8 7.75 ± 0.32 7.09 - 8.03 10.5 ± 0.4 10.0- 11.2 41 ± 23 13 - 74 405 15 7.66 ± 0.41 6.43 - 8.05 10.1 ± 1.0 8.1 - 11.7 132 ± 109 12 - 378 508 26 7.67 ± 0.33 6.80 - 8.24 10 ± 1.1 8.2 - 12.1 28 ± 26 7 - 120 602 26 7.77 ± 0.27 6.95 - 8.28 9.9 ± 1.1 8.0 - 12.3 61 ± 74 9 - 306 609 26 7.49 ± 0.33 6.51 - 8.04 9.3 ± 1.1 7.4 - 11.6 35 ± 24 8 - 103 711 25 7.48 ± 0.38 6.82 - 8.16 9.9 ± 1.8 7.2 - 14.5 27 ± 52 4 - 243 815 25 7.58 ± 0.42 6.75 - 8.31 9.9 ± 1.6 7.6 - 13.8 13 ± 17 3 - 80 902 25 7.58 ± 0.44 6.59 - 8.30 10 ± 1.8 7.8 - 14.9 20 ± 35 3 - 184 910 1 7.55 - 12.5 - 6 - 915 25 7.60 ± 0.39 6.78 - 8.20 9.8 ± 1.9 7.5 - 14.8 11 ± 8 4 - 44 CL 26 7.61 ± 0.4 6.80 - 8.29 9.9 ± 1.7 7.5 - 14.4 44 ± 41 7 - 217 CU 26 7.80 ± 0.44 6.76 - 8.43 10.1 ± 1.7 8.3 - 15.1 54 ± 30 8 - 119 Hood 26 7.42 ± 0.32 6.80 - 8.05 9 ± 1.5 7.1 - 11.7 20 ± 26 5 - 107 Light 55 25 7.64 ± 0.37 7.08 - 8.36 9.8 ± 1.3 8.1 - 12.5 51 ± 45 8 - 240 Napa 16 7.66 ± 0.48 6.96 - 8.70 9.1 ± 2.4 5.4 - 12.4 45 ± 46 7 - 195 R&R 25 7.52 ± 0.31 6.92 - 8.10 8.4 ± 1.3 5.8 - 11.1 14 ± 9 5 - 45 Suisun @ RR 24 7.35 ± 0.28 6.74 - 7.97 7.5 ± 1.6 5.1 - 11.0 62 ± 45 15 - 177
Suisun Pub.
Dock 2 7.48 ± 0.25 7.30 - 7.65 9.3 ± 1.3 8.4 - 10.2 161 ± 149 56 - 266 2009 340 9 7.23 ± 0.45 6.58 - 7.88 10 ± 1.3 8.7 - 13.0 52 ± 21 21 - 78
405 17 7.49 ± 0.24 6.99 - 7.89 9.6 ± 1.2 8.1 - 13.0 112 ± 115 11 - 424 508 26 7.46 ± 0.32 6.54 - 7.87 9.9 ± 1.0 8.5 - 11.8 22 ± 13 8 - 49 602 26 7.58 ± 0.30 6.75 - 8.00 10 ± 1.2 8.6 - 13.4 74 ± 90 8 - 379 609 25 7.33 ± 0.28 6.66 - 7.70 9.1 ± 1.4 7.4 - 11.9 45 ± 34 12 - 138 711 26 7.43 ± 0.36 6.61 - 8.60 9.6 ± 1.3 8.1 - 12.1 17 ± 31 3 - 146 815 26 7.43 ± 0.36 6.58 - 8.55 9.6 ± 1.3 8.2 - 12.0 5 ± 3 2 - 17 902 26 7.59 ± 0.40 6.58 - 8.58 9.7 ± 1.3 8.0 - 12.1 6 ± 4 2 - 19 915 26 7.51 ± 0.39 6.43 - 8.61 9.5 ± 1.5 7.7 - 12.6 5 ± 2 2 - 11 CL 26 7.53 ± 0.33 6.80 - 8.59 9.9 ± 1.2 8.4 - 12.1 30 ± 25 6 - 133 CU 26 7.70 ± 0.40 6.88 - 8.61 9.8 ± 1.7 6.4 - 13.8 56 ± 43 9 - 164 Hood 25 7.29 ± 0.28 6.55 - 7.67 9.4 ± 1.3 7.5 - 12.0 13 ± 8 5 - 44 Light 55 26 7.67 ± 0.36 7.02 - 8.38 9.7 ± 1.2 8.3 - 12.5 27 ± 18 8 - 97 Napa 20 7.43 ± 0.34 6.51 - 7.98 9.5 ± 1.7 6.1 - 11.4 64 ± 151 4 - 713 R&R 25 7.51 ± 0.24 7.08 - 7.94 8.5 ± 1.9 5.6 - 11.3 7 ± 3 2 - 13 Suisun @ RR 25 7.23 ± 0.22 6.51 - 7.53 8.3 ± 1.7 5.5 - 11.9 63 ± 93 9 - 395

POD 2008-2010: Final Report
17
Table 4 a, continued. Water quality at sites sampled during January 2008 – December 2009.
Year Site N Hardness
(mg/L as CaCO3)
Alkalinity (mg/L as CaCO3)
Mean ± SD Range Mean ± SD Range
2008 340 8 1976 ± 593 1000 - 2640 100 ± 12 82 - 116 405 15 1798 ± 658 224 - 2720 99 ± 6 88 - 112 508 26 702 ± 465 60 - 1560 87 ± 8 70 - 101 602 26 1478 ± 802 96 - 2560 94 ± 7 76 - 106 609 26 1132 ± 530 408 - 2320 99 ± 11 80 - 114 711 25 76 ± 28 52 - 200 74 ± 12 53 - 98 815 25 83 ± 14 60 - 116 82 ± 28 64 - 212 902 25 109 ± 22 76 - 156 77 ± 8 60 - 88 910 1 120 - 88 - 915 25 104 ± 18 52 - 132 81 ± 19 66 - 166 CL 26 84 ± 19 56 - 128 87 ± 17 62 - 126 CU 26 122 ± 53 44 - 248 116 ± 38 70 - 222 Hood 26 67 ± 15 28 - 92 73 ± 12 48 - 98 Light 55 25 98 ± 16 76 - 132 93 ± 15 66 - 124 Napa 16 1227 ± 1151 76 - 3160 115 ± 31 62 - 148 R&R 25 154 ± 35 88 - 244 97 ± 17 64 - 126 Suisun @ RR 24 1282 ± 642 400 - 2440 167 ± 15 136 - 192 Suisun Pub. Dock 2 578 ± 269 388 - 768 187 ± 30 166 - 208
2009 340 9 2177 ± 675 1040 - 2880 98 ± 6 88 - 108 405 17 1952 ± 657 800 - 2840 89 ± 6 80 - 104 508 26 788 ± 514 92 - 2120 78 ± 13 56 - 106 602 26 1643 ± 786 152 - 3040 86 ± 11 68 - 106 609 25 964 ± 518 292 - 1760 93 ± 8 78 - 116 711 26 67 ± 16 44 - 100 66 ± 15 46 - 96 815 26 80 ± 20 48 - 124 67 ± 13 50 - 94 902 26 98 ± 27 56 - 156 70 ± 12 50 - 92 915 26 100 ± 23 64 - 152 72 ± 12 54 - 98 CL 26 80 ± 17 54 - 116 80 ± 18 54 - 118 CU 26 120 ± 49 60 - 226 110 ± 39 62 - 204 Hood 25 65 ± 15 44 - 100 68 ± 14 50 - 92 Light 55 26 94 ± 15 64 - 124 87 ± 16 66 - 124 Napa 20 1585 ± 1032 70 - 2800 124 ± 44 48 - 284 R&R 25 150 ± 40 92 - 212 97 ± 33 68 - 240 Suisun @ RR 25 1028 ± 469 160 - 1880 169 ± 34 130 - 274
POD 2008-2010: Final Report
18
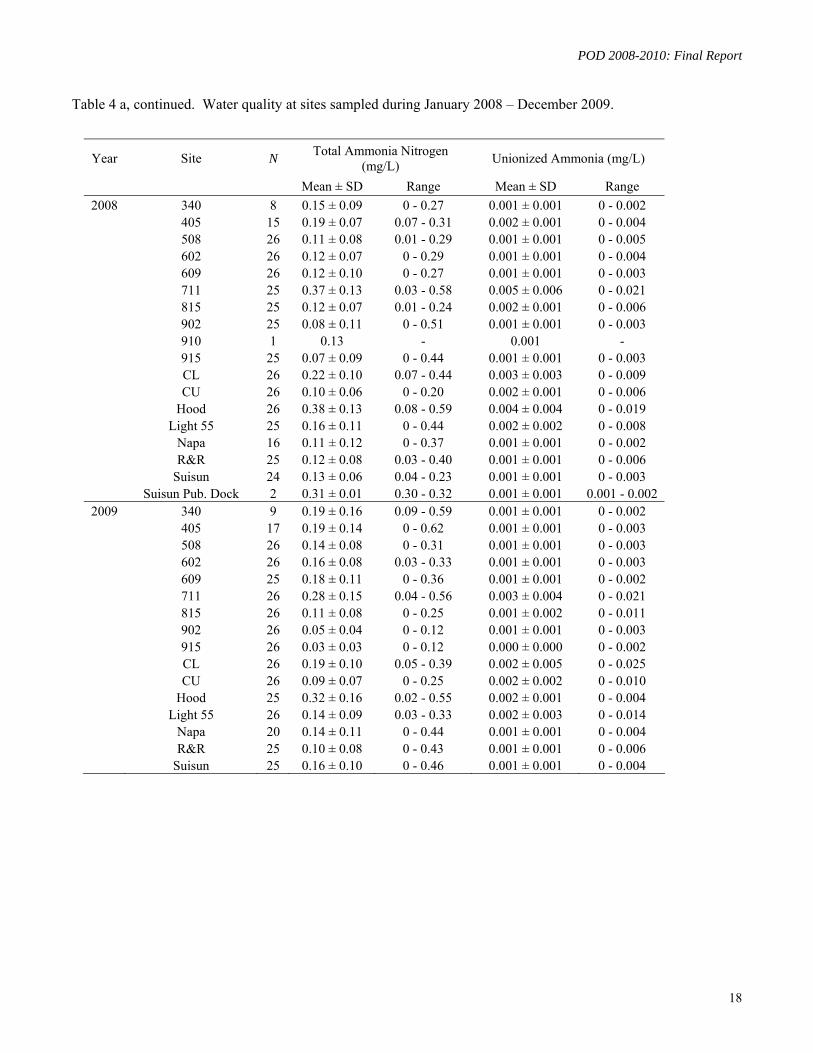
Table 4 a, continued. Water quality at sites sampled during January 2008 – December 2009.
Year Site N Total Ammonia Nitrogen
(mg/L) Unionized Ammonia (mg/L)
Mean ± SD Range Mean ± SD Range
2008 340 8 0.15 ± 0.09 0 - 0.27 0.001 ± 0.001 0 - 0.002 405 15 0.19 ± 0.07 0.07 - 0.31 0.002 ± 0.001 0 - 0.004 508 26 0.11 ± 0.08 0.01 - 0.29 0.001 ± 0.001 0 - 0.005 602 26 0.12 ± 0.07 0 - 0.29 0.001 ± 0.001 0 - 0.004 609 26 0.12 ± 0.10 0 - 0.27 0.001 ± 0.001 0 - 0.003 711 25 0.37 ± 0.13 0.03 - 0.58 0.005 ± 0.006 0 - 0.021 815 25 0.12 ± 0.07 0.01 - 0.24 0.002 ± 0.001 0 - 0.006 902 25 0.08 ± 0.11 0 - 0.51 0.001 ± 0.001 0 - 0.003 910 1 0.13 - 0.001 - 915 25 0.07 ± 0.09 0 - 0.44 0.001 ± 0.001 0 - 0.003 CL 26 0.22 ± 0.10 0.07 - 0.44 0.003 ± 0.003 0 - 0.009 CU 26 0.10 ± 0.06 0 - 0.20 0.002 ± 0.001 0 - 0.006 Hood 26 0.38 ± 0.13 0.08 - 0.59 0.004 ± 0.004 0 - 0.019 Light 55 25 0.16 ± 0.11 0 - 0.44 0.002 ± 0.002 0 - 0.008 Napa 16 0.11 ± 0.12 0 - 0.37 0.001 ± 0.001 0 - 0.002 R&R 25 0.12 ± 0.08 0.03 - 0.40 0.001 ± 0.001 0 - 0.006 Suisun 24 0.13 ± 0.06 0.04 - 0.23 0.001 ± 0.001 0 - 0.003 Suisun Pub. Dock 2 0.31 ± 0.01 0.30 - 0.32 0.001 ± 0.001 0.001 - 0.002
2009 340 9 0.19 ± 0.16 0.09 - 0.59 0.001 ± 0.001 0 - 0.002 405 17 0.19 ± 0.14 0 - 0.62 0.001 ± 0.001 0 - 0.003 508 26 0.14 ± 0.08 0 - 0.31 0.001 ± 0.001 0 - 0.003 602 26 0.16 ± 0.08 0.03 - 0.33 0.001 ± 0.001 0 - 0.003 609 25 0.18 ± 0.11 0 - 0.36 0.001 ± 0.001 0 - 0.002 711 26 0.28 ± 0.15 0.04 - 0.56 0.003 ± 0.004 0 - 0.021 815 26 0.11 ± 0.08 0 - 0.25 0.001 ± 0.002 0 - 0.011 902 26 0.05 ± 0.04 0 - 0.12 0.001 ± 0.001 0 - 0.003 915 26 0.03 ± 0.03 0 - 0.12 0.000 ± 0.000 0 - 0.002 CL 26 0.19 ± 0.10 0.05 - 0.39 0.002 ± 0.005 0 - 0.025 CU 26 0.09 ± 0.07 0 - 0.25 0.002 ± 0.002 0 - 0.010 Hood 25 0.32 ± 0.16 0.02 - 0.55 0.002 ± 0.001 0 - 0.004 Light 55 26 0.14 ± 0.09 0.03 - 0.33 0.002 ± 0.003 0 - 0.014 Napa 20 0.14 ± 0.11 0 - 0.44 0.001 ± 0.001 0 - 0.004 R&R 25 0.10 ± 0.08 0 - 0.43 0.001 ± 0.001 0 - 0.006 Suisun 25 0.16 ± 0.10 0 - 0.46 0.001 ± 0.001 0 - 0.004
2008-2010: Final Report
Table 4 b. Ranking of sites with respect to total ammonia/um and un-ionized ammonia concentrations at sampling sites, 2008-2009. Un-ionized ammonia concentrations were calculated using water temperature, EC and pH measured at the time of sampling. Sites are ranked with different letters to indicate statistical differences (p≤0.05), where A represents sites with highest and E or F represents sites with lowest concentrations.
Total Ammonia Nitrogen (mg/L) Unionized Ammonia (mg/L) Site N Mean ± SD Range Rank N Mean ± SD Range Rank
340 17 0.17 ± 0.13 0 - 0.59 B C D 17 0.001 ± 0.001 0 - 0.002 D E F 405 32 0.19 ± 0.11 0 - 0.62 B C 32 0.002 ± 0.001 0 - 0.004 B C D E 508 52 0.13 ± 0.08 0 - 0.31 C D E 52 0.001 ± 0.001 0 - 0.005 D E F 602 52 0.14 ± 0.08 0 - 0.33 C D 52 0.001 ± 0.001 0 - 0.004 C D E F 609 51 0.15 ± 0.11 0 - 0.36 B C D 51 0.001 ± 0.001 0 - 0.003 E F 711 52 0.33 ± 0.14 0.03 - 0.58 A 51 0.004 ± 0.005 0 - 0.021 A 815 51 0.12 ± 0.08 0 - 0.25 D E 51 0.001 ± 0.002 0 - 0.011 D E F 902 51 0.06 ± 0.08 0 - 0.51 E 51 0.001 ± 0.001 0 - 0.003 F 910 1 0.13 - - 1 0.001 - - 915 51 0.05 ± 0.07 0 - 0.44 E 51 0 ± 0.001 0 - 0.003 F CL 52 0.20 ± 0.10 0.05 - 0.44 B 52 0.003 ± 0.004 0 - 0.025 A B C CU 52 0.09 ± 0.07 0 - 0.25 D E 52 0.002 ± 0.002 0 - 0.010 C D E F
Hood 52 0.35 ± 0.15 0.02 - 0.59 A 51 0.003 ± 0.003 0 - 0.019 A B Light 55 52 0.15 ± 0.10 0 - 0.44 B C D 51 0.002 ± 0.003 0 - 0.014 A B C D
Napa 37 0.13 ± 0.11 0 - 0.44 C D E 36 0.001 ± 0.001 0 - 0.004 E F R&R 51 0.11 ± 0.08 0 - 0.43 D E 50 0.001 ± 0.001 0 - 0.006 D E F
Suisun 50 0.15 ± 0.08 0 - 0.46 B C D 49 0.001 ± 0.001 0 - 0.004 F Suisun Pub.
Dock 2 0.31 ± 0.01 0.30 - 0.32 - 2 0.001 ± 0.001 0.001 - 0.002 -

POD 2008-2010: Final Report
20
Table 4 c. Ranking of sites with respect to total ammonia/um and un-ionized ammonia concentrations at sampling sites, 2006-2009. Un-ionized ammonia concentrations were calculated using water temperature, EC and pH measured at the time of sampling. Sites are ranked with different letters to indicate statistical differences (p≤0.05), where A represents sites with highest and E sites with lowest concentrations.
Total Ammonia Nitrogen (mg/L) Unionized Ammonia (mg/L) Site N Mean ± SD Range Rank N Mean ± SD Range Rank
323 14 0.11 ± 0.04 0.06 - 0.20 C D E 14 0.001 ± 0.001 0 - 0.003 A B C D E 340 55 0.11 ± 0.10 0 - 0.59 D E 54 0.001 ± 0.001 0 - 0.002 E 405 79 0.15 ± 0.10 0 - 0.62 C D 79 0.002 ± 0.001 0 - 0.006 B C D E 504 50 0.10 ± 0.06 0 - 0.26 E 50 0.001 ± 0.001 0 - 0.005 E 508 102 0.11 ± 0.07 0 - 0.31 D E 102 0.001 ± 0.001 0 - 0.006 E 602 101 0.12 ± 0.07 0 - 0.33 D E 101 0.001 ± 0.001 0 - 0.005 C D E 609 101 0.14 ± 0.09 0 - 0.36 D E 100 0.001 ± 0.001 0 - 0.003 E 704 50 0.11 ± 0.07 0 - 0.30 D E 50 0.001 ± 0.001 0 - 0.005 C D E 711 102 0.27 ± 0.14 0.03 - 0.58 B 100 0.004 ± 0.004 0 - 0.021 A 804 50 0.09 ± 0.06 0 - 0.29 E 50 0.001 ± 0.002 0 - 0.008 C D E 812 48 0.09 ± 0.06 0 - 0.29 E 48 0.001 ± 0.001 0 - 0.005 E 815 51 0.12 ± 0.08 0 - 0.25 D E 51 0.001 ± 0.002 0 - 0.011 E 902 101 0.06 ± 0.07 0 - 0.51 E 100 0.001 ± 0.002 0 - 0.010 E 910 51 0.15 ± 0.10 0 - 0.44 C D E 50 0.002 ± 0.002 0 - 0.007 B C D E 915 101 0.06 ± 0.07 0 - 0.44 E 100 0.001 ± 0.001 0 - 0.006 E CL 52 0.20 ± 0.10 0.05 - 0.44 C 52 0.003 ± 0.004 0 - 0.025 A B C CU 53 0.09 ± 0.07 0 - 0.25 E 53 0.002 ± 0.002 0 - 0.010 C D E
Hood 61 0.34 ± 0.14 0.02 - 0.59 A 59 0.003 ± 0.003 0 - 0.019 A B Light 55 100 0.13 ± 0.09 0 - 0.44 D E 98 0.002 ± 0.003 0 - 0.014 A B C D
Napa 37 0.13 ± 0.11 0 - 0.44 D E 36 0.001 ± 0.001 0 - 0.004 E R&R 51 0.11 ± 0.08 0 - 0.43 D E 50 0.001 ± 0.001 0 - 0.006 D E
Stockton WWTF 1 0.21 - - 1 0.003 - - Suisun 50 0.15 ± 0.08 0 - 0.46 C D E 49 0.001 ± 0.001 0 - 0.004 E
Suisun Pub. Dock 2 0.31 ± 0.01 0.30 - 0.32 - 2 0.002 ± 0.001 0.001 - 0.002 -

2008-2010: Final Report
III.2.2.1 Acute Toxicity to H. azteca - Effects on 10-d Survival
During the project period, a total of 752 water samples were collected and tested for toxicity with H. azteca. Samples that caused significant mortality, with or without PBO, are listed below in Table 5, along with TIE results and analytical chemistry information. Detailed data tables of all H. azteca test results are provided in Appendix B. Four water samples (0.5 % of total) collected from sites 711, Light 55, 405 and Suisun were acutely toxic, causing a significant reduction in amphipod survival within the 10 d test period. Two of these (sites 711, Suisun) had less than 50 % survival, the other two had more than 80 % survival.
PBO Effect on 10-d Survival: The addition of PBO increased acute toxicity in seven ambient samples (0.9 % of total, Table 4-1) suggesting the presence of pyrethroid insecticides. Three of these contained detectable concentrations of pyrethroids: cypermethrin (site 902, Aug. 28, 2008); bifenthrin and lambda cyhalothrin (Cache-Ulatis, Feb. 28, 2008) and permethrin (Hood, Jun. 23, 2009). Survival in six PBO-containing samples (0.8 % of total) was significantly lower than in the respective PBO-controls.
III.2.2.2 Toxicity Identification Evaluation
Samples that were subject to TIEs were collected from site Cache-Ulatis on Jan. 31, 2008 and Oct. 15, 2009, and from Suisun Slough on August 12, 2008 (Table 5). All TIEs indicated that pyrethroid insecticides were the dominant toxicants. However, chemical analyses only detected OP insecticides at low concentrations in one sample, but pyrethroids were below detection limits. Interestingly, while no pyrethroids were detected in the water sample collected from site Cache-Ulatis on Jan. 31, 2008 and stored at ATL for the duration of the initial toxicity test, analysis of a sample from this site collected for CVRWQCB at the same time, and sent for chemical analysis the following day, contained two pyrethroids, 0.007 µg/L cyfluthrin and 0.003 µg/L bifenthrin, and one organophosphate insecticide, 0.011 µg/L disulfoton. This demonstrates that degradation of pesticides takes place even if water samples are preserved with DCM, and stored in the dark at 4oC until toxicity test results become available. This poses problems for the identification/confirmation of toxicity testing results by analytical chemistry, especially for low or sublethal (growth) levels of toxicity.
III.2.2.3 Chronic Toxicity to H. azteca - Effects on 10-d Growth
Chronic toxicity in the form of reduced amphipod growth compared to control was detected in 7 samples (0.9 % of total) without apparent seasonal or geographic patterns (Table 6 a, b). Amphipods exposed to a sample from Cache-Ulatis (collected Jan. 31, 2008) not only weighed significantly less than control animals, but PBO addition also caused significantly higher mortality than the ambient sample alone. This suggested that pyrethroid insecticides were present at concentrations that caused sublethal toxicity. In general, however, the growth endpoint is not a sensitive indicator of toxicity due to the variable size of the organisms, the variability of food content in Delta water samples, and the lack of natural particulate matter in the laboratory control water.
PBO Effect on 10-d Growth: A total of 100 samples (13.3 %) demonstrated significant PBO effects on amphipod growth, 45 in 2008 and 55 in 2009. Of these, 36 (4.8 % of total samples tested) showed an increase in weight with PBO addition (antagonistic PBO effect), and 64 (8.5 % of total) a decrease (synergistic PBO effect). Most samples resulting in a significant reduction or increase in growth were submitted for chemical analysis.

POD 2008-2010: Final Report
22
Table 5. List of samples causing significant reduction in 10-d survival of H. azteca or PBO effects on survival.
10-d Survival ± SE (%)
Site Sampling Date Control
EC Control
(EC) Control w. PBO
Ambient Ambient w.
PBO (% Ambient)
TIE Results Analytical Results
340 May 13 2009 100±0.0 73±6.0 73±11.1 61±10.1 14±9.0 a, b N/A P: ND
405 Mar 27 2008 100±0.0 100±0.0 93±4.8 87±2.2 a 97±2.8 N/A N/A
602 July 20 2009 100±0.0 97±2.8 100±0.0 93±4.8 82±4.3 a N/A O + P: ND
" Sept 16 2009 91±3.0 98±2.5 100±0.0 95±2.9 87±2.4 a N/A N/A
711 June 25 2009 97±3.1 89±6.4 77±6.1 45±7.6 a 61±4.2 a N/A C: Diuron: 3 ng/L
" July 9 2009 98±2.5 100±0.0 98±2.5 93±3.3 83±2.2 a N/A N/A
902 Aug 28 2008 84±3.1 N/A 94±6.3 97±3.1 28±20.7 a, b N/A P: Cypermethrin: 16 ng/L
" June 25 2009 97±3.1 N/A 95±2.8 90±7.1 85±4.2 a N/A Not analyzed.
915 Aug 28 2008 84±3.1 N/A 94±6.3 94±3.6 60±14.1 a, b N/A P: ND
CU Jan 31 2008 95±2.8 N/A 95±2.9 97±2.8 8±4.9 a, b PBO Addition Increased Toxicity @ 15° ND*
" Feb 28 2008 92±4.8 N/A 98±2.5 98±2.5 66±9.3 a, b N/A P: Bifenthrin: 1 ng/L,
Lambda-cyhalothrin: 1 ng/L
" Oct 15 2009 93±7.5 N/A 92±4.8 98±2.5 10±6.1 a, b C8 Eluate Toxic, C8 Rinsate Reduced
Toxicity, PBO Addition Increased Toxicity, More Toxicity at 15° than 23°
O + P: Chlorpyrifos: 3 ng/L, Diazinon: 3 ng/L
Hood June 23 2009 92±2.7 95±2.6 91±5.1 87±3.0 66±6.1 a, b N/A P: Permethrin: 20 ng/L
(7 cis, 13 trans)
Napa Jun 17 2008 97±2.8 95±2.9 98±2.5 89±6.8 82±2.7 a N/A C: Diuron: 32 ng/L,
M: See Below Suisun @ Rush R.
Aug 12 2008 98±2.5 98±2.5 95±2.9 16±6.5 a 0±0.0 a C8 Eluate Toxic; PBO Addition
Increased Eluate Toxicity P: ND
M: See Below Light 55 Aug 14 2008 100±0.0 N/A 100±0.0 85±8.7 a 97±3.3 N/A Not analyzed.
a Significantly different from appropriate control (p≤0.05);
b Significantly different from ambient sample (p≤0.05);
Chemical Analysis Key: P: Pyrethroid, O: Organophosphate, C: Comprehensive, Cb: Carbamate, M: Metal
*Analysis of a water sample (CVRWQCB) without storage resulted in the detection of 0.007 µg/L cyfluthrin, 0.003 µg/L bifenthrin & 0.011 µg/L disulfoton

POD 2008-2010: Final Report
23
Table 6 a. Samples collected in 2008 and showing significant differences in final H. azteca weight compared to controls or PBO effects, and corresponding analytical results. Gray shade: significant difference from control; pink shade: significant increase in weight due to PBO.
10-d Weight ± SE (µg/individual)
Site Sampling Date Test Acceptability
Control
EC Control
(EC) Control
with PBO Ambient
Ambient with PBO
Analytical Results
340 Mar 27 2008 46±8 37±1 42±12 47±1 66±2 b N/A
" Apr 10 2008 42±6 24±14 43±9 50±7 21±3 b N/A
405 Feb 13 2008 44±6 76±17 85±5 69±5 46±3 b N/A
" May 23 2008 37±14 27±12 48±7 57±8 24±6 b P: ND
508 Mar 27 2008 46±8 N/A 55±4 100±5 77±7 b N/A
" May 7 2008 42±6 N/A 66±3 103±4 71±6 b P: ND
" May 23 2008 37±14 N/A 25±10 66±8 91±2 b N/A
" June 4 2008 53±3 49±4 45±3 101±8 78±4 b N/A
" July 3 2008 118±16 N/A 66±11 68±8 a 76±22 N/A
" Aug 27 2008 46±2 N/A 43±5 63±3 49±4 b N/A
" Sept 10 2008 46±6 N/A 73±9 91±10 57±5 b P: ND
" Oct 8 2008 80±12 N/A 53±5 47±8 a 48±5 N/A
602 May 7 2008 42±6 81±9 66±3 62±4 44±3 b N/A
" May 23 2008 37±14 40±5 54±14 33±10 61±4 b N/A
" June 4 2008 53±3 49±4 45±3 69±4 48±7 b N/A
609 Apr 24 2008 17±8 N/A 25±3 70±4 43±3 b N/A
" July 16 2008 53±6 81±7 47±10 93±7 47±8 b P: ND
" July 30 2008 66±8 89±12 68±7 106±10 66±11 b P: ND
" Sept 10 2008 46±6 46±2 50±8 72±5 36±9 b P: ND
" Oct 8 2008 80±12 N/A 53±5 43±12 a 22±5 a Cb: 8 ng/L Diuron; Metals: See Below
711 July 3 2008 118±16 105±17 98±3 80±6 28±5 a, b N/A
" Nov 20 2008 47±13 77±10 47±6 77±10 47±6 b P: ND
815 May 12 2008 44±5 N/A 34±9 71±3 88±4 b N/A
" May 23 2008 37±14 N/A 25±10 76±3 110±4 b N/A
" July 17 2008 31±9 35±9 34±6 85±11 36±7 b P: ND
902 May 23 2008 37±14 N/A 25±10 53±16 98±5 b O: ND
915 Jan 2 2008 32±15 N/A 47±9 81±5 100±4 b N/A
" June 19 2008 73±4 N/A 60±5 157±10 113±11 b N/A
" July 31 2008 38±5 N/A 45±6 89±9 58±7 b P: ND
" Aug 28 2008 17±7 N/A 28±7 89±8 42±11 b P: ND
CL Dec 4 2008 41±8 N/A 35±6 65±5 47±5 b N/A
CU Jan 31 2008 60±3 N/A 45±10 42±7 a - ND
" Mar 13 2008 37±3 N/A 41±8 78±5 48±3 b N/A
" Mar 26 2008 53±2 N/A 46±5 108±8 77±7 b N/A
" Apr 9 2008 35±3 N/A 31±5 56±4 34±4 b N/A
Hood Jan 1 2008 32±15 N/A 47±9 34±9 62±6 b N/A
" July 15 2008 53±6 75±6 53±8 89±6 48±3 b P: ND
" Oct 7 2008 80±12 41±9 59±9 22±5 50±6 b O: ND
" Nov 4 2008 41±6 51±11 93±66 91±6 35±10 b P: 1.2 ng/L Cyfluthrin

POD 2008-2010: Final Report
24
Table 6 a, cont. Samples collected in 2008 and showing significant differences in final H. azteca weight
compared to controls or PBO effects, and corresponding analytical results.
10-d Weight ± SE (µg/individual)
Site Sampling Date Test Acceptability
Control
EC Control
(EC) Control
with PBO Ambient
Ambient with PBO
Analytical Results
Light 55 Feb 14 2008 53±6 N/A 56±7 94±3 70±4 b N/A
" Mar 13 2008 37±3 N/A 41±8 75±7 53±4 b N/A
" July 17 2008 31±9 35±9 34±6 42±4 62±4 b N/A
Napa Apr 23 2008 29±5 N/A 27±9 46±8 82±5 b N/A
" May 22 2008 84±7 63±17 85±6 116±7 55±4 a P: ND
" July 15 2008 53±6 44±3 69±14 34±3 a 43±12 P: ND
R&R Aug 26 2008 46±2 N/A 43±5 83±3 63±5 b N/A
" Sept 23 2008 64±4 N/A 63±5 132±16 84±10 b N/A
" Nov 4 2008 41±6 N/A 35±2 91±8 41±11 b P: ND Suisun
Rush R. Apr 23 2008 29±5 N/A 27±9 42±4 77±2 b N/A
" Aug 26 2008 46±2 51±9 38±5 54±5 37±2 b N/A Suisun
Pub. Dock Jan 15 2008 55±4 N/A 53±4 88±6 104±4 b N/A
a Significantly different from appropriate control (p≤0.05); b Significantly different from ambient sample (p≤0.05);
Chemical Analysis: P: Pyrethroid, O: Organophosphate, C: Comprehensive, Cb: Carbamate, M: Metal

POD 2008-2010: Final Report
25
Table 6 b. Samples collected in 2009 and showing significant differences in final H. azteca weight compared to controls or PBO effects, and corresponding analytical results. Gray shade: significant difference from control; pink shade: significant increase in weight due to PBO.
10-d Weight ± SE (µg/individual)
Site Sampling
Date Test
Acceptability Control
EC Control
(EC) Control
with PBO Ambient
Ambient with PBO
Analytical Results
340 Feb 18 2009 39±4 25±2 41±21 23±4 52±7 b O: ND
" Mar 17 2009 48±9 N/A 63±11 73±2 57±5 b N/A
" Apr 29 2009 55±9 20±5 34±12 48±7 70±5 b N/A
405 Mar 17 2009 48±9 N/A 63±11 75±5 61±3 b N/A
" Apr 14 2009 46±3 N/A 33±5 30±7 a 44±8 N/A
" July 20 2009 72±8 28±8 38±3 31±6 66±7 b N/A
508 Jan 21 2009 45±6 54±3 40±5 45±6 73±4 b O: ND
" Feb 5 2009 46±4 29±6 34±4 28±4 46±3 b N/A
" Mar 4 2009 57±7 N/A 46±5 131±6 83±13 b P: ND
602 Apr 29 2009 55±9 N/A 69±6 54±7 81±4 b O: ND
" Apr 20 2009 72±8 58±4 43±5 46±1a 74±5 b O+P: ND
" Nov 10 2009 46±5 35±4 31±3 35±5 55±6 b O+P: ND
609 May 27 2009 35±6 N/A 78±6 90±1 75±5 b N/A
711 Jan 22 2009 75±6 N/A 53±9 107±6 78±8 b P: ND
" Sept 15 2009 43±8 42±7 33±3 100±5 75±9 b O+P: ND
815 Feb 19 2009 34±6 N/A 30±6 56±5 98±7 b O: Diazinon: 2 ng/L
" Aug 20 2009 30±7 N/A 38±2 112±3 65±18 b N/A
902 Jan 22 2009 75±6 N/A 53±9 127±6 75±8 b P: ND
" Feb 4 2009 66±9 N/A 52±3 119±14 44±12 b P: ND
" Apr 2 2009 50±8 N/A 50±12 90±7 124±7 b
O: Chlorpyrifos: 2 ng/L (Below RL);
Disulfoton: 8 ng/L (Below RL)
" June 11 2009 27±9 29±8 42±7 81±4 60±9 b P: Cypermethrin: 2 ng/L
" Oct 15 2009 49±9 N/A 32±7 88±7 49±6 b O+P: ND
915 Jan 22 2009 75±6 N/A 53±9 84±16 127±5 b O: ND
" Mar 18 2009 26±5 N/A 46±5 93±6 69±4 b P: ND
" June 25 2009 46±10 N/A 44±5 55±10 78±7 b O: ND
" Oct 27 2009 55±8 N/A 45±7 61±5 116±11 b
O+P: 1.5 ng/L Lambda-cyhalothrin;
Permethrin: 48.9 ng/L (15.1 cis, 33.8 trans)
CL Feb 4 2009 66±9 N/A 52±3 105±4 60±2 b P: ND
" June 25 2009 46±10 N/A 44±5 83±7 43±7 b P: ND
" Aug 20 2009 30±7 26±5 32±3 101±8 72±8 b N/A
" Oct 15 2009 38±4 N/A 44±2 83±5 62±4 b O+P: ND
" Dec 30 2009 51±4 N/A 88±16 96±10 127±8 b O: ND
CU Feb 4 2009 66±9 N/A 52±3 121±11 63±5 b P: ND
" Feb 19 2009 34±6 N/A 30±6 74±8 42±6 b P: Bifenthrin: 117 ng/L
" Mar 5 2009 45±2 N/A 60±26 73±4 40±5 b P: ND
" Apr 2 2009 50±8 N/A 50±12 36±5 106±5 b O: Chlorpyrifos: 78 ng/L;
Disulfoton: 17 ng/L (Below RL)
Hood Mar 19 2009 26±5 N/A 46±5 92±3 67±6 b P: Permethrin: 3 ng/L
(2 cis, 1 trans)

POD 2008-2010: Final Report
26
Table 6 b, cont. Samples collected in 2009 and showing significant differences in final H. azteca
weight compared to controls or PBO effects, and corresponding analytical results. Gray shade: significant difference from control; pink shade: significant increase in weight due to PBO.
10-d Weight ± SE (µg/individual)
Site Sampling Date Test Acceptability
Control
EC Control
(EC) Control with PBO
Ambient Ambient with PBO
Analytical Results
" Apr 28 2009 55±9 55±2 57±6 77±5 99±5 b O: ND
" July 7 2009 67±4 57±6 58±4 94±5 56±6 b P: Permethrin: 11
ng/L (5 cis, 6 trans)
" Sept 17 2009 60±11 59±4 76±10 104±2 81±3 b O+P: ND
" Oct 1 2009 42±12 N/A 52±4 51±9 77±4 b O+P: ND
" Dec 3 2009 51±5 N/A 50±6 101±4 84±7 b O+P: ND Light
55 Feb 4 2009 66±9 N/A 52±3 79±5 50±5 b P: ND
" Mar 18 2009 48±9 N/A 63±11 72±4 97±3 b O: Chlorpyrifos: 10
ng/L
" June 11 2009 27±9 N/A 37±3 86±6 64±2 b P: Cypermethrin: 2
ng/L
" Dec 1 2009 37±5 N/A 41±3 74±6 99±7 b O+P: 1.4 ng/L Esfenvalerate
" Dec 15 2009 34±3 N/A 30±5 68±4 43±5 b P: ND
NAPA July 7 2009 67±4 31±1 33±5 39±4 12±2 a, b N/A
R&R Jan 6 2009 42±6 N/A 76±9 117±6 64±15 b P: ND
" Mar 17 2009 48±9 N/A 63±11 93±6 64±7 b P: Cyfluthrin: 3
ng/L
" Aug 18 2009 45±5 36±6 27±6 100±12 66±7 b P: Cyfluthrin: 0.4
ng/L " Sept 17 2009 60±11 N/A 70±6 135±4 117±3 b N/A
Suisun @
Rush R.
Feb 17 2009 39±4 N/A 32±6 35±6 60±1 b O: Disulfoton: 14
ng/L
" Apr 15 2009 65±6 N/A 56±1 50±14 90±5 b O: ND
" Apr 28 2009 55±9 N/A 69±6 90±6 119±6 b O: ND
" Dec 3 2009 51±5 43±3 40±5 124±12 78±5 b O+P: ND
" Dec 17 2009 45±6 N/A 37±8 62±2 76±1 b O: ND a Significantly different from appropriate control (p≤0.05); b Significantly different from ambient sample (p≤0.05);
Chemical Analysis: P: Pyrethroid, O: Organophosphate, C: Comprehensive, Cb: Carbamate, M: Metal

POD 2008-2010: Final Report
27
Site-specific toxicity: Information on the number of samples causing significant effects on amphipod survival and growth, or PBO effects at any given sampling site is summarized in Table 7. Cache-Ulatis had the greatest number of samples, where a PBO effect on survival suggested the presence of pyrethroid insecticides. In addition, PBO synergized effects on growth in 6 samples. Sites Hood, Cache-Ulatis, Rough and Ready Island, Suisun Slough at Rush Ranch, Light 55, 915 and 508 had the greatest number of samples with synergistic or antagonistic effects on amphipod growth. Table 7. Number of samples causing significant differences in H. azteca survival or growth by
sampling site.
Site
Total Samples Tested
[n]
Reduced Survival1 [n] (% of Total)
Reduced Survival (PBO)2
[n]
PBO Effect on Survival
[n]
Reduced Weight1
[n] (% of Total)
Synergistic PBO Effect on Growth
[n]
Antagonistic PBO Effect on Growth
[n] 340 17 0 1 1 (6%) ↓ 0 2 3 405 32 1 (3%) 0 0 1 (3%) 3 1 508 51 0 0 0 2 (4%) 6 3 602 51 0 2 0 1 (2%) 2 4 609 50 0 0 0 1 (2%) 5 0 711 51 1 (2%) 2 0 0 4 0 815 50 0 0 0 0 2 3 902 50 0 2 1 (2%) ↓ 0 4 2 910 1 0 0 0 0 0 0 915 50 0 1 1 (2%) ↓ 0 4 4 CL 51 0 0 0 0 5 1 CU 51 0 3 3 (6%) ↓ 1 (2%) 6 1
Hood 51 0 1 1 (2%) ↓ 0 6 4 Light 55 51 1 (2%) 0 0 0 5 3
Napa 36 0 1 (3%) 0 1 (2.8%) 1 1 R & R 50 0 0 0 0 7 0
Suisun @ Rush R.
49 1 (2%) 0 * 0 2 5
Suisun Pub. Dock
2 0 0 0 0 0 1 1 Ambient samples significantly different from appropriate control. 2 Ambient samples with PBO significantly different from PBO control. ↓ Synergistic effect of PBO ↑ Antagonistic effect of PBO

POD 2008-2010: Final Report
28
Effect of ammonia/um on amphipod survival and growth: Correlation analysis of data collected over a 4-year period (2006-2010) revealed significant relationships between amphipod survival and growth at several sites (Table 8). Total ammonia/um concentrations were positively correlated with amphipod survival at sites 323, 504, 804, 915 and Cache-Lindsey, but negatively correlated at Cache-Ulatis. Amphipod growth was negatively correlated with total ammonia/um at sites 405, 609, 711, Light 55, Napa and Rough and Ready Island, and positively correlated at site 910. Un-ionized ammonia was negatively correlated with amphipod growth at Rough and Ready Island.
Table 8. Site-specific correlation between total and un-ionized ammonia and H. azteca survival and growth in Delta water samples collected 2006 - 2009.
Site
Survival vs Total NH4
+/NH3 Survival vs NH3
Log10 Weight vs NH4
+/NH3 Log10 Weight vs
NH3
Coeff. P Coeff. P Coeff. P Coeff. P 323 0.726 0.017* 0.558 0.094 -0.038 0.861 3.114 0.775 340 -0.181 0.346 0.061 0.760 -0.001 0.983 -4.333 0.484 405 -0.339 0.078 -0.295 0.128 -0.057 0.032* -3.051 0.171 504 0.578 <0.0001* 0.219 0.149 0.032 0.678 0.410 0.929 508 0.059 0.559 -0.034 0.737 -0.026 0.407 -2.959 0.153 602 0.183 0.177 0.025 0.854 -0.065 0.050 -1.760 0.454 609 0.204 0.052 0.118 0.266 -0.052 0.039* -4.029 0.181 704 0.242 0.091 0.005 0.974 0.037 0.538 0.641 0.858 711 0.095 0.348 0.097 0.338 -0.036 0.049* -0.881 0.131 804 0.354 0.012* 0.010 0.943 0.020 0.761 -2.805 0.262 812 0.166 0.260 0.043 0.771 -0.108 0.158 -3.088 0.361 815 0.060 0.676 -0.009 0.950 -0.006 0.896 -0.036 0.984 902 0.012 0.905 -0.110 0.276 -0.044 0.250 2.546 0.136 910 0.207 0.150 -0.154 0.285 0.099 0.029* 1.163 0.685 915 0.219 0.029* 0.075 0.460 0.019 0.609 1.745 0.492 CL 0.340 0.014* 0.089 0.529 -0.020 0.476 -1.210 0.087 CU -0.131 0.350 -0.283 0.040* -0.085 0.089 0.159 0.926
Hood 0.056 0.674 -0.016 0.907 0.019 0.408 -0.781 0.446 Light 55 -0.168 0.098 -0.164 0.107 -0.068 0.018* -1.191 0.226
Napa -0.210 0.375 -0.306 0.190 -0.070 0.021* -2.909 0.525 R&R -0.159 0.271 0.098 0.501 -0.099 0.011* -6.301 0.012*
Suisun @ Rush R. 0.072 0.652 0.089 0.576 -0.008 0.824 -4.145 0.268
Survival: Nonparametric correlations in the EC < 12,000 range. Weight: Multivariate regression models with EC controlled as a covariate with linear and quadratic terms.
III.2.2.4 Analytical Chemistry
When acute toxicity was observed, whole water samples preserved with DCM were immediately submitted to CDFG-WPCL for chemical analysis. Otherwise, samples were
POD 2008-2010: Final Report
29
submitted after statistical analysis was complete and significant PBO effects on growth were detected (approx. 14 d after sample collection). Ambient water samples submitted for chemical analysis are listed in Tables 9 a-c. For a detailed list of analytes, please see Table A1, Appendix A. A total of 113 samles were submitted for analysis. Pyrethroids, in particular cyfluthrin, permethrin, cypermethrin, bifenthrin, lambda-cyhalothrin and esfenvalerate, were detected in 24 samples, organophosphates, in particular chlorpyrifos, diazinon and disulfoton, were detected in 13 samples, and the herbicide diuron was detected in all ten samples it was analyzed in. Numerous samples contained more than one contaminant.
Pyrethroids were not detected in several samples, where TIE analyses strongly suggested that toxicity was due to this group of insecticides. Pyrethroids and organophosphates were, however, detected in some of the samples that showed reductions or increases in H. azteca weight, respectively. Pyrethroid insecticides were detected in low concentrations from samples collected at Rough & Ready Island on 3/17/2009 (3 ng/L cyfluthrin) and Hood on 3/18/2009 (3 ng/L permethrin). The organophosphate insecticides chlorpyrifos, diazinon, and disulfoton were detected singularly or in combination at sites 508, 602, 815, 902, Cache-Ulatis, and Light 55. Although the majority of these detections were below the reporting limit of the analytical laboratory, a sample collected from Cache-Ulatis on 4/2/2009 resulted in the detection of 78 ng/L chlorpyrifos. This sample was submitted to CDFG-WPCL following a significant increase in growth with the addition of PBO in the 10-d H. azteca bioassay. The detected concentration of chlorpyrifos is greater than the 10-d control water LC50 of 67.2 ng/L determined by UCD-ATL in January 2009, but survival was not affected in this test. A sample collected from Light 55 on 3/19/09 caused a significant increase in growth when treated with PBO and resulted in the detection of 10 ng/L chlorpyrifos. The herbicide diuron was detected at concentrations of up to 32 ng/L (Napa - Aug. 12, 2008). Analytical results of total and dissolved metals suggest that metals are not the dominant toxicants in these water samples, although a more detailed analysis of available LC50 and effect concentrations at different salinities, as well as mixture effects is needed.
In many samples where survival or weight effects suggested the influence of insecticides, chemical analyses resulted in no detection of chemicals. This may, in part, be due to the very high sensitivity of H. azteca to pyrethroid insecticides. For example, effect concentrations of bifenthrin and cyfluthrin are close to the reporting and detection limits of the chemical analysis (Table 10). Analyte degradation may have further reduced our capability to detect the small amounts of pesticide capable of affecting H. azteca. Although samples destined for pyrethroid analysis were preserved with DCM within 12 hours of collection, the time from sample collection to observation of toxicity caused a latency of approximately two weeks from sample collection to delivery to the analytical laboratory.

POD 2008-2010: Final Report
30
Table 9 a. Results of chemical analysis of whole water samples analyzed in 2008 and 2009. Samples are listed in chronological order. All samples were submitted approx. 14 d after collection unless otherwise noted. Results of metals analysis provided in Table 4-5 b. ND=below detection limit; * detection below reporting limit
Site Collection
Date Scan Type Results
CU 1/31/2008 pyrethroid scan ND
CU 1/31/2008 OP & Pyrethroids 7 pptr cyfluthrin, 3 pptr bifenthrin, 11 pptr disulfoton (submitted within 24 h of sample collection)
CU 2/28/2008 pyrethroid scan 1 pptr bifenthrin, 1 pptr lambda-cyhalothrin
711 4/9/2008 comprehensive1 1 pptr bifenthrin, 41 pptr diuron + METALS CL 4/9/2008 comprehensive 86 pptr diuron, + METALS
PAH: 0.0473 ng/mL naphthalene, 0.0141 ng/mL methylnaphthalene, 2-, 0.00769 ng/mL methylnaphthalene, 1-, 0.0232 ng/mL naphthalenes, C1-, 0.0141 naphthalenes, C2-
Hood 4/22/2008 comprehensive 1 pptr lambda-cyhalothrin, 87 pptr diuron, + METALS
PAH: 0.005 ng/mL fluoranthene, 0.008 ng/mL benzo(b)fluoranthene
CL 4/23/2008 comprehensive 1 pptr bifenthrin, 60 pptr diuron, 4 pptr methomyl, + METALS
PAH: 0.011 ng/mL fluoranthene, 0.010 ng/mL fluoranthene/pyrenes, C1-, 0.009 ng/mL pyrene, 0.007 ng/mL benz(a)anthracene, 0.007 ng/mL chrysene, 0.017 ng/mL benzo(b)fluoranthene, 0.010 ng/mL benzo(e)pyrene, 0.010 ng/mL benzo(a)pyrene, 0.012 ng/mL indenol(1,2,3-c,d)pyrene, 0.012 ng/mLbenzo(g,h,i)perylene
711 4/23/2008 comprehensive 1 pptr bifenthrin, 60 pptr diuron, 3 pptr carbaryl + METALS 508 5/7/2008 pyrethroid scan ND 902 5/12/2008 comprehensive 57 pptr diuron + METALS Napa 5/21/2008 pyrethroid scan ND 405 5/23/2008 pyrethroid scan ND 902 5/23/2008 OP scan ND Napa 6/17/2008 comprehensive 32 pptr diuron + METALS Napa 7/15/2008 pyrethroid scan ND Hood 7/15/2008 pyrethroid scan ND 609 7/16/2008 pyrethroid scan ND 815 7/17/2008 pyrethroid scan ND
405 7/30/2008 comprehensive1 10 pptr diuron + METALS 609 7/30/2008 pyrethroid scan ND 915 7/31/2008 pyrethroid scan ND 902 7/31/2008 pyrethroid scan ND
Suisun 8/12/2008 pyrethroid scan & metals ND + METALS
602 8/13/2008 pyrethroid scan ND 902 8/28/2008 pyrethroid scan 16 pptr cypermethrin 915 8/28/2008 pyrethroid scan ND 508 9/10/2008 pyrethroid scan ND 609 9/10/2008 pyrethroid scan ND 609 9/24/2008 pyrethroid scan ND

POD 2008-2010: Final Report
31
Site ID Collection
Date Scan Type Results
Hood 10/7/2008 organophosphate scan ND
609 10/8/2008 carbamate scan & metals 8 pptr diuron + METALS
Hood 11/4/2008 pyrethroid scan 1.2 pptr cyfluthrin R&R 11/4/2008 pyrethroid scan ND 711 11/20/2008 pyrethroid scan ND
R&R 1/6/2009 pyrethroid ND2 602 1/7/2009 organophosphate 8 pptr disulfoton* 508 1/21/2009 organophosphate ND 711 1/22/2009 pyrethroid ND 915 1/22/2009 organophosphate ND 902 1/22/2009 pyrethroid ND Hood 1/23/2009 pyrethroid ND Cache-Ulatis 2/4/2009 pyrethroid ND 902 2/4/2009 pyrethroid ND Cache-Lindsey 2/4/2009 pyrethroid ND Light 55 2/4/2009 pyrethroid ND Suisun 2/17/2009 organophosphate 14 pptr disulfoton 340 2/18/2009 organophosphate ND 815 2/19/2009 organophosphate 2 pptr diazinon Cache-Ulatis 2/19/2009 pyrethroid 117 pptr bifenthrin 508 3/4/2009 pyrethroid ND Cache-Ulatis 3/5/2009 pyrethroid ND Rough & Ready 3/17/2009 pyrethroid 3 pptr cyfluthrin 815 3/18/2009 organophosphate 2 pptr diazinon*, 3 pptr chlorpyrifos*, 8 pptr disulfoton*
Hood 3/18/2009 pyrethroid 3 pptr permethrin 915 3/18/2009 pyrethroid ND Light 55 3/19/2009 organophosphate 10 pptr chlorpyrifos 508 4/1/2009 organophosphate 2 pptr chlorpyrifos* 902 4/2/2009 organophosphate 2 pptr chlorpyrifos*, 8 pptr disulfoton* Cache-Ulatis
4/2/2009 organophosphate 78 pptr chlorpyrifos, 17 pptr disulfoton*
Suisun 4/15/2009 organophosphate ND Suisun 4/28/2009 organophosphate ND Hood 4/28/2009 organophosphate ND 602 4/29/2009 organophosphate ND 340 5/13/2009 pyrethroid ND Napa 6/9/2009 pyrethroid 9 pptr esfenvalerate/fenvalerate 340 6/10/2009 organophosphate ND Light 55 6/11/2009 pyrethroid 2 pptr cypermethrin 902 6/11/2009 pyrethroid 2 pptr cypermethrin

POD 2008-2010: Final Report
32
Site ID Collection Date Scan Type Results
Hood 6/23/2009 pyrethroid 20 pptr permethrin (7 pptr cis, 13 pptr trans) R&R 6/23/2009 organophosphate 12 pptr diazinon
711 6/25/2009 comprehensive1 3 pptr diuron + METALS results not yet available Cache-Lindsay 6/25/2009 pyrethroid ND 902 6/25/2009 METALS results not yet available 915 6/25/2009 organophosphate ND Hood 7/7/2009 pyrethroid 11 pptr permethrin (5 pptr cis, 6 pptr trans) 602 7/20/2009 OP + pyrethroid ND 711 8/6/2009 METALS results not yet available R&R 8/18/2009 pyrethroid 0.4 pptr cyfluthrin CL 8/20/2009 pyrethroid 2 pptr cypermethrin 815 8/20/2009 pyrethroid 2 pptr cypermethrin CL 9/1/2009 pyrethroid ND CU 9/1/2009 pyrethroid ND 711 9/15/2009 pyrethroid ND Hood 9/17/2009 pyrethroid ND 609 9/16/2009 OP + pyrethroid ND1 CL 9/15/2009 OP + pyrethroid ND1 609 9/30/2009 OP + pyrethroid 2.6 pptr bifenthrin, 1.4 pptr cypermethrin R&R 10/1/2009 OP + pyrethroid 1.7 pptr bifenthrin Hood 10/1/2009 OP + pyrethroid ND CU 10/15/2009 OP + pyrethroid 3 pptr diazinon, 3 pptr chlorpyrifos CL 10/15/2009 OP + pyrethroid ND 902 10/15/2009 OP + pyrethroid ND 815 10/15/2009 OP + pyrethroid 2 pptr chlorpyrifos, 5 pptr diazinon Light 55 10/15/2009 OP + pyrethroid ND Suisun 10/16/2009 OP + pyrethroid ND R&R 10/16/2009 OP + pyrethroid ND CU 10/27/2009 OP + pyrethroid 34.7 pptr permethrin (16.5 cis, 18.2 trans), 2 pptr chlorpyrifos
915 10/27/2009 OP + pyrethroid 1.5 pptr lambda-cyhalothrin, 48.9 pptr permethrin (15.1 cis, 33.8 trans)
CL 10/27/2009 OP + pyrethroid ND R&R 10/29/2009 OP + pyrethroid ND Hood 10/29/2009 OP + pyrethroid 3.7 pptr permethrin (3.7 trans) CL 11/9/2009 OP + pyrethroid ND 815 11/9/2009 OP + pyrethroid ND 602 11/10/2009 OP + pyrethroid ND 711 12/1/2009 OP + pyrethroid ND Light 55 12/1/2009 OP + pyrethroid 1.4 pptr esfenvalerate Suisun 12/3/2009 OP + pyrethroid ND Hood 12/3/2009 OP + pyrethroid ND Light 55 12/17/2009 pyrethroid ND Suisun 12/17/2009 pyrethroid ND CL 12/30/2009 pyrethroid ND
1 delivered to DFG on furlough Friday, samples were not refrigerated for 2 d and extraction delayed.

POD 2008-2010: Final Report
33
Table 9 b. Results of metals analysis of toxic samples collected 2008 - 2009.
711 CL Hood CL 711 902 Napa 405 Suisun (RR)
609 Metal
4/9/2008 4/9/2008 4/22/208 4/23/2008 4/23/2008 5/12/2008 6/17/2008 7/30/2008 8/12/2008 10/8/2008
Ag Total <0.001 0.002 <0.001 <0.001 0.005 <0.001 0.12 0.08 0.67 <0.02 Dissolved <0.001 <0.001 <0.001 <0.001 <0.001 <0.001 0.48 0.09 0.04 <0.02 Al Total 206 771 307 1421 398 613 1970 1431 15256 536 Dissolved 5.89 11.3 13.5 <1.7 2.71 20.5 15.1 <1.7 <1.7 <1.7 As Total 2.03 2.6 1.84 2.46 1.93 2.69 55.1 66.4 39.5 27.3 Dissolved 2.58 2 1.77 2.42 1.98 2.24 49.8 63.7 40.3 25.6 Cd Total 0.025 0.035 0.02 0.017 0.016 0.02 0.32 0.26 0.49 0.11 Dissolved 0.014 0.016 0.01 <0.004 <0.004 0.01 0.32 0.19 0.29 0.10 Cr Total 2.46 6.11 3.1 4.25 1.62 2.91 11.8 9.13 27.1 4.51 Dissolved 3.6 0.64 0.86 1.22 0.85 1.28 5.06 5.57 3.70 3.25 Cu Total 3.01 4.1 2.22 4.41 2.16 3.47 57.9 63.3 61.6 24.9 Dissolved 2.4 1.51 1.25 2.13 1.3 1.72 49.0 58.9 37.2 21.2 Mn Total 26.3 37.6 34.5 43.3 24.9 26.7 557 49.4 1231 89.1 Dissolved 5.29 9.94 6.39 0.19 0.39 0.83 15.0 2.54 34.0 72.0 Ni Total 2.21 5.41 2.19 6.75 2.22 3.53 22.7 16.2 48.0 8.15 Dissolved 1.94 1.29 1.02 1.83 1.04 2.13 13.6 11.7 13.4 6.50 Pb Total 0.31 0.56 0.32 0.62 0.21 1.31 3.13 0.63 20.3 0.41 Dissolved 0.18 0.079 0.27 <0.002 0.002 0.49 0.11 0.04 <0.015 <0.015 Se Total <0.45 <0.45 <0.45 <0.45 <0.45 <0.45 136 150 84.0 44.7 Dissolved 0.51 0.53 <0.45 0.69 <0.45 0.59 119 137 77.1 55.0 Zn Total 7.04 6.52 6.37 6.5 2.43 3.91 12.6 5.11 83.4 1.41 Dissolved 7.69 2.08 2.16 0.74 0.57 5.02 1.96 2.04 1.00 <0.50
Results still pending for: 711-062509, 902-062509, 711-080609

POD 2008-2010: Final Report
34
Table 9 c. Results of routine metals analysis performed during 2009. Dissolved Metals (ppb)
Site Date
Collected Ag Al As Cd Cr Cu Mn Ni Pb Se Zn
711 2/19/2009 <.02 12.8 1.52 <.01 0.11 2.54 0.79 1.49 0.04 2.24 <.50 711 3/18/2009 0.03 <1.7 2.88 0.14 2.40 2.24 6.57 1.89 <.015 <.60 <.50 711 4/15/2009 <.02 3.28 1.46 <.01 0.18 2.78 0.05 0.85 <.015 <.60 <.50 711 5/28/2009 0.06 2.72 1.60 0.03 <.10 2.23 12.0 0.60 0.03 <.60 <.50 902 2/19/2009 <.02 11.7 2.45 <.01 0.56 2.23 7.64 2.07 0.05 3.68 <.50 902 3/18/2009 <.02 9.88 2.01 0.12 2.07 2.86 7.33 2.67 0.02 <.60 <.50 902 4/23/2009 0.08 11.9 2.16 0.03 <.10 2.69 2.60 1.02 0.14 3.03 <.50 902 5/28/2009 0.05 7.60 2.64 0.05 0.13 3.19 3.25 1.04 0.04 <.60 <.50 CL 2/19/2009 <.02 6.05 2.14 <.01 0.38 2.35 0.27 1.92 0.02 1.86 0.55 CL 3/18/2009 <.02 <1.7 2.58 0.02 2.18 3.35 3.79 2.53 0.02 <.60 <.50 CL 4/15/2009 <.02 5.91 2.25 <.01 <.10 4.93 0.13 1.69 0.03 3.01 <.50 CL 5/28/2009 0.07 2.03 1.92 0.05 0.21 2.25 6.68 1.13 0.04 0.89 <.50
Rough & Ready 2/17/2009 <.02 2.68 2.11 <.01 <.10 2.57 0.09 2.64 <.015 3.66 1.21 Rough & Ready 3/17/2009 0.62 <1.7 2.83 0.13 2.17 2.95 0.87 3.28 <.015 1.2 <.50 Rough & Ready 4/14/2009 0.09 2.85 2.85 <.01 <.10 4.64 0.27 2.87 0.02 3.51 <.50 Rough & Ready 5/27/2009 0.04 44.7 2.57 0.10 1.28 4.41 25.1 2.53 0.03 4.09 <.50 Suisun 2/19/2009 0.04 4.42 10.1 0.02 1.40 11.5 52.1 9.00 0.02 43.6 2.07 Suisun 3/18/2009 <.02 <1.7 12.1 0.10 5.88 9.65 352 9.01 <.015 19.2 <.50 Suisun 4/15/2009 0.50 6.98 7.92 0.01 1.44 18.9 17.4 9.08 0.15 25.3 2.46 Suisun 5/26/2009 0.51 4.77 9.18 0.11 1.25 11.3 83.8 6.23 0.10 28.4 <.50
June 2009 routine metals results still pending

POD 2008-2010: Final Report
35
Table 10. Comparison of analytical detection limits and H. azteca sensitivities to some organophosphate and pyrethroid pesticides. LC50 / EC25 values were used preferentially, with LOEC substituted when necessary.
Analytical Chemistry H. azteca Toxicity Pesticide Estimated Detection
Limit (ng/L) Reporting Limit
(ng/L)
10-d Survival LC50/LOEC (ng/L)
10-d Weight EC25/LOEC (ng/L)
Chlorpyrifos 2.0 5.0 84.9 > 66 Diazinon 2.0 5.0 2900 2000 Bifenthrin 0.2 0.4 3.3 0.9 Cyfluthrin 0.4 0.8 2.7 1.5 Permethrin 0.6 1.0 59.0 > 80

POD 2008-2010: Final Report
III.3 Toxicity Monitoring with Delta Smelt (Hypomesus transpacificus)
III.3.1 Methods
III.3.1.1 Ambient Toxicity Tests
Test organisms and control water: Tests were performed using larval delta smelt at age ranges of 28-57 d (2008) and 30-55 d (2009). Delta smelt were obtained from the UC Davis Fish Conservation and Culture Laboratory (UCD-FCCL) in Byron, CA. Hatchery water collected from the UCD-FCCL was used for all control treatments. Fish were transported to UCD-ATL following methods described by Werner et al. (2008).
Sampling: Water samples (35 gal/site) were collected as described in Chapter 1 (above) from the DWR water quality monitoring stations at Hood (Sacramento River) and Rough & Ready Island (San Joaquin River), and from sites Light 55, Suisun Slough at Rush Ranch, Napa River at the Vallejo Seawall, and Cache Slough near the confluence with Lindsey Slough (Table 3-1, Figure 3-1). Water collections for delta smelt toxicity testing occurred four times in 2008 (March 25 to May 22, 2008) and six times in 2009 (March 17 to May 28, 2009).
Testing procedures: Test and fish transport protocols followed those developed at UCD-ATL and described in detail by Werner et al. (2008). A flow-through system was used for testing of ambient waters. Upon arrival at UCD-ATL, the transport containers with fish were placed into a temperature-regulated water bath maintained at 16º C. One-liter glass beakers were used to gently move the fish to a bread pan containing hatchery water at a depth of approximately 2 cm. The fish were then carefully removed from the pan using 100 ml beakers and released into the replicate exposure tanks at random, submerging the beaker and allowing the fish to swim freely into the tanks. Twelve fish were placed into each of the tanks containing 7 L of water for a 48-h EC acclimation period. Hatchery water and EC-adjusted hatchery water was used as acclimation and control water. EC was adjusted with distilled water (“Low EC Control”) to match the lowest EC of ambient water samples. When turbidity of the hatchery water was below 11 NTUs, Nanno 3600™, a concentrated Nannochloropsis algae solution (68·109 cells/ml; Reed Mariculture, Inc. Campbell, CA) was added to increase turbidity in control treatments. Turbidity of the “Low Turbidity Control” was matched daily to the lowest turbidity seen in ambient samples. For tests conducted in 2009, gram-negative and gram-positive antibiotics (Maracyn and Maracyn-2, Virbac AH Inc., Fort Worth TX) were added at the manufacturer’s recommended dose throughout the acclimation and testing period. Final concentrations were 5.3 mg/L Maracyn (erythromycin) and 0.26 mg/L Maracyn-2 (minocycline). During acclimation and testing, fish were fed three times per day with 200 µl of Artemia and 300 µl of rotifers. At test initiation, water in aquaria was drained to approximately 2 L to allow for an accurate count of living fish. Water quality parameters (EC, pH, temperature, DO, turbidity and ammonia) were measured daily. Dead fish were counted and removed daily. At test termination, surviving fish were counted, euthanized with MS-222, flash-frozen and stored at -80oC for future biomarker analysis.
III.3.1.2 Statistical Analysis
Data from delta smelt tests were analyzed using the USEPA standard single-concentration statistical protocols (US EPA 2002). The US EPA method follows standardized statistical method used in aquatic toxicology monitoring and regulation throughout the United States.
36

POD 2008-2010: Final Report
III.3.2 Results
2008 Monitoring Period: Two out of four samples collected at Hood caused significant reductions in delta smelt survival compared to the appropriate controls (Table 11, Appendix C). While control survival was below 60% in two tests (March 25/27, April 22/24), larval delta smelt survival was consistently high in water from Suisun Slough (85-98%) and the Napa River (76-96%). Larval smelt generally did very well in water from the Deep Water Ship Channel at Light 55 (52-92% survival). Good performance at these sites can potentially be explained by two important water quality parameters: salinity and/or high turbidity. Turbidity appears to be the most important factor, since water at Light 55 generally has low conductivity (200-300 µS/cm) albeit not as low as the Sacramento River. However, although Cache Slough had similar conductivity and turbidity conditions as the Deep Water Ship Channel (Chapter III.1), fish survival rates were generally lower in Cache Slough (59-71%), suggesting less favorable water quality. Survival was significantly lower than the appropriate control in two water samples collected from Hood on April 24 and May 22, 2008.
Table 11. Percent survival of H. transpacificus after 7-day exposures to Delta water samples. Results marked in bold/shaded boxes are significantly different from their respective control.
Sampling Dates:
3/25- 3/27/08
4/8- 4/10/08
4/22- 4/24/08
5/20- 5/22/08
Age of Delta Smelt: 28 days 38 days 37 days 57 days
Treatment Mean EC (µS/cm)
Mean 7-day Survival1
Low EC Control 213 48.7 60 37.7 75 Hatchery Rearing Control 909 58.3 72.9 38.3 75 High EC Control 4034 82.6 77.3 60.8 88.8 Low Turbidity Control 3075 56.3 27.1 50 69.2
Sacramento River at Hood DWR Station2 185 25 34.5 20.25 46.15
Deep Water Channel, Light 552 296 91.7 72.9 52.1 77.5
Confluence of Lindsey Sl. And Cache Sl.2 282 59.3 67.8 61.9 71.3
Rough and Ready DWR station2 536 42.4 47.9 51.3 55
Suisun Slough at Rush Ranch3 3928 91.8 87.5 97.7 85
Napa River at Vallejo Seawall (340)4 17767 89.7 95.8 76.1 92.5 1. Highlighted areas indicate significant reductions in survival compared to the appropriate EC-specific and turbidity-specific controls.
2. These low conductivity samples were compared to the Low EC Control. 3. Suisun Slough at Rush Ranch was compared to Mid- and High EC Controls, as appropriate. 4. Napa River at Vallejo Seawall was compared to the High EC Control. 5. Hood showed lower survival than both the low EC control and the low turbidity control according to USEPA statistical protocols.
37

POD 2008-2010: Final Report
38
2009 Monitoring Period: With the exception of the first test of the season, which performed poorly, survival of larval delta smelt after 7 d was ≥76.4 in the “low-conductivity controls”, ≥70.8 in “mid-conductivity controls”, ≥82.5 in “high conductivity controls, and ≥62.5% in “very high conductivity controls” (Table 12; Appendix C). Survival in the “low conductivity/low turbidity control” was generally matched to the water collected from Hood. Delta smelt survival was significantly lower than appropriate conductivity controls in ambient water samples collected from Hood on 4/28/09, from Cache-Lindsey on 4/30/09 and from Rough & Ready collected on 3/31/09, 4/15/09 and 5/12/09. Other instances of significantly reduced survival relative to conductivity-specific controls are samples from Light 55 and Cache-Lindsey, collected on 3/31/09. Water from these sites generally had relatively high turbidity (Chapter III.1). Survival was consistently high in samples collected at the high conductivity, high turbidity site at Suisun Slough at Rush Ranch, as was observed in tests performed in 2008. At site 340, where conductivity was higher and turbidity was lower than in Suisun Slough, survival was generally lower, highlighting the importance of turbidity as a factor influencing delta smelt survival.
We conclude that water quality in the Sacramento River at Hood, in the San Joaquin River at Rough & Ready Island, and near the confluence of Cache and Lindsey Sloughs is at times unfavorable for larval delta smelt. This may in some cases be partly attributable to low turbidity stress. Turbidity, and to a lesser degree salinity/EC, are extremely important parameters influencing larval delta smelt survival. All testing therefore requires controls matching the salinity/EC and turbidity of each sample to obtain conclusive data on water toxicity.

Table 12. Survival of larval H. transpacificus in water samples collected from the Sacramento - San Joaquin Delta. Results indicated in shaded boxes are significantly different from the appropriate control. Hood, Light 55, and Cache Sl. at Lindsey Sl. were compared to the Low EC Control; Rough and Ready to the Mid EC Control; Suisun Slough at Rush Ranch to the High EC Control; Napa River at Vallejo Seawall to the High EC Control or Very High EC Control.
Sampling Period:
3/17/09 - 3/19/09
3/31/09 - 4/2/09
4/14/09 - 4/16/09
4/28/09 - 4/30/09
5/12/09 - 5/14/09
5/26/09 - 5/28/09
Age of Delta Smelt: 30 d 44 d 54 d 41 d 41 d 55 d
Endpoint Treatment Mean EC
(µS/cm) Survival
96-h Survival Low EC Control 160 NA 85.0 84.7N/65.0A 79.2N/88.2A 76.4 79.2 Low EC/Low Turbidity Control 186 NA 66.8 46.7 92.5 68.8 87.5 Low EC/Low Turbidity Control
with Tannins 174 NA 31.8 - - - -
Hood 157 NA 51.0* 67.0* 79.5 62.9 89.7 Light 55 262 NA 69.3 71.4 85.0 84.7 91.9 Cache Lindsey 234 NA 53.6* 55.3 82.5 94.7 91.3 Mid EC Control 644 NA 81.4 75.6 88.0 80.3 70.8 Rough and Ready Island 593 NA 43.0 59.8 90.7 56.7 86.1 High EC Control 3751 NA 86.1 82.5 100.0 86.4 92.5 Low Turbidity Control 3750 NA 81.6 83.3 88.6 85.4 92.5 Suisun 3672 NA 97.7 94.7 97.5 80.4 89.2 Very High EC Control 15776 NA - - - 72.1 70.8 340 15078 NA 88.6 62.2** 97.7 68.9 67.5
* These samples showed significantly lower survival compared to an EC-specific control, but not compared to an EC- and turbidity-specific control.
** Significantly reduced survival was potentially caused by extremely high conductivity.
A Antibiotics added. Antibiotics were added to all treatments in tests initiated 4/30/09 and later.
N No antibiotics added.

POD 2008-2010: Final Report
40
Table 12, cont. Survival of larval H. transpacificus in water samples collected from the Sacramento - San Joaquin Delta. Results indicated in shaded boxes are significantly different from the appropriate control. Hood, Light 55, and Cache Sl. at Lindsey Sl. were compared to the Low EC Control; Rough and Ready to the Mid EC Control; Suisun Slough at Rush Ranch to the High EC Control; Napa River at Vallejo Seawall to the High EC Control or Very High EC Control.
7-d Survival Low EC Control 160 8.3 70.0 58.9N / 65.0A 69.4N / 85.9A 71.4 76.4 Low EC/Low Turbidity Control 186 2.8 43.0 27.4 85.2 59.7 75.0
Low EC/Low Turbidity Control with Tannins
174 - 2.5 - - - -
Hood 157 8.7 19.5* 30.1* 55.3 52.3 71.1 Light 55 262 23.6 40.7* 55.8 80.2 85.5 86.9 Cache Lindsey 234 2.8 25.0* 46.9 67.5 80.1 81.3 Mid EC Control 644 15.3 69.5 67.5 76.4 71.9 62.8 Rough and Ready Island 593 2.8 9.3 42.2 88.2 28.1 72.8 High EC Control 3751 18.6 64.5 70.0 100.0 80.8 82.5 Low Turbidity Control 3750 18.1 61.6 61.9 86.1 55.2 71.4 Suisun 3672 95.0 95.5 92.2 93.1 85.7 86.4 Very High EC Control 15776 - - - - 62.5 68.1 340 15078 88.8 74.8 62.2 88.2 63.9 62.5
* These samples showed significantly lower survival compared to an EC-specific control, but not compared to an EC- and turbidity-specific control.
** Significantly reduced survival was potentially caused by extremely high conductivity.
A Antibiotics added. Antibiotics were added to all treatments in tests initiated 4/30/09 and later.
N No antibiotics added.

POD 2008-2010: Final Report
III.4 In Situ Monitoring on the Sacramento & San Joaquin Rivers
During March – May 2009, in situ monitoring was conducted at the DWR water quality monitoring stations located in Hood, CA (Sacramento River) and Rough & Ready Island in Stockton, CA (San Joaquin River). Six exposures using H. transpacificus, P. promelas, and H. azteca were conducted concurrently with ambient delta smelt toxicity testing in the laboratory. During this pilot project, no toxicity was detected in the Sacramento River at Hood or the San Joaquin River at Rough and Ready Island. H. transpacificus survival was poor, overall, but generally higher in ambient water than in the control, potentially due to slightly higher water temperatures in the control system. H. azteca survival was consistently high in ambient water as well as controls throughout the testing period. P. promelas survival was variable in both the control and ambient water. Poor P. promelas survival in controls was attributed to the addition of algal paste to optimize turbidity conditions for delta smelt larvae. Additional information including system design and exposure methods are provided below.
III.4.1 Methods
III.4.1.1 System Design
In situ devices were installed inside DWR water quality monitoring stations located directly above the Sacramento River in the town of Hood, CA and next to the San Joaquin River on Rough & Ready Island in Stockton, CA. Positioning the devices inside these small buildings had several advantages over placing the replicate cages inside the river itself, including improved temperature control, flow control, and ease of daily access. The device located at Rough & Ready Island was slightly different in layout than the device at Hood due to space restrictions, but overall function was the same. Ambient water was supplied from DWR’s sampling station pump and delivered to the exposure chamber at 3.8 liters per minute (LPM). The apparatus consisted of three main parts: the ambient exposure chamber, the control exposure chamber, and the control sump. Plumbing that connected these three parts consisted primarily of common polyvinyl chloride (PVC) plumbing supplies. The function of each main part is described below.
The ambient exposure chamber consisted of a customized, white acrylic tank surrounded by an outer bath filled with flowing ambient water to maintain temperature. During the acclimation period for delta smelt, the chamber was filled with control water supplied from the control sump below, and at test initiation, control water was switched over to ambient water and the outer bath was drained. Held within the chamber were four replicate cages for each of the three test species (Figures 2, 3). The largest cages, used for larval delta smelt, H. transpacificus, were made from one gallon high density polyethylene (HDPE) buckets. These buckets and lids were black to provide optimal lighting conditions (less than 1 ft-candle through a hole in the lid) for H. transpacificus. Cages used for P. promelas and H. azteca were constructed from two manufactured parts; a low density polyethelene pipe cap (Niagra, Erie, PA) and nylon tea strainer (The Republic of Tea, Navato, CA). The exposure chamber lid that covered these cages was constructed from clear acrylic in order to allow ambient light into the chamber (16:8 light:dark cycle).
41

POD 2008-2010: Final Report
The control exposure chamber, exposure cages and lids were identical to those in the ambient system. Control water was supplied from the control sump immediately below and the control exposure chamber was also surrounded by an outer ambient water bath in order to maintain the temperature within 1 °C of the ambient water at all times. Flow was set at 3.8 LPM.
The control sump consisted of an 11 gallon HDPE bath containing a 210 gallons per hour (GPH) pond pump, which supplied recirculating control water to the control exposure chamber at all times, and to the ambient exposure chamber during acclimation only. The control water consisted of hatchery water diluted with deionized water or salted up with Instant Ocean to the same specific conductance as its corresponding ambient water. Approximately half the control water was replaced daily to reduce an accumulation of total ammonia in the control system and the control sump was aerated to ensure that dissolved oxygen levels remained at or near saturation.
III.4.1.2 Exposure Experiments
Diluted hatchery control water was used for acclimation of test organisms in the laboratory, and their transport to the DWR Station at Hood, as well as for the control treatment. Nanno 3600 Instant Algae (ReedMariculture, Inc., Cambell, CA) was added to increase the turbidity to 10 NTU to provide optimal conditions for H. transpacificus.
H. transpacificus (45-55 d old) were obtained from the UC Davis FCCL in Byron, CA. Fish were transported directly from the hatchery to each experimental site. Upon arrival, the fish were loaded into replicate buckets containing SC-adjusted hatchery water that matched their rearing conditions. The acclimation water also contained Nanno 3600 Instant Algae (ReedMariculture, Inc., Cambell, CA) to raise the turbidity to a minimum of 6 NTU. Over the course of the next 48 hours, the conductivity of the hatchery water was lowered slowly by adding deionized water or diluted hatchery water, until the conductivity matched that of the ambient water. H. transpacificus were fed Artemia nauplii three times daily during acclimation and once daily during the exposure.
Adult H. azteca were obtained from in house cultures and were acclimated in the lab for a minimum of 48 hours prior to the event. P. promelas were obtained from Aquatox, Inc. (Hot Springs, AR) and were acclimated a minimum of 24 hours prior to the event then deployed in the in situ exposure at 7 days old. A piece of dryed and leached leaf, measuring one cm squared, was placed into each H. azteca replicate cage prior to test initiation. All in situ species were fed once daily during the exposure period. P. promelas and H. azteca survival was recorded prior to test initiation and each day during the exposure. H. transpacificus survival was recorded at test initiation, on day 4, and at test termination due to the limited visibility in replicate buckets and the need to minimize disturbance.
42

POD 2008-2010: Final Report
Figure 2. The in-situ exposure system at Hood.
43
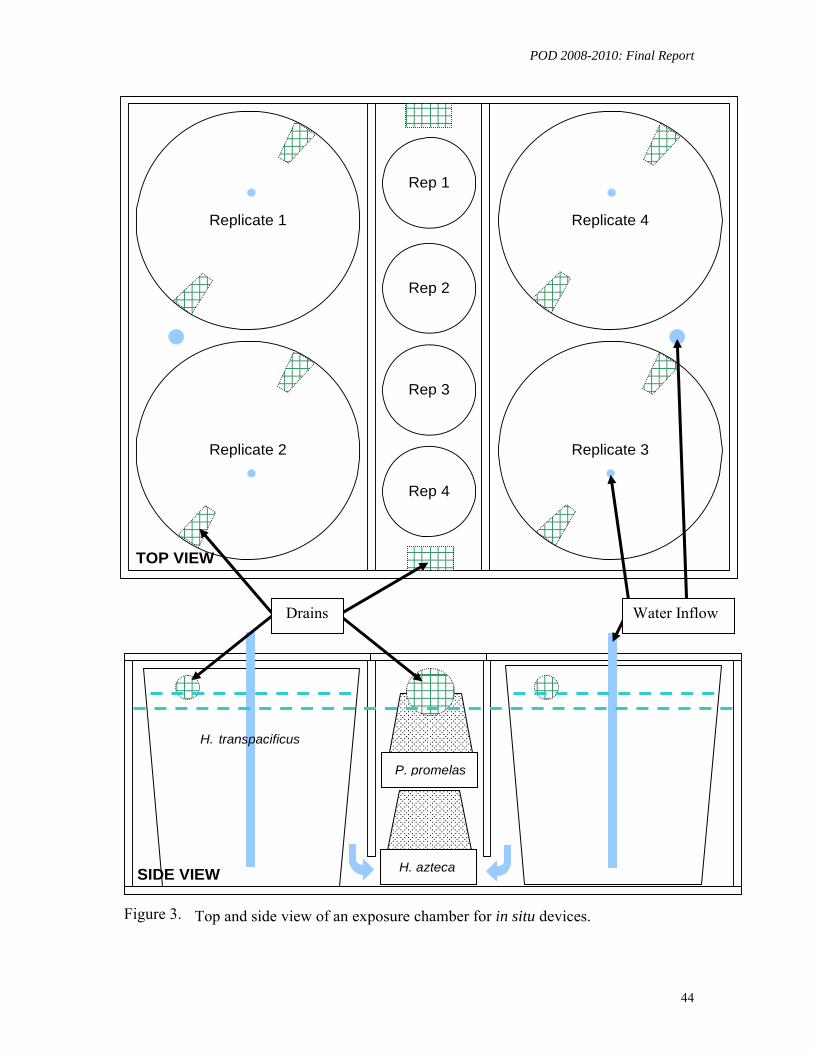
POD 2008-2010: Final Report
Rep 1
Replicate 1
Replicate 2
Replicate 4
Replicate 3
Rep 4
Rep 2
Rep 3
Figure 6-1. Top and side view of an exposure chamber for in situ devices.
H. transpacificus
H. azteca
P. promelas
TOP VIEW
SIDE VIEW
Drains Water Inflow
Figure 3.
44

POD 2008-2010: Final Report
45
Turbidity, temperature, total ammonia, pH, DO, SC, EC, hardness and alkalinity were measured in both the ambient and control exposure chambers daily. Once water was inside the exposure tanks, sediment did settle out to some degree causing an increase in sedimentation over the course of the experiment. Turbidity was also measured at the ambient water source to determine the turbidity going into the system. To the extent possible, SC, turbidity, and temperature were manipulated in the control to parallel the ambient exposure system. The SC and turbidity of the control water was adjusted daily immediately following a partial water exchange. Although we intended to adjust the turbidity of the control water to match the ambient water, we were unable to match the turbidity since the addition of too much alga confounds exposure results by increasing ammonia and producing more pathogens. Turbidity readings were consistently lower in the control water than the ambient water.
4.1.3 Statistical Analysis
Survival of each species was compared between control and ambient treatments using USEPA standard single-concentration statistical protocols.
4.2 Results
Tables 13 and 14 show the survival of H. transpacificus, P. promelas and H. azteca at the Rough and Ready DWR Station at Stockton and the Hood DWR Station on the Sacramento River. Detailed data tables are provided in Appendix D. No significant reductions in survival were detected at either site during any experimental event. H. transpacificus survival was generally higher in ambient waters than in the controls, H. azteca survival was consistently high throughout the in situ season, and P. promelas survival was variable in both the control and ambient waters.

POD 2008-2010: Final Report
Table 13. 96-hour and 7-day survival of animals examined in flow-through in situ tests initiated at the Rough and Ready DWR Station, Stockton, CA.
H. transpacificus P. promelas H. azteca
96-h Survival (%)
7-d Survival (%)
96-h Survival (%)
7-d Survival (%)
96-h Survival (%)
7-d Survival (%) Date Treatment
mean se mean se mean se mean se mean se mean se
3/19/2009 Control - - 22 10.4 94 6.3 71 16.1 95 5.0 95 5.0 Ambient - - 35 9.3 80 0.0 65 9.6 100 0.0 100 0.0 4/2/2009 Control 61 8.9 41 7.9 60 8.2 45 5.0 95 5.0 95 5.0 Ambient 75 6.8 61 9.4 90 10.0 90 10.0 100 0.0 100 0.0 4/16/2009 Control 63 9.7 59 12.4 65 12.6 65 12.6 100 0.0 100 0.0 Ambient 71 9.8 66 12.5 45 12.6 40 8.2 100 0.0 100 0.0 4/30/2009 Control 79 12.5 68 15.8 75 9.6 70 12.9 95 5.0 90 10.0 Ambient 61 16.5 47 14.1 70 12.9 70 12.9 100 0.0 85 9.6 5/14/2009 Control 15 9.6 0 0.0 95 5.0 95 5.0 100 0.0 95 5.0 Ambient 15 8.6 15 8.6 100 0.0 100 0.0 100 0.0 100 0.0 5/28/2009 Control - - - - 100 0.0 100 0.0 100 0.0 100 0.0 Ambient - - - - 100 0.0 100 0.0 100 0.0 95 5.0
46
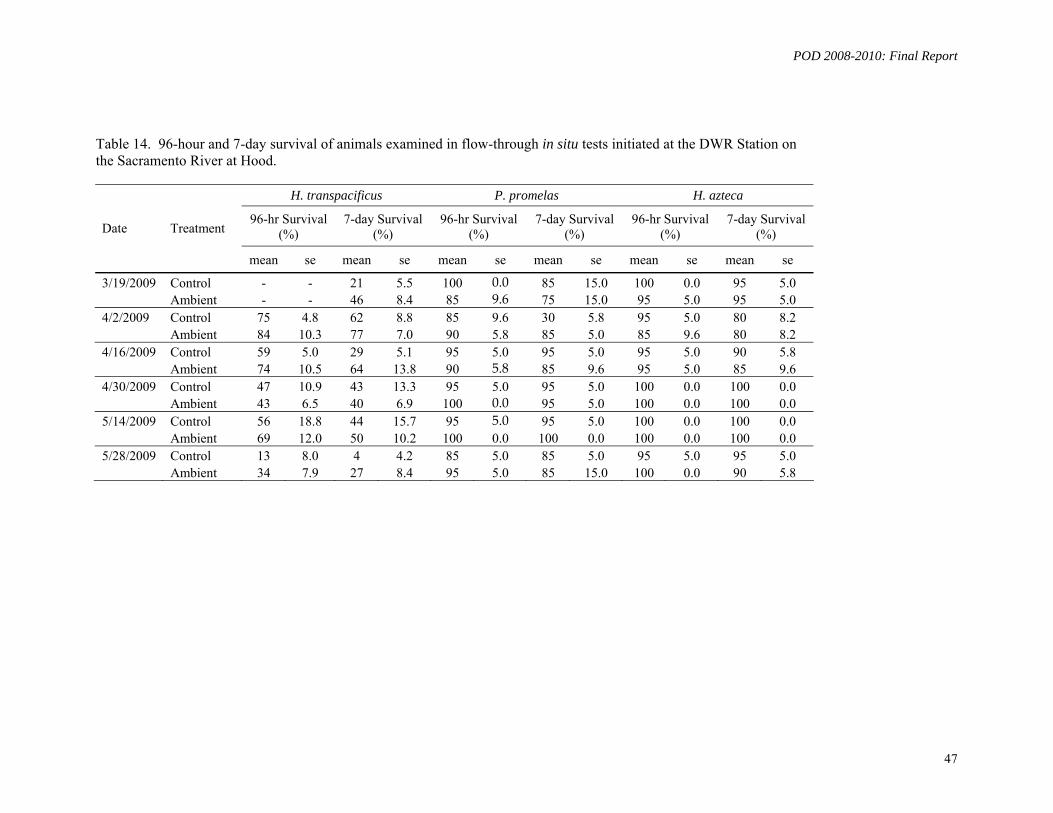
POD 2008-2010: Final Report
47
Table 14. 96-hour and 7-day survival of animals examined in flow-through in situ tests initiated at the DWR Station on the Sacramento River at Hood.
H. transpacificus P. promelas H. azteca
96-hr Survival (%)
7-day Survival (%)
96-hr Survival (%)
7-day Survival (%)
96-hr Survival (%)
7-day Survival (%) Date Treatment
mean se mean se mean se mean se mean se mean se
3/19/2009 Control - - 21 5.5 100 0.0 85 15.0 100 0.0 95 5.0 Ambient - - 46 8.4 85 9.6 75 15.0 95 5.0 95 5.0 4/2/2009 Control 75 4.8 62 8.8 85 9.6 30 5.8 95 5.0 80 8.2 Ambient 84 10.3 77 7.0 90 5.8 85 5.0 85 9.6 80 8.2 4/16/2009 Control 59 5.0 29 5.1 95 5.0 95 5.0 95 5.0 90 5.8 Ambient 74 10.5 64 13.8 90 5.8 85 9.6 95 5.0 85 9.6 4/30/2009 Control 47 10.9 43 13.3 95 5.0 95 5.0 100 0.0 100 0.0 Ambient 43 6.5 40 6.9 100 0.0 95 5.0 100 0.0 100 0.0 5/14/2009 Control 56 18.8 44 15.7 95 5.0 95 5.0 100 0.0 100 0.0 Ambient 69 12.0 50 10.2 100 0.0 100 0.0 100 0.0 100 0.0 5/28/2009 Control 13 8.0 4 4.2 85 5.0 85 5.0 95 5.0 95 5.0
Ambient 34 7.9 27 8.4 95 5.0 85 15.0 100 0.0 90 5.8
POD 2008-2010: Final Report
III.4.3 Discussion
One of the greatest advantages to the in situ exposure is that the organisms experience the fluctuations of toxicant concentrations for the same length of time that stationary organisms in the river would experience them. In contrast, organisms that are exposed in a laboratory setting to a one-time grab sample experience the same water sample for a defined test period. A one-time grab sample can be collected when the concentrations of a chemical are at its peak, fall well below the peak concentration or miss a chemical pulse entirely. Laboratory static renewal tests utilizing one-time sub surface grab samples can therefore overestimate or underestimate toxicity depending on when a sample is collected relative to a toxic pulse moving through the system. The in situ devices renew water continuously with approximately 95% of the water renewed every half hour. The constant flow to the system is representative of the river conditions throughout the exposure period.
No toxicity was detected in the Sacramento River at Hood or the San Joaquin River at Rough and Ready Island suggesting that any toxicant(s) that may have traveled through the system were not at high enough concentrations for enough time to cause reduced survival to the test species. H. transpacificus survival was generally higher in ambient water than in the control, which decreased our ability to detect a toxic event with the species. A number of variables, including natural food supply, temperature, and turbidity may have contributed to higher delta smelt survival in ambient water compared to the controls. H. azteca survival was consistently high in ambient water and control water while P. promelas survival was variable in both, possibly due to the promotion of bacterial growth following the addition of Nannochloropsis.
Despite our efforts to slowly acclimate the H. transpacificus to the conductivity and temperature conditions of river water at in situ sites, survival of delta smelt remained low. Our recommendations are to use a test species that is more tolerant of transport, salinity and temperature stresses. P. promelas and O. mykiss appear to be far more tolerant of such stressors. O. mykiss might be a suitable species to use during the cold months and a warmwater species might be more suitable during the warmer months.
48

POD 2008-2010: Final Report
III.5 Toxicity Monitoring with Copepods
III.5.1 Methods
III.5.1.1 Collection and Culturing
E. affinis and P. forbesi were cultured at the UCD-ATL after being collected from the field or obtained from the Romberg Tiburon Center, Tiburon, CA. When copepods were collected in the field, 5-minute tows were performed using a 147 µm plankton net, either by boat, from a dock, or from the bank. Following each tow, the collection tube was emptied into a 1-gal plastic bucket filled with site water and then visually inspected to determine the density of zooplankton. This was done after each tow in order to avoid stress and mortality induced by overcrowding. The 1-gal buckets were then placed in a cooler and transported to UCD-ATL where they were immediately transferred to an environmental chamber adjusted to the ambient water temperature of the collection site. Dates, locations, and conditions of field collections are summarized in Table 15.
Table 15. Copepod collections in the Delta during October 2009 – February 2010.
Collection Date Location
Temp. (°C)
SC (µS/cm) Catch
10/16/2009 Antioch 17.3 1466 Many cyclopoids and non-target calanoids. P. forbesi and E. affinis present.
12/1/2009 Antioch 10.5 2309 Many cyclopoids and non-target calanoids. E. affinis present.
12/21/2009 Rio Vista 9.5 242 Cyclopoids abundant. E. affinis present. Very few P. forbesi.
1/6/2010 Rio Vista 9.0 251 Cyclopoids abundant. E. affinis and P. forbesi present.
1/15/2010 Antioch 9.4 1923 E. affinis and cyclopoids abundant in collection. Very few P. forbesi.
2/2/2010 West
Sacramento 10.5 995 P. forbesi abundant. Cyclopoids and non-target calanoids present. E. affinis present.
2/18/2010 West
Sacramento 14.0 957
Cyclopoids and non-target calanoids abundant. Many P. forbesi and some E. affinis.
Following collection and transport to the laboratory, P. forbesi and E. affinis were isolated and identified using a dissecting scope and depression slides. The desired copepods were gently pipetted into 250 ml glass beakers containing 1 µm filtered site water collected at the time of sampling. These beakers were returned to the environmental chamber and moved into larger culturing vessels at the end of the day.
E. affinis copepodites obtained from the Romberg Tiburon Center were placed in a 1-gal plastic jar containing culture water and transported to UCD ATL in a cooler. Upon receipt, the organisms were placed in an environmental chamber and acclimated to test conditions. Cultures were maintained in either 5-gal acrylic cones or 4-L glass beakers, depending on the number of organisms isolated. Density was maintained at 25-50 adult copepods/L and organisms were fed diluted Shellfish Diet daily. Culture vessels were cleaned and approximately 50% of the culture water was replaced weekly.
49

POD 2008-2010: Final Report
In preparation for toxicity testing, juvenile or adult copepods were selected by inspecting sub-samples of cultures under a dissecting scope and pipetting animals individually.
III.5.1.2 Disease and Treatment
In several batches of field collected copepods, E. affinis was found to be infested to varying degrees with a parasitic ciliate called Vorticella. These ciliates attach themselves by a slender stalk to the bodies of the copepods, and use them as a vehicle to obtain food including bacteria and small protozoans. Vorticella do not affect copepod health unless food supply is limited and parasites are competing with their hosts for food.
Infestations were controlled by removing infected copepods from the cultures to prevent the ciliates from spreading. In addition, experimental treatments were added to the E. affinis copper reference toxicant test initiated on January 31, 2010 to determine if the infestation could be treated with 1 ppb copper, and if heavily infested animals could survive for the duration of the 96-h test. The copper treatment had no effect, but the data showed that copepod survival was not compromised by heavy Vorticella infestation .
No diseases were noted or treated in P. forbesi.
III.5.1.3 Toxicity Testing
Copepods were acclimated to test conditions for 48 h prior to testing. Before initiating bioassays, the water samples were mixed rigorously in the original sampling containers, filtered through a 60-µm screen, brought to test temperature of 15 ºC and aerated at a rate of 100 bubbles/minute until the DO concentration was approximately 9.5 mg/L. Sierra SpringsTM water amended to US EPA moderately hard standards (SSEPAMH) and adjusted to an SC of 500µS/cm was used as the primary laboratory control water. Each series of tests included a standard laboratory control, and if necessary, a “low EC control”. “Low EC” control water was reconstituted to US EPA moderate hardness and the EC was adjusted to match the lowest EC of the water samples by diluting with glass distilled water. During Event 2, E. affinis were taken from cultures held at a salinity of 8 ppt. These animals were acclimated to 2 ppt, and both controls and ambient waters were amended to 2 ppt for testing.
The 96-hour tests consisted of ten 20 ml replicate glass scintillation vials, each containing 15 ml of sample and 1 organism. Tests were initiated with juvenile copepods whenever possible, and if juveniles were not available, adult copepods were used. Each replicate vial was fed 15 µl of diluted Shellfish Diet (Reed Mariculture, Campbell, CA) at test initiation and during the daily renewal of 75% of test waters. Tests were conducted at a temperature of 15 ± 2 ºC with a 16h:8h Light:Dark photoperiod. Mortality was recorded daily. Details of E. affinis and P. forbesi test conditions are given in Tables 16 and 17.
50

POD 2008-2010: Final Report
Table 16. Test conditions and protocols for 96-h E. affinis test.
Test method: Eurytemora affinis 96-h Water Column Initial Screening Test Method number: Modified from method number 1002.0 (UCD ATL SOP 1-7, non-certification) Method source: Adapted from the Chronic Ceriodaphnia dubia testing protocol outlined in Methods for Estimating the Chronic Toxicity of Effluents and Receiving Waters to Freshwater Organisms, 4th ed., 2002, EPA/821/R-02/013. Endpoints: 96-hour Survival Test chamber type and volume: 20 mL glass scintillation vial Volume of sample per chamber: 15 mL Organisms per chamber: 1 Replicates per treatment: 10 Acclimation of test organisms: 48 hours prior to start of the test Renewal: 75% daily renewal Feeding frequency, amount and type: 15 µl of Dilute Shellfish Diet per replicate daily pH control measures: None; pH between 6-9 Aeration: None; treatment waters aerated if supersaturated prior to renewal
Table 17. Test conditions and protocols for 96-h P. forbesi test.
Test method: Pseudodiaptomus forbesi 96-h Water Column Initial Screening Test Method number: Modified from method number 1002.0 (UCD ATL SOP 1-8, non-certification) Method source: Adapted from the Chronic Ceriodaphnia dubia testing protocol outlined in Methods for Estimating the Chronic Toxicity of Effluents and Receiving Waters to Freshwater Organisms, 4th ed., 2002, EPA/821/R-02/013. Endpoints: 96-hour Survival Test chamber type and volume: 20 mL glass scintillation vial Volume of sample per chamber: 15 mL Organisms per chamber: 1 Replicates per treatment: 10 Acclimation of test organisms: 48 hours prior to start of the test. Renewal: 75% daily renewal Feeding frequency, amount and type: 15 µl of Dilute Shellfish Diet per replicate daily pH control measures: None; pH between 6-9 Aeration: None; treatment waters aerated if supersaturated prior to renewal
51

POD 2008-2010: Final Report
52
III.5.1.5 Statistical Analysis
Data was analyzed using USEPA standard single-concentration statistical protocols (USEPA 2002). The USEPA method of data analysis showed the results of the tests according to the standardized statistical method used in aquatic toxicology monitoring and regulation throughout the United States. Each comparison of a sample to a control was treated as a separate statistical test, in accordance with USEPA (2002).
III.5.2 Results
In the control series, survival was best in the highest conductivity treatment of 1900 µS/cm (90% survival after 7 d) and decreased with decreasing conductivity. Survival was generally low in ambient samples with the exception of Cache-Ulatis (100% survival after 7 d). This sample had the highest turbidity (45.9 NTU) and specific conductance (329 µS/cm) of all four sites which may have contributed to better animal performance, despite the low survival encountered in the corresponding conductivity control (Table 18). Detailed data tables are provided in Appendix E. Survival in all ambient samples was higher than survival in the corresponding control water, however it is apparent that conductivity was the most important factor determining copepod survival in all samples tested.
Table 18. Results of a E. affinis 7-d test initiated 5/1/09 evaluating the toxicity of ambient samples collected on 4/28/09 and 4/30/09.
Survival (%)1 Treatment
Measured Specific Conductivity (uS/cm) Mean SE
L16 Media @ 1 ppt 1930 90 10.0 L16 Media @ 1000 µS/cm 1003 50 16.7 L16 Media @ 500 µS/cm 517 30 15.3 L16 Media @ 250 µS/cm 282 20 13.3 L16 Media @ 100 µS/cm 129 0 0.0 Sacramento R. Deep Water Channel, Light 55 271 50 22.4 Sacramento River at tip of Grand Island (711) 136 20 13.3 Upper Cache Slough at mouth of Ulatis Creek 329 100 0.0 Sacramento River at Hood DWR Station 142 20 13.3
1. Highlighted cells indicate statistically significant reductions in survival compared to the L16 media @ 1 ppt. Ambient samples showed no significant decreases in survival compared to the most appropriate conductivity control waters. Data were analyzed using USEPA standard statistical protocols.

POD 2008-2010: Final Report
III.6. Quality Assurance / Quality Control Quality Assurance/Quality Control (QA/QC) measures are included in this project to assess the reliability of the data collected. These QA/QC procedures include positive control tests (i.e., reference toxicant tests), field duplicates, bottle blanks and trip blanks. Duplicate, bottle and trip blank samples were selected from H. azteca-specific sampling sites because QA/QC comparisons were not included in the developmental H. transpacificus bioassays. The components of these QA/QC measures are outlined below. Reference toxicant tests: Positive control tests (reference toxicant tests) are conducted to ascertain whether organism responses fall within the acceptable range as dictated by US EPA. The LC50/EC25 for each reference toxicant endpoint was plotted to determine whether it fell within the 95% confidence interval of the running mean. If the LC50/EC25 falls out of the 95% confidence interval, or plus or minus two standard deviations around a running mean, test organism sensitivity is considered atypical and results of toxicity tests conducted during the month of reference toxicant outliers may be considered suspect. Reference toxicant tests with H. azteca, C. dubia, P. promelas and O. mykiss were performed using sodium chloride as the toxicant. Reference toxicant tests with H. transpacificus and E. affinis were conducted with copper (II) chloride as the toxicant.
H. azteca: Reference toxicant tests were conducted monthly. From January 1, 2008 to December 31, 2009, H. azteca performed normally within each reference toxicant test.
C. dubia: Chronic reference toxicant tests were performed monthly. An acute reference toxicant test was performed in March, 2010, to coincide with acute LC50 toxicity testing. Chronic and acute C. dubia performance was within acceptable limits during the project period.
P. promelas: Reference toxicant tests were performed monthly to coincide with LC50 toxicity testing. P. promelas performance was within acceptable limits during the project period.
O. mykiss: One reference toxicant test was performed concurrently with a toxicity test initiated on November 11, 2008, which examined toxicity observed in the field at Rough and Ready Island, DWR Station, Stockton. Organisms in the reference toxicant test performed normally.
H. transpacificus: Four successful reference toxicant tests were conducted during the study period; organism performance was within acceptable limits.
E. affinis: Reference toxicant tests were conducted monthly between January and March, 2010. Two reference toxicant tests did not meet the test acceptability criterion for survival in March, due to poor organism health. However, although survival in the controls in these tests was less than the required 75%, effect concentration data was obtained. Field duplicates: Field duplicate samples were collected to assess precision. Field duplicate samples are in agreement when the primary sample and its duplicate are
53

POD 2008-2010: Final Report
both either statistically similar or statistically different from the control. Forty-eight field duplicates were collected during 2008-2010 of the study. Of those forty-eight samples, 100% shared equivalent survival results and 98% shared equivalent weight results. The frequency of field duplicates sharing equivalent results is outlined in Table 19. Bottle blanks: Bottle blank samples were included to evaluate potential incidental contamination due to the sample container. Bottle blanks are analyte-free water samples that are transferred to a clean sample container that is prepared in the laboratory. Bottle blanks were comprised of DIEPAMHR. A bottle blank sample is in agreement when it is statistically similar to the control. Thirty bottle blanks were analyzed during 2008-2010 of the study. Of those thirty samples, 100% shared equivalent survival results and 92% shared equivalent weight results. The frequency of bottle blank samples sharing equivalent results is outlined in Table 19. Trip blanks: Trip blank samples were included in this project to evaluate potential incidental contamination that can occur during field sampling and sample processing. A trip blank is an analyte-free water sample that is transferred into a clean sample container that is prepared in the laboratory, brought out into the field, and treated like any other collected sample throughout the course of the trip. Trip blank samples were comprised of DIEPAMHR. A trip blank sample is in agreement when it is statistically similar to the control. Twenty-four trip blank samples were analyzed during 2008-2010 of the study. Of those twenty-four samples, 100% shared equivalent survival and weight results. The frequency of trip blank samples sharing equivalent results is outlined in Table 19. Table 19. Frequency of QA/QC samples sharing equivalent results
% Agreement QA/QC Samples Sample Size
Survival Weight Field Duplicates 48 100 98 Bottle Blanks 30 100 92 Trip Blanks 24 100 100
Precision: Precision is the degree to which the primary sample agrees with its duplicate. Precision can be measured by calculating the Relative Percent Difference (RPD) between sample measurements. The RPD between a sample and its duplicate can be calculated by using the following equation:
100*
21
21*2
DupDup
DupDupRPD
RPDs were calculated using the aforementioned equation on water chemistry measurements such as DO, pH, EC, hardness and alkalinity and ammonia. Both the individual and average RPDs between duplicates are outlined in detail in Appendix K. Caution should be applied when interpreting water quality precision data. Often times an
54

POD 2008-2010: Final Report
unusually high RPD is due very minute amounts of a particular analyte being measured rather than a lack of precision.
Deviations: Six deviations occurred during the 2008-2010 project study period. Deviations consisted of warm sample temperatures at receipt, exceeded holding times, and a protocol deviation. Frequency of deviations is outlined in Table 20.
Sample temperatures: USEPA requires sample temperatures to be maintained between 0-6 ºC during transport, receipt and storage. Elevated sample receiving temperatures occurred during the summer months of the study period and were due to ice melting in the transport coolers. Samples in which temperatures exceeded the EPA criterion were within half a degree of the target temperature of 6 ºC and were placed in the dark in cold storage immediately after receipt. These samples performed normally in toxicity tests and the data associated with these samples are considered reliable.
Holding times: Two H. azteca tests conducted during the study period were initiated past the 72-hour holding time. These tests were a retest of the original samples which were initiated in a toxicity test which did meet proper holding time requirements. One toxicity test initiated on August 28, 2008 did not meet test acceptability criteria and had to be repeated. The second toxicity test, initiated on May 14, 2009, exhibited contamination related to the PBO-manipulated samples and had to be repeated. The retests met all test acceptability criteria and the data are considered reliable.
Protocol deviation: An H. azteca toxicity test initiated on August 29, 2008 was initiated with a reduced number of animals per replicate. This deviation occurred because there was a shortage of healthy animals available for test initiation. In order to meet holding time requirements, the test was initiated using only the healthiest animals in the culture, which resulted in having a reduced number of organisms in each replicate. This test met all test acceptability criteria and the data are considered reliable. Table 20. Frequency of deviations
Deviation Type Date of Deviation Explanation
Exceeded sample temperature
CL 5/8/2008 602, 609 4/1/2009 887 (Site 915 FD) 8/6/2009
Ice melting in transport coolers
Exceeded holding time
H. azteca retest initiated 9/10/2008 H. azteca retest initiated 5/16/2009
Test did not meet test acceptability criteria PBO contamination
Protocol deviation H. azteca test initiated 8/29/2008 Shortage of healthy animals available; test initiated with reduced number of animals per replicate
Completeness: UCD ATL strives for a 90% completeness of work performed. The following is a summary of work completed for the duration of the study period of
55

POD 2008-2010: Final Report
56
2008-2010. Table 21 denotes the number of successful tests completed out of number of tests conducted. Please note there are no test acceptability criteria for in-situ testing. Table 21. Completeness during the project period 2008-2010.
Species Test Number of Tests % Completeness Ambient 99 / 101 (2 tests repeated) 100
LC50 7 / 7 100 H. azteca
In-situ 6 / 6 100 C. dubia LC50 6 / 6 100
LC50 7 / 7 100 P. promelas In-situ 6 / 6 100
Ambient 7 / 10 70 LC50 7 / 7 100
H. transpacificus
In-situ 6 / 6 100

POD 2008-2010: Final Report
III.7 References
California State Water Resources Control Board. 2002. Toxicity Testing SOPs: Hyalella azteca 10-Day Water Toxicity Test. Quality Assurance Management Plan for the State of California's Surface Water Ambient Monitoring Program. Division of Water Quality. Sacramento, CA.
US EPA. 2002. Short-Term Methods for Estimating the Chronic Toxicity of Effluents and Receiving Waters to Freshwater Organisms. 4th Ed. EPA/821/R-02/013. US Environmental Protection Agency, Office of Research and Development, Duluth, MN.
Amweg EL, Weston DP. 2007. Whole-sediment toxicity identification evaluation tools for pyrethroid insecticides: I. Piperonyl butoxide addition. Environ Toxicol Chem 26(11):2389-2396.
Bailey HC, DiGiorgio C, Kroll K, Miller JL, Hinton DE, Starrett G. 1996. Development of procedures for identifying pesticide toxicity in ambient waters: Carbofuran, diazinon, chlorpyrifos. Environ Toxicol Chem 15(6): 837-845.
US EPA. 1991. Methods for Aquatic Toxicity Identification Evaluations: Phase I
Toxicity Characterization Procedures. 2nd ed. EPA/600/6-91/003. ERL, US Environmental Protection Agency, Office of Research and Development, Duluth, MN.
57

POD 2008-2010: Final Report
58
IV. Comparative Sensitivity of Resident Species to Chemical Stressors
The lack of information on the toxic effects of contaminants on resident Delta species, among them delta smelt and important prey species, prevents an estimation of the risk of chemical contamination to pelagic organisms of concern. This study generated comparative sensitivity data (in the form of 96-h LC50, EC50, no observed effect level (NOEC), and lowest observed effect level (LOEC) for Delta species and standard toxicity test species. Testing included Pseudodiaptomus forbesi, Eurytemora affinis, Ceriodaphnia dubia, Hyalella azteca, delta smelt, and fathead minnow.
Chemicals were selected based on their relevance for the Delta: copper, ammonia, the organophosphate insecticides chlorpyrifos and diazinon, and the pyrethroid insecticides, cyfluthrin, bifenthrin, permethrin. Copper is used as a pesticide in various forms, is a common chemical in stormwater runoff, and is ubiquitous in the aquatic environment. Ammonia is released from wastewater treatment plants. Chlorpyrifos is one of the most heavily used agricultural insecticides, and has recently been shown to be present at toxic concentrations in Ulatis Creek (Werner and Kuivila, 2004, unpublished data) and agricultural drains (California Regional Water Quality Control Board Agricultural Waiver Program, 2007). Diazinon, bifenthrin, cyfluthrin, and permethrin were detected in 2007 in water column samples from various sites in the Delta (Werneret al., 2008).
Samples from each pesticide concentration as well as a control were submitted to CDFG-WPCL to verify nominal chemical concentrations. In tests evaluating toxicity in both control and hatchery waters, only samples of hatchery water were submitted for chemical analysis. Total ammonia measurements for the ammonia chloride tests were measured at the UCD ATL. Sensitivity testing methods for each species are described below.
IV.1 Methods
Rangefinder tests were conducted to assist the selection of exposure concentrations for the “definitive” LC50/EC50 tests. Rangefinder test methods followed protocols described by US EPA (2002 a, b), but were limited to two replicates per treatment and a duration of 48 h. Water quality parameters (electrical conductivity (EC, dissolved oxygen concentration (DO), pH, ammonia concentration, hardness and alkalinity) were measured at test initiation; pH, temperature and DO were measured daily before and after water renewal.
IV.1.1 H. transpacificus 96-h Survival
For definitive LC50 tests, H. transpacificus, ranging from 39 to 51 days post hatch (DPH), were obtained from the UC Davis FCCL in Byron, CA. The organisms were acclimated a minimum of 24 hours with hatchery water adjusted to a specific conductance (SC) of 900 µS/cm using Instant Ocean and a pH of 7.9 using HCl. H. transpacificus were fed Artemia nauplii three times daily during acclimation and during the exposures. After the acclimation period, ten organisms were randomly transferred into each of four replicate buckets using a 50 ml beaker.
POD 2008-2010: Final Report
59
Tests were performed in hatchery water (Appendix A, Table A-7) filtered through a 1 micron filter at 900 µS/cm and pH 7.9. Chemicals were dissolved in methanol (insecticides only) or water, and spiked into treatment solutions the morning the test was initiated and again on the renewal day. Tests were conducted in a water bath maintained at 16°C surrounded by dark shower curtains to minimize light-induced stress. One gallon black buckets with lids were used as replicate vessels, each containing 3.5 liters of sample. During testing, lids were allowed to rest on top of the buckets, but were not snapped shut to allow less than one ft-candle of ambient light in. Where methanol was used as a solvent, solvent control treatments containing 0.05% methanol (equal to the highest concentration added to insecticide treatments) were added. These methanol treatments were aerated after recognition of dissolved oxygen problems associated with the addition of the methanol, likely due to bacterial growth and associated respiration.
Mortality was recorded daily using a small flashlight. On day 2, 80% of test solutions were renewed during which dead fish, excess Artemia and other detritus were removed. At the end of the 96-h exposure, surviving organisms were euthanized with MS-222 and preserved with liquid nitrogen for subsequent molecular studies.
Water quality parameters (specific conductance (SC), temperature, dissolved oxygen concentration (DO), pH, total ammonium concentration, hardness and alkalinity) were measured at test initiation; in addition, pH, ammonium, temperature and DO were measured on day 2 before and after water renewal, and at test termination. Samples of each exposure concentration and a control were preserved and submitted to the CDFG analytical laboratory, Rancho Cordova, to verify nominal chemical concentrations. Additional analytical samples were taken following the first 48 hour exposure period to account for pesticide adsorption to container walls and food.
IV.1.2 P. promelas 7-d Survival and Growth
Larval fathead minnows were obtained from Aquatox, Inc. (Hot Springs, AR). Organisms used in sensitivity tests were <48 hours old and were acclimated to laboratory conditions 24 hours prior to test initiation.7-d LC50 test methods followed those outlined in the Fathead Minnow Larval Survival and Growth Test (USEPA, 2002). These tests were performed in deionized water amended to US EPA moderately hard standards (DIEPAMH) as well as hatchery water filtered through a 1 micron filter. Water was adjusted to an SC of 900 µS/cm using Instant Ocean and a pH of 7.9 using HCl.
Stock solutions were prepared by dissolving pesticides in methanol and ammonia and copper in glass distilled water. Chemicals were spiked into test solutions on Days 0, 2, 4, and 6. Where methanol was used as a solvent, solvent control treatments containing 0.05% methanol (equal to the highest concentration added to insecticide treatments) were added. These methanol treatments were aerated after recognition of dissolved oxygen problems associated with the addition of methanol, likely due to bacterial growth and associated respiration.
Mortality was recorded daily, and at test termination, a portion of organisms were preserved using liquid nitrogen for subsequent molecular studies while the rest were dried to a constant weight for the biomass endpoint. If ten surviving fish were present in a replicate at test termination, five were preserved with liquid nitrogen and five were dried;

POD 2008-2010: Final Report
60
if nine surviving fish were present in a replicate, 4 were preserved with liquid nitrogen and five were dried; if eight surviving fish were present in a replicate, four were preserved with liquid nitrogen and four were dried. If there were seven or less surviving fish in a replicate, all were dried to calculate biomass and average weight per individual.
Water quality parameters (specific conductance (SC), temperature, dissolved oxygen concentration (DO), pH, total ammonium concentration, hardness and alkalinity) were measured at test initiation; in addition, pH, ammonium, temperature and DO were measured on days 2, 4 and 6, before and after water renewal, and at test termination. Samples of each exposure concentration and a control were preserved and submitted to the CDFG analytical laboratory, Rancho Cordova, to verify nominal chemical concentrations.
IV.1.3 H. azteca 10-day Survival and Growth
H. azteca purchased from Aquatic Research Organisms were received at the UCD ATL 48 hours prior to test initiation and acclimated to laboratory conditions. The 10-day sensitivity tests were conducted in both DIEPAMHR (Appendix A, Table A-7) and “hatchery water” collected from the UCD FCCL. Waters were adjusted to a SC of 900 µS/cm using Instant Ocean and a pH of 7.9 using HCl. Prior to initiating bioassays, the water samples were brought to the test temperature of 23º C and aerated at a rate of 100 bubbles/min until the dissolved oxygen concentration was approximately 8.5 mg/L.
Sensitivity tests consisted of four 250 ml replicate glass beakers, each containing 100 ml of sample, a one-square-inch piece of nitex screen and 10 organisms. Tests were initiated with 7-14 day-old H. azteca. Animals in each replicate were fed 1000 µl of YCT on test initiation and on days 2, 4, 6 and 8, following the renewal of 75% of the test waters. Each series of sensitivity tests included a standard laboratory control, hatchery water control and any applicable method blanks.
Tests were conducted at a temperature of 23 ± 2º C with a 16h:8h, light:dark photoperiod. Mortality was recorded daily and waters were renewed on days 2, 4, 6 and 8. On day 10, the surviving H. azteca were dried and weighed to determine dry tissue weight per individual and relative growth. Effect data such as NOEC, LOEC, LC10, LC50 and EC25 were calculated on both the 96-h and 10-d endpoints.
IV.1.4 C. dubia Tests
96-h Survival: Toxicity testing for acute C. dubia 96-h LC50 tests followed the static-renewal procedures outlined in "Methods for Measuring the Acute Toxicity of Effluents and Receiving Waters to Freshwater and Marine Organisms" (USEPA, 2002). The 96-h acute C. dubia test consists of four replicate 20 ml glass scintillation vials containing 18 ml of sample and five organisms. Tests are initiated with less than 24-h neonates, born within a 20-h window. Organisms are fed a mixture of YCT (a mixture of yeast, organic alfalfa and trout chow) and S. capricornutum two hours prior to daily water renewal in order to minimize adsorption of chemicals to food particles. C. dubia are transferred into a new vial of fresh solution daily. Sierra Springs (TM) drinking water amended to US EPA moderately hard standards (SDEPAMH; Appendix A, Table A-7))

POD 2008-2010: Final Report
61
is used as the control water for the C. dubia test. Treatment solutions were made daily and added in increasing concentrations to SDEPAMH, pH-adjusted to 7.9, and salinity-adjusted to 900 µS/cm with Instant Ocean. Tests were conducted at 25 ± 2ºC with a 16-h light: 8-h dark photoperiod. Mortality was measured daily and at test termination.
Seven-Day Survival and Reproduction: The C. dubia chronic test consists of ten replicate 20 ml glass vials each containing 15 ml of test solution and one organism. C. dubia are cultured at UCD ATL. Tests were initiated with less than 24-h old C. dubia, born within an 8-h period. C. dubia were fed a mixture of S. capricornutum and YCT (a mixture of yeast, organic alfalfa and trout chow) and transferred into a new vial containing fresh test solution daily. Sierra SpringsTM water amended to EPA moderately hard specifications (SSEPAMH) was used as method control, in addition to the synthetic water. Tests were conducted at 25 ± 2 ºC with a 16-h light: 8-h dark photoperiod. Mortality and reproduction (number of neonates) were recorded daily and at test termination (after the third brood; day 6-8).
IV.1.5 E. affinis Tests
Please refer to Chapters III.5 and IV.3 (Teh et al., 2009) for a detailed description of E. affinis testing methods.
In addition to tests conducted in the laboratory of Dr. S. Teh, UC Davis, the UCD ATL conducted a series of tests to confirm earlier results obtained by Dr. Teh. Copper was used as a reference toxicant for a CV Regional Water Quality Control Board study measuring the toxicity of Delta island agricultural drains. The results of these tests are provided below. Rangefinder tests were conducted for a number of insecticides, but for lack of time, the respective LC50 tests were not completed. Nevertheless, results of rangefinder studies are also provided for comparison.
LC50 tests: The E. affinis 96-h LC50 tests consisted of ten 20 ml replicate glass scintillation vials, each containing 15 ml of test solution and 1 organism. Rangefinder tests used four replicate glass vials containing 15 ml of test solution and 1 organism. Tests were initiated with juvenile copepods whenever possible, and if juveniles were not available, adult copepods were used. Each replicate vial was fed 15 µl of diluted Shellfish Diet (Reed Mariculture, Campbell, CA) at test initiation and during the daily renewal of 75% of test waters. Tests were conducted at a temperature of 20 ± 2 ºC, a conductivity of 900 µS/cm, and pH 7.9 with a 16h:8h Light:Dark photoperiod. Mortality was recorded daily. Details of E. affinis and P. forbesi test conditions are provided in Chapter III.5.
Reference toxicant tests with copper: The sensitivity of E. affinis to copper was examined in reference toxicant tests performed multiple times. These tests were conducted using a synthetic laboratory control water (Appendix A, Table A-7) adjusted to a salinity of 2 ppt. Temperature was maintained at 20°C in an environmental chamber.
IV.1.6 Statistical Analysis
Lethal and sublethal effective concentrations were calculated using CETIS v. 1.1.2 (Tidepool Scientific Software, McKinleyville, CA, USA, 2006) following USEPA standard statistical protocols (USEPA 2002). LC50s and EC50s were calculated using

POD 2008-2010: Final Report
62
linear regression, non-linear regression, or linear interpolation methods. For each endpoint, toxicity is defined as a statistically significant difference (p < 0.05) to the laboratory control. Percentage minimum significant differences (PMSD) of Dunnett’s multiple comparison procedure were calculated for all multiple concentration statistical tests. IV.1.7 Analytical Chemistry
Water samples for analytical chemistry were collected upon preparation of test solutions using two acid-cleaned, 1-L amber-glass bottles. Samples for analysis of organic chemicals were immediately preserved by addition of 10 ml/l dichloromethylene. Samples were transported on ice and submitted to the California Department of Fish and Game Water Pollution Laboratory, Rancho Cordova, CA. Samples submitted for total and/or dissolved metals analysis were analyzed at the California Department of Fish and Game – Moss Landing Marine Laboratory, Moss Landing, CA.
For delta smelt tests, samples of all test solutions were submitted for chemical analysis. For fathead minnow tests, all test solutions prepared in “hatchery water” (HW) were submitted for whole water (dissolved and particulate) analysis, and the amounts of chemical detected in HW were used to calculate effect concentrations in both hatchery and synthetic laboratory control water. HW was found to contain 2.07 µg/L copper thus this amount was subtracted from measured copper concentrations of test concentrations for calculation of copper effect concentrations in synthetic laboratory control water.
For H. azteca tests with insecticides, all test solutions prepared in HW, as well as the highest, lowest and mid-range test concentrations prepared in synthetic laboratory control water were submitted for analysis. For the copper LC50 test, all test solutions prepared in synthetic laboratory control water, as well as the highest, lowest and mid-range test solutions prepared in HW were submitted for analysis. Were not all solutions were submitted, analytical data used to calculate effect concentrations were supplemented by data obtained for the corresponding test concentration in a different matrix.
For C. dubia chronic tests with insecticides, all test solutions in one matrix were submitted for analysis, and resulting data used to calculate effect concentrations in the second matrix. Samples from the C. dubia permethrin test were erroneously not submitted for analysis.
Organophosphate and pyrethroid insecticides were measured by gas chromatography (Agilent 6890 plus, Agilent Technologies Inc., Santa Clara, CA, USA) with dual columns (DB5 and DB17) and dual flame photometric detectors in phosphorous mode (OP insecticides), or dual micro-electron capture detectors (pyrethroid insecticides). Pyrethroids were confirmed using GC-MS or GC-MSMS.
IV.2 Results
IV.2.1 H. transpacificus
Toxic effect concentrations (96 h) for larval delta smelt were determined for ammonia/ium, un-ionized ammonia, copper (total and dissolved), the organophosphate

POD 2008-2010: Final Report
63
insecticide chlorpyrifos, and the pyrethroid insecticides esfenvalerate, bifenthrin, cyfluthrin and permethrin. These test were performed with treated Delta water obtained from the UCD FCCL adjusted to 900 µS/cm and pH 7.9. Results are presented both as measured and nominal concentrations (Tables 22 a, b). Among pesticides, delta smelt were most sensitive to esfenvalerate and bifenthrin, followed in order of decreasing sensitivity by cyfluthrin, permethrin and chlorpyrifos.
IV.2.2 P. promelas
Acute (96 h, 7 d) and chronic (7-d growth) effect concentrations for larval fathead minnow were determined for ammonia/ium, un-ionized ammonia, copper (total and dissolved), the organophosphate insecticide chlorpyrifos, and the pyrethroid insecticides esfenvalerate, bifenthrin, cyfluthrin and permethrin. Results are presented both as measured and nominal concentrations (Tables 23 a, b). These tests compared performance in hatchery water obtained from the UCD FCCL to performance in laboratory control water. Both types of water were adjusted to 900 µS/cm and pH 7.9.
As for delta smelt, the most toxic chemical was esfenvalerate, followed by cyfluthrin and bifenthrin. Permethrin was the least toxic pyrethroid. Copper was more toxic to larval fathead minnows than chlorpyrifos.
Water type did not affect acute toxicity of ammonia/um, chlorpyrifos, esfenvalerate or cyfluthrin. However, toxicity of bifenthrin was greater in “hatchery water (HW)” than in laboratory control water. Toxicity of permethrin was somewhat lower in hatchery water than in laboratory control water. Toxicity of copper was significantly lower in hatchery water than in control water, suggesting that dissolved organic carbon in Delta water rendered the metal less bioavailable. We were able to determine chronic effect concentrations for copper (7-d growth: 53 ug/L dissolved Cu+ in laboratory control water, and 101.9 µg/L dissolved Cu+ in hatchery water), chlorpyrifos and esfenvalerate.

POD 2008-2010: Final Report
64
Table 22 a. Measured acute effect concentrations of selected chemicals for larval delta smelt. Tests were performed using treated water from the delta smelt hatchery adjusted to EC 900 μS/cm.
Chemical Test Date Fish Age 96-h LC10 96-h LC50 [dph] NOEC LOEC Estimate 95% C.I. Estimate 95% C.I. Ammonia Nitrogen (mg/L) 7/8/2009 47 14.4 29.0 5.38 < 1.9 - 9.38 11.8 8.1 - 18.5 Unionized Ammonia (mg/L) 7/8/2009 47 0.191 0.333 0.084 < 0.002 - 0.127 0.164 0.12 - 0.24 Copper (total) (ug/L) 5/14/2008 49 40.4 78.2 49.7 39.9 - 82.3 97.3 76.7 - 113.3 Copper (dissolved) (µg/L) 5/14/2008 49 41.4 76.2 50.1 40.9 - 80.1 92.1 74.7 - 110.8 Chlorpyrifos (µg/L) 5/5/2010 44 14.8 25.2 12.8 7.7 - 17.9 27.7 19.0 - 51.2 Esfenvalerate (µg/L) 4/7/2010 43 0.051 0.135 0.054 0 - 0.058 0.117 0.088 - 0.159 Bifenthrin (µg/L) 5/14/2008 49 0.120 0.260 0.095 0.061 - 0.117 0.143 0.12 - 0.17 Cyfluthrin (µg/L) 5/14/2008 49 0.407 0.890 0.26 0.067 - 0.357 0.42 0.26 - 0.56 Permethrin (µg/L) 4/7/2010 43 2.557 4.84 2.373 1.783 - 2.825 4.065 3.427 - 5.497
Table 22 b. Nominal acute effect concentrations of selected chemicals for larval delta smelt. Tests were performed using treated water from the delta smelt hatchery adjusted to EC 900 μS/cm.
Chemical Test Date Fish Age 96-h LC10 96-h LC50 [dph] NOEC LOEC Estimate 95% C.I. Estimate 95% C.I. Ammonia Nitrogen (mg/L) 7/8/2009 47 20 40 7.44 < 2.5 - 13.25 16.45 11.35 - 25.57 Copper (total) (ug/L) 5/14/2008 49 37.5 75 45 19 - 55 85 76 - 95 Chlorpyrifos (µg/L) 5/5/2010 44 25 50 13.8 < 6.25 - 38.8 54.7 34.5 - 86.4 Esfenvalerate (µg/L) 4/7/2010 43 0.150 0.300 0.165 0.144 - 0.180 0.280 0.228 - 0.366 Bifenthrin (µg/L) 5/14/2008 49 0.250 0.500 0.215 0.140 - 0.262 0.305 0.246 - 0.359 Cyfluthrin (µg/L) 5/14/2008 49 0.500 1.000 0.160 0.129 - 0.466 0.454 0.393 - 0.523 Permethrin (µg/L) 4/7/2010 43 5 10 4.695 3.127 - 5.417 8.295 6.658 - 11.220

POD 2008-2010: Final Report
65
Table 23 a. Measured acute and chronic effect concentrations of selected chemicals for larval (<48 h old) fathead minnow. Tests were performed using both laboratory control water (DIEPAMH) and water from the delta smelt hatchery (HW) adjusted to EC 900 μS/cm. The 96-h ECs are calculated from survival recorded on day 4. Chemical Matrix Test Date 96-h Survival 96-h LC10 96-h LC50 7-d Survival 7-d LC10 7-d LC50
NOEC LOEC Estimate 95% C.I. Estimate 95% C.I. NOEC LOEC Estimate 95% C.I. Estimate 95% C.I.
Total Ammonia/um DIEPAMHR 9/17/2008 15 30.8 17.1 16 - 21 28.9 22-45 15 30.8 17.1 16-21 28.9 22-45 (mg/L) HW 15.2 29.8 16.0 15 - 16 20.9 20-21 15.2 29.8 16.0 15-16 20.9 20-21
Un-ionized Ammonia DIEPAMHR 9/17/2008 0.518 1.004 0.60 0.56-0.73 0.95 0.75 - 1.54 0.518 1.004 0.60 0.56 - 0.73 0.95 0.75 - 1.54 (mg/L) HW 0.629 1.121 0.66 0.63-0.68 0.85 0.83 - 0.86 0.629 1.121 0.66 0.63 - 0.68 0.85 0.83 - 0.86
Copper DIEPAMHR 8/7/2008 32.2 67.1 49 45-63 103 92-122 32.2 67.1 40 36-50 85 67-103 (total; µg/L) HW 132 260 132 81-150 216 188-248 69.2 132 90 79-117 162 146-180
Copper DIEPAMHR 8/7/2008 31.7 60.6 46 43 - 58 96 85 - 115 31.7 60.6 39 35 - 47 78 60 - 96 (dissolved; µg/L) HW 125 238 125 74-141 200 175-228 62.3 125 82 72-109 151 136-168
Chlorpyrifos (µg/L) DIEPAMHR 8/19/2008 144 311 170 128 - 204 > 311 NA 144 311 141 90 - 165 252 202 - 347
HW 144 311 159 137 - 180 > 311 NA 144 311 100 48 - 170 222 172 - 299
Esfenvalerate (µg/L) DIEPAMHR 8/19/2008 0.500 0.920 0.536 0.52 - 0.55 0.74 0.72 - 0.76 0.500 0.920 0.53 0.52 - 0.54 0.69 0.67 - 0.71
HW 0.500 0.920 0.516 0.49 - 0.54 0.67 0.65 - 0.68 0.500 0.920 0.52 0.49 - 0.53 0.67 0.65 - 0.68
Bifenthrin (µg/L) DIEPAMHR 9/24/2008 0.7 1.4 0.70 0.45-0.84 1.19 0.94 - 1.53 0.7 1.4 0.54 0.43 - 0.82 1.00 0.87 - 1.12
HW 0.4 0.7 0.42 0.39-0.53 0.92 0.43 - 1.50 0.4 0.7 0.42 0.39 - 0.48 0.76 0.50 - 1.03
Cyfluthrin (µg/L) DIEPAMHR 7/7/2009 0.645 1.11 0.67 0.64-0.69 0.85 0.83 - 0.88 0.645 1.11 0.56 0.25 - 0.74 0.82 0.78 - 0.85
HW 0.645 1.11 0.66 0.63-0.69 0.83 0.81 - 0.85 0.645 1.11 0.67 0.64 - 0.69 0.84 0.82 - 0.85
Permethrin (µg/L) DIEPAMHR 7/7/2009 0.49 1.20 0.72 0.58-1.06 1.55 1.22 - 1.74 0.49 1.20 0.64 0.51 - 0.81 1.43 0.85 - 1.70
HW 1.20 2.52 1.73 1.63 - 1.81 1.20 2.52 1.22 0.68 - 1.34 1.72 1.61 - 1.81

POD 2008-2010: Final Report
66
Table 23b. Measured chronic effect concentrations of selected chemicals for larval (<48 h old) fathead minnow. Tests were performed using both laboratory control water (DIEPAMH) and water from the delta smelt hatchery (HW) adjusted to EC 900 μS/cm.
Chemical Matrix Test Date 7-d Weight 7-d Weight EC10 7-d Weight EC25
NOEC LOEC Estimate 95% C.I. Estimate 95% C.I.
Total Ammonia/um DIEPAMHR 9/17/2008 30.8 > 30.8 > 30.8 NA > 30.8 NA (mg/L) HW 15.2 > 15.2 > 15.2 NA > 15.2 NA
Un-ionized Ammonia DIEPAMHR 9/17/2008 1.004 > 1.004 > 1.004 NA > 1.004 NA (mg/L) HW 0.629 > 0.629 > 0.629 NA > 0.629 NA
Copper DIEPAMHR 8/7/2008 67.1 129.9 41 12-45 58 41-75 (total; µg/L) HW 69.2 132 72.14 <17.6-100.7 109.2 78.1- 82
Copper DIEPAMHR 8/7/2008 60.6 123.3 39 12 - 42 53 40 - 67 (dissolved; µg/L) HW 62.3 125 62.2 <1.72-238 101.9 70.9-171.4
Chlorpyrifos (µg/L) DIEPAMHR 8/19/2008 43.2 82.4 7.8 0.5 - 67.4 66 35 - 106
HW 43.2 82.4 28 <21.4-70.2 144 91 - 267
Esfenvalerate (µg/L) DIEPAMHR 8/19/2008 0.920 > 0.920 > 0.920 - > 0.920 - HW 0.500 > 0.500 > 0.50 - > 0.50 -
Bifenthrin (µg/L) DIEPAMHR 9/24/2008 1.4 >1.4 > 1.4 - > 1.4 -
HW 1.4 >1.4 > 1.4 - > 1.4 -
Cyfluthrin (µg/L) DIEPAMHR 7/7/2009 0.645 > 0.645 > 0.645 - > 0.645 -
HW 0.645 > 0.645 > 0.645 - > 0.645 -
Permethrin (µg/L) DIEPAMHR 7/7/2009 1.20 > 1.20 > 1.20 - > 1.20 -
HW 1.20 > 1.20 > 1.20 - > 1.20 -

POD 2008-2010: Final Report
67
Table 23 c. Nominal acute and chronic effect concentrations of selected chemicals for larval fathead minnow. Tests were performed using both laboratory control water (DIEPAMH) and water from the delta smelt hatchery (HW) adjusted to EC 900 μS/cm. The 96-h ECs are calculated from survival recorded on day 4. Chemical Matrix Test Date 96-h LC10 96-h LC50 7-d LC10 7-d LC50 7-d Weight EC10 7-d Weight EC25
Estimate 95% C.I. Estimate 95% C.I.
Estimate 95% C.I.
Estimate 95% C.I.
Estimate 95% C.I.
Estimate 95% C.I.
Total Ammonia/um DIEPAMHR 9/17/2008 22.7 21 - 28 37.6 28 - 57 22.7 21 - 28 37.6 28 - 57 > 40 NA > 40 NA (mg/L) HW 21.1 20 - 22 27.8 27 - 29 21.1 20 - 22 27.8 27 - 29 > 20 NA > 20 NA
Copper DIEPAMHR 8/19/2008 47 43 - 66 99 87 - 113 38.9 35 - 48 80.1 70 - 91 39.7 16 - 44 56.6 48 - 76 (total; µg/L)
HW 125 74 - 142 207 180 - 239 83 72 - 109 154 138 - 172 62.36
< 15.6 - 93.4 102 71.1 - 174
Chlorpyrifos (µg/L) DIEPAMHR 8/19/2008 233 180 - 272 >400 NA 196 109 - 227 331.0
272 - 442 8.8 0.4 - 78.4 79.1
39.5 - 133.4
HW 219 189 - 244 >400 NA 128 53 -253 295.4 258 - 338 32.6
< 25 - 82.8 85.7 32 - 151
Esfenvalerate (µg/L) DIEPAMHR 9/24/2008 0.541
0.52 - 0.55 0.779
0.76 - 0.81 0.54
0.52 - 0.54 0.72
0.70 - 0.75 >1.0 - >1.0 -
HW 0.519 489 - 537 0.694 0.67 - 0.71 0.52
0.49 - 0.53 0.69
0.67 - 0.71 > 0.500 - > 0.500 -
Bifenthrin (µg/L) DIEPAMHR 7/7/2009 1.25
0.71 - 1.49 2.10
1.70 - 3.02 0.91
0.63 - 1.45 1.76
1.58 - 2.04 > 2.5 - > 2.5 -
HW 0.72 0.57 - 1.16 1.66
0.73 - 2.70 0.69
0.58 - 0.91 1.39
0.84 - 1.83 > 1.25 - > 1.25 -
Cyfluthrin (µg/L) DIEPAMHR 7/7/2009 1.06
1.00 - 1.09 1.41
1.37 - 1.48 0.92
0.59 - 1.14 1.35
1.27 - 1.43 > 1.0 - > 1.0 -
HW 1.04 0.98 - 1.09 1.39
1.35 - 1.43 1.05
0.99 - 1.09 1.40
1.36 - 1.42 > 1.0 - > 1.0 -
Permethrin (µg/L) DIEPAMHR 9/17/2008 5.2 4.5 - 7.3 10.0 8.2 - 11.2 4.8 4.1 - 5.8 9.3
6.0 - 10.9 > 8.0 - > 8.0 -
HW 8.2 4.2 - 8.8 11.1 10.3 - 11.5 8.0 4.3 - 8.7 10.9
10.3 - 11.5 > 8.0 - > 8.0 -

POD 2008-2010: Final Report
68
IV.2.3 H. azteca
Acute (96 h, 10 d) and chronic (10-d growth) effect concentrations for the amphipod H. azteca were determined for ammonia/ium, un-ionized ammonia, copper (total and dissolved), the organophosphate insecticides chlorpyrifos and diazinon, and the pyrethroid insecticides bifenthrin, cyfluthrin and permethrin. Results are presented both as measured and nominal concentrations (Tables 24 a-d). These tests compared performance in hatchery water obtained from the UCD FCCL to performance in laboratory control water. Both types of water were adjusted to 900 µS/cm and pH 7.9.
For H. azteca, the most toxic chemical was cyfluthrin with a 10-d LC50 of 1.74 (DIEPAMHR) and 1.86 (HW) ng/L, closely followed by bifenthrin with a 10-d LC50 of 2.7 (DIEPAMHR) and 2.3 (HW) ng/L. Permethrin was the least toxic pyrethroid tested with a 10-d LC50 of 63.9 (DIEPAMHR) and >90 (HW) ng/L. Amphipods were relatively sensitive to chlorppyrifos (10-d LC50: 105/103 ng/L), but far less sensitive to diazinon (10-d LC50: 3080/4310 ng/L) than other invertebrate test species. H. azteca is not sensitive to ammonia/um and copper compared to both fish and other invertebrate test species.
Water type did not affect the 10-d acute toxicity endpoint of ammonia/um, chlorpyrifos, bifenthrin or cyfluthrin. However, toxicity of diazinon and permethrin was somewhat lower in hatchery water than in laboratory control water. Toxicity of copper was significantly lower in hatchery water than in control water, suggesting that dissolved organic carbon in Delta water rendered the metal less bioavailable.
We determined chronic effect concentrations for ammonia/um (10-d growth: 20.2/52.5 mg/L NH4
+; 0.688/1.52 mg/L NH3), as well as for copper (10-d growth: 44/61 µg/L Cu+), diazinon and bifenthrin. Effect concentrations were lower in laboratory control water than in hatchery water for ammonia/um, copper and diazinon, but higher for bifenthrin. For both organic pesticides, the chronic effect concentration was approximately half the 10-d LC50.

POD 2008-2010: Final Report
69
Table 24 a. Measured acute effect concentrations of selected chemicals for juvenile Hyalella azteca. Tests were performed using both laboratory control water (DIEPAMH) and water from the delta smelt hatchery (HW) adjusted to EC 900 μS/cm. The 96-h ECs are calculated from survival recorded on day 4.
Chemical Date Matrix 96-h LC10 96-h LC50 10-d LC10 10-d LC50 Estimate 95% C.I. Estimate 95% C.I. Estimate 95% C.I. Estimate 95% C.I.
Total Ammonia/um 4/10/2009 DIEPAMHR 39.4 27.3 - 49.8 102.2 84-133 42.8 29.5 - 52.3 72.9 62 - 84
(mg/L) HW 53.9 40.0 - 68.9 149.3 115 - 234 32.3 23.6 - 39.8 72.9 62 - 88
Un-ionized 4/10/2009 DIEPAMHR 1.025 0.823 - 1.168 1.714
1.542 -1.976 1.113
0.904 - 1.238 1.454
1.331 - 1.564
Ammonia (mg/L) HW 1.513
1.231 - 1.697 2.406 2.138 - 2.99 1.151
0.947 - 1.291 1.731
1.591 - 1.904
Copper 4/10/2009 DIEPAMHR 271 244 - 303 449 377 - 554 122 36 - 133 178 165 - 197 (dissolved; µg/L) HW 303 230 - 627 613 474 - 737 199 152 - 287 343 312 - 369
Chlorpyrifos 1/15/2009 DIEPAMHR 77.9 65.4 - 117.6 153.6 95.7 - 183.3 71.1 65.6 - 75.9 105.2 88.2 - 141.7
(ng/L) HW 78.3 75.4 - 83.4 146.6
131.4 - 161.8 72.1 70.5 - 73.8 102.6 91.2 - 114.7
Diazinon (ng/L) 12/30/2008 DIEPAMHR 2680 2460 - 3260 5900 4500 - 6950 1450 1300 - 1860 3080 2420 - 3670 HW 3410 2980 - 5000 6737 4180 - 8210 3000 2790 - 3120 4310 4150 - 4460
Bifenthrin (ng/L) 1/14/2009 DIEPAMHR 2.4 2.2 - 2.6 3.9 3.4 - 4.3 2.1 2.1 - 2.2 2.7 2.5 - 3.0 HW 2.9 1.4 - 3.4 4.3 4.0 - 4.9 1.2 1.0 - 1.6 2.3 1.6 - 4.5
Cyfluthrin (ng/L) 12/12/2008 DIEPAMHR 1.29 1.25 - 1.34 1.77 1.65 - 2.02 1.29 1.25 - 1.33 1.74 1.61 - 2.04 HW 1.04 0.82 - 1.41 2.12 1.75 - 2.50 0.98 0.81 - 1.24 1.86 1.50 - 2.22
Permethrin 1/21/2009 DIEPAMHR 46.4 43.0 - 56.1 83.6 56.1 - > 90 43.1 40.0 - 45.0 63.9 59.6 - 68.1 (ng/L) HW > 90 - > 90 - 44.1 1.6 - 56.0 >90 -
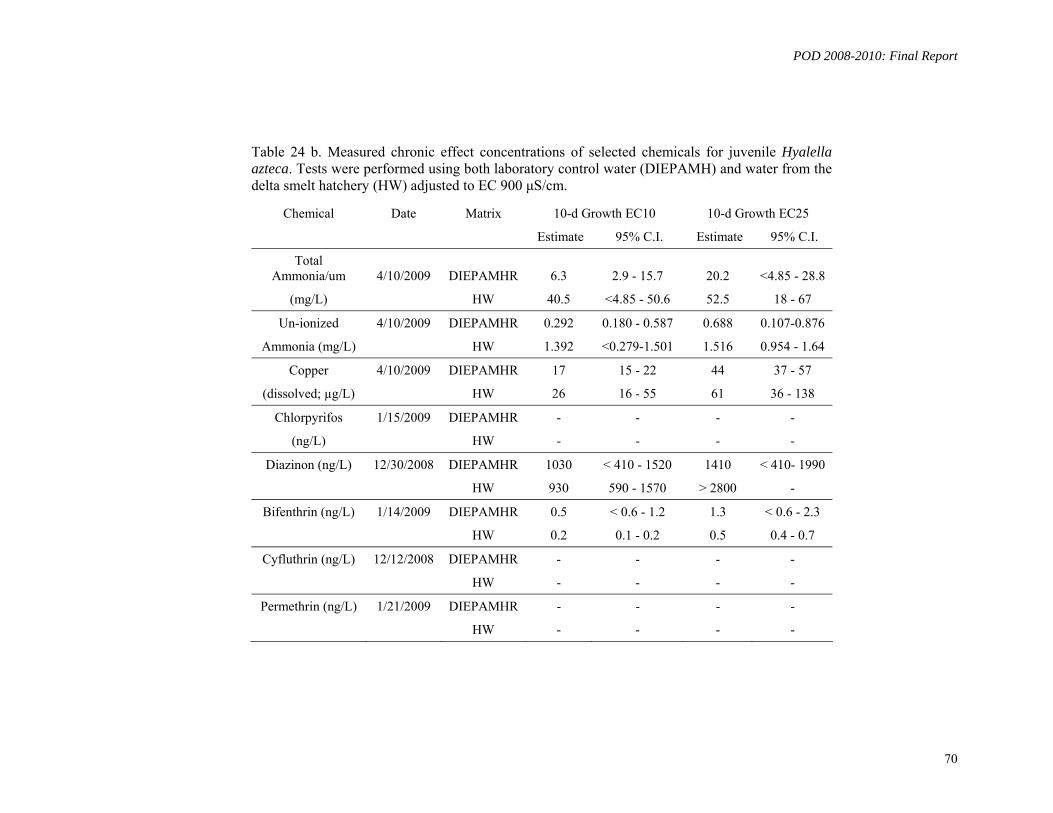
POD 2008-2010: Final Report
70
Table 24 b. Measured chronic effect concentrations of selected chemicals for juvenile Hyalella azteca. Tests were performed using both laboratory control water (DIEPAMH) and water from the delta smelt hatchery (HW) adjusted to EC 900 μS/cm.
Chemical Date Matrix 10-d Growth EC10 10-d Growth EC25
Estimate 95% C.I. Estimate 95% C.I.
Total Ammonia/um 4/10/2009 DIEPAMHR 6.3 2.9 - 15.7 20.2 <4.85 - 28.8
(mg/L) HW 40.5 <4.85 - 50.6 52.5 18 - 67
Un-ionized 4/10/2009 DIEPAMHR 0.292 0.180 - 0.587 0.688 0.107-0.876
Ammonia (mg/L) HW 1.392 <0.279-1.501 1.516 0.954 - 1.64
Copper 4/10/2009 DIEPAMHR 17 15 - 22 44 37 - 57
(dissolved; µg/L) HW 26 16 - 55 61 36 - 138
Chlorpyrifos 1/15/2009 DIEPAMHR - - - -
(ng/L) HW - - - -
Diazinon (ng/L) 12/30/2008 DIEPAMHR 1030 < 410 - 1520 1410 < 410- 1990
HW 930 590 - 1570 > 2800 -
Bifenthrin (ng/L) 1/14/2009 DIEPAMHR 0.5 < 0.6 - 1.2 1.3 < 0.6 - 2.3
HW 0.2 0.1 - 0.2 0.5 0.4 - 0.7
Cyfluthrin (ng/L) 12/12/2008 DIEPAMHR - - - -
HW - - - -
Permethrin (ng/L) 1/21/2009 DIEPAMHR - - - -
HW - - - -

POD 2008-2010: Final Report
71
Table 24 c. Nominal acute effect concentrations of selected chemicals for juvenile Hyalella azteca. Tests were performed using both laboratory control water (DIEPAMH) and water from the delta smelt hatchery (HW) adjusted to EC 900 μS/cm. The 96-h ECs are calculated from survival recorded on day 4.
Chemical Date Matrix 96-h LC10 96-h LC50 10-d LC10 10-d LC50
Estimate 95% C.I. Estimate 95% C.I. Estimate 95% C.I. Estimate 95% C.I.
Total Ammonia/um 4/10/2009 DIEPAMHR 52.3 36.6 - 65.5 130.9 108 - 169 57.3 40.5 - 69.1 94.3 81 - 108
(mg/L) HW 69.5 46.1 - 88.9 192.9 149 - 304 41.6 30.3 - 51.4 94.3 80 - 114
Copper 4/10/2009 DIEPAMHR 291 224 - 343 484 422 - 553 125 36 - 140 174 165 - 183
(µg/L) HW 352 274 - 412 570 500 - 650 207 153 - 295 318 293 - 344
Chlorpyrifos 1/15/2009 DIEPAMHR 75.2 61.4 - 158 152.7 91.2-185.8 67.6 62.1 - 72.6 102.4 84.3 - 145.6
(ng/L) HW 138.8 124.2-154.1 138.8 124.2-154.1 96.7 86.1 - 108.0 101.9 93.2 - 111.4
Diazinon 12/30/2008 DIEPAMHR 2210 1410 - 2690 4440 3300 - 5470 1340 1150 - 2350 2670 2190 - 3080
(ng/L) HW 2410 2000 - 3480 4900.00 2790 - 5810 2110 1950 - 2240 3120 3000 - 3270
Bifenthrin 1/14/2009 DIEPAMHR 5.38 4.56 - 6.27 9.01 9.01-11.35 4.48 4.28 - 4.59 6.88 6.09 - 8.00
(ng/L) HW 7.87 5.29 - 8.69 11.48 10.57-13.28 4.36 3.98 - 4.99 6.73 5.31 - 11.75
Cyfluthrin 12/12/2008 DIEPAMHR 2.12 2.04 - 2.21 3.04 2.75 - 3.54 2.12 2.05 - 2.20 2.97 2.73 - 3.57
(ng/L) HW 1.30 1.01 - 1.83 2.70 2.25 - 3.17 1.22 0.99 - 1.58 2.39 1.95 - 2.83
Permethrin 1/21/2009 DIEPAMHR 56.8 53.2 - 66.8 93.9 67.12- >100 53.24 50.0 - 55.3 74.6 70.3 - 78.7
(ng/L) HW > 100 - >100 - 54.39 3.31 - 66.72 > 100 -

POD 2008-2010: Final Report
72
Table 24 d. Nominal chronic effect concentrations of selected chemicals for juvenile Hyalella azteca. Tests were performed using both laboratory control water (DIEPAMH) and water from the delta smelt hatchery (HW) adjusted to EC 900 μS/cm.
Chemical Date Matrix 10-d Growth EC10 10-d Growth EC25 Estimate 95% C.I. Estimate 95% C.I.
Total Ammonia/um
(mg/L) 4/10/2009 DIEPAMHR 8.5 3.7 - 21.3 26.7 0.2 - 38.4 HW 51.7 < 6.25 - 65.3 67.9 22.9 - 87.5
Copper (µg/L) 4/10/2009 DIEPAMHR 18 15 - 24 45 38 - 62 HW 24 13 - 57 60 32 - 147
Chlorpyrifos (ng/L) 1/15/2009 DIEPAMHR - - - -
HW - - - - Diazinon (ng/L) 12/30/2008 DIEPAMHR 930 < 500 - 1390 1270 0 - 1780
HW 1050 550 - 2020 >2000 - Bifenthrin (ng/L) 1/14/2009 DIEPAMHR 0.86 < 1.0 - 2.25 2.18 < 1.0 - 4.25
HW 0.78 < 1.0 - 1.47 1.33 0.50 - 2.05 Cyfluthrin (ng/L) 12/12/2008 DIEPAMHR - - - -
HW 0.29 0.16 - 0.66 0.88 0.45 - >3.9 Permethrin (ng/L) 1/21/2009 DIEPAMHR 1.30 0.50 - > 100 >50 -
HW 16.11 13.63 - 37.16 23.42 15.38 - 79.28

POD 2008-2010: Final Report
73
IV.2.4 C. dubia Two types of standard tests were performed to establish effect concentrations for the waterflea, C. dubia. The 96-h acute test follows different protocols and was expected to be more sensitive than the chronic test, where more food is provided for the organisms.
When comparing nominal effect concentrations from both testing methods, all chemicals tested were more toxic to C. dubia in the 96-h acute test than in the chronic test, with the possible exception of chlorpyrifos and diazinon (Tables 25 a-f). The 7-d LC50 derived from the chronic test was the same as the 96-h LC50 derived from the acute test for chlorpyrifos, and for diazinon, the 7-d LC50 (chronic test) was significantly lower than the 96-h LC50 (acute test). The differences were substantial for all pyrethroids tested. The acute test method resulted in 96-h LC50s that were significantly lower (>20- fold) than the 7-d LC50. As opposed to H. azteca and both fish species, C. dubia was more sensitive to OP insecticides than to pyrethroids, and more sensitive than H. azteca to ammonia/um and copper (Table 28 a). Toxicity of copper was significantly lower in hatchery water than in control water, suggesting that dissolved organic carbon in Delta water rendered the metal less bioavailable (Table 25 d).
Table 25 a. Acute 96-h effect concentrations for C. dubia. Tests were performed using laboratory control water (SDEPAMH). All concentrations are nominal except ammonia/um concentrations.
Chemical Test Date 96-h LC10 96-h LC50
Estimate 95% C.I. Estimate 95% C.I. Total
Ammonia/um* (mg/L) 4/13/2010 5.8
<2.74 - 12.79 12.6 11 - 14
Un-ionized Ammonia* (mg/L) 4/13/2010 0.208 <0.147- .276 0.295 0.267-0.319
Copper (µg/L) 3/17/2010 19.7 13.4 - 20.4 26.3 24.5 - 26.8 Chlorpyrifos (ng/L) 3/11/2010 53.6 - 70.8 -
Diazinon (ng/L) 3/11/2010 207.4 195.5-218.5 277.8 268.9-286 Bifenthrin (ng/L) 3/2/2010 3.2 0.1 - 25.6 21.1 18.2 - 23.3 Cyfluthrin (ng/L) 3/2/2010 1.6 0.7 - 4.2 21.0 17.7 - 25.3 Permethrin (ng/L) 3/16/2010 278.5 256.2-311.3 428.7 331.3-651.3
* measured concentrations

POD 2008-2010: Final Report
74
Table 25 b. Nominal 96-h effect concentrations derived from chronic test with C. dubia. Tests were performed using laboratory control water (SDEPAMH). All concentrations are nominal except ammonia/um concentrations.
Chemical Test Date Matrix 96-h LC10 96-h LC50
Estimate 95% C.I. Estimate 95% C.I. Copper (dissolved; µg/L) 3/3/2010 SD900 37.5 2.4 - 43.1 59.6 49.5 - 84.2
HW 94.5 84.2 - 150 182.9 133.7 - 204.2 Chlorpyrifos (ng/L) 10/8/2009 SD900 54.6 53.6 - 56.2 77.2 70.8 - 89.1
HW 50.0 17.7 - 54.0 70.8 64.9 - 79.4
Diazinon (ng/L) 10/22/2009 SD900 268 - 353.6 -
HW 256.3 11.1 - 268 345.0 329.9 - 353.6
Bifenthrin (ng/L) 3/18/2010 SS900 630 561.3 - 1072 1219 890.9 - 1414
HW 561.3 540 - 630 890.9 734.9 - 1219
Cyfluthrin (ng/L) 4/7/2010 SD900 530.1 222 - 535.9 702.9 674.3 - 707.2
HW 535.9 - 707.2 -
Permethrin (ng/L) 12/2/2009 SD900 1487 1380 - 2500 2806 2051 - 3402
3/3/2010 HW 1487.0 1380 - 2500 2806.0 2051 - 3402
Table 25 c. Measured 96-h effect concentrations derived from chronic test with C. dubia. Tests were performed using laboratory control water (SDEPAMH).
Chemical Test Date Matrix 96-h LC10 96-h LC50
Estimate 95% C.I. Estimate 95% C.I. Copper (dissolved; µg/L) 3/3/2010 SD900 34.9 2.3 - 40.4 56.9 44.6 - 82.1
HW 92.7 82.1 - 162 184.6 133.7 - 214.7 Chlorpyrifos (ng/L) 10/8/2009 SD900 20.9 20.7 - 21.2 24.7 23.7 - 26.5
HW 20.0 1.7 - 20.8 23.7 22.7 - 25.0
Diazinon (ng/L) 10/22/2009 SD900 249.5 - 357.4 -
HW 235.4 10.4 - 249.5 346.1 326.7 - 357.4
Bifenthrin (ng/L) 3/18/2010 SS900 329.7 308.1 - 432 506.2 403.8 - 552.7
HW 308.1 301.3 - 329.7 403.8 360.8 - 506.2
Cyfluthrin (ng/L) 4/7/2010 SD900 543.9 229.4 - 549.5 708.2 681.3 - 712.3
HW 549.5 - 712.3 - Permethrin* (ng/L) 12/2/2009 SD900 NA NA NA NA
3/3/2010 HW NA NA NA NA
* concentrations not measured.

POD 2008-2010: Final Report
75
Table 25 d. Dissolved organic carbon (DOC) measurements in Hatchery Water and synthetic laboratory control water (SSEPAMH).
Water Type Date DOC (mg/L) Filtered Hatchery Water 2/7/2010 6.19 SSEPAMH 2/8/2010 0.63 Filtered Hatchery Water 3/1/2010 7.61 SSEPAMH 3/1/2010 0.94 Filtered Hatchery Water 3/15/2010 7.25 SDEPAMH 3/18/2010 1.04 Filtered Hatchery Water 4/4/2010 6.29 SDEPAMH 4/2/2010 ND Filtered Hatchery Water 5/3/2010 3.79

POD 2008-2010: Final Report
76
Table 25 e. Nominal acute and chronic effect concentrations for C. dubia 7-d survival and fecundity for selected chemicals. Tests were performed using both laboratory control water (SDEPAMH) and water from the delta smelt hatchery (HW) adjusted to EC 900 μS/cm.
Chemical Date Matrix 7-d LC10 7-d LC50 7-d Reproduction EC10 7-d Reproduction EC25
Estimate 95% C.I. Estimate 95% C.I. Estimate 95% C.I. Estimate 95% C.I.
Copper (µg/L) 3/3/2010 SDEPAMH 37.5 2.4 - 40.9 53.1 47.3 - 59.5 2.20 1.1 - 11.8 17.1 5.3 - 40.9
HW 106.1 86.2 - 160.8 194.6 150- 212.2 55.90 44.0 - 83.2 83.2 58.5 - 98.2
Chlorpyrifos (ng/L) 10/8/2009 SDEPAMH 53.6 - 70.8 - 52.4 35.1 - 54.2 59.3 54.5 - 61.3
HW 50.0 17.7 - 53.6 68.1 64.9 - 70.8 17.6 9.0 - 51.4 53.8 21.5 - 58.5
Diazinon (ng/L) 10/22/2009 SDEPAMH 134.0 - 176.8 142-220.1 145.3 126.5-155.1 189.5 170.9-222.1
HW 14.9 2.99-134 172.7 150.4-198.3 4.0 1.61-142.9 53.85 9.98-237.9
Bifenthrin (ng/L) 3/18/2010 SDEPAMH 500.0 315 - 535.9 680.5 609.6-707.2 298.4 15.2 - 344.4 388.9 298.2 - 520.4
HW 280.6 270-315 445.5 367.5-609.6 290.7 78.1 - 315.3 364.6 310.7 - 446.6
Cyfluthrin (ng/L) 4/7/2010 SDEPAMH 511.7 177 - 536 689.2 610 - 707 91.3 3 - 203 171.8 25 - 282
HW 535.9 - 707.2 - 9.8 4 - 96 140.0 49 - 177
Permethrin (ng/L) 12/2/2009 SDEPAMH 1250.0
787.5 - 2500 2806 1895 - 3402 209.6
12.25 - 725.7 899.8 498 - 1354
HW 1250.0 787.5-2500 2806 1895 - 3402 251.1 9.7 - 771 815.3 357 - 1268 ** poor test acceptability control (TAC) performance

POD 2008-2010: Final Report
77
Table 25 f. Measured acute and chronic effect concentrations for C. dubia 7-d survival and fecundity for selected chemicals. Tests were performed using both laboratory control water (SDEPAMH) and water from the delta smelt hatchery (HW) adjusted to EC 900 μS/cm.
Chemical Date Matrix 7-d LC10 7-d LC50 7-d Reproduction EC10 7-d Reproduction EC25
Estimate 95% C.I. Estimate 95% C.I. Estimate 95% C.I. Estimate 95% C.I.
Copper 3/3/2010 SDEPAMH 34.9 2.3 - 38.8 50.4 43.1 - 59.0 2.4 1.1 - 21.2 20.7 5.1 - 39.4
(dissolved; µg/L) HW 92.7 82.1 - 162 184.6
133.7 - 214.7 53.20 41.5 - 80.2 81.0 54.2 - 95.6
Chlorpyrifos (ng/L) 10/8/2009 SDEPAMH 20.7 - 23.7 - 20.6 18.4 - 20.8 21.9 21.2 - 22.1
HW 20.0 1.7 - 20.7 23.2 22.4 - 23.7 7.7 1.52 - 20.8 21.3 9.13 - 22.1
Diazinon (ng/L) 10/22/2009 SDEPAMH 130.8 - 167.5 - 139.1 123.1-148.1 176.5 160.3 - 208
HW 14.0 2.87-130.8 164.1 146.8- 85.7 44.1 2.41- 228 176.2 20.5 - 264.9
Bifenthrin (ng/L) 3/18/2010 SDEPAMH** 288.0
209.8 - 299.9 344.9
323.4 - 352.7 203.1 8.0 - 240 245.4 203 - 302
HW 193.8 188.7 - 209.8 266.1
233.2 - 323.4 198.5 86.9 - 208.7 231.9 211.6 - 262.9
Cyfluthrin (ng/L) 4/7/2010 SDEPAMH 537.8 183 -550 703.8 620 -712 64.9 1.8 - 270.9 163.9 12.0 - 307.7
HW 549.5 NA 712.3 NA 9.7 3.6 - 112.5 127.6 43.3 - 183.3
Permethrin (ng/L) 12/2/2009 SDEPAMH * * * * * * * *
HW * * * * * * * * * measured concentrations not available ** poor TAC performance

POD 2008-2010: Final Report
78
IV.2.5 E. affinis Acute (96-h) effect concentrations were determined for ammonia, copper, the organophosphate insecticide chlorpyrifos, and the pyrethroid insecticides bifenthrin, cyfluthrin, and permethrin by Dr. Teh (UC Davis, CA). In addition, the UCD ATL performed several LC50 tests with ammonia and copper (900 µS/cm and 2 ppt salinity), as well as rangefinder tests for insecticides. Please refer to chapter III.5 (Teh et al.). Results obtained by UCD ATL are presented in Tables 26 a, b. below.
The sensitivity of E. affinis to copper was determined in multiple tests (Table ). Tests conducted at a salinity of 2 ppt and a temperature of 20oC resulted in 48-h LC50s and 96-h LC50s of 210 - >300 µg/L, and 31.6 – 109.2 µg/L, respectively. At a conductivity of 900 µS/cm, the 96-h LC50 was 72.6 µg/L copper (dissolved). These results are in sharp contrast to 96-h LC values reported by Teh et al. (2009) of 3.48 µg/L, who tested under similar conditions (T=20oC, pH 8.0) and at a salinity of 2 ppt.
While UCD ATL results for copper are 10-33 times higher than those reported by Teh et al., LC50 values for total ammonia/um were similar (depending on pH). Effect concentrations for ammonia/um suggest, that E. affinis is far more sensitive to ammonia/um than H. azteca. Effect concentrations for the insecticides chlorpyrifos, cyfluthrin, permethrin and bifenthrin determined by both labs were similar, and demonstrate that E. affinis is less sensitive to pyrethroids, and chlorpyrifos than other common invertebrate test species. Table 26 a. Nominal effect concentrations for copper in E. affinis reference toxicant tests conducted at a salinity of 2 ppt.
Copper (ug/L) LC10 LC50 Date Endpoint
Control Survival
(%) NOEC LOEC Estimate 95% C.I. Estimate 95% C.I.
24-hr Survival 100 256 >256 - - - - 48-hr Survival 100 128 256 8 0.6 - 64 210 128 - >256 72-hr Survival 90 128 256 9.3 0.5 - 19.4 76 16 - 137
1/31/2010
96-hr Survival 90 64 128 1.9 0.4 - 16.8 70 15 - 83 24-hr Survival 100 300 >300 >300 - >300 - 48-hr Survival 100 300 >300 189 60 - >300 >300 - 72-hr Survival 100 300 >300 37.5 24 - 172 >300 -
2/26/2010
96-hr Survival 80 300 >300 39.9 3 - 70 71.8 53 - 246 24-hr Survival 100 300 >300 150 95 - 300 >300 - 48-hr Survival 90 300 >300 110.4 90 - 300 >300 - 72-hr Survival 90 150 300 86.5 83 - 110 156.7 123 - >300
3/8/2010*
96-hr Survival 50 300 >300 67.6 2 - 84 109.2 53 - 162 24-hr Survival 100 300 >300 75 27 - >300 >300 - 48-hr Survival 80 300 >300 51 27 - 172 >300 - 72-hr Survival 80 300 >300 35 22 - 43 63.1 50 - >300
3/26/10*
96-hr Survival 50 300 >300 3.4 0.5 - 40 31.6 5.7 - 56
*: Control survival was < 80%

POD 2008-2010: Final Report
79
Table 26 b. Acute effect concentrations (UCD-ATL) for E. affinis for selected chemicals. Tests were performed using laboratory control water (SSEPAMH) adjusted to EC 900 μS/cm and pH 7.9.
Chemical Test Date Notes NOEC LOEC 96-h LC50
Estimate 95% C.I.
Nominal Ammonia (mg/L) 3/9/2010 Nominal 6.3 12.5 2.5 1.3 - 6.9
Ammonia Nitrogen (mg/L) 3/9/2010 Measured 7.0 14.7 3.1 1.5 - 7.8
Un-ionized Ammonia (mg/L) 3/9/2010 Measured 0.222 0.434 0.117 0.076 - 0.250
Nominal Copper (ug/L) 3/3/2010 Nominal 150 300 75.0 30.2 - 172.3
Dissolved Copper (ug/L) 3/3/2010 Measured 151 305 72.6 27.1 - 174.9
Chlorpyrifos (ng/L) 3/12/2010
Rangefinder test, 4 rep./treatment
N/A* 1092 <25 - 1216
Diazinon (ng/L) 3/12/2010 Rangefinder test N/A* No Dose Response
Bifenthrin (ng/L) 3/10/2010 Rangefinder test N/A* 26.08 <2 - 243.6
Cyfluthrin (ng/L) 3/10/2010 Rangefinder test N/A* 31.30 <2 - 115.5
Permethrin (ng/L) 3/12/2010 Rangefinder test N/A* 467.8 <30 - 1731
* replication too low to derive value.

POD 2008-2010: Final Report
80
IV.2.6 Interspecies Comparison
IV.2.6.1 Fish
Comparison of effect concentrations derived from tests using hatchery water adjusted to 900 µS/cm and ph 7.9 showed that larval delta smelt (although older and larger) were more sensitive than fathead minnow to ammonia/um, copper, and all insecticides tested with the exception of permethrin (Table 27).
Table 27. Comparison of the NOEC, LOEC and 96-h LC50s of 39 – 51 day old delta smelt and <48 h old fathead minnows in hatchery water to selected chemicals. All effect concentrations are based on measured concentrations.
Delta Smelt (DS) Fathead Minnow (FHM) Relative
Sensitivity Chemical
NOEC LOEC LC50 NOEC LOEC LC50 LC50 FHM/
LC50 DS Ammonia Nitrogen* (mg/L)
14.4 29.0 11.8/11.6 15.2 29.8 20.9 1.8
Unionized Ammonia* (mg/L)
0.191 0.333 0.164/0.147 0.629 1.121 0.85 5.2/5.8
Copper (total; µg/L)
40.4 78.2 97.3 132 260 216 2.2
Copper (dissolved; µg/L)
41.4 76.2 92.1 125 238 200 2.2
Chlorpyrifos (µg/L)
14.8 25.2 27.7 144 311 >311 >11.2
Esfenvalerate (µg/L)
0.051 0.135 0.117 0.500 0.920 0.670 6.4
Bifenthrin (µg/L)
0.120 0.260 0.143 0.4 0.7 0.920 6.4
Cyfluthrin (µg/L)
0.407 0.890 0.420 0.645 1.11 0.830 2
Permethrin (µg/L)
2.557 4.84 4.065 1.20 2.52 1.730 0.43
* two tests were performed

POD 2008-2010: Final Report
81
IV.2.6.2 Invertebrates
Comparison of effect concentrations for H. azteca, C. dubia and E. affinis shows markedly different species sensitivities to ammonia/um, copper and pesticides (Tables 28 a, b). The copepod E. affinis and the waterflea C. dubia were the most sensitive species with regard to ammonia/um, while H. azteca was far less sensitive to this compound than all invertebrate and fish species tested. Similarly, H. azteca was least sensitive to copper, while C. dubia was most sensitive. Values for E. affinis varied widely. However, a series of four LC50 tests with copper conducted at 2 ppt (same salinity as used in tests conducted by Teh et al., 2009) resulted in nominal 96-h LC50 values of 31.6 – 109.2 µg/L (Table 26 a). At a conductivity of 900 µS/cm the 96-h LC50 was 75 µg/L. This suggests that the low LC50 of 3.48 µg/L copper must be considered an outlier.
C. dubia was most sensitive to chlorpyrifos, and 16-fold more sensitive to diazinon than H. azteca, while E. affinis was the least sensitive species with regard to chlorpyrifos. H. azteca was the most sensitive to all pyrethroid insecticides tested (bifenthrin, cyfluthrin and permethrin). C. dubia showed the least sensitivity to these materials, while the sensitivity of E. affinis was intermediate.
In order to investigate if standard toxicity endpoints are protective of copepod species, Table 28 b compares effect concentrations of E. affinis to toxicity endpoints of H. azteca and C. dubia tests considered to be most sensitive. C. dubia reproduction was most sensitive to copper and both organophosphate insecticides, while H. azteca 10-d survival and growth were the most sensitive endpoints for pyrethroid insecticides. The C. dubia chronic endpoint (reproduction) was far less sensitive than the acute endpoint (96-h survival) for pyrethroid toxicity, likely due to the differences in test protocols.

POD 2008-2010: Final Report
82
Table 28 a. Comparison of 96-h LC50 (nominal unless otherwise noted) of H. azteca, E. affinis and C. dubia exposed in laboratory control water to selected chemicals. Sensitivity ratios are derived using nominal concentrations, except for ammonia/um (C. dubia/H. azteca comparison).
Chemical
H. azteca
96-h LC50 a
(measured)
H. azteca
96-h LC50 a
(nominal)
E. affinis
96-h LC50 a
E. affinis
96-h LC50 b
C.dubia
Acute 96-h LC50 a
H. azteca: C. dubia
H. azteca: E. affinis
E. affinis: C. dubia
Total Ammonia/um
(mg/L) 102.2 c 130.9 3.1 c 10.97 12.6 c 10.4 33/10.4 0.25/0.87
Un-ionized Ammonia (mg/L) 1.714 c 4.36 0.117 c 0.78 0.42 c 10.4 14.6/2.2 0.28/1.86
Copper (µg/L) 449.0 c 484 75.0 3.48 26.3 17.1 6.5/139 2.85/0.13
Chlorpyrifos
(µg/L) 0.153 c 0.153 1.092 0.803 0.071 2.2 0.14/0.19 15.4/11.3
Diazinon (µg/L) 5.90 c 4.44 - - 0.278 16.0 - -
Bifenthrin (µg/L) 0.0039 c 0.009 0.026 d 0.011* 0.021 0.43 0.34/0.82 1.24/0.52
Cyfluthrin (µg/L) 0.0018 c 0.003 0.031 d 0.013 0.021 0.15 0.10/0.23 1.48/0.62
Permethrin (µg/L) 0.0836 c 0.094 0.468 d 0.158** 0.429 0.22 0.20/0.59 1.09/0.37
a Data generated at UCD ATL; experimental conditions: SC= 900 µS/cm, pH 7.9, T= 20.0ºC b Data obtained from S. Teh (UC Davis); experimental conditions: salinity=2 ppt, pH 8.1, T= 20.0ºC c measured or calculated from measured concentrations d derived from rangefinder tests * measured concentrations ranged from 2 - 18 ng/L (nominal : 4 – 32 ng/L) ** measured concentrations did not follow a concentration gradient

POD 2008-2010: Final Report
83
Table 28 b. Comparison of E. affinis 96-h LC50s to effect concentrations using the most sensitive endpoints for H. azteca (10-d survival, growth), and C. dubia (7-d fecundity) exposed in laboratory control water to selected chemicals. Concentrations were nominal unless otherwise noted.
Chemical E. affinis
96-h LC50 a
E. affinis
96-h LC50 b
H. azteca
10-d LC50 a
H. azteca
10-d Growth EC25 a
C.dubia
Acute 96-h LC50 a
C.dubia
Chronic, 7-d fecundity
EC25 a
Total Ammonia/um
(mg/L) 3.1 c 10.97 72.9 c 20.2 c 12.6 c -
Un-ionized Ammonia (mg/L) 0.117 c 0.78 1.45 c 0.688 c 0.42 c -
Copper (µg/L) 75.0 3.48 178.0 c 44 c 26.3 20.7 c
Chlorpyrifos (µg/L) 1.092 0.803 0.105 c - 0.071 0.022 c
Diazinon (µg/L) - - 3.08 c 1.41 c 0.278 0.177 c
Bifenthrin (µg/L) 0.026 d 0.011 0.0027 c 0.0013 c 0.021 0.245 c
Cyfluthrin (µg/L) 0.031 d 0.013 0.0018 c - 0.021 0.164 c
Permethrin (µg/L) 0.468 d 0.158 0.0640 c <0.050 c 0.429 0.900
a Data generated at UCD ATL; experimental conditions: SC= 900 µS/cm, pH 7.9, T= 20.0ºC b Data obtained from S. Teh (UC Davis); experimental conditions: salinity=2 ppt, pH 8.1, T= 20.0ºC c measured or calculated from measured concentrations d derived from rangefinder test

POD 2008-2010: Final Report
IV.3 Acute Toxicity of Ammonia, Copper, and Pesticides to Eurytemora affinis, of the San Francisco
Estuary
Final Report Submitted to:
Dr. Inge Werner
Aquatic Toxicology Laboratory University of California at Davis
Davis, California 95616
By
Swee J. Teh Sarah Lesmeister, Ida Flores, Michelle Kawaguchi, and Ching Teh
Aquatic Toxicology Program Department of Anatomy, Physiology, and Cell Biology
School of Veterinary Medicine, University of California at Davis
Davis, California 95616 Phone (530)-754-8183 Fax (530)-752- 7690
Email: [email protected]
84

POD 2008-2010: Final Report
Executive Summary Toxicity testing (96-h) of ambient surface waters in April-May 2008 from several locations in the North and South Delta-San Francisco Estuary (SFE) was shown to significantly affect the survival of Eurytemora affinis. Although chemical contaminants such as ammonia, bifenthrin, copper diuron, lambda cyhalothrin, and polyaromatic hydrocarbons have been detected in ambient waters, the impacts of these contaminants to pelagic organisms in the SFE food web are critically unknown particularly to the dominant zooplankton, i.e., E. affinis. The acute toxicity of ammonia, bifenthrin, chlorpyrifos, copper, cyfluthrin and permethrin to E. affinis was addressed in the current study as shown by the results of 96hr-LC50 values of the different contaminants: 1) ammonia - 10.97 mg/L total ammonia or 0.78 mg/L unionized ammonia at pH 8.1, 7.56 mg/L total ammonia or 0.12 mg/L unionized ammonia at pH7.6, and 10.93 mg/L total ammonia or 0.068 mg/L unionized ammonia at pH7.2; 2) bifenthrin - 11.37 ng/L, 3) chlorpyrifos - 803.20 ng/L 4) copper - 3.48 μg/L, 5) cyfluthrin - 12.72 ng/L and 6) permethrin -158.08 ng/L. Current findings indicated that E. affinis were sensitive to ammonia, copper, and pyrethroid pesticides (bifenthrin, cyfluthrin, and permethrin) and organophosphate insecticide (chlorpyrifos). Based on the results of this study, it is likely that the toxicities observed in E. affinis in 2008 may have been due, in part, to the presence of some of these chemicals in examined ambient waters. The potential impact of one or additive effects of these chemicals pose serious implications to the health and survival of zooplankton as important components of the SFE food web. Introduction Eurytemora affinis is an important food source to higher trophic level pelagic fish such as delta smelt, threadfin shad, and longfin smelt in the San Francisco Estuary (SFE). Previous study in this laboratory revealed that ambient surface waters from several locations in the North and South Delta in April-May 2008 showed significant effects to E. affinis survival (Teh et al., 2008). The initial detection of several chemical contaminants including ammonia, bifenthrin, chlorpyrifos, copper, cyfluthrin and permethrin in ambient waters prompted the need to examine their acute toxicity to E. affinis. Assessing the 96-hour LC50 values to establish the toxicity of these contaminants to E. affinis under controlled laboratory conditions was the main objective of the current study. Experimental Details 1. Copepods Brood stock of E. affinis was grown in aerated 120 L tanks placed in an environmentally
controlled room at 20 ± 1oC. Water quality in the tank including dissolved oxygen (>8
mg/L), pH (8.0 ± 0.1), water hardness (100 mg/L), salinity (2.0 ppt), and ammonia (<1
85

POD 2008-2010: Final Report
μg/L) were monitored weekly. An equal biovolume of the Instant Algae
(Nannochloropsis and Pavlova) mix was given as food at 400 μg C.L-1
.day-1. 2. Chemicals Stock solutions of ammonium chloride (10.0 g/L), bifenthrin (8.0 mg/L), chlorpyrifos (4.0 mg/L) copper chloride (4.0 mg/L), cyfluthrin (4.0 mg/L), and permethrin (8.0 mg/L) were prepared by personnel of Aquatic Toxicology Laboratory at UC Davis. The concentrations of the chemical used were: 1) bifenthrin (methanol control, 4.0, 8.0, 16.0, 32.0, and 64.0 ng/L), 2) chlorpyrifos (methanol control, 300, 600, 900, 1200, 1500 ng/L), 3) cyfluthrin (methanol control, 1.0, 3.0, 5.0, 7.0, 9.0 ng/L), and 4) permethrin (methanol control, 150, 175, 200, 225, 250 ng/L). Methanol was used as solvent for these chemicals, and therefore served as control using the highest concentration in each of the chemical treatments. The concentrations used for ammonia were: 1) 0.0, 10.0, 15.0, 20.0, 25.0, and 30.0 mg/L at pH 8.1, 2) 0.0, 10.0, 15.0, 20.0, 25.0, and 30.0 mg/L at pH7.6, and 3) 0.0, 4.0, 6.0, 8.0, 10.0, and 12.0 mg/L at pH7.2 that were prepared by diluting the ammonium chloride stock solution with culture water and the pH adjusted with 1N HCl. The concentrations used for copper chloride were 0.0, 1.0, 2.0, 4.0, 6.0, and 8.0 μg/L. Graded concentrations of these chemicals were prepared by diluting the stock solution with culture water (same source of water as used for culturing the E. affinis) 30-45 minutes prior to the initiation of the 96-hour exposures. 3. Acute Toxicity Test Groups of juvenile E. affinis (N = 20 per replicate; three replicates per concentration) were exposed separately to ammonia, bifenthrin, chlorpyrifos, copper, cyfluthrin and permethrin using the standard static renewal method for acute toxicity testing (1993). The test conditions used for the acute toxicity tests for ammonia, bifenthrin, chlorpyrifos, copper, cyfluthrin and permethrin are shown in Table 1. Briefly, Copepods were fed with nutritious algae and 80% of the tested water was replaced at 24, 48, and 72 h with newly
prepared corresponding treatment solutions previously acclimated to 20oC. Mortalities
were recorded daily for 4 days. At the end of 96 hr, the number of survivors in each beaker was counted to derive the mean percentage survival of E. affinis exposed to each chemical concentration. The estimated 96-hour LC50 values (Lethal Concentration causing 50% mortality of the E. affinis) were calculated using the U.S. Environmental Protection Agency Probit Analysis Program v1.5 (http://www.epa.gov/nerleerd/stat2.htm). 4. Water parameters and chemical analysis Water quality was monitored and recorded daily for each of the acute toxicity trials. Unionized ammonia was calculated from total ammonia nitrogen using free ammonia calculator (http://cobweb.ecn.purdue.edu/~piwc/w3-research/free-ammonia/nh3.html). The concentrations of the chemicals used for the toxicity trials will be verified at the Aquatic Toxicology Laboratory at UC Davis by testing I L subsamples of each of the chemical concentrations prior to the exposure trials.
86

POD 2008-2010: Final Report
Results and Discussions The mean survival (%) of E. affinis at the end of 96 hour of toxicity testing is given in Table 2. The 96hr-LC10 and 96hr-LC50 values with 95% confidence intervals as calculated using the USEPA Probit Analysis Program v1.5 are shown in Table 3. The data demonstrates that juvenile E. affinis are sensitive to the ammonia, copper, pyrethroid pesticides (.bifenthrin, cyfluthrin and permethrin), and organophosphate insecticide (chlorpyrifos). This pilot study aimed to establish LC50 values for E. affinis to support the hypothesis that ambient water samples from certain locations in the SFE are toxic to E. affinis. Based on the results of this study, it is likely that the toxicities observed in E. affinis in 2008 may have been due, in part, to the presence of these chemicals in examined ambient waters. The potential impact of one or additive effects of these chemicals pose serious implications to the health and survival of zooplankton as important components of the SFE food web. . References US Environmental Protection Agency. 1993. Methods for measuring the acute toxicity of effluents and receiving waters to freshwater and marine organisms (Fourth Edition). Report EPA/600/4-90/027F/93. Environmental Monitoring Systems Laboratory, Office of Research and Development. Cincinnati, OH. Teh SJ, Min L, Teh, FC Lesmeister, S, Werner,I, Krause, J, and Deanovic, L. 2008. Toxic effects of surface water in the upper San Francisco Estuary on Eurytemora affinis. Final report to San Luis and Delta-Mendota Water Authority.
87

POD 2008-2010: Final Report
Table 1 Test conditions used for Eurytemora affinis Temperature (°C) 20 ± 0.1
Salinity (ppt) 2
pH 8.0 ± 0.1
Conductivity (μmhos) 3000
Hardness (mg/L) 360
Alkalinity (mg/L) 60
Acceptability in control survival ≥80%
Size of test beaker (mL) 600
Volume of test solution (mL) 500
Life stage of copepods Juvenile
# of copepods 20
# of replicates per concentration 3
# of concentrations 6
Feeding regime Daily
Static-renewal test Duration 24-96 h
88

POD 2008-2010: Final Report
Table 2 Mean % survivorship of E. affinis at the end of 96 hour exposure
Chemicals Concentration % Survivorship Control 96.66
10 56.66 15 20.00 20 5.00 25 0
Ammonia mg/L
at pH 8.1
30 0 Control 88.33
10 16.66 15 0 20 0 25 0
Ammonia mg/L
at pH 7.6
30 0 Control 88.33
4 60.00 6 56.66 8 55.00
10 46.66
Ammonia mg/L
at pH 7.2
12 35.00 Methanol control 85.00
4 75.00 8 43.33
16 38.33 32 16.67
Bifenthrin ng/L
(pptr)
64 3.33 Methanol control 83.33
300 76.66 600 65.00 900 26.66 1200 18.33
Chlorpyrifos ng/L
(pptr)
1500 15.00 Control 88.33
1 88.33 2 61.66 4 23.33 6 30.00
Copper μg/L (ppb)
8 13.33
89
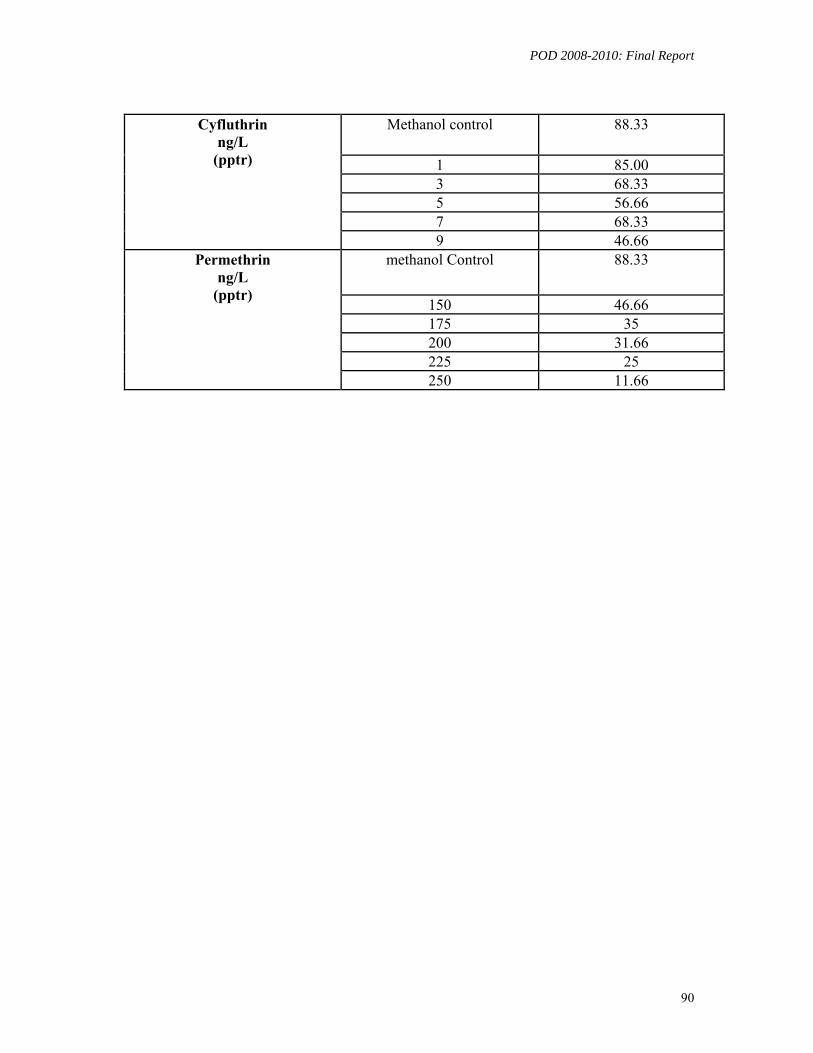
POD 2008-2010: Final Report
Methanol control 88.33
1 85.00 3 68.33 5 56.66 7 68.33
Cyfluthrin ng/L
(pptr)
9 46.66 methanol Control 88.33
150 46.66 175 35 200 31.66 225 25
Permethrin ng/L
(pptr)
250 11.66
90

POD 2008-2010: Final Report
91
Table 3 Estimates LC 10 and 50 values of E. affinis calculated using Probit Analysis (95% confidence intervals are indicated in parentheses)
Chemicals 96hr-LC10 96hr-LC50 Total Ammonia (mg/L; pH8.1)
7.01 (5.50, 8.71) 10.97 (9.76, 11.96)
Unionized Ammonia (mg/L; pH8.1)
0.46 (0.35, 0.55) 0.78 (0.68, 0.86)
Total Ammonia (mg/L; pH7.6)
5.02 (1.42, 6.85) 7.56 (4.07, 8.95)
Unionized Ammonia (mg/L; pH7.6)
0.08 (0.02, 0.11) 0.12 (0.06, 0.14)
Total Ammonia (mg/L; pH7.2)
1.82 (0, 2.79) 10.93 (7.34,49.0)
Unionized Ammonia (mg/L; pH7.2)
0.011 (0.0, 0.017) 0.068 (0.046, 0.306)
Bifenthrin (ng/L; pptr)
2.76 (1.27, 4.43) 11.37 (8.04, 14.80)
Chlorpyrifos (ng/L; pptr)
384.49 (211.81, 515.58) 803.20 (640.17, 926.41)
Copper (μg/L; ppb)
1.42 (0.61, 1.45) 3.48 (2.85, 4.15)
Cyfluthrin (ng/L; pptr)
1.40 (0.05, 2.89) 12.72 (8.05, 55.55)
Permethrin (ng/L; pptr)
83.37 (38.71, 110.83) 158.08 (125.55, 175.99

POD 2008-2010: Final Report
Manuscript in preparation.
Evaluating the Suitability of Hyalella azteca for Chronic Water Column Toxicity Testing. Linda A. Deanovic†, Dan Markiewicz†, Marie Stillway†, Stephanie Fong‡ and Inge Werner†. †School of Veterinary Medicine, Department of Anatomy, Physiology, and Cell Biology, University of California, Davis, California 95616, USA, ‡Central Valley Regional Water Quality Control Board, Sacramento Office, 11020 Sun Center Drive #200, Rancho Cordova, California, 95670, USA
92

POD 2008-2010: Final Report
Abstract Standard US EPA laboratory tests are used to monitor toxicity in surface waters. The waterflea, Ceriodaphnia dubia, is considered one of the most sensitive test organism for detecting insecticide toxicity in freshwater environments. However, several inland water bodies within California typically have conductivities higher than this species can tolerate. The euryhaline amphipod, Hyalella azteca, has the potential to be a valuable surrogate test species under such conditions. Before tests with H. azteca can effectively replace or complement C. dubia tests in monitoring programs, information must be generated on the sensitivity of the species to toxicants, the method’s ability to detect statistical differences, and the availability of protocols for Toxicity Identification Evaluation (TIE) procedures. This study compares the sensitivity of two water column toxicity tests, the chronic US EPA C. dubia test, and a 10-d H. azteca test. Organism sensitivity was evaluated through the collection of concentration effect data for four current-use insecticides. Test sensitivity was evaluated by comparing the percent minimum significant differences (PMSDs). Factors affecting the ability to identify pyrethroids pesticides in TIE procedures were addressed, including adsorption to container walls, selecting effective piperonyl buteoxide (PBO) concentrations and quantifying synergism between PBO and pyrethroids. H. azteca was more sensitive to pyrethroids and less sensitive to organophosphate (OP) pesticides than C. dubia. The H. azteca survival endpoint was the most sensitive, followed by the C. dubia reproduction endpoint. Adsorption of insecticides to sampling containers was greatest within the first 72 h of sample storage with approximately 80% loss for all insecticides studied. Fifty and 100 µg/L piperonyl-butoxide (PBO) accelerated mortality in conjunction with one toxic unit of two pyrethroids, bifenthrin or permethrin, and delayed mortality in the presence of the organophosphate, chlorpyrifos. Piperonyl-butoxide at a concentration of 25 µg/L synergized pyrethroid toxicity up to 9-fold. Our results show that H. azteca is a viable test species for evaluating ecosystem health, especially when the conductivity range of samples falls between 200 and 10,000 µS/cm, and pyrethroids may be present in the sample Key Words: Hyalella azteca, Ceriodaphnia dubia, insecticides, organophosphates, pyrethroids, piperonyl butoxide
93

POD 2008-2010: Final Report
Introduction Ceriodaphnia dubia has been used as a surrogate species in standard US EPA toxicity tests since the 1980s for ambient monitoring in California. Data gathered from these tests have been used by regulators to provide weight of evidence for TMDL listings, meeting Basin Plan objectives and other water quality investigations. After numerous years of testing, scientists have come to recognize that C. dubia is not always an ideal toxicity testing species, in particular when investigating the health of some of California’s more saline inland surface waters. California has a number of water bodies, including the Sacramento-San Joaquin Delta, the Colorado River, the New River and the Alamo River, that frequently have conductivities which exceed the upper salinity tolerance of C. dubia. US EPA (2002) recommends a salinity of 1 ppt or a conductivity of approximately 1900 µS/cm, as the upper limit for use with freshwater test species. In-house tests have repeatedly demonstrated that C. dubia reproduction is negatively impacted by samples with conductivities above 2000 µS/cm (UCD ATL, unpublished data). For marine test species, on the other hand, USEPA (2002) recommends a lower salinity limit of 5 ppt. This creates a significant gap between the freshwater species’ upper limit and the marine species’ lower limit, resulting in a limited number of surrogate species appropriate for testing within this salinity range. The amphipod species, Hyalella azteca, is tolerant of a broad conductivity range, which bridges the salinity gap between the US EPA freshwater and marine methods. A number of researchers have adapted the US EPA H. azteca 10-d sediment test for water column testing (Werner et al, 2008; SWRCB, 2002; Phillips, 2002). With an increasing interest in H. azteca as a water column test species, researchers need a refined testing protocol and a better understanding of the test’s effectiveness in detecting water column toxicity. Three important factors contribute to one’s ability to detect and identify a toxicant: the sensitivity of the species to toxicants, the method’s ability to detect statistical differences when toxicants are present, and a researcher’s ability to identify a toxicant using Toxicity Identification Evaluation (TIE) procedures. This paper compares the sensitivity of two water column toxicity tests, the chronic US EPA C. dubia survival and reproduction test, and a 10-d H. azteca survival and growth test. The US EPA (2002) recommends selecting multiple species in different trophic levels for monitoring projects. Utilizing multiple species with varying chemical sensitivities will improve the likelihood that the presence of any toxicants will be detected. Among the species utilized in the US EPA freshwater manuals, C. dubia is more sensitive to pesticides than Selenastrum capricornutum or Pimephales promelas. Several authors have demonstrated that H. azteca is also relatively sensitive to pesticides (Werner et al, 2007; Ankley et al, 1995; Amweg et al, 2006; Burkepile et al, 2000). This sensitivity contributes to the increasing interest in developing standardized H. azteca chronic water column toxicity test methods. To evaluate these organisms’ sensitivity to different chemicals, several tests were conducted with both C. dubia and H. azteca in two different water matrices in order to compare their effect concentration data. Pyrethroid pesticides were of particular interest in this study because their use is on the rise after several popular organophosphate pesticides were banned from use.
94

POD 2008-2010: Final Report
Percent minimum significant differences (PMSDs) give researchers an indication of the statistical sensitivity of test methods. PMSD is the smallest difference between the mean performance of a control and the mean performance of a sample can be detected by a given statistical test. The calculation of the PMSD differs depending on the statistical test being examined. This sensitivity is important in ambient monitoring projects as well as in the interpretation of TIEs, because the PMSD can indicate the reliability of a non-significant result. When a PMSD is small, most biologically significant differences in test organism performance will be detected by the statistical comparison, whereas in cases of a large PMSD, biologically significant differences in performance may not be detected by a statistical comparison. We compared PMSDs for both species to evaluate the relative statistical sensitivities of the two test methods. With the increase in use of pyrethroid pesticides in urban and agricultural areas (Lee et al, 2002; Weston et al, 2006) and the recognition that H. azteca are relatively sensitive to this pesticide class, scientists are also interested in how well these chemicals can be tracked and fingerprinted throughout the TIE process. Previous studies have demonstrated that pyrethroid pesticides in particular have extremely high adsorption rates (Lee et al, 2002). While TIEs are generally initiated within 48 hours of sample toxicity, the amount of time hydrophobic compounds spend in storage can be a problem, as toxicant degradation and adsorption increase with time. A study was conducted to determine how much pesticide was lost to adsorption to sample container and test beaker walls. Understanding loss gives researchers some indication of what concentrations may be bioavailble to the test organism, especially under the extended storage time required for TIEs. The US EPA TIE methods for C. dubia are well established (US EPA, 1992; US EPA, 1993). Generally these TIE procedures can be used for several species, but in many cases the individual manipulations have to be tested with unfamiliar species to understand the species’ tolerance to various TIE chemicals. For example, repeated attempts at adding a range of concentrations of sodium thiosulfate to in-house H. azteca TIEs have often resulted in high mortality in method controls, even though this manipulation has been used successfully with C. dubia. Moreover, establishing a range of non-toxic chemical concentrations for TIEs can be even more difficult with varying values of hardness in ambient samples, as organism response differs as hardness increases. Due to the high octanol-water partitioning coefficient, pyrethroids can be problematic when using columns that remove non-polar organic chemicals, such as C8 or C18 columns. Recovery in MeOH extraction can also be low, and as a result may not provide a strong enough signal in the TIE to interpret the results. Utilizing piperonyl buteoxide (PBO) as a TIE tool becomes important to add to the weight of evidence reflected in the TIE results. The PBO manipulation was implemented to reveal the presence of pesticides through the inhibitory effects of PBO on the toxicity of organophosphate insecticides and the synergistic effects of PBO on the toxicity of pyrethroid insecticides. There have been a number of PBO studies which have been used to evaluate its effect on H. azteca survival (Ankley et al, 1995; Amweg et al, 2006), but little has been assessed in relation to the growth endpoint. This paper includes two studies evaluating PBO as a TIE manipulation; one to determine the optimum PBO concentration to use in H. azteca
95

POD 2008-2010: Final Report
TIEs, and a second to determine how much pyrethroid toxicity is synergized by the addition of PBO. Growth data is presented whenever available. During four years of extensive testing, H. azteca were exposed to ambient water samples from the Sacramento – San Joaquin Delta both with and without the addition of PBO. The most common differences in H. azteca performance seen with the addition of PBO were increases and decreases in weight. The presence of suspected pesticides was revealed by chemical analysis of a number of samples which had effects on the weight endpoint associated with the addition of PBO. In the present study, we examined the ability of the PBO manipulation to reliably reveal the effects of pesticides on H. azteca weight. The frequency of detection of pesticides by chemical analysis was compared between samples that showed a significant effect on H. azteca weight with PBO addition and those that showed no toxicological effect. The objective of this paper is to determine whether the H. azteca 10-d water column test is a viable option for evaluating ecosystem health of those water bodies with conductivities above the tolerance level for EPA freshwater species, specifically C. dubia. This data contributes a small amount of information to the start of an extensive method validation process.
Materials and Methods
Toxicity Test Procedures
All tests were conducted at the University of California Aquatic Toxicology Laboratory (UCD-ATL), Davis, California, USA. The C. dubia chronic toxicity test method strictly followed US EPA protocols (US EPA, 2002) with test duration ranging from 6 to 8 d depending on the time required to produce a third brood. C. dubia used in testing were obtained from in-house cultures. The control water for C. dubia used in effect concentration studies consisted of Sierra Spring or Drinking Water (DS Waters of America, USA) amended with dry salts to moderately hard specifications (US EPA, 2002). Test endpoints were survival and reproduction. H. azteca were purchased from Aquatic Research Organisms (Hampton, NH, USA). Upon receipt, amphipods were moved to 10-L aquaria, fed, and acclimated to laboratory test conditions for 48 h. The 10-d testing procedure used in this monitoring study was based on protocols described in the Quality Assurance Management Plan for the State of California's Surface Water Ambient Monitoring Program (2002) and by US EPA (2000). At test initiation, water samples were shaken rigorously in original sampling containers, and sub-samples were filtered (ambient monitoring tests only) through a 53-m screen to remove debris and other organisms. Water was then warmed to test temperature (23 ± 1oC) in 600 ml beakers using a water bath maintained at 25±2oC, and aerated at a rate of 100 bubbles/min until DO concentration was 4.9 - 8.9 mg/l. De-ionized water amended to US EPA moderately hard specifications (US EPA, 2000]) was used for controls. Tests were initiated with 9-14 d old H. azteca. Each of four replicate 250-ml glass beakers contained 100 ml of water, a small piece of nitex screen (approx. 4 cm2) for use as substrate for the H. azteca, and 10 organisms. Animals were fed a mixture of yeast, organic alfalfa and trout chow (1 ml per replicate) at test initiation and on Days 2, 4, 5, 6, and 8. Tests
96

POD 2008-2010: Final Report
were conducted at 23 ± 1°C with a 16h:8h L:D photoperiod. Mortality was recorded daily and 80% of test water was renewed every other day. On day 10, the surviving H. azteca were dried to constant weight at 103-105 °C, and weighed using a Mettler AE 163 balance.
Analytical Chemistry
All analytical samples were collected in 1-L glass amber bottles and preserved with dichloromethane (DCM) within 24 hours of collection at the UCD ATL. Aqueous pesticide concentrations were determined by the California Department of Fish and Game Water Pollution Control Laboratory (Rancho Cordova, CA). Samples were extracted within 7 days of sample receipt. Water extractions followed USEPA Method 3510C – Separatory Funnel Liquid-Liquid Extraction. One-liter samples were fortified with the surrogates triphenyl phosphate and dibromooctaflurobiphenyl to monitor extraction efficiency and extracted twice with DCM using a mechanical rotating extractor. The extractions were dried using sodium sulfate, concentrated and solvent exchanged with petroleum ether using Kuderna-Danish evaporative glasswater equipped with a 3-ball snyder column followed with a micro-snyder apparatus and adjusted to a final volume of 2 ml in iso-octane. Final extracts were analyzed for OP pesticides using USEPA method 8141B, and for pyrethroids using USEPA method 8081B. OP pesticides were analyzed using a dual column high resolution gas chromatography with flame photometric detectors in phosphorous mode. Pyrethroids were analyzed using a dual column high resolution gas chromatography equipped with an electron capture detector.
Effect Concentration Tests
H. azteca test sensitivity to four current-use insecticides, the OPs, diazinon and chlorpyrifos, and the pyrethroids, bifenthrin and cyfluthrin was determined using standard effect concentrations (NOEC, LOEC, LC50 and EC25). Analytical grade pesticides were obtained from ChemService (West Chester, PA). For each chemical, C. dubia and H. azteca were exposed to a minimum of five concentrations, a solvent control and a negative control in both a synthetic control and delta water series. The test waters consisted of the moderately hard synthetic waters described earlier or non-toxic 1.0 micron filtered Sacramento-San Joaquin Delta water (Byron, CA). Both dilution waters were amended to a specific conductance of 900 µS/cm with Instant Ocean® (Aquarium Systems, Inc., Mentor, OH) and a pH of 7.9 to better represent conductivities that are typically found in the Sacramento – San Joaquin Delta. Pesticide grade methanol was used as a carrier for the pesticides and did not exceed 0.05%. Samples of each pesticide concentration and the solvent control were collected at test initiation, immediately preserved with DCM, and submitted for analysis within 14 d. Lethal and sublethal effect concentrations were calculated using CETIS v.1.1.2 (Tidepool Scientific Software, McKinleyville, CA, 2006). NOEC and LOEC values were calculated using USEPA standard statistical protocols (USEPA, 2002). LC50 and EC25 concentrations were calculated using linear regression, non-linear regression or linear interpolation methods.
Sensitivity Comparison for Toxicity Endpoints
Percent minimum significant difference (PMSD) is the minimum difference in survival, fecundity or growth between an ambient sample and a control needed for statistical significance, expressed as the percentage of control performance for a given endpoint. PMSDs for lethal and sublethal endpoints were calculated for samples examined in ambient H. azteca 10-d water
97

POD 2008-2010: Final Report
column tests as part of the Pelagic Organism Decline project or C. dubia 7-d chronic tests as part of the Surface Water Ambient Monitoring Program (SWAMP) at UCD-ATL between January 2008 and June 2009. Samples were randomly selected among all toxic and non-toxic samples whose conductivity fell within the range optimal for the health of the test organisms. C. dubia data were exclusively from ambient water samples with a conductivity of ≤2,000 uS/cm. Two sets of data used for H. azteca tests were from samples with a conductivity <2,000 uS/cm, or <10,000 uS/cm. The first data set reflects the performance of the H. azteca test within the conductivity range suited for C. dubia, while the second data set reflects the wider range of conductivity over which H. azteca shows no detectable decrease in survival or weight (UCDATL, unpublished data). Selected test data was compared to respective controls using US EPA standard single-concentration statistical protocols (US EPA, 2002). Fisher’s exact test was used to detect differences in survival in the C. dubia chronic test. H. azteca survival was arcsine square root transformed before analysis. C. dubia reproduction, H. azteca survival, and H. azteca growth were examined by homoschedastic (same variance) t-tests, heteroschedastic (separate variance) t-tests or Wilcoxon tests depending on the normality of the distributions and homogeneity of variances of the comparison under consideration. Fisher’s exact test minimum significant differences (MSDs) were calculated as the smallest difference in survival that would constitute a significant difference and thus indicate toxicity. MSDs of homoschedastic and heteroschedastic t-tests were determined following Wang et al. (2000) and Phillips et al. (2001). Wilcoxon test MSDs were calculated based on the method proposed by van der Hoeven (2008). A constant was added or subtracted from the performance of each replicate in the experimental treatment to change the ranks of the data such that the reduction in rank performance between the control and the experimental treatments was the minimum reduction detectable by the Wilcoxon test. All MSDs were converted to PMSDs by dividing the MSD by the mean control performance and multiplying the result by 100.
Toxicity Identification Evaluations
Three studies were conducted to address some of the emerging questions related to sample storage and the effectiveness of a specific TIE manipulation, the addition of PBO. The PBO manipulation has been used in TIEs for a number of years to evualuate the presence of pyrethroid and OP pesticides (Ankley et al, 1995; Amweg et al, 2006; Wheelock et al, 2006). Insecticide Adsorption and Loss
To quantify the loss of chemical due to adsorption during storage and testing, a test was performed without organisms simulating typical procedures in a H. azteca test. Insecticides were spiked into laboratory control water (USEPA, 2000) and non-toxic, unfiltered ambient water from the Sacramento-San Joaquin Delta. Initial nominal concentrations were 50 ng/L for permethrin, bifenthrin, lambda-cyhalothrin, cyfluthrin and esfenvalerate; and 100 ng/L for chorpyrifos. These concentrations were selected because of their ecological relevance. The test solution was rigorously mixed, dispensed into 3.8-L low density polyethylene cubitainers, then stored in the dark at 4°C to mimic sample collection procedures. On the following day (test initiation), each cubitainer was shaken vigorously for 30 s just prior to pouring sample water into each of three 600 ml glass beakers, where water was aerated and warmed to the test temperature
98
POD 2008-2010: Final Report
of 23°C. Four replicate aliquots (100 ml) were subsequently poured from each 500 ml beaker into 250 ml glass beakers routinely used for toxicity testing, for a total of 12 replicates. Warming samples and pouring warmed samples into replicate beakers occurred on each day that a test renewal would typically occur. Loss to Sample Container Storage: Samples for chemical analyses were collected immediately following pesticide spiking. These samples represented the initial concentration of pesticides, or what hypothetically might be collected from a water body at the time of sample collection. Additional samples, representing adsorption during storage, were also collected after 3, 4, 9 and 10 d of storage at 4°C. These samples also represent the concentrations that were poured into warming beakers on Days 2, 3, 8, and 9 of the test since the samples were stored for 24 hours before the simulated test was initiated. Additional Loss to Toxicity Test Containers: To evaluate chemical fate during a toxicity test, samples for chemical analyses were collected from test containers (replicate beakers) on Day 4 and 10 of the simulated test, representing typical acute and chronic exposure durations for H. azteca. One-liter samples were collected by combining 80 mL of each of the 12 replicate beakers. All analytical samples were collected in 1 L glass amber bottles and preserved with 10 mL of DCM within 24 hours of sample collection.
Two test methods were evaluated, a daily renewal and an every other day renewal, in order to determine whether more frequent renewals would increase the bioavailability of pesticides to the test organism. Comparisons were also made between a synthetic moderately hard control water and an unfiltered ambient water using the every other day renewal method. This comparison was made to determine whether there were any matrices effects on adsorption.
Effectiveness of PBO as a TIE Tool
During an ambient monitoring project, 100 µg/L of PBO was initially used as a TIE manipulation because that concentration was well below the LC50 for H. azteca (UCDATL unreported data, Ankley et al, 1995) and it had been used successfully for many TIEs in C. dubia tests. It soon became apparent that this concentration negatively impacted H. azteca growth in the method blank. In-house tests revealed that 25 µg/L was generally a safe concentration for the growth endpoint, but whether this lower PBO concentration was effective as a TIE manipulation for higher pesticide concentrations, specifically with respect to the survival endpoint, was unknown. A test was initiated to evaluate how effective 25, 50 and 100 µg/L PBO was as a TIE manipulation for approximately one toxic unit1 (TU) of three pesticides: permethrin, bifenthrin and chlorpyrifos. The TU concentration was determined from the nominal LC50 concentrations generated in the effect concentration tests. The test also included a solvent control with and without PBO. PBO was expected to accelerate the toxicity of the two pyrethroids and alleviate the toxicity of the OP pesticide. Following the test, each PBO treatment was statistically compared to its non-PBO counterpart using the Wilcoxon statistical test to determine whether PBO accelerated or decelerated toxicity on any given day during the test.
1 A toxic unit is defined as the concentration of a specific chemical present in a sample divided by the 96-h LC50 concentration for the species of interest.
99

POD 2008-2010: Final Report
One additional H. azteca test was conducted to determine the potency of 25 µg/L PBO in synergizing toxicity with two pyrethroids pesticides, permethrin and bifenthrin. A minimum of four concentrations of each pesticide and a solvent control were tested with and without PBO. The pesticide concentrations ranged from 1/32 to 1 TU for each chemical. After test termination, effect concentrations were calculated, using CETIS software as described above, and compared to determine the extent to which toxicity was synergized by the presence of PBO. Evaluation of the significance of the weight endpoint: In order to verify the ability of the PBO manipulation to reveal the effects of pesticides on H. azteca weight, a set of samples that caused a significant PBO effect and a set of samples that did not cause a PBO effect were analyzed for the presence of both pyrethroid and organophosphate insecticides. The results of the toxicological and chemical analyses were categorized as indicating the presence or absence of pesticide, and toxicological and chemical results were compared in a 2x2 contingency table by Fisher’s Exact test. The null hypothesis was that no association existed between the results of toxicological and chemical analyses, and the alternate hypothesis was that chemical analysis indicated the presence of pesticides more often in the event of a significant PBO effect on H. azteca weight.
Results
Chemical Sensitivity
Table 1 lists the NOEC, LOEC, LC50 and available EC25 concentrations for both species exposed to each pesticide. The control of the C. dubia test conducted with cyfluthrin did not produce the minimum number of offspring (15 neonates/surviving female) that EPA requires to consider an acceptable test. This test only produced an average of 11.4 neonates/surviving female in the 900 µS/cm synthetic control water.
Statistical Sensitivity
H. azteca survival data were often non-normally distributed, and were consequently analyzed mostly using Wilcoxon tests. Whether tested by Wilcoxon test or t-test, H. azteca survival MSDs were low (Table 2), both for tests within the range of conductivity physiologically compatible with C. dubia (<2 mS/cm) and for the entire optimal range for the survival of H. azteca (<10 mS/cm). For the sublethal endpoints of H. azteca and C. dubia the majority of test were analyzed using t-tests. PMSDs of C. dubia reproduction comparisons were low. PMSDs of H. azteca weight was highly variable, sometimes reaching above 100%.
Insecticide Adsorption and Loss During Storage and Testing
Table 3 lists the concentrations of six individual pesticides and the percent loss associated with adsorption to storage containers and test beakers. Loss to Sample Containers: As an approximation, the pesticide losses from the six pesticides were averaged within a specific treatment to simplify quantification. In instances where calculating the average percent loss included a concentration below the detection limit, the lowest percent loss was used in the calculation. As such, these values may slightly under-
100

POD 2008-2010: Final Report
estimate the actual loss occurring under these conditions. The greatest loss occurred during the first 72 h of storage, regardless of the water type and losses generally increased with increasing storage time. One decrease in loss occurred between Day 8 and Day 9 in the control water series. Analytical variability may have played a role in this decrease, especially since concentrations were near the minimum detection limits for that analytical method. Adsorption was slightly less in the ambient water compared to the synthetic control after 3 and 9 days of storage with an average difference of 9.2 and 5.1 percent difference, respectively. Additional Loss to Toxicity Test Containers: Analytical samples collected from the test replicate beakers represented the lowest pesticide concentration in a test at either the 96-h or 10-d time point. Concentrations were at their lowest, because the measurement included losses to multiple surfaces including the sample container, the warming beakers and the replicate beakers. The loss in all treatment types was approximately 93% in the replicate beakers by 96 hours in to the test. Losses for both water types were within 3.1% of each other at both the 96-h or 10-d test time point suggesting that any adsorption to particulate matter in the ambient water had little effect on bioavailability. The average percent loss between the two water-renewal methods (daily versus every other day) in the control water series were within 2.1% of each other at both the 96-h and 10-d time points. This similarity suggests that organisms employed in toxicity tests are most likely exposed to similar chemical concentrations in either renewal method in relation to their original concentration. In general, the maximum average pesticide concentrations on Day 2 of the test that organisms would see in a typical toxicity test are about one fifth of the concentrations that are originally present in a sample. This is most likely an overestimation, taking into consideration the likelihood that pesticides also bind to the warming beakers. By the end of the test, the minimum concentrations organisms are likely to encounter in a toxicity test are typically less than one twentieth of their original concentration. Effectiveness of PBO as a TIE Tool
TIEs are more easily interpreted when the signal from any manipulation is more apparent. Daily organism survival in the test evaluating the efficacy of three concentrations of PBO is presented in Table 4. All concentrations of PBO accelerated toxicity of two pyrethroids and decelerated toxicity of the OP pesticide. No statistical differences occurred in the method blanks, suggesting that all three PBO concentrations were non-lethal and suitable for a TIE addressing the survival endpoint. Permethrin with all three concentrations of PBO were statistically different from the permethrin alone on Day 2 of the test only. The higher two concentrations of PBO, 50 and 100 µg/L, in the presence of bifenthrin, were also statistically different than bifenthrin alone on Days 2 – 4. In all cases, 25 µg/L PBO produced a less distinct TIE signal, either by duration or differences in % survival, than the 50 and 100 µg/L PBO. The weight endpoint with PBO could not be evaluated for permethrin and bifenthrin, because all organisms in treatments containing pyrethroids exhibited 100% mortality by the end of the test. With chlorpyrifos, the higher two concentrations of PBO reduced mortality for the final four days of the test, while the lowest concentration of PBO only showed statistical differences in the final two days of the test. Growth
101

POD 2008-2010: Final Report
in chlorpyrifos treatments, with and without PBO, was not statistically different, suggesting that PBO may not be an effective TIE tool at any concentration for the growth endpoint. Table 5 summarizes results of H. azteca exposures to permethrin and bifenthrin in the presence of 25 µg/L PBO. The permethrin LC50 was potentiated by 2.48 and 8.81 fold for the 96-h and 10-d LC50s, respectively. Synergism for bifenthrin was 3.95 and 3.22 fold for the 96-h and 10-d LC50s, respectively. Little growth data was available to adequately address synergism in the growth endpoint. Evaluation of the significance of the weight endpoint: The results of the Fisher’s Exact Test conducted on ambient samples suggest that no association existed between the detection of either pyrethroid or OP pesticides and significant effects of 25 µg/L PBO on H. azteca growth. Pyrethroids were detected in 3 out of 11 samples that showed reduced weight with PBO addition, and they were detected in 4 out of 12 samples that did not show a significant PBO effect on weight (one-tailed Fisher's Exact Test, /P/ = 0.7776). OP pesticides were detected in 0 out of 10 samples that showed increased growth with PBO addition, and they were detected in 1 out of 12 samples that did not show a significant PBO effect on weight (one-tailed Fisher's Exact Test, /P/ = 1.000).
Discussion Limited effect concentration data is available for H. azteca water column tests, rendering it difficult to make broad generalizations about which species is more sensitive to a particular class of pesticides. Furthermore, better comparisons are made between commonly used methods with standardized organism age, test conditions and test durations. Whenever possible, the publications referenced below were selected based on similarities in test duration and the use of an organism age that matches the life stages of standardized test methods. H. azteca were far more sensitive to pyrethroid insecticides than C. dubia in our studies for both survival and sublethal endpoints. The LC50 concentrations for H. azteca (1.74 ng/L in synthetic control water and 1.86 ng/L in filtered delta water) for cyfluthrin were at least 382 times lower than those of C. dubia (703.8 and 712.3 ng/L). Yang and Hunter (2007) reported 96-h LC50 concentrations ranging from 0.093 to 0.210 µg/L to C. dubia. These concentrations are considerably lower than our 7-d C. dubia LC50 concentrations, but are considerably higher than our H. azteca LC50s. The bifenthrin LC50 concentrations for H. azteca (2.7 ng/L in synthetic control water and 2.3 ng/L in filtered delta water) were at least 115 times lower than those of C. dubia (344.9 and 266.1 ng/L). Liu (2005) reported a 96-h C. dubia LC50 for mixed isomers of cis-bifenthrin of 144 ng/L. Although this author reported varying sensitivities to different cis-bifenthrin isomers, the data supports the conclusion that C. dubia is less sensitive to bifenthrin than H. azteca. Werner et al (2007) summarized the effects of pyrethroid insecticides on of numerous aquatic organisms and found that H. azteca was frequently more sensitive to pyrethroids by more than an order of magnitude than C. dubia. Van Wijingaarden et al. (2005) reported that amphipods were sensitive to repeated application of pyrethroids in microcosm and mesocosm studies in 100% of the studies where organisms were repeatedly exposed to 0.1 to 1 TU. In contrast, cladocerans
102
POD 2008-2010: Final Report
only were impacted in 50% of the studies. Both our data and published literature values strongly suggest that H. azteca is more sensitive to pyrethroids than C. dubia. Ambient monitoring programs targeting waterbodies that are likely to contain pyrethroid insecticides would benefit from the greater sensitivity of H. azteca, especially in samples with conductivities above 2 mS/cm. In contrast, C. dubia were generally more sensitive to both OP insecticides, diazinon and chlorpyrifos, than H. azteca in our studies. The LC50 concentrations for C. dubia (167.5 ng/L in synthetic control water and 164.1 ng/L in filtered delta water) for diazinon were a minimum of 18 times lower than those of H. azteca (3080 and 4310 ng/L). The EC25 concentration for C. dubia for control water was approximately 8 times that of H. azteca. Effect concentrations determined here confirm those known from other studies. Giddings et al. (2000) reported the geometric mean 48-h C. dubia and H. azteca LC50 concentrations for diazinon of 0.49 and 22 µg/L, respectively. Burkepile et al. (2000) also reported 48-h C. dubia and H. azteca LC50 concentrations of 0.92 and 15.07 µg/L, respectively. Both the results of our study and the published literature values imply that C. dubia are more sensitive to diazinon than H. azteca. The 7-d LC50 concentrations for C. dubia (23.7 ng/L in synthetic control water and 23.2 ng /L in filtered delta water) for chlorpyrifos were approximately one fourth of those for H. azteca (105.2 and 102.6 ng/L), suggesting that the cladoceran is the more sensitive species for the survival endpoint. Sublethal endpoints were more varied. The limited NOEC and LOEC data suggests that H. azteca was less slightly more sensitive than C. dubia in synthetic control water and less sensitive in filtered delta water. Ankley et al (1995) reported a 96-h LC50 concentration of 0.04 µg/L for H. azteca. For C. dubia, Bailey et al, (1996; 1997) reported a 96-h LC50 concentration of 0.05 and 0.06 µg/L, respectively. For chlorpyrifos, the published literature values suggest that H. azteca is more sensitive than C. dubia with respect to the survival endpoint, which contradicts our findings. These contradictions suggest that both species most likely have a similar sensitivity to chlorpyrifos. Consideration of PMSDs is important in ambient monitoring programs because they directly affect test sensitivity. H. azteca survival data were analyzed using the Wilcoxon rank sum test in 28 out of 30 comparisons. This test is nonparametric, and MSDs are not usually calculated for nonparametric tests. The use of the method suggested by van der Hoeven (2008) for calculating the MSD of a Wilcoxon rank sum test made it possible to compare the statistical sensitivities of the C. dubia and H. azteca survival endpoints, and made it possible to include the results of Wilcoxon rank sum tests in the investigation of the statistical sensitivity of sub-lethal endpoints. Weighted averages of mean PMSDs for each endpoint at conductivities below 2000 µS/cm delineate as follows: H. azteca survival (13.8%), C. dubia reproduction (17.2%), C. dubia survival (43.6%) and H. azteca growth (60.0%). PMSDs for H. azteca were nearly identical at conductivities between 2000 and 10,000 µS/cm. The PMSD for C. dubia 7-d survival (43.6%), one of the most commonly used endpoints in toxicity testing was significantly higher than that of H. azteca survival (13.8%). Even when the C. dubia chronic control showed 100% survival (10 out of 10 animals), the highest survival detectable in the experimental treatment as significantly different was 60% (PMSD = 40.0%). The C. dubia 7-d chronic test is unusual among commonly used aquatic toxicology tests in that every replicate includes only one animal. The survival data
103

POD 2008-2010: Final Report
generated by this test are therefore categorical in nature (each replicate was recorded as either alive or dead), and differences between treatments are evaluated using the Fisher’s exact test, rather than the t-tests and the Wilcoxon test used to analyze the results of other endpoints. In contrast, replicates in the H. azteca 10-d water column test contain 10 individuals each, and survival data for each replicate is recorded as a percentage, making analysis by t-test or Wilcoxon test appropriate. H. azteca survival data were often non-normally distributed, and were therefore usually analyzed using Wilcoxon tests. The growth endpoint for H. azteca was far less sensitive (PMSD=60.0%) than the reproductive endpoint for C. dubia (PMSD=17.2%). The PMSD for C. dubia reproduction for the heteroschedastic t- test fell outside of the EPA’s lower limit for an acceptable PMSD while the PMSDs for the homoschedastic t-test and Wilcoxon’s test were within range, but very close to EPA’s lower limit. The PMSD for the H. azteca growth endpoint may be higher due to the variable in organism size at the beginning of test initiation. To select organisms that are the right “age” for a toxicity test, commercial suppliers often pass H. azteca through specific mesh sized sieves in order to collect organisms that are 7 to 14 d old. In contrast, selection of C. dubia neonates is much more refined. Neonates are collected within an eight h window and used for testing before they are 24 h old in an effort to reduce between-replicate variability. Our study demonstrated that pyrethroids as well as the OP chlorpyrifos in water samples present extraordinary challenges with respect to toxicity testing. During sample storage, the majority (approx. 80-88%) of insecticide was lost from solution within 72 h. These results corroborate data reported by Lee et al. (2002) who measured respective reductions of recovery of 37, 28, 21 and 32% of bifenthrin, cis-permethrin, trans-permethrin and deltamethrin in deionized water within the first 24 h of sample storage, with starting concentrations of 2 µg/L for each pyrethroid. Sharom and Solomon (1981) also reported adsorption of permethrin to borosilicate glass scintillation vials, with the majority of loss taking place within the first 24 h of contact. Contrarily, Hladik et al. (2009) reported only 5-7% loss of pyrethroids due to adsorption to cubitainers after storage for one week at 4 °C and one minute of shaking. The author spiked 400 ng/L of each pyrethroid. The thirty seconds of rigorous cubitainer shaking used in our study represents what is typically done during routine toxicity testing. Our results suggest that ambient samples must have pesticide concentrations substantially higher than any organisms’ 96-h LC50 in order to elicit a toxic response within a 96 h testing period. In addition, the high rate of adsorption during sample storage suggests that extended storage times associated with TIEs typically result in less than 90% of the original pesticide concentrations remaining in the water sample. TIEs on samples strongly suspected to contain pyrethroids should therefore be limited to samples that are acutely toxic. We conclude that loss of non-polar chemicals due to adsorption may lead to gross under-estimation of toxicity experienced by organisms in the field when using laboratory toxicity tests. The differences in adsorption, as average percent loss, between the daily and every-other-day renewal methods are 2.1 percent or less at both the 96-h and 10-d time points. This similarity suggests that either method may expose organisms to similar pesticide concentrations. Each storage time point also represents the pesticide concentrations just prior to pouring samples into the warming beakers of the simulated test. The difference in average percent loss in the storage containers between 72 and 96 h was a minimum of 4.7% suggesting that daily renewals may potentially provide the test organisms with concentrations slightly closer to the concentrations
104

POD 2008-2010: Final Report
that were present when a sample was originally collected. Unfortunately, data was not collected to evaluate the adsorption to the warming beakers prior to pouring a warmed aliquot into the replicate beakers. The highest concentrations in the replicate exposure beakers would be expected to occur immediately following renewal just prior to any adsorption to the replicate beaker walls. Wheelock et al. (2005) compared loss due to adsorption in acute H. azteca and C. dubia methods and found that even 4 h of holding permethrin prior to loading C. dubia resulted in a 50% loss of toxicity. The author reported the loss of toxicity to H. azteca was not as severe. Nonetheless, the pesticide loss to replicate container walls happened very quickly. Similarly, the differences in percent loss in replicate beakers between the two water types at the 96-h and 10-d time points are 3.1% or less. These results suggest that H. azteca may be exposed to similar concentrations of pesticides, regardless of the water type. The loss to sample container walls in the ambient water was 9.2% less than in the control water, suggesting that organisms in an ambient sample test may be exposed to slightly higher pesticide concentrations initially, but these concentrations ultimately declined to match the concentrations in the control water series. These results coincide with those of Lee et al, (2002), whose overall reduction of recovery of pyrethroid pesticides in ambient water was higher than comparable deionized water samples. The largest factor that may increase the bioavailability of pyrethroids in ambient samples, especially in the first few days of the test, is adsorption of pesticides to suspended solids rather than the beaker walls. Pesticides may be even more bioavailable because the amphipod may cling to or consume these contaminated particles. PBO proved to be an effective tool to synergize pyrethroid or antagonize OP toxicity for the survival endpoint. All three PBO concentrations tested increased or decreased survival as anticipated. Both 50 and 100 µg/L PBO accelerate the toxicity of pyrethroids and delayed the toxicity of OP pesticides without negatively affecting the positive control. More data is needed to determine whether PBO causes similar statistical differences in amphipod growth. The magnitude of synergism or antagonism caused by the addition of PBO can affect researchers ability to interpret TIE results. Previous studies with C. dubia showed synergism up to 32 fold between 100 µg/L PBO and several pyrethroids (UCDATL, unpublished data). For H. azteca, the maximum increase in the toxicity of permethrin and bifenthrin with 25 µg/L PBO was 9 and 4 fold, respectively. Since the synergism in a H. azteca test is relatively low compared to the synergism in C. dubia studies, researchers may have a much smaller window of time within a TIE to observe an effect, making the TIE signal more difficult to interpret. For OPs administered at 1 TU, studies with C. dubia and other cladocera species have shown toxicity is delayed for at least 24 hours with the addition of 100 µg/L PBO (UCDATL, unpublished data, Ankley et al., 1991). In our study with H. azteca, the differences in survival following exposure to chlorpyrifos with or without PBO were more subtle and required statistical analyses of daily data to verify that PBO was effective. Ankley et al. (1991) also demonstrated that higher concentrations of PBO were more effective at alleviating toxicity in higher concentrations of OP pesticides for three cladoceran species. Amweg et al. (2006) reported that higher concentrations of PBO synergized the toxicity of permethrin more than lower concentrations of PBO in H. azteca sediment tests. For both species, higher concentrations of PBO were more affective at eliciting the response one would expect in
105

POD 2008-2010: Final Report
from a TIE manipulation. Similar studies need to be done with H. azteca water column tests, especially to determine if TIE signals can be amplified to the point where they are readily apparent to the researcher. Stronger TIE signals ensure that researchers send analytical samples in for the most appropriate chemical class and expedite this decision making process. No studies evaluating PBO efficacy as a TIE tool on the growth endpoint have been published to date. Our small study suggests that PBO at 25 µg/L is an ineffective TIE tool for the H. azteca growth endpoint. While this concentration does not affect growth in control treatments, 25 µg/L PBO does not adequately predict the presence of either insecticide class. Considering that LC50 concentrations are so close to the detection limits for pyrethroids, it is possible that concentrations affecting the growth endpoint are currently undetectable. A higher concentration such as 50 or 100 µg/L PBO can be used to ensure the TIE tool is effective for the survival endpoint. Future Research
US EPA spent many years validating acute and chronic methods for C. dubia (US EPA, 2000). Since the H. azteca method described in this paper is relatively new, and additional authors have used dissimilar methods, validating any water column H. azteca method will require more studies to ascertain its reliability as a test method. Suggestions for future research include, but are not limited to:
PBO, temperature (Weston et al, 2006; Ware and Whitacre, 2004), and esterase (Wheelock et al, 2006) have successfully been used as H. azteca TIE tools. More research is needed to address metal toxicity by addition of EDTA and sodium thiosulfate to provide a more complete set of TIE tools. To date, in-house studies have shown these manipulations can be problematic, especially when salinities are above 10 ppt.
Acute H. azteca and C. dubia toxicity tests were utilized to evaluate five urban runoff samples from Roseville, CA (UCDATL, unpublished data). Although the source of toxicity was unknown, the H. azteca in four of the five samples died within 48 h while all C. dubia remained unaffected for the duration of the test. Similar studies should be performed to directly compare aggregate chemical sensitivity between both species. Research objectives should include investigations for various land use practices.
Conclusion Based on the results of our study, we conclude that H. azteca is an appropriate surrogate species for toxicity testing in California, especially at water conductivities of 2-10 mS/cm. The 10-d H. azteca water column toxicity test has a number of advantages over the standardized US EPA chronic C. dubia test. These advantages include a much broader salinity tolerance of the test organism, greater sensitivity to a number of commonly used pyrethroids and better PMSDs on the survival endpoint. The higher sensitivity of H. azteca to some pesticides may enable researchers to initiate TIEs in a more timely fashion, thus minimizing problems associated with chemical loss during storage and testing. The biggest disadvantage to using H. azteca is the lack of knowledge associated with TIE manipulations. Researchers should carefully weigh the financial risks associated with conducting
106
POD 2008-2010: Final Report
TIEs on samples that express toxicity late in the 10 day test period, especially since there is substantial pesticide loss due to adsorption and TIE tools are limited. Secondarily, the methods’ growth endpoint is not a sensitive indication of sublethal toxicity due to significant data variability. Overall, H. azteca is a good test organism where promulgated water column methods are not required, the conductivity range of samples falls between 200 and 10,000 µS/cm, and pyrethroids may be present in the sample. More studies are needed to further validate this method, however, it does have considerable promise based on its sensitivity.
Acknowledgments We would like to thank the staff of the UC Davis Aquatic Toxicology Laboratory for conducting the toxicity tests. Funding was provided by the Interagency Ecological Program, Sacramento, California (Contract No. 4600008070 to I. Werner) and the Central Valley Regional Water Quality Control Board (Contract No. 06-262-150).
References Amweg EL, Weston DP, Jonson CS, You J, Lydy MJ. 2006. Effect of Piperonyl Butoxide on Permethrin Toxicity in the Amphipod Hyalella Azteca. Environ. Toxicol. Chem. 25(7): 1817-1825. Anderson BS, Phillips BM, Hunt HW, Connor V, Richard N, Tjeerdema RS. 2006. Identifying primary stressors impacting macroinvertebrates in the Salinas River (California, USA): Relative effects of pesticides and suspended particles. Environ. Poll. 141 (2006) 402-408. Ankley G, Dierkes JR, Jensen DA, Peterson GS. 1991. Piperonyl Butoxide as a Tool in Aquatic Toxicological Research with Organophosphate Insecticides. Ecotoxocol. Environ. Safety. 21: 266-274. Ankley GT, Collyard SA. 1995. Influence of Piperonyl Butoxide on the Toxicity of Organophosphate Insecticides to Three Species of Freshwater Benthic Invertebrates. Comp. Biochem. Physiol. 110C(2): 149-155. Bailey HC, DiGiorgio C, Kroll K, Miller JL, Hinton DE, Starrett G. 1996. Development of Procedures for Identifying Pesticide Toxicity in Ambient Waters: Carbofuran, Diazinon, Chlorpyrifos. Environ. Toxicol. Chem. 15(6): 837-845. Bailey HC, Miller JM, Miller MJ, Wiborg LC, Deanovic L, Shed T. 1997. Joint Acute Toxicity of Diazinon and Chlorpyrifos to Ceriodaphnia Dubia. Environ. Toxicol. Chem. 16(11): 2304-2308. Burkepile DE, Moore MT, Holland MM. 2000. Susceptibility of Five Non-Target Organisms to Aqueous Diazinon Exposure. Bull. Environ. Contam. Toxicol. 64: 114-121.
107

POD 2008-2010: Final Report
Giddings JM, Hall LW, Solomon KR. 2000. Ecological Risks of Diazinon from Agricultural Use in the Sacramento-San Joaquin River Basins, California. Risk Analysis, 20(5): 545-572. Hladik M, Orlando JL, Kuivilla KM. 2009. Collection of Pyrethroids in Water and Sediment Matrices: Development and Validation of a Standard Operating Procedure. Scientific Investigations Report 2009-5012. US Geological Services. Reston, VA. Phillips BM. 2002. University of California, Granite Canyon, Standard Operating Procedures Manual. Moss Landing Marine Laboratories. Moss Landing, CA. Phillips BM, Hunt JW, Anderson BS, Puckett HM, Fairey R, Wilson CJ, Tjeerdema R. 2001. Statistical Significance of Sediment Toxicity Test Results: Threshold Values Derived by the Detectable Significance Approach. Environ. Toxicol. Chem. 20(2): 371-373. Lee S, Gan J , Kabashima J. 2002. Recovery of Synthetic Pyrethroids in Water Samples during Storage and Extraction. J. Agric. Food. Chem. 50: 7194-7198. Liu W, Gan J. 2005. Separation and Aquatic Toxicity of Enantiomers of Synthetic Pyrethroid Insecticides. Chirality 17:S127-S133 (2005). Sharom MS, Solomon KR. 1981. Adsorption and desorption of permethrin and other pesticides on glass and plastic materials used in bioassay procedures. Can. J. Fish. Aquat. Sci. 38: 199-204. SWRCB. 2002. Quality Assurance Management Plan for the State of California's Surface Water Ambient Monitoring Program. Division of Water Quality. Sacramento, CA. USEPA. 1992. Toxicity Identification Evaluation: Characterization of Chronically Toxic Effluents, Phase I. EPA/600/6-91/005F. Washington, DC. USEPA. 1993. Methods for Aquatic Toxicity Identification Evaluations: Phase II Toxicity Identification Procedures for Samples Exhibiting Acute and Chronic Toxicity. EPA/600/R-92/080. Washington, DC. USEPA. 2000. Understanding and Accounting for Method Variability in Whole Effluent Toxicity Applications Under the National Pollutant Discharge Elimination System Program. EPA/833/R-00/003. Washington, DC. USEPA. 2000. Methods for Measuring the Toxicity and Bioaccumulation of Sediment-associated Contaminants with Freshwater Invertebrates. 2nd ed. EPA/600/R-99/064. Washington, DC. USEPA. 2002. Short-term Methods for Measuring the Chronic Toxicity of Effluents and Receiving Waters to Freshwater Organisms. 4th ed. EPA/821/R-02/013. Washington, DC.
108

POD 2008-2010: Final Report
109
USEPA. 2002. Short-term Methods for Measuring the Chronic Toxicity of Effluents and Receiving Waters to Marine and Estuarine Organisms. 3rd ed. EPA/821/R-02/014. Washington, DC. Wang Q, Denton DL, Shukla R. 2000. Applications and statistical properties of minimum significant difference-based criterion testing in a toxicity testing program. Environ. Toxicol. Chem. 19(1): 113-117. Ware GM, Whitacre DM. 2004. The Pesticide Book, 6th ed. Meister, Willoughby, OH. USA. Werner I, Deanovic L, Reece C, Markiewicz D, Stillway M, Khamphanh J. 2008. Pelagic Organism Decline (POD): Acute and Chronic Invertebrate and Fish Toxicity Testing in the Sacramento-San Joaquin Delta 2008-2010. Progress Report II. Aquatic Toxicology Laboratory, University of California, Davis. Davis, CA Werner I., Moran K. (2008) Effects of pyrethroid insecticides on aquatic organisms. In: Synthetic Pyrethroids: Occurrence and Behavior in Aquatic Environments. J. Gan, F. Spurlock, P. Hendley, D. P. Weston, editors. American Chemical Society, ACS Symposium Series 991, American Chemical Society, Washington, DC, USA, pp 310-335. Weston DP. 2006. Temperature Dependence of Pyrethroid Toxicity: TIE Applications and Environmental Consequences. Proceedings, SETAC, National Meeting, Montreal, QC, Canada. P26. Wheelock CE, Miller JL, Miller MJ, Phillips BM, Gee SJ, Tjeerdema RS, Hammock BD. 2005. Influence of container adsorption upon observed pyrethroid toxicity to Ceriodaphnia dubia and Hyalella azteca. Aquat. Toxicol. 74(1): 47-52. Wheelock CE, Miller JL, Miller MJ, Phillips BM, Hentley SA, Gee SJ, Tjeerdema RS, Hammock BD. 2006. Use of Carboxylesterase Activity to Remove Pyrethroid-associated Toxicity to Ceriodaphnia dubia and Hyalella azteca in Toxicity Identification Evaluations. Environ Toxicol Chem 25(4): 973-984. van der Hoeven N. 2008. Calculation of the minimum significant difference at the NOEC using a non-parametric test. Ecotoxicology and Environmental Safety. 70: 61-66. Van Wijngaarden RPA, Brock TCM, Van den Bringk PJ. 2005. Threshold levels for effects of insecticides in freshwater ecosystems: A review. Ecotoxicology. 14(3): 355-380. Yang WC, Hunter W, Spurlock F, Gan J. 2007. Bioavailability of Permethrin and Cyfluthrin in Surface Waters with Low Levels of Dissolved Organic Matter. J. Environ. Qual. 36:1678-1685 (2007).

POD 2008-2010: Final Report
Table 1 a. Acute toxicity (measured) of organophosphate and pyrethroid insecticides to C. dubia and H. azteca in synthetic control water
7-d Survival C. dubia 10-d Survival H. azteca Chemical LC50 (ng/L) LC50 (ng/L)
NOEC (ng/L)
LOEC (ng/L) Estimate 95% C.I.
NOEC (ng/L)
LOEC (ng/L) Estimate 95% C.I.
Diazinon 123 228 167.5 - 1140 2100 3080 2420 - 3670 Chlorpyrifos 20 28 23.7 - 66 128 105.2 88.2 - 141.7 Bifenthrin 288 432 344.9 323.4 – 352.7 2 3 2.7 2.5 - 3.0 Cyfluthrin 515 985 703.8 620 - 712 1.2 2.2 1.74 1.61 – 2.04
Table 1 b. Acute toxicity (measured) of organophosphate and pyrethroid insecticides to C. dubia and H. azteca in filtered delta water
7-d Survival C. dubia 10-d Survival H. azteca Chemical LC50 (ng/L) LC50 (ng/L)
NOEC (ng/L)
LOEC (ng/L) Estimate 95% C.I.
NOEC (ng/L)
LOEC (ng/L) Estimate 95% C.I.
Diazinon 123 228 164.1 146.8 - 185.7 2800 5440 4310 4150 - 4460 Chlorpyrifos 20 28 23.2 22.4 - 23.7 66 133 102.6 91.2 - 114.7 Bifenthrin 179 288 266.1 233.2 - 323.4 1 3 2.3 1.6 - 4.5 Cyfluthrin 515 985 712.3 - 0.8 1.5 1.86 1.50 – 2.22
110

POD 2008-2010: Final Report
Table 1 c. Sublethal toxicity (measured) of organophosphate and pyrethroid insecticides to C. dubia and H. azteca in synthetic control water
7-d Fecundity C. dubia 10-d Growth H. azteca Chemical EC25 (ng/L) EC25 (ng/L)
NOEC (ng/L)
LOEC (ng/L) Estimate 95% C.I.
NOEC (ng/L)
LOEC (ng/L) Estimate 95% C.I.
Diazinon 123 228 176.5 160.3 - 208 1140 2100 1410 <410 - 1990 Chlorpyrifos 20 28 21.9 21.2 - 22.1 14 >14 - - Bifenthrin 288 432 245.4 203 - 302 0.6 2 1.3 <0.6 - 2.3 Cyfluthrin* 268 515 351.6 240 - 412 2.2 3.7 - -
* reproductive data for C. dubia was excluded because the average reproduction in the control did not meet EPA’s minimum reproductive requirement for test acceptability.
Table 1 d. Sublethal toxicity (measured) of organophosphate and pyrethroid insecticides to C. dubia and H. azteca in filtered delta water.
7-d Fecundity C. dubia 10-d Growth H. azteca Chemical EC25 (ng/L) EC25 (ng/L)
NOEC (ng/L)
LOEC (ng/L) Estimate 95% C.I.
NOEC (ng/L)
LOEC (ng/L) Estimate 95% C.I.
Diazinon 228 560 176.2 20.5 - 264.9 1140 2800 >2800 - Chlorpyrifos 20 28 21.3 9.13 - 22.1 66 >66 - - Bifenthrin 179 288 231.9 211.6 - 262.9 <1 1 0.5 0.4 – 0.7 Cyfluthrin <108 108 273.7 206 - 321 3.1 >3.1 - -
a: Low weight of solvent control indicates that EC25 estimate may be an artifact of high weights in low concentration treatments.
111

POD 2008-2010: Final Report
112
Table 2. Percent minimum significant differences (PMSD) in C. dubia 7-d and H. azteca 10-d toxicity tests.
PMSD (%) Species Endpoint Statistical Test Method N
Mean SD Range
Survival Fishers Exact 32 43.6 7.1 40 - 62.5 C. dubia Reproduction Heteroschedastic T-test 3 12.2 3.1 9.9 - 15.7 Homoschedastic T-test 23 17.7 10.7 5.8 - 41.1 Wilcoxon 6 18.0 7.0 7.0 - 25.3
Homoschedastic T-test 2 13.1 0.0 13.1 - 13.1 H. azteca
Arcsinsqrt Survival Wilcoxon 28 13.1 8.4 3.5 - 32.4
(<10 mS/cm) Weight Homoschedastic T-test 35 55.8 33.1 11.4 - 188.6 Wilcoxon 3 61.6 17.7 48.1 - 81.6
Homoschedastic T-test 2 13.1 0.0 13.1 - 13.1 H. azteca
Arcsinsqrt Survival Wilcoxon 25 13.9 8.6 3.5 - 32.4
(<2 mS/cm) Weight Homoshedastic T-test 27 59.8 35.2 11.4 - 188.6 Wilcoxon 3 61.6 17.7 48.1 - 81.6

POD 2008-2010: Final Report
Table 3. Loss of insecticide during storage and testing in 10-d H. azteca water column toxicity tests with different water renewal regimes. Nominal initial concentrations were 50 ng/L for pyrethroids and 100 ng/L for chlorpyrifos.
Loss of Chemical as % of Initial Concentration After
Chemical
Measured Initial
Concentration (ng/L) a
3 d b 4 d b 5 d c
(Day 4 of Test)
9 d b 10 d b 11 d c
(Day 10 of Test)
Daily Water Renewal Chlorpyrifos 68 82.4 >95.6 >95.6 >95.6 >95.6 >95.6 Bifenthrin 21 80.8 80.8 88.5 92.3 92.3 96.2 Cyfluthrin 33 87.9 90.9 93.9 97.0 93.9 98.2* Esfenvalerate 36 86.1 88.9 88.9 94.4 94.4 97.2 Lambda Cyhalothrin 36 86.1 88.9 88.9 91.7 88.9 94.4 Permethrin, Cis and Trans 54 81.5 87.0 90.7 >95.2 96.5* 94.4
Every Other Day Renewals Chlorpyrifos 68 82.4 >95.6 >95.6 >95.6 Bifenthrin 21 80.8 92.3 92.3 92.3 Cyfluthrin 33 87.9 93.9 97.0 93.9 Esfenvalerate 36 86.1 91.7 94.4 94.4 Lambda Cyhalothrin 36 86.1 94.4 91.7 94.4 Permethrin, Cis and Trans 54 81.5 92.6 >95.2 96.3
Delta Water: Every Other Day Renewals Chlorpyrifos 72 80.6* >95.8 >95.8 >95.8 Bifenthrin 21 61.9 >99.0 90.5 >99.0 Cyfluthrin 28 78.6 >98.6 92.9 >98.6 Esfenvalerate 28 71.4 85.7 85.7 >99.3 Lambda Cyhalothrin 30 76.7 90.0 96.7 99.0* Permethrin, Cis and Trans 36 77.8 95.6 78.9 >96.7 * concentration was below reporting limit > concentration was below minimum detection limit a chemical concentration immediately after spiking b percent loss after storage in cubitainer and prior to pouring an aliquot into 600 mL warming beakers c percent loss associated after storage and 1-2 d testing
113

POD 2008-2010: Final Report
114
Table 4. Concentration dependent effect of PBO on acute toxicity of nominal concentrations of permethrin, bifenthrin and chlorpyrifos to H. azteca.
Mean Survival (%) Treatment
Day 1 Day 2 Day 3 Day 4 Day 5 Day 6 Day 7 Day 8 Day 9 Day 10 Control 100 100 100 100 100 100 100 100 100 100 Control + MeOH @ 0.02% 100 100 100 100 100 100 100 100 100 100 Control + MeOH + 50 µg/L PBO 100 100 100 100 100 100 100 100 100 98 Control + MeOH + 100 µg/L PBO 100 100 98 98 98 95 95 95 95 93 94 ng/L Permethrin 90 58+ 23+ 23+ 18+ 15+ 8+ 8+ 5+ 5+ 94 ng/L Permethrin + 25 µg/L PBO 90 20* 0 0 0 0 0 0 0 0 94 ng/L Permethrin + 50 µg/L PBO 83 0* 0 0 0 0 0 0 0 0 94 ng/L Permethrin +100 µg/L PBO 73 0* 0 0 0 0 0 0 0 0 10 ng/L Bifenthrin 100 100 48+ 20+ 13+ 8+ 3+ 0+ 0+ 0+ 10 ng/L Bifenthrin + 25 µg/L PBO 100 98 0* 0* 0 0 0 0 0 0 10 ng/L Bifenthrin + 50 µg/L PBO 100 48* 5* 0* 0 0 0 0 0 0 10 ng/L Bifenthrin + 100 µg/L PBO 95 43* 0* 0* 0 0 0 0 0 0 143 ng/L Chlorpyrifos 100 100 100 100 100 69+ 28+ 23+ 13+ 10+ 143 ng/L Chlorpyrifos + 25 µg/L PBO 100 100 100 100 98 87 71* 71* 50* 45* 143 ng/L Chlorpyrifos + 50 µg/L PBO 100 98 98 98 95 87 79* 79* 79* 74* 143 ng/L Chlorpyrifos + 100 µg/L PBO 100 100 100 100 100 97* 92* 92* 87* 87*
*: P < 0.05 with corresponding non-PBO chemical spike
+: P < 0.05 with Control + MeOH

POD 2008-2010: Final Report
Table 5. Synergistic effect of PBO on 96-h and 10-d H. azteca toxicity endpoints for permethrin and bifenthrin.
Toxicity Endpoint Chemical NOEC (ng/L)
Fold Increase Due to PBO
LOEC (ng/L)
Fold Increase Due to PBO
LC50/EC25 (ng/L)
Fold Increase Due to PBO
96-h Survival Permethrin 47 94.0 76.9 Permethrin + 25 µg/L PBO 23.5
2x 47
2x 31.0
2.5x
10-d Survival Permethrin 23.5 47.0 52.9 Permethrin + 25 µg/L PBO 2.94
8x 5.88
8x 6.0
8.8x
10-d Growth Permethrin 47 >47 14.9a
Permethrin + 25 µg/L PBO 5.88 8x
>5.88 n/a
- n/a
96-h Survival Bifenthrin 5 10 15.8 Bifenthrin + 25 µg/L PBO 1.25
4x 2.5
4x 4.0
4.0x
10-d Survival Bifenthrin 1.25 2.5 2.9 Bifenthrin + 25 µg/L PBO 0.625
2x 1.25
2x 0.9
3.2x
10-d Growth Bifenthrin 2.5 >2.5 - Bifenthrin + 25 µg/L PBO 1.25
2x >1.25
n/a -
n/a
a Unreliable estimate because dose-response was not consistent with a single trendline and weights of some treatments were anomalous.
115

BioMed CentralBMC Genomics
ss
Open AcceResearch articleLinking mechanistic and behavioral responses to sublethal esfenvalerate exposure in the endangered delta smelt; Hypomesus transpacificus (Fam. Osmeridae)Richard E Connon*†1, Juergen Geist†1,4, Janice Pfeiff†2, Alexander V Loguinov†3, Leandro S D'Abronzo†1, Henri Wintz3,5, Christopher D Vulpe3 and Inge Werner1Address: 1School of Veterinary Medicine, Department of Anatomy, Physiology and Cell Biology, University of California, Davis, California 95616, USA, 2School of Veterinary Medicine, Molecular Biosciences, University of California, Davis, California 95616, USA, 3School of Nutritional Sciences and Toxicology, University of California, Berkeley, California 94720, USA, 4Unit of Functional Aquatic Ecology and Fish Biology, Department of Animal Science, Technische Universität München, D-85350 Freising, Germany and 5Biorad Laboratories, Life Science Research, Hercules, California, USA
Email: Richard E Connon* - [email protected]; Juergen Geist - [email protected]; Janice Pfeiff - [email protected]; Alexander V Loguinov - [email protected]; Leandro S D'Abronzo - [email protected]; Henri Wintz - [email protected]; Christopher D Vulpe - [email protected]; Inge Werner - [email protected]
* Corresponding author †Equal contributors
AbstractBackground: The delta smelt (Hypomesus transpacificus) is a pelagic fish species listed asendangered under both the USA Federal and Californian State Endangered Species Acts andconsidered an indicator of ecosystem health in its habitat range, which is limited to the Sacramento-San Joaquin estuary in California, USA. Anthropogenic contaminants are one of multiple stressorsaffecting this system, and among them, current-use insecticides are of major concern. Interrogativetools are required to successfully monitor effects of contaminants on the delta smelt, and toresearch potential causes of population decline in this species. We have created a microarray toinvestigate genome-wide effects of potentially causative stressors, and applied this tool to assesseffects of the pyrethroid insecticide esfenvalerate on larval delta smelt. Selected genes were furtherinvestigated as molecular biomarkers using quantitative PCR analyses.
Results: Exposure to esfenvalerate affected swimming behavior of larval delta smelt atconcentrations as low as 0.0625 μg.L-1, and significant differences in expression were measured ingenes involved in neuromuscular activity. Alterations in the expression of genes associated withimmune responses, along with apoptosis, redox, osmotic stress, detoxification, and growth anddevelopment appear to have been invoked by esfenvalerate exposure. Swimming impairmentcorrelated significantly with expression of aspartoacylase (ASPA), an enzyme involved in brain cellfunction and associated with numerous human diseases. Selected genes were investigated for theiruse as molecular biomarkers, and strong links were determined between measureddownregulation in ASPA and observed behavioral responses in fish exposed to environmentallyrelevant pyrethroid concentrations.
Published: 15 December 2009
BMC Genomics 2009, 10:608 doi:10.1186/1471-2164-10-608
Received: 25 February 2009Accepted: 15 December 2009
This article is available from: http://www.biomedcentral.com/1471-2164/10/608
© 2009 Connon et al; licensee BioMed Central Ltd. This is an Open Access article distributed under the terms of the Creative Commons Attribution License (http://creativecommons.org/licenses/by/2.0), which permits unrestricted use, distribution, and reproduction in any medium, provided the original work is properly cited.
Page 1 of 18(page number not for citation purposes)

BMC Genomics 2009, 10:608 http://www.biomedcentral.com/1471-2164/10/608
Conclusions: The results of this study show that microarray technology is a useful approach inscreening for, and generation of molecular biomarkers in endangered, non-model organisms,identifying specific genes that can be directly linked with sublethal toxicological endpoints; such aschanges in expression levels of neuromuscular genes resulting in measurable swimmingimpairments. The developed microarrays were successfully applied on larval fish exposed toesfenvalerate, a known contaminant of the Sacramento-San Joaquin estuary, and has permitted theidentification of specific biomarkers which could provide insight into the factors contributing todelta smelt population decline.
BackgroundThe delta smelt (Hypomesus transpacificus) is a pelagic fishspecies endemic to the Sacramento-San Joaquin estuary,whose abundance has dramatically declined since the1980s, and more precipitously in recent years [1-4]. It waslisted as endangered in 2009, under both the FederalEndangered Species Act (ESA) and California EndangeredSpecies Act (CESA). Considerable efforts are presentlybeing made to understand the causes of this recent popu-lation decline [4,5], especially because several otherpelagic species have shown similar population trends.Delta habitats have been compromised by a number ofcomplex factors, both known and unknown, potentiallyaffecting aquatic species throughout the Sacramento-SanJoaquin watersheds and estuary [4]. Pollution, in the formof chemicals contained in runoff from agricultural andurban areas, and old mining sites, treated wastewatereffluent, along with the effects of water exports, invasivespecies and habitat destruction are amongst potentialcauses for the population decline of several pelagic species[5].
Identifying the sublethal impacts of environmental stres-sors and their mechanistic effects on resident individualsand populations is a major challenge in ecotoxicology.Contaminants may not only affect organism survival, butcan compromise ecological fitness of individual speciesvia sublethal physiological, behavioral or immunologicaleffects (e.g. [6-10]), consequently altering food web andecosystem dynamics. However, such physiological end-points are often difficult to determine in field studies,because they either require behavioral observation andmeasurements, or because affected individuals will notsurvive in the wild. Similarly, widely used ecotoxicologi-cal tools such as standard toxicity tests [11,12] cannot eas-ily be adapted to resident species of concern, and,conversely, it is problematic to extrapolate test resultsobtained with surrogate species to resident species of con-cern [13]. Recent comparative studies have demonstrateda need for identifying effects directly in the species of con-cern, as traditional model organisms may differ in sensi-tivity and physiological response to environmentalcontaminants and other stressors [14,15].
Carefully selected molecular biomarkers can provide spe-cies-specific and sensitive, mechanistic information onthe overall health of an organism, as toxic responses areoften preceded by alterations in gene expression [16,17].In particular microarray gene profiling is a powerful toolfor defining genome-wide effects of environmentalchange on biological function [16,18,19]. The predictivevalue of microarrays as screening tools, as well as ourunderstanding of these responses and their application inthe field of ecotoxicology is rapidly growing. This technol-ogy can be applied in vertebrates and invertebrates,plants, algae, cell lines and unicellular organisms [20]. Inaddition, links are being established between specificmolecular biomarkers identified by microarray technol-ogy, and higher-level life history parameters, such asmetabolism, growth and reproduction [16,18,21,22].Gene expression studies carried out over short-term expo-sures have allowed for the prediction of chronic stressoreffects, such as reduced fecundity and embryonic arrest,somatic growth, and population dynamics [16,18,21,23].Thus, specific gene responses in studied organisms wouldnot only be indicative of health status, but when used inconservation studies, could highlight potential causes forpopulation decline. However, few biomarkers are cur-rently understood well enough to provide conclusive evi-dence of contaminant impacts on aquatic species in fieldmonitoring, and extrapolating effects seen at the biomar-ker level to individual or population-level toxicity contin-ues to be a challenge. For molecular biomarkers to be usedas successful monitoring tools of individual, populationand ecosystem damage, strong links need to continue tobe established between gene expression and health status.
To better understand the sublethal effects of contaminantsupon H. transpacificus, and to identify biomarkers forfuture field investigations, we have constructed a microar-ray with 8,448 Expressed Sequence Tags (ESTs). Nogenomic information was available on any database at thetime this project began, other than a few mitochondrialsequences used in taxonomic studies [24]. We describehere, the construction and first application of this tool toidentify genes in the delta smelt, specifically respondingto exposure to esfenvalerate, a pyrethroid insecticide, and
Page 2 of 18(page number not for citation purposes)

BMC Genomics 2009, 10:608 http://www.biomedcentral.com/1471-2164/10/608
present gene expression quantitation of selected biomark-ers, utilizing these to explain observed swimming abnor-malities. We used esfenvalerate in our study becausebiochemical responses and adverse effects on the wholeorganisms are relatively well understood [25] and there-fore would aid interpretation of results in this "proof ofprinciple" test. Esfenvalerate [(S)-a-cyano-3-phenoxyben-zyl-(S)-2-(-4-chlorophenyl)-3-methylbutyrate] is a syn-thetic pyrethroid insecticide, widely used in agriculture,with a high risk to aquatic organisms [26]. It causes neu-rological damage by blocking sodium and potassiumchannels, resulting in repetitive neurological discharge[25]. In addition, pyrethroid insecticides are highly solu-ble in myelin sheaths of nerves, causing demyelination,resulting in conduction deficiencies through nerve lesions[27], directly affecting swimming ability, and impingingon foraging and migration. Fish are highly sensitive to thisinsecticide, with for example effects on bluegill behaviorat measured concentrations as low as 0.025 μg/L-1[28].Pyrethroids have also been reported to affect growth,induce immune responses, reduce hepatic glycogen levelsand delay spawning [9,29].
The main focus of this study was not the development ofthe microarray, rather the identification of molecularbiomarkers specific to the delta smelt and stressors foundin the San Joaquin-Sacramento delta. We present hereresults from annotated genes identified through microar-ray analyses and specifically quantitative PCR analyses ofselected molecular biomarkers.
Results and DiscussionEffects of esfenvalerate exposure: mortality and swimming behaviorFish larvae are known to be highly sensitive to esfenvaler-ate, with effects on swimming performance and enhancedsusceptibility to predation resulting from concentrationsas low as 0.0625 μg/L-1[10]. Behavior alterations are con-strued as being consequential to the reported neurologicalmode of action of this pesticide, further affecting foraging,migration and reproduction [30]. Toxicity of pyrethroidsin the Sacramento-San Joaquin estuary is likely alleviatedby the presence of particles and organic matter, and todate concentrations of esfenvalerate detected in the watercolumn were low, however, concentrations in winterstorm runoff from agricultural lands have been reportedup to 0.093 μg.L-1 [31], influencing our decision to inves-tigate dose response exposures to both high and environ-mentally relevant concentrations in confirmatory studies.
In terms of mortality, 10-d old delta smelt were onlyslightly more sensitive in this study (LC50,24 h = 0.19 μg.L-
1) than 52-d old (LC50,24 h = 0.24 μg.L-1), however swim-ming performance of the younger larvae was affected at aconcentration approximating one third of that observed
affecting older fish (figure 1). Swimming abnormality in10-d old larvae, intensified with increasing esfenvalerateconcentration at 4 h, escalating significantly after 24 hexposure (figure 1a). This swimming abnormality wasalso concentration dependent in 52-d old fish, howeverswimming effects resulting from different time pointmeasurements differed only at the highest exposure con-centration of 0.250 μg.L-1 (figure 1b), where effects onmotion increased from 22.5% anomaly at 4 h to 45% at24 h. Behavioral abnormalities, reduced food intake andgrowth, as well as increased susceptibility to predationwere reported in fathead minnow larvae exposed to esfen-valerate for 4 h to concentrations above 0.455 μg.L-1 [10].Significant swimming impairments were determined inthis study at 0.250 μg.L-1, thus delta smelt are highly sen-sitive to sublethal esfenvalerate exposure. Furthermore,bioaccumulation in rainbow trout have resulted in con-centrations 400 times higher than background ambientlevels http://extoxnet.orst.edu.
Microarray application and q-PCRThrough the application of the delta smelt microarrays,and combined analytical methods, we have identified 288ESTs, from which a number of genes of interest could beused to measure the effect of esfenvalerate and potentiallyother pyrethroid insecticides; further investigating theiruse as biomarkers in this species. Of the sequenced ESTsthat responded significantly, 118 genes were successfullyannotated; 170 matched unnamed or hypothetical pro-teins, or did not match the described annotation selectioncriteria; i.e. BLASTx searches resulted in expect-valuesgreater than 1 × 10⁻⁵ and scores below 50. Based on geneontology; molecular function, biological processes andcellular components, 94 unique genes were functionallyclassified (figure 2 and table 1) and described below.Based on the proportions of ESTs responding to success-fully annotated unique genes (33%), it is estimated that ofthe 8,448 ESTs printed on the microarray, there could beabove 2,500 unique genes identified in the delta smelt.These numbers however represent responses to a singlecontaminant, and should not be construed as final asthere will have an intrinsic bias exerted upon them, how-ever, the proportion of repeated sequences in the analyseswas very low, with a maximum of nine repetitions forCHK1 checkpoint homologue and not more than one ortwo duplication for a few others. It is also important tonote that the microarray was manufactured with incom-plete genome data, thus information presented in figure 2represents proportions of a limited number of availablegenes.
Differences between methods used allow for greater min-ing of possible biomarkers. The method by Loguinov et al[32] identified a single differentially expressed gene at0.125 μg/L-1 esfenvalerate (with no significant homol-
Page 3 of 18(page number not for citation purposes)

BMC Genomics 2009, 10:608 http://www.biomedcentral.com/1471-2164/10/608
ogy). The addition of LIMMA GUI analysis, also identify-ing this single gene, generated a broader list of genes forbiomarker selection.
A large percentage of uniquely annotated genes, respond-ing to esfenvalerate exposure; 49%, were classified asinvolved in various biological processes. These includedgenes encoding for ribosomal proteins, t-RNA synthases,
telomerases, uncoupling proteins and genes involved inchromosome maintenance. Of greater interest was theidentification of genes involved in neuromuscular activ-ity; representing 19% of identified sequences, a further12% eliciting immune responses, along with 6% relatedto oxidative stress, respiration and iron storage and 5%relevant to apoptosis. Digestion appears to have also beenaffected, along with growth and development, repre-
Swimming behavior and mortalityFigure 1Swimming behavior and mortality. Percentage swimming normality and survival in (a.) 10-d old and (b.) 52-d old H. trans-pacificus exposed to esfenvalerate, ± standard errors (n = 10). * Indicates significant reduction in survival or swimming per-formance compared to solvent control.
0
20
40
60
80
100
0.00 0.10 0.20 0.30 0.40 0.50
4-hour Survival
24-hour Survival
4-hour Normal Swimming
24-hour Normal Swimming
0
20
40
60
80
100
0.00 0.10 0.20 0.30 0.40 0.50
4-hour Survival
24-hour Survival
4-hour Normal Swimming
24-hour Normal Swimming
Perc
enta
ge s
urvi
val a
nd s
wim
min
g no
rmal
ity
Esfenvalerate concentration (μg.L-1)
**
*
*
**
*
**
*
a.
b.
*
(LC50 = 0.19 μg.L-1)
(EC50 = 0.04 μg.L-1)
(EC50 = 0.38 μg.L-1)
(LC50 = 0.24 μg.L-1)
(EC50 = 0.11 μg.L-1)
(EC50 = 0.13 μg.L-1)
0
20
40
60
80
100
0.00 0.10 0.20 0.30 0.40 0.50
4-hour Survival
24-hour Survival
4-hour Normal Swimming
24-hour Normal Swimming
0
20
40
60
80
100
0.00 0.10 0.20 0.30 0.40 0.50
4-hour Survival
24-hour Survival
4-hour Normal Swimming
24-hour Normal Swimming
Perc
enta
ge s
urvi
val a
nd s
wim
min
g no
rmal
ity
Esfenvalerate concentration (μg.L-1)
**
*
*
**
*
**
*
a.
b.
*
(LC50 = 0.19 μg.L-1)
(EC50 = 0.04 μg.L-1)
(EC50 = 0.38 μg.L-1)
(LC50 = 0.24 μg.L-1)
(EC50 = 0.11 μg.L-1)
(EC50 = 0.13 μg.L-1)
Page 4 of 18(page number not for citation purposes)

Page
5 o
f 18
(pag
e nu
mbe
r not
for c
itatio
n pu
rpos
es)
re as identified by microarray analyses.
Fold Change (+/-)
P-VALUE (or cut-off)
1.3277 0.0625 **
1.2252 0.0029
1.1884 0.0044
1.1876 0.0003
1.1720 0.0046
1.1607 0.0021
1.1368 0.0090
1.1196 0.0082
1.0860 0.0059
-1.0841 0.0045
-1.0878 0.0030
-1.1419 0.0074
-1.1675 0.0033
-1.2019 0.0625 *
-1.2121 0.0020
-1.2547 0.0625 *
-1.2602 0.0625 *
-1.3905 0.0625 *
1.2897 0.0041
1.1769 0.0003
-1.1727 0.0625 *
-1.1939 0.0625 *
-1.1945 0.0625 *
-1.1995 0.0034
-1.2245 0.0625 *
-1.2298 0.0625 *
-1.2600 0.0052
-1.2652 0.0625 *
-1.3981 0.0013
1.1235 0.0082
1.0898 0.0069
-1.0647 0.0022
BM
C G
enom
ics
2009
, 10:
608
http
://w
ww
.bio
med
cent
ral.c
om/1
471-
2164
/10/
608
Table 1: Classification of differential gene expression of esfenvalerate responding genes in 52-d old H. transpacificus following 24 h exposu
BLASTX top hit Species match Accession No. Score E-value Concentration
Neuromuscular
titin a Danio rerio ABG48500 110 4.00E-23 0.0625
smooth muscle cell-specific protein SM22 alpha Epinephelus coioides ABW04145 349 1.00E-94 0.1250
toxin-1 Oncorhynchus mykiss AAM21198 116 5.00E-25 0.1250
thymosin beta-12 Lateolabrax japonicus P33248 80 2.00E-13 0.1250
similar to 19.9 kD myosin light chain isoform 1 Danio rerio XP_685183 332 1.00E-89 0.1250
ictacalcin Ictalurus punctatus AAY86967 145 1.00E-33 0.1250
tropomyosin Theragra chalcogramma BAC44994 281 2.00E-74 0.1250
N-acylsphingosine amidohydrolase Takifugu rubripes AAM43813 367 e-100 0.1250
alanine-glyoxylate aminotransferase Platichthys flesus CAH59400 345 2.00E-93 0.1250
titin b Danio rerio ABG48499 65 5.00E-09 0.1250
alpha-2,8-polysialyltransferase IV Oncorhynchus mykiss BAC77411 70 1.00E-10 0.1250
hedgehog acyltransferase-like, a Danio rerio NP_957181 295 1.00E-78 0.1250
parvalbumin Cyprinus carpio CAC83659 173 7.00E-42 0.1250
BTEB transcription factor Pimephales promelas ABO28528 107 1.00E-21 0.0625
myosin regulatory light chain 2 Salmo salar CAD89610 330 7.00E-89 0.1250
similar to Clca1 protein Danio rerio XP_694323 198 2.00E-49 0.0625
ependymin Perca flavescens ABU49423 168 2.00E-40 0.0625
aspartoacylase Danio rerio NP_001103573 384 e-105 0.0625
Immune
carboxypeptidase B Paralichthys olivaceus BAC53789 365 2.00E-99 0.1250
fish-egg lectin (FEL) Cyprinus carpio P68512 192 2.00E-47 0.1250
procathepsin B Oncorhynchus mykiss AAK69705 346 1.00E-93 0.0625
gamma-glutamyl hydrolase Danio rerio NP_998487 223 6.00E-57 0.0625
membrane glycoprotein Human coronavirus ABD75532 53 1.00E-05 0.0625
beta-2 microglobulin Salmo salar AAG17525 176 8.00E-43 0.1250
microtubule-associated protein 1 light chain 3 alpha Danio rerio NP_999904 238 3.00E-61 0.0625
microtubule-associated protein, RP/EB family, member Danio rerio NP_998805 272 1.00E-71 0.0625
T-cell receptor beta chain ANA 11, putative Brugia malayi EDP38115 63 2.00E-08 0.1250
glycerophosphodiester phosphodiesterase domain containing 1 Danio rerio NP_001004118 322 2E-86 0.0625
CHK1 checkpoint homolog Xenopus tropicalis CAJ83813 92 2.00E-17 0.1250
Apoptosis
tissue inhibitor of metalloproteinase 2 Oncorhynchus mykiss AAU14867 265 3.00E-69 0.1250
cathepsin H Danio rerio NP_997853 300 5.00E-80 0.1250
caspase-3 Dicentrarchus labrax ABC70996 223 6.00E-68 0.1250

Page
6 o
f 18
(pag
e nu
mbe
r not
for c
itatio
n pu
rpos
es)
-1.1270 0.0061
-1.1507 0.0047
1.3333 0.0042
1.2968 0.0052
1.1769 0.0080
1.1543 0.0036
-1.1340 0.0073
-1.2429 0.0625 *
-1.1388 0.0072
-1.1568 0.0625 *
-1.2321 0.0625 *
-1.1053 0.0021
1.4959 0.0056
1.4211 0.0095
1.3204 0.0025
1.1297 0.0021
-1.0618 0.0097
nding to both 0.0625 and 0.125 μg.L1 esfenvalerate. e applied microarray.
e as identified by microarray analyses. (Continued)
BM
C G
enom
ics
2009
, 10:
608
http
://w
ww
.bio
med
cent
ral.c
om/1
471-
2164
/10/
608
caspase-1 Dicentrarchus labrax ABB05054 79 3.00E-13 0.1250
cathepsin S-like Oncorhynchus mykiss AAV32964 291 1.00E-77 0.1250
Redox and metal ion binding
hydroxymethylbilane synthase Danio rerio CAM15096 369 e-101 0.1250
hemopexin Danio rerio NP_001104617 313 2.00E-83 0.1250
transferrin Salvelinus fontinalis BAA84100 326 1.00E-87 0.1250
similar to leprecan-like 1 protein Danio rerio XP_695073 183 1.00E-44 0.1250
similar to synaptic glycoprotein SC2 Danio rerio XP_693420 430 e-119 0.1250
similar to LOC407663 protein Danio rerio XP_698537 124 6.00E-27 0.0625
Growth and development
yghl1 (Putative growth hormone like protein-1) Seriola quinqueradiata BAB62526 153 1.00E-35 0.1250
ZPA domain containing protein Oryzias latipes NP_001098216 168 3.00E-40 0.0625
Detoxification
pregnane × receptor Oncorhynchus mykiss ABP38412 206 2.00E-51 0.0625
Osmotic stress
hyperosmotic glycine rich protein Salmo salar AAO32675 134 8.00E-30 0.1250
Digestion
similar to Apoa4 protein isoform 2 (Apolipoprotein) Danio rerio XP_698920 296 7.00E-79 0.1250
chymotrypsinogen 2-like protein Sparus aurata AAT45254 460 e-128 0.1250
pancreatic carboxypeptidase A1 precursor copy 2 Tetraodon nigroviridis AAR16321 242 9.00E-63 0.1250
pancreatic protein with two somatomedin B domains Paralichthys olivaceus BAA88246 214 e-100 0.1250
chitinase (Zgc:55941) Danio rerio AAH44549 369 e-100 0.1250
Genes selected for quantitative PCR analyses are shown in bold. * indicates genes responding at 0.0625 μg.L-1 esfenvalerate and ** indicates gene respoRemaining genes responded only at 0.125 μg.L1 esfenvalerate exposure. Information represents proportions of a limited number of available genes on th
Table 1: Classification of differential gene expression of esfenvalerate responding genes in 52-d old H. transpacificus following 24 h exposur

BMC Genomics 2009, 10:608 http://www.biomedcentral.com/1471-2164/10/608
sented by genes coding for pancreatic enzymes, a zonapellucida protein; inferred to be choriogenin, and agrowth hormone.
A selected group of genes, highlighted in bold in the genelist in table 1, were validated using q-PCR and furtherinvestigated for use as molecular biomarkers. Theseresults are described below, in conjunction with differen-tially expressed genes identified through microarray appli-cation.
Specific effects of esfenvalerate exposure on gene expressionPyrethroid insecticides are known sodium and potassiumchannel modulators [25], with axon demyelinating effects[27]. This the proof-of-principle microarray assessment ofesfenvalerate exposure of 52-d old delta smelt, was suc-
cessfully used to screen for, and further understand itsmode of action, identifying neuromuscular responses,that were confirmed as highly significant through qPCR,corroborating known effects of this pesticide, but alsopointing at other significant effects upon growth anddevelopment, digestion and the immune system. Geneexpression assessed by qPCR on 10-d old delta smelt thatverified these genomic responses are presented below.Correlations in expression between q-PCR investigatedgenes are shown in table 2 and fold changes in geneexpression are summarized in figure 3 and table 3.
i. Neuromuscular responsesParvalbumin expression in 10 d old larvae was induced1.8-fold (t-test, p = 0.008) at 0.0313 μg.L-1 esfenvalerate,reducing in expression at higher concentrations. Localizedin fast-contracting muscles, some endocrine tissues, in the
Functional classification of gene expressionFigure 2Functional classification of gene expression. Functional classification of genes responding to esfenvalerate exposure (0.0625 and 0.125 μg.L-1) in 52-d old delta smelt. Percentages were calculated based on function and biological processes of 94 unique differentially expressed genes.
Redox and iron binding
6%Various cellular processes
49%
Digestion5%
Apoptosis5%
Growth and development
2%
Neuromuscular19%
Detoxification1%Immune response
12%
Osmotic stress1%
Page 7 of 18(page number not for citation purposes)

BMC Genomics 2009, 10:608 http://www.biomedcentral.com/1471-2164/10/608
nervous system in GABAergic interneurons and in thebrain [33], parvalbumin removes calcium from myofi-brils, protecting neurons from hyper-excitability and facil-itating muscle relaxation [34]. Accumulation of calciumin muscular tissue contributes to muscle degradation,muscular dystrophy and muscle fiber necrosis [35]. Estro-gen is required for parvalbumin expression, thus estrogenreceptor-β co-expresses with parvalbumin [36]. Estrogenis also required in brain development and has a protectiveneurological role, by regulating the activity of GABAergicsystems within the hippocampus, basal forebrain and
hypothalamus [37]. Differential expression of parvalbu-min on exposure to esfenvalerate may be resultant ofestrogenic effects. Pyrethroid pesticides have steroidreceptor-binding activity [38] linked with endocrine dis-ruption [39], thus exposure is likely to affect the popula-tion dynamics of wildlife not only throughneuromuscular impairments, but also by affecting repro-ductive output [29,40]. Parvalbumin, could therefore, bea good indicator of possible endocrine-disruption as wellas neuromuscular impairments.
Table 2: Pairwise correlations of gene expression in esfenvalerate exposed 10-d old delta smelt.
Aspartoacylase Titin a Microglobulin Caspase-3 Parvalbumin Hemopexin ZPA Myozenin Creatine Kinase
PXR
Aspartoacylase 1(0)
Titin a 0.490 (0.402) 1(0)
Microglobulin 0.576 (0.310) 0.954 (0.012)
1(0)
Caspase-3 0.344 (0.571) 0.919 (0.027)
0.921 (0.026) 1(0)
Parvalbumin 0.284 (0.644) 0.953 (0.012)
0.928 (0.023) 0.981 (0.003)
1(0)
Hemopexin 0.629 (0.256) 0.819 (0.090)
0.951 (0.013) 0.860 (0.061) 0.822 (0.088) 1(0)
ZPA -0.017 (0.979) 0.788 (0.113)
0.646 (0.239) 0.853 (0.066) 0.871 (0.054) 0.472 (0.422) 1(0)
Myozenin 0.309 (0.613) 0.898 (0.038)
0.949 (0.014) 0.909 (0.033)
0.943 (0.016) 0.892 (0.042)
0.677 (0.210) 1(0)
Creatine Kinase
0.255 (0.679) 0.916 (0.029)
0.865 (0.058) 0.984 (0.003)
0.978 (0.004) 0.759 (0.137) 0.932 (0.021)
0.859 (0.062)
1(0)
PXR 0.880(0.049)
0.087(0.890)
0.208(0.737)
-0.113(0.857)
-0.153(0.805)
0.307(0.616)
-0.475(0.418)
-0.038(0.952)
-0.218(0.725)
1(0)
Numbers represent correlation coefficients; r, and significance probabilities; (p), between ten selected biomarkers assessed with quantitative PCR. Bold p-values highlight significant correlations.
Table 3: Mean and standard deviations in fold changes in gene expression of ten selected biomarkers in esfenvalerate exposed, 10-d old, delta smelt, assessed by quantitative PCR.
Gene\Concentration 0.000 0.031 0.063 0.125 0.250
Aspartoacylase Mean 1.000 0.629 0.346 0.299 0.244SE 0.240 0.100 0.078 0.035 0.088
Titin Mean 1.000 1.515 0.909 0.933 0.475SE 0.529 0.198 0.095 0.192 0.096
Microglobulin Mean 1.000 1.420 0.760 0.828 0.628SE 0.404 0.127 0.104 0.154 0.221
Caspase Mean 1.000 2.024 1.136 0.818 0.670SE 0.336 0.432 0.043 0.117 0.094
Parvalbumin Mean 1.000 1.718 1.097 1.037 0.771SE 0.241 0.151 0.125 0.062 0.107
Hemopexin Mean 1.000 1.501 0.521 0.548 0.612SE 0.089 0.296 0.051 0.147 0.295
ZPA Mean 1.000 1.612 1.455 1.165 0.912SE 0.415 0.321 0.224 0.210 0.574
Myozenin Mean 1.000 1.730 0.857 1.069 0.835SE 0.212 0.205 0.121 0.093 0.188
Creatine Kinase Mean 1.000 1.799 1.265 0.968 0.750SE 0.270 0.249 0.272 0.162 0.145
PXR Mean 1.000 0.737 0.668 0.737 0.729SE 0.126 0.083 0.124 0.080 0.178
Page 8 of 18(page number not for citation purposes)

BMC Genomics 2009, 10:608 http://www.biomedcentral.com/1471-2164/10/608
Interestingly, expression of aspartoacylase (ASPA) inexposed 10-d old delta smelt larvae was significantlyaffected at all concentrations, downregulating withincreasing esfenvalerate concentration in a dose responsemanner, and correlating significantly with swimminganomaly at 24 h (r = 0.913, p = 0.029). Aspartoacylase cat-alyzes hydrolysis of N-acetyl-L-aspartate (NAA) to aspar-tate and acetate in the vertebrate brain [41]. Variations inNAA measured in urine, blood and brain, have been usedas diagnosis of nervous system diseases such as Alzhe-imer's and multiple sclerosis [42,43]. Measurements ofNAA, along with ADP levels determined by creatinekinase activity, are used to evaluate the energetic state ofthe brain, a positive linear correlation existing betweenNAA and ADP synthesis [44]. Deficiency in ASPA activityleads to degeneration of the myelin; an ensheathmentthat isolates and controls axonal activity, it is associatedwith schizophrenia [45], and is the established cause ofleukodystrophy in Canavan's disease [43]. Abnormalmyelination is known to result from acyltransferase defi-ciency [46]. Ependymin, a myelin associated glycoprotein
related to memory formation and involved in neuronalregeneration [47], was also negatively affected by esfenva-lerate. Myelin has been postulated as a probable modula-tor of ASPA activity [48] further affecting this criticalpathway of neurological function. ASPA protein activity isa strong biomarker of brain damage and neurologicalimpairment investigation, used regularly in human andveterinary disease diagnostics [49].
Creatine kinase was significantly up-regulated at 0.0313μg.L-1 esfenvalerate (t-test, p < 0.05). Creatine kinase pro-tein is used not only as a diagnosis of brain energetic valueas mentioned above, but also of diseases like cardiac inf-arction and skeletal muscle necrosis [50]. In muscle, crea-tine kinase is specifically bound to sarcoendoplasmicreticulum, and regulates calcium uptake and ATP/ADPratios [51], thus is directly involved in muscle contraction.Of interest here, are the pathway links and correlatingresponses (r = 0.98) between parvalbumin; facilitatingmuscle relaxation by binding calcium, and creatinekinase, which regulates calcium uptake. These two param-
Molecular biomarkers responsesFigure 3Molecular biomarkers responses. Fold changes in gene expression of ten selected biomarkers in esfenvalerate exposed, 10-d old, delta smelt, assessed by quantitative PCR. Significance in expression differences, as determined by One-way ANOVA, is shown in brackets in legend.
0.0
0.5
1.0
1.5
2.0
2.5
0.00 0.03 0.06 0.13 0.25
Aspartoacylase (p=0.0140)
Titin a (p=0.0858)
Microglobulin (p=0.1176)
Caspase-3 (p=0.0245)
Parvalbumin (p=0.0376)
Hemopexin (p=0.0242)
ZPA (p=0.6465)
Myozenin (p=0.0494)
Creatine Kinase (p=0.1198)
PXR (p=0.1881)
Fold
cha
nge
in g
ene
expr
essi
on
Esfenvalerate concentration (μg.L-1)
Page 9 of 18(page number not for citation purposes)

BMC Genomics 2009, 10:608 http://www.biomedcentral.com/1471-2164/10/608
eters on their own indicate muscular activity impairments,creating strong links with observed larval swimmingbehavior.
Titin expression also correlated significantly with parval-bumin (r = 0.95) and creatine kinase (r = 0.92), thoughnot statistically significant in q-PCR assessments of 10-dold smelt larvae. Titin is an important protein alsoinvolved in muscle contraction, responsible for muscleelasticity and is the molecular scaffold for thick actin fila-ment formation, forming a connection between filamentsand the muscle Z-line [52]. Myozenin, another proteininvolved in muscle contraction, was significantly influ-enced by esfenvalerate exposure (t-test, p < 0.05) in 10-dold larvae. Co-regulating with Titin (r = 0.90), myozeninis a Z-line, α-actinin- and γ-filamin-binding proteinexpressed predominantly in skeletal muscle, and has beensuggested as a biomarker for muscular dystrophy andother neuromuscular disorders [53].
ii Immune responsesIn this study we have identified a significant alteration inexpression of several genes involved in immuneresponses, most of them with links to neurological dam-age. β-microglobulin, a small protein normally found onthe surface of many cells, including lymphocytes, isknown to be involved in cell protection [54]. β-microglobulin is almost exclusively catabolized in the kid-ney and its excretion is an indication of long term neph-rotoxicity [55]. High concentrations of β-microglobulinare reported to inhibit generation of functional dendriticcells [56], thus an increased amount in the blood or urinemay be a sign of neural degeneration and of certain dis-eases, including some types of cancer, such as multiplemyeloma or lymphoma. β-microglobulin levels are alsoreported to rise following viral infection and its reducedexpression can compromise the immune system [57].Interestingly, exposure to esfenvalerate resulted in a sig-nificant increase of pathogen susceptibility in chinooksalmon [9]. β-microglobulin assessment with q-PCR didnot show any significance in expression in 10 d old larvae(t-test, p = 0.131), however, an overall increase wasobserved at low concentrations of esfenvalerate, correlat-ing significantly with expression of other genes investi-gated, further discussed below.
Multiple sclerosis is caused by an immunological attackon myelin [58], decreasing NAA and resulting in neuro-logical instability. Furthermore, oxidative stress is induc-tive of apoptosis of myelin-reactive T cells [59]. A putativeT cell receptor gene was identified through microarrayscreening, probably reacting to pyrethroid exposure, act-ing upon the myelin sheath and causing further neurolog-ical damage and cell death.
iii Apoptotic responsesCaspases (cysteine-aspartic acid protease) belong to a fam-ily of cysteine proteases that cleave other proteins, such asthe precursor forms of the inflammatory cytokines inter-leukin 1-β and interleukin 18, into active mature peptidesand are also involved in programmed cell death; or apop-tosis [60]. Enzymatic activity requires an aspartic acid res-idue, and plays a critical role in the regulation ofproinflammatory cytokines [61] that are associated withseptic shock and autoimmune syndromes [62]. Upregula-tion of proinflammatory cytokines were reported in viralinfected salmon, which further increased in expressionfollowing esfenvalerate exposure [63]. Caspases contrib-ute to the pathogenesis of neurodegenerative disorderssuch as ischemia, Krabbes and Huntington's diseases,Alzheimer's, and other leukodystrophic diseases resultingin neural degeneration [64,65]. Moreover, caspase inhibi-tors have been suggested as therapeutic treatments forneurodegenerative diseases [66]. Low concentrations ofesfenvalerate; 0.0313 μg.L-1, significantly induced cas-pase-3 expression 2-fold (t-test, p = 0.002) in 10-d olddelta smelt. As caspases are activated by aspartic acid,induction may be suggestive of increases in substrate resi-dues, along with inflammatory cytokines, probable effectsupon the immune system, and subsequent neurodegener-ation. Furthermore, a decrease in ASPA expression couldbe suggestive of reduced breakdown of NNA to aspartateand acetate, required as substrate for caspase activity, andsynthesis of proteins required in repair mechanisms.
iv. Redox and metal ion bindingUpregulation of hemopexin was confirmed by quantita-tive PCR in 10-d old delta smelt exposed to 0.0313 μg.L-1
esfenvalerate. Hemopexin-like protein, a gene sequencedisplaying vast similarities to warm-temperature-acclima-tion-related-65 protein (WAP65) on BLAST homologieswith Japanese medaka (Oryzias latipes), was identified assignificantly upregulated through microarray screening.Hemopexin is synthesized by Schwann cells followingnerve injury [67], accumulation has been reported in theperipheral nervous system following axonal lesions, andis specifically regulated during repair, returning to normallevels on axonal regeneration [68]. Wallerian degenera-tion occurs after axonal injury and is critical for repair, itis characterized by axonal and myelin degeneration [69],is accompanied by macrophage invasion and subsequentsynthesis of hemopexin [67]. Hemopexin appears to playa significant role in neural regeneration, but may beresultant of oxidative stress mediated T cell activity onmyelin sheaths (described above, under immuneresponses). Though upregulation follows nerve injury andthere are strong connections with apoptosis, we classifyhemopexin under oxidative stress as it has a high affinitywith heme and reportedly plays a strong role in bothheme transport and preventing heme-catalyzed oxidative
Page 10 of 18(page number not for citation purposes)

BMC Genomics 2009, 10:608 http://www.biomedcentral.com/1471-2164/10/608
damage [70]. Moreover, pyrethroids have been shown togenerate free radicals and induce oxidative stress [71].Heme is known to respond to nerve injury, and has beensuggested to play a role in neurodegenerative disorders[72], and hemopexin-mediated heme transport wasreported to significantly decrease levels of transferrinreceptor mRNA in HeLa cells [70]. Transferrin was alsoidentified by microarray screening as significantly upregu-lated by esfenvalerate exposure. The primary role of trans-ferrin is the delivery of iron across the blood brain barrier,and its expression in brain is not only related to myelinproduction, but may be a permissive agent in the processof myelination [73]. Furthermore, hemopexin and trans-ferrin reportedly act by similar receptor-mediated mecha-nisms [74].
v. Growth and developmentMicroarray analyses identified a gene with high homologyto egg envelope glycoproteins within the zona pellucida(ZPA) referred to as choriogenins, in fish [75]. This wassignificantly expressed in 52-d old larvae, however, no sta-tistical differences in expression of ZPA were measuredwith qPCR in 10-d old larvae exposed to esfenvalerate.Choriogenin is reportedly more sensitive to endocrine dis-rupting chemicals (EDCs) than estrogen receptors andvitellogenin [76]. Composed primarily of glycoproteinswith various functions during fertilization and develop-ment, choriogenin has been suggested as a biomarker ofexposure to endocrine disrupting chemicals, as it isinduced in late stage embryos, larvae and adult male fishexposed to estrogens [76,77]. Choriogenin is synthesizedin liver of adult females, in response to estrogen, trans-ported in blood and incorporated into the fish egg enve-lope; chorion or zona pellucida (ZPA), an extracellularmatrix that surrounds the oocyte and early embryo [78].Expression was notably elevated at low pyrethroid con-centration, and it responded in a similar fashion to creat-ine kinase (r = 0.93), though no significant links wereidentified between these two biomarkers.
vi. DetoxificationPregnane × receptor (PXR), involved in the detection oftoxic substances and a key regulator of xenobiotic metab-olism, was identified through microarray assessments, asdownregulated in 52-d old larvae. PXR is a steroid recep-tor and transcriptional regulator of detoxification mecha-nisms such as cytochrome oxidases, and phase IIconjugating enzymes such as glutathione-S-tranferases[79,80]. Downregulation of PXR expression has beenlinked with growth inhibition and cell death in rats andhuman cell lines following exposure to medroxyproges-terone and estradiol, known PXR ligands [80], furthersupporting identified apoptotic responses, steroid recep-tor-binding and endocrine disruption activity of esfenva-lerate [38,39]. PXR expression was not significantly
different in q-PCR assessments of 10-d old larvae exposedto esfenvalerate, however, overall expression declined in adose response manner, correlating with ASPA (r = 0.880;p = 0.049), making it a notable candidate of xenobioticdetection for future biomarker investigations in the deltasmelt.
vii Osmotic StressA hyperosmotic glycine rich protein was identified withthe microarrays as significantly downregulated by expo-sure to 0.0625 μg.L-1 esfenvalerate in 52-d old larvae.Osmoregulation is physiologically controlled by chemicalmessages from the endocrine system, along with cell sig-nalling and nerve transmission [81]. Pyrethroids havebeen suggested to induce osmotic imbalances in commoncarp larvae [82] which are linked to effects on ATPaseactivity responsible for maintaining the Sodium trans-membrane electrochemical gradient [83]. Larval fish areunder direct exposure to osmotic stress as their endocrinesystem is not fully developed [84]. Parvalbumin and cho-riogenin expression have indicated possible effects on theendocrine system, thus expression of this hyperosmoticglycine rich protein may be directly caused by conditionsaffecting endocrine regulation.
viii DigestionChitinase was identified through microarray analysis asbeing downregulated by esfenvalerate exposure. Chitinaseis the principal enzyme involved in digesting chitin, amajor component of insect and crustacean exoskeleton[85]. Larval smelt were fed on artemia during the pre-exposure acclimation period. Not only chitinase but,other digestive enzymes; apolipoproteins, pancreaticenzymes, carboxypeptidase precursors and chemot-rypsinogen, were also significantly upregulated followingexposure in 52-d old larvae. Effects on digestion alone willundoubtedly have significant effects on growth, whichwhen combined with hypothesized feeding reductionresulting from impaired swimming would lead to signifi-cant malnutrition. Contaminants affect a whole ecosys-tem, at all levels, and dramatic reductions in copepods,cladoceran and amphipod populations; organisms pre-dated upon by the delta smelt, have been reported in theSacramento delta [86]. Scarcity in food and reduced inges-tion ability, besides digestion will significantly affect pop-ulation dynamics of any specie.
ConclusionsMicroarray technology was used as an initial screening ofprobable genes responding to esfenvalerate exposuretherefore no multiple testing correction was applied. Wehave, however, examined and confirmed effect of esfenva-lerate upon some of the genes in a different age group oflarval delta smelt, identifying significant responses thatare primarily linked with swimming behavior. Some
Page 11 of 18(page number not for citation purposes)

BMC Genomics 2009, 10:608 http://www.biomedcentral.com/1471-2164/10/608
responding genes can be classified within different func-tional groups. Due to the measured behavioral responses,the classification approach contains a certain bias towardsunderstanding neuromuscular effects. It is interesting thatqPCR measurements have identified a greater response atthe lower concentrations, implying homeostatic altera-tions, at environmentally relevant concentrations. Mostgenes did not display a desired dose response correlationassociated with usable biomarkers, but did supportresponses within the suite of genes investigated, some-what validating their use within a broader biomarkerapproach. Hemopexin for example is known to beinvolved in axon repair, and the myelin sheath surround-ing the axon needs to be degraded for this repair to beprocessed, hypothesizing therefore that ASPA downregu-lation is resultant of neurological damage. The subse-quent decrease of hemopexin expression at higherexposure concentrations, and further decrease in ASPA,may be indicative of repair impairments.
What becomes apparent from this study is that exposureto sublethal concentrations of esfenvalerate results in neu-rological damage and a series of compensatory molecularresponses that attempt to repair nerve damage. We wouldhypothesize that induction of transcription of the genesencoding ASPA, hemopexin, parvalbumin and creatinekinase are part of a pathway of damage triggered repairmechanisms, responding to esfenvalerate insult. Reduc-tion in expression of ASPA indicates that myelin sheathsmay be degraded, resulting in a number of detrimentaleffects on the lesion sites, and similarly, muscular struc-ture and function is being compromised as measured byalterations in titin and myozenin expression. The expres-sion of β-microglobulins could be a compensatory reac-tion to toxic damage, protecting cells from infections in asusceptible immune system caused by exposure to esfen-valerate. Previous studies, carried out in esfenvalerateexposed chinook salmon have reported a compromisedimmunity and significantly higher susceptibility to infec-tion [9,63]. This is particularly important in youngerorganisms that are generally more susceptible than adults.Furthermore, polluted waters not only contain mixturesof contaminants, but also harbor multiple pathogens thatwill further affect health parameters.
Behavioral endpoints, such as swimming behavior, areamongst the most sensitive and ecologically relevantparameters to assess sublethal toxicity of neurotoxicchemicals [29]. The high susceptibility of delta smelt toesfenvalerate, mediated neurological damage resulting inimpaired swimming ability, also raises questions on thelikely effects upon their chemosensory system; olfactorysystem, important in sensing reproductive pheromones,mediating reproduction. Females synthesize sex hor-mones stimulating male reproductive behavior [87]. Neu-
rological damage affecting the olfactory nerves, the brainand or entire nervous system, could lead to further impair-ments in reproductive success following exposure to pyre-throids. Damage to the olfactory system has been used asa sublethal toxicological endpoint in fish, in studies inves-tigating behavior following pesticide exposures [88]. Pyre-throids are known to affect the olfactory system [89]. Achemosensory gene, ictacalcin, responding to esfenvaler-ate exposure was also differentially expressed on themicroarray. Ictacalcin is a gene originally identified in cat-fish (Ictalurus punctatus), involved in chemosensory tis-sues, and highly expressed in barbell, olfactory mucosaand gill [90]. Differential expression of this gene mayindicate that further behavioral parameters, not investi-gated in this study, such as recognition, alarm response,feeding, imprinting and homing, gamete release and syn-chronization, contaminant avoidance [88], and otherbehavioral parameters that are governed by chemosensorysystem, could be compromised. We could speculate thatoutside laboratory conditions, neuromuscular and chem-osensory impairments would probably result in higherecological parameters being affected through inability toswim against water currents, making them more suscepti-ble to predation and reducing their ability to obtain food.Furthermore, effects on chemosensory parameters wouldlead to migratory, reproductive, predator and contami-nant avoidance impairments.
Inhibition of repair mechanisms, leading to neuromuscu-lar damage and eventual death, was behaviorally observedthroughout exposure, as impairment in swimming ability.The ability to use molecular biomarkers of neuromusculareffect further strengthens links between mechanisticeffects with parameters of ecological relevance. Our studysupports the use of gene expression as a productive way ofunderstanding modes of actions of individual chemicalsin endangered species. Furthermore, this screening andinterrogative approach permits the identification anddevelopment of biomarkers for species of concern inwhich prior information is limited and allows for investi-gations into problems specific to the organism in ques-tion; assessing possible causes of detrimental effects andresulting influences on individual performance andhypothesizing effects upon population dynamics. A suiteof biomarkers developed in this manner, though addi-tions and subtractions are required from the presentedlist, could be used to aid monitor impacts of stressorsupon organisms within a specific environment and couldbe an essential tool in determining causative factors ofpopulation decline in the delta smelt and other threat-ened species. The selected biomarkers clearly need to befurther investigated and validated against other knowncontaminants, and suitability in field applications.
Page 12 of 18(page number not for citation purposes)

BMC Genomics 2009, 10:608 http://www.biomedcentral.com/1471-2164/10/608
MethodsMicroarray constructionWe constructed a delta smelt microarray using 8448 PCRamplified fragments from a normalized cDNA library. AcDNA library was created using expressed sequence tags(ESTs) ligated into p-BS plasmid vectors and cloned intochemically competent Escherichia coli cells (BioS&T Inc,Montreal, Quebec, Canada). RNA for library constructionwas obtained from a number of larval, juvenile and adultdelta smelt, ranging from unexposed, control conditions,to fish from exposures to high temperature (25°C), andsublethal concentrations of copper, esfenvalerate, and asix field water samples from throughout the Sacramento-San Joaquin estuary. Products were PCR amplified from 1μl bacterial suspension, and visualized on agarose gels.Purified PCR fragments ranging in size from 1-4 kb, alongwith control spots, were pin-printed in duplicate ontoepoxysilane coated glass slides (Schott-Nexterion, USA) ina 20 × 19 block format, with 48 blocks per microarray.Microarrays were printed using a Lucidea Array Spotter(Amersham) at the Array Core facility at UC Davis (sinceclosed down). Microarray control spots included anumber of hybridization tags comprised of a pooled PCRproduct from all spots on the array, H. transpacificus DNA,and four Spot Report System of alien PCR products fromArabidopsis thaliana; CAB, RCA, RBCL and LPT4 (Strata-gene, USA). Blank control spots consisted of 1× Nexterionbuffer solution.
Esfenvalerate exposuresDelta smelt larvae aged 10 d and 52 d were exposed for 24h, in two separate experiments, to a range of esfenvalerateconcentrations; 0.0313, 0.0625, 0.125, 0.250 and 0.500μg.L-1 (nominal) in laboratory control water, with corre-sponding laboratory and solvent controls. Concentrationswere measured at the start of the experiment by the WaterPollution Control Laboratory at the Department of Fishand Game (Rancho Cordova, California, USA), only sin-gle measurements were taken per treatment (results notshown), therefore we present the data in terms of nominalconcentrations. Laboratory control water consisted ofdeionized water amended to US EPA moderately hardstandards (80-100 mg.L-1 CaCO3) and 200 μl/L methanolwas used as solvent carrier. Salinity was adjusted withInstant Ocean salt to match hatchery rearing conditions(range 650 μS.cm-1 to 900 μS.cm-1).
Average wet weights of 10-d to 52-d old larval delta smeltranged from 0.5 to 2.5 mg respectively. Larvae wereobtained from the Fish Conservation and Culture Labora-tory (FCCL) UC Davis, Byron, CA, transported in cool,oxygenated 2-gallon black buckets, and held overnight inthe laboratory at 17°C and a 8 h:16 h D:L light cycle. Thefollowing day, ten larvae were transferred to each 2-Lbeaker containing 1 L of aerated control water or esfenva-
lerate treatment. Each treatment consisted of 4 replicatesand tests were performed at 8 h:16 h D:L cycle, at a watertemperature of 17°C ± 1.2°C. The pH during the tests was7.1 - 7.5. Dissolved oxygen levels were within the accept-able range for delta smelt (above 6.5 mg.L-1)[91]. Larvaewere fed rotifers the day before the test start, but not dur-ing the 24 h exposure. Rotifer cultures were obtained fromFCCL. During exposure, larvae were observed for aberrantswimming behavior, and surviving fish were scored after4 h and 24 h. Swimming behavior was assessed by observ-ing each tank for 5 min as described in Geist et. al. [17].Any pronounced deviation (> 1 min) from normal (con-trol) swimming patterns were recorded as abnormal.Effects on swimming performance (EC50) and mortality(LC50) were assessed using linear regression analysis withEnvironmental Toxicity Information System (CETIS) byTidepool Scientific Software (McKinleyville, CA, USA).
Four surviving 52 d old larvae from solvent controls, andexposures to 0.0625 and 0.125 μg.L-1 esfenvalerate, wereused for microarray analyses, hybridized in a referencedesign against a pool of RNA from all treatments. Fourreplicate 10 d old larvae from each treatment (controlsand 0.0312, 0.0625, 0.125 μg.L-1 esfenvalerate) were usedfor biomarker analyses and gene expression verificationusing quantitative PCR (q-PCR).
All experiments and use of test organisms were approvedby the UC Davis Institutional Animal Care and Use Com-mittee (Animal Use Protocol for Animal Care and Use#13361). This institution is accredited by the Associationfor Assessment and Accreditation of Laboratory AnimalCare, International (AAALAC) and has an Animal WelfareAssurance on file with the Office of Laboratory AnimalWelfare (OLAW). The Assurance Number is A3433-01.The IACUC is constituted in accordance with U.S. PublicHealth Service (PHS) Animal Welfare Policy and includesa member of the public and a non-scientist.
RNA isolation, cDNA synthesis and fluorescence labelingRNA was extracted from whole, individual organismsusing a standard phenol:chloroform protocol with TrizolReagent (Invitrogen). Fifteen micrograms of total RNAwere used for cDNA synthesis, spiked with control RNA(CAB, RCA, RBCL and LTP4 (SpotReport, Stratagene) andlabeled with Alexa fluor dyes, using SuperScript™ PlusIndirect cDNA labeling System (Invitrogen). Each experi-mental sample and control was combined with a refer-ence pool cDNA prior to hybridization using anautomated Tecan HS4800 hybridization station. Slideswere scanned using a GenePix 4000B scanner (AxonInstruments).
Microarray images and data from esfenvalerate exposeddelta smelt can be accessed at http://www.vet
Page 13 of 18(page number not for citation purposes)

BMC Genomics 2009, 10:608 http://www.biomedcentral.com/1471-2164/10/608
med.ucdavis.edu/apc/WernerLab/subpagpelagic_organism_decline.html; POD archivedata.
Microarray AnalysesNormalization and analytical methods are described inLoguinov et. al. [32] and Smyth [92]. In brief, print tipnormalization was carried out within slides and sequen-tial single slide data analysis was carried out as an alterna-tive to between-slide normalization. An α-outlier-generating model was used to identify differentiallyexpressed genes by applying the following decision rulefor multiple-slide data analysis: a given gene was selectedas a candidate if it was detected as significantly up- ordownregulated in 4 of 4 replicates (raw p-value = 0.0625using exact binomial test and considering outcomes asBernoulli trials). The approach did not use scale estimatorfor statistical inference and, therefore, it did not requirebetween-slide normalization. This method however,detected only one significant differentially expressed can-didate gene at the highest exposure concentration (0.125μg/L-1), (with no significant annotation identity - seeresults and discussion). As a result, a second analyticalmethod was applied to increase the number of probablegenes for consideration in biomarker development. Thuswe further analyzed the data using LIMMA GUI (Linearmodel for microarray analysis graphical user interface)[92], written in the R-programming language availablethrough Bioconductor http://www.Bioconductor.org.Data was normalized within arrays using print-tip Lowessand between arrays applying aquantile normalizationmethods [92]. A linear model fit was computed using the
duplicates on the arrays and the least-squares method, nomultiple assessment methods were applied to eliminatefalse positives as our aim was to increase the number ofgenes available for biomarker assessment, and qualifythese through quantitative PCR.
Sequencing and AnnotationSequencing was carried out at the CA&ES Genomic Facil-ity, UC Davis. Basic Local Alignment Search Tool; trans-lated nucleotide (BLASTx) searches were performed onspecific fragments that responded significantly to theexposure treatments. Only genes that were differentiallyexpressed following esfenvalerate exposure weresequenced. Sequences were annotated according tohomologies to protein database searches using translatednucleotide sequences and direct nucleotide queries http://blast.ncbi.nlm.nih.gov/Blast.cgi. Sequences were onlyannotated if they were found to have a BLASTx match withthe expect value smaller than 1 × 10⁻⁵ and a score above50.
Functional ClassificationsDifferentially expressed genes were classified according togene ontology http://www.uniprot.org/uniprot, andinformation gathered from literature, into functionalgroups. Classification was carried out based on geneexpression changes in respect of control subjects, regard-less of whether these were up or downregulated, or expo-sure concentrations. Specific genes of interest wereselected for further investigation using quantitative PCR.
Table 4: Primers and probes used for molecular biomarkers: Primer pairs and TaqMan probes used in q-PCR assessments.
Accession no. Gene Primer Sequences Probe No.
FJ711577 Aspartoacylase Left: ggaggcacacatgggaatg 109Right: cttcctctgaatctctgttccattatc
FJ711576 Parvalbumin Left: gaccaagacaagagtggcttca 101Right: tctggcaccagcagagaagtt
FJ711580 β-2 microglobulin Left: tctttcgcggtcatctttctc 22Right: ggttgtggccatacacctgaa
FJ711579 Hemopexin Left: catgcactacgaggacgacaag 143Right: tggtagtagctgaacaccttgctg
FJ711578 Caspase-3 Left: gagaaccggtatgaaccaacg 159Right: tccaagcttcccaaacactttc
FJ711575 Titin a Left: tgatcactggcgtgaaagagg 159Right: caagctcattggacagtttgagg
FJ711581 ZPA Left: catgcggctgagtttggataa 106Right: tgccattgatagcatcaacttca
FJ711583 Myozenin* Left: ccaatgtcgtgctggtacacc 106Right: ctgccagacattgatgtagcca
FJ711584 Creatine kinase* Left: cgatcggcgttggagatg 163Right: gccaagttcaacgagattctgg
FJ711582 PXR Left: tgaggcggtggagaagag 144Right: gaggcggtggagaagag
* indicates biomarkers obtained from preliminary studies carried out during microarray development.
Page 14 of 18(page number not for citation purposes)

BMC Genomics 2009, 10:608 http://www.biomedcentral.com/1471-2164/10/608
Biomarker developmentGenes were selected according to level of expression sig-nificance, knowledge base from literature, and functionalclassification. Primer and probes for qPCR analyses weredesigned using Roche Universal Probe Library AssayDesign Center https://www.roche-applied-science.com.Designed primers were obtained from Eurofins MWGOperon http://www.eurofinsdna.com, and TaqManprobes were supplied by Roche. Sequences for all genesassessed by qPCR analyses have been submitted to gen-bank http://www.ncbi.nlm.nih.gov. Primers and probes,and genbank accession numbers, for investigated biomar-kers are detailed in table 4. Myozenin and creatine kinase,though not resulting from the current study, were genesidentified in investigations carried out during microarraydevelopment, and added to the selected biomarkers dueto our interest in neuromuscular activity.
Quantitative PCRA total of 1.5 μg RNA was cDNA synthesized using ran-dom primers, and diluted to a total of 50 μl with nucleasefree water to generate sufficient template for qPCR analy-sis. TaqMan Universal PCR Mastermix (Applied Biosys-tems) was used in q-PCR amplifications in a reactioncontaining 10mMTris-HCl (pH 8.3), 50 mM KCl, 5 mMMgCl2, 2.5 mM deoxynucleotide triphosphates, 0.625 UAmpliTaq Gold DNA polymerase per reaction, 0.25 UAmpErase UNG per reaction and 5 μL of cDNA sample ina final volume of 12 μL. The samples were placed in 384well plates and cDNA was amplified in an automatedfluorometer (ABI PRISM 7900 Sequence Detection Sys-tem, Applied Biosystems). Amplification conditions were2 min at 50°C, 10 min at 95°C, 40 cycles of 15 s at 95°Cand 60 s at 60°C. Fluorescence of samples was measuredevery 7 s and signals were considered positive if fluores-cence intensity exceeded 10 times the standard deviationof the baseline fluorescence (threshold cycle, CT). SDS2.2.1 software (Applied Biosystems) was used to quantifytranscription.
Quantitative PCR data was analyzed using the relativequantification 2(-Delta Delta CT) method ()([93]. In theabsence of house keeping genes, expression was calcu-lated relative to the mean of controls in respective expo-sures. Surviving larvae from each replicate of the 10-d oldexposed delta smelt were used for q-PCR analyses. One-way ANOVA was used to assess differences in gene expres-sion through out the exposure concentrations, and datawere further assessed using Student's T-test at individualconcentrations in respect to solvent controls.
AbbreviationsEST: expressed sequence tag; q-PCR: real-time quantitativepolymerase chain reaction; ASPA: aspartoacylase; ESA:endangered species act; CESA: California endangered spe-
cies act; LIMMA GUI: linear model for microarray analy-sis, graphical user interface; BLAST: basic local alignmentsearch tool; GABA: gamma-aminobutyric acid; NAA: N-acetyl-L-aspartate; ADP: adenosine diphosphate; WAP65:warm-temperature-acclimation-related-65 protein; EDC:endocrine disrupting chemical; ZPA: zona pellucida; PXR:pregnane × receptor; p-BS: p-Bluescript; IPTG: isopropylβ-galactosidase; LB: Luria Bertani; FCCL: Fish Conserva-tion and Culture Laboratory; UNG: Uracil N-glycosylase;CT: cycle threshold.
Authors' contributionsAll authors were involved in designing the experiments.JG carried out esfenvalerate exposures recording swim-ming abnormality and mortality. REC designed, devel-oped and applied the microarrays with assistance from JPand HW. REC and JP prepared, hybridized and scannedmicroarrays. REC and AVL performed microarray analy-ses. REC and LSD designed qPCR assays and performedrespective assessments and analysis. REC drafted the man-uscript and all authors read, contributed intellectually andapproved the final manuscript.
AcknowledgementsWe thank E. Campbell, UC Davis, for assistance with the microarray devel-opment, J. Lindberg and B. Baskerville-Bridges (FCCL) for supplying delta smelt along with invaluable knowledge on culture and handling. UC Davis ATL was used for all exposure tests; we thank all staff for assistance. Fund-ing provided by the Interagency Ecological Program, Sacramento, California (Contract No. 4600004445 to I. Werner).
References1. Bryant M, Souza K: Summer townet and fall midwater trawl
survey status and trends. Interagency Ecological Program Newsletter2004, 17:14-17.
2. Hieb K, Bryant M, Souza K, Greiner T, Slater S: Place holder forbay and estuary species 2004 status and trends report. Inter-agency Ecological Program Newsletter 2005, 18:6-10.
3. Feyrer F, Nobriga ML, Sommer TR: Multidecal trends for threedeclining fish species: habitat patterns and mechanisms inthe San Francisco Estuary, California, USA. Journal of Fisheriesand Aquatic Sciences 2007, 64:723-734.
4. Brown LR, Kimmerer W, Brown R: Managing water to protectfish: a review of California's Environmental Water Account,2001-2005. Environmental management 2009, 43(2):357-368.
5. Sommer T, Armor C, Baxter R, Breuer R, Brown L, Chotkowski M,Culberson S, Feyerer F, Gingras M, Herbold B, et al.: The collapseof pelagic fishes in the upper san francisco estuary. Fisheries2007, 32(6):270-277.
6. Scholz NL, Truelove NK, French BL, Berejikian BA, Quinn TP, CasillasE, Collier TK: Diazinon disrupts antipredator and homingbehaviors in chinook salmon (Oncorhynchus tshawytscha).Canadian Journal of Fisheries and Aquatic Sciences 2000, 57:1911-1918.
7. de Vlaming V, Connor V, DiGiorgio C, Bailey HC, Deanovic LA, Hin-ton DE: Application of whole effluent toxicity test proceduresto ambient water quality assessment. Environmental Toxicologyand Chemistry 2000, 19(1):42-62.
8. Sandahl JF, Baldwin DH, Jenkins JJ, Scholz NL: Comparative thresh-olds for acetylcholinesterase inhibition and behavioralimpairment in coho salmon exposed to chlorpyrifos. Environ-mental toxicology and chemistry/SETAC 2005, 24(1):136-145.
9. Clifford MA, Eder KJ, Werner I, Hedrick RP: Synergistic effects ofesfenvalerate and infectious hematopoietic necrosis virus onjuvenile chinook salmon mortality. Environmental toxicology andchemistry/SETAC 2005, 24(7):1766-1772.
Page 15 of 18(page number not for citation purposes)

BMC Genomics 2009, 10:608 http://www.biomedcentral.com/1471-2164/10/608
10. Floyd EY, Geist JP, Werner I: Acute, sublethal exposure to apyrethroid insecticide alters behavior, growth, and preda-tion risk in larvae of the fathead minnow (Pimephalespromelas). Environmental toxicology and chemistry/SETAC 2008,27(8):1780-1787.
11. Rand GM: Fundamentals of Aquatic Toxicology Taylor and Francis, Bris-tol, PA; 1995.
12. U.S. EPA: Short-term Methods for Estimating the ChronicToxicity of Effluents and Receiving Waters to FreshwaterOrganisms. 4th edition. U.S. EPA OoW, Washington, DC, EPA-821-R-02-013; 2002.
13. Denslow ND, Colbourne JK, Dix D, Freedman J, Helbing C, KennedyS, Williams P: Selection of surrogate animal species for com-parative toxicogenomics. In Genomic Approaches for Cross-SpeciesExtrapolation in Toxicology Edited by: Benson WH, Di Giulio RT. Port-land, Oregon, USA: CRC Press; 2006:33-75.
14. Little EE, Calfee RD: Acute toxicity of three herbicides,DMA*41VM, Renovate 3, and Sonar A.S., to two life stagesof white sturgeon from the Kootenai River and to rainbowtrout. USGS Report: Columbia Envrionmental Research Center,Columbia, MO; 2008.
15. Little EE, Calfee RD: Toxicity of Chlorine and Copper to Rain-bow Trout and to White Sturgeon from the Kootenai Riverand Columbia River. USGS Report: Columbia EnvrionmentalResearch Center, Columbia, MO; 2008.
16. Connon R, Hooper HL, Sibly RM, Lim FL, Heckmann LH, Moore DJ,Watanabe H, Soetaert A, Cook K, Maund SJ, et al.: Linking molec-ular and population stress responses in Daphnia magnaexposed to cadmium. Environmental science & technology 2008,42(6):2181-2188.
17. Geist J, Werner I, Eder KJ, Leutenegger CM: Comparisons of tis-sue-specific transcription of stress response genes withwhole animal endpoints of adverse effect in striped bass(Morone saxatilis) following treatment with copper andesfenvalerate. Aquatic toxicology (Amsterdam, Netherlands) 2007,85(1):28-39.
18. Heckmann LH, Sibly RM, Connon R, Hooper HL, Hutchinson TH,Maund SJ, Hill CJ, Bouetard A, Callaghan A: Systems biology meetsstress ecology: linking molecular and organismal stressresponses in Daphnia magna. Genome biology 2008, 9(2):R40.
19. Denslow ND, Garcia-Reyero N, Barber DS: Fish 'n' chips: the useof microarrays for aquatic toxicology. Molecular bioSystems2007, 3(3):172-177.
20. Steinberg CE, Sturzenbaum SR, Menzel R: Genes and environment- Striking the fine balance between sophisticated biomoni-toring and true functional environmental genomics. The Sci-ence of the total environment 2008, 400(1-3):142-161.
21. Soetaert A, Vandenbrouck T, Ven K van der, Maras M, van RemortelP, Blust R, De Coen WM: Molecular responses during cad-mium-induced stress in Daphnia magna: integration of dif-ferential gene expression with higher-level effects. Aquatictoxicology (Amsterdam, Netherlands) 2007, 83(3):212-222.
22. Poynton HC, Varshavsky JR, Chang B, Cavigiolio G, Chan S, HolmanPS, Loguinov AV, Bauer DJ, Komachi K, Theil EC, et al.: Daphniamagna ecotoxicogenomics provides mechanistic insightsinto metal toxicity. Environmental science & technology 2007,41(3):1044-1050.
23. Ahluwalia A, Clodfelter KH, Waxman DJ: Sexual dimorphism ofrat liver gene expression: regulatory role of growth hor-mone revealed by deoxyribonucleic Acid microarray analy-sis. Molecular endocrinology (Baltimore, Md) 2004, 18(3):747-760.
24. Ilves KL, Taylor EB: Molecular resolution of the systematics ofa problematic group of fishes (Teleostei: Osmeridae) andevidence for morphological homoplasy. Molecular phylogeneticsand evolution 2009, 50(1):163-178.
25. Soderlund DM, Clark JM, Sheets LP, Mullin LS, Piccirillo VJ, Sargent D,Stevens JT, Weiner ML: Mechanisms of pyrethroid neurotoxic-ity: implications for cumulative risk assessment. Toxicology2002, 171(1):3-59.
26. Werner I, Geist J, Okihiro M, Rosenkranz P, Hinton DE: Effects ofdietary exposure to the pyrethroid pesticide esfenvalerateon medaka (Oryzias latipes). Marine environmental research 2002,54(3-5):609-614.
27. Lees G: Effects of pyrethroid molecules on rat nerves in vitro:potential to reverse temperature-sensitive conduction block
of demyelinated peripheral axons. British journal of pharmacology1998, 123(3):487-496.
28. Little EE, Dwyer FJ, Fairchild JF, DeLonay AJ, Zajicek JL: Survival ofbluegill and their behavioral responses during continuousand pulsed exposures to esfenvalerate, a pyrethroid insecti-cide. Environmental Toxicology and Chemistry 1993, 12(5):871-878.
29. Werner I, Moran K: Effects of pyrethroid insecticides onaquatic organisms. Synthetic pyrethroids, occurrence and behaviour inaquatic environments 2008:310-334 [http://pubs.acs.org/doi/abs/10.1021/bk-2008-0991.ch014 ]. Washington DC: American ChemicalSociety
30. Swanson C, Young P: Swimming performance of delta smelt:maximum performance, and behavioral and kinematic limi-tations on swimming at submaximal velocities. J Exp Biol 1998,201(3):333-345.
31. Bacey J, Spurlock F, Starner K, Feng H, Hsu J, White J, Tran DM: Res-idues and toxicity of esfenvalerate and permethrin in waterand sediment, in tributaries of the Sacramento and SanJoaquin rivers, California, USA. Bulletin of environmental contami-nation and toxicology 2005, 74(5):864-871.
32. Loguinov AV, Mian IS, Vulpe CD: Exploratory differential geneexpression analysis in microarray experiments with no orlimited replication. Genome biology 2004, 5(3):R18.
33. Freund TF: GABAergic septohippocampal neurons containparvalbumin. Brain Res 1989, 478(2):375-381.
34. Rewal M, Wen Y, Wilson A, Simpkins JW, Jung ME: Role of parval-bumin in estrogen protection from ethanol withdrawal syn-drome. Alcoholism, clinical and experimental research 2005,29(10):1837-1844.
35. Olive M, Rivera R, Ferrer I: Parvalbumin immunocytochemistryand calcium deposition in muscle fiber necrosis and subse-quent regeneration following intramuscular injection ofmetoclopramide. Muscle & nerve 1994, 17(5):494-499.
36. Blurton-Jones M, Tuszynski MH: Estrogen receptor-beta colocal-izes extensively with parvalbumin-labeled inhibitory neuronsin the cortex, amygdala, basal forebrain, and hippocampalformation of intact and ovariectomized adult rats. The Journalof comparative neurology 2002, 452(3):276-287.
37. Ross NR, Porter LL: Effects of dopamine and estrogen uponcortical neurons that express parvalbumin in vitro. Brain ResDev Brain Res 2002, 137(1):23-34.
38. Tyler C, Beresford N, Woning M van der, Sumpter J, Thorpe K:Metabolism and environmental degradation of pyrethroidinsecticides produce compounds with endocrine activities.Environmental Toxicology and Chemistry 2002, 19:801-809.
39. Moniz AC, Cruz-Casallas PE, Salzgeber SA, Varoli FM, Spinosa HS,Bernardi MM: Behavioral and endocrine changes induced byperinatal fenvalerate exposure in female rats. Neurotoxicologyand teratology 2005, 27(4):609-614.
40. Gutjahr-Gobell RE, Zaroogian GE, Horowitz DJ, Gleason TR, Mills LJ:Individual effects of estrogens on a marine fish, Cunner (Tau-togolabrus adspersus), extrapolated to the population level.Ecotoxicology and environmental safety 2006, 63(2):244-252.
41. Baslow MH: Functions of N-acetyl-L-aspartate and N-acetyl-L-aspartylglutamate in the vertebrate brain: role in glial cell-specific signaling. Journal of neurochemistry 2000, 75(2):453-459.
42. Bitto E, Bingman CA, Wesenberg GE, McCoy JG, Phillips GN Jr:Structure of aspartoacylase, the brain enzyme impaired inCanavan disease. Proceedings of the National Academy of Sciences ofthe United States of America 2007, 104(2):456-461.
43. Matalon R, Kaul R, Casanova J, Michals K, Johnson A, Rapin I, GashkoffP, Deanching M: SSIEM Award. Aspartoacylase deficiency: theenzyme defect in Canavan disease. Journal of inherited metabolicdisease 1989, 12(Suppl 2):329-331.
44. Pan JW, Takahashi K: Interdependence of N-acetyl aspartateand high-energy phosphates in healthy human brain. Annals ofneurology 2005, 57(1):92-97.
45. Holmes E, Tsang TM, Huang JT, Leweke FM, Koethe D, Gerth CW,Nolden BM, Gross S, Schreiber D, Nicholson JK, et al.: Metabolicprofiling of CSF: evidence that early intervention mayimpact on disease progression and outcome in schizophre-nia. PLoS medicine 2006, 3(8):e327.
46. Sztriha LS, Nork MP, Abdulrazzaq YM, al-Gazali LI, Bakalinova DB:Abnormal myelination in peroxisomal isolated dihydroxyac-etonephosphate acyltransferase deficiency. Pediatric neurology1997, 16(3):232-236.
Page 16 of 18(page number not for citation purposes)

BMC Genomics 2009, 10:608 http://www.biomedcentral.com/1471-2164/10/608
47. Adams DS, Hasson B, Boyer-Boiteau A, El-Khishin A, Shashoua VE: Apeptide fragment of ependymin neurotrophic factor usesprotein kinase C and the mitogen-activated protein kinasepathway to activate c-Jun N-terminal kinase and a functionalAP-1 containing c-Jun and c-Fos proteins in mouse NB2acells. Journal of neuroscience research 2003, 72(3):405-416.
48. Trapp BD, Peterson J, Ransohoff RM, Rudick R, Mork S, Bo L: Axonaltransection in the lesions of multiple sclerosis. The New Eng-land journal of medicine 1998, 338(5):278-285.
49. Matalon R, Michals-Matalon K: Biochemistry and molecular biol-ogy of Canavan disease. Neurochemical research 1999,24(4):507-513.
50. Jockusch H, Friedrich G, Zippel M: Serum parvalbumin, an indi-cator of muscle disease in murine dystrophy and myotonia.Muscle & nerve 1990, 13(6):551-555.
51. Rossi AM, Eppenberger HM, Volpe P, Cotrufo R, Wallimann T: Mus-cle-type MM creatine kinase is specifically bound to sarco-plasmic reticulum and can support Ca2+ uptake andregulate local ATP/ADP ratios. The Journal of biological chemistry1990, 265(9):5258-5266.
52. Tskhovrebova L, Trinick J, Sleep JA, Simmons RM: Elasticity andunfolding of single molecules of the giant muscle proteintitin. Nature 1997, 387(6630):308-312.
53. Takada F, Woude DL Vander, Tong HQ, Thompson TG, Watkins SC,Kunkel LM, Beggs AH: Myozenin: an alpha-actinin- and gamma-filamin-binding protein of skeletal muscle Z lines. Proceedingsof the National Academy of Sciences of the United States of America 2001,98(4):1595-1600.
54. Tanaka T, Ebata T, Tajima A, Kinoshita K, Okumura K, Yagita H:Beta2-microglobulin required for cell surface expression ofblastocyst MHC. Biochemical and biophysical research communica-tions 2005, 332(1):311-317.
55. Sorensen PG, Nissen MH, Groth S, Rorth M: Beta-2-microglobulinexcretion: an indicator of long term nephrotoxicity duringcis-platinum treatment? Cancer chemotherapy and pharmacology1985, 14(3):247-249.
56. Xie J, Wang Y, Freeman ME, Barlogie B, Yi Q: Beta 2-microglobulinas a negative regulator of the immune system: high concen-trations of the protein inhibit in vitro generation of func-tional dendritic cells. Blood 2003, 101(10):4005-4012.
57. Tay CH, Welsh RM, Brutkiewicz RR: NK cell response to viralinfections in beta 2-microglobulin-deficient mice. J Immunol1995, 154(2):780-789.
58. Ota K, Matsui M, Milford EL, Mackin GA, Weiner HL, Hafler DA: T-cell recognition of an immunodominant myelin basic proteinepitope in multiple sclerosis. Nature 1990, 346(6280):183-187.
59. Zettl UK, Mix E, Zielasek J, Stangel M, Hartung HP, Gold R: Apopto-sis of myelin-reactive T cells induced by reactive oxygen andnitrogen intermediates in vitro. Cellular immunology 1997,178(1):1-8.
60. Jarry A, Vallette G, Cassagnau E, Moreau A, Bou-Hanna C, LemarreP, Letessier E, Le Neel JC, Galmiche JP, Laboisse CL: Interleukin 1and interleukin 1beta converting enzyme (caspase 1) expres-sion in the human colonic epithelial barrier. Gut 1999,45(2):246-251.
61. Ghayur T, Banerjee S, Hugunin M, Butler D, Herzog L, Carter A,Quintal L, Sekut L, Talanian R, Paskind M, et al.: Caspase-1 proc-esses IFN-gamma-inducing factor and regulates LPS-induced IFN-gamma production. Nature 1997,386(6625):619-623.
62. Mariathasan S, Newton K, Monack DM, Vucic D, French DM, Lee WP,Roose-Girma M, Erickson S, Dixit VM: Differential activation ofthe inflammasome by caspase-1 adaptors ASC and Ipaf.Nature 2004, 430(6996):213-218.
63. Eder KJ, Clifford MA, Hedrick RP, Kohler HR, Werner I: Expressionof immune-regulatory genes in juvenile Chinook salmon fol-lowing exposure to pesticides and infectious hematopoieticnecrosis virus (IHNV). Fish & shellfish immunology 2008,25(5):508-516.
64. Kruidering M, Schouten T, Evan GI, Vreugdenhil E: Caspase-medi-ated cleavage of the Ca2+/calmodulin-dependent proteinkinase-like kinase facilitates neuronal apoptosis. The Journal ofbiological chemistry 2001, 276(42):38417-38425.
65. Zaka M, Wenger DA: Psychosine-induced apoptosis in a mouseoligodendrocyte progenitor cell line is mediated by caspaseactivation. Neuroscience letters 2004, 358(3):205-209.
66. Wellington CL, Hayden MR: Caspases and neurodegeneration:on the cutting edge of new therapeutic approaches. Clinicalgenetics 2000, 57(1):1-10.
67. Camborieux L, Bertrand N, Swerts JP: Changes in expression andlocalization of hemopexin and its transcripts in injured nerv-ous system: a comparison of central and peripheral tissues.Neuroscience 1998, 82(4):1039-1052.
68. Swerts JP, Soula C, Sagot Y, Guinaudy MJ, Guillemot JC, Ferrara P,Duprat AM, Cochard P: Hemopexin is synthesized in peripheralnerves but not in central nervous system and accumulatesafter axotomy. The Journal of biological chemistry 1992,267(15):10596-10600.
69. Camborieux L, Julia V, Pipy B, Swerts JP: Respective roles ofinflammation and axonal breakdown in the regulation ofperipheral nerve hemopexin: an analysis in rats and inC57BL/Wlds mice. Journal of neuroimmunology 2000, 107(1):29-41.
70. Tolosano E, Altruda F: Hemopexin: structure, function, andregulation. DNA and cell biology 2002, 21(4):297-306.
71. Kale M, Rathore N, John S, Bhatnagar D: Lipid peroxidative dam-age on pyrethroid exposure and alterations in antioxidantstatus in rat erythrocytes: a possible involvement of reactiveoxygen species. Toxicology letters 1999, 105(3):197-205.
72. Ferreira G, Moura J, Franco R: Iron metabolism: inorganic bio-chemistry and regulatory mechanisms. Germany: Wiley-VCH;1999:65-93.
73. Connor JR: Iron acquisition and expression of iron regulatoryproteins in the developing brain: manipulation by ethanolexposure, iron deprivation and cellular dysfunction. Develop-mental neuroscience 1994, 16(5-6):233-247.
74. Smith A, Hunt RC: Hemopexin joins transferrin as representa-tive members of a distinct class of receptor-mediated endo-cytic transport systems. European journal of cell biology 1990,53(2):234-245.
75. Yu RM, Wong MM, Kong RY, Wu RS, Cheng SH: Induction ofhepatic choriogenin mRNA expression in male marinemedaka: a highly sensitive biomarker for environmentalestrogens. Aquatic toxicology (Amsterdam, Netherlands) 2006,77(4):348-358.
76. Chen X, Li VW, Yu RM, Cheng SH: Choriogenin mRNA as a sen-sitive molecular biomarker for estrogenic chemicals indeveloping brackish medaka (Oryzias melastigma). Ecotoxi-cology and environmental safety 2008, 71(1):200-208.
77. Lee C, Na JG, Lee KC, Park K: Choriogenin mRNA induction inmale medaka, Oryzias latipes as a biomarker of endocrinedisruption. Aquatic toxicology (Amsterdam, Netherlands) 2002, 61(3-4):233-241.
78. Ueno T, Yasumasu S, Hayashi S, Iuchi I: Identification of chorio-genin cis-regulatory elements and production of estrogen-inducible, liver-specific transgenic Medaka. Mechanisms ofdevelopment 2004, 121(7-8):803-815.
79. Kliewer SA, Goodwin B, Willson TM: The nuclear pregnane ×receptor: a key regulator of xenobiotic metabolism. Endocrinereviews 2002, 23(5):687-702.
80. Masuyama H, Nakatsukasa H, Takamoto N, Hiramatsu Y: Down-regulation of pregnane × receptor contributes to cell growthinhibition and apoptosis by anticancer agents in endometrialcancer cells. Molecular pharmacology 2007, 72(4):1045-1053.
81. Bentley PJ: Endocrines and Osmoregulation: A ComparativeAccount in Vertebrates. Volume 1. 2nd edition. New York, NY.:Springer; 2002.
82. Aydın R, Köprücü K, Dörücü M, Köprücü SŞ, Pala M: Acute Toxic-ity of Synthetic Pyrethroid Cypermethrin on the CommonCarp (Cyprinus carpio L.) Embryos and Larvae. AquacultureInternational 2005, 13(5):451-458.
83. Tipsmark CK, Madsen SS: Rapid modulation of Na+/K+-ATPaseactivity in osmoregulatory tissues of a salmonid fish. J Exp Biol2001, 204(Pt 4):701-709.
84. Takeuchi K, Toyohara H, Sakaguchi M: A hyperosmotic stress-induced mRNA of carp cell encodes Na(+)- and Cl(-)-dependent high affinity taurine transporter. Biochimica et bio-physica acta 2000, 1464(2):219-230.
85. Krogdahl Å, Hemre G-I, Mommsen T: Carbohydrates in fishnutrition: digestion and absorption in postlarval stages. Aqua-culture Nutrition 2005, 11(2):103-122.
86. Baxter R, Breuer R, Brown L, Chotkowski M, Feyrer F, Gingras M,Herbold B, Mueller-Solger A, Nobriga M, Sommer T, et al.: Pelagic
Page 17 of 18(page number not for citation purposes)

BMC Genomics 2009, 10:608 http://www.biomedcentral.com/1471-2164/10/608
Publish with BioMed Central and every scientist can read your work free of charge
"BioMed Central will be the most significant development for disseminating the results of biomedical research in our lifetime."
Sir Paul Nurse, Cancer Research UK
Your research papers will be:
available free of charge to the entire biomedical community
peer reviewed and published immediately upon acceptance
cited in PubMed and archived on PubMed Central
yours — you keep the copyright
Submit your manuscript here:http://www.biomedcentral.com/info/publishing_adv.asp
BioMedcentral
Organism Decline Progress Report: 2007 Synthesis ofResults. Interagency Ecological Program for the San Francisco Estuary2008:1-86.
87. Fujita I, Sorensen PW, Stacey NE, Hara TJ: The olfactory system,not the terminal nerve, functions as the primary chemosen-sory pathway mediating responses to sex pheromones inmale goldfish. Brain, behavior and evolution 1991, 38(6):313-321.
88. Tierney KB, Singh CR, Ross PS, Kennedy CJ: Relating olfactoryneurotoxicity to altered olfactory-mediated behaviors inrainbow trout exposed to three currently-used pesticides.Aquatic toxicology (Amsterdam, Netherlands) 2007, 81(1):55-64.
89. Moore A, Waring CP: The effects of a synthetic pyrethroid pes-ticide on some aspects of reproduction in Atlantic salmon(Salmo salar L. Aquatic toxicology (Amsterdam, Netherlands) 2001,52(1):1-12.
90. Bettini E, Porta AR, Dahmen N, Wang H, Margolis FL: Expressedsequence tags (EST) identify genes preferentially expressedin catfish chemosensory tissues. Brain research 1994,23(4):285-291.
91. Baskerville-Bridges B, Lindberg JC, Doroshov SI: Manual for theIntensive Culture of Delta Smelt (Hypomesus transpacifi-cus). Second edition. University of California, Department of AnimalScience Davis, CA; 2005:1-63.
92. Smyth GK: Limma: linear models for microarray data. Bioinfor-matics and computational biology solutions using R and Bioconductor2005:397-420 [http://www.springerlink.com/content/g26110k024423738/]. New York, NY.: Springer
93. Livak KJ, Schmittgen TD: Analysis of relative gene expressiondata using real-time quantitative PCR and the 2(-Delta DeltaC(T)) Method. Methods (San Diego, Calif) 2001, 25(4):402-408.
Page 18 of 18(page number not for citation purposes)

POD 2008-2010: Final Report
Environmental Toxicology and Chemistry, Manuscript accepted pending revision.
Linking molecular biomarkers with higher level condition indicators to identify effects of copper exposures on the endangered delta smelt (Hypomesus transpacificus).
Corresponding author:
Dr Richard Edward Connon
School of Veterinary Medicine
Deptartment of Anatomy, Physiology and Cell Biology
University of California, Davis,
CA 95616, USA
TEL: +1 (530) 752-3141
FAX: +1 (530) 752-7690
E-MAIL: [email protected]
Word count: 5336
134

POD 2008-2010: Final Report
Linking molecular biomarkers with higher level condition indicators to identify effects of copper exposures on the endangered delta smelt (Hypomesus transpacificus).
Connon, R.E.†*; Beggel, S.† ‡; D’Abronzo L.S.†; Geist, J.‡; Pfeiff, J.§; Loguinov A.V. ||; Vulpe C.D. || and Werner, I.†
† School of Veterinary Medicine, Department of Anatomy, Physiology and Cell Biology, University of California, Davis, California 95616, USA. ‡Unit of Functional Aquatic Ecology and Fish Biology, Department of Animal Science, Technische Universität München, Muehlenweg 22, 85354 Freising-Weihenstephan, Germany. §School of Veterinary Medicine, Molecular Biosciences, University of California, Davis, California 95616, USA. || School of Nutritional Sciences and Toxicology, University of California, Berkeley, California 94720, USA.
135


POD 2008-2010: Final Report
Abstract:
The experimental combination of molecular biomarkers with higher level condition indicators has allowed for interpretation of responses in a functional context that can be used to predict detrimental outcomes caused by contaminant exposure. In fish, not only swimming behavior, but maintenance of optimal swimming performance is of particular importance for optimal fitness. The delta smelt (Hypomesus transpacificus) is an endangered pelagic fish species endemic to the Sacramento-San Joaquin estuary, California, and considered an indicator of ecosystem health. Copper is a contaminant of concern in Californian waterways. Functional classifications of microarray responses are presented along with complementary quantitative PCR in measuring effects upon neuromuscular, digestive and immune responses in delta smelt exposed to copper. Differences in sensitivity were measured between juvenile and larval delta smelt (LC50-96h= 25.2 and 80.4 μg.Cu2+.L-1 respectively). Swimming velocity of declined on exposure in a dose dependent manner. Genes encoding for aspartoacylase, hemopexin, -actin and calcium regulation proteins were significantly affected by exposure and were functionally linked with measured swimming responses. Effects on digestion were measured by upregulation of chitinase and downregulation of amylase. Downregulation of tumor necrosis factor indicated a compromised immune system. Results from this study, and many others support the use of functionally characterized molecular biomarkers to assess effects of contaminants in field scenarios. We thus propose that in order to attribute environmental relevance to molecular biomarkers, research should concentrate on their application in field studies with the aim of developing monitoring programs.
Keywords: ‘Hypomesus transpacificus’, ‘delta smelt’, microarray, biomarker, copper, “stress response”, “aquatic ecosystems”, endangered
137

POD 2008-2010: Final Report
Introduction.
The application and significance of biomarkers in an environmental context has been criticized due to the lack of linkage between biomarker response in individual organisms and effects (such as reproductive fitness or population decline) at higher levels of organization (e.g., populations and ecosystems) [1-8]. The experimental combination of biomarkers with indicators of population or ecosystem condition, allows for the evaluation of effects upon an individual and subsequent extrapolation of endpoints such as population effects. Recent studies have hypothesized, identified and demonstrated links between gene expression and higher levels of organization [9-16]. The success behind the use of biomarkers as early and sensitive warning tools thus lies on interpreting biomarker responses in individuals in the context of affected cellular pathways, integrated with extensive life history knowledge of the species in question. This requirement is especially true when assessing effects on non-model species, or organisms living in ecological systems where sensitivity to stressors could greatly differ from sentinel organisms.
In fish, not only swimming behavior, but maintenance of optimal swimming performance is of particular importance for optimal fitness. A number of life history variables are dependent on swimming ability, including respiration, feeding, predator prey interactions, and social interactions such as courtship and spawning, which are fundamental to survival, growth and reproduction, the most important traits in evolutionary success. Contaminant exposures that predominantly affect neuromuscular structure and activity will undoubtedly translate to swimming impairments, however, other maintenance aspects, such as immune system and acquisition of adequate nutrients, will also play a role. Furthermore, exposure may affect olfactory senses and related behavioral responses, like contaminant avoidance and homing that will further affect individuals’ chances of survival and reproduction, and as such have direct effects on population dynamics. Contaminant avoidance is, in itself, generally seen as a beneficial response, however, should the avoidance coincide with homing and identification of limited spawning sites, would impinge on reproduction and consequently population dynamics [17].
The delta smelt (Hypomesus transpacificus) is an endangered pelagic fish species endemic to the Sacramento-San Joaquin estuary, California, whose abundance has dramatically declined since the 1980s, and more precipitously in recent years [18-21]. A number of complex factors, such as freshwater export and habitat destruction [22, 23], have been attributed to the decline of delta smelt in its native environment, with contaminants being another key issue. A more recent steep decline has prompted considerable efforts to understand the causative factors of reduced population [21, 24], especially because several other pelagic species have shown similar population trends.
Delta smelt are restricted to the Sacramento-San Joaquin estuary, spawning in late winter and early spring, at limited freshwater sites both known and speculated upon, based on sediment type and other physicochemical properties such as slope, vegetation, depth, temperature and salinity [25, 26]. A major site of delta smelt spawning is in the Lower Sacramento River from which hatched larvae are transported with the flow to brackish waters down-stream, where they mature, during a short-lived one-year cycle [27, 28]. This spawning site is located within agricultural areas and down-stream from the Sacramento
138

POD 2008-2010: Final Report
municipal wastewater treatment plant. Thus, emerging larvae are potentially exposed to a cocktail of contaminants, coinciding with early pest control chemical applications that mix with urban effluent contaminants.
Copper is a contaminant of concern in Californian waterways. It is not only common in urban storm-water runoff, and transport off old mining sites, but it is regularly used as a pesticide and fungicide in agricultural areas. Seasonally fluctuating dissolved copper concentrations in the Sacramento River have been reported approximating 2 μg.Cu2+.L-1, however, concentrations in tributaries (e.g. Arcade Creek) have been measured above 6 μg.L-1 [29], and concentrations have been reported to exceed 500 μg.L-1 in rice field effluents following application [30]. The delta smelt have been reported to be highly sensitive to copper [31] and its extensive application in Californian agriculture likely affects ecosystem health.
Copper, though essential for multiple cellular proteins, can be toxic to many aquatic organisms including fish. The mode of action of copper in several fish species has been reported to involve inhibition of Na+ channels in gill epithelium although other mechanisms are likely to be important as well [32]. Our knowledge on the effects of copper on model organisms is extensive, making this an ideal contaminant to utilize in this biomarker assessment proof-of-concept study, where our aim is to link molecular responses with higher level condition indicators, in this study, swimming performance. We describe in this paper, the effects of copper upon delta smelt at sensitive larval and juvenile developmental stages, the development of molecular biomarkers and their link with swimming performance. We emphasize the need for inclusion of molecular biomarkers in monitoring programs in order to understand mechanisms by which contaminants exert effects upon endangered organisms.
Methods
Fish exposures and swimming assessments
Delta smelt were obtained from the Fish Conservation and Culture Laboratory, UC Davis and maintained for a minimum of 24 hours in experimental conditions prior to test initiation. Two separate tests were conducted with juveniles and larvae, and used to assess gene expression through microarray and quantitative PCR (qPCR) applications respectively. Swimming behavior of larval fish was investigated and compared to q-PCR responses as detailed below. All experiments and use of test organisms were approved by the UC Davis Institutional Animal Care and Use Committee (Animal Use Protocol for Animal Care and Use #13361). This institution is accredited by the Association for Assessment and Accreditation of Laboratory Animal Care, International (AAALAC) and has an Animal Welfare Assurance on file with the Office of Laboratory Animal Welfare (OLAW). The Assurance Number is A3433-01. The IACUC is constituted in accordance with U.S. Public Health Service (PHS) Animal Welfare Policy and includes a member of the public and a non-scientist.
i. Exposures used for microarray analysis:
139

POD 2008-2010: Final Report
Juvenile delta smelt (90-d old) were exposed for 7 days to 4.2, 8.4, 21.0 and 42.0 µg.C2+.L-
1; sourced from CuCl2 (dihydrate). Controls were maintained in diluted well-water adjusted to a specific conductance (SC) of 450 μS.cm-1 using Instant Ocean, and a pH of 8.45, using HCl. Juveniles were acclimated to control water for 24 h prior to test initiation. Replicate experimental treatments (n=4) were initiated with 10, juveniles in 7L of water at 20°C. Fish were fed twice daily with artemia (<48 h old). The light:dark cycle was 16h:8h. Approximately 80% of the water in each replicate was renewed at test initiation and on days 2, 4, and 6. At test end, surviving fish were euthanized with MS-222 (tricaine methanesulfonate, Sigma, St. Louis, MO, USA), then measured, weighed and snap-frozen in liquid nitrogen and stored at –80°C for subsequent analyses. Surviving juveniles from 42.0 µg.C2+.L-1 were assessed against controls, utilizing the developed microarrays (see below).
ii. Exposures used for quantitative PCR and swimming ability analyses:
Larval delta smelt (47-d old) were exposed for 4 days to 24.0, 52.4, 105.0 and 213.0 µg.C2+.L-1; sourced from CuCl2 (dihydrate). Controls were maintained in hatchery water with specific conductance (SC) of 930 μS.cm-1 and pH of 7.9. Larvae were acclimated to control water for 24 h prior to test initiation. Antibiotics, (Maracyn and Maracyn-2, Virbac AH Inc., Fort Worth TX) were added during the acclimation period at concentrations of 5.3 mg.L-1 Maracyn (erythromycin) and 0.26 mg.L-1 Maracyn-2 (minocycline), to eliminate any gram-positive and gram-negative bacteria respectively. Experimental conditions were as detailed above. Approximately 80% of the water in each replicate was renewed at test initiation and on the second exposure day. At test end, a subset of fish were used for swimming assessments and remaining fish snap-frozen and stored at –80°C for subsequent biomarker analyses.
Swimming assessments were performed at test takedown. Fish were placed in rectangular tanks (12 x 6 x 9 cm) containing control water, and allowed to acclimate for 5 min. Three minute video imaging, recorded in MPEG-2 format, was performed at 30 frames per second using a black and white Panasonic CCTV camera (12VDC) connected to a laptop computer via a USB framegrabber (Model WinTV-HVR 950). Video analysis was carried out using Ethovision XT (Version 6.1.326, Noldus Information Technology). Average velocity was determined for each fish by analyzing a total of 72 seconds per video test. One-way ANOVA was used to assess differences in gene expression and Dunnett’s multiple comparison post hoc tests were used to compare exposed treatments to controls.
Experimental physicochemistry:
For all exposure tests, water temperature, pH, and DO were measured daily. Ammonia nitrogen (NH4
+-N) concentrations were measured prior to each water renewal and at test termination. Dissolved copper analyses were carried out by the California Department of Fish and Game – Water Pollution Laboratory, Rancho Cordova, CA.
140

POD 2008-2010: Final Report
Microarray application
Development of the delta smelt microarray was described in Connon et al. (2009) [15], briefly we have constructed a cDNA microarray with 8,448 expressed sequence tags (ESTs) which were pin-printed in duplicate onto epoxysilane coated glass slides.
RNA isolation, cDNA synthesis and fluorescence labeling.
RNA was extracted from whole, individual organisms, using Trizol Reagent (Invitrogen) as per manufacturer's guidelines. Fifteen micrograms of total RNA were used for cDNA synthesis, spiked with control RNA (CAB, RCA, RBCL and LTP4 (SpotReport, Stratagene) and labeled with Alexa fluor dyes, using SuperScripttm Plus Indirect cDNA labeling System (Invitrogen). Microarray assessments were carried out using three replicate treatments. Each experimental sample or control was combined with a reference pool cDNA prior to hybridization using an automated Tecan HS4800 hybridization station. Slides were scanned using a GenePix 4000B scanner (Axon Instruments).
Microarray images and data from exposed delta smelt can be accessed at http://www.vetmed.ucdavis.edu/apc/WernerLab/subpage/pelagic_organism_decline.html; POD archive data.
Microarray Analyses
Normalization and analytical methods are described in [15, 33]. In brief, print tip normalization was carried out within slides and sequential single slide data analysis was carried out as an alternative to between-slide normalization. An -outlier-generating model was used to identify differentially expressed genes by applying the following decision rule for multiple-slide data analysis: a given gene was selected as a candidate if it was consistently detected as up- or downregulated in 4 of 4 replicates (raw p-value = 0.0625 using exact binomial test and considering outcomes as Bernoulli trials). The approach did not use scale estimation for statistical inference and, therefore did not require between-slide normalization. We used a higher than usual cut-off point of 0.0625, due to normal microarray normalization stringencies, as the purpose of this investigation was to identify genes that could be assessed as probable qPCR based molecular biomarkers for future monitoring programs (see below).
Sequencing and Annotation
Sequencing was carried out at the CA&ES Genomic Facility, UC Davis. Basic Local Alignment Search Tool; translated nucleotide (BLASTx) searches were performed on specific fragments that responded significantly to the exposure treatments. Only genes that were differentially expressed following exposure were sequenced. Sequences were annotated according to homologies to protein database searches using translated nucleotide sequences and direct nucleotide queries (http://blast.ncbi.nlm.nih.gov/Blast.cgi). Sequences were only annotated if they were found to have a BLASTx match with the expect value smaller than 1x10⁻⁵ and a score above 50.
141

POD 2008-2010: Final Report
Functional Classifications
Differentially expressed genes were classified according to the Kyoto Encyclopedia of Genes and genomes (KEGG - http://www.genome.jp/kegg/kegg2.html) and Gene Ontology (GO - http://www.uniprot.org/uniprot), and information gathered from literature, into functional groups. Classification was carried out based on gene expression changes in respect of control subjects, regardless of whether these were up- or downregulated. Specific genes of interest were selected for further investigation using quantitative PCR (see below).
Biomarker development
Genes were selected according to level of expression significance, knowledge base from literature, and functional classification. Primer and probes for qPCR analyses were designed using Roche Universal Probe Library Assay Design Center (https://www.roche-applied-science.com). Designed primers were obtained from Eurofins MWG Operon (http://www.eurofinsdna.com), and TaqMan probes were supplied by Roche. Sequences for all genes assessed by qPCR analyses have been submitted to GenBank (http://www.ncbi.nlm.nih.gov). Primers and probes for investigated biomarkers are detailed in table 1.
Quantitative PCR
Complementary cDNA was synthesized using 1.0 µg total RNA, with random primers and SuperScript® III reverse transcriptase (Invitrogen), and diluted to a total of 120 µl with nuclease free water to generate sufficient template for qPCR analysis. TaqMan Universal PCR Mastermix (Applied Biosystems) was used in q-PCR amplifications in a reaction containing 10mMTris–HCl (pH 8.3), 50mM KCl, 5mM MgCl2, 2.5mM deoxynucleotide triphosphates, 0.625U AmpliTaq Gold DNA polymerase per reaction, 0.25U AmpErase UNG per reaction and 5µL of cDNA sample in a final volume of 12µL. The samples were placed in 384 well plates and cDNA was amplified in an automated fluorometer (ABI PRISM 7900 Sequence Detection System, Applied Biosystems). Amplification conditions were 2 min at 50°C, 10 min at 95°C, 40 cycles of 15 s at 95°C and 60s at 60°C. Fluorescence of samples was measured every 7 s and signals were considered positive if fluorescence intensity exceeded 10 times the standard deviation of the baseline fluorescence (threshold cycle, CT). SDS 2.2.1 software (Applied Biosystems) was used to quantify transcription.
Statistical analyses
We used the geNorm algorithm [34] to estimate the variability of the reference genes, and to determine an optimal normalization gene.
Quantitative PCR data was analyzed using the relative quantification 2(-Delta Delta CT) method [35]. Expression was calculated relative to a-actin determined by GeNorm as the least variable gene in this study. Quantitative PCR data were not normally distributed, therefore, significant differences in gene expression, relative to the unexposed controls, were assessed using two-tailed Mann-Whitney U test, single comparison alpha = 0.05, with
142

POD 2008-2010: Final Report
Bonferroni’s correction experiment-wide alpha = 0.15, treating each gene as a separate experiment.
Results
Fish Exposures and swimming assessments
i. Exposures used for microarray analyses:
Juvenile delta smelt (90-d old) were highly sensitive to copper exposure (table 2), resulting in an estimated LC50-7d= 17.8 μg.Cu2+.L-1. Surviving fish from the 42.0 µg.Cu2+.L-1 exposure treatment, were pooled, per replicate, and used for microarray analysis, against controls, in order to obtain copper specific genomic expression information (see microarray responses, below).
ii. Exposures used for quantitative PCR and swimming video-analyses:
Exposure of 47-d old larval delta smelt to copper for 4 days resulted in an LC50-96h = 80.4 µg.Cu2+.L-1 (table 2). Differences in copper sensitivity between juvenile and larval exposures were attributed not only to age and size, but also to temperature and conductivity, which are known to affect metal uptake and toxicity [36, 37]. Due to high mortality resulting at the highest copper concentration, surviving fish numbers were not sufficient for use in qPCR tests and thus were discarded from further analysis.
Video-analysis of larval swimming performance (figure 1) has demonstrated an overall effect of copper exposure resulting in declining velocity with increasing copper concentration (r=-0.911).
Experimental water physicochemistry:
Water physicochemical parameters for all tests remained stable throughout the exposures (table 3) except for a lower ammonium-nitrogen concentration in the 42.0 µg.CuCl2.L
-1 7 day test used for microarray analysis, which was attributed to a lower number of remaining fish due to high mortality. Discrepancy in total ammonium (NH4
+N) between exposure sets are attributed to development stage, age and size differences between juvenile and larval delta smelt.
Comparative toxicological data:
Differences in the above reported toxicity between juvenile and larval delta smelt (table 2) are due to exposure duration discrepancies and developmental stage, but variations in experimental conditions such as differences in water conductivity, pH, and temperature, also contributed to the higher copper toxicity to juveniles. Furthermore, the larval exposure tests were carried out using anitibiotic treatments. Though juvenile delta smelt appear more sensitive to copper exposure than do larvae, acute toxicity results are thus inconclusive, however, genomic responses have been analyzed successfully in a comparative manner (see below).
143

POD 2008-2010: Final Report
Microarray responses
Differentially expressed genes resulting for exposure to 42.0 μg.Cu2+.L-1 are presented in table 4. A functional classification based on KEGG and GO of up- and down-regulated genes responding to copper exposure are presented in figure 2.
Copper exposure primarily impacted on neuromuscular activity, affecting muscle integrity and contraction activity (e.g. creatine kinase, myozenin, sarcoendoplasmic reticulum calcium ATPase, titin a), neurological effects resulting in calcium and phosphate signaling (e.g. m-calpain, cyclophilin-a) and nerve maintenance (hemopexin and aspartoacylase). Copper is reported to inhibit iron storage through interaction with peroxidases causing oxidative stress which leads to disruption in calcium homeostasis [38]; resulting from effects upon Na+/Ca2+ membrane exchange, thus elevating intracellular Ca2+ [39]. Digestion was also affected by copper exposure, including genes encoding a number of proteins involved in glycolysis, cholesterol efflux, lipid transport, chymotrypsin activity, proteolysis (e.g. amylase-3, gastric chitinase). Other responses indicate compromised immunity (e.g. TNF, TGF-), and cellular homeostasis and tumor malignancy (e.g. vitronectin), changes in expression of these proteins have been implicated in a variety of diseases.
Gene classification from KEGG Orthology analyses also indicate effects on expression of genes encoding proteins involved in the Peroxisome Proliferator-Activated Receptor (PPAR) pathway, receptors that function as transcription factors regulating gene expression, playing an essential role in the regulation of cellular differentiation, development, metabolism of carbohydrate, lipids and proteins, and tumorgenesis. This pathway integrates the majority of genes classified into digestion and metabolism.
Molecular Biomarker responses
Genes were selected according to level of expression significance and to represent the identified functional classifications. Thus genes involved in muscular, neurological, digestive and immune system functional groups were further investigated, using q PCR, and assessed as probable biomarkers of copper exposure in H. transpacificus.
Results confirm microarray identified functional responses. Quantitative PCR verified copper elicited responses in neuromuscular, digestive and immune system functions (figure 3a-d), with significant differences in expression of muscle -actin, ASPA, hemopexin, chitinase and TNF (p<0.05). Remaining assessed genes displayed dose response relationships, and/or differences in expression trends, but were not statistically significant compared to controls. Though not statistically significant in their expression level, responses from these genes directly facilitate the interpretation of functionally affected systems and are thus interpreted with biological significance.
Muscular structure and activity:
Muscular structure and integrity appears to have been affected by copper exposure (figure 3a), as indicated by effects on contractile muscle systems; -actin and myozenin. Skeletal
144

POD 2008-2010: Final Report
-actin, significantly downregulated at all concentrations, is also reported to induce expression of a number of other myogenic genes essential for muscle formation [40]. Thus actin may serve as wholistic muscle integrity and functioning effect biomarker. Myozenin is a Z-line, -actinin- and -filamin-binding protein expressed predominantly in skeletal muscle, and has been suggested as a biomarker for muscular dystrophy and other neuromuscular disorders [41].
Muscle activity was also affected by copper exposure, altering Ca2+ homeostasis, denoted by SER Ca ATPase and Creatine Kinase altered expression. SER Ca ATPase a muscle sarcoendoplasmic reticulum (SR) calcium ATPase pump, responsible for the transfer of calcium from the cytoplasm into the SR after muscle activity [42, 43], was downregulated by copper exposure in a dose dependent manner. This is suggestive of a potential biomarker of muscular activity, indicative of mobility impairments, and likely apoptotic responses. Downregulation of SER Ca ATPase mRNA signifies a decrease in enzyme synthesis, likely causing a decrease in Ca2+ in the SR lumen. Disruption of Ca2+ homeostasis within the SR has been postulated as an early warning sign of apoptosis, thus inhibition of SER Ca ATPase could lead to cell death [44, 45].
A further biomarker assessed to measure muscular effects of copper exposure was Creatine kinase (CK). Protein concentrations are used as a diagnosis of diseases like cardiac infarction and skeletal muscle necrosis [46]. It is specifically bound to sarcoendoplasmic reticulum, and regulates calcium uptake and ATP/ADP ratios [47], thus is directly linked with SER Ca ATPase and involved in muscle activity. Though not statistically significant, CK expression was also reduced by increasing copper concentration, in a similar manner displayed by SER Ca and -actin, suggesting a decline in calcium regulation and overall energetic activity.
Neurological activity:
Copper exposure is known to affect the nervous system through the formation of reactive radicals [38, 48], an effect that was sustained in this study (figure 3b), through expression of hemopexin, which was significantly upregulated at lower concentrations. Hemopexin is synthesized by Schwann cells following nerve injury [49], has been reported in the peripheral nervous system, and is specifically regulated during repair [50]. The measured downregulation at higher concentrations could imply inhibition of repair mechanisms. Wallerian degeneration generally occurs following axonal injury and is critical for its repair. This is characterized by axonal and myelin degeneration [51], thus Aspartoacylase (ASPA), a gene identified in a previous study [15], was investigated as it is expressed in myelin sheaths and involved in their maintenance. Because of its functional proximity to hemopexin, it was chosen to further assess neurological damage, however, ASPA did not respond significantly to copper exposure, but displayed an increase at lower concentrations, supporting measured differences in hemopexin transcription. Both hemopexin and ASPA expression were elevated at lower concentrations and reduced at higher concentrations. Effects of copper exposure on calcium availability were further corroborated by changes in m-Calpain expression (figure 3b). m-Calpain is a calcium-dependent cysteine protease, known to co-localize with a calcium-sensing receptor, where calcium not only activates the
145

POD 2008-2010: Final Report
m-Calpain enzyme, but also causes it to undergo autolysis through subunit dissociation [52]. The physiological roles of calpains are still poorly understood, however, they have been shown to control cell fusions in myoblasts, playing an important role during myogenesis and thus muscle regeneration [53]. Interestingly, activation of m-Calpain in the peripheral nervous system has been also reported to be involved in Wallerian degeneration, with increased expression being initiated following nerve injury [54], which was also indicated by changes in ASPA expression levels (see above). Thus m-Calpain is a potential biomarker of neuromuscular activity, and as such clustered into both muscular and neurological responses. However due to high variability in control subjects, and the low number of replicates available in this study, changes in expression were not significantly different in this test.
Digestion:
Heavy metals are known to affect digestion [55]. Copper exposure resulted in significant responses in transcription of genes involved in delta smelt digestion (figure 3c). -Amylase is a digestive enzyme that hydrolyses starch into maltose [56]. It was downregulated, significantly correlating (r=0.978) with increasing copper concentration. Downregulation of α-amylase transcription has previously been associated with copper exposure [57-59]. Chitinase, an enzyme required in the digestion of chitin structures in the exoskeleton of crustacean and many insects, was significantly upregulated on exposure to copper. It has recently been found that fish express chitinase in their guts [60], thus hypothesized to be involved in arthropod digestion. Chitin is also a component of some bacterial cell walls [61], and chitinase has been reported as a hydrolase involved in the defense against Gram positive bacteria and fungal pathogens, particularly during larval stages [60], though this role has not fully been established [62].
Immune responses:
Microarray analysis also identified effects upon the immune system that were confirmed through qPCR (figure 3d). Tumor Necrosis Factor, a proinflammatory cytokine, was significantly downregulated by copper exposure, indicating a compromised immune system. Produced in many cell types, TNF plays an important role in immunity and inflammation, and in the control of cell proliferation, differentiation and apoptosis [63] and its downregulation has been implicated with various diseases such as Crohn’s, arthritis, multiple-sclerosis and Alzheimer’s [63, 64] . Balkwill et al [64], indicate that TNF knock-out causes autoreactive T Cells regulation, resulting epitope spreading, thus leading to a state of disease. Transforming growth factor- is an anti-inflammatory cytokine expressed functionally during development and in tissue maintenance and homeostasis regulating proliferation and differentiation, cell survival and apoptosis [65, 66]. Upregulation of TGF-b has been linked with neurodegenerative diseases and ischemic injuries [67] and interestingly is reported to induce muscle -actin expression [68], which was downregulated by copper exposure. TGF- displayed an upregulation at lower levels of copper exposure, in similar trends observed in ASPA and hemopexin, further suggesting immune responses resulting from probable neurological or signaling impairments.
Discussion
146

POD 2008-2010: Final Report
Molecular biomarkers in monitoring programs:
Molecular biomarkers have, for many years, successfully been used in human medicine as diagnostic tools, for example the assessment of prostate specific antigen (PSA) gene expression as an indicator of prostate cancer [69], and are increasingly being used in the pharmaceutical arena to assess the mode of action, safety, efficiency and targeted effects of novel and developed drugs [70]. Research in environmental toxicology has been concentrating on attributing or defining an ecological relevance to responses measured using biomarkers, through measuring responses at the individual level and attempting to extrapolate results to population responses. This work has been the subject of extensive critical discussion that has successfully strengthened biomarker research, but has concurrently discouraged wide spread application in field studies. However, a limited number of researchers have successfully applied molecular biomarkers in field studies, identifying contaminant stress induced responses [71, 72] and metal contamination effects [73] in various field collected aquatic organisms. Others report successful applications on field deployed organisms [74, 75]
In most aquatic organisms, and particularly in fish, a number of life cycle characteristics are dependent on swimming behavior, from respiration to reproduction, thus swimming performance in fish, is likely the single most significant environmentally relevant parameter that can be measured, as it is indicative of effects upon behavior. Thus, effects upon individual fish, however minimal, will reduce reproductive success of a population. It is clear that neuromuscular alterations will have significant effects on swimming performance. In this study we confirm that a suite of molecular biomarkers, designed specifically to address neuromuscular disturbances, can successfully indicate, allow interpretation of, and correlate with effects on swimming ability, but are also informative of the mode of action of stressors upon impinging on this ability.
The use of biomarkers to specifically address key health parameters have extensively been investigated, through proteomics, a global genomics approach, or with the application of molecular probes, such as neuromuscular activity, digestion and immune responses, as in this study, or with the addition of developmental assessments, such as links with endocrine responses, growth and sexual development. In the search for biomarkers of effect and exposure, it is traditional to ascertain as useful, only those whose functional responses correlate with exposure concentration. However, hormetic or biphasic dose responses appear to be indicative of changes in homeostasis [76, 77], and as such should be treated as an invaluable technique to identify concentrations at which organisms can no longer compensate adequately to exposure. It is our contention that biphasic responses can therefore be more informative that dose responsive biomarkers, which are solely indicative of exposures, without identifying lowest concentrations at which detrimental effects may occur. Thus a suite of biomarkers, both biphasic and dose respondent should be utilized in conjunction in order to elucidate effects upon an organism. We have previously demonstrated the ability to link neurological effects from pyrethroid exposures in the delta smelt, with changes in gene expression that correlated with swimming behavior [15]. In order to attribute environmental relevance to molecular biomarkers, research should concentrate on their application in field studies with the aim of developing monitoring
147

POD 2008-2010: Final Report
programs. Only through the inclusion of these techniques in monitoring programs, can biomarkers truly be evaluated.
Molecular biomarkers in the delta smelt:
The delta smelt are highly sensitive to handling and extremely difficult to work with under laboratory conditions, and these studies are not necessarily informative of what the organism are exposed to in their habitat. Thus reliable biomarkers for determining the health status and exposure history of delta smelt, in field based studies are essential. Molecular biomarkers such as those identified in this study, could therefore be coupled to, and carried out in collaboration with, the Californian Department of Fish and Game (DFG) annual townet surveys and monitoring programs (http://www.dfg.ca.gov/delta). Thus creating an informative database of genomic responses indicative of delta smelt health status, aiding the process of toxicity identification and evaluation through the identification of contaminant specific responses within complex chemical mixtures. Base line gene expression, for comparative purposes, could be generated from assessing hatchery raised larval, juvenile and adult delta smelt, alongside temporal, site specific variations in townet surveyed wild fish.
Biomarker suite recommendations for field based monitoring studies in the delta smelt:
A number of delta smelt genes, identified in this and previous studies [15] have been demonstrated as specific and informative biomarkers to warrant their application in field studies. Utilizing the molecular biomarkers identified this far, we are able to identify and further understand neuromuscular effects resulting from copper and pesticide exposures. Combining gene expression changes in aspartoacylase and hemopexin, for example, has proven successful in the identification of neurological insults, suggesting degradation of axon myelin sheaths and nerve repair [15]. Biphasic changes in expression seemingly differentiate homeostatic responses, allowing repair mechanisms, from concentrations which are chronically detrimental, as implied by aspartoacylase and hemopexin responses in this study. Effects of copper on muscular activity and integrity can also be ascertained through the resulting downregulation of SER Ca ATPase and -actin respectively. These are genomic measurements that statistically correlate with declining swimming behavior and are biologically significant in the interpretation of exposure effects of neurotoxicants. Furthermore, the health status of an organism can be assessed in terms of digestion capacity and immune system functioning. Additional to the qPCR based biomarkers already described, a number of prospective genes have been identified with the microarray application, and will be isolated from future studies, to expand genomic information towards a suite of functionally classified biomarkers to be in monitoring programs and identify classes of contaminants present in the delta smelt’ habitat range that may be responsible for toxicity. Thus, the presently assessed suite of biomarkers could be applied to field studies, comprising site specific collected water sample exposures within a laboratory conditions, as well as upon wild specimens caught during townet surveys.
Linking molecular responses to copper exposure with condition indicators:
148

POD 2008-2010: Final Report
The short-term copper exposure (4-d) in this study resulted in an overall decrease in swimming velocity in larval delta smelt with increasing concentration. The reduction in swimming activity can be explained by alterations measured by all neuromuscular molecular biomarkers, as these indicate the mechanisms of action of copper upon the delta smelt. SER Ca ATPase was a particularly informative gene, as the measured downregulation confirmed interference of copper with Ca2+ homeostasis, neurological signaling and muscle activity. The strong downregulation of -Actin, at all concentrations, sustains reported effects of copper on contractile muscle proteins [59], further supported by increases in m-Calpain expression, involved in muscle regeneration [53].
Food consumption was not measured in this test, thus it is not clear from this study whether the measured digestive changes are directly due to copper exposure acting upon specific enzymes, or whether this is a result of altered swimming performance impinging on prey capture and ingestion. Under unexposed conditions, elevated levels of chitinase would likely signify higher levels of ingestion. It is unlikely that copper exposed fish had a higher consumption level, thus our contention is that copper directly acts upon digestion either impeding the proteolytic process through synthesis inhibition, enzyme degradation or mRNA expression inhibition, as indicated through amylase expression.
Further responses to copper exposure indicate compromised immune system, with specific links to the central nervous system, as suggested by the measured upregulation of TGF- reported to be linked to neurodegenerative diseases [67], and its involvement in the induction of contractile muscle protein [68] further supports neuromuscular damage.
Copper concentrations used in this study, though high, are not uncommon [58], especially the lowest concentration investigated. Results from this study are indicative of short-term exposure responses. Bioaccumulation properties of heavy metals are well researched [78], and we extrapolate that longer-term exposures to lower levels of copper are likely to have similar effects on swimming performance and altering the overall chances of delta smelt survival in the wild. Indisputably, the primary reason for the decline in number of pelagic organism in the Sacramento-San Joaquin Delta is directly related to water exports [22-24], however, organisms that manage to survive this habitat destruction, are exposed to elevated concentrations of contaminant resulting from industrial, agricultural and urban pollution, lower water flows combined with a lesser dilution rate. Management systems to monitor the extent of change resulting from anthropogenic loads are essential, and this study enhances the argument for the use of a suite of molecular biomarkers as a successful approach towards identifying effects and causal factors of species decline.
149

POD 2008-2010: Final Report
Tables and Figures:
Table 1. Molecular biomarkers: Primer and probe sequences used for quantitative-PCR analyses of gene expression in H. transpacificus. * indicates reference gene.
Table 2. Physicochemical parameters of control and test waters from 4 and 7-d copper exposures.
Table 3. Acute toxicity data from copper exposed 90-d old juvenile and 47 d-old larval delta smelt.
Table 4. Annotation, gene ontology and regulation of gene expression, in juvenile delta smelt exposed to copper (42.0 μg.Cu2+.L-1).
Figure 1. Swimming performance of 47-d old larval delta smelt exposed to copper for 96 h.
Figure 2. Microarray responses: systematic analysis of KEGG Orthology and Gene Ontology based functional classification of delta smelt genes significantly differing in juveniles exposed to copper (42.0 μg.Cu2+.L-1) for 7-days.
Figure 3. Quantitative PCR expression assessments of selected delta smelt genes responding to copper exposed larvae. * indicates tests significant differences (p<0.05 at. n= 9, 9, 8, and 5, for concentrations 1.6, 24.0, 52.4 and 105.0 respectively).
150

POD 2008-2010: Final Report
Gene GenBank
Accession No. q-PCR Primer Sequences
Roche Probe No.
Myozenin FJ711583 F
R
CCAATGTCGTGCTGGTACACC
CTGCCAGACATTGATGTAGCCA 106
Creatine Kinase FJ711584 F
R
CGATCGGCGTTGGAGATG
GCCAAGTTCAACGAGATTCTGG 163
SER-Ca ATPase Submitted F
R
CATGATCATTGGGGGAGCA
TGCTGTGATGACAACGAGGAC 148
-Actin Submitted F
R
CCTGCCTCGTCGTACTCCTG
CATCCTGGCTTCCCTGTCC 11
m-Calpain Submitted F
R
CCCTCCGACATGGGAAGAGT
ACCAACTATGCCTTGCCCAA 30
Aspartoacylase FJ711577 F
R
GGAGGCACACATGGGAATG
CTTCCTCTGAATCTCTGTTCCATTATC 109
Hemopexin FJ711579 FR
CATGCACTACGAGGACGACAAG
TGGTAGTAGCTGAACACCTTGCTG 143
Chitinase Submitted F
R
TGTGATCAAGTTCCTCCGTCAGT
CCGGGGTATTCCCAGTCAAT 147
-Amylase Submitted F
R
GATCACCATGTTCTTGATCTGACG
CCATCAATCCTGACCAAACCTG 99
TGF- Submitted F
R
CAACGGCATAGTGCATGTGG
GAATGTGTGCACGTTGTTGGT 76
TNF-decoy receptor Submitted F
R
CTTTTTCCGCTGTTCCATGTTC
GTTACCAGCATACGCAGTGTCC 2
-Actin* Submitted F
R
TGCCACAGGACTCCATACC
CATCGGCAACGAGAGGTT 12
Table 1.
151

POD 2008-2010: Final Report
Treatment Temp (°C)
pH EC
S.cm-1) DO
(mg.L-1) NH4
+-N (mg.L-1)
Weight (g)
Length (cm)
i. Exposures used for microarray analysis (90-d old juvenile, 7-d exposure):
Control water 21 8.40 431 8.8 0.28 0.24 3.42
4.2 µg.Cu2+.L-1 21 8.49 456 8.7 0.24 0.24 3.53
8.4 µg.Cu2+.L-1 21 8.48 461 9.0 0.23 0.23 3.49
21.0 µg.Cu2+.L-1 21 8.46 455 8.8 0.37 0.26 3.57
42.0 µg.Cu2+.L-1 21 8.39 457 8.9 0.14 0.26 3.52
Experimental Mean
21 8.44 452 8.84 0.25 0.25 3.51
ii. Exposures used for quantitative PCR and swimming ability analyses (47-d old larvae, 4-d exposure):
Control water 17 7.86 931 9.1 0.025 N/A N/A
24.0 µg.Cu2+.L-1 17 7.84 926 9.3 0.037 N/A N/A
52.4 µg.Cu2+.L-1 17 7.89 927 9.4 0.057 N/A N/A
105.0 µg.Cu2+.L-1 17 7.93 931 9.4 0.047 N/A N/A
213.0 µg.Cu2+.L-1 17 7.89 931 9.5 0.033 N/A N/A
Experimental Mean
17 7.88 929 9.34 0.039 N/A N/A
Table 2.
152

POD 2008-2010: Final Report
Endpoint Juvenile exposure Larval exposure
96-h 95% CI 7-d 95% CI 96-h 95% CI
NOEC 8.4 - 8.4 - 53.0 -
LOEC 21.0 - 21.0 - 106.0 -
LC10 9.6 4.2 - 11.4 9.0 4.2 - 10.3 9.3 27.0 - 77.8
LC25 13.4 10.6 - 18.0 11.7 9.7 - 13.0 44.8 27.0 - 83.1
LC50 25.2 16.4 - 35.4 17.8 14.4 - 22.4 80.4 48.7 - 227.2
Table 3.
153

POD 2008-2010: Final Report
Gene most similar to Species Match Accession No E-Value Score GO Fold-
change
pancreatic protein with two somatomedin B domains Paralichthys olivaceus BAA88246 2.00E-95 352 GO:0005179 7.54
cell division cycle 14 homolog A Danio rerio CAP09233 3.00E-19 99 GO:0004725 5.76
corticotropin-lipotropin A precursor Oncorhynchus mykiss Q04617 7.00E-63 244 GO:0005179 5.20
elastase 2-like protein Sparus aurata AAT45251 2.00E-89 332 GO:0006508 5.08
actin alpha 2, skeletal muscle Pagrus major BAF80060 1.00E-94 384 GO:0003774 4.88
phosphoglucose isomerase-2 Plecoglossus altivelis BAF91566 1.00E-120 435 GO:0006096 4.86
apolipoprotein A-I-2 precursor Oncorhynchus mykiss O57524 4.00E-71 271 GO:0033344 4.81
pepsinogen A form IIa Pseudopleuronectes americanus AAD56283 1.00E-105 384 GO:0004194 4.65
arachidonate 12-lipoxygenase Danio rerio NP_955912 4.00E-23 112 GO:0004052 4.42
chitinase1 Paralichthys olivaceus BAD15059 1.00E-127 458 GO:0004568 4.25
lipoxygenase 12R (PREDICTED: similar to) Ornithorhynchus anatinus XP_001518171 8.00E-06 55 GO:0016165 4.17
apolipoprotein Eb Danio rerio NP_571173 2.00E-38 162 GO:0033344 4.16
SPARC: secreted protein, acidic, rich in cysteine Danio rerio AAT01213 2.00E-31 139 GO:0006816 4.14
pepsin A2 Trematomus bernacchii CAD80096 2.00E-88 253 GO:0004194 4.05
apolipoprotein A-I-1 precursor (Apo-AI-1) Oncorhynchus mykiss O57523 8.00E-76 286 GO:0033344 3.99
chymotrypsinogen 2-like protein Sparus aurata AAT45254 1.00E-20 101 GO:0004263 3.93
myozenin 1 Danio rerio NP_991241 2.00E-25 119 GO:0030346 3.91
NADH dehydrogenase subunit 5 Osmerus mordax ABI35911 1.00E-107 390 GO:0008137 3.88
astacin like metallo-protease Oryzias latipes NP_001098207 2.00E-83 311 GO:0008533 3.87
Hect domain and RLD 4 (PREDICTED: similar to) Danio rerio XP_685685 7.00E-76 286 GO:0006512 3.76
actin, alpha 2, smooth muscle, aorta Danio rerio AAH75896 1.00E-107 391 GO:0003774 3.75
chitinase Oncorhynchus mykiss CAD59687 9.00E-68 260 GO:0004568 3.75
F-type lectin Morone saxatilis ABB29997 1.00E-46 188 GO:0016467 3.73
Pgk1(phosphoglycerate kinase 1) protein Danio rerio AAH65888 9.00E-84 313 GO:0006096 3.67
aldolase a, fructose-bisphosphate Danio rerio NP_919358 1.00E-124 447 GO:0006096 3.47
NADH dehydrogenase subunit 5 Osmerus mordax ABI35911 5.00E-94 308 GO:0008137 3.47
pepsinogen C (progastricsin) Salvelinus fontinalis AAG35646 1.00E-107 390 GO:0004194 3.41
amylase-3 protein Tetraodon nigroviridis CAC87127 3.00E-54 213 GO:0004556 3.36
simple type II keratin K8b (S2) Oncorhynchus mykiss CAA63300 3.00E-74 281 GO:0005882 3.28
glutamate dehydrogenase 1 Danio rerio NP_955839 1.00E-107 392 GO:0004352 3.24
-amylase Pseudopleuronectes americanus AAF65827 1.00E-144 513 GO:0004556 3.06
pepsinogen Paralichthys olivaceus BAC87742 3.00E-77 291 GO:0004194 3.04
NADH dehydrogenase subunit 6 Salangichthys microdon NP_795843 1.00E-107 392 GO:0008137 3.03
Hemopexin Danio rerio NP_001104617 1.00E-59 233 GO:0046872 3.02
gamma2-synuclein Takifugu rubripes NP_001029019 2.00E-41 172 GO:0030424 2.93
actin, alpha, cardiac muscle 1 like Danio rerio NP_001001409 1.00E-141 503 GO:0003774 2.92
cardiac muscle ATP synthase,alpha 1, Danio rerio NP_001070823 7.00E-62 240 GO:0015662 2.91
selenoprotein P, 1a Danio rerio NP_840082 1.00E-53 213 GO:0001887 2.86
intestinal fatty acid binding protein Danio rerio AAF00925 3.00E-56 221 GO:0008289 2.82
L-arginine:glycine amidinotransferase Danio rerio NP_955825 5.00E-83 310 GO:0016740 2.76
apolipoprotein A-IV Danio rerio AAH93239 1.00E-73 279 GO:0006869 2.72
peptidylprolyl isomerase A (cyclophilin) Danio rerio AAQ91263 2.00E-74 282 GO:0003755 2.66
histone methyltransferase SmyD1b Danio rerio ABC54714 1.00E-108 394 GO:0030239 2.62
sarcoendoplasmic reticulum calcium ATPase Silurus lanzhouensis ABG90496 8.00E-79 297 GO:0006937 2.47
1-acylglycerol-3-phosphate O-acyltransferase 3 Danio rerio NP_998590 4.00E-68 261 GO:0003841 2.36
chitin binding Peritrophin-A domain Danio rerio AAH45331 4.00E-69 264 GO:0016490 2.34
apolipoprotein A-I Danio rerio NP_571203 1.00E-81 306 GO:0033344 2.28
calpain 1 protein Danio rerio AAH91999 2.00E-68 262 GO:0005509 2.27
apolipoprotein B Salmo salar CAA57449 3.00E-24 115 GO:0030301 2.23
sarcoendoplasmic reticulum calcium ATPase Makaira nigricans AAB08097 1.00E-83 313 GO:0006937 2.22
muscle creatine kinase Danio rerio CAM16434 1.00E-112 406 GO:0004111 2.21
transmembrane protein 38A Danio rerio NP_957194 8.00E-81 303 GO:0005267 2.21
tripartite motif-containing 45 Xenopus tropicalis NP_001011026 3.00E-27 125 GO:0046872 2.20
titin a Danio rerio ABG48500 3.00E-88 328 GO:0031432 2.19
c1q-like protein Dissostichus mawsoni ABN45966 3.00E-38 162 GO:0006817 2.17
apolipoprotein CII Oncorhynchus mykiss AAG11410 1.00E-19 100 GO:0006869 2.02
guanine nucleotide binding protein (G protein), beta 1 Danio rerio NP_997774 1.00E-117 424 GO:0003924 1.88
alpha tubulin, (protein LOC573122) Danio rerio NP_001098596 1.00E-120 434 GO:0007018 1.86
DAZAP2-like protein (deleted in azoospermia-associated) Takifugu rubripes NP_001072102 5.00E-59 230 GO:0030154 1.86
154
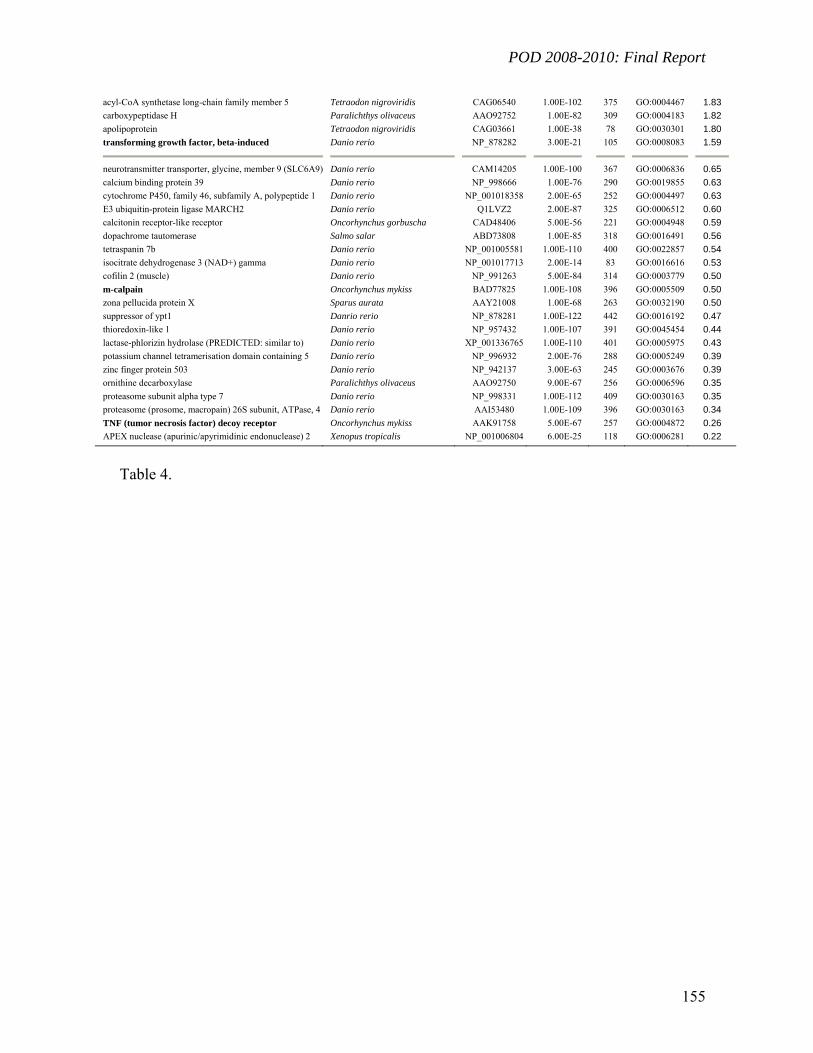
POD 2008-2010: Final Report
acyl-CoA synthetase long-chain family member 5 Tetraodon nigroviridis CAG06540 1.00E-102 375 GO:0004467 1.83
carboxypeptidase H Paralichthys olivaceus AAO92752 1.00E-82 309 GO:0004183 1.82
apolipoprotein Tetraodon nigroviridis CAG03661 1.00E-38 78 GO:0030301 1.80
transforming growth factor, beta-induced Danio rerio NP_878282 3.00E-21 105 GO:0008083 1.59
neurotransmitter transporter, glycine, member 9 (SLC6A9) Danio rerio CAM14205 1.00E-100 367 GO:0006836 0.65
calcium binding protein 39 Danio rerio NP_998666 1.00E-76 290 GO:0019855 0.63
cytochrome P450, family 46, subfamily A, polypeptide 1 Danio rerio NP_001018358 2.00E-65 252 GO:0004497 0.63
E3 ubiquitin-protein ligase MARCH2 Danio rerio Q1LVZ2 2.00E-87 325 GO:0006512 0.60
calcitonin receptor-like receptor Oncorhynchus gorbuscha CAD48406 5.00E-56 221 GO:0004948 0.59
dopachrome tautomerase Salmo salar ABD73808 1.00E-85 318 GO:0016491 0.56
tetraspanin 7b Danio rerio NP_001005581 1.00E-110 400 GO:0022857 0.54
isocitrate dehydrogenase 3 (NAD+) gamma Danio rerio NP_001017713 2.00E-14 83 GO:0016616 0.53
cofilin 2 (muscle) Danio rerio NP_991263 5.00E-84 314 GO:0003779 0.50
m-calpain Oncorhynchus mykiss BAD77825 1.00E-108 396 GO:0005509 0.50
zona pellucida protein X Sparus aurata AAY21008 1.00E-68 263 GO:0032190 0.50
suppressor of ypt1 Danrio rerio NP_878281 1.00E-122 442 GO:0016192 0.47
thioredoxin-like 1 Danio rerio NP_957432 1.00E-107 391 GO:0045454 0.44
lactase-phlorizin hydrolase (PREDICTED: similar to) Danio rerio XP_001336765 1.00E-110 401 GO:0005975 0.43
potassium channel tetramerisation domain containing 5 Danio rerio NP_996932 2.00E-76 288 GO:0005249 0.39
zinc finger protein 503 Danio rerio NP_942137 3.00E-63 245 GO:0003676 0.39
ornithine decarboxylase Paralichthys olivaceus AAO92750 9.00E-67 256 GO:0006596 0.35
proteasome subunit alpha type 7 Danio rerio NP_998331 1.00E-112 409 GO:0030163 0.35
proteasome (prosome, macropain) 26S subunit, ATPase, 4 Danio rerio AAI53480 1.00E-109 396 GO:0030163 0.34
TNF (tumor necrosis factor) decoy receptor Oncorhynchus mykiss AAK91758 5.00E-67 257 GO:0004872 0.26
APEX nuclease (apurinic/apyrimidinic endonuclease) 2 Xenopus tropicalis NP_001006804 6.00E-25 118 GO:0006281 0.22
Table 4.
155

POD 2008-2010: Final Report
Concentration (g.Cu2+.L-1)
Vel
ocity
(C
m.S
-1)
0.0
0.5
1.0
1.5
0 50 100 150 200
Concentration (g.Cu2+.L-1)
Vel
ocity
(C
m.S
-1)
0.0
0.5
1.0
1.5
0 50 100 150 200
Figure 1.
156

POD 2008-2010: Final Report
Muscle contraction and signaling
14%
Neurological
8%
Redox and metal ion binding
10%
Immune response
4%Digestion and metabolism
39%
Various cellular processes
17%
Muscle
8%Muscle contraction
and signaling
14%
Neurological
8%
Redox and metal ion binding
10%
Immune response
4%Digestion and metabolism
39%
Various cellular processes
17%
Muscle
8%
Figure 2.
157

POD 2008-2010: Final Report
-8
-4
0
4
8
0 20 40 60 80 100
Chitinase
Amylase
-4
-3
-2
-1
0
1
0 20 40 60 80 100
TGF-b
TNF
-3
-2
-1
0
1
0 20 40 60 80 100
Myozenin
CK
SER Ca
a-Actin
-6
-4
-2
0
2
0 20 40 60 80 100
ASPA
Hemopexin
m-Calpain
Muscular Neurological
Digestive Immune
Exposure concentration (g.Cu2+.L-1)
Rel
ativ
e g
ene
exp
res
sio
n
(Lin
eari
zed
to
-Act
in)
a b
c d
*
* *
*
* *
*
**
Figure 3.
158

POD 2008-2010: Final Report
References: [1] Handy RD, Galloway TS, Depledge MH. 2003. A Proposal for the Use of Biomarkers for the Assessment of Chronic Pollution and in Regulatory Toxicology. Ecotoxicology (London, England) 12:331-343. [2] Eason C, O'Halloran K. 2002. Biomarkers in toxicology versus ecological risk assessment. Toxicology 181-182:517-521. [3] Hyne RV, Maher WA. 2003. Invertebrate biomarkers: links to toxicosis that predict population decline. Ecotoxicology and environmental safety 54:366-374. [4] Moore MN. 2002. Biocomplexity: the post-genome challenge in ecotoxicology. Aquatic Toxicology 59:1-15. [5] Depledge MH, Galloway TS. 2005. Healthy animals, healthy ecosystems. pp 251-258. [6] Anderson SL. 2007. Biomarkers and the pelagic organism decline: Conclusions of the POD Biomarker Task Force, Fort Mason, San Francisco, August 29-30, 2007. [7] Poynton HC, Wintz H, Vulpe CD, Christer Hogstrand and Peter K. 2008. Progress in ecotoxicogenomics for environmental monitoring, mode of action, and toxicant identification. Advances in Experimental Biology. Elsevier, pp 21-73, 322-323. [8] Vieira LR, Gravato C, Soares AM, Morgado F, Guilhermino L. 2009. Acute effects of copper and mercury on the estuarine fish Pomatoschistus microps: linking biomarkers to behaviour. Chemosphere 76:1416-1427. [9] Soetaert A, Moens LN, Van der Ven K, Van Leemput K, Naudts B, Blust R, De Coen WM. 2006. Molecular impact of propiconazole on Daphnia magna using a reproduction-related cDNA array. Comp Biochem Physiol C Toxicol Pharmacol 142:66-76. [10] Soetaert A, van der Ven K, Moens LN, Vandenbrouck T, van Remortel P, De Coen WM. 2007. Daphnia magna and ecotoxicogenomics: gene expression profiles of the anti-ecdysteroidal fungicide fenarimol using energy-, molting- and life stage-related cDNA libraries. Chemosphere 67:60-71. [11] Soetaert A, Vandenbrouck T, van der Ven K, Maras M, van Remortel P, Blust R, De Coen WM. 2007. Molecular responses during cadmium-induced stress in Daphnia magna: integration of differential gene expression with higher-level effects. Aquatic toxicology (Amsterdam, Netherlands) 83:212-222. [12] Connon R, Hooper HL, Sibly RM, Lim FL, Heckmann LH, Moore DJ, Watanabe H, Soetaert A, Cook K, Maund SJ, Hutchinson TH, Moggs J, De Coen W, Iguchi T, Callaghan A. 2008. Linking molecular and population stress responses in Daphnia magna exposed to cadmium. Environmental science & technology 42:2181-2188. [13] Heckmann LH, Sibly RM, Connon R, Hooper HL, Hutchinson TH, Maund SJ, Hill CJ, Bouetard A, Callaghan A. 2008. Systems biology meets stress ecology: linking molecular and organismal stress responses in Daphnia magna. Genome biology 9:R40. [14] Ungerer MC, Johnson LC, Herman MA. 2008. Ecological genomics: understanding gene and genome function in the natural environment. Heredity 100:178-183. [15] Connon RE, Geist J, Pfeiff J, Loguinov AV, D'Abronzo L, Wintz H, Vulpe CD, Werner I. 2009. Linking mechanistic and behavioral responses to sublethal esfenvalerate exposure in the endangered delta smelt; Hypomesus transpacificus (Fam. Osmeridae). BMC genomics, p. 608. [16] Ankley GT, Bencic DC, Breen MS, Collette TW, Conolly RB, Denslow ND, Edwards SW, Ekman DR, Garcia-Reyero N, Jensen KM, Lazorchak JM, Martinovic D, Miller DH, Perkins EJ, Orlando EF, Villeneuve DL, Wang R-L, Watanabe KH. 2009.
159

POD 2008-2010: Final Report
Endocrine disrupting chemicals in fish: Developing exposure indicators and predictive models of effects based on mechanism of action. Aquatic Toxicology 92:168-178. [17] DeLonay AJ, Brumbaugh WG, Little EE, Cleveland L. 2001. Laboratory evaluation of the behavioral avoidance-preference response of chinook salmon (Oncorhynchus tshawytscha) to chromium in the Hanford Reach of the Columbia River, Washington, USA: Final Report for the Hanford Natural Resource Trustee Council (90884). [18] Bryant M, Souza K. 2004. Summer townet and fall midwater trawl survey status and trends. [19] Hieb K, Bryant M, Souza K, Greiner T, Slater S. 2005. Place holder for bay and estuary species 2004 status and trends report. Interagency Ecological Program Newsletter, pp 6-10. [20] Feyrer F, Nobriga ML, Sommer TR. 2007. Multidecal trends for three declining fish species: habitat patterns and mechanisms in the San Francisco Estuary, California, USA. Journal of Fisheries and Aquatic Sciences 64:723-734. [21] Brown LR, Kimmerer W, Brown R. 2009. Managing water to protect fish: a review of California's Environmental Water Account, 2001-2005. Environmental management 43:357-368. [22] Bennett WA, Kimmerer WJ, Jon RB. 2002. Plasticity in Vertical Migration by Native and Exotic Estuarine Fishes in a Dynamic Low-Salinity Zone. Limnology and Oceanography 47:1496-1507. [23] Bennett WA. 2005. Critical assessment of the delta smelt population in the San Francisco Estuary, California. . San Francisco Estuary and Watershed Science 3. [24] Sommer T, Armor C, Baxter R, Breuer R, Brown L, Chotkowski M, Culberson S, Feyerer F, Gingras M, Herbold B, Kimmerer W, Mueller-Solger A, Nobriga M, Souza K. 2007. The collapse of pelagic fishes in the upper san francisco estuary. Fisheries 32:270-277. [25] Swanson C, Reid T, Young PS, Cech Jr JJ. 2000. Comparative environmental tolerances of threatened delta smelt ( Hypomesus transpacificus ) and introduced wakasagi ( H. nipponensis ) in an altered California estuary. Oecologia 123:384-390. [26] Hobbs JA, Bennett WA, Burton J, Gras M. 2007. Classification of Larval and Adult Delta Smelt to Nursery Areas by Use of Trace Elemental Fingerprinting. pp 518-527. [27] Moyle PB, Herbold B, Stevens DE, Miller LW. 1992. Life History and Status of Delta Smelt in the Sacramento-San Joaquin Estuary, California. pp 67-77. [28] Swanson C, Young P. 1998. Swimming performance of delta smelt: maximum performance, and behavioral and kinematic limitations on swimming at submaximal velocities. J Exp Biol 201:333-345. [29] USGS. 1998. Water-quality assessment of the Sacramento river basin, California – Water quality of fixed sites, 1996-1998. Water-resources investigations report 00-4247 US Department of the Interior, US Geological Survey. [30] California-DFG. 1998. Environmental monitoring for chemical control of Egeria densa in the Sacramento-San Joaquin Delta. Report 3 State of California, The Resourses Agency, Department of Fish and Game. [31] Werner I, Deanovic LA, Markiewicz D, Stillway M, Offer N, Connon R, Brander S. 2008. Pelagic Organism Decline (POD): Acute and Chronic Invertebrate and Fish Toxicity Testing in the Sacramento-San Joaquin Delta 2006-2007.
160

POD 2008-2010: Final Report
[32] Handy RD, Eddy FB, Baines H. 2002. Sodium-dependent copper uptake across epithelia: a review of rationale with experimental evidence from gill and intestine. Biochimica et Biophysica Acta (BBA) - Biomembranes 1566:104-115. [33] Loguinov AV, Mian IS, Vulpe CD. 2004. Exploratory differential gene expression analysis in microarray experiments with no or limited replication. Genome biology 5:R18. [34] Vandesompele J, De Preter K, Pattyn F, Poppe B, Van Roy N, De Paepe A, Speleman F. 2002. Accurate normalization of real-time quantitative RT-PCR data by geometric averaging of multiple internal control genes. Genome Biologoy 3:Research0034. [35] Livak KJ, Schmittgen TD. 2001. Analysis of relative gene expression data using real-time quantitative PCR and the 2(-Delta Delta C(T)) Method. Methods (San Diego, Calif 25:402-408. [36] Sorensen EMB. 1991. Metal Poisoning in Fish. CRC Press, Boca Raton, FL. [37] Ozoh PTE. 1992. The effect of temperature and salinity on copper body-burden and copper toxicity to Hediste (Nereis) diversicolor. Environmental Monitoring and Assessment 21:11-17. [38] Viarengo A, Nicotera P. 1991. Possible role of Ca2+ in heavy metal cytotoxicity. Comp Biochem Physiol C 100:81-84. [39] Manzl C, Enrich J, Ebner H, Dallinger R, Krumschnabel G. 2004. Copper-induced formation of reactive oxygen species causes cell death and disruption of calcium homeostasis in trout hepatocytes. Toxicology 196:57-64. [40] Gunning PW, Ferguson V, Brennan KJ, Hardeman EC. 2001. Alpha-skeletal actin induces a subset of muscle genes independently of muscle differentiation and withdrawal from the cell cycle. Journal of cell science 114:513-524. [41] Takada F, Vander Woude DL, Tong HQ, Thompson TG, Watkins SC, Kunkel LM, Beggs AH. 2001. Myozenin: an alpha-actinin- and gamma-filamin-binding protein of skeletal muscle Z lines. Proceedings of the National Academy of Sciences of the United States of America 98:1595-1600. [42] Inesi G, Hua S, Xu C, Ma H, Seth M, Prasad AM, Sumbilla C. 2005. Studies of Ca2+ ATPase (SERCA) inhibition. Journal of bioenergetics and biomembranes 37:365-368. [43] de Meis L, Oliveira GM, Arruda AP, Santos R, Costa RM, Benchimol M. 2005. The thermogenic activity of rat brown adipose tissue and rabbit white muscle Ca2+-ATPase. IUBMB life 57:337-345. [44] Toescu EC, Verkhratsky A. 2003. Neuronal ageing from an intraneuronal perspective: roles of endoplasmic reticulum and mitochondria. Cell calcium 34:311-323. [45] Verkhratsky A, Toescu EC. 2003. Endoplasmic reticulum Ca(2+) homeostasis and neuronal death. Journal of cellular and molecular medicine 7:351-361. [46] Jockusch H, Friedrich G, Zippel M. 1990. Serum parvalbumin, an indicator of muscle disease in murine dystrophy and myotonia. Muscle & nerve 13:551-555. [47] Rossi AM, Eppenberger HM, Volpe P, Cotrufo R, Wallimann T. 1990. Muscle-type MM creatine kinase is specifically bound to sarcoplasmic reticulum and can support Ca2+ uptake and regulate local ATP/ADP ratios. The Journal of biological chemistry 265:5258-5266. [48] Halliwell B. 1992. Reactive oxygen species and the central nervous system. Journal of neurochemistry 59:1609-1623.
161

POD 2008-2010: Final Report
[49] Camborieux L, Bertrand N, Swerts JP. 1998. Changes in expression and localization of hemopexin and its transcripts in injured nervous system: a comparison of central and peripheral tissues. Neuroscience 82:1039-1052. [50] Swerts JP, Soula C, Sagot Y, Guinaudy MJ, Guillemot JC, Ferrara P, Duprat AM, Cochard P. 1992. Hemopexin is synthesized in peripheral nerves but not in central nervous system and accumulates after axotomy. The Journal of biological chemistry 267:10596-10600. [51] Camborieux L, Julia V, Pipy B, Swerts JP. 2000. Respective roles of inflammation and axonal breakdown in the regulation of peripheral nerve hemopexin: an analysis in rats and in C57BL/Wlds mice. Journal of neuroimmunology 107:29-41. [52] Kifor O, Kifor I, Moore FD, Jr., Butters RR, Jr., Brown EM. 2003. m-Calpain colocalizes with the calcium-sensing receptor (CaR) in caveolae in parathyroid cells and participates in degradation of the CaR. The Journal of biological chemistry 278:31167-31176. [53] Raynaud F, Carnac G, Marcilhac A, Benyamin Y. 2004. m-Calpain implication in cell cycle during muscle precursor cell activation. Experimental cell research 298:48-57. [54] Glass JD, Culver DG, Levey AI, Nash NR. 2002. Very early activation of m-calpain in peripheral nerve during Wallerian degeneration. Journal of the neurological sciences 196:9-20. [55] Le Bihan E, Perrin A, Koueta N. 2004. Development of a bioassay from isolated digestive gland cells of the cuttlefish Sepia officinalis L. (Mollusca Cephalopoda): effect of Cu, Zn and Ag on enzyme activities and cell viability. Journal of Experimental Marine Biology and Ecology 309:47-66. [56] Englyst HN, Cummings JH. 1985. Digestion of the polysaccharides of some cereal foods in the human small intestine. The American journal of clinical nutrition 42:778-787. [57] Poynton HC, Varshavsky JR, Chang B, Cavigiolio G, Chan S, Holman PS, Loguinov AV, Bauer DJ, Komachi K, Theil EC, Perkins EJ, Hughes O, Vulpe CD. 2007. Daphnia magna ecotoxicogenomics provides mechanistic insights into metal toxicity. Environmental science & technology 41:1044-1050. [58] Poynton HC, Zuzow R, Loguinov AV, Perkins EJ, Vulpe CD. 2008. Gene expression profiling in Daphnia magna, part II: validation of a copper specific gene expression signature with effluent from two copper mines in California. Environmental science & technology 42:6257-6263. [59] Lewis SS, Keller SJ. 2009. Identification of copper-responsive genes in an early life stage of the fathead minnow Pimephales promelas. Ecotoxicology (London, England) 18:281-292. [60] Kurokawa T, Uji S, Suzuki T. 2004. Molecular cloning of multiple chitinase genes in Japanese flounder, Paralichthys olivaceus. Comp Biochem Physiol B Biochem Mol Biol 138:255-264. [61] Krogdahl Å, Hemre G-I, Mommsen T. 2005. Carbohydrates in fish nutrition: digestion and absorption in postlarval stages. Aquaculture Nutrition 11:103-122. [62] Magnadottir B. 2006. Innate immunity of fish (overview). Fish & shellfish immunology 20:137-151. [63] Baud V, Karin M. 2001. Signal transduction by tumor necrosis factor and its relatives. Trends in cell biology 11:372-377. [64] Balkwill F, Foxwell B, Brennan F. 2000. TNF is here to stay! Immunology today 21:470-471.
162

POD 2008-2010: Final Report
163
[65] Bottner M, Krieglstein K, Unsicker K. 2000. The transforming growth factor-betas: structure, signaling, and roles in nervous system development and functions. Journal of neurochemistry 75:2227-2240. [66] Echeverry S, Shi XQ, Haw A, Liu H, Zhang ZW, Zhang J. 2009. Transforming growth factor-beta1 impairs neuropathic pain through pleiotropic effects. Molecular pain 5:16. [67] Lippa CF, Smith TW, Flanders KC. 1995. Transforming growth factor-beta: neuronal and glial expression in CNS degenerative diseases. Neurodegeneration 4:425-432. [68] Desmouliere A, Geinoz A, Gabbiani F, Gabbiani G. 1993. Transforming growth factor-beta 1 induces alpha-smooth muscle actin expression in granulation tissue myofibroblasts and in quiescent and growing cultured fibroblasts. The Journal of cell biology 122:103-111. [69] Dixon SC, Knopf KB, Figg WD. 2001. The control of prostate-specific antigen expression and gene regulation by pharmacological agents. Pharmacological reviews 53:73-91. [70] Amir-Aslani A, Mangematin V. The future of drug discovery and development: Shifting emphasis towards personalized medicine. Technological Forecasting and Social Change 77:203-217. [71] Yoshimi T, Minowa K, Karouna-Renier NK, Watanabe C, Sugaya Y, Miura T. 2002. Activation of a stress-induced gene by insecticides in the midge, Chironomus yoshimatsui. Journal of biochemical and molecular toxicology 16:10-17. [72] McClain JS, Oris JT, Burton GA, Jr., Lattier D. 2003. Laboratory and field validation of multiple molecular biomarkers of contaminant exposure in rainbow trout (Oncorhynchus mykiss). Environmental toxicology and chemistry / SETAC 22:361-370. [73] Perceval O, Couillard Y, Pinel-Alloul B, Giguere A, Campbell PG. 2004. Metal-induced stress in bivalves living along a gradient of Cd contamination: relating sub-cellular metal distribution to population-level responses. Aquatic toxicology (Amsterdam, Netherlands) 69:327-345. [74] Roberts AP, Oris JT, Stubblefield WA. 2006. Gene expression in caged juvenile Coho Salmon (Oncorhynchys kisutch) exposed to the waters of Prince William Sound, Alaska. Marine pollution bulletin 52:1527-1532. [75] Brammell BF, McClain JS, Oris JT, Price DJ, Birge WJ, Elskus AA. 2009. CYP1A Expression in Caged Rainbow Trout Discriminates Among Sites with Various Degrees of Polychlorinated Biphenyl Contamination. Archives of environmental contamination and toxicology. [76] Steinberg CE, Sturzenbaum SR, Menzel R. 2008. Genes and environment - Striking the fine balance between sophisticated biomonitoring and true functional environmental genomics. The Science of the total environment 400:142-161. [77] Calabrese EJ. 2008. Hormesis: why it is important to toxicology and toxicologists. Environmental toxicology and chemistry / SETAC 27:1451-1474. [78] Campbell KR. 1994. Concentrations of heavy metals associated with urban runoff in fish living in stormwater treatment ponds. Archives of environmental contamination and toxicology 27:352-356.

POD 2008-2010: Final Report
Manuscript in preparation, for submission to Transactions of the American Fisheries Society
Sublethal responses to ammonia in the endangered delta smelt; Hypomesus transpacificus (Fam. Osmeridae)
Richard E. Connon*, Leandro S. D’Abronzo, Linda Deanovic, and Inge Werner.
Aquatic Toxicology Laboratory, Department of Anatomy, Physiology and Cell Biology, School of Veterinary Medicine, University of California, Davis, California 95616, USA.
To whom correspondence may be addressed: [email protected] (Richard E. Connon)
164

POD 2008-2010: Final Report
Abstract: The delta smelt (Hypomesus transpacificus) is a pelagic fish species endemic to the Sacramento-San Joaquin Estuary in Northern California, listed as endangered under both the USA Federal and Californian State Endangered Species Acts and acts as an indicator of ecosystem health in its habitat range. Interrogative tools are required to successfully monitor effects of contaminants upon the delta smelt, and to research potential causes of population decline in this species. We used microarray technology to investigate genome-wide effects in fish exposed to ammonia; one of multiple contaminants arising from wastewater treatment plants and agricultural runoff. A 4-day exposure of 57-day old larvae resulted in a measured un-ionized ammonia (NH3) LC50 of 147µg.L-1, a NOEC of 66 µg.L-1 and LOEC 105 µg.L-1. We assessed genome-wide expression at 105 µg.L-1 and selected genes were further investigated as molecular biomarkers using quantitative PCR analyses on exposures to 23, 66, 105, 228 and 439 µg.NH3.L
-1. Genes predominantly encoding for membrane bound proteins responded significantly to ammonia exposure, however, neurological and muscular activity were also impaired. We present here our functional gene classification and further investigations into neurological, muscular, immune, growth and development responses significantly affected by exposure to this contaminant. Keywords: ‘Hypomesus transpacificus’, ‘delta smelt’, microarray, biomarker, ammonia Introduction. Contaminants and their potential deleterious effects to fish in the Sacramento-San Joaquin Estuary in Northern California are of particular interest due to negative long-term population trends and a possible step decline in numbers of several pelagic fish species in the years 2000-2001 (Bryant and Souza, 2004; Feyrer et al., 2007; Hieb et al., 2005; Sommer et al., 2007). This trend, known as the pelagic organism decline, has been the focus of an increasing number of investigations over the past several years (Brown et al., 2009; Connon et al., 2009; Sommer et al., 2007). Delta smelt (Hypomesus transpacificus) is one of the species of concern. It is endemic to the Delta and has been listed as endangered under both the USA Federal and Californian State Endangered Species Acts. Ammonia (NH3) originating from municipal wastewater treatment plants, agricultural activity and numerous other sources, is one of multiple contaminants of concern in delta smelt habitat. The term ammonia/um refers to two chemical species which are in equilibrium in water (NH3, un-ionized and NH4+, ionized or nitrogenous ammonia) according to NH3 + H+ NH4+. Tests for ammonia/um usually measure total ammonia plus ammonium, while the toxicity is primarily attributable to the un-ionized form. In general, more un-ionized ammonia and greater toxicity exist at higher pH, because its relative proportion increases with increasing pH according to the following equations (USEPA, 1985):
1 / (1 + 10 pKa-pH ) = % NH3 where: pKa = 0.0902 + [2729.9/(°C+273.2)]
165

POD 2008-2010: Final Report
Temperature will affect this equilibrium, but to a far lesser extent than pH. Acute fish toxicity of ammonia decreases with increasing temperature, but toxicity of total ammonia/um shows no correlation with temperature (USEPA, 1999). This is probably due to an increase in the permeability of biological membranes such as gills by a factor of 2-3 for each 10°C increase in water temperature (Eddy et al., 1995). The Sacramento River drains into delta smelt spawning and larval nursery areas, thus toxicants present in river water could potentially affect early life stages of delta smelt found downstream. Werner et al. (2010), found that ambient ammonia concentrations were greatest in Cache Slough (≤0.025 mg/L nitrogenous ammonia), and near the Sacramento River confluence with the Deep Water Shipping Channel (≤0.021 mg/L nitrogenous ammonia). Ammonia concentrations in the Sacramento River, downstream from the regional wastewater treatment plant were generally lower (≤0.019 mg/L nitrogenous ammonia), likely due to the lower pH of the river water at this location. Interrogative tools are required to successfully monitor effects of contaminants upon the delta smelt, and to research potential causes of population decline in this species. Microarray gene profiling is a powerful tool for defining genome-wide effects of environmental change on biological function. We have developed a microarray for delta smelt (Connon et al., 2009) and present here the application of this tool to investigate genome-wide effects in delta smelt exposed to ammonia/um. We further assess specific genomic responses utilizing quantitative PCR, within functional gene pathways, and assess the validity of using molecular biomarkers as monitoring tools of individual and population damage. Materials and Methods.
Test organisms: Delta smelt were obtained from the Fish Conservation and Culture Laboratory (FCCL), UC Davis and maintained for a minimum of 24 hours in experimental conditions prior to test initiation. All experiments and use of test organisms were approved by the UC Davis Institutional Animal Care and Use Committee (Animal Use Protocol for Animal Care and Use #13361). This institution is accredited by the Association for Assessment and Accreditation of Laboratory Animal Care, International (AAALAC) and has an Animal Welfare Assurance on file with the Office of Laboratory Animal Welfare (OLAW). The Assurance Number is A3433-01.
Exposures: Larval delta smelt (57-d old) were exposed for 4 days to 2.5, 5. 10. 20, 40 and 80 mg.L-1 ammonium chloride prepared in culture water obtained from the FCCL, concentrations that correspond to 23, 66, 105, 228 and 439 µg NH3 L
-1 (un-ionized ammonia). Controls were maintained in culture facility water with specific conductance (SC) of 930 μS.cm-1 and pH of 7.9. Larvae were acclimated to control water for 24 h prior to test initiation. Replicate experimental treatments (n=4) were initiated with 10 larvae in 7L of water at 20°C. Fish were fed twice daily with artemia (<48 h old). The light:dark cycle was 16h:8h. Approximately 80% of the water in each replicate container was renewed at test initiation and on day 2. At test end, surviving fish were euthanized with MS-222 (tricaine methanesulfonate, Sigma, St. Louis, MO, USA), rinsed in de-ionized water and snap-frozen in liquid nitrogen and stored at –80°C for subsequent analyses.
166

POD 2008-2010: Final Report
Experimental physicochemistry: Water temperature, pH, and DO were measured daily. Conductivity was measured at test initiation. Ammonia nitrogen (NH4
+-N) concentrations were measured prior to each water renewal and at test termination.
Genomic assessments - microarrays: Development of the delta smelt microarray was described in Connon et al. (2009) (Connon et al., 2009), briefly we utilized a cDNA microarray with 8,448 expressed sequence tags (ESTs) which were pin-printed in duplicate onto epoxysilane coated glass slides. RNA was extracted from frozen whole, individual organisms, using Trizol Reagent (Invitrogen) as per manufacturer's guidelines. cDNA was synthesized from a total of 1ug total RNA, and amplified using a SuperScripttm Indirect RNA Amplification System (Invitrogen) and labeled with and labeled with Alexa fluor dyes (Invitrogen) as per manufacturer’s instructions. Microarray assessments were carried out using quadruplicate treatments. Microarray hybridizations were performed using an automated Tecan HS4800 hybridization station. Slides were scanned using a GenePix 4000B scanner (Axon Instruments). Microarray images and data from exposed delta smelt can be accessed at under the pelagic organism decline (POD) section at: http://www.vetmed.ucdavis.edu/apc/WernerLab/subpage/pelagic_organism_decline.html.
Data was analyzed using LIMMA GUI (Linear model for microarray analysis graphical user interface) (Smyth, 2005), written in the R-programming language available through Bioconductor http://www.Bioconductor.org. Data was normalized within arrays using print-tip Lowess and between arrays applying aquantile normalization methods (Livak and Schmittgen, 2001). A linear model fit was computed using the duplicates on the arrays and the least-squares method, no multiple assessment methods were applied to eliminate false positives as our aim was to increase the number of genes available for biomarker assessment, and qualify these through quantitative PCR.
Sequencing of differentially expressed features was carried out at the CA&ES Genomic Facility, UC Davis. Basic Local Alignment Search Tool; translated nucleotide (BLASTx) searches were performed on specific fragments that responded significantly to the exposure treatments. Only genes that were differentially expressed following exposure were sequenced. Sequences were annotated according to homologies to protein database searches using translated nucleotide sequences and direct nucleotide queries (http://blast.ncbi.nlm.nih.gov/Blast.cgi). Sequences were only annotated if they were found to have a BLASTx match with the expect value smaller than 1x10⁻⁵ and a score above 50.
Differentially expressed genes were classified according to the Kyoto Encyclopedia of Genes and genomes (KEGG - http://www.genome.jp/kegg/kegg2.html) and Gene Ontology (GO - http://www.uniprot.org/uniprot), and information gathered from literature, into functional groups. Classification was carried out based on gene expression changes in respect of control subjects, regardless of whether these were up- or downregulated. Specific genes of interest were selected for further investigation using quantitative PCR (see below).
Genomic assessments – qPCR: Genes for quantitative PCR assessments were selected according to level of expression significance, knowledge base from literature, and functional classification. Primer and probes for q-PCR analyses were designed using Roche Universal Probe Library Assay Design Center (https://www.roche-applied-science.com). Designed primers were obtained
167

POD 2008-2010: Final Report
from Eurofins MWG Operon (http://www.eurofinsdna.com), and TaqMan probes were supplied by Roche. Sequences for all genes assessed by q-PCR analyses have been submitted to GenBank (http://www.ncbi.nlm.nih.gov). Respective primers and probe systems for investigated biomarkers are detailed in Table 1. Complementary cDNA was synthesized using 1.0 µg total RNA, with random primers and SuperScript® III reverse transcriptase (Invitrogen), and diluted to a total of 120 µl with nuclease free water to generate sufficient template for q-PCR analysis. TaqMan Universal PCR Mastermix (Applied Biosystems) was used in q-PCR amplifications. SDS 2.2.1 software (Applied Biosystems) was used to quantify transcription. We used the geNorm algorithm (Vandesompele et al., 2002) to estimate the variability of the reference genes, and to determine an optimal normalization gene. Quantitative PCR data was analyzed using the relative quantification 2(-Delta Delta CT) method (Livak and Schmittgen, 2001). Expression was calculated relative to-actin determined by GeNorm as the least variable gene in this study. Quantitative PCR data were not normally distributed, therefore, significant differences in gene expression, relative to the unexposed controls, were assessed using two-tailed Mann-Whitney U test, single comparison alpha = 0.05, with Bonferroni’s correction experiment-wide alpha = 0.15, treating each gene as a separate experiment.
Table 1. Primer probe systems designed from microarray assessments on larval delta smelt.
Gene Name Gene Code Primer Left Primer Right Probe No.adenylate_kinase ADK ctgtcttctggggacctgttg ctcctttctgcataattgcctgt 36calmodulin CaM ttccttattcgacatggatggc gcagacccagtgactgcatg 17claudin-10 CLDN10 ctgcctcggattctttggtg cctccaattttggtgcacttc 140epimorphin EpiM ctttcgggaaaggaccaaaac tgcttgtcacttttcccagttatc 94hla HLA atcgtgtctgtggagaaacaggt ggaagctctggttgaactcgg 25keratin-15 Ker15 ccagcaaaaccagttactcctcc cctgatgagcctccatacctca 38myosin-regulatory-light-chain-2 MYL2 catgggagaccgcttcacc tgtcgatgggagcttcacg 10septin-3 SEPT3 ggctttgacctcaacattatggt cttgagcagagtgttgaccagagt 60sirtuin-6 SIRT6 gaagccgacaggacgctact ttccctctgcaggctctgag 1transmembrane-4-l6-family-member-4 Tm4sf4 ccctggctctcatctccatc ccatctttggcatacttcacc 64tropomyosin TPM tcccttaacagacgcatccag cagtagccagacgctcctgtg 101tubulin-folding-cofactor-b TBCB gactcctgcagctggtatgga ccagcttctgcaggaacttgtc 78Alpha-Actin A-Actin cctgcctcgtcgtactcctg catcctggcttccctgtcc 11Amylase Amy gatcaccatgttcttgatctgacg ccatcaatcctgaccaaacctg 99Beta-Actin B-Actin tgccacaggactccatacc catcggcaacgagaggtt 12Creatine Kinase CK cgatcggcgttggagatg gccaagttcaacgagattctgg 163Myozenin MyoZ ccaatgtcgtgctggtacacc ctgccagacattgatgtagcca 106SER-Ca SER CA catgatcattgggggagca tgctgtgatgacaacgaggac 148TGF-B TGF-b caacggcatagtgcatgtgg gaatgtgtgcacgttgttggt 76Tumor Necrosis Factor TNF ctttttccgctgttccatgttc gttaccagcatacgcagtgtcc 2Aspartoacylase ASPA ggaggcacacatgggaatg cttcctctgaatctctgttccattatc 109Hemopexin HPEX catgcactacgaggacgacaag tggtagtagctgaacaccttgctg 143Titin-a Titin tgatcactggcgtgaaagagg caagctcattggacagtttgagg 159Zona Pellucida ZPA catgcggctgagtttggataa tgccattgatagcatcaacttca 106
168

POD 2008-2010: Final Report
Results and Discussion. Acute toxicity: 4-day exposure of 57-day old larvae to ammonium chloride resulted in a nominal LC50 of 13 mg.L-1, a NOEC of 5 mg.L-1 and LOEC 10mg.L-1, corresponding to measured un-ionized ammonia (NH3) LC50 of 147µg.L-1, a NOEC of 66 µg.L-1 and LOEC 105 µg.L-1 (Table 2 and Fig 1).
Table 2. Ammonium chloride toxicity data on 57-d old larval delta smelt (96-h exposure). Calculated and measured ammonia/um concentrations.
0
1
2
3
4
5
6
7
8
9
10
0 100 200 300 400
Mean un-ionized ammonia (g.L-1)
Mea
n su
rviv
al o
f 10
larv
ae (
n=4)
Figure 1. Mean survival (± standard errors) of larval delta smelt exposed to ammonium chloride (96-h exposure). Data expressed as un-ionized ammonia.
Experimental physicochemistry: Temperature, DO and pH remained stable throughout the test duration. Mean data for water temperature, conductivity, DO, pH, ionized and un-ionized ammonia data is shown in table 3.
169

POD 2008-2010: Final Report
Table 3. Mean ammonia/um concentrations and physicochemical parameters from 96-h exposure of larval delta smelt to ammonium chloride.
Genomic assessments: A wide variety of genes from a number of functional pathways were affected by exposure to ammonium chloride (Fig. 2a), of which genes encoding for membrane bound proteins were prominent (56%) (Fig 2b). Microarray assessment of identified a number of genes that were predominantly related to membrane integrity, membrane bound proteins responsible for ion transport and ionic exchange. This has previously been reported and is attributed to changes in cellular pH resulting from ammonium gradients (Martinelle and Haggstrom, 1993; Randall and Tsui, 2002; Wicks et al., 2002). Neurological and muscular activity was also affected by exposure to ammonium chloride, suggesting possible effects on swimming performance however this was not assessed in this study. Effects of ammonia on swimming performance has been reported in past studies (McKenzie et al., 2009; Wicks et al., 2002).
170
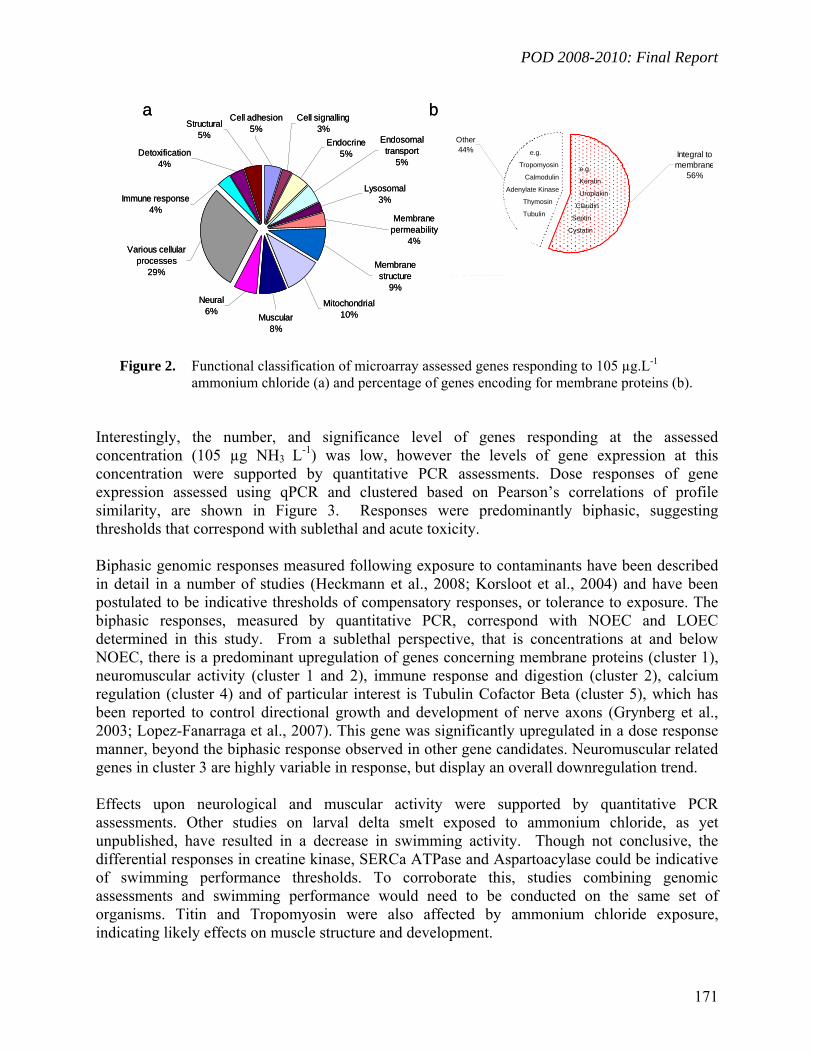
POD 2008-2010: Final Report
Integral to membrane
56%
Other44%
e.g.
Keratin
Uroplakin
Claudin
Septin
Cystatin
e.g.
Tropomyosin
Calmodulin
Adenylate Kinase
Thymosin
Tubulin
Integral to membrane
56%
Other44%
e.g.
Keratin
Uroplakin
Claudin
Septin
Cystatin
e.g.
Tropomyosin
Calmodulin
Adenylate Kinase
Thymosin
Tubulin
4-d exposure
57-d old larvae
Structural5%
Detoxification4%
Immune response4%
Various cellular processes
29%
Neural6%
Muscular8%
Membrane structure
9%
Mitochondrial10%
Membrane permeability
4%
Lysosomal3%
Endosomal transport
5%
Endocrine5%
Cell signalling3%
Cell adhesion5%
4-d exposure
57-d old larvae
a b
Integral to membrane
56%
Other44%
e.g.
Keratin
Uroplakin
Claudin
Septin
Cystatin
e.g.
Tropomyosin
Calmodulin
Adenylate Kinase
Thymosin
Tubulin
Integral to membrane
56%
Other44%
e.g.
Keratin
Uroplakin
Claudin
Septin
Cystatin
e.g.
Tropomyosin
Calmodulin
Adenylate Kinase
Thymosin
Tubulin
4-d exposure
57-d old larvae
Structural5%
Detoxification4%
Immune response4%
Various cellular processes
29%
Neural6%
Muscular8%
Membrane structure
9%
Mitochondrial10%
Membrane permeability
4%
Lysosomal3%
Endosomal transport
5%
Endocrine5%
Cell signalling3%
Cell adhesion5%
4-d exposure
57-d old larvae
a b
Figure 2. Functional classification of microarray assessed genes responding to 105 µg.L-1 ammonium chloride (a) and percentage of genes encoding for membrane proteins (b).
Interestingly, the number, and significance level of genes responding at the assessed concentration (105 µg NH3 L-1) was low, however the levels of gene expression at this concentration were supported by quantitative PCR assessments. Dose responses of gene expression assessed using qPCR and clustered based on Pearson’s correlations of profile similarity, are shown in Figure 3. Responses were predominantly biphasic, suggesting thresholds that correspond with sublethal and acute toxicity. Biphasic genomic responses measured following exposure to contaminants have been described in detail in a number of studies (Heckmann et al., 2008; Korsloot et al., 2004) and have been postulated to be indicative thresholds of compensatory responses, or tolerance to exposure. The biphasic responses, measured by quantitative PCR, correspond with NOEC and LOEC determined in this study. From a sublethal perspective, that is concentrations at and below NOEC, there is a predominant upregulation of genes concerning membrane proteins (cluster 1), neuromuscular activity (cluster 1 and 2), immune response and digestion (cluster 2), calcium regulation (cluster 4) and of particular interest is Tubulin Cofactor Beta (cluster 5), which has been reported to control directional growth and development of nerve axons (Grynberg et al., 2003; Lopez-Fanarraga et al., 2007). This gene was significantly upregulated in a dose response manner, beyond the biphasic response observed in other gene candidates. Neuromuscular related genes in cluster 3 are highly variable in response, but display an overall downregulation trend. Effects upon neurological and muscular activity were supported by quantitative PCR assessments. Other studies on larval delta smelt exposed to ammonium chloride, as yet unpublished, have resulted in a decrease in swimming activity. Though not conclusive, the differential responses in creatine kinase, SERCa ATPase and Aspartoacylase could be indicative of swimming performance thresholds. To corroborate this, studies combining genomic assessments and swimming performance would need to be conducted on the same set of organisms. Titin and Tropomyosin were also affected by ammonium chloride exposure, indicating likely effects on muscle structure and development.
171

POD 2008-2010: Final Report
Genomic responses at sublethal concentrations of ammonium chloride indicate that membrane systems are being affected by exposure, affecting overall osmoregulation capacity. The biphasic response, observed primarily at 105 µg NH3 L-1 could indicate a threshold beyond which organisms can no longer compensate for exposure. Acknowledgements We would like to thank the staff of the UC Davis Aquatic Toxicology Laboratory for assistance with exposure experiments. This study was supported by the Interagency Ecological Program, Sacramento, California (Contract No. 4600008070 to I. Werner).
172

POD 2008-2010: Final Report
Figure 3. Pearson Correlation cluster analysis of quantitative PCR assessed genes responding in larval delta smelt to 96-h ammonium chloride exposure. Significance levels are displayed for NOEC at 66 µg NH3 L
-1 ( * = p<0.05 and ** = p<0.01).
-4
-3
-2
-1
0
1
2
3
4
5
0 100 200 300 400 500
Amy Titin ASPA
TGF-b ZPA SERCa
-4
-3
-2
-1
0
1
2
3
4
5
0 100 200 300 400 500
a-Actin Myo
MYL2 Hpex
-4
-3
-2
-1
0
1
2
3
4
5
0 100 200 300 400 500
CK CLDN10 Ker15
Sept3 SIRT6 ADK
TPM EpiM TM4
-4
-3
-2
-1
0
1
2
3
4
5
0 100 200 300 400 500
CaM
-4
-3
-2
-1
0
1
2
3
4
5
0 100 200 300 400 500
TBCB
Rel
ativ
e ge
ne e
xpre
ssio
n (n
orm
aliz
ed to
b-A
ctin
)
Un-ionized ammonia (g.L-1)
Un-ionized ammonia (g.L-1)
NOEC
LOEC
**
**
* **
* **
*
173
POD 2008-2010: Final Report
References. Brown LR, Kimmerer W, Brown R. Managing water to protect fish: a review of California's
Environmental Water Account, 2001-2005. Environ Manage 2009; 43: 357-68. Bryant M, Souza K. Summer townet and fall midwater trawl survey status and trends.
Interagency Ecological Program Newsletter. 17, 2004, pp. 14-17. Connon RE, Geist J, Pfeiff J, Loguinov AV, D'Abronzo L, Wintz H, et al. Linking mechanistic
and behavioral responses to sublethal esfenvalerate exposure in the endangered delta smelt; Hypomesus transpacificus (Fam. Osmeridae). BMC Genomics. 10, 2009, pp. 608.
Eddy FB, Penrice WS, Fernandes MN, Hill GF. K+ balance in rainbow trout gill and liver tissue, cell suspensions and cultured cells. Braz J Med Biol Res 1995; 28: 1319-25.
Feyrer F, Nobriga ML, Sommer TR. Multidecal trends for three declining fish species: habitat patterns and mechanisms in the San Francisco Estuary, California, USA. Journal of Fisheries and Aquatic Sciences 2007; 64: 723-734.
Grynberg M, Jaroszewski L, Godzik A. Domain analysis of the tubulin cofactor system: a model for tubulin folding and dimerization. BMC Bioinformatics 2003; 4: 46.
Heckmann LH, Sibly RM, Connon R, Hooper HL, Hutchinson TH, Maund SJ, et al. Systems biology meets stress ecology: linking molecular and organismal stress responses in Daphnia magna. Genome Biol 2008; 9: R40.
Hieb K, Bryant M, Souza K, Greiner T, Slater S. Place holder for bay and estuary species 2004 status and trends report. Interagency Ecological Program Newsletter. 18, 2005, pp. 6-10.
Korsloot A, van Gestel CAM, van Straalen NM. Environmental Stress and Cellular Response in Arthropods. Boca Raton, FL: CRC Press, 2004.
Livak KJ, Schmittgen TD. Analysis of relative gene expression data using real-time quantitative PCR and the 2(-Delta Delta C(T)) Method. Methods 2001; 25: 402-8.
Lopez-Fanarraga M, Carranza G, Bellido J, Kortazar D, Villegas JC, Zabala JC. Tubulin cofactor B plays a role in the neuronal growth cone. J Neurochem 2007; 100: 1680-7.
Martinelle K, Haggstrom L. Mechanisms of ammonia and ammonium ion toxicity in animal cells: transport across cell membranes. J Biotechnol 1993; 30: 339-50.
McKenzie DJ, Shingles A, Claireaux G, Domenici P. Sublethal concentrations of ammonia impair performance of the teleost fast-start escape response. Physiol Biochem Zool 2009; 82: 353-62.
Randall DJ, Tsui TK. Ammonia toxicity in fish. Mar Pollut Bull 2002; 45: 17-23. Smyth GK. Limma: linear models for microarray data. In: Gentleman R, Carry V, Dudoit S,
Irizarry R, Huber W, editors. Bioinformatics and computational biology solutions using R and Bioconductor. Springer, New York, NY., 2005, pp. 397–420.
Sommer T, Armor C, Baxter R, Breuer R, Brown L, Chotkowski M, et al. The collapse of pelagic fishes in the upper san francisco estuary. Fisheries 2007; 32: 270-277.
USEPA. Ambient water quality criteria for ammonia. EPA-440/5-85/001. Office of Water Regulations and Standards. Criteria and Standards Division. Washington, DC., 1985.
USEPA. Update of ambient water quality criteria for ammonia. EPA-822-R-99-014, US Environmental Protection Agency, Office of Water, Washington, D.C. 1999.
Vandesompele J, De Preter K, Pattyn F, Poppe B, Van Roy N, De Paepe A, et al. Accurate normalization of real-time quantitative RT-PCR data by geometric averaging of multiple internal control genes. Genome Biologoy 2002; 3: Research0034.
174

POD 2008-2010: Final Report
175
Werner I, Deanovic LA, Markiewicz D, Stillway M, Offer N, Connon R, et al. Pelagic Organism Decline (POD): Acute and Chronic Invertebrate and Fish Toxicity Testing in the Sacramento-San Joaquin Delta 2006-2007, 2008.
Wicks BJ, Joensen R, Tang Q, Randall DJ. Swimming and ammonia toxicity in salmonids: the effect of sub lethal ammonia exposure on the swimming performance of coho salmon and the acute toxicity of ammonia in swimming and resting rainbow trout. Aquat Toxicol 2002; 59: 55-69.

POD 2008-2010: Final Report
Manuscript in preparation.
Cytochrome P450 induction in the striped bass (Morone saxatilis): signature biomarkers of past and present xenobiotic exposure Richard E. Connon1, E.D.H. Durieux2, 3, Leandro S. D’Abronzo1, David J. Ostrach2 and Inge Werner1. 1 School of Veterinary Medicine, Department of Anatomy, Physiology and Cell Biology, University of California, Davis, California 95616, USA. 2 Pathobiology, Conservation & Population Biology Laboratory, John Muir Institute of the Environment, Center for Watershed Sciences, University of California, Davis, One Shields Avenue, Davis, CA 95616, USA 3 IFREMER, Centre de Recherche Halieutique Méditerranéenne et Tropicale, Laboratoire Ressources Halieutiques, Avenue Jean Monnet BP 171, 34203 Sète cedex France (Current address).
176

POD 2008-2010: Final Report
Introduction Cytochrome P4501A (CYP1A) is a monooxygenase involved in xenobiotic biotransformation and detoxification. Induction of CYP1A is a powerful biomarker of exposure to polycyclic aromatic hydrocarbons (PAH) and has been widely used in aquatic biomonitoring. Polycyclic aromatic hydrocarbons are widespread contaminants in the San Francisco Bay, a detailed account of which is given by Oros et al (2007). PAHs generally occur as complex mixtures originating from a variety of sources; storm water runoff, wastewater treatment plant effluent, atmospheric deposition and dredged material disposal. Exposure to PAH has been reported to result in weight loss, immune system dysfunction, hyperkeratinization, tumor promotion, edema formation and increased mortality (Poland and Knutson 1982) and alteration of sex hormones in female fish (Spies and Rice Jr 1988). Along with other pelagic fish species in the San Francisco Estuary, the striped bass (Morone saxatilis) have suffered a significant decline in numbers (Bennett and Moyle 1996; Feyrer et al. 2007), and contaminants are likely to have contributed to this decline (Bailey et al. 1994; Bennett et al. 1995; Ostrach et al. 2008; Stevens et al. 1985). Striped bass were introduced from the East coast of USA in the late 1880s, now supports a valuable recreational fishery, and is among the most important piscivorous fish of the Estuary. The aim of this study was to investigate the dynamics of CYP1A induction at different biological levels of organization (RNA transcription / protein synthesis / catalytic activity) in order to define the respective ranges of utilization as biomarkers of PAHs contamination in this species, and to better understand the relationship of CYP1A gene expression with higher level cellular effects. Toxic responses are directly linked to a contaminant’s mode of action, and are generally preceded by alterations in gene transcription (Connon et al. 2009). Although RNA is not the final product of a gene, as the gene function is carried out by the resulting protein, protein expression is influenced and regulated by many processes downstream of mRNA synthesis. Thus by measuring CYP1A mRNA levels it is possible to predict resulting protein activity. -naphthoflavone (BNF), a commonly used PAH model compound, was used to induce CYP1A responses in juvenile striped bass. This chemical has been widely used as inducer of genes involved in xenobiotic metabolism; phase I and phase II enzymes. As well as inducing cellular detoxification pathways, BNF has been reported to significantly modulate transcription of genes involved in neuroendocrine control of stress and reproduction (Aluru and Vijayan 2008), thus CYP1A has been proposed as a biomarker of exposure to a number of contaminants (Anderson 2007).
Methods Fish handling: Striped bass juveniles used in this study were one year old fish produced from a domestic brood stock at the Center for Aquatic Biology and Aquaculture. Fish were moved to the experimental facility two days prior the start of the experiment. They were maintained in circular flow-through tanks (10 fish per tank) at 19 – 20 °C water temperature and under natural photoperiod. Fish were fed daily at 2.5% body weight with #3 Crumbled Salmon / Trout (Silver Cup, Murray, UT 84157).
177

POD 2008-2010: Final Report
BNF exposures: Fish were dosed through intra-peritoneal injections in two experiments: (i) a 24h dose response to concentrations ranging from BNF (Sigma-Aldrich Corporation) 0.1 to 50 mg.kg-
1, and (ii) a time response study at 0 h, 6 h, 12 h, 24 h, 2 d, 4 d and 8 d after exposure to BNF 10mg.kg-1 and to solvent control. Ten fish were used per time / exposure was used. Fish at 0h received no injection. Corn oil (Sunny Select, Super store industries, Lathrop, CA 95330) was used for BNF dilution and as solvent control. Fish were not fed the day prior the injection. Experiments were carried out from 16/07/08 till 24/07/08. Prior to injection, fish were anesthetized with MS-222 100mg.L-1. Fish were sacrificed using an overdose of MS-222. Fish livers were dissected and immediately snap frozen in liquid nitrogen.
Sample preparation: Liver tissue was ground in liquid nitrogen to a fine powder using mortar and pestle and aliquoted into two separate microcentrifuge tubes and then stored at -80°C for subsequent molecular and protein analyzes.
RNA extraction and cDNA synthesis: Total RNA was extracted from powdered liver tissue using RNeasy Mini Kit (Qiagen Inc., Valencia, CA), with on-column DNAse digestion, as per manufactures protocol. Samples were quantified using a NanoDrop spectrophotometer and their quality verified by electrophoresis on 1% agarose gel. Complementary DNA (cDNA) was synthesized using 100 units of SuperScript III (Invitrogen, Carlsbad, CA, USA), 600 ng random hexadeoxyribonucleotide (pd(N)6) primers (random hexamer primer), 10U RNaseOut (RNase inhibitor), and 1mM dNTPs (all Invitrogen, Carlsbad, CA, USA).
Quantitative PCR: We measured CYP1A gene expression in striped bass using specific probes and primers designed for quantitative PCR (qPCR), as detailed in Table 1. -actin was used as a housekeeping gene, to which CYP1A expression was normalized. TaqMan Universal PCR Mastermix (Applied Biosystems) was used in cDNA amplifications using an automated fluorometer (ABI PRISM 7900 Sequence Detection System, Applied Biosystems). Table 1. Primer and Probes for CYP1A and -actin used for quantitative PCR assessments of gene expression in striped bass.
Gene Primer Roche Probe CYP1A Forward: GCGGCACAACCCCAGAGTA
Reverse: CAGCTTTCATGACGGTGTTGAG No. 65; CTGGAGGA
-actin Forward GCAATGAGAGGTTCCGTTGC Reverse GCAGGACTCCATACCGAGGAA
No. 11; CTTCCAGC
CYP1A Protein quantification: A CYP1A competitive-ELISA for striped bass was developed as described by Tom et al (2002). A brief method description is provided below.
CYP1A protein production: A strain of Escherichia coli that contained an antigenic fragment of Lithognathus mormyrus CYP1A1 gene was obtained from Dr. Moshe Tom, Israel Oceanographic and Limnological Research, Haifa, Israel. This bacterium was grown over night in Lysogeny Broth with 100 µg/mL ampicillin at 37 ºC overnight to produce a starter culture. This was used to inoculate one liter of Terrific Broth + 50 µg/mL ampicillin + 1.0 mM thiamine at 37 ºC. This was grown for four hours and then heme precursor δ-aminolevulinic acid and inducer isopropyl
178

POD 2008-2010: Final Report
β-D-1-thiogalactopyranoside (IPTG) was added to a final concentration of 0.5 mM, and the culture was incubated at 28 ºC for 24 hours. After a first centrifugation at 5,000 x g for 15 minutes in 250ml flasks, bacteria were harvested and then condensed into 50 mL centrifuge tube after a second centrifugation. The cells were resuspended into 30 mL of 0.1 M potassium phosphate buffer + 20% glycerol + 0.1 mM DTT and EDTA (pH 7.4). 0.5 mg/ml of egg white lysozyme was added to the buffer and incubated for one hour at 4 ºC. A nonselective protease inhibitor (Sigma P8340) to a dilution of 1/10,000 and 1 µg/ml DNAaseI was added. The resulted spheroplast suspension was then sonicated with a high powered probe sonicator at 25 Watts, 8 times for 30 seconds while being held on ice and then centrifuged at 30,000 g for 2 hours. The CYP1A containing cytosol was saved and the pellet was discarded. CYP1A protein purification: The CYP1A containing cytosol was purified on a Ni+ NTA Agarose (Qiagen) column equilibrated with 50 mM potassium phosphate buffer containing 0.2 M NaCl, 20 mM glycine, 20% glycerol and supported with 0.1 mM of both EDTA and DDT running buffer. The poly-His tail that was added on the recombinant protein fragment has a high affinity for the Ni+ ion and allows for the crude extract to pass through and enrich the solution with the protein of interest. The protein was eluted from the column with running buffer containing 50 mM histidine. The fractions of protein were analyzed for total protein with the BioRad DC protein assay, and further analyzed with SDS polyacrylamide gel (InVitrogen NuPAGE) to determine the fractions that had high concentrations of CYP1A. These fractions were pooled, and analyzed with the BioRad DC protein assay to determine total protein content and by SDS gel to determine the CYP1A protein concentration. The results of the SDS gel showed a prominent band at 55kDa matching the molecular weight of the CYP1A protein fragment with a concentration of 0.18 µg/µL in the produced stock. CYP1A competitive-ELISA optimization: The CYP1A protein fraction was coated on high binding 96 well plates (Costar 3925, Black) at a level of 100, 200 ng/mL CYP1A1 protein fragment in Bicarbonate buffer, pH 9.6. This plate was then blocked with PBS buffer pH 7.5 containing 1% Hammerstein Casein, 1.0 mM Ethylene diamine tetra acetic acid (EDTA), and 0.05% Tween 20. Following this, the plate was first assayed with several concentrations (1/5,000 and 1/10,000 dilutions) of Mouse Anti-Trout CYP1A1 antibody (Biosense Laboratories) and then labeled with a marker antibody, Goat Anti Mouse Horse Radish Peroxidase (HRP) conjugate (Jackson Immuno Research), 1/10,000 dilution. This reporter Ab-Enzyme conjugate catalyzed the reaction with the substrates ADHP or Amplex Red (Anaspec Inc.), 35.4 µM, and Urea Hydrogen Peroxide, 1.76 mM in 0.05 M Sodium Phosphate buffer, pH 7.4. Fluorescence was measured at 544 nm excitation with 590 nm emission on a Wallac Victor 2 Fluorescence Plate Reader. The results confirmed that the antigenic CYP1A protein fragment was present. The assay has been optimized to contain a 200 ng/ml CYP1A coating step, 1/10,000 dilution of Mouse anti-Striped Bass CYP1A (Biosense Laboratories) competitive binding step, and a 1/10,000 dilution of Goat anti Mouse-HRP reporter Ab-enzyme step of the competitive ELISA assay. EROD assay for quantification of Cytochrome P450 enzyme activity: Livers were prepared for EROD analysis according modifications of the procedures of (Hodson, Efler et al. 1996; Billiard, Bols et al. 2004). Briefly, livers were homogenized in 10 volumes of ice cold 0.02 M HEPES, 0.15 M KCl, pH 7.5 with 0.22 mM AEBSF and 1/200 Sigma Protease Inhibitor Cocktail.
179

POD 2008-2010: Final Report
Following centrifugation at 10,000xG for 15 minutes at 4°C, the S9 supernatant fractions were stored at –80°C. The S9 fractions (40 μl) were then diluted 2-fold and added in triplicate to Costar #3915 black, 96-well plates. Then 40 μl of 10 μM Resorufin ethyl ether in 0.1 M HEPES, 0.1% BSA, pH 7.8 was added for the EROD assays. Forty μl of preincubated NADPH generating system was added to result in a final concentration of 0.8 mm NADP+, 4.8 mM glucose-6-phosphate, 3.2 mM MgCl2 and 0.5 Units/ml glucose-6-Phosphate Dehydrogenase. EROD activity was then determined immediately by measuring fluorescence with Excitation 544 and emission 590 on a Perkin Elmer/Wallace Victor2 fluorescent plate reader. Plates were re-read every 2 minutes and the pmoles product formed estimated from resorufin standard curves. Previous studies (Radenac, Coteir et al. 2004), as well as, preliminary studies in our laboratory, showed that the Resorufin ethyl ether substrate has a slight overlap in fluorescence with that of the resorufin product, and also attenuated the excitation/emission of the product. Thus, resorufin standard curves were spiked on 40 μl of 10 μM substrate to correct for the interference by the initial concentration of substrate. Protein was determined using Bio-Rad DC protein assay with BSA as standard. EROD activity over the 10-minute incubation was calculated as pmole resorufin formed per mg protein per minute.
Results
Gene expression: CYP1A mRNA transcription was significantly upregulated in a dose response manner following 24 h post BNF injection, reaching a plateau at 25 mg.Kg-1 at 180-fold change induction (p<0.001) (Figure 1). Significant differences were measured at concentrations as low as 0.1 mg.Kg-1 resulting in a 12-fold change in gene expression (p<0.05). The median response was 10 mg.Kg-1, nearing 100-fold change in gene expression (p<0.001), a concentration selected for timed exposure.
-50
0
50
100
150
200
250
300
0 10 20 30 40 50
BNF dose (mg.kg-1)
Cyp
1a
tra
nsc
rip
tion
(re
lativ
e t
o -
Act
in)
Figure 1. Dose-dependent change in CYP1A gene expression in striped bass exposed for 24 h to 0.1 to 50 mg.Kg-1 -naphthoflavone naphthoflavone (mean +/- standard error).
180

POD 2008-2010: Final Report
Timed BNF exposure displayed a 240-fold peak in CYP1A mRNA transcription (p<0.0001) at 6 h post injection, reducing after 8 d exposure, though remaining significantly different compared to both time 0, and respective solvent controls (p<0.001) at 35-fold change in expression (Figure 2).
-50
0
50
100
150
200
250
300
0 1 2 3 4 5 6 7 8 9
Time after exposure (days)
Cyp
1a tra
nsc
riptio
n (
rela
tive to -
Act
in) Solvent control
BNF 10 mg/kg
T0
Figure 2. Time-dependent change in CYP1A gene expression in striped bass exposed to 10mg.kg-1 -naphthoflavone (mean +/- standard error).
Protein translation: Quantities of CYP1A protein measured in striped bass exposed to 10 mg.kg-1 -naphtoflavone increased cumulatively until day 4 of the experiment decreasing slightly by day 8. Protein levels after 8 d were significantly higher (approximately 3–fold) than those measured in control fish (Figure 3).
0
2
4
6
8
10
0 1 2 3 4 5 6 7 8 9
Time after exposure (days)
CY
P1A
1 co
nte
nt
µg
/mg
pro
t
Solvent Control
BNF 10 mg.kg-1
T0
Figure 3. Change in CYP1A protein of striped bass induced with 10 mg.kg-1 -naphtoflavone compared to solvent control (mean +/- standard error).
181

POD 2008-2010: Final Report
Enzyme activity: P450 Enzyme activity, as measured by EROD, increased rapidly upon exposure to BNF, and reached a peak after 12 h post-injection. It declined after that to near control levels by day 8 (Figure 4).
0
15
30
45
60
75
90
0 1 2 3 4 5 6 7 8 9
Time after exposure (days)
ER
OD
Ac
tiv
ity
(p
mo
les
/mg
pro
t/m
in) Solvent Control
BNF 10 mg.kg-1
T0
Figure 4. Change in EROD activity of striped bass induced with 10 mg.kg-1 -naphtoflavone compared to solvent controls (mean +/- standard error).
Comparatively, mRNA transcription and enzymatic activity displayed a similar trend (Figure 5). Expected differences in peak responses were observed, corresponding to mRNA transcription sequentially followed by protein synthesis and resulting enzymatic activity.
0
50
100
150
200
250
300
0 1 2 3 4 5 6 7 8
Time after exposure (days)
Cyp
1a tr
ansc
riptio
n (r
elat
ive
to b
-Act
in)
0
10
20
30
40
50
60
70
80
ER
OD
Act
ivity
(pm
oles
/min
/mg
prot
)
mRNA
EROD
Figure 5. Time dependent change in CYP1A mRNA transcription and EROD activity in striped bass, induced by intraperitoneal injection with 10 mg.kg-1 -naphtoflavone.
182

POD 2008-2010: Final Report
Discussion All organisms respond to environmental stress by regulating gene expression; templates for protein synthesis. Thus gene expression is the first measurable parameter in response to a stimulus. Linking the molecular, cellular, whole organism and population responses to stressors remains one of the great challenges in ecology and ecotoxicology (Walker et al. 2006), thus the information generated in this study will improve the predictive powers of gene expression measurements as early warning biomarkers of exposure and effect.
CYP1A gene expression responded rapidly to PAH exposure, and corresponding biotransformation and detoxification proteins were synthesized within the first few hours of exposure. An expected lag time was measured between mRNA synthesis (peak at 6h) and resulting protein activity (peak at 12h). Relative lag time is expected to be less than that observed, however interpretation is restricted by the time points measured in the present study. Accumulation of CYP1A protein and protein activity, measured as EROD, displayed significantly different trends. This may be due to the fact that EROD measures the catalytic activity of CYP1A, specifically involved in O-deetheylisation (Cousinou et al. 2000; Whyte et al. 2000), whilst the competitive ELISA is aimed at quantifying the protein (Brammell et al. 2010; Tom et al. 2002). CYP1A protein is considered an excellent indicator of PAH exposure, but has also been shown to be involved in neuroendocrine control of stress and reproduction (Aluru and Vijayan 2008), by altering sex hormones (Spies and Rice Jr 1988), as well as affecting the immune system, and promoting tumor formation, and eventual death (Poland and Knutson 1982). The rapid gene expression following BNF injection observed in this study supports the use of this biomarker to detect recent sublethal exposure to PAH. Preliminary results suggest a good correlation between enzymatic activity and gene expression, with a cumulative increase in protein up to day 4 of the experimental period. Measuring both genomic and proteomic responses could thus provide information on the time of xenobiotic exposure, where gene expression is used to detect recent exposures and cumulative protein is indicative of past exposures, whereas the joint response could indicate chronic exposure. Further analyses of data from these tests are currently underway, and additional striped bass genes are being investigated in response to BNF exposure within the context of this study. Sequential induction of mRNA was followed by protein activity, peaking at 6 and 12 h respectively, and remaining significantly induced over the 8 d treatment. Total CYP1A protein was seen to accumulate throughout the duration of this study, peaking at day 4. This study has demonstrated that all three striped bass biomarker methods used to measure the effect of BNF exposure were successful in detecting CYP1A induction. Though confirmatory studies are still required, models utilizing the differences in responses measured by each of the three biomarkers could be used to detect, in field situations, signatures of past and/or current exposure.
Acknowledgements Funding for this study was provided by the Interagency Ecological Program on Pelagic Organism Decline Investigations, Department of Water Resources, Sacramento, California, contract
183

POD 2008-2010: Final Report
Numbers 4600004445 to I. Werner, and 4600004664 to D. Ostrach. We would also like to thank all staff and students at the University of California, Davis, that were involved in exposures and sample preparations.
References Aluru, N., and M. M. Vijayan. 2008. Brain transcriptomics in response to beta-naphthoflavone
treatment in rainbow trout: the role of aryl hydrocarbon receptor signaling. Aquat Toxicol 87(1):1-12.
Anderson, S. L. 2007. Biomarkers and the pelagic organism decline: Conclusions of the POD Biomarker Task Force, Fort Mason, San Francisco, August 29-30, 2007.
Bailey, H. C., and coauthors. 1994. The effect of agricultural discharge on striped bass (Morone saxatilis) in California's Sacramento-San Joaquin drainage. Ecotoxicology 3(2):123-142.
Bennett, W., and P. Moyle. 1996. Where have all the fishes gone? Interactive factors producing fish declines in the Sacramento-San Joaquin Estuary. Pages 479-518 in J. Holligaugh, editor. San Francisco Bay: the ecosystem. Pacific Division of the American Association for the Advancement of Science, San Francisco.
Bennett, W. A., D. J. Ostrach, and D. E. Hinton. 1995. Larval Striped Bass Condition in a Drought-Stricken Estuary: Evaluating Pelagic Food-Web Limitation. Ecological Applications 5(3):680-692.
Brammell, B. F., and coauthors. 2010. CYP1A expression in caged rainbow trout discriminates among sites with various degrees of polychlorinated biphenyl contamination. Arch Environ Contam Toxicol 58(3):772-82.
Connon, R. E., and coauthors. 2009. Linking mechanistic and behavioral responses to sublethal esfenvalerate exposure in the endangered delta smelt; Hypomesus transpacificus (Fam. Osmeridae). Pages 608 in BMC Genomics.
Cousinou, M., B. Nilsen, J. López-Barea, and G. Dorado. 2000. New methods to use fish cytochrome P4501A to assess marine organic pollutants. Sci Total Environ 247(2-3):213-225.
Feyrer, F., M. L. Nobriga, and T. R. Sommer. 2007. Multidecadal trends for three declining fish species: habitat patterns and mechanisms in the San Francisco Estuary, California, USA. Canadian Journal of Fisheries and Aquatic Sciences 64:723-734.
Oros, D. R., J. R. Ross, R. B. Spies, and T. Mumley. 2007. Polycyclic aromatic hydrocarbon (PAH) contamination in San Francisco Bay: a 10-year retrospective of monitoring in an urbanized estuary. Environ Res 105(1):101-18.
Ostrach, D. J., J. M. Low-Marchelli, K. J. Eder, S. J. Whiteman, and J. G. Zinkl. 2008. Maternal transfer of xenobiotics and effects on larval striped bass in the San Francisco Estuary. Proceedings of the National Academy of Sciences 105(49):19354-19359.
Poland, A., and J. C. Knutson. 1982. 2,3,7,8-tetrachlorodibenzo-p-dioxin and related halogenated aromatic hydrocarbons: examination of the mechanism of toxicity. Annu Rev Pharmacol Toxicol 22:517-54.
Spies, R. B., and D. W. Rice Jr. 1988. Effects of organic contaminants on reproduction of the starry flounder Platichthys stellatus in San Francisco Bay. Part II. Reproductive success of fish captured in San Francisco Bay and spawned in the laboratory. Marine biology. Berlin, Heidelberg 98(2):191-200.
184

POD 2008-2010: Final Report
185
Stevens, D. E., D. W. Kohlhorst, L. W. Miller, and D. W. Kelley. 1985. The Decline of Striped Bass in the Sacramento-San Joaquin Estuary, California. Transactions of the American Fisheries Society 114(1):12-30.
Tom, M., C. R. Myers, and M. R. Waterman. 2002. Evaluating molar CYP1A level in fish hepatic microsomes by competitive ELISA using recombinant membrane-free CYP1A standard protein. Aquatic Toxicology 59(1-2):101-114.
Walker, C. H., S. P. Hopkin, R. M. Sibly, and D. Peakall. 2006. Principles of Ecotoxicology Taylor and Francis, London.
Whyte, J. J., R. E. Jung, C. J. Schmitt, and D. E. Tillitt. 2000. Ethoxyresorufin-O-deethylase (EROD) activity in fish as a biomarker of chemical exposure. Crit Rev Toxicol 30(4):347-570.

POD 2008-2010: Final Report
V.5 Molecular Evaluation of Environmental Contaminant Extracts in Striped
bass collected from Semi Permeable Membrane Devices (SPMD) in the San Francisco Estuary.
Connon R.E., D’Abronzo L.S., Ostrach D.J. and Werner I.
Background Semipermeable membrane devices (SPMDs) are used to assess environmental pollutants from water and air, through the accumulation of hydrophobic organic compounds, such as PCBs, PAHs, and organochlorine pesticides. The principal advantage of SPMD is its sampling of the truly-dissolved and thus bio available phase of these pollutants. SPMDs estimate bioconcentration factors of organic compounds over a period of time, representing a time-weighted average. SPMD derived extracts can be used for conventionally applied aquatic toxicological bioassays. In an effort to assess bioavailable lipophilic contaminants in the estuary, SPMDs were deployed and extracts used in toxicant bioassays of juvenile striped bass (Morone saxitilis). This study was carried out by Dr. David Ostrach. Tissue samples were assessed for gene expression by Dr. Inge Werner’s laboratory, in a collaborative approach. Additional tissues will be analyzed in the near future. Methods Exposure details: SPMD extracts dissolved in peanut oil were injected intraperitoneally (100 µL/fish) into 4 and 6 month old hatchery juvenile striped bass in two different exposure experiments. Fish were exposed for 7-days and test terminated by humanely euthanizing the fish in MS222. Livers from each fish were dissected, snap frozen in liquid nitrogen and stored at -80°C for molecular analyses. RNA extraction and cDNA synthesis Total RNA from was extracted from liver tissue using a Qiagen RNeasy Mini kit, with on-column DNase digestion following manufacturer’s protocols. Complementary DNA (cDNA) was synthesized using 1µg total RNA, with 50 units of Superscript III reverse transcriptase, 600ng random primers, 10 units of RNaseOut, and 1mM dNTPs (all Invitrogen). Reactions were incubated for 50 min at 50ºC, followed by a 5 min denaturation step at 95ºC, and were later diluted 3-fold for subsequent real time - PCR assessments. Real-time quantitative PCR (rt-qPCR) Genes investigated in this study were based on sequences, primers and probes previously developed and validated by (Geist et al. 2007), with the addition of �-actin, used as
186

POD 2008-2010: Final Report
reference gene, for which primer pairs and fluorescent probes were designed using Roche Applied Science Universal ProbeLibrary Assay Design. All rt-qPCR systems were validated for specificity and amplification efficiencies as described in (Leutenegger et al. 1999). Briefly, a 2-fold dilution series of cDNA samples were tested in triplicate with the respective real-time TaqMan PCR system. The amplification efficiency was calculated using the formula E=21/S −1, where S is the slope curve. All amplification efficiencies were above 90%, validating the specificity of the rt-qPCR systems. Molecular biomarkers (summarized in table 1) were used to evaluate sublethal stress response of proteotoxicity (HSP70), phase I detoxification mechanism (CYP1a), metal-binding (Metallothionein), endocrine disruption (Vitellogenin) and pathogen-defense (Mx protein).
Gene Primer Sequences Roche Probe Number and
Sequence
HSP 70 F: CATCCTTTCTGGGGACAAGTCAG R: ACACCTCCAGCGGTCTCAATAC
62 ACCTGCTG
CYP1A1 F: GCGGCACAACCCCAGAGTA
R: CAGCTTTCATGACGGTGTTGAG
65 CTGGAGGA
Metallothionein F: GCGGAGGATCCTGCACTTG
R:CAGCCAGAGGCACACTTGGT
68 CTGCTCCT
Vitellogenin F: CTGATCTGAATTTGGCCTGAGG
R: ACCTGTATCCCAAGGACAGTGC
156 GCTGATGG
-Actin F: CAATGAGAGGTTCCGTTGC R: CAGGACTCCATACCGAGGAA
11 CTTCCAGC
Table 1. Molecular Biomarkers: List of real-time Quantitative PCR primers and probes used on Striped bass (Morone saxatilis) Real-time TaqMan PCR reactions were prepared with 400nM of each of two primers and 80nM of the appropriate TaqMan probe, and TaqMan Universal PCR Mastermix (Applied Biosystems, Foster City, CA, USA) containing 10mMTris–HCl (pH 8.3), 50mM KCl, 5mM MgCl2, 2.5mM deoxynucleotide triphosphates, 0.625U AmpliTaq Gold DNA polymerase per reaction, 0.25U AmpErase UNG per reaction. A total of 5μl of cDNA was combined with 7µl of the above mix and amplified in 384-well plates with an automated fluorometer (ABI HT 7900 A FAST Sequence Detection System, Applied Biosystems). Amplification conditions were 2 min initial primer annealing at 50ºC and 10 min denaturation at 95ºC, followed by 40 cycles of 15 sec denaturing at 95ºC and 60 sec annealing at 60ºC. SDS 2.2.1 software (Applied Biosystems) was used to quantify product amplification. Relative quantitation and statistical analyses. A comparative cycle threshold (CT) method as described in (User Bulletin #2, Applied Biosystems) was applied to quantify gene transcription of investigated stress response
187

POD 2008-2010: Final Report
genes and values are therefore expressed as relative transcription to �-actin reference gene and n-fold transcription relative to oil controls. Both Analysis of Variance (ANOVA) and student-T tests were carried out between SPMD site samples and oil controls, as well as between SPMD dialysis and oil controls. Differences between the two tests dates were also assessed through ANOVA and student t-tests. Results and Discussion There were significant temporal variations in gene expression over the four SMPD deployment periods (Figure 1 and 2 – presented separately due to expression scale differences)
-4
-3
-2
-1
0
1
2
3
-4
-3
-2
-1
0
1
2
3
-4
-3
-2
-1
0
1
2
3
-4
-3
-2
-1
0
1
2
3
OIL BOY GY LHB SL BAR OIL BOY GY LHB SL BAR
OIL BOY GY LHB SL BAR OIL BOY GY LHB SL BAR
Rel
ativ
e g
en
e e
xpre
ssio
n (
no
rma
lize
d t
o o
il c
on
tro
l)
Dec 27, 2007 Jan 31, 2008 Mar 4, 2008 Apr 2, 2008
HSP70 Cyp1a
Metallothionein Vitellogenin
** ***** ***
* *
**
-4
-3
-2
-1
0
1
2
3
-4
-3
-2
-1
0
1
2
3
-4
-3
-2
-1
0
1
2
3
-4
-3
-2
-1
0
1
2
3
OIL BOY GY LHB SL BAR OIL BOY GY LHB SL BAR
OIL BOY GY LHB SL BAR OIL BOY GY LHB SL BAR
Rel
ativ
e g
en
e e
xpre
ssio
n (
no
rma
lize
d t
o o
il c
on
tro
l)
Dec 27, 2007 Jan 31, 2008 Mar 4, 2008 Apr 2, 2008
HSP70 Cyp1a
Metallothionein Vitellogenin
** ***** ***
-4
-3
-2
-1
0
1
2
3
-4
-3
-2
-1
0
1
2
3
-4
-3
-2
-1
0
1
2
3
-4
-3
-2
-1
0
1
2
3
OIL BOY GY LHB SL BAR OIL BOY GY LHB SL BAR
OIL BOY GY LHB SL BAR OIL BOY GY LHB SL BAR
Rel
ativ
e g
en
e e
xpre
ssio
n (
no
rma
lize
d t
o o
il c
on
tro
l)
Dec 27, 2007 Jan 31, 2008 Mar 4, 2008 Apr 2, 2008
HSP70 Cyp1a
Metallothionein Vitellogenin
-4
-3
-2
-1
0
1
2
3
-4
-3
-2
-1
0
1
2
3
-4
-3
-2
-1
0
1
2
3
-4
-3
-2
-1
0
1
2
3
OIL BOY GY LHB SL BAR OIL BOY GY LHB SL BAR
OIL BOY GY LHB SL BAR OIL BOY GY LHB SL BAR
Rel
ativ
e g
en
e e
xpre
ssio
n (
no
rma
lize
d t
o o
il c
on
tro
l)
Dec 27, 2007 Jan 31, 2008 Mar 4, 2008 Apr 2, 2008
HSP70 Cyp1a
Metallothionein Vitellogenin
** ***** ***
* *
**
Figure 1. Gene Expression: Biomarker transcription of four selected genes in Striped bass responding to intraperitoneal doses of SPMD accumulated contaminants from five sites in the San Francisco Estuary. Site keys: BAR = Barbie Slough/North Cache Slough; LHB = Little Honker Bay; BY = Boyngton Slough; GY = Goodyear Slough & SL = Sherman Lake. (* p<0.05, ** p<0.01, ***p<0.001). Heat Shock Proteins (HSP70) were predominantly up-regulated confirming contaminant induced stress, and that protein increase protein synthesis was still induced at the end of the tests. Expression levels were significantly up-regulated at all sites except for Barbie Slough/North Cache Slough (BAR). CYP1a were predominantly down-regulated at sites Little Honker Bay (LHB) and
188

POD 2008-2010: Final Report
Sherman Lake (SL) suggesting probable short term induction leading to sufficient protein synthesis for detoxification purposes. Goodyear Slough (GY), LHB and SL displayed significant down-regulation in respect of oil controls. Metallothionein displayed both up and down regulations, with temporal variations. Down-regulation, though not significant at test termination, may be indicative of sufficient protein synthesis for metal sequestration at lower doses, whilst mRNA levels were still highly expressed at 48 hour with elevated contaminants. Interestingly vitellogenin was down-regulated at LHB, SL and BAR at similar time-points in April 2008, though the expression levels were not significantly different to oil controls. The cytokine encoding for MX protein (presented in fig 2), was significantly up-regulated at Boynton Slough (BOY) and SL, suggesting effects upon the immune system.
-50
-40
-30
-20
-10
0
10
20
30
40
50
60
Oil BOY GY LHB SL BAR
**
*
Re
lati
ve g
en
e e
xp
ress
ion
(no
rma
lized
to
oil
co
ntr
ol)
Dec 27, 2007 Jan 31, 2008 Mar 4, 2008 Apr 2, 2008
MX
-50
-40
-30
-20
-10
0
10
20
30
40
50
60
Oil BOY GY LHB SL BAR
**
*
Re
lati
ve g
en
e e
xp
ress
ion
(no
rma
lized
to
oil
co
ntr
ol)
Dec 27, 2007 Jan 31, 2008 Mar 4, 2008 Apr 2, 2008
MX
Figure 2. Gene Expression: Biomarker transcription of MX in Striped bass responding to intraperitoneal doses of SPMD accumulated contaminants from five sites in the San Francisco Estuary. Site keys: BAR = Barbie Slough/North Cache Slough; LHB = Little Honker Bay; BY = Boyngton Slough; GY = Goodyear Slough & SL = Sherman Lake. (* p<0.05, ** p<0.01, ***p<0.001). In summary, HSP70 up-regulation confirms general stress at sites BOYS, GY, LHB and SL, with little to no variation in BAR. Interestingly, the same sites display a down-regulation in Cyp1a, a probable indication that processes have synthesized sufficient protein for this phase I detoxification enzyme. Both BOY and SL samples appear to have further effects upon the striped bass immune system.
189

POD 2008-2010: Final Report
190
References Geist J, Werner I, Eder KJ, Leutenegger CM. 2007. Comparisons of tissue-specific
transcription of stress response genes with whole animal endpoints of adverse effect in striped bass (Morone saxatilis) following treatment with copper and esfenvalerate. Aquat Toxicol 85(1):28-39.
Leutenegger CM, Mislin CN, Sigrist B, Ehrengruber MU, Hofmann-Lehmann R, Lutz H.
1999. Quantitative real-time PCR for the measurement of feline cytokine mRNA. Vet Immunol Immunopathol 71(3-4):291-305.

Science of the Total Environment 408 (2010) 3169–3175
Contents lists available at ScienceDirect
Science of the Total Environment
j ourna l homepage: www.e lsev ie r.com/ locate /sc i totenv
Sublethal toxicity of commercial insecticide formulations and their active ingredientsto larval fathead minnow (Pimephales promelas)
Sebastian Beggel a,b, Inge Werner a, Richard E. Connon a, Juergen P. Geist b,⁎a Aquatic Toxicology Laboratory, Department of Anatomy, Physiology and Cell Biology, School of Veterinary Medicine, University of California, One Shields Avenue, Davis, CA 95616, USAb Unit of Functional Aquatic Ecology and Fish Biology, Department of Animal Science, Technische Universität München, Mühlenweg 22, 85354 Freising-Weihenstephan, Germany
⁎ Corresponding author. Tel.: +49 8161 713767; fax:E-mail address: [email protected] (J.P. Geist).
0048-9697/$ – see front matter © 2010 Elsevier B.V. Aldoi:10.1016/j.scitotenv.2010.04.004
a b s t r a c t
a r t i c l e i n f oArticle history:Received 14 December 2009Received in revised form 19 March 2010Accepted 2 April 2010
Keywords:Sublethal effectsFishSwimming behaviorPyrethroidsBifenthrinFipronil
Toxic effect concentrations of insecticides are generally determined using the technical grade or pure activeingredient. Commercial insecticide formulations, however, contain a significant proportion (N90%) of so-called inert ingredients, which may alter the toxicity of the active ingredient(s). This study compares thesublethal toxicity of two insecticides, the pyrethroid bifenthrin, and the phenylpyrazole fipronil, to theircommercial formulations, Talstar® and Termidor®. Both insecticides are used for landscape treatment andstructural pest control, and can be transported into surface water bodies via stormwater and irrigationrunoff. We used larval fathead minnow (Pimephales promelas), to determine effects on growth andswimming performance after short-term (24 h) exposure to sublethal concentrations of pure insecticidesand the respective formulations. Significantly enhanced 7 d growth was observed at 10% of the 24 h LC10(53 μg L−1) fipronil. Swimming performance was significantly impaired at 20% of the 24 h LC10 (0.14 μg L−1)of bifenthrin and 10% of the 24 h LC10 of Talstar® (0.03 μg L−1). Fipronil and Termidor® led to a significantimpairment of swimming performance at 142 μg L−1 and 148 μg L−1 respectively, with more pronouncedeffects for the formulation. Our data shows that based on dissolved concentrations both formulations weremore toxic than the pure active ingredients, suggesting that increased toxicity due to inert ingredientsshould be considered in risk assessments and regulation of insecticides.
+49 8161 713477.
l rights reserved.
© 2010 Elsevier B.V. All rights reserved.
1. Introduction
Insecticides are contaminating surface water bodies of agriculturalareas in California, USA, and elsewhere (Schulz, 2004; TDC-Environ-mental, 2008; Werner et al., 2004). It is, however, a misconceptionthat attributes insecticide use to agricultural activities alone.
Insecticides are also heavily used in urban areas where applicationby homeowners and professionals for mosquito control, landscapetreatment and structural pest control results in an extensive source ofcontamination (Budd et al., 2007; Sandahl et al., 2007). Even if notapplied in the vicinity of surface water bodies, insecticides can betransported via irrigation runoff and stormwater into urban streamsand waterways (Brady et al., 2006; Weston et al., 2005). Aquaticinvertebrates and fish thus become targets of toxic substances atpotentially hazardous concentrations. This is of special concern ifsensitive larval and developmental stages are affected.
Toxicity of insecticides to fish and other aquatic species isgenerally determined via threshold concentrations such as LC/EC50
for the pure active ingredient (A.I.) of commercial products (Cox andSurgan, 2006; USEPA, 2007a). However, commercial products contain
the A.I. mixed with non-insecticidal ingredients, so-called “inert” or“other” ingredients, which in some cases comprise more than 90% involume of insecticide formulations (Cox and Surgan, 2006). They neednot be identified on the product label, unless classified as highly toxic(USEPA, 2007b), and act as adjuvants, solvents, emulsifiers, surfactantsand/or preservatives. Numerous commercial formulations often existfor eachA.I., and it is known that availability and toxicity of the A.I.maybe substantially altered by inert ingredients (Schmuck et al., 1994).Studies have shown that in many cases the toxicity of commercialformulations is higher than that of the active ingredient, but this is notalways the case. Mayer and Ellersieck (1986) compared the toxicity of161 technical grade pesticides to their formulations and showed thatoverall toxicitywas not affected in 57%, decreased in 11% and increasedin 32% of the cases. In a more recent study (Schmuck et al., 1994), 95%of 273 herbicide, fungicide and insecticide formulations were moretoxic to fish than the respective pure A.I. The study presented hereaims to contribute information about the comparative toxicity of purebifenthrin and fipronil and two of their formulation products focusingon sublethal endpoints in larval fish. To our knowledge no suchinformation is currently available for these substances.
Both bifenthrin and fipronil are widely used in structural pestcontrol and other urban and agricultural applications (Oros andWerner, 2005; TDC-Environmental, 2008). The pyrethroid, bifenthrin,is one of the most frequently detected contaminants in surface water

3170 S. Beggel et al. / Science of the Total Environment 408 (2010) 3169–3175
bodies of areas with urban and agricultural land use (Budd et al.,2007). Similarly, the phenylpyrazole, fipronil, was found to be presentin runoff from metropolitan areas throughout the United States(Sprague and Nowell, 2008). Both insecticides are commerciallyavailable in a large number of formulated products, generallycontaining b10% A.I. The bifenthrin formulation; Talstar®, contains7.9% A.I. as microcapsules (as indicated on product label, 2008), wherethe insecticide is encased in a coat of “inert” ingredients to ensure itsslow release and stabilization (Tsuji, 2001). Termidor®, a fipronilformulation, contains 9.1% A.I. in the form of crystalline particlesforming a liquid suspension concentrate (as indicated on productlabel, 2008). Like all pyrethroids, bifenthrin is highly toxic to fish,interfering with Na+ channel gating in the nerve cell endings, butother ion-channels such as Cl− and Ca2+ channels can be targeted aswell (Burr and Ray, 2004). This leads to continuous neurotransmis-sion, causing hyperexcitability, tremors, convulsions and ultimatelydeath (Bradbury and Coats, 1989; Haya, 1989). Reported LC50 valuesof bifenthrin for fish range from 0.15 µg L−1 (rainbow trout, 96 h LC50)to 17.5 μg L−1 (sheepshead minnow, 96 h LC50) (Kegley et al., 2008;Werner and Moran, 2008). Runoff from residential areas containedbifenthrin at concentrations of 0.12 µg L−1 to 6.12 µg L−1, measuredat storm water drainage outflows (L. Oki, UC Davis, personalcommunication). Fipronil is a “new generation” phenylpyrazoleinsecticide, whose mode of action differs from organophosphatesand pyrethroids, to which numerous insects have developedresistance (Bloomquist, 2003; Soderlund, 2008). Phenylpyrazolesinterfere with the function of γ-aminobutyric acid (GABA)-gated Cl−
channels (Cole et al., 1993). In insects and mammals, the behavioraleffects of GABA antagonists include hyperactivity, hyperexcitability,and convulsions, which are correlated with increased spontaneousnerve activity (Gunasekara et al., 2007). Fish LC50 values have beenreported for sheepshead minnow (130 µg L−1, 96 h LC50), bluegillsunfish (83 μg L−1, 96 h LC50) and rainbow trout (100 µg L−1, 96 hLC50) (Gunasekara et al., 2007; Kegley et al., 2008). Concentrationsmeasured in irrigation runoff from residential areas ranged from0.122 to 10.0 µg L−1 (L. Oki, UC Davis, personal communication), and≤9 μg L−1 in surface waters downstream of treated rice fields(Schlenk et al., 2001).
Here we tested the hypothesis that the toxicity of the pure activeingredients, bifenthrin and fipronil, differs from the toxicity of theirrespective formulations, Talstar® and Termidor®.We used swimmingperformance and growth as toxicological endpoints in larval fatheadminnow (Pimephales promelas Rafinesque), and a short exposureperiod (24 h), to mimic runoff-related pulse exposures (Pick et al.,1984; Werner et al., 2004). Sublethal exposure concentrations werebased on previously determined acute LC10 values.
2. Materials and methods
2.1. Fish source, acclimation and quality assurance
Fathead minnow larvae were obtained from Aquatox Inc. (HotSprings, AR, USA) at 7 d post-hatch on the day of arrival. Control waterconsisted of deionized water, modified with salts to meet USEPAspecifications (electric conductivity (EC): 265–293 μS cm−1; hard-ness: 80–100 as mg CaCO3 L−1; alkalinity: 57–64 as mg CaCO3 L−1
(USEPA, 2002a)). Fish were acclimated for a minimum period of 4 h incontrol water at a temperature of 25 °C. During the acclimation periodb1% mortality was observed, and the fish fed and swam normally.
During the project period, routinemonthly reference toxicant testswere performed using NaCl to ascertain whether organism responsefell within the acceptable range according to USEPA requirements(USEPA, 2002a). Each test consists of a dilution series (5 testconcentrations) and a control. All test organisms responded normally(within 95% confidence interval of running mean) and sensitivity wasconsidered typical.
2.2. Insecticide exposure
Reference standard grade bifenthrin [[1α3α(2)]-(±)(2-methyl[1,1′-biphenyl]-3-yl)methyl 3-(2-chloro-3,3,3, trifluoro-1-propenyl)-2,2-dimethylcyclopropanecarboxylate], 99% purity (CAS number82657-04-3), and fipronil (5-amino-1 [2,6-dichloro-4-(triflouro-methyl) phenyl]-4 [(triflouromethyl) sulfinyl]-1H-pyrazole-3-carbo-nitrile), 98.5% purity (CAS number 120068-37-3) were obtained fromChemService inc. (West Chester, PA, USA). Commercial insecticideformulations Talstar® (US EPA Reg. No. 279-3155; 7.9% bifenthrin pervolume; FMC Corporation, Philadelphia, PA, USA) and Termidor® (USEPA Reg. No. 7969-210; 9.1% fipronil per volume; BASF Corporation,Research Triangle Park, NC, USA) were purchased commercially.Bifenthrin consists of 97% cis-isomer both in the pure compound andthe formulated product. Pure fipronil is a 50:50 racemic mixture, justlike its formulation product. All insecticide exposure experimentswere conducted at the Aquatic Toxicology Laboratory, School ofVeterinary Medicine, University of California Davis.
To determine acute toxic effects on survival, 7 d old larval fishwereexposed for 24 h to the following nominal concentrations: 0.75, 1.0,1.5, 2.0, 3.0 and 4.0 µg L−1 bifenthrin, 3.0, 4.0, 4.5, 5.0 and 6.0 μg L−1
bifenthrin as amount A.I. in Talstar®, 150, 200, 250, 300, 350 and400 μg L−1
fipronil, and 150, 200, 350, 400 and 450 μg L−1 offipronil asamount A.I. in Termidor®. The exposure concentrations used todetermine acute toxicity refer to A.I. concentrations (pure chemical orrespective formulation) to ensure direct comparability. For the puresubstances we used 1 ml L−1 methanol (MeOH) as the solvent carrierand one treatment group containing the sameMeOH concentration incontrol water was added as a solvent control. No solvent carrier wasrequired for the formulations as they are designed to mix with water.
Stock solutions were prepared in MeOH for pure insecticides(2000 mg L−1) and used for both, 24 h LC50 determination andsublethal exposure experiments.
Exposure concentrations used for the swimming performance andgrowth test series were calculated as percentages of the nominal LC10values derived from the acute toxicity tests. For each chemical,treatments consisted of a control, solvent control (pure chemicalsonly), and 10%, 20%, 33% and 50% of the nominal LC10. Each treatmentconsisted of 13 replicate 600 ml Pyrex beakers containing 250 ml testsolution and 10 fish larvae. Subsequently, we used 9 replicates todetermine swimming performance at three different time points and4 replicates to determine growth.
At test initiation, 10 larvae were transferred from the acclimati-zation tank to each beaker and exposed for 24 h at a watertemperature of 25 °C and a 16:8 light–dark ratio. Test vessels werethen manually distributed in a random manner, within the exposurewater bath. Fish were not fed during the exposure period.
For the sublethal concentrations, sub-samples of each test solution(1 L) were preserved with dichloromethane (Fisher Scientific, USA) attest initiation, shipped overnight to the California Department of Fishand Game Water Pollution Laboratory (Rancho Cordova, CA, USA),extracted within 24 h of arrival, and analyzed using gas chromatog-raphy with mass spectrometry and ion-trap detection. Reportinglimits for detection of bifenthrin and fipronil were 0.002 μg L−1
(recovery 88.3%) and 0.2 μg L−1 (recovery 83.1%), respectively.Talstar® samples were filtered through 0.45 μm glass fiber filter toseparate microcapsules from the water phase, and “particulate” anddissolved bifenthrin concentrations were determined. Concentrationsfor Talstar® are presented as the dissolved fraction. Measured andnominal insecticide concentrations are shown in Table 2.
2.3. 7 d growth
Following the 24 h insecticide exposure, fish were transferred tocontrol water and maintained for 6 days at 25 °C and a 16:8 light:darkphotoperiod. During transfer, fish were gently rinsed in control water,

3171S. Beggel et al. / Science of the Total Environment 408 (2010) 3169–3175
using a fine-meshed sieve and moved to vessels containing controlwater. From days 2 to 7, approximately 80% of the water wasexchanged daily and the number of surviving fish was recorded.Physicochemical variables (pH, dissolved oxygen, temperature, EC)were measured per treatment before and after each water exchangeand at test termination. Measurements were conducted on pooledreplicates of each treatment. After each water renewal the testbeakers were manually distributed in a random manner, throughoutthe exposure waterbath. Fish were fed ad libitum twice a day withnewly hatched Artemia nauplii (ranging from 30 to 50 individuals). Attest termination, surviving fish were euthanized with MS-222(Tricaine Methanesulfonate, Sigma, St. Louis, MO, USA), thentransferred to pre-weighed aluminium weigh boats and dried for24 h at 100 °C. Dry weight per fish (±0.001 mg) was calculated bymeasuring whole dry weight divided by the number of fish in eachreplicate.
2.4. Swimming performance (“one minute racetrack”)
Swimming performance was measured at three different timepoints: (1) Immediately after the 24 h insecticide exposure; (2) after atotal of 48 h (24 h recovery in control water), and (3) after a total of7 days (6 d recovery in control water). At each time point, seven fishper replicate from three replicate beakers per treatment were testedusing a circular “racetrack” method (Heath et al., 1993a). Thisracetrack consisted of a 13 cm diameter Petri dish with an upside-down 8 cm diameter Petri dish centrally placed, divided into 8 sectorsby radiating lines drawn on the bottom of the testing dish, and filledwith control water to a depth of 1 cm. Fish from pre-selected beakerswere transferred individually into the testing device and allowed toacclimate for 1 min. A plastic rod was then used to trigger the fish'sescape response by gently touching the tail fin every time the fishstopped moving. Due to possible bias in experimental technique,groups of fish were tested in a random manner, without theexperimenter's knowledge of exposure concentration followingHeath et al. (1993b). The number of lines or sectors crossed by thefish within 1 min was recorded and used as a measure of swimmingperformance. Water in the testing device was renewed after testing 7fish from individual replicates.
2.5. Statistical analysis
We used the Comprehensive Environmental Toxicity InformationSystem (CETIS) by Tidepool Scientific Software (McKinleyville, CA,USA) to calculate nominal effect concentrations for 24 h survival(NOEC, LC50, LC10) based on A.I. Statistical analyses of sublethalendpoints utilized the measured dissolved A.I. concentrations. TheShapiro–Wilk normality test was used to evaluate whether quantita-tive data met the assumptions of the parametric ANOVA. For multiplecomparisons the JMP 7.0 Software by SAS Institute Inc. was used. Toevaluate differences between treatments in swimming performanceand growth data we used one-way ANOVA and Dunett's multiplecomparison post hoc test to compare insecticide treatments tocontrols and solvent controls. Assumptions of normality and homo-geneity of variances were met, except for the highest concentrations,but due to the large differences in swimming performance, the
Table 1Acute nominal effect concentrations (mortality) for 7 d old fathead minnow after 24 h expconcentrations, LC50 and LC10. Values in parenthesis represent 95% confidence intervals det
Substance NOEC [μg L−1] LOEC [μg L−1]
Fipronil, pure 300 350Fipronil formulation 200 350Bifenthrin, pure 0.5 1Bifenthrin formulation b3 3
ANOVA is considered to be robust (Underwood, 1997), particularlysince the distribution of residuals was unimodal.
3. Results
3.1. Water chemistry
Physicochemical parameters measured at the start and end of the24 h exposure period were within the acceptable range for the testorganism (USEPA, 2002a,b) for all experiments and treatments. Themeasured mean values (±standard deviation) were pH: 7.51(±0.19), dissolved oxygen 7. 2 (±0.5) mg L−1, temperature: 23.1(±0.3) °C, and EC: 278 (±6) μS cm−1.
3.2. Sublethal effects
Individual effects were observed for each substance at concentra-tions below 50% of the LC10. Concentration levels in the followingsections refer to the measured dissolved fractions of A.I., or topercentages of the nominal LC10 values determined by initial acutetoxicity tests (Table 1).
3.2.1. Swimming performance
3.2.1.1. Bifenthrin. Immediately following the 24 h exposure to purebifenthrin, the swimming performance of fish from the lowestconcentration treatment (0.07 μg L−1 or 10% LC10) showed nostatistical difference to control or solvent control treatments(Fig. 1). Swimming performance of fish exposed to concentrations≥0.14 μg L−1 (20% LC10, pb0.001) was significantly decreasedcompared to solvent controls. In comparison, exposure to thecommercial formulation Talstar® led to decreased swimming perfor-mance at ≥0.03 μg L−1 bifenthrin (10% LC10, pb0.001). After transferto control water for a 24 h recovery period, swimming performance ofexposed fish improved inmost insecticide treatments. Fish exposed tobifenthrin concentrations of 0.07–0.14 μg L−1 as pure chemical(Fig. 1A), and 0.03–0.05 μg L−1 as Talstar® (Fig. 1B) recoveredcompletely. After a recovery period of 6 days, no statisticallysignificant differences between treatments were observed. Whencomparing dissolved bifenthrin concentrations between pure bifen-thrin and Talstar®, the formulation was approximately 5 times moretoxic than the pure active ingredient.
3.2.1.2. Fipronil. Swimming performance after 24 h was significantlydecreased in fish exposed to concentrations≥142 µg L−1 pure fipronil(20% LC10, pb0.001) and ≥148 µg L−1 Termidor® (33% LC10, pb0.01)(Fig. 2). Although the measured concentrations at this time point arein a similar range, the formulation had a stronger negative impact onswimming at higher concentrations. Fish exposed to 192 µg L−1
Termidor® (50% LC10) exhibited statistically significant lower swim-ming activity than fish exposed to 333 μg L−1
fipronil treatment (33%LC10). After 24 h recovery in control water no significant effects onswimming performance were observed in fish exposed to purefipronil, but after the 6 d recovery period, there was a statisticallysignificant negative effect (pb0.01, Fig. 2A). In contrast to the purefipronil treatments, swimming performance of fish exposed to
osure to bifenthrin, fipronil and their formulations, Talstar® and Termidor®. Effectiveermined via probit analysis.
24 h LC50 [μg L−1] 24 h LC10 [μg L−1]
398.29 (376.27–438.79) 305.57 (275.56–324.12)379.47 (355.13–405.48) 233.01 (201.99–307.94)1.90 (1.69–2.12) 0.92 (0.72–1.09)4.85 (4.47–5.34) 2.99 (2.36–3.39 )

Fig. 1. Swimming performance of larval fathead minnow after 24 h exposure bifenthrinand Talstar®, 24 h recovery and 6 d recovery. Asterisks indicate significant differencesin treatments compared to control/solvent control (*: pb0.05. **: pb0.01. ***: pb0.001).Data shown as arithmetic mean±SD; n=7. A: pure bifenthrin, control group shifted tox=0.02 for visibility (grey); B: Talstar®.
Fig. 2. Swimming performance of larval fathead minnow after 24 h exposure, 24 hrecovery and 6 d recovery. Asterisks indicate significant differences in treatmentscompared to control/solvent control (*: pb0.05. **: pb0.01. ***: pb0.001). Data shownas arithmetic mean±SD; n=7. A: pure fipronil, control group shifted to x=5 forvisibility (grey); B: Termidor®.
Fig. 3. Average dry weight per fish after 24 h exposure to bifenthrin and Talstar® and6 d recovery.
3172 S. Beggel et al. / Science of the Total Environment 408 (2010) 3169–3175
192 µg L−1 Termidor® (50% LC10) remained suppressed after the 24 hrecovery period. This effect persisted throughout the test, and norecovery of swimming performance was observed after 6 days(Fig. 2B).
3.2.2. 7 d growth
3.2.2.1. Bifenthrin. Neither pure bifenthrin (maximum test concentra-tions: 0.35 μg L−1, 50% LC10,) nor Talstar® (maximum test concen-tration 0.16 μg L−1 A.I., 50% LC10) caused any growth effects in larvalfathead minnow (Fig. 3).
3.2.2.2. Fipronil. Fish exposed to pure fipronil at all concentrationstested grew significantly more than fish exposed to the solvent alone(53 μg L−1, pb0.05; 333 μg L−1, pb0.01; 365 μg L−1, pb0.01, Fig. 4).Exposure to Termidor® did not result in negative or positive effects ongrowth.
In addition to the observed effects on 7 d growth, fish exposed toboth pure fipronil and Termidor® showed deformities of the spine(data not presented). Four to five days after the 24 h insecticideexposure, several fish showed scoliosis and in some cases bothscoliosis and lordosis. At test termination 5 of the fish exposed to365 μg L−1 and 1 of the fish exposed to 333 μg L−1 pure fipronil haddevelopmental abnormalities. The same effect was visible for 4 of thefish exposed to 192 μg L−1 and 1 of the fish exposed to 148 μg L−1
Termidor®. No such effects were observed in any of the othertreatments.
4. Discussion
This study provides new information on the sublethal toxicity oftwo pure insecticides and two of their commercial formulations tolarval stage fathead minnow. Results demonstrate that short-term(24 h) exposures to sublethal concentrations of pure and formulatedbifenthrin and fipronil significantly impaired swimming performance
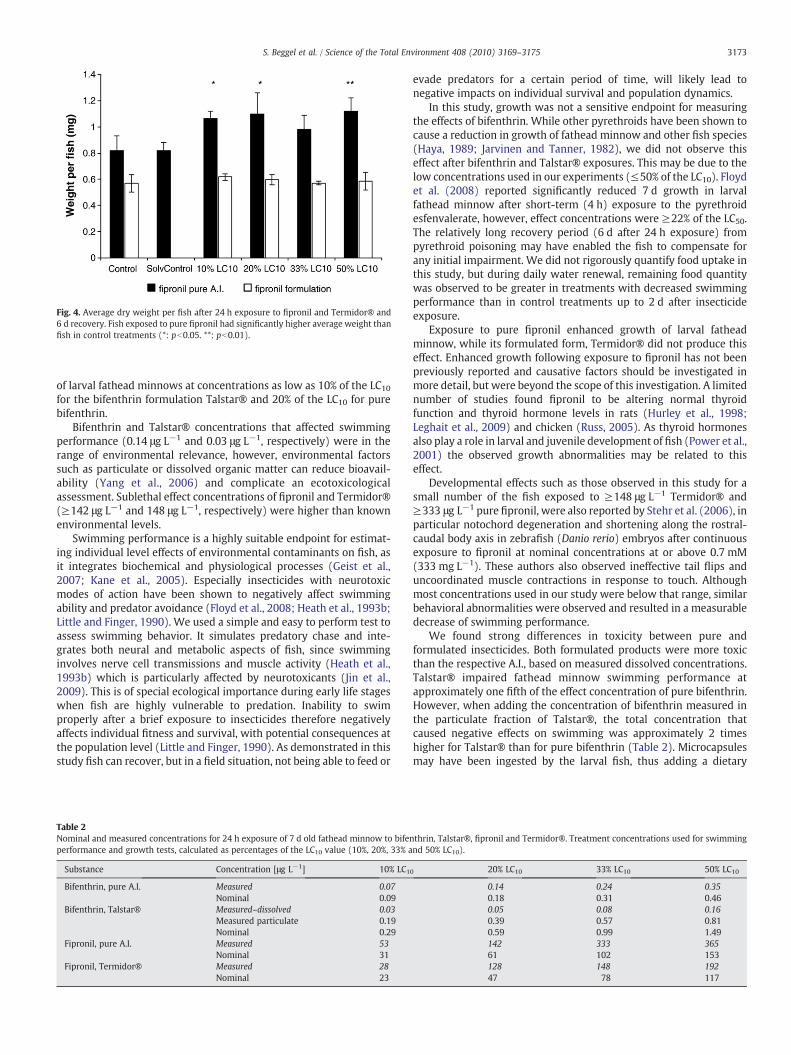
Fig. 4. Average dry weight per fish after 24 h exposure to fipronil and Termidor® and6 d recovery. Fish exposed to pure fipronil had significantly higher average weight thanfish in control treatments (*: pb0.05. **: pb0.01).
3173S. Beggel et al. / Science of the Total Environment 408 (2010) 3169–3175
of larval fathead minnows at concentrations as low as 10% of the LC10for the bifenthrin formulation Talstar® and 20% of the LC10 for purebifenthrin.
Bifenthrin and Talstar® concentrations that affected swimmingperformance (0.14 μg L−1 and 0.03 μg L−1, respectively) were in therange of environmental relevance, however, environmental factorssuch as particulate or dissolved organic matter can reduce bioavail-ability (Yang et al., 2006) and complicate an ecotoxicologicalassessment. Sublethal effect concentrations of fipronil and Termidor®(≥142 μg L−1 and 148 μg L−1, respectively) were higher than knownenvironmental levels.
Swimming performance is a highly suitable endpoint for estimat-ing individual level effects of environmental contaminants on fish, asit integrates biochemical and physiological processes (Geist et al.,2007; Kane et al., 2005). Especially insecticides with neurotoxicmodes of action have been shown to negatively affect swimmingability and predator avoidance (Floyd et al., 2008; Heath et al., 1993b;Little and Finger, 1990). We used a simple and easy to perform test toassess swimming behavior. It simulates predatory chase and inte-grates both neural and metabolic aspects of fish, since swimminginvolves nerve cell transmissions and muscle activity (Heath et al.,1993b) which is particularly affected by neurotoxicants (Jin et al.,2009). This is of special ecological importance during early life stageswhen fish are highly vulnerable to predation. Inability to swimproperly after a brief exposure to insecticides therefore negativelyaffects individual fitness and survival, with potential consequences atthe population level (Little and Finger, 1990). As demonstrated in thisstudy fish can recover, but in a field situation, not being able to feed or
Table 2Nominal and measured concentrations for 24 h exposure of 7 d old fathead minnow to bifenperformance and growth tests, calculated as percentages of the LC10 value (10%, 20%, 33% a
Substance Concentration [μg L−1] 10% LC1
Bifenthrin, pure A.I. Measured 0.07Nominal 0.09
Bifenthrin, Talstar® Measured–dissolved 0.03Measured particulate 0.19Nominal 0.29
Fipronil, pure A.I. Measured 53Nominal 31
Fipronil, Termidor® Measured 28Nominal 23
evade predators for a certain period of time, will likely lead tonegative impacts on individual survival and population dynamics.
In this study, growth was not a sensitive endpoint for measuringthe effects of bifenthrin. While other pyrethroids have been shown tocause a reduction in growth of fathead minnow and other fish species(Haya, 1989; Jarvinen and Tanner, 1982), we did not observe thiseffect after bifenthrin and Talstar® exposures. This may be due to thelow concentrations used in our experiments (≤50% of the LC10). Floydet al. (2008) reported significantly reduced 7 d growth in larvalfathead minnow after short-term (4 h) exposure to the pyrethroidesfenvalerate, however, effect concentrations were ≥22% of the LC50.The relatively long recovery period (6 d after 24 h exposure) frompyrethroid poisoning may have enabled the fish to compensate forany initial impairment. We did not rigorously quantify food uptake inthis study, but during daily water renewal, remaining food quantitywas observed to be greater in treatments with decreased swimmingperformance than in control treatments up to 2 d after insecticideexposure.
Exposure to pure fipronil enhanced growth of larval fatheadminnow, while its formulated form, Termidor® did not produce thiseffect. Enhanced growth following exposure to fipronil has not beenpreviously reported and causative factors should be investigated inmore detail, but were beyond the scope of this investigation. A limitednumber of studies found fipronil to be altering normal thyroidfunction and thyroid hormone levels in rats (Hurley et al., 1998;Leghait et al., 2009) and chicken (Russ, 2005). As thyroid hormonesalso play a role in larval and juvenile development of fish (Power et al.,2001) the observed growth abnormalities may be related to thiseffect.
Developmental effects such as those observed in this study for asmall number of the fish exposed to ≥148 μg L−1 Termidor® and≥333 μg L−1 pure fipronil, were also reported by Stehr et al. (2006), inparticular notochord degeneration and shortening along the rostral-caudal body axis in zebrafish (Danio rerio) embryos after continuousexposure to fipronil at nominal concentrations at or above 0.7 mM(333 mg L−1). These authors also observed ineffective tail flips anduncoordinated muscle contractions in response to touch. Althoughmost concentrations used in our study were below that range, similarbehavioral abnormalities were observed and resulted in a measurabledecrease of swimming performance.
We found strong differences in toxicity between pure andformulated insecticides. Both formulated products were more toxicthan the respective A.I., based on measured dissolved concentrations.Talstar® impaired fathead minnow swimming performance atapproximately one fifth of the effect concentration of pure bifenthrin.However, when adding the concentration of bifenthrin measured inthe particulate fraction of Talstar®, the total concentration thatcaused negative effects on swimming was approximately 2 timeshigher for Talstar® than for pure bifenthrin (Table 2). Microcapsulesmay have been ingested by the larval fish, thus adding a dietary
thrin, Talstar®, fipronil and Termidor®. Treatment concentrations used for swimmingnd 50% LC10).
0 20% LC10 33% LC10 50% LC10
0.14 0.24 0.350.18 0.31 0.460.05 0.08 0.160.39 0.57 0.810.59 0.99 1.49142 333 36561 102 153128 148 19247 78 117

3174 S. Beggel et al. / Science of the Total Environment 408 (2010) 3169–3175
exposure route to the aqueous exposure to dissolved bifenthrin,which could account for the higher toxicity of the formulated productbased on dissolved concentrations. In addition, it is possible that thepresence of 0.1 methanol added as a carrier increased bioavailabilityand toxicity of the pure insecticides, however, we found no differencein swimming performance or growth between control and solventcontrol treatments. For pure fipronil and Termidor®, effect concen-trations for swimming performancewere similar, but impairment wasmore persistent in fish exposed to the formulated product.
Insecticide formulations can act as mixtures and environmentalrisks cannot be determined by assessing the toxicity of the A.I. alone.The relevance of these findings is obvious as pure insecticides arenever applied in the environment. Extrapolating our laboratoryresults to a field exposure scenario is, however, beyond the scope ofthis study. For determination of toxicity under environmentalconditions many additional factors have to be taken into account.Sediment particles, dissolved organic carbon, water pH and temper-ature can change the bioavailability and therefore toxicity ofpesticides (Maul et al., 2008; Yang et al., 2007). Despite that, theconsideration of short-term exposures, delayed effects and sublethaltoxicity is of importance as exposure of aquatic organisms toinsecticides is most likely to be of short duration and below lethallevels. For example, Brady et al. (2006) demonstrated that themajority of insecticide runoff of two insecticides, diazinon andesfenvalerate, occurred within the first hour of a simulated rainevent.
Information on inert ingredients is largely treated as trade secret,but these chemicals have been shown to exert additive or synergistictoxicity, due to either their mechanism of action or through increasingthe bioavailability of the A.I. Emulsifiable formulations of pyrethroidswere found to be 2.2 to 8.5 times more lethal to fish than the puresubstance (Haya, 1989) as a consequence of enhanced uptake via thegill epithelium. In other products, enzyme altering synergists likepiperonyl butoxide (PBO) are added (Amweg and Weston, 2007) toenhance toxicity of the A.I. The solvent propylene glycol is part of theTalstar® formulation, but its toxicity to fish is low (fathead minnow48 h LC50: 790,000 μg L−1 (Kegley et al., 2008; TDC-Environmental,2008)), and it was found to not significantly modify the toxicity ofbifenthrin to cultured human cells (Skandrani et al., 2006). Chemicalsused in pesticide formulations may also increase mobility of the A.I.thus facilitating pesticide movement into aquatic environments.Suspension liquids such as Termidor® or microencapsulated productslike Talstar® are designed to not immediately bind to porous surfaces,and are therefore more susceptible to runoff or leaching. For example,Armbrust and Peeler (2002) reported that the concentration of theinsecticide imidacloprid was higher in runoff from turf that wastreated with granules than turf treated with wettable powder. Similarformulation effects were observed for herbicide runoff from containerplant nurseries (Briggs et al., 2002). Kenimer et al. (1997) reportedhigher surface runoff of alachlor microencapsulated formulationcompared to alachlor emulsifiable concentrate formulation, asmicrocapsule movement was similar to that of eroded sediment.
Talstar® is formulated as a so-called microencapsulation ofbifenthrin, resulting in μm-sized particles, where the A.I. forms acore that is coated by an outer wall consisting of “inert” ingredients(Scher et al., 1998; Tsuji, 2001). The toxicity of this formulation istherefore dependent on how fast and how much of the activeingredient is released through the capsule (Jarvinen and Tanner,1982). As this formulation is designed to bemore persistent at the siteof application, the release is probably slow. This explains whymeasured concentrations of dissolved bifenthrin were lower in theTalstar® experiment than in the exposures to pure bifenthrin. The useof such controlled-release insecticides may lead to lower exposureconcentrations but increased exposure time of non-target organisms.Future investigations on these types of products should thereforeconsider a long-term exposure scenario to lower concentrations.
5. Conclusions
Our study demonstrated that formulated products of two widelyused insecticides, the pyrethroid bifenthrin and the phenylpyrazole,fipronil, were approximately 5 and 2 times more toxic to larvalfathead minnow than the active ingredients alone. Growth was not asensitive toxicity endpoint, but the fish's ability to swim normally wasimpaired at Talstar® (bifenthrin) and Termidor® (fipronil) concen-trations 10 and 3 times lower, respectively, than the 24 h LC10. Resultssuggest that these neurotoxic insecticides can decrease ecologicalfitness of sensitive aquatic species at concentrations far below thelethal level. We have demonstrated that behavioral endpoints such asswimming are valuable tools to detect sublethal effects of neurotoxicchemicals. Future risk assessments should include information onsublethal endpoints such as swimming behavior, and additional safetyfactors to account for the greater toxicity of formulated pesticideproducts.
Acknowledgements
We would like to thank the staff of the UC Davis AquaticToxicology Laboratory for their assistancewith exposure experiments.This study was supported by the Interagency Ecological Program,Sacramento, California (contract no. 4600008070 to I. Werner), and apostgraduate scholarship to S. Beggel (contract no. DOK-82-07 toJ. Geist) by Bayerische Forschungsstiftung, Germany.
References
Amweg EL, Weston DP. Whole-sediment toxicity identification evaluation tools forpyrethroid insecticides: I. Piperonyl butoxide addition. Environ Toxicol Chem2007;26:2389–96.
Armbrust KL, Peeler HB. Effects of formulation on the run-off of imidacloprid from turf.Pest Manag Sci 2002;58:702–6.
Bloomquist JR. Chloride channels as tools for developing selective insecticides. ArchInsect Biochem Physiol 2003;54:145–56.
Bradbury SP, Coats JR. Toxicokinetics and toxicodynamics of pyrethroid insecticides infish. Environ Toxicol Chem 1989;8:373–80.
Brady JA, Wallender WW, Werner I, Fard BM, Zalom FG, Oliver MN, et al. Pesticiderunoff from orchard floors in Davis, California, USA: a comparative analysis ofdiazinon and esfenvalerate. Agric Ecosyst Environ 2006;115:56–68.
Briggs JA, Whitwell T, Fernandez RT, Riley MB. Formulation effects on Isoxaben andTrifluralin in runoff water from container plant nurseries. Weed Sci 2002;50:536–41.
Budd R, Bondarenko S, Haver D, Kabashima J, Gan J. Occurrence and bioavailability ofpyrethroids in a mixed land use watershed. J Environ Qual 2007;36:1006–12.
Burr SA, Ray DE. Structure–activity and interaction effects of 14 different pyrethroids onvoltage-gated chloride ion channels. Toxicol Sci 2004;77:341–6.
Cole L, Nicholson R, Casida J. Action of phenylpyrazole insecticides at the GABA-gatedchloride channel. Pesticide Biochem Physiol 1993;46:47–54.
Cox C, Surgan M. Unidentified inert ingredients in pesticides: implications for humanand environmental health. Environ Health Perspect 2006;114:1803–6.
Floyd EY, Geist JP, Werner I. Acute, sublethal exposure to a pyrethroid insecticide altersbehavior, growth, and predation risk in larvae of the fathead minnow (Pimephalespromelas). Environ Toxicol Chem 2008;27:1780–7.
Geist J, Werner I, Eder KJ, Leutenegger CM. Comparisons of tissue-specific transcriptionof stress response genes with whole animal endpoints of adverse effect in stripedbass (Morone saxatilis) following treatment with copper and esfenvalerate. AquatToxicol 2007;85:28–39.
Gunasekara AS, Truong T, Goh KS, Spurlock F, Tjeerdema RS. Environmental fate andtoxicology of fipronil. J Pest Sci 2007;32:189–99.
Haya K. Toxicity of pyrethroid insecticides to fish. Environ Toxicol Chem 1989;8:381–92.
Heath AG, Cech JJ, Zinkl JG, Finlayson B, Fujimura R. Sublethal effects of methylparathion, carbofuran, and molinate on larval striped bass. American FisheriesSociety Symposium; Water quality and the early life stages of fishes. AmericanFisheries Society; 1993a. p. 17–28.
Heath AG, Cech JJ, Zinkl JG, Steele MD. Sublethal effects of three pesticides on Japanesemedaka. Arch Environ Contam Toxicol 1993b;25:485–91.
Hurley PM, Hill RN, Whiting RJ. Mode of carcinogenic action of pesticides inducingthyroid follicular cell tumors in rodents. Environ Health Perspect 1998;106:437–45.
Jarvinen AW, Tanner DK. Toxicity of selected controlled release and correspondingunformulated technical grade pesticides to the fathead minnow Pimephalespromelas. Environ Pollut A Ecol Biol 1982;27:179–95.
JinM, Zhang X,Wang L, Huang C, Zhang Y, ZhaoM. Developmental toxicity of bifenthrinin embryo-larval stages of zebrafish. Aquat Toxicol 2009;95:347–54.

3175S. Beggel et al. / Science of the Total Environment 408 (2010) 3169–3175
Kane AS, Salierno JD, Brewer SK. Fish models in behavioral toxicology: automatedtechniques, updates and perspectives. In: Ostrander GK, editor. Methods in AquaticToxicology, 2. Boca Raton, FL: Lewis Publishers; 2005. p. 559–90.
Kegley SE, Hill, BR, Orme S, Choi AH. PAN Pesticide Database. 2007. Pesticide ActionNetwork, North America, San Francisco, CA, 2008. http://www.pesticideinfo.org(Accessed March 2010).
Kenimer AL, Mitchell JK, Felsot AS, et al. Pesticide formulation and applicationtechnique effects on surface pesticide losses, vol. 40. St. Joseph, MI, ETATS-UNIS:American Society of Agricultural Engineers; 1997.
Leghait J, Gayrard V, Picard-Hagen N, Camp M, Perdu E, Toutain P-L, et al. Fipronil-induced disruption of thyroid function in rats is mediated by increased total andfree thyroxine clearances concomitantly to increased activity of hepatic enzymes.Toxicology 2009;255:38–44.
Little EE, Finger SE. Swimming behavior as an indicator of sublethal toxicity in fish.Environ Toxicol Chem 1990;9:13–20.
Maul JD, Brennan A, Harwood AD, Lydy MJ. Effect of sediment-associated pyrethroids,fipronil, and metabolites on Chironomus tentans growth rate, body mass, conditionindex, immobilization, and survival. Environ Toxicol Chem 2008;27:2582–90.
Mayer F, Ellersieck MR. Manual of acute toxicity: interpretation and data base for 410chemicals and 66 species of freshwater animals. Resource Publication, 160.Washington, DC: Fish and Wildlife Service, U.S. Department of Interior; 1986.
Oros D, Werner I. Pyrethroid insecticides: an analysis of use patterns, distributions,potential toxicity and fate in the Sacramento-San Joaquin Delta and Central Valley.White Paper for the Interagency Ecological ProgramSFEI Contribution, 415.Oakland, CA: San Francisco Estuary Institute; 2005.
Pick FE, Van Dyk LP, De Beer PR. The effect of simulated rain on deposits of some cottonpesticides. Pest Sci 1984;15:616–23.
Power DM, Llewellyn L, Faustino M, Nowell MA, Björnsson BT, Einarsdottir IE, et al.Thyroid hormones in growth and development of fish. Comp Biochem Physiol CToxicol Pharmacol 2001;130:447–59.
Russ M. An investigation of the effects locust-control pesticides, Fenitrothion andFipronil, on avian development using an in ovo model. Dissertation, University ofWollongong, 2005.
Sandahl JF, Baldwin DH, Jenkins JJ, Scholz NL. A sensory system at the interface betweenurban stormwater runoff and salmon survival. Environ Sci Technol 2007;41:2998–3004.
Scher HB, Rodson M, Lee K-S. Microencapsulation of pesticides by interfacialpolymerization utilizing isocyanate or aminoplast chemistry. Pest Sci 1998;54:394–400.
Schlenk D, Huggett DB, Allgood J, Bennett E, Rimoldi J, Beeler AB, et al. Toxicity offipronil and its degradation products to Procambarus sp.: field and laboratorystudies. Arch Environ Contam Toxicol 2001;41:325–32.
Schmuck R, Pflüger W, Grau R, Hollihn U, Fischer R. Comparison of short-term aquatictoxicity: formulation vs active ingredients of pesticides. Arch Environ ContamToxicol 1994;26:240–50.
Schulz R. Field studies on exposure, effects, and risk mitigation of aquatic nonpoint-source insecticide pollution: a review. J Environ Qual 2004;33:419–48.
Skandrani D, Gaubin Y, Vincent C, Beau B, Claude Murat J, Soleilhavoup J-P, et al.Relationship between toxicity of selected insecticides and expression of stressproteins (HSP, GRP) in cultured human cells: effects of commercial formulationsversus pure active molecules. Biochim Biophys Acta (BBA) — Gen Subj 2006;1760:95-103.
Soderlund DM. Pyrethroids, knockdown resistance and sodium channels. Pest ManagSci 2008;64:610–6.
Sprague LA, Nowell LH. Comparison of pesticide concentrations in streams at low flowin six metropolitan areas of the United States. Environ Toxicol Chem 2008;27:288–98.
Stehr CM, Linbo TL, Incardona JP, Scholz NL. The developmental neurotoxicity offipronil: notochord degeneration and locomotor defects in zebrafish embryos andlarvae. Toxicol Sci 2006;92:270–8.
TDC-Environmental. Urban Pesticides Use Trends Annual Report 2008. http://www.up3project.org/up3_documents.shtml (Accessed January 2009).
Tsuji K. Microencapsulation of pesticides and their improved handling safety. JMicroencapsul 2001;18:137–47.
Underwood AJ. Experiments in ecology: their logical design and interpretation usinganalysis of variance. Cambridge, UK: Cambridge University Press; 1997.
USEPA. Methods for measuring the acute toxicity of effluents and receiving waters tofreshwater organisms. Fifth edition, EPA/821/R-02/012. 2002a.
USEPA. Short-term methods for estimating the chronic toxicity of effluents andreceiving waters to freshwater organisms. Fourth edition, EPA/821/R-02/013.2002b.
USEPA. Data requirements for pesticide registration, 2007a.USEPA. Pesticide Registration (PR) Notice 97-6: Use of term “inert” in the label
ingredients statement, 2007b. http://www.epa.gov/pesticides/regulating/data_re-quirements.html (Accessed March 2008).
Werner I, Moran K. Effects of pyrethroid insecticides on aquatic organisms. Syntheticpyrethroids: occurrence and behavior in aquatic environments; 2008. p. 310–34.
Werner I, Zalom FG, Oliver MN, Deanovic LA, Kimball TS, Henderson JD, et al. Toxicity ofstorm-water runoff after dormant spray application in a French prune orchard,Glenn County, California, USA: temporal Patterns and the effect of ground covers.Environ Toxicol Chem 2004;23:2719–26.
Weston DP, Holmes RW, You J, Lydy MJ. Aquatic toxicity due to residential use ofpyrethroid insecticides. Environ Sci Technol 2005;39:9778–84.
Yang WC, Gan J, Hunter W, Spurlock F. Effect of suspended solids on bioavailability ofpyrethroid insecticides. Environ Toxicol Chem 2006;25:1585–91.
Yang WC, Hunter W, Spurlock F, Gan J. Bioavailability of Permethrin and Cyfluthrin insurface waters with low levels of dissolved organic matter. J Environ Qual 2007;36:1678–85.

POD 2008-2010: Final Report
Manuscript in preparation
Changes in gene expression in larval fathead minnow (Pimephales promelas) following
short-term exposure to two insecticides, bifenthrin and fipronil.
Sebastian Beggel a, b, Richard Connon a, Juergen Geist b, Inge Werner a
a Aquatic Toxicology Laboratory, Dept. of Anatomy, Physiology and Cell Biology, School of
Veterinary Medicine, University of California, One Shields Avenue, Davis, CA 95616, USA
b Unit of Functional Aquatic Ecology and Fish Biology, Department of Animal Science,
Technische Universität München, Muehlenweg 22, 85354 Freising-Weihenstephan, Germany
198

POD 2008-2010: Final Report
Introduction
For environmental risk assessment in the field of ecotoxicological research, molecular methods are becoming more and more important. So called “omics” technologies allow investigation of chemical modes of action from a mechanistic point of view. These techniques are suitable to describe the effects of environmental stressors, including chemical contaminants, on organisms at concentration levels far below the lethal range. This goes hand in hand with ecological relevance, as many chemicals occur at concentrations far below lethal levels. Sublethal concentrations are known to affect organisms at the molecular and individual level that can result in negative consequences at the population and finally ecosystem levels. This is of special concern with regard to sensitive non-target organisms. The application of insecticides in urban and agricultural areas and their effects on aquatic ecosystems are a good example for this. Molecular approaches provide tools for investigating the pathways of adverse effects in the organism. Molecular biomarkers can be rapid, cost-effective and sensitive diagnostic tools for physiological organism impacts. To study gene responses of fish to insecticide exposure, we used the common model organism, the fathead minnow (Pimephales promelas). Effects were determined by quantifying the expression of a suite of biomarker genes involved in molecular pathways involved in organism growth, energy metabolism, muscular and neuronal function and general stress responses. In combination with previously measured effects on swimming performance and growth we evaluated, how useful a small set of biomarkers can be to predict and describe toxic effects of two different insecticides on larval fish. We exposed fish to two insecticides, the synthetic pyrethroid bifenthrin, and the phenylpyrazole fipronil, both widely applied in urban and agricultural areas. These insecticides are heavily used in urban areas, where application by homeowners and professionals for mosquito control, landscape treatment and structural pest control results in an extensive source of contamination (Budd et al., 2007; Sandahl et al., 2007). Even if not applied in the vicinity of surface water bodies, insecticides can be transported via irrigation runoff and stormwater into urban streams and waterways (Weston et al., 2005). Aquatic invertebrates and sensitive life stages of fish thus become targets of toxic substances at potentially hazardous concentrations. Both insecticides frequently been detected in surface waters and sediments in California surface waters (Budd et al., 2007, Sprague and Nowell, 2008). Runoff from residential areas contained bifenthrin at concentrations of 0.12 µg.L-1 to 6.12 µg.L-1, measured at the the point of storm water drainage outflows (L.Oki, UC Davis, personal communication). Like all pyrethroids, bifenthrin is highly toxic to aquatic organisms. The main mode of action is the interference with Na+ channel gating in the nerve cell endings, but other ion-channels such as Cl- and Ca2+ channels can be targeted as well (Burr and Ray, 2004). This leads to continuous neurotransmission, causing hyperexcitability, tremors, convulsions and ultimately death (Bradbury and Coats, 1989; Haya, 1989). Reported LC50 values of bifenthrin for fish range from 0.15 µg.L-1 to 17.5 μg.L-1 (Kegley, 2008; Werner and Moran, 2008). Fipronil is a “new generation” phenylpyrazole insecticide, whose mode of action differs from organophosphates and pyrethroids, to which numerous insects have developed resistance. Phenylpyrazoles interfere with the function of γ-aminobutyric acid (GABA)–gated Cl- channels (Cole et al., 1993). GABA is a major inhibitory neurotransmitter in the vertebrate central nervous system. In insects and mammals, the behavioral effects of GABA antagonists include hyperactivity, hyperexcitability, and convulsions, which are correlated with increased spontaneous nerve
199

POD 2008-2010: Final Report
activity (Gunasekara et al., 2007). Fish LC50 values have been reported for sheepshead minnow (130 µg.L-1), bluegill sunfish (54 μg.L-1) and rainbow trout (128 µg.L-1) (Gunasekara et al., 2007, Kegley, 2008). Concentrations measured in irrigation runoff from residential areas ranged from 0.122 to 10.0 µg.L-1 (L.Oki, UC Davis, personal communication), and ≥9 μg.L-1 in surface waters downstream of treated rice fields (Schlenk et al., 2001). Material and Methods Fish source, acclimation and quality assurance: Fathead minnow larvae were obtained from Aquatox Inc. (Hot Springs, AR, USA) at 7 d post-hatch on the day of arrival. Control water consisted of deionized water, modified with salts to meet US EPA specifications (electric conductivity (EC): 265 - 293 S.cm-1; hardness: 80-100 as mg CaCO3.L
-1; alkalinity: 57-64 as mg CaCO3.L
-1 (US EPA, 2002a). Fish were acclimated for a minimum period of 4 h in control water at a temperature of 25˚C. During the acclimation period <1% mortality was observed, and the fish fed and swam normally. During the project period, routine monthly reference toxicant tests were performed using NaCl to ascertain whether organism response fell within the acceptable range according to USEPA requirements (USEPA, 2002a). Each test consists of a dilution series (5 test concentrations) and a control. All test organisms responded normally (within 95% confidence interval of running mean) and sensitivity was considered typical. Insecticide exposure: Reference standard grade bifenthrin [[1α3α(2)]-(±)(2-methyl[1,1’-biphenyl]-3-yl)methyl 3-(2-chloro-3,3,3, trifluoro-1-propenyl)-2,2-dimethylcyclopropane-carboxylate], 99% purity (CAS number 82657-04-3), and fipronil (5-amino-1 [2,6-dichloro-4- (triflouromethyl) phenyl]-4 [(triflouromethyl) sulfinyl]- 1H-pyrazole-3-carbonitrile), 98.5% purity (CAS number 120068-37-3) were obtained from ChemService inc. (West Chester, PA, USA). Bifenthrin consists of 97% cis-isomer. Pure fipronil is a 50:50 racemic mixture. All insecticide exposure experiments were conducted at the Aquatic Toxicology Laboratory, School of Veterinary Medicine, University of California Davis. To determine acute toxic effects on survival, 7 d old larval fish were exposed for 24 h to the following nominal concentrations: 0.75, 1.0, 1.5, 2.0, 3.0 and 4.0 µg.L-1 bifenthrin and 150, 200, 250, 300, 350 and 400 μg.L-1 fipronil. We used 1 ml.L-1 methanol (MeOH) as the solvent carrier and one treatment group containing the same MeOH concentration in control water was added as a solvent control. Stock solutions were prepared in MeOH for pure insecticides (2000 mg.L-1) and used for both, 24 h LC50 determination and sublethal exposure experiments. Exposure concentrations used for assessment of sublethal stress responses were calculated as percentages of the nominal LC10 values derived from the acute toxicity tests. For each chemical, treatments consisted of a control, solvent control and 10%, 20%, 33% and 50% of the nominal LC10 (table 1). Each treatment consisted of 9 replicate 600 ml Pyrex beaker containing 250 ml test solution and 10 fish larvae. We used 3 replicates to sample fish for gene expression analysis at each of three different time points. At test initiation, 10 larvae were transferred from the acclimatization tank to each beaker and exposed to test solutions for 24 h at a water temperature of 25˚C and a 16:8 light-dark ratio. Test vessels were then manually distributed in a random manner, within the exposure water bath. Fish were not fed during the exposure period. For measuring exposure concentrations, sub-samples of each test solution (1 L) were preserved with dichloromethane (Fisher
200

POD 2008-2010: Final Report
Scientific, USA) at test initiation, shipped overnight to the California Department of Fish and Game Water Pollution Laboratory (Rancho Cordova, CA, USA), extracted within 24 h of arrival, and analyzed using gas chromatography with mass spectrometry and ion-trap detection. Reporting limits for detection of bifenthrin and fipronil were 0.002 μg.L-1 (recovery 88.3 %) and 0.2 μg.L-1 (recovery 83.1 %), respectively. After 24 h, a subset of fish from three replicate exposure containers per treatment was sampled. The remaining fish were transferred to control water and maintained according to standard US EPA protocols. Additional samples (3 replicates per treatment) were taken after 48 h, including a 24 h recovery period in control water, and after 7 days, including a 6 d recovery period. Fish were euthanized in MS-222, individually transferred into 1.5 ml Eppendorf tubes and immediately flash-frozen in liquid nitrogen. Samples were stored at -80°C until processing. Sample processing: RNA was extracted from whole, individual organisms, using QIAGEN RNeasy MiniKit according to manufacturer's instructions. Total RNA concentration was estimated from absorbance at 260 nm (NanoDrop ND 1000) and RNA quality was verified by electrophoresis on ethidium bromide-stained 1.5% agarose gels and A260/A280 ratios. 1.0 µg of total RNA was used for cDNA synthesis. Primer and probes for qPCR analyses were designed using Roche Universal Probe Library Assay Design Center (https://www.roche-applied-science.com). Designed primers were obtained from Eurofins MWG Operon (http://www.eurofinsdna.com), and TaqMan probes were supplied by Roche. Primers and probes for investigated biomarkers are detailed in table 1. Quantitative PCR: Complementary DNA (cDNA) was synthesized using 1.0 µg total RNA, with random primers and SuperScript® III reverse transcriptase (Invitrogen), and diluted to a total of 150 µl with nuclease free water to generate sufficient template for qPCR analysis. TaqMan Universal PCR Mastermix (Applied Biosystems) was used in q-PCR amplifications in a reaction containing 10 mM Tris–HCl (pH 8.3), 50 mM KCl, 5 mM MgCl2, 2.5 mM deoxynucleotide triphosphates, 0.625U AmpliTaq Gold DNA polymerase per reaction, 0.25U AmpErase UNG per reaction and 5 µL of cDNA sample in a final volume of 12 µL. Samples were placed in 384 well plates, and cDNA was amplified in an automated fluorometer (ABI PRISM 7900 Sequence Detection System, Applied Biosystems). Amplification conditions were 2 min at 50°C, 10 min at 95°C, 40 cycles of 15 s at 95°C and 60s at 60°C. Fluorescence of samples was measured every 7 s and signals were considered positive if fluorescence intensity exceeded 10 times the standard deviation of the baseline fluorescence (threshold cycle, CT). SDS 2.2.1 software (Applied Biosystems) was used to quantify transcription
201

POD 2008-2010: Final Report
Table 1: Primer pairs and TaqMan probes used in qPCR assessment of molecular biomarkers.
Accession No. Gene Primer Sequences
Probe No.
AY538777 Heat shock cognate 70 kDa protein (HSP70) Left: ccgttgaagatgagaaactcgc 101
Right: cctcattgcacttgtcgagga EF628371 Ferritin heavy chain mRNA Left: cttgctggttttgccaagttct 63 Right: gcccctcttgttctgaaactcc EU332792 CYP3A126 (CYP3A126) Left: caacccagaggccatgaaga 63 Right: gggccttatttgggaaggtct - Parvalbumin Left: gctctgtctgctgacaacgtg 63 Right: cagcaaaacccttcagcacaa EF628374 Epithelial calcium channel Left: gagaggccagaaggattcttga 109 Right: cagattccacttcagccttacga AY919670 60S ribosomal protein L8 Left: ggctaaggtggttttccgtga 35 Right: cttcagctgcaatgaacagctc EF628372 Glucose-6-phosphate dehydrogenase Left: tgagggaagcctggagaatct 35 Right: ggtggcgtcttctctttctcg - Cytochrome P4501A (CYP1A) Left: tctaacggttgtcccgatcct 9 Right: gaggcgcattagcagatacaca AY533140 Insulin-like growth factor-I Left: ggcaaaactccacgatcccta 9 Right: atgtccagatataggtttctttgctg - microglobulin Left: aactgctgaaagatggagtggtt 3 Right: cccttttcgaaggccaggt AY751300 Mx protein Left: gaaatggcatgggagaatcag 3 Right: cctgggcttcacgaatctttt AF130354 Vitellogenin precursor (Vtg) Left: ccatttgttcctgccactaagc 106 Right: cttgatgggaatctgaagctga AY643400 Elongation factor 1-alpha Left: ctctttctgttacctggcaaagg 66 Right: tcccatgattgattagtttcaggat AY855349 18S ribosomal RNA gene Left: cattggagggcaagtctggt 66 Right: tttaactgcagcaactttagtatacgc AY533141 Glucocorticoid receptor Left: caagaagggacgtcaaacagg 66 Right: ggaaagattgcgctctggaat - Heat shock protein 90 Left: ctggtcatcctcctgttcgag 56 Right: tgtgtctgaggatcgtccaatg - Metallothionein Left: ctgccagtgtacaacatgcaaga 56 Right: gcacatttgctgcaaccaga - Creatine kinase Left: ggaaatatgccaccccttcatt 5 Right: ccttgaacacctcataggtctcttc
AF190773 Natural resistance associated macrophage protein Left: gcaatgcatcaggcagtcct 103
Right: ccacctgtagcgtgctgttgt AY643399 Growth hormone Left: gtggtcctggttagtttgttggt 103 Right: tgactgcgttgttgaagagcc AF192407 Zona pellucida glycoprotein 3 (ZP3) Left: atcatgggtgctttgtggatg 11 Right: gcttgtgaccgaggcatga EF628373 Glutathione S-transferase Left: ccggcaagagcttcaccat 48 Right: agtgaagtcgtgggaaataggc - Aspartoacylase Left: tctggtaatggatgtcccgatt 94 Right: gacctctatggaaaagccatgc - TGF beta Left: tgagcctgtacaacacgctga 1 Right: gtcccacgtagtagaggatggtg
202

POD 2008-2010: Final Report
Statistical analysis: We used the geNorm algorithm to estimate the variability of reference gene expression, and to determine an optimal gene for normalization of the data (Vandesompele et al., 2002). Quantitative PCR data was analyzed using the relative quantification 2(-Delta Delta CT) method (Livak and Schmittgen, 2001). Expression was calculated relative to EF1alpha determined by GeNorm as the least variable gene in this study. As some quantitative PCR data were not distributed normally, significant differences in gene expression, relative to the unexposed controls, were assessed using Kruskal-Wallis nonparametric test with Dunn´s post-hoc test to compare treatments. For analysis each gene was treated as a separate experiment. Transcription profile heatmaps were created using Genesis gene expression analysis software (Technical University Graz, Austria). Results and Discussion Water chemistry: Physicochemical parameters measured at the beginning and end of the 24 h exposure period were within the acceptable range for the test organism (USEPA, 2002a; USEPA, 2002b) for all experiments and treatments. The measured mean values (± standard deviation) were pH: 7.51 (± 0.19), dissolved oxygen 7. 2 (± 0.5) mg.L-1, temperature: 23.1 (± 0.3) ˚C, and EC: 278 (± 6) μS.cm-1. Sublethal effects: Expression of target genes involved in stress responses, neuromuscular function, and endocrine function, was determined, and insecticide-exposed fish were compared with untreated (control) fish. Individual effects were observed for each substance at concentrations below 50% of the LC10. Concentration levels in the following sections refer to the measured dissolved fractions of active ingredient (A.I.), or to percentages of the nominal LC10 values determined by initial acute toxicity tests (table 2).
Table 2: Nominal and measured effect concentrations in [µg/L] of bifenthrin and fipronil for larval fathead minnow.
Substance concentration [µg/L] 10% LC10 20% LC10 33% LC10 50% LC10
bifenthrin nominal 0.09 0.18 0.31 0.46
measured 0.07 0.14 0.24 0.35
fipronil nominal 31 61 102 153
measured 53 142 333 365 Effects on gene expression: Significant gene expression responses to bifenthrin and fipronil exposures were observed at the lowest tested concentrations, equal to 10% of the 24 h LC10. The response was often bi-phasic, and genes that were down-regulated at the lowest exposure concentration were generally up-regulated at higher concentrations and vice versa. Beyond a threshold concentration, expression of most genes increased or decreased in a dose dependent manner. This threshold concentration was the same concentration that caused measurable negative effects on swimming ability of the fish (figures 1, 2; Beggel et al. 2010). In a few cases, expression levels remained unchanged at higher exposure concentrations after initial up- or down-regulation.
203

POD 2008-2010: Final Report
Gene responses to bifenthrin: Significant gene responses to bifenthrin exposure at only the lowest test concentration of 0.07 µg.L-1 (10% LC10) were measured for genes involved in endocrine function and growth: Cyp3A (p<0.05), parvalbumin (p<0.01), zona pellucida (p<0.01), glucocorticoid receptor (p< 0.001), insuline-like growth factor (p<0.01), growth hormone (p<0.01) and HSP90 (p<0.001). Expression of insuline-like growth factor (p <0.001) and growth hormone (p <0.01) was also significantly different from control at the highest exposure concentration. Significant dose-dependent responses to bifenthrin were observed for genes involved in neuromuscular function, nerve repair and energetic status. Aspartoacylase (ASPA), in particular, was significantly downregulated at all exposure concentrations (0.07 µg.L-1, p <0.001. 0.14 µg.L-1, p <0.01, 0.24 µg.L-1, p <0.05, 0.35 µg.L-1, p <0.05). Aspartoacylase catalyzes hydrolysis of N-acetyl-L-aspartate (NAA) to aspartate and acetate in the vertebrate brain. Deficiency in ASPA activity leads to degeneration of Myelin sheet of nerve cell axons. Our data corroborate findings by Connon et.al. (2009), who observed significant downregulation of ASPA in the endangered fish species, delta smelt (Hypomesus transpacificus), after exposure to sublethal concentrations of the pyrethroid, esfenvalerate. Creatine kinase was significantly downregulated after exposure to 0.24 µg.L-1 (p <0.05) and 0.35 µg.L-1 (p <0.001) bifenthrin. Creatine kinase plays an important role in the cellular energy metabolism, and is involved in muscle contraction by regulating calcium uptake and ATP/ADP ratios (Rossi et al., 1990). Creatine kinase activity is measured in humans to evaluate the energetic status of the brain. Expression of metallothionein was significantly up-regulated in fish exposed to 0.24 µg.L-1 (p <0.05) and 0.35 µg.L-1 (p <0.001) bifenthrin. Metallothionein is often used as a biomarker for metal-induced stress, but it is also known to contribute to a variety of other cellular processes, including neuroprotection and regeneration after CNS injuries (West et.al.2008). Cytochrome CYP3A (Christen et al., 2010) plays an important role in the detoxification of xenobiotics in fish. Bifenthrin exposure led to a significant down-regulation of this enzyme at concentrations of 0.24 µg.L-1 (p<0.001) and 0.35 µg.L-1 (p<0.001). Additionally, another enzyme important in the cellular defense against oxidative stress, glutathione-S-transferase, was significantly down-regulated at the highest exposure concentration (p <0.05). Downregulation of such important enzymes has the potential to negatively affects the organism’s detoxification capacity, and response to other stressors thus possible synergistic toxicity of bifenthrin with other chemicals is of concern.
204

POD 2008-2010: Final Report
205
Concentration bifenthrin [µg/L]
-6
-5
-4
-3
-2
-1
0
1
2
3
4
0 0.1 0.2 0.3 0.4 0.5
Vitellogenin
Zona Pellucida
glucocorticoidreceptor
Growthhormoneigf
-6
-5
-4
-3
-2
-1
0
1
2
3
4
0 0.1 0.2 0.3 0.4 0.5
Cyp3a
Cyp1a
HSP90
GST
Metallothionein
-6
-5
-4
-3
-2
-1
0
1
2
3
4
0 0.1 0.2 0.3 0.4 0.5
parvalbumin
creatine kinase
Aspartoacylase
eCaCH
G6PD
Fol
dch
ange
in g
ene
expr
essi
on(E
F1a
nor
mal
ized
)
Figure 1: Changes in gene expression in reponse to bifenthrin exposure. Significant changes occurred at 0.07 µg.L-1bifenthrin. Measured concentration levels ≥ 0.14 µg.L-1result in negative effects on swimming performance (lowest observed effect threshold for swimming indicated by --). Strongest differences were observed for genes involved in detoxification, energy and neuromuscular function.

POD 2008-2010: Final Report
Gene responses to fipronil: Changes in gene expression occurred at the lowest test concentration of 53 µg.L-1 fipronil (10% LC10, measured concentration). Significant changes were observed for the epithelial calcium channel (p <0.001), G6PD (p <0.05), vitellogenin (p <0.05) and metallothionein (p <0.05). At the highest fipronil concentration (365 µg.L-1 measured concentration), significant up-regulation was observed for Cyp3A (p <0.01), metallothionein (p <0.01) and epithelial calcium channel (p <0.01), suggesting that cellular xenobiotic detoxification processes and maintenance of ion homeostasis were negatively affected. Similar to bifenthrin-exposed fish, fipronil led to an up-regulation of ASPA at the highest exposure concentration (p <0.01). Fipronil exposure also caused induction of the glucocorticoid receptor (p <0.001); these are the principal receptors mediating the effects of glucocorticoids, mainly cortisol, in fish. Cortisol levels are used as indication of physiological stress, however, cortisol is also involved in growth, larval development, cognition and immune function. Glucocorticoids are known for maintaining basal and stress-related homeostasis in mammals. In the stressed state, elevated cortisol is important for central nervous system activation, increasing blood glucose concentration and elevating mean blood pressure, important parameters for stress compensation (Mommson et al., 1999). In fish, cortisol is involved in increasing plasma glucose concentration leading to increases in metabolic rate and oxygen uptake in response to elevated energy demand. Exposure to fipronil also resulted in strong dose-dependent up-regulation of the gene coding for egg-yolk protein, or vitellogenin (p <0.01), indicative of estrogenic effects in larval fish. Larval fish do not naturally express this gene. From gene expression to higher level effects: Observed responses in gene expression demonstrate stress-related cellular effects in exposed fathead minnow larvae. The initial response at very low concentrations likely indicates disturbance in cell homeostasis leading, with increasing concentration, to adaptive and compensatory responses. It might be expected that these energy demanding responses result in measurable negative outcomes on the individual level, i.e. behavior, growth and reproduction. We recently demonstrated (Beggel et al. 2010) significant impacts of sublethal bifenthrin and fipronil concentrations on swimming ability and behavior, as well as 7-d growth of larval fathead minnow (Beggel et al. 2010). Swimming ability was significantly affected following 24 h exposure to ≥ 0.14 µg.L-1 bifenthrin. This threshold corresponds to the onset of the second phase responses at the molecular level, which tended to be dose-dependent. Further assessment of swimming performance after 48 h and 6 d in control water showed that fish are able to recover from initial negative effects. The neuromuscular impairment after short bifenthrin exposure was reversible. This recovery was reflected in expression levels of ASPA. After the 6 d recovery period, the initially significantly downregulated ASPA showed no difference to control after exposure to 0.07 and 0.14 µg.L-1 bifenthrin (figure 3). Fipronil exposure led to significant impairment of swimming at 20% of the LC10, however effects were less pronounced than in fish exposed to bifenthrin. Contrary to bifenthrin, recovery of swimming performance was not observed for fish exposed to 365 µg.L-1 fipronil (measured). Fipronil exposed fish showed enhanced 7-d growth compared to controls, which may be linked to the strong estrogenic effects observed in the highest exposure concentration (figure 4). Expression of vitellogenin was increased approximately 90 fold after the 6 d recovery period .
206

POD 2008-2010: Final Report
-6
-5
-4
-3
-2
-1
0
1
2
3
4
0 20 40 6 80 100 120 140 160 1800
Cyp3A
Cyp1A
HSP90
GST
Metallothionein
-6
-5
-4
-3
-2
-1
0
1
2
3
4
0 20 40 6 80 100 120 140 160 180
Vitellogenin
0
Zona Pellucida
glucocorticoidreceptorGrowthhormoneigf
-6
-5
-4
-3
-2
-1
0
1
2
3
4
0 20 40 6 80 100 120 140 160 1800
Parvalbumin
creatine kinase
Aspartoacylase
eCaCh
G6PD
Concentration fipronil [µg/L]
Fol
dch
ange
in g
ene
expr
essi
on(E
F1a
nor
mal
ized)
-6
-5
-4
-3
-2
-1
0
1
2
3
4
0 20 40 6 80 100 120 140 160 1800
Cyp3A
Cyp1A
HSP90
GST
Metallothionein
-6
-5
-4
-3
-2
-1
0
1
2
3
4
0 20 40 6 80 100 120 140 160 180
Vitellogenin
0
Zona Pellucida
glucocorticoidreceptorGrowthhormoneigf
-6
-5
-4
-3
-2
-1
0
1
2
3
4
0 20 40 6 80 100 120 140 160 1800
Parvalbumin
creatine kinase
Aspartoacylase
eCaCh
G6PD
Concentration fipronil [µg/L]
Fol
dch
ange
in g
ene
expr
essi
on(E
F1a
nor
mal
ized)
Figure 2: Changes in gene expression in reponse to fipronil exposure. Concentration levels ≥ 61 µg/L (nominal) resulted in negative effects on swimming performance (--). Strongest differences were observed for genes involved in detoxification and endocrine function.
207

POD 2008-2010: Final Report
24 h 48 h 168 h
-5
-4
-3
-2
-1
0
1
0.07 µg/L0.14 µg/L
Fol
dch
ange
gene
exp
ress
ion
timepoint
24 h 48 h 168 h
-5
-4
-3
-2
-1
0
1
0.07 µg/L0.14 µg/L
Fol
dch
ange
gene
exp
ress
ion
timepoint Figure 3: Fold change in gene expression of aspartoacylase exposed to 0.07 and 0.14 µg.L-1 bifenthrin. at three timepoints. (i) 24 h (exposure period); (ii) 48 h (24 h exposure, 24 h recovery); (iii) 168 h (24 h exposure, 6 d recovery).
-20
0
20
40
60
80
100
24 h 48 h 168 h
53 µg/L
142 µg/L
Fo
ldch
ange
gene
expr
essi
on
timepoint-20
0
20
40
60
80
100
24 h 48 h 168 h
53 µg/L
142 µg/L
Fo
ldch
ange
gene
expr
essi
on
timepoint
Figure 4: Fold change in gene expression of vitellogenin exposused to nominal 53 and 142 µg.L-1 fipronil at three timepoints. (i) 24 h (exposure period); (ii) 48 h (24 h exposure, 24 h recovery); (iii) 168 h (24 h exposure, 6 d recovery).
Expression profiling: Genesis software, a tool developed to analyze microarray datasets, was used to perform cluster analysis of gene expression data. Expression data from individual fish samples were grouped by hierarchical clustering to create a heatmap. This allowed discrimination between fish exposed to different insecticides. Two main clusters separated between bifenthrin and fipronil exposed fish (figure 5) with few exceptions. Within these two major groups, cluster analysis also distinguished between exposure concentrations. Due to individual variation in gene expression the transcriptional patterns were not exactly the same for all test animals from one specific treatment group, but the separation into distinct groups is obvious. However, further research is required to improve this approach. The application of this set of genes on field samples with unknown exposure history could be a promising method to screen for toxicant effects in the environment. Furthermore, the analysis of gene expression profiles for effects of chemical mixtures should be examined in more detail.
208

POD 2008-2010: Final Report
Bifenthrin exposed samples
Fipronil exposed samples
Figure 5: Heat map showing clusters of gene expression data from fish exposed to bifenthrin and fipronil (Manhattan distance) for 24 h. Red indicates up-regulation of genes, green down-regulation.
209

POD 2008-2010: Final Report
Acknowledgements
We would like to thank the staff of the UC Davis Aquatic Toxicology Laboratory for assistance with exposure experiments. This study was supported by the Interagency Ecological Program, Sacramento, California (Contract No. 4600008070 to I. Werner), and a postgraduate scholarship to S. Beggel (Contract No. DOK-82-07 to J. Geist) by Bayerische Forschungsstiftung, Germany.
References
Ames A. 2000. CNS energy metobolism as related to function. Brain Research Reviews 34: 42-68.
Beggel S, Werner I, Connon RE, Geist J. 2010. Sublethal toxicity of commercial insecticide formulations and their active ingredients to larval fathead minnow (Pimephales promelas). Science of the Total Environment. In press.
Budd R, Bondarenko S, Haver D, Kabashima J, Gan J. 2007. Occurrence and Bioavailability of Pyrethroids in a Mixed Land Use Watershed. Journal of Environmental Quality 36: 1006-1012.
Bradbury SP, Coats JR. 1989. Toxicokinetics and toxicodynamics of pyrethroid insecticides in fish. Environmental Toxicology and Chemistry 8: 373-380.
Burr SA, Ray DE. 2004. Structure-Activity and Interaction Effects of 14 Different Pyrethroids on Voltage-Gated Chloride Ion Channels. Toxicological Science 77: 341-346.
Christen V, Caminada D, Arand M, Fent K. 2010. Identification of CYP3A form (CYP3A126) in fathead minnow (Pimephales promelas) and characterisation of putative CYP3A enzyme activity. Analytical and Bioanalytical Chemistry 396: 585-595.
Connon R, Hooper HL, Sibly RM, Lim F, Heckmann LH, Moore DJ, Watanabe H, Soetart A, Cook K, Maund SJ, Hutchinson TH, Moggs J, De Coen W, Iguchi T, Callaghan A. 2007. Linking Molecular and Population Stress Responses in Daphnia magna exposed to Cadmium. Environmental Science and Technology 42. 2181-2188.
Connon RE, Geist, J, Pfeiff J, Loguinov AV, DAdronzo LS, Wintz H, Vulpe CD, Werner I. 2009. Linking mechanistic and behavioural responses to sublethal esfenvalerate exposure in the endangered delta smelt; Hypomesus transpacificus (Fam. Osmeridae). BMC Genomics 10:608.
Gunasekara AS, Truong T, Goh KS, Spurlock F, Tjeerdema RS. 2007. Environmental fate and toxicology of fipronil. Journal of Pesticide Science 32: 189-199.
Haya K. 1989. Toxicity of pyrethroid insecticides to fish. Environmental Toxicology and Chemistry 8: 381-392.
Heath AG, Cech, JJ, Zinkl JG, Finlayson B, Fujimura R. 1993. Sublethal effects of methyl parathion, carbofuran, and molinate on larval striped bass. American Fisheries Society Symposium 14: 17-28.
Kegley SE, Hill, BR., Orme S, Choi AH. PAN Pesticide Database. 2007. Pesticide Action Network, North America, San Francisco, CA. http://www.pesticideinfo.org
210

POD 2008-2010: Final Report
211
Livak KJ, Schmittgen TD. 2001. Analysis of relative gene expression data using real-time quantitative PCR and the 2(-Delta Delta C(T)) Method. Methods (San Diego, Calif 25:402-408.
Mommson TP, Vijayan MM, Moon TW. 1999. Cortisol in teleosts: dynamics, mechanisms of action, and metabolic regulation. Reviews in Fish Biology and Fisheries 9: 211-268.
Rossi AM, Eppenberger HM, Volpe P, Cotrufo R, Wallimann T. 1990. Muscle-type MM creatine kinase is specifically bound to sarcoplasmic reticulum and can support Ca2+ uptake and regulate local ATP/ADP ratios. The Journal of biological chemistry 265:5258-5266.
Sandahl JF, Baldwin DH, Jenkins JJ, Scholz NL. 2007. A Sensory System at the Interface between Urban Stormwater Runoff and Salmon Survival. Environmental Science & Technology 41: 2998-3004.
Schlenk D, Huggett DB, Allgood J, Bennett E, Rimoldi J, Beeler AB, Block D, Holder AW, Hovinga R, Bedient P. 2001. Toxicity of Fipronil and Its Degradation Products to Procambarus sp.: Field and Laboratory Studies. Archives of Environmental Contamination and Toxicology 41: 325-332.
Shahsavarani A, Perry SF. 2006. Hormonal and environmental regulation of epithelial calcium channel in gill of rainbow trout (Oncorhynchus mykiss). American Journal of Physiology - Regulatory, Integrative and Comparative Physiology 291: R1490-R1498.
Sprague LA, Nowell LH. 2008. Comparison of pesticide concentrations in streams at low flow in six metropolitan areas of the United States. Environmental Toxicology and Chemistry 27: 288-298.
Thorpe KL, Benstead R, Hutchinson TH, Tyler CR. 2007. Associations between altered vitellogenin concentrations and adverse health effects in fathead minnow (Pimephales promelas). Aquatic Toxicology 85: 176-183
USEPA. 2002a. Methods for Measuring the Acute Toxicity of Effluents and Receiving Waters to Freshwater Organisms. Fifth edition, EPA/821/R-02/012.
USEPA.2002b. Short-term Methods for Estimating the Chronic Toxicity of Effluents and Receiving Waters to Freshwater Organisms. Fourth edition, EPA/821/R-02/013.
West AK, Hidalgo J, Eddins D, Levin ED, Aschner M. 2008. Metallothionein in the central nervous system: Roles in protection, regeneration and cognition. NeuroToxicology 29: 489-503
Vandesompele J, De Preter K, Pattyn F, Poppe B, Van Roy N, De Paepe A, Speleman F. 2002. Accurate normalization of real-time quantitative RT-PCR data by geometric averaging of multiple internal control genes. Genome Biologoy 3:Research0034
Werner I, Moran K. 2008. Effects of Pyrethroid Insecticides on Aquatic Organisms. Synthetic Pyrethroids: OCCURRENCE AND BEHAVIOR IN AQUATIC ENVIRONMENTS, pp. 310-334.
Weston DP, Holmes RW, You J, Lydy MJ.2005. Aquatic Toxicity Due to Residential Use of Pyrethroid Insecticides. Environmental Science & Technology 39: 9778-9784.