pef assessment and accreditation committee data summary report
TRANSCRIPT

Professional Education Faculty
2015-2016
Georgia State University
PEF Assessment and Accreditation
Committee Data Summary Report
OVERVIEW
The PEF Assessment and Accreditation Committee examines data related to
CAEP Standards 1, 3, 4, and 5, and PSC Georgia Requirements Standard 6.
CAEP STANDARD 1
The provider ensures that candidates develop a deep understanding of the criti-
cal concepts and principles of their discipline and, by completion, are able to use
discipline-specific practices flexibly to advance the learning of all students to-
ward attainment of college- and career-readiness standards.
CAEP STANDARD 3
The provider demonstrates that the quality of candidates is a continuing and
purposeful part of its responsibility from recruitment, at admission, through the
progression of courses and clinical experiences, and to decisions that complet-
ers are prepared to teach effectively and are recommended for certification.
The provider demonstrates that development of candidate quality is the goal of
educator preparation in all phases of the program. This process is ultimately
determined by a program’s meeting of Standard 4.
CAEP STANDARD 4
The provider demonstrates the impact of its completers on P-12 student learn-
ing and development, classroom instruction, and schools, and the satisfaction
of its completers with the relevance and effectiveness of their preparation.
CAEP STANDARD 5
The provider maintains a quality assurance system comprised of valid data
from multiple measures, including evidence of candidates’ and completers’
positive impact on P-12 student learning and development. The provider sup-
ports continuous improvement that is sustained and evidence-based, and that
evaluates the effectiveness of its completers. The provider uses the results of
inquiry and data collection to establish priorities, enhance program elements
and capacity, and test innovations to improve completers’ impact on P-12 stu-
dent learning and development.
TABLE OF CONTENTS
Overview ………………...………..1
Action Items ……………….……..2
edTPA Support…………….……..3
Intern KES ……………….…….4-5
CF Student Survey ….……….6-9
GACE Scores ………..……..10-12
Entry Scores ………….……..13-15
Dispositions ………..……….16-18
edTPA Scores ………………19-23
OUR MISSION
is to prepare educators who are:
informed by research,
knowledge and reflective practice;
empowered to serve as change
agents;
committed to and respectful of
all learners; and
engaged with learners, their
families, schools, and local and
global communities.
2
The 2014-2015 PEF Annual Report identified the following action items for this
committee to address in 15-16:
Continue the review of mid and end point data.
Identify an appropriate dispositions instrument for Advanced and Endorse-
ment Program.
Fall 2015, work with program coordinators in advanced programs to
identify mid and endpoint assessments.
Offer unit wide training sessions on the Intern KES: one in fall semester and
one in spring prior to the end of the semester.
Full implementation of edTPA for fall 2015.
Continue to review and disseminate student scores to faculty.
Local evaluation scores will be compared with the external scores
Update program web site pages with BOR 2014 Accountability Report
Continue to stay abreast of CAEP Standards, especially, CAEP standards for
advanced degrees and endorsement programs.
Conduct an in-depth look at CAEP Standards 1 and 4 to ensure the necessary
assessments are in place to access data.
Develop a method of analysis for selectivity of student national scores: GRE,
SAT, ACT.
ASSESSMENT AND ACCREDITATION
COMMITTEE: ACTION ITEMS FOR
2015-2016

3
2015-2016
EDTPA SUPPORT STRUCTURES THROUGH
THE DEAN’S OFFICE, CEHD
Since 2014-2015 was the implementation year for edTPA in the state of Georgia, the dean’s
office worked to provide support structures to enable faculty as well as students to get au-
thentic experiences in understanding edTPA tasks. Some of the supports included:
Associate to the Dean for Clinical Practice: This position was created to help facili-
tate the edTPA implementation process across the different initial preparation programs in
GSU. The associate to the dean played a key role in organizing training sessions and man-
aging support structures for edTPA implementation, in response to specific needs of the
different programs.
Local Evaluation Training: Every semester two trainings were offered to faculty as well
as supervisors on the process of local evaluation of edTPA portfolios. The trainings were
three hours long and helped faculty to engage in close examination of the edTPA hand-
books in their content areas and familiarize with rubric structure, prompts, and the expec-
tations for local evaluation.
Instructional Seminars for Students: multiple seminars were offered to candidates
across content handbooks specific to edTPA tasks. Online seminars were offered for
GOML students.
Candidate Work Samples: edTPA work samples were collected for different content
handbooks. These work samples served as locally developed exemplars for students as well
as faculty to get an understanding of edTPA prompts and rubrics.
Curriculum Mapping and Data Analysis: the associate to the dean helped with data
analysis for all edTPA portfolios scored by Pearson and comparisons were made for all GSU
portfolios with state and national trends for each rubric and handbook. Based on results,
curriculum mapping for edTPA related assignments as well as local evaluation was also
done.
Mentor Work with Candidates for edTPA Retakes: for all candidates needing to
retake a portion or all of edTPA, processes were outlined to provide mentor support
through GRAs for the different content handbooks.
Monthly edTPA Liaison Group Meetings: a monthly edTPA liaison group meeting
provided opportunity to program faculty to share their edTPA related experiences, ask questions and learn from other colleagues about edTPA implementation in the different
programs across the unit. This meeting also provided a platform to share all important news and events related to edTPA in the state, as well as any policy changes and updates.

14-15 INTERN KES– INTASC STANDARDS
4
INTERN KEYS (Midpoint N = 111)
Level IV Level III Level II Level I Unit Average
Learner and
Learning 3% 41% 53% 3% 2.4 Level IV Level III Level II Level I Unit Average
Content
Knowledge 3% 41% 52% 3% 2.4 Level IV Level III Level II Level I Unit Average
Instruction 2% 36% 59% 3% 2.4
Level IV Level III Level II Level I Unit Average
Professional
Development 5% 38% 54% 3% 2.5
INTERN KEYS (Endpoint N = 290)
Level IV Level III Level II Level I Unit Average
Learner and
Learning 14% 78% 8% 3.1
Level IV Level III Level II Level I Unit Average
Content
Knowledge 14% 80% 6% 3.1
Level IV Level III Level II Level I Unit Average
Instruction 12% 78% 10% 3.0
Level IV Level III Level II Level I Unit Average
Professional
Development 18% 78% 4% 0% 3.1

Findings on mid-point and endpoint for the Intern KES assessments are linked to the INTASC
standards and the four learning outcomes: Learner and Learning, Content Knowledge, Instruc-
tion, and Professional Development. Initial teacher preparation candidates were assessed at the
mid and end point of their programs on Intern KES standards. Their ratings in the four IN-
TASC principles: Learner and Learning, Content Knowledge, Instruction, and Professional
Development are provided in the table on page 4. Ratings were provided on a four point scale,
with Level IV representing an accomplished and exemplary teacher.
At midpoint, most candidates were rated at Level II (on a 4 level scale). Level II is charac-
terized by an inconsistent demonstration and use of knowledge in practice. The unit mean
for midpoint was 2.4 (for a detailed table with the ten Intern KES indicators ratings, and
their alignment with different INTASC principles see the LiveText committee folder data
file)
At the endpoint, most candidates were rated at Level III, with the unit mean at 3.1 for all
the INTASC categories. Level III is characterized by proficient performance by the teacher
candidate, demonstrating the knowledge and skills acceptable for a beginning level teach-
er.
5
SUMMARY OF INTERN KES 14-15 FINDINGS
Beginning fall of 2013, many EPPs across Georgia began using the TAPS as a summative assessment
at the end of the clinical practice. As a result, each EPP was encouraged by the Georgia Department of
Education to have at least one faculty member complete the TKES credentialing. GSU organized three
sessions for faculty training on the TAPS instrument, which were conducted by the GaDOE. CAEP
and state accreditation expectations for assessment rubrics are that these should be valid and reliable
instruments. Intern KES validity and reliability was established, in collaboration with the Council of
Chief State School Officers (CCSSO) grant to the University of Georgia with participation of 17 EPPs,
including GSU.
Overall, the Intern KES instrument has a high reliability and internal consistency (Chronbach’s
alpha .95; one factor solution for 10 items). Also, the internal consistency of ratings provided by
mentors and supervisors were equal, indicating that professionals in these two roles apply the in-
strument in a similar way.
Among the 10 standards, Assessment Uses (Standard 6) and Differentiated Instruction (Standard 4)
are given lower scores by raters, indicating that these are more difficult for teacher candidates. In
contrast, professionalism (Standard 9) is the easiest standard to meet.
The results showed that raters who had watched videos only in their training, tended to rate signifi-
cantly higher than those who were trained with live method (s) on those standards.
OVERVIEW OF INTERN KES
RELIABILITY AND VALIDITY ANALYSIS

STUDENT SURVEY FEEDBACK ON PROGRAM EFFECTIVENESS
6
Conceptual Framework 14-15 Student Survey (4 point scale)
Midpoint Results Endpoint Results
Objectives Objective Number
Midpoint Mean
(All Pro-grams)
Mid-point Mean (ECE)
N= 30
Mid-point Mean (MSE)
N= 32
Mid-point Mean (P-12)
N= 27
End point Mean
(All Pro-grams)
End point Mean (ECE)
N=34
End point Mean (MSE)
N=71
End Point Mean (P-12)
N=27
Our candidates use their knowledge of child, adoles-cent, and adult development and theories of learning to design meaningful educational opportunities for all learners. (CF 1.1)
CF 1.1 3.42 3.45 3.25 3.56 3.62 3.70 3.48 3.69
Our candidates possess and use research-based, discipline-specific knowledge and peda-gogy to facilitate learning for all. (CF 1.2)
CF 1.2 3.35 3.26 3.16 3.63 3.53 3.70 3.38 3.50
Our candidates reflect critically upon data as part of a recur-sive process when planning, implementing and assessing teaching, learning, and devel-opment. (CF 1.3)
CF 1.3 3.33 3.32 3.07 3.59 3.52 3.59 3.33 3.63
Our candidates critically ana-lyze educational policies and/or practices that affect learners in metropolitan contexts. (CF 1.4)
CF 1.4 3.15 3.23 2.90 3.33 3.51 3.57 3.51 3.45
Our candidates know and re-spect individual differences, establish productive and ethi-cal relationships with candi-dates, and modify the learning environment to positively im-pact student learning. (CF 2.1)
CF 2.1 3.58 3.52 3.56 3.67 3.68 3.65 3.69 3.71
7
Conceptual Framework 14-15 Student Survey (4 point
Midpoint Results Endpoint Results
Objectives Objective Number
Midpoint Mean
(All Pro-grams)
Midpoint Mean (ECE)
Midpoint Mean (MSE)
Midpoint Mean (P-12)
End point Mean
(All Pro-
grams)
End point Mean (ECE)
End point Mean (MSE)
End Point Mean (P-12)
Our candidates create engaging learning communi-ties where the diverse perspec-tives, opinions, and beliefs of oth-ers are acknowl-edged and re-spected. (CF 2.2) CF 2.2 3.56 3.55 3.44 3.69 3.68 3.70 3.62 3.71
Our candidates commit to contin-uing personal and professional devel-opment.(CF 2.3) CF 2.3 3.48 3.42 3.45 3.56 3.63 3.61 3.54 3.73
Our candidates use knowledge of students cultures, experiences, and communities to create and sustain culturally respon-sive classrooms and schools. (CF 3.1) CF 3.1 3.46 3.45 3.45 3.48 3.64 3.74 3.51 3.68
Our candidates coordinate time, space, activities, technology and other resources to provide active and equitable engage-ment of diverse learners in real world experiences. (CF 3.2) CF 3.2 3.34 3.32 3.23 3.48 3.55 3.64 3.42 3.60
Our candidates implement appro-priate communica-tion techniques to provide for learner interaction within local and global communities. (CF 3.3) CF 3.3 3.19 3.13 3.14 3.30 3.46 3.52 3.31 3.56
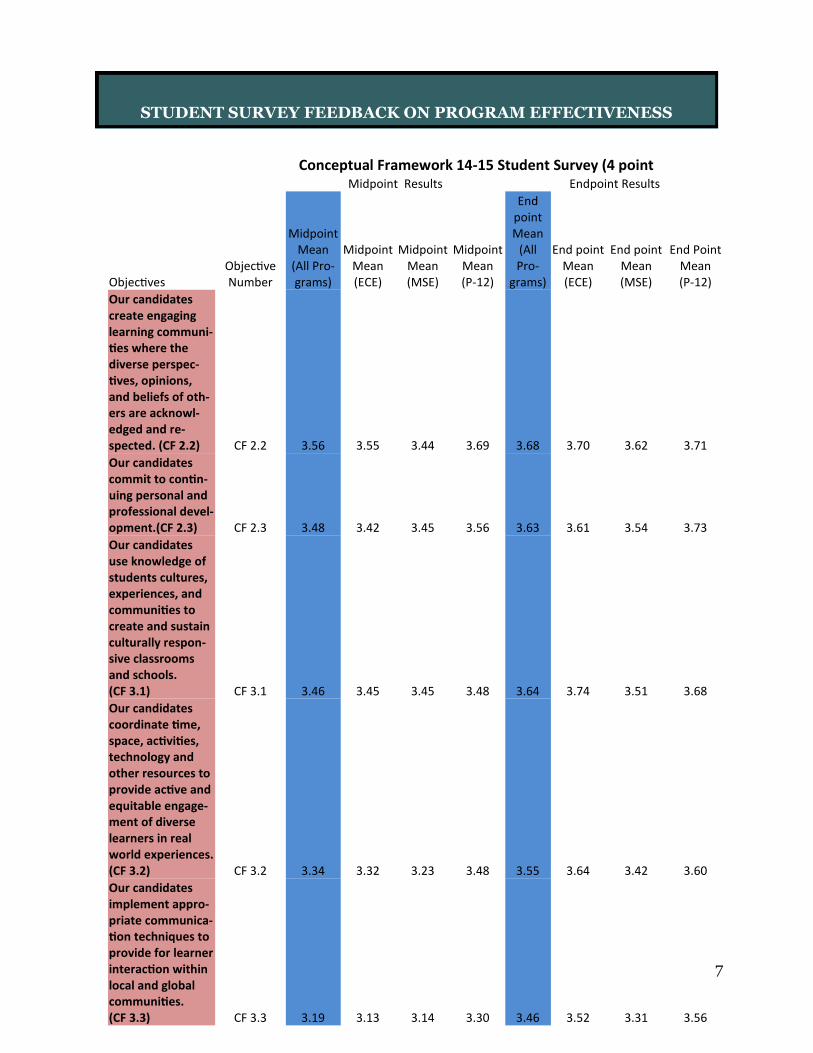
STUDENT SURVEY FEEDBACK ON PROGRAM EFFECTIVENESS

This survey is sent to all initial teacher preparation candidates at mid point (prior to stu-
dent teaching) and endpoint of their programs, and to advanced and endorsement candi-
dates at end point. There were 236 total responders to student surveys in 2014-2015. The
quantitative results from the student survey can be found on page 6 of this report. The stu-
dents rated the programs on a 4 point scale (not effective, somewhat effective, moderately
effective, and very effective). Of the 236 responses, 149 students provided written feedback
on the strengths of their programs, and 83 provided recommendations for improvement.
Consistent with the analysis of previous years’ data, the ratings overall were high, on a 4 point scale. The con-
ceptual framework outcome 1.4 and 3.3 were rated the lowest by our students, both at midpoint and end-
point in their programs. The unit means for 1.4 was 3.15 and for 3.3 was 3.19 at the midpoint. The end point,
the 1.4 and 3.3 unit means were 3.51 and 3.46 respectively. Also consistent with previous analysis was the
finding about the highest rated conceptual framework outcome which was 2.1, both at the midpoint and end-
point.
We conducted an analysis of students’ ratings separating them by their enrolment in undergraduate or grad-
uate programs, and found parallel results. Please refer to TAB 2 on the raw data file attached in the LiveText
committee folder (file name: Conceptual Framework_204-2015_student survey). Below are some recom-
mendation from students about 1.4 and 3.3:
* “More practical information, less theoretical. More professional development.”
* “I enjoy learning about the urban classroom, but a suburban perspective would be helpful as well.”
* “More diverse instructors. Classes should be more focused on school counseling and working with children and ado-
lescents rather than mental health counseling and working with adults.”
* “I think the only recommendation was to help us prepare better for dealing with parents. I didn't encounter any par-
ents on a discipline level, but I would have liked to have some practice with them.”
* “I wish there was more of an emphasis on creating the 21st century classroom with the use of digital media and in-
structional technology. This seems to be the ongoing trend in education. I also feel that the program should clarify
8
Our candidates critically analyze educational policies and/or practices that affect learners in metropolitan con-texts. (CF 1.4)
Our candidates implement appropriate communication techniques to provide for learner interaction within local and global communities. (CF 3.3)
Our mission is to prepare educators who are:
informed by research, knowledge and reflective practice;
empowered to serve as change agents;
committed to and respectful of all learners; and e
SUMMARY OF STUDENT FEEDBACK

For the highest rated conceptual framework outcome, 2.1, below are some of
the examples about the strengths of GSU programs:
* “Equity in the empowerment and training opportunities, especially to those individ-
uals from marginalized populations, which may include meeting the student where he
or she is at, providing additional exposure to new academic skill sets, and monitoring
their developments.”
* “Some courses do provide much time for students to interact. Especially in graduate
courses, I think some of the value of the program is in interacting with other
professionals who are serious about the field. This is lost when classes are mostly lec-
ture, and there is very little discussion.”
“Continuing using the hybrid approach at offering courses.”
“A range of professors teaching different material.”
Since we first started collecting data from students on the concep-
tual framework outcomes in 2010-2011, we have observed the same
findings as reported above for five consecutive years. Recently, we
examined the exit surveys for the MSE and ECE departments which
included questions on the evaluation of program quality but, in ad-
dition, also sought feedback on the implementation and support on
edTPA offered by the programs. Since the conceptual framework
does not get prominence in CAEP standards, and the student cur-
rent survey is not offering us new insights on program evaluation,
the survey was not sent out in Fall 2014.
9
Our candidates know and respect individual differences, establish productive and ethical
relationships with candidates, and modify the learning environment to positively impact stu-
dent learning. (CF 2.1)

GACE SCORES FOR 2014-2015
10
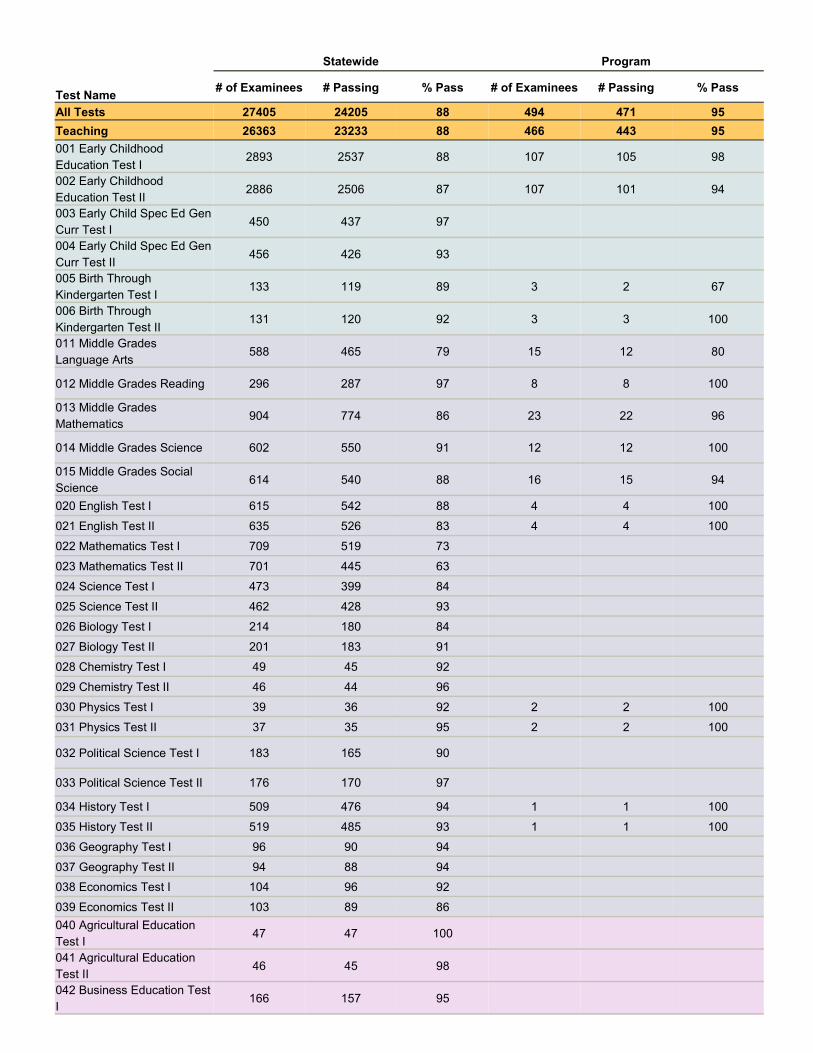
For GACE test-takers across all fields, GSU candidates had a 95% pass
rate (471/494). This was in comparison to an 88% state-wide pass rate.
For all teaching fields, GSU had a 95% pass rate (443/466). The state
pass rate was 88% for this group as well. Please see the attachment in
LiveText for detailed pass rated for individual fields in the respective
program report folders. Pages 11 and 12 provide GACE summary re-
port for all fields in comparison to the state pass rate.
Overall, across the different fields, candidates from GSU performed
well on the GACE test, with many fields having a 100% pass rate. The
lowest pass rate was 54% for Art Education, tests I and II. There 7 test-
takers in this field and 4 passed.
The pass rate for all of the service field GSU candidates was 100%.
Test Name
Statewide Program
# of Examinees # Passing % Pass # of Examinees # Passing % Pass
All Tests 27405 24205 88 494 471 95
Teaching 26363 23233 88 466 443 95
001 Early Childhood
Education Test I 2893 2537 88 107 105 98
002 Early Childhood
Education Test II 2886 2506 87 107 101 94
003 Early Child Spec Ed Gen
Curr Test I 450 437 97
004 Early Child Spec Ed Gen
Curr Test II 456 426 93
005 Birth Through
Kindergarten Test I 133 119 89 3 2 67
006 Birth Through
Kindergarten Test II 131 120 92 3 3 100
011 Middle Grades
Language Arts 588 465 79 15 12 80
012 Middle Grades Reading 296 287 97 8 8 100
013 Middle Grades
Mathematics 904 774 86 23 22 96
014 Middle Grades Science 602 550 91 12 12 100
015 Middle Grades Social
Science 614 540 88 16 15 94
020 English Test I 615 542 88 4 4 100
021 English Test II 635 526 83 4 4 100
022 Mathematics Test I 709 519 73
023 Mathematics Test II 701 445 63
024 Science Test I 473 399 84
025 Science Test II 462 428 93
026 Biology Test I 214 180 84
027 Biology Test II 201 183 91
028 Chemistry Test I 49 45 92
029 Chemistry Test II 46 44 96
030 Physics Test I 39 36 92 2 2 100
031 Physics Test II 37 35 95 2 2 100
032 Political Science Test I 183 165 90
033 Political Science Test II 176 170 97
034 History Test I 509 476 94 1 1 100
035 History Test II 519 485 93 1 1 100
036 Geography Test I 96 90 94
037 Geography Test II 94 88 94
038 Economics Test I 104 96 92
039 Economics Test II 103 89 86
040 Agricultural Education
Test I 47 47 100
041 Agricultural Education
Test II 46 45 98
042 Business Education Test
I 166 157 95

Test Name
Statewide Program
# of Exami-
nees # Passing % Pass
# of Exami-
nees # Passing % Pass
043 Business Education Test II 160 150 94
044 Fam and Consumer Science Ed Test I 52 43 83
045 Fam and Consumer Science Ed Test II 48 44 92
046 Marketing Education Test I 40 37 93
047 Marketing Education Test II 38 36 95
048 Technology Education Test I 99 98 99
049 Technology Education Test II 101 95 94
050 Behavioral Science Test I 27 24 89
051 Behavioral Science Test II 26 23 88
081 Special Ed Gen Curriculum Test I 1861 1697 91 37 37 100
082 Special Ed Gen Curriculum Test II 1839 1693 92 37 36 97
083 Spec Ed Adapted Curriculum Test I 543 543 100
084 Spec Ed Adapted Curriculum Test II 530 527 99
085 Special Ed Deaf Education Test I 28 25 89
086 Special Ed Deaf Education Test II 27 27 100
087 Spec Ed Reading English L A and
Social Studies 681 618 91
088 Special Education Math and Science 710 545 77
109 Art Education Test I 193 125 65 7 4 57
110 Art Education Test II 191 126 66 7 4 57
111 Music Test I 205 171 83 14 14 100
112 Music Test II 199 183 92 14 14 100
113 Health Education Test I 13 12 92
114 Health Education Test II 12 9 75
115 Health and Physical Ed Test I 526 479 91 12 11 92
116 Health and Physical Ed Test II 516 464 90 12 12 100
117 Reading Test I 111 111 100
118 Reading Test II 112 109 97
119 Eng to Speaker of Other Lang Test I 354 352 99 1 1 100
120 Eng to Speaker of Other Lang Test II 354 343 97 1 1 100
141 Spanish Test I (Reading/Writing) 232 190 82 7 6 86
142 Spanish Test II (Listening/Speaking) 226 174 77 7 7 100
143 French Test I (Reading/Writing) 48 42 88 1 1 100
144 French Test II (Listening/Speaking) 47 39 83 1 1 100
145 German Test I (Reading/Writing) 6 5 83
146 German Test II (Listening/Speaking) 6 5 83
147 Latin 11 8 73
150 American Sign Language Test I 7 7 100
151 Assessment of Sign Language Test II 7 3 43
Service 1042 972 93 28 28 100
101 Media Specialist Test I 151 139 92
102 Media Specialist Test II 149 133 89
103 School Counseling Test I 344 321 93 12 12 100
104 School Counseling Test II 346 327 95 12 12 100
105 School Psychology Test I 26 26 100 2 2 100
106 School Psychology Test II 26 26 100 2 2 100
301 Educational Leadership 614 496 81 9 9 100
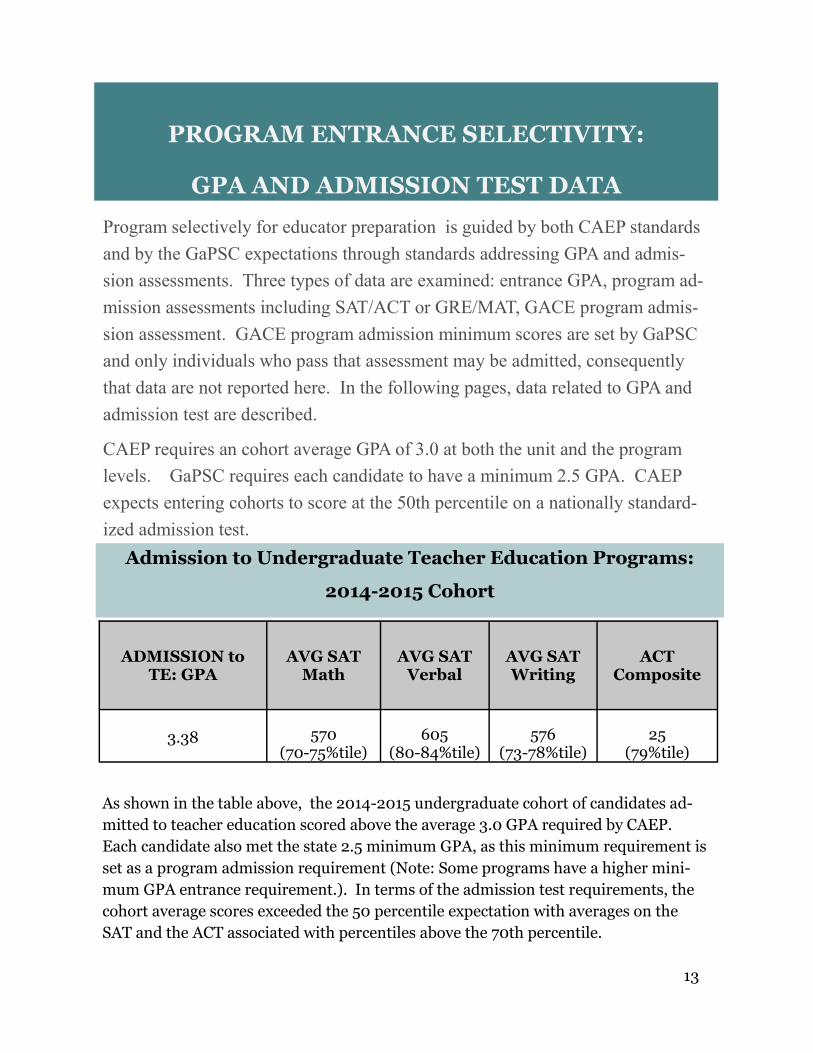
Program selectively for educator preparation is guided by both CAEP standards
and by the GaPSC expectations through standards addressing GPA and admis-
sion assessments. Three types of data are examined: entrance GPA, program ad-
mission assessments including SAT/ACT or GRE/MAT, GACE program admis-
sion assessment. GACE program admission minimum scores are set by GaPSC
and only individuals who pass that assessment may be admitted, consequently
that data are not reported here. In the following pages, data related to GPA and
admission test are described.
CAEP requires an cohort average GPA of 3.0 at both the unit and the program
levels. GaPSC requires each candidate to have a minimum 2.5 GPA. CAEP
expects entering cohorts to score at the 50th percentile on a nationally standard-
ized admission test.
PROGRAM ENTRANCE SELECTIVITY:
GPA AND ADMISSION TEST DATA
13
ADMISSION to TE: GPA
AVG SAT Math
AVG SAT Verbal
AVG SAT Writing
ACT Composite
3.38
570 (70-75%tile)
605 (80-84%tile)
576 (73-78%tile)
25 (79%tile)
Admission to Undergraduate Teacher Education Programs:
2014-2015 Cohort
As shown in the table above, the 2014-2015 undergraduate cohort of candidates ad-
mitted to teacher education scored above the average 3.0 GPA required by CAEP.
Each candidate also met the state 2.5 minimum GPA, as this minimum requirement is
set as a program admission requirement (Note: Some programs have a higher mini-
mum GPA entrance requirement.). In terms of the admission test requirements, the
cohort average scores exceeded the 50 percentile expectation with averages on the
SAT and the ACT associated with percentiles above the 70th percentile.

GPA AND AVERAGE SAT/ACT SCORES: BSE PROGRAMS
The table above shows that when data were separated out for the BSE programs,
the average high-school GPAs for admits of each of these program was well above the 3.0 CAEP recommendation. Additionally, for majority of these programs. The
SAT/ACT scores were above the 50th percentile. Entry to teacher education GPA was above 3.0 and SAT/ACT above 50th percentile for the COAS undergraduate
programs (see table below).
Program
# of Ad-mits
Ad-mission to TE GPA
AVG SAT Math
AVG SAT Verbal
AVG SAT Writing
ACT Compo-site
Foreign language 13 3.3
588 (70- 5%)
604 (80-84%)
563 (73-78%)
22 (62%)
Art Educa-tion 4 3.3
590 (70-5%)
655 (88-91%)
620 (86-89%)
29 (93%)
Music Education 13 3.27
536 (52-57%)
556 (64-70%)
545 (68-73%)
23 (68%)
Program
# of Ad-mits
AVG SAT Math
AVG SAT Verbal
AVG SAT Writing ACT Composite
BSE BRF 17 488
(40-45%) 513
(50-57%) 471
(41-48%) 20
(49%)
BSE ECE ESOL 55
525 (52-59%)
507 (50-57%)
532 (62-68%)
21 (56%)
BSE ECE SPEC ED 22
505 (45-52%)
513 (50-57%)
493 (48-55%)
21 (56%)
BSE HPE 4 440
(27-33%) 550
(64-70%) 560
(73-78%) 23
(68%)
BSE ML 26 543
(59-64%) 516
(50-57%) 481
(48-55%) 22
(62%)
ADMISSION TO TE GPA AND AVERAGE SAT/ACT SCORES
WITH PERCENTILES FOR UNDERGRAD PROGRAMS-COAS
2011-12 2012-13 2013-14 2014-15
Verbal Quant Verbal Quant Verbal Quant Verbal Quant
MAT 151
(50%)
146
(25%)
152
(54%)
148
(32%)
153
(59%)
149
(37%)
154
(63%)
150
(40%)
MED 149
(41%)
146
(25%)
149
(41%)
146
(25%)
151
(50%)
147
(28%)
151
(50%)
146
(25%)
Ed.S. 159
(81%)
147
(28%)
154
(63%)
146
(25%)
152
(54%)
148
(32%)
155
(67%)
151
(45%)
Ed.D. 152
(54%)
148
(32%)
149
(41%)
141
(10%)
155
(67%)
148
(32%)
153
(59%)
144
(18%)
AVER-
AGE
TO-
TAL
153
(59%)
147
(28%)
151
(50%)
145
(21%)
153
(59%)
148
(32%)
153
(59%)
148
(32%)
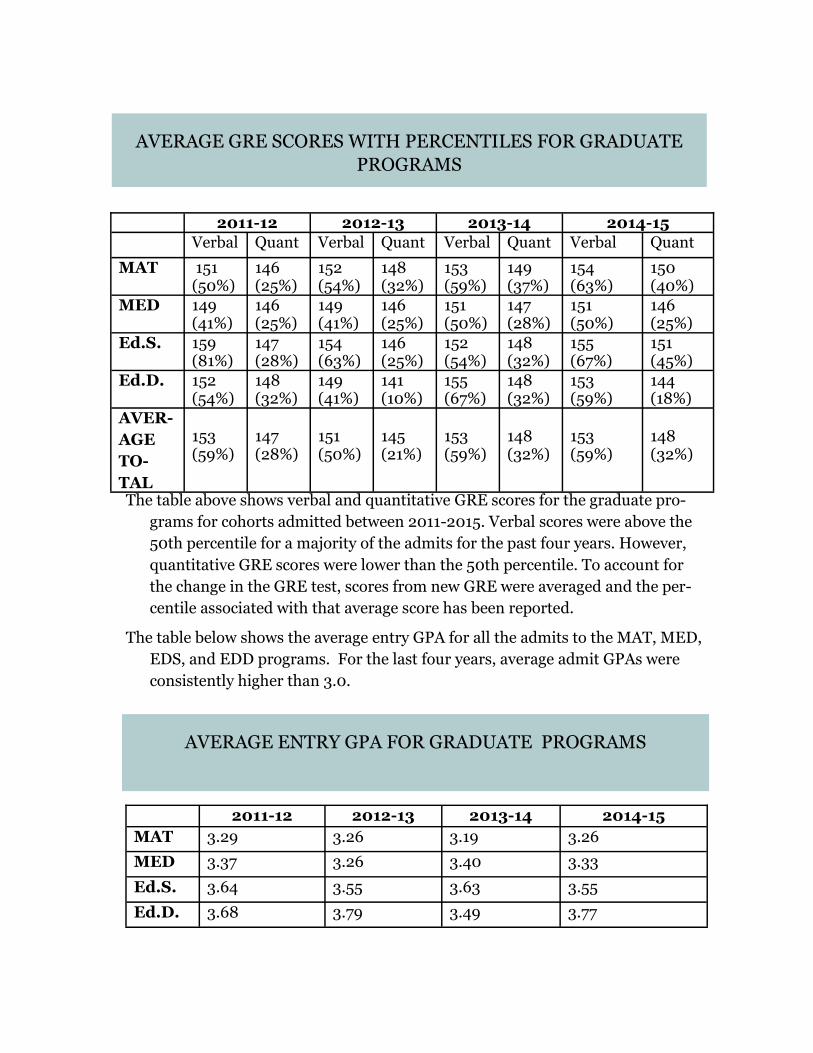
AVERAGE GRE SCORES WITH PERCENTILES FOR GRADUATE
PROGRAMS
The table above shows verbal and quantitative GRE scores for the graduate pro-
grams for cohorts admitted between 2011-2015. Verbal scores were above the
50th percentile for a majority of the admits for the past four years. However,
quantitative GRE scores were lower than the 50th percentile. To account for
the change in the GRE test, scores from new GRE were averaged and the per-
centile associated with that average score has been reported.
The table below shows the average entry GPA for all the admits to the MAT, MED,
EDS, and EDD programs. For the last four years, average admit GPAs were
consistently higher than 3.0.
2011-12 2012-13 2013-14 2014-15
MAT 3.29 3.26 3.19 3.26
MED 3.37 3.26 3.40 3.33
Ed.S. 3.64 3.55 3.63 3.55
Ed.D. 3.68 3.79 3.49 3.77
AVERAGE ENTRY GPA FOR GRADUATE PROGRAMS

16
7. Positive Learning Environment: The teacher provides a well-managed, safe, and orderly envi-
ronment that is conducive to learning and encourages respect for all....
GA-GSU-COE-CF-2.2, GA-GSU-COE-CF-3.1, INTASC-2011-3
3 (2%) 57 (55%) 40 (39%) 2 (1%)
7.3- Dispositions: Models caring, fairness, respect, and enthusiasm for learning...
8 (7%) 51 (50%) 39 (38%) 3 (2%)
7.4- Dispositions: Promotes a climate of trust and teamwork within the classroom....
6 (5%) 46 (45%) 47 (46%) 3 (2%)
7.5 Dispositions: Promotes respect for and understanding of students diversity, including but not
limited to race, color, religion, sex, national origin, or disability....
6 (5%) 51 (50%) 43 (42%)
2 (1%)
7.6 Dispositions: Actively listens and pays attention to student’s needs and responses....
6 (5%) 44 (43%) 50 (49%)
2 (1%)
7.7 Dispositions: Creates a warm, attractive, inviting, and supportive classroom environment....
9. Professionalism: The teacher exhibits a commitment to professional ethics and the schools
mission, participates in professional growth opportunities to support student learning, and
contributes to the profession.... GA-GSU-COE-CF-1.4, GA-GSU-COE-CF-2.3, INTASC-2011-9
7 (6%) 36 (35%) 57 (55%)
2 (1%)
9.8 Dispositions: Candidate maintains appropriate interactions with students, parents, faculty,
and staff....
3 (2%) 46 (45%) 51 (50%) 2 (1%)
9.9 Dispositions: Engages in self-reflection about the success of the lesson after teaching; seeks
feedback from teacher about teaching and impact on student learning....
5 (4%) 40 (39%) 55 (53%) 2 (1%)
KEY: 4 3 2 1
Dispositions 2014-2015
Midpoint Summary Table (n= 98)
5 (4%) 54 (52%) 41 (40%) 2 (1%)

7. Positive Learning Environment: The teacher provides a well-managed, safe, and orderly en-
vironment that is conducive to learning and encourages respect for all....
GA-GSU-COE-CF-2.2, GA-GSU-COE-CF-3.1, INTASC-2011-3
54 (18%) 220 (74%) 23 (8%)
7.3- Dispositions: Models caring, fairness, respect, and enthusiasm for learning...
62 (21%) 222 (75%) 10 (3%) 1 (0%)
7.4- Dispositions: Promotes a climate of trust and teamwork within the classroom....
59 (20%) 218 (74%) 14 (4%) 1(0%)
7.5 Dispositions: Promotes respect for and understanding of students diversity, including but
not limited to race, color, religion, sex, national origin, or disability....
7.6 Dispositions: Actively listens and pays attention to student’s needs and responses....
53 (18%) 222 (75%) 18 (7%)
7.7 Dispositions: Creates a warm, attractive, inviting, and supportive classroom environment....
56 (19%) 225 (76%) 12 (4%)
1 (0%)
9. Professionalism: The teacher exhibits a commitment to professional ethics and the schools mis-
sion, participates in professional growth opportunities to support student learning, and contributes
to the profession.... GA-GSU-COE-CF-1.4, GA-GSU-COE-CF-2.3, INTASC-2011-9
9.8 Dispositions: Candidate maintains appropriate interactions with students, parents, faculty, and
staff....
9.9 Dispositions: Engages in self-reflection about the success of the lesson after teaching; seeks
feedback from teacher about teaching and impact on student learning....
56 (19%) 228 (77%) 10 (3%)
Dispositions 2014-2015
Endpoint Summary Table (n= 297)
17
57 (19%) 231 (78%) 5
1% 1
(0%
58 (19%) 225 (76%) 11 (3%)
1 (0%)
56 (18%) 229 (77%) 9 (3%)
1 (0%)

18
FINDINGS: DISPOSITIONS
The PEF began assessing overall dispositions for initial, candidates using standard 7
(Positive Learning Environment: The teacher provides a well-managed, safe, and orderly envi-
ronment that is conducive to learning and encourages respect for all) and Standard 9
(Professionalism: The teacher exhibits a commitment to professional ethics and the school’s
mission, participates in professional growth opportunities to support student learning, and
contributes to the profession) as the two benchmarks of dispositional attributes. Within stand-
ards 7 and 9, sub-standards 7.3, 7.4, 7.5, 7.6, 7.7, 9.8, and 9.9 were used for assessing disposi-
tions. Standard 9.1 was used for ethics assessment.
The 2014-2015 Summary Tables for Dispositions found on the pages 16 and 17, outline the
overall results for all candidates at mid and end points of their programs. Below we highlight
key points from this year’s analysis:
The mean scores for each dimension rose from midpoint to endpoint.
At midpoint, 40% students on standard 7 and 50% on standard 9 at midpoint were rated at
LEVEL 2, indicating inconsistent understanding and demonstration of the standard.
At endpoint, 90% or more candidates were rated at least a level 3 on both these standards,
showing proficiency expected of a beginner level teacher.

19
In the fall of 2015, we conducted a comparison local and national scores on 155 portfolios for the candidates
from the year 2014-2015. This was the implementation year in the state of Georgia, when teacher preparation
institutions were expected to get ready for consequential use of edTPA in their programs. Using state provided
vouchers, a number of edTPA portfolios that were sent to Pearson in Spring 2015. Scores were compared for all
rubrics to see how many candidates scored at the Emergent (LEVEL 1 and 2 on the 5 point rubric), Proficient
(Level 3), or Advanced (LEVELS 4 and 5). For every single rubric, the national scores were lower than the local
scores (please see attachment in the LiveText folder for rubric-wise comparison). The differences in local and
external evaluation were most prominent for rubrics 13, 14, and 15. These are also the rubrics where nationally,
candidates tend to score the lowest.
Rubric 13 - Student Use of Feedback
Emergent Proficient Advanced
Local Evaluation Data for all programs using 3-point rubrics (Emergent, Profi-cient, Advanced) to evaluate portfolios
38/154 25%
75/154 49%
41/154 27%
External Scores Summary (5-pt. rubric scores collapsed into 3 levels)
117/165 71%
40/165 24%
8/165 5%
Rubric 14 - Analyzing Students’ Language Use and Learning/Use of Communi-cation
Emergent Proficient Advanced
Local Evaluation Data for all programs using 3-point rubrics (Emergent, Profi-cient, Advanced) to evaluate portfolios
23/155 15%
95/155 61%
37/155 24%
External Scores Summary (5-pt. rubric scores collapsed into 3 levels)
96/153 63%
55/153 36%
2/153 1%
Rubric 15 - Using Assessments to Inform Instruction
Emergent Proficient Advanced
Local Evaluation Data for all programs using 3-point rubrics (Emergent, Profi-cient, Advanced) to evaluate portfolios
16/155 10%
91/155 59%
48/155 31%
External Scores Summary (5-pt. rubric scores collapsed into 3 levels)
86/165 52%
64/165 39%
15/165 9%
COMPARISON OF LOCAL AND NATIONAL
EVALUATION SCORES ON EDTPA PORTFOLIOS

20
FINDINGS: EDTPA SCORES—FALL
2015
A total of 60 candidates submitted their edTPA portfolios in the Fall of 2015,
which was the first semester when scores became consequential for certification
in Georgia. Overall, 54 of our candidates, across content handbooks, passed
without incompletes, making our pass rate 90%. Out of the total 60, 4 of our
candidates got an incomplete. Please see the Fall 2015 edTPA attachment in the
LiveText folder for details of individual scores across the different handbooks.
The pass score cut-off for all handbooks will go up in 2017. and the changed
scores will be as follows:
Elementary Education: current cut-off score– 42, 2017 cut-off score—45
World Languages current cut-off score– 29, 2017 cut-off score—32
All other handbooks: current cut-off score– 35, 2017 cut-off score—38
If we were at the increased cut-off scores set for 2017, one more student out of
the 60 who sent their portfolios to Pearson in Fall 2015 would have failed.

21
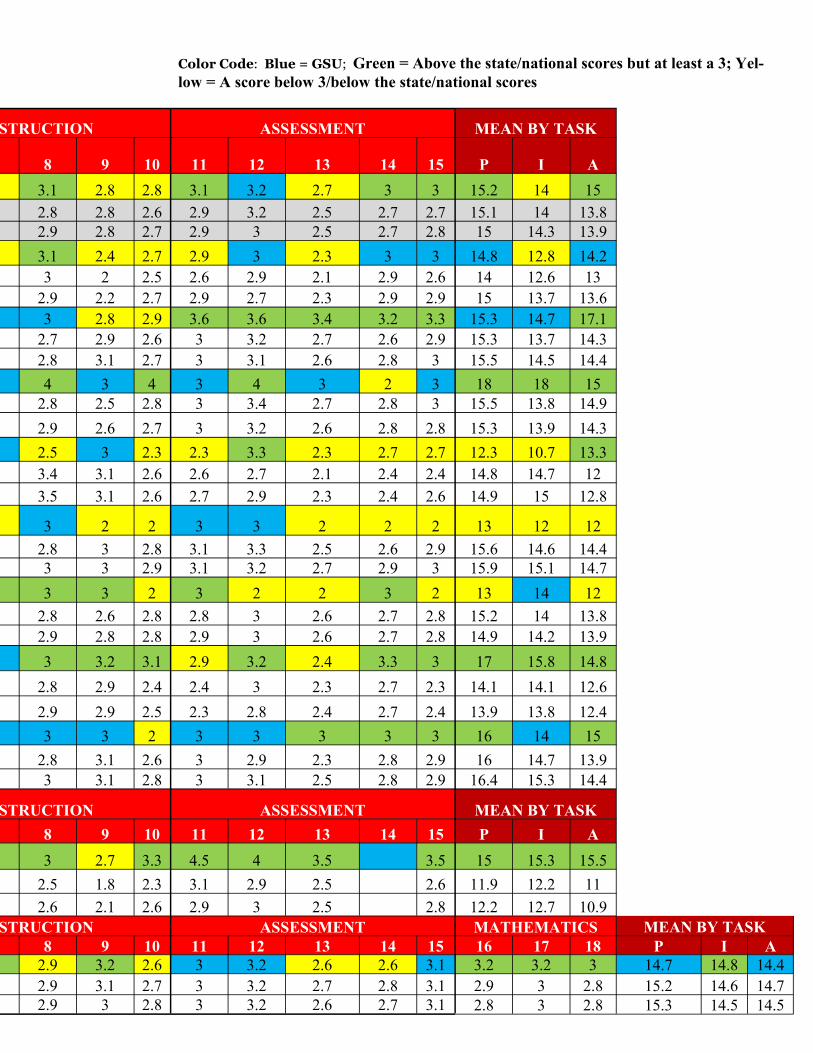
COMPARISONS OF GSU EDTPA SCORES—JULY-
DECEMBER 2015 ACROSS HANDBOOKS WITH STATE
AND NATIONAL SCORES
We compared the GSU candidates’ scores on the different edTPA handbooks with
the state and national averages. The table on page 22 and 23 provides a detailed ru-
bric-by-rubric comparison on these scores across handbooks. Some of the main find-
ings were as follows:
1. For the 15 rubric handbooks, 30 students from GSU submitted their portfolios to
Pearson. Their average score was 44.2, which was higher than the state average
(42.5) and the national average (42.8). For the following handbooks, the GSU
average was above the state and national averages: ECE, K-12 performing arts,
middle childhood science, special education, and visual arts. For the handbooks
physical education, secondary ELA, and secondary history/social studies, the
GSU averages were lower than the state and national averages. In these hand-
books the number of students submitting their edTPA portfolios to Pearson were
very few (3, 1, and 1 respectively).
2. For the 13 rubric, world languages handbook, the GSU scores were higher than
the state and national average.
3. For the 18 rubric Elementary handbook, the GSU scores were above the national
average but slightly lower than the state average.
4. Overall, for the 15 rubric edTPA handbooks, rubrics 5, 7, 9. 10 , and 13 were the
ones with averages below a score of 3 (on a maximum possible score of 5). Alt-
hough, GSU students’ scores were similar higher to state or national averages for
these rubrics, it might call for a closer look at the prompts and expectations for
these particular rubrics.
5. For the 15 rubric handbooks, the overall means for the task-level comparisons
showed that it was within the task of instruction that GSU students scored low-
er than the national average (but similar to the state average). On the assessment
task, which is deemed most challenging for pre-service teachers, the GSU averag-
es were well above the state and national averages.

JULY - DECEMBER 2015 PLANNING INSTRUCTION
EDTPA HANDBOOKS N Mean 1 2 3 4 5 6 7
15 Rubric Handbooks - GSU 30 44.2 3.1 3 3 3.1 2.9 3.2 2.9
15 Rubric Handbooks - STATE 555 42.5 3.1 3 3 3 3 3.1 2.9
15 Rubric Handbooks - NATIONAL 9481 42.8 3.1 3 3 3 2.9 3.1 3
Early Childhood—GSU 8 41.9 2.9 3.2 2.9 3.1 2.8 3.2 2.9
STATE 14 38.7 2.8 3 2.7 2.9 2.7 3 2.8
NATIONAL 1132 41.8 3.1 3.1 3 3 2.9 3.1 3
K-12 Performing Arts—GSU 9 47.1 47.1 3.1 3.1 3.1 3 3 3
STATE 64 43.3 3.1 3 3.1 3.1 3 2.9 2.7
NATIONAL 581 44.1 3.2 3.1 3.1 3 3.1 3.1 2.9
Middle Childhood Science _ GSU 1 51 4 3 4 4 3 4 3
STATE 43 44.2 3.1 3.1 3.2 3.1 3 3.3 3
NATIONAL 3 3 3.1 3 3.1 3.2 3 3.2 3
Physical Education—GSU 3 36.3 2.7 2.3 2.3 2.3 2.7 3 3
STATE 32 41.5 3.1 3 2.8 2.8 3 3.1 3
NATIONAL 435 42.1 3.2 3.1 2.9 2.8 2.9 3.2 3
Secondary English LA—GSU 1 37 3 2 3 2 3 3 2
STATE 53 44.6 3.3 3.1 3.2 3 3.1 3 2.9
NATIONAL 708 45.6 3.3 3.1 3.2 3.1 3.2 3.2 3.1
Secondary History/SS—GSU 1 39 3 2 2 3 3 3 3
STATE 51 43 3 3.1 3 3 3.1 3 2.8
NATIONAL 721 42.6 3.1 3 3 2.9 3 3 2.9
Special Education GSU 6 47.7 3.5 3.4 3.5 3.8 2.8 3.5 3
STATE 89 39.9 2.8 2.9 2.9 3 2.6 3.2 3
NATIONAL 1381 39.6 2.8 2.8 2.8 2.9 2.6 3.2 2.9
Visual Arts—GSU 1 45 4 3 3 3 3 3 3
STATE 19 44.6 3.7 2.9 3 3.3 3.1 3.3 3
NATIONAL 255 46.1 3.6 3.2 3.2 3.1 3.4 3.2 3.1
EDTPA HANDBOOKS PLANNING INSTRUCTION
World Languages N Mean 1 2 3 4 5 6 7
13 Rubric Handbooks - GSU 3 40.7 3.7 4 4 3.3 3.3 3
13 Rubric Handbooks - STATE 24 32.8 3 2.9 3.1 2.8 3 2.7
13 Rubric Handbooks - NATIONAL 243 34.7 3.1 3 3.1 3 3.1 2.7
EDTPA HANDBOOKS PLANNING INSTRUCTION
Elementary Education N Mean 1 2 3 4 5 6 7
18 Rubric Handbooks - GSU 38 52.2 3 2.9 2.9 3 3 3.1 3.1
18 Rubric Handbooks - STATE 621 52.8 3 3.1 3.1 3.1 3 3.1 3
18 Rubric Handbooks - NATIONAL 1921 51.8 3 3.1 3.1 3.1 3 3.1 3
INSTRUCTION ASSESSMENT MEAN BY TASK
7 8 9 10 11 12 13 14 15 P I A
2.9 3.1 2.8 2.8 3.1 3.2 2.7 3 3 15.2 14 15
2.9 2.8 2.8 2.6 2.9 3.2 2.5 2.7 2.7 15.1 14 13.8
3 2.9 2.8 2.7 2.9 3 2.5 2.7 2.8 15 14.3 13.9
2.9 3.1 2.4 2.7 2.9 3 2.3 3 3 14.8 12.8 14.2
2.8 3 2 2.5 2.6 2.9 2.1 2.9 2.6 14 12.6 13
3 2.9 2.2 2.7 2.9 2.7 2.3 2.9 2.9 15 13.7 13.6
3 3 2.8 2.9 3.6 3.6 3.4 3.2 3.3 15.3 14.7 17.1
2.7 2.7 2.9 2.6 3 3.2 2.7 2.6 2.9 15.3 13.7 14.3
2.9 2.8 3.1 2.7 3 3.1 2.6 2.8 3 15.5 14.5 14.4
3 4 3 4 3 4 3 2 3 18 18 15
3 2.8 2.5 2.8 3 3.4 2.7 2.8 3 15.5 13.8 14.9
3 2.9 2.6 2.7 3 3.2 2.6 2.8 2.8 15.3 13.9 14.3
3 2.5 3 2.3 2.3 3.3 2.3 2.7 2.7 12.3 10.7 13.3
3 3.4 3.1 2.6 2.6 2.7 2.1 2.4 2.4 14.8 14.7 12
3 3.5 3.1 2.6 2.7 2.9 2.3 2.4 2.6 14.9 15 12.8
2 3 2 2 3 3 2 2 2 13 12 12
2.9 2.8 3 2.8 3.1 3.3 2.5 2.6 2.9 15.6 14.6 14.4
3.1 3 3 2.9 3.1 3.2 2.7 2.9 3 15.9 15.1 14.7
3 3 3 2 3 2 2 3 2 13 14 12
2.8 2.8 2.6 2.8 2.8 3 2.6 2.7 2.8 15.2 14 13.8
2.9 2.9 2.8 2.8 2.9 3 2.6 2.7 2.8 14.9 14.2 13.9
3 3 3.2 3.1 2.9 3.2 2.4 3.3 3 17 15.8 14.8
3 2.8 2.9 2.4 2.4 3 2.3 2.7 2.3 14.1 14.1 12.6
2.9 2.9 2.9 2.5 2.3 2.8 2.4 2.7 2.4 13.9 13.8 12.4
3 3 3 2 3 3 3 3 3 16 14 15
3 2.8 3.1 2.6 3 2.9 2.3 2.8 2.9 16 14.7 13.9
3.1 3 3.1 2.8 3 3.1 2.5 2.8 2.9 16.4 15.3 14.4
INSTRUCTION ASSESSMENT MEAN BY TASK
7 8 9 10 11 12 13 14 15 P I A
3 3 2.7 3.3 4.5 4 3.5 3.5 15 15.3 15.5
2.7 2.5 1.8 2.3 3.1 2.9 2.5 2.6 11.9 12.2 11
2.7 2.6 2.1 2.6 2.9 3 2.5 2.8 12.2 12.7 10.9
INSTRUCTION ASSESSMENT MATHEMATICS MEAN BY TASK
7 8 9 10 11 12 13 14 15 16 17 18 P I A
3.1 2.9 3.2 2.6 3 3.2 2.6 2.6 3.1 3.2 3.2 3 14.7 14.8 14.4
3 2.9 3.1 2.7 3 3.2 2.7 2.8 3.1 2.9 3 2.8 15.2 14.6 14.7
3 2.9 3 2.8 3 3.2 2.6 2.7 3.1 2.8 3 2.8 15.3 14.5 14.5
Color Code: Blue = GSU; Green = Above the state/national scores but at least a 3; Yel-
low = A score below 3/below the state/national scores

GSU TEACHER PREPARATION DASHBOARD
* 2015 –16 Workforce data will be available
in Fall 2016
Note. The numbers in this table reflect the
Board of Regents Completer data.
Year of Completion Number of Counties Hiring
GSU New Teachers
Top 5 Counties Employing GSU New Teachers
2015 2015 Workforce data will be available in Fall 2016
2014 25 DeKalb, Gwinnett, Fulton, APS, Cobb/Clayton
2013 24 DeKalb, Fulton, Gwinnett, APS, Cobb
2012 34 Fulton, Gwinnett, Atlanta, DeKalb, Cobb
2011 33 Fulton, DeKalb, APS, Gwinnett, Cobb/Clayton
2010 30 DeKalb, Fulton, Gwinnett, Cobb, APS
GSU Pass Rates – Title II Summary Reports
2014-15 2013-14 2012-13 2011-12 2011-10 2010-09
97% 96% 96 % 97% 99%
GSU Completers of Initial Preparation Programs
2014-15 2013-14 2012-13 2011-12 2010-11
445 471 566 608 486
Yield and Retention Rates for Completers from 2010-2014
Cohort Total Yield Rate Retention Rates
One year Two years
2014 445 309 (69.4%) NA NA
2013 471 269 (57.1%) 237 (88.1%) NA
2012 566 294 (51.9%) 264 (89.8%) 246 (84%)
2011 608 345 (56.7%) 312 (90.4%) 283 (82%)
2010 486 290 (59.7%) 263 (90.7%) 249 (86%)
24
* The Title II pass rate can change depending on when
completers take the GACE. Initial results for 2014-2015
GACE scores will be available in Spring 2016.