peer-reviewed review article bioresources · peer-reviewed review article ... tem can essentially...
TRANSCRIPT

PEER-REVIEWED REVIEW ARTICLE bioresources.com
Reza et al. (2015). “TEM wood fiber analysis review,” BioResources 10(3), 6230-6261. 6230
Transmission Electron Microscopy for Wood and Fiber Analysis − A Review
Mehedi Reza,a,* Eero Kontturi,b Anna-Stiina Jääskeläinen,b,c Tapani Vuorinen,b and
Janne Ruokolainen a,*
This review describes use of transmission electron microscopy (TEM) in wood and fiber analysis. Analytical techniques and sample preparation methods are used to localize substructures of the cell wall polymers and are discussed in this review. The ultrastructural features of the wood cell walls, the structures formed by microfibrils, and the distribution of cell wall polymers, as revealed by TEM, are covered. Research investigating the distribution of lignin in tension and compression woods using TEM is reviewed. Different kinds of wood biodegrading enzymes localized using TEM are mentioned. Additional features of TEM, i.e., 3D imaging, analytical TEM, and electron diffraction are discussed. Lastly, a comparison between TEM and other imaging techniques used for wood and fiber research are made. Thus, this review provides insight into the contribution of TEM in wood research since its invention and demonstrates how to use it more effectively in the future.
Keywords: Cellulose microfibril; Lignin distribution; Reaction wood; TEM; Wood biodegradation;
Wood cell wall
Contact information: a: Department of Applied Physics, Aalto University, P.O. Box 11100, FI-00076 Aalto,
Finland; b: Department of Forest Products Technology, Aalto University, P.O. Box 16300, FI-00076 Aalto,
Finland; c: VTT Technical Research Centre of Finland, Tietotie 2, P.O. Box 1000, Espoo, Finland;
* Corresponding authors: [email protected]; [email protected]
INTRODUCTION
Microscopy is the study of fine structures and morphologies using the wide range
of microscopy techniques available, which can resolve the details of an object ranging
from the millimeter to the sub-nanometer scale. Electron microscopy and its
supplementary techniques have been used extensively in most scientific fields. In
addition, microscopy has been and is currently being used successfully in wood research
to observe wood cells and their sub-cellular components. The invention of the light
microscope led to the discovery and description of cells, and it remains influential in
wood research. Several sophisticated microscopy and spectroscopy techniques are
available, providing high-resolution information about wood cells at the molecular level;
e.g., Transmission Electron Microscopy (TEM), Scanning Electron Microscopy (SEM),
Atomic Force Microscopy (AFM), X-ray methods, and Raman microspectroscopy are
routinely used for wood research (Abe et al. 1991; Zimmermann and Sell 2003; Fahlén
and Salmén 2005; Peura et al. 2008; Gierlinger et al. 2010; Raghavan et al. 2012; Reza et
al. 2014b). Bucur (2003) reviewed existing imaging methods for investigating wood
structure; however, most of the techniques exhibited low resolution. Nevertheless,
transmission electron microscopy, a technique that has been around for approximately 80
years, has one of the highest resolutions (about 0.2 nm for analyzing wood fiber) among
PEER-REVIEWED REVIEW ARTICLE bioresources.com
Reza et al. (2015). “TEM wood fiber analysis review,” BioResources 10(3), 6230-6261. 6231
the techniques used in wood and fiber research (Ruska 1934; Duchesne and Daniel 1999).
For wood materials, the characteristic dimension of ultrastructural features, which
influence the effective material properties, is in the range of few nanometers. Moreover,
the formation of three main components (cellulose, hemicelluloses and lignin) and their
deposition in the wood cell is still fragmentarily known. Therefore, TEM, a package of
2D imaging, 3D tomography, and elemental analysis with high-resolution, can certainly
be used more effectively to understand the sub-cellular structures of wood cells. TEM has
already provided invaluable information on ultrastructure of wood cell wall following its
development. Meanwhile, TEMs with spherical aberration (Cs) correctors are able to
perform imaging with sub-Å resolution (Jiang et al. 2012); the performance of such TEM
in wood research is, however, limited by the beam sensitivity of the specimens. Cryo-
TEMs, a version of TEM, are able to perform imaging of beam-sensitive, low-contrast
specimens at liquid N2 or liquid He temperatures. However, sample preparation and
stability under the electron beam have always been challenging steps to overcome for
high-resolution imaging of wood specimens at the molecular level. In this review, we
have assessed the majority of the information available for TEM analysis of wood
materials necessary to overcome complications during analysis. Core areas of evaluation
will pertain to the sample preparation, the ultrastructural features of the wood cell wall,
and the distribution of cell wall polymers as revealed by TEM. The analytical potential of
TEM can essentially be amplified using complementary instruments, and thus these will
also be briefly reviewed.
Image Formation in TEM The basic principles for image formation using TEM are described in Williams
and Carter (2009). Briefly, TEM uses an electron beam to image the sample. This
provides a higher resolving power than the visible light in optical microscopy. Because
the wavelength of the energized electron beam is very short, the diffraction limit is
correspondingly lower. Generally, in electron microscopy, high energy primary electrons
hit the specimen and the same or different electrons deflect from the sample to form an
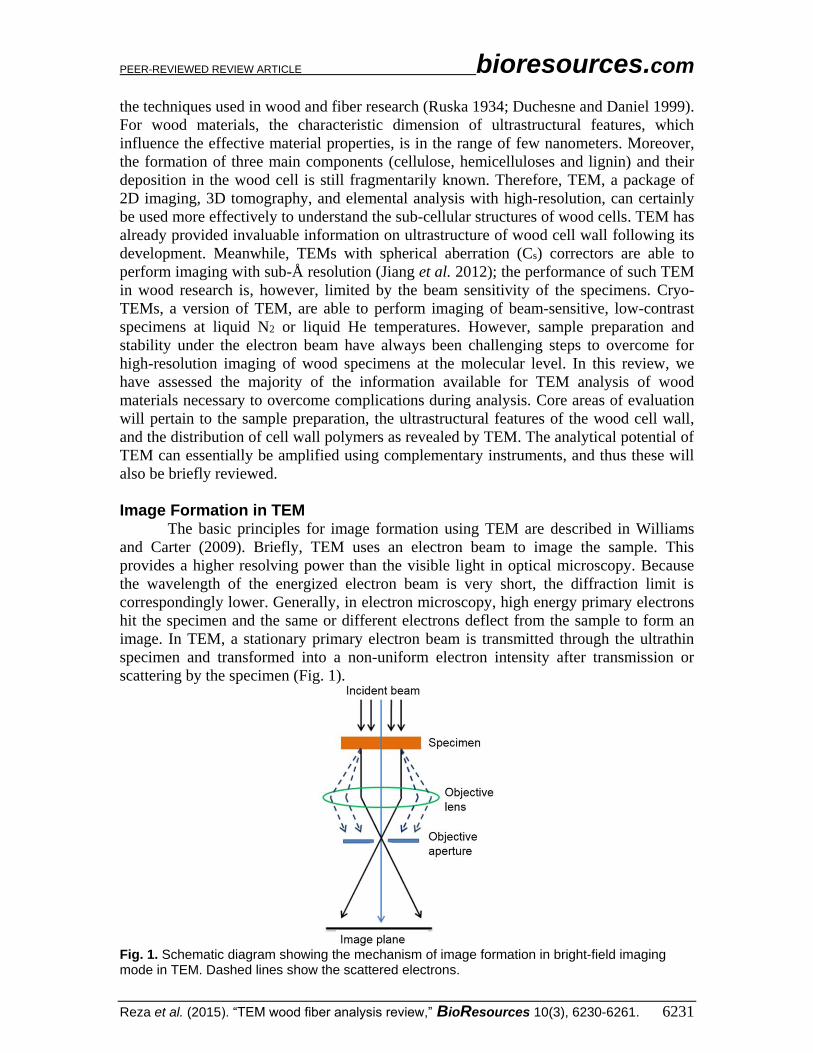
image. In TEM, a stationary primary electron beam is transmitted through the ultrathin
specimen and transformed into a non-uniform electron intensity after transmission or
scattering by the specimen (Fig. 1).
Fig. 1. Schematic diagram showing the mechanism of image formation in bright-field imaging mode in TEM. Dashed lines show the scattered electrons.
PEER-REVIEWED REVIEW ARTICLE bioresources.com
Reza et al. (2015). “TEM wood fiber analysis review,” BioResources 10(3), 6230-6261. 6232
This non-uniform electron intensity hits the fluorescent screen or the electron
detector and is translated into image contrast on the screen. Either the direct beam or a
diffracted beam is used to form bright-field and dark-field images, respectively. Figure 1
illustrates the mechanism of image formation in the bright-field imaging mode using
direct beam. In the bright-field mode, scattered electrons are blocked with an objective
aperture in order to enhance the contrast. In addition, while interacting with the specimen,
a wide range of secondary signals are produced. Many of them are used in analytical
electron microscopy, providing the chemical composition and additional information
about the specimens. A TEM analysis must be run under an ultra-high vacuum that
prevents scattering of the electron beam by the gas molecules so that the electrons can
move freely from the gun through the specimen and further to the detector.
Because of the extraneous materials, low crystallinity, and tight association of cell
wall materials it has always been challenging to image the structure and morphology of
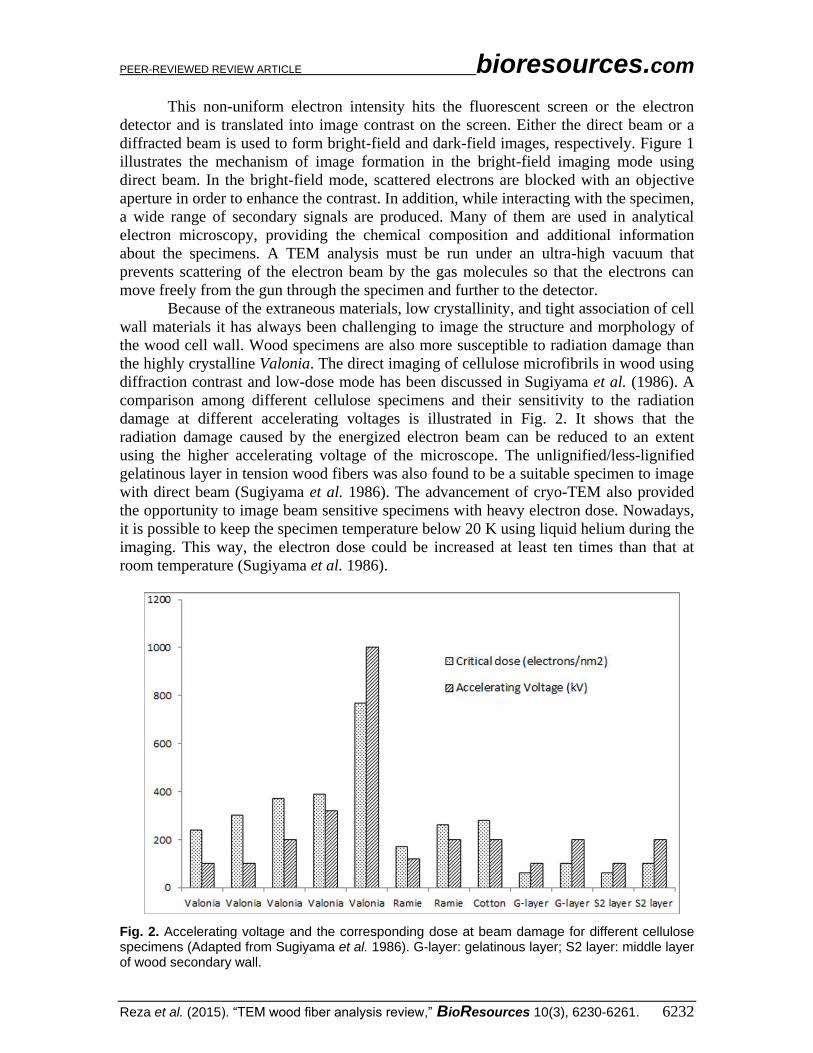
the wood cell wall. Wood specimens are also more susceptible to radiation damage than
the highly crystalline Valonia. The direct imaging of cellulose microfibrils in wood using
diffraction contrast and low-dose mode has been discussed in Sugiyama et al. (1986). A
comparison among different cellulose specimens and their sensitivity to the radiation
damage at different accelerating voltages is illustrated in Fig. 2. It shows that the
radiation damage caused by the energized electron beam can be reduced to an extent
using the higher accelerating voltage of the microscope. The unlignified/less-lignified
gelatinous layer in tension wood fibers was also found to be a suitable specimen to image
with direct beam (Sugiyama et al. 1986). The advancement of cryo-TEM also provided
the opportunity to image beam sensitive specimens with heavy electron dose. Nowadays,
it is possible to keep the specimen temperature below 20 K using liquid helium during the
imaging. This way, the electron dose could be increased at least ten times than that at
room temperature (Sugiyama et al. 1986).
Fig. 2. Accelerating voltage and the corresponding dose at beam damage for different cellulose specimens (Adapted from Sugiyama et al. 1986). G-layer: gelatinous layer; S2 layer: middle layer of wood secondary wall.
PEER-REVIEWED REVIEW ARTICLE bioresources.com
Reza et al. (2015). “TEM wood fiber analysis review,” BioResources 10(3), 6230-6261. 6233
SAMPLE PREPARATION FOR TEM ANALYSIS
Sample preparation is a very important step because TEM requires ultrathin
specimens. Samples for TEM analysis need to be fit on a specimen support known as a
grid. TEM grids are metal mesh screens and are about 3 mm in diameter. The size and
shape of the mesh vary. They are mainly made of copper, but gold, nickel, and beryllium
grids are also used in special circumstances. A fuller discussion on sample preparation
protocols for studying cellular ultrastructure of plant tissues with TEM is found in Kuo
(2007). In this chapter, essential steps of sample preparation such as replication,
sectioning, and staining are discussed.
Replication The replica technique, an indirect way of looking at specimens, is one of the
oldest techniques used in TEM sample preparation. Replicas that have the surface
topography of the original specimen can be imaged without exposing beam-sensitive
specimens to the electron. This technique was routinely used to study fiber morphology
using TEM, especially at the early stage of its invention (Harada 1965). Different types of
replication techniques of wood and fiber specimens have been discussed by Côté et al.
(1964). Briefly, the technique involves the evaporation of a metal or carbon film on the
surface of interest, followed by the dissolution of the fiber specimen with an acid (e.g.,
chromic acid), so that the film is removed. Enhanced contrast can be produced by coating
this film with a heavy metal at an oblique angle (20° to 45°). Finally, replicas are
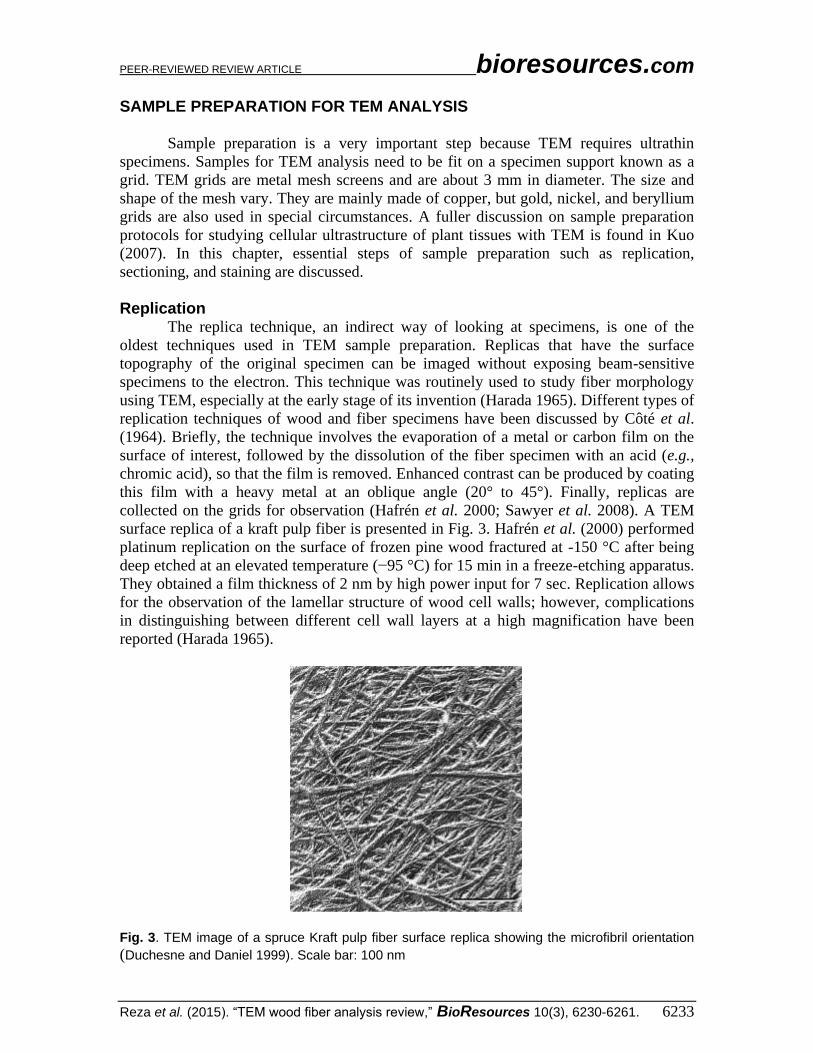
collected on the grids for observation (Hafrén et al. 2000; Sawyer et al. 2008). A TEM
surface replica of a kraft pulp fiber is presented in Fig. 3. Hafrén et al. (2000) performed
platinum replication on the surface of frozen pine wood fractured at -150 °C after being
deep etched at an elevated temperature (−95 °C) for 15 min in a freeze-etching apparatus.
They obtained a film thickness of 2 nm by high power input for 7 sec. Replication allows
for the observation of the lamellar structure of wood cell walls; however, complications
in distinguishing between different cell wall layers at a high magnification have been
reported (Harada 1965).
Fig. 3. TEM image of a spruce Kraft pulp fiber surface replica showing the microfibril orientation (Duchesne and Daniel 1999). Scale bar: 100 nm
PEER-REVIEWED REVIEW ARTICLE bioresources.com
Reza et al. (2015). “TEM wood fiber analysis review,” BioResources 10(3), 6230-6261. 6234
Sectioning Specimen thickness is an important factor for imaging with TEM. A thin
specimen improves the resolution by reducing image blurring caused by chromatic
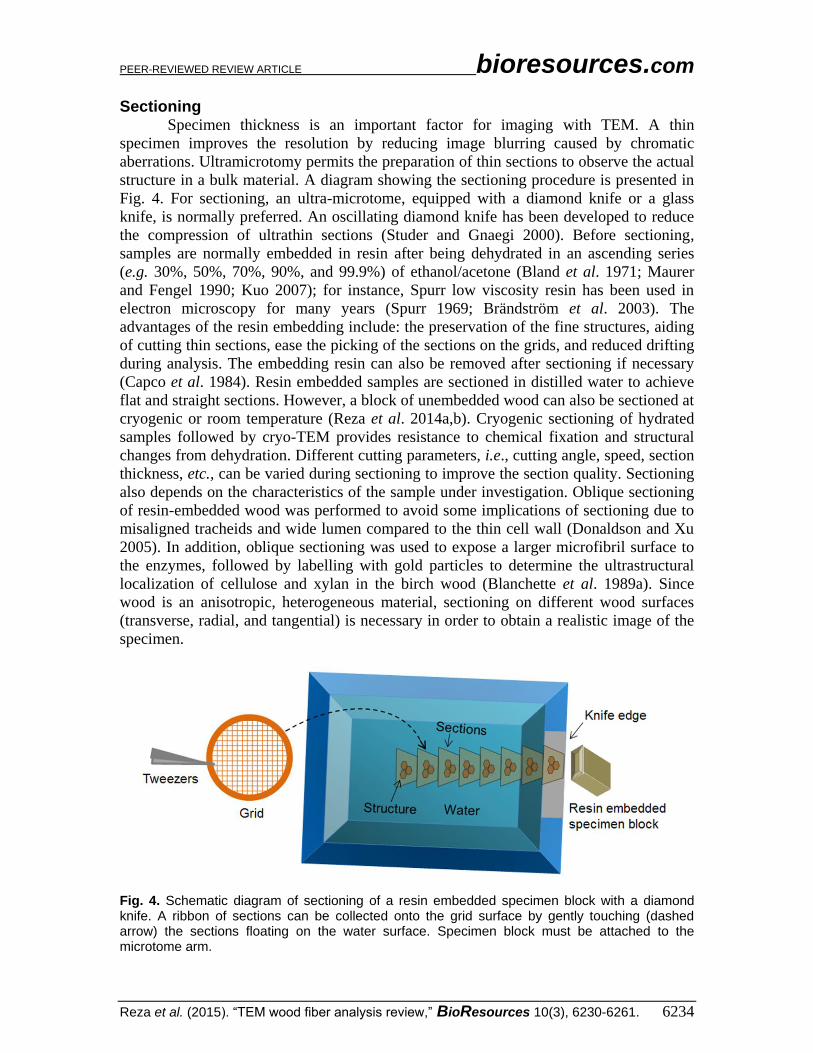
aberrations. Ultramicrotomy permits the preparation of thin sections to observe the actual
structure in a bulk material. A diagram showing the sectioning procedure is presented in
Fig. 4. For sectioning, an ultra-microtome, equipped with a diamond knife or a glass
knife, is normally preferred. An oscillating diamond knife has been developed to reduce
the compression of ultrathin sections (Studer and Gnaegi 2000). Before sectioning,
samples are normally embedded in resin after being dehydrated in an ascending series
(e.g. 30%, 50%, 70%, 90%, and 99.9%) of ethanol/acetone (Bland et al. 1971; Maurer
and Fengel 1990; Kuo 2007); for instance, Spurr low viscosity resin has been used in
electron microscopy for many years (Spurr 1969; Brändström et al. 2003). The
advantages of the resin embedding include: the preservation of the fine structures, aiding
of cutting thin sections, ease the picking of the sections on the grids, and reduced drifting
during analysis. The embedding resin can also be removed after sectioning if necessary
(Capco et al. 1984). Resin embedded samples are sectioned in distilled water to achieve
flat and straight sections. However, a block of unembedded wood can also be sectioned at
cryogenic or room temperature (Reza et al. 2014a,b). Cryogenic sectioning of hydrated
samples followed by cryo-TEM provides resistance to chemical fixation and structural
changes from dehydration. Different cutting parameters, i.e., cutting angle, speed, section
thickness, etc., can be varied during sectioning to improve the section quality. Sectioning
also depends on the characteristics of the sample under investigation. Oblique sectioning
of resin-embedded wood was performed to avoid some implications of sectioning due to
misaligned tracheids and wide lumen compared to the thin cell wall (Donaldson and Xu
2005). In addition, oblique sectioning was used to expose a larger microfibril surface to
the enzymes, followed by labelling with gold particles to determine the ultrastructural
localization of cellulose and xylan in the birch wood (Blanchette et al. 1989a). Since
wood is an anisotropic, heterogeneous material, sectioning on different wood surfaces
(transverse, radial, and tangential) is necessary in order to obtain a realistic image of the
specimen.
Fig. 4. Schematic diagram of sectioning of a resin embedded specimen block with a diamond knife. A ribbon of sections can be collected onto the grid surface by gently touching (dashed arrow) the sections floating on the water surface. Specimen block must be attached to the microtome arm.
PEER-REVIEWED REVIEW ARTICLE bioresources.com
Reza et al. (2015). “TEM wood fiber analysis review,” BioResources 10(3), 6230-6261. 6235
Staining Staining, an important procedure in specimen preparation, is an auxiliary
technique used in microscopy to enhance the contrast of an image by depositing heavy
elements onto the specimen. Staining usually enhances the stability of the specimen when
visualized with transmitted beam in direct imaging. Sometimes stains can be fixatives,
i.e., chemical cross-linkers that cause hardening and increased density. In biology,
fixation helps to preserve cells and tissue components in their original state. Staining can
be performed before sectioning (pre-staining) or after sectioning (post-staining).
Potassium permanganate, osmium tetroxide, and uranyl acetate are the most common
stains used in wood research and are discussed below.
Potassium permanganate
Potassium permanganate (KMnO4) is a common stain used for contrasting lignin
in wood sections (Bland et al. 1971). The stain appears to be specific to lignin, although
there are suggestions that it may also stain some hemicelluloses, but not cellulose
(Khristova et al. 1998). The KMnO4 staining technique was used for studying lignin
distribution (Fromm et al. 2003; Ma et al. 2011a), lignin degradation by rot fungi
(Paszczynski et al. 1988; Lequart et al. 2000), lignification during the cell wall
differentiation (Donaldson 1992; Prislan et al. 2009), and the properties of pulp fibers
(Solala et al. 2013).
Bland et al. (1971) studied the mechanism of permanganate staining and lignin
distribution in the cell wall of the Pinus radiata. It was found that the syringyl and
guaiacyl groups were mainly responsible for permanganate staining. Experiments with
lignin model compounds showed that phenols, especially diphenols and triphenols,
rapidly reduced permanganate to manganese oxides (MnO2) (Bland et al. 1971). Perhaps
KMnO4 oxidizes the phenolic groups of lignin molecules to aldehydes and carbonic
acids. Finally, the resulting water-insoluble MnO2 is deposited on the section,
distinguishing the reaction sites (Koch and Schmitt 2013). According to the degree of
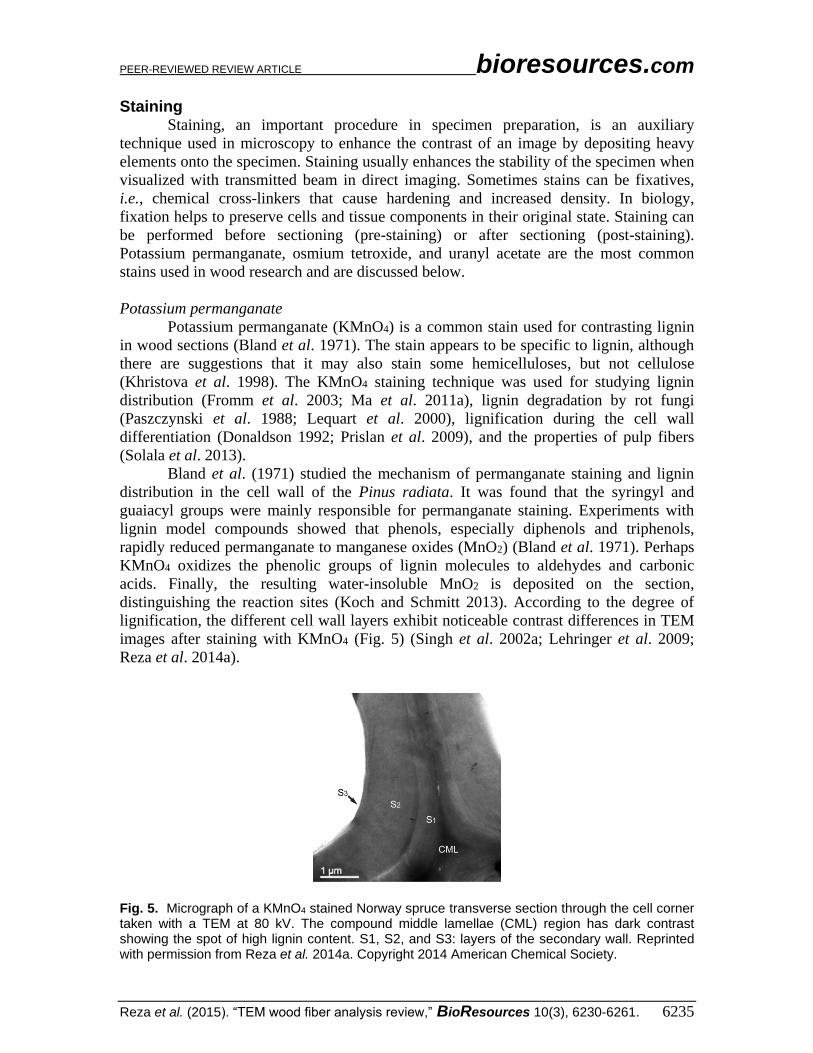
lignification, the different cell wall layers exhibit noticeable contrast differences in TEM
images after staining with KMnO4 (Fig. 5) (Singh et al. 2002a; Lehringer et al. 2009;
Reza et al. 2014a).
Fig. 5. Micrograph of a KMnO4 stained Norway spruce transverse section through the cell corner taken with a TEM at 80 kV. The compound middle lamellae (CML) region has dark contrast showing the spot of high lignin content. S1, S2, and S3: layers of the secondary wall. Reprinted with permission from Reza et al. 2014a. Copyright 2014 American Chemical Society.
PEER-REVIEWED REVIEW ARTICLE bioresources.com
Reza et al. (2015). “TEM wood fiber analysis review,” BioResources 10(3), 6230-6261. 6236
The time period for staining the ultrathin sections varied from 2 min to 2 h (Bland
et al. 1971; Donaldson 2002). The longer the staining time and the higher the KMnO4
concentration, then the probability of contamination with MnO2 increased (Maurer and
Fengel 1990).
In some cases, pre-staining of wood blocks before embedding in resin was
preferred to study the ultrastructure of wood (Donaldson 1997; Singh et al. 2002a), as
post-stained with KMnO4 resulted in contamination of the section surfaces with MnO2
(Maurer and Fengel 1990). However, this contamination effect was avoided by carefully
washing the sections in aqueous citric acid after staining (Greyer 1973). Wood embedded
in melamine also had a negligible amount of MnO2 contamination after staining with
KMnO4 (Maurer and Fengel 1990, 1991).
Osmium tetroxide
Osmium tetroxide (OsO4) is a strong oxidizing agent. It oxidizes many organic
materials and becomes reduced to elemental osmium, an easily detectable black
substance. As a heavy metal, osmium strongly scatters electrons and is commonly used as
a stain and fixative for studying morphology in biological electron microscopy. It is also
used for staining polymers when studying their spatial structure using TEM. The OsO4
compound is a highly volatile and extremely toxic chemical; therefore special care needs
to be taken during its handling (Sawyer et al. 2008).
Osmium tetroxide is inert towards carbohydrates, but it reacts with unsaturated
fatty acids, proteins, and amino acids (Bahr 1954). Although both proteins and
unsaturated fatty acids may exist in plant cell walls (Roelofsen et al. 1959; Northcote and
Lamport 1960), their concentrations are too low to significantly contribute to any
reactions with OsO4. Thus, it has been assumed that the dark contrast regions in the
electron micrographs of OsO4 stained cell walls come from lignin or its precursors
(Hepler and Newcombe 1963).
Bland et al. (1971) have confirmed that no reactions occur between acetylated
lignin and OsO4. Their results showed the positive reactivity of OsO4 with double bonds,
and di- and trihydroxy phenols. However, compared with KMnO4, OsO4 only slightly
stained the Pinus radiata wood sections in the middle lamella region (Bland et al. 1971).
Fernando and Daniel (2008) used OsO4 and ruthenium red as pre-staining chemicals,
followed by post-staining with KMnO4 to study lignin distribution in the cell wall of pine
and spruce thermo-mechanical pulp (TMP) shives. In their study, they observed a highly
lignified outer region and a less lignified inner region within the S1 layer of spruce TMP
shives, when compared with pine TMP fibers, whereas no variation in electron density
was apparent within the S1 layer. Pre-staining with OsO4 before embedding and post-
staining with uranyl acetate and lead citrate was performed to study the protective role of
lignin against radiation induced degradation (de Lhoneux et al. 1984). Osmium tetroxide
has also been used as a pre-staining chemical prior to post-staining with lead citrate to
study the ultrastructure of wood (Borgin et al. 1975).
Uranyl acetate
Despite its cationic reactivity towards biological materials and acidity in aqueous
solution, uranyl acetate has been a widely used negative stain. The main reason for
negative staining is to surround the object in a suitable electron-dense material that
provides high cellular contrast and good preservation. Uranyl acetate is often the first
choice for initial TEM screening of an unknown sample or for rapid preliminary

PEER-REVIEWED REVIEW ARTICLE bioresources.com
Reza et al. (2015). “TEM wood fiber analysis review,” BioResources 10(3), 6230-6261. 6237
biological structure quality assessment. The main disadvantage of uranyl acetate for high-
resolution studies is the granular/microcrystalline nature of the dried stain and its
sensitivity to the electron beam (De Carlo and Harris 2011). The latter can be minimized
by the use of low-dose imaging. Basically, the structural detail of the image is limited by
the shape and size of the uranyl acetate aggregate as it appears in the projection (Frank
2006).
Uranyl acetate has been mainly used for studying cellulose fibrils (Saito et al.
2006) and fines in suspension (Kallavus and Gravitis 1995). Generally, a drop of a
dispersion of the sample is mounted on a carbon-coated electron microscope grid. Then, a
drop of 1 to 2% uranyl acetate is added before drying. The excess of solution is blotted
with filter paper, and the dispersion is dried by natural evaporation (Kallavus and Gravitis
1995; Saito et al. 2006).
The combination of uranyl acetate and lead citrate has been successfully used to
stain flat sections of non-woody fibers in order to study the distribution of lignin in
different cell wall layers (Khalil et al. 2006; 2010). Kim et al. (2011) stained
immunogold labeled sections with uranyl acetate to study xylan and mannan distribution
in compression wood. Kallavus and Gravitis (1995) used uranyl acetate staining to study
ultrastructural changes in steam exploded wood. These techniques revealed the
occurrence of micro-fibrillar bundles in the freshly exploded substrate. The effect of
refining and pretreatment on the pulp fibers was also studied by means of this technique
(Molin and Daniel 2004; Lei et al. 2012).
Immunogold labeling Immunogold labeling for TEM analysis has played an important role in the fields
of cell and tissue biology. This methodology enables precise investigation of the
topochemistry of cells and tissues in relation to structural organization. In principle, an
antibody localizes and identifies a specific structure in a cell specimen followed by
antibody labeling with gold particles (Hayat 2002). The gold particles appear dark in the
bright-field image. Using this approach, the distribution of lignin at the ultrastructural
level was visualized.
The localization of the dibenzodioxocin structures were studied by counting the
number of labeled gold particles in TEM micrographs (Kukkola et al. 2003). The
dynamics of the deposition of crystalline and amorphous forms of cellulose during cell
wall formation have also been studied by TEM and immunogold labeling (Ruel et al.
2012). This method was also useful for the investigation of wood degradation by
microorganisms (Daniel 1994; Goodell et al. 1997).
The progress of lignin deposition and structural variations in the lignin
macromolecule during the lignification were studied using immunogold labeling by
Joseleau and Ruel (1997) and Ruel et al. (1999). The lignin-specific antibodies exhibited
no affinity for cellulose and thus provided the necessary sensitivity to detect a discrete
amount of lignin by TEM. This technique has been reported as a non-invasive method,
which preserves the constituents and the morphology of the material to be studied
(Joseleau et al. 2004). It also provides more precise and detailed information than the
conventional methods, such as lignin stains and autofluorescence (Kukkola et al. 2003).
Topochemistry of different cell wall polymers studied using this technique is reviewed in
the later parts of this paper.

PEER-REVIEWED REVIEW ARTICLE bioresources.com
Reza et al. (2015). “TEM wood fiber analysis review,” BioResources 10(3), 6230-6261. 6238
AREAS COVERED BY TEM
Before describing the features of wood ultrastructure and role of TEM, it is
important to understand the terminology that will be used. The term “ultrastructure”, also
known as “fine structure”, is used to denote the structural domain of a tissue or cell, as
revealed by microscopy, especially electron microscope. The use of ultrastructure in
wood science has been intensified after the invention of the electron microscope (Côté
1981). Now the question is “what is the dimension that is considered as ultrastructure?”.
Precisely, the wood ultrastructure is the hierarchic level ranging from the molecular level
up to the cell wall (Eder et al. 2013). Thus, the ultrastructure of wood is also reachable
with one of the contemporary instruments in light microscope, e.g., the confocal
microscope.
Fibrillar Structure of Wood Cell Wall The basic structure of the wood cell wall has been described in detail in
previously reported research (Côté 1964; Daniel 2007). The ultrastructure of the wood
cell wall revealed by TEM is the main focus of this paper. Figure 6a illustrates the typical
cell wall layering structure, which shows the relative size of each layer and the average
microfibril orientation within each layer. This model is acceptable for tracheids; however,
there are many deviations from this in ray parenchyma, reaction wood cells, and in
normal longitudinal elements (Côté 1981; Alén 2000; Daniel 2007). Transmission
electron micrographs of the Fraxinus mandshurica cell wall shows two layers (S1 and
S2) in the secondary wall (Prodhan et al. 1995). The high variability in the thickness of
the different wood cell wall layers was shown by TEM investigations (Timell 1973;
Singh et al. 2002b).
Fig. 6. Schematic diagrams and cryo-TEM image of wood cell walls showing microfibril orientation in different cell wall layers: (a) Model of the wood cell wall with planar microfibril orientation (Côté 1967. Republished with permission of the University of Washington Press); (b) a cryo-TEM image of KMnO4 stained spruce radial longitudinal section showing the microfibril orientation in different layers; and (c) A 3D model based on the high-resolution cryo-TEM where microfibrils form an out-of-plane angle with respect to the cell wall plane. (Figures b and c republished from Reza et al. 2014b with permission from Springer-Verlag). ML: middle lamellae; CML: compound middle lamellae; P: primary wall; S1, S2, and S3: layers of the secondary wall; W: warty layer. Arrows show the direction of the microfibril orientation.
The fibrillar structure of the cell wall was confirmed in the early electron
microscopic studies of plant materials (Preston et al. 1948; Mühlethaler 1949). The

PEER-REVIEWED REVIEW ARTICLE bioresources.com
Reza et al. (2015). “TEM wood fiber analysis review,” BioResources 10(3), 6230-6261. 6239
application of TEM to study the fibrillar structure of wood cell walls in the 1950’s
provided some details pertaining to the microfibril orientation. Imaging by electron
microscopes suggests that microfibrils are synthesized in the plasma membrane by
cellulose synthases consisting of a ring of six particles called a rosette (Mueller and
Brown 1980; Emons and Mulder 2000). Microfibrils are about 3.5 nm wide (Mühlethaler
1969; Kerr and Goring 1975) and are regularly bridged, forming an interfibrillar bridging
element (Donaldson and Singh 1998). Models of microfibrils consisting of 36 and 24
cellulose chains with diamond and rectangular cross-sections were proposed using
different analytical techniques, where crystalline chains are surrounded by less crystalline
and amorphic chains (Frey-Wyssling and Mühlethaler 1963; Ding and Himmel 2006;
Fernandes et al. 2011). However, these models were mainly based on indirect evidence
and obtained occasionally after removing the associated matrix materials with strong
solvents. Since the removal of the surrounding matrix material can change the structure,
researchers often prefer microfibrils in a matrix containing fewer non-cellulosic
polymers, such as cotton, that possesses a large crystalline dimension. These models are
speculations about the true structure of microfibrils in the native wood cell wall.
The presence of granular structures along microfibrils was observed in TEM
images of gold-shadowed formvar replicas of tracheid secondary wall (Hodge and
Wardrop 1950). Such features were later described as a string of pearls (Manley 1964).
The granular structure of microfibrils was also observed in cryo-TEM images of KMnO4
stained spruce wood (Fig. 6b). The explanation behind such structures is unclear in the
literature. However, there is evidence that the microfibrils form aggregates in the wood
and pulps, as observed by several researchers (Preston et al. 1948; Hodge and Wardrop
1950; Hult et al. 2003; Reza et al. 2014b). These aggregates appear as bundles in the
micrograph on the transverse section of the tracheid S2 layer (Singh et al. 1998; Singh
and Daniel 2001). The aggregation of cellulose microfibrils in wood and pulps controls
the accessibility of cellulose (Krässig 1993), thus affecting the extraction of the cell wall
components during the biorefinery process; however this mechanism is poorly
understood.
The orientation of cellulose microfibrils in woody and non-woody fibers has been
revealed by TEM studies. Deposition of microfibrils in lamellae was observed in Avena
coleoptiles thin sections (Bayley et al. 1957) and Valonia ventricosa surface replica
(Preston et al. 1948). Uniform and cross-fibrillar orientations were reported in the
secondary wall of Pseudotsuga taxifolia wood (Hodge and Wardrop 1950). An S-Z-S
helical orientation in the S1, S2, and S3 layers, respectively, was exhibited frequently in
models of the wood cell wall (Wardrop 1954; Côté 1981). In the tracheid S1 layer, both
S and Z-helical orientations, with an impression of cross-fibrillar structure, were reported
(Emerton and Goldsmith 1956; Wardrop 1957; Donaldson and Xu 2005). However,
microfibrils perpendicular with respect to the fiber longitudinal axis in single helix have
been observed in recent studies (Brändström et al. 2003; Reza et al. 2014b). The presence
of lamellar structure in the S2 layer was proposed based on TEM micrographs of KMnO4
stained softwood sections (Maurer and Fengel 1991; Kerr and Goring 1975), which were
interpreted as tangential striations by Chafe (1974). An abrupt change in the orientation
of microfibrils between S1 and S2 layers in Norway spruce was observed in TEM images
(Brändström et al. 2003; Reza et al. 2014b), whereas no clear transition was observed
between S2 and S3 layers (Donaldson and Xu 2005). In a recent study, Reza et al.
(2014b) proposed a 3D model of the tracheid wall based on cryo-TEM (Fig. 6b,c) where,
in contrast to the existing models of wood cell wall with planar microfibril orientation,
PEER-REVIEWED REVIEW ARTICLE bioresources.com
Reza et al. (2015). “TEM wood fiber analysis review,” BioResources 10(3), 6230-6261. 6240
microfibrils protruded from the cell wall plane towards the lumen, forming an out-of-
plane angle. Based on the above discussion, it is apparent that the ultrastructure of the
wood cell wall is far from being well understood. More systematic studies using high-
resolution imaging techniques are required to fully understand the structure of
microfibrils and their orientation in native cell walls.
Lignin Distribution The ultrastructural aspects of cell wall lignification and lignin topochemistry were
discussed in detail by Donaldson (2001). In this paper, the focus is on the lignin
deposition and topochemistry explored by TEM.
Normal wood
Transmission electron microscopy has been used to obtain high-resolution
information about the distribution of lignin in both the developing and the mature xylem
(Xu et al. 2006a; Ma et al. 2011b; Koch and Schmitt 2013). The TEM study on
developing tissues in Pinus thunbergii showed that the structure of the unlignified middle
lamella in the cambium/developing xylem consists of a fine network containing pectin
and hemicelluloses (Hafrén et al. 2000; Kim et al. 2014). As lignification proceeds, the
middle lamella becomes compact, dense, and partly covered with globular structures
(Hafrén et al. 2000). Differences in the temporal synthesis of p-hydroxyphenylpropane,
guaiacyl, and syringyl units in growing maize internodes were studied by Joseleau and
Ruel (1997) using TEM and immunogold labeling. Immunological probes and TEM
allowed visualization of the progress of lignin deposition during maturation in each cell
type. The TEM images of conifer tracheid cell walls showed an inhomogeneous lignin
distribution in the S2 layer after analyzing the electron density variations within the
micrographs of KMnO4 stained pine sections (Singh and Daniel 2001; Singh et al.
2002a). On the other hand, the TEM micrographs of Fagus sylvatica wood sections
showed a homogeneous distribution of lignin in the S2 layer (Prislan et al. 2009). The
distribution of lignin in the ultrathin sections of TMP fibers of rubber wood under high
temperatures was examined by Singh and co-workers (2003) using TEM and KMnO4
staining. They also found a heterogeneous lignin distribution in the middle lamella
attached to the fiber surface. The degradation/alteration of CML lignin was reported in
thermally modified wood (Gao et al. 2014). Kukkola and colleagues (2003) localized
dibenzodioxocin substructures in lignifying xylem using immunogold labeling and TEM.
The abundance of dibenzodioxocin in the softwood lignin was estimated to be
approximately 6%, making it one of the major structural units (Ämmälahti et al. 1998).
Dibenzodioxocin is more abundant in the secondary cell wall layers than in the middle
lamella. More specifically, dibenzodioxocin exists in the S2 and S3 layers of secondary
cell wall. In young tracheids, where secondary cell wall layers have not appeared yet, the
dibenzodioxocin structure was absent (Kukkola et al. 2003).
Tension wood
Tension wood is formed in hardwood on the upper side of a leaning stem to
maintain the natural vertical orientation of the tree. These fibers are characterized by the
formation of an extra layer, termed the gelatinous layer (GL), that may replace part of the
secondary cell wall (S1+GL, S1+S2+GL), or occupy the cell lumen attached to the S3
layer (S1+S2+S3+GL), depending on the species and the intensity of the tensile stress
(Fig. 7a) (Dadswell and Wardrop 1955; Scurfield 1973; Lehringer et al. 2009; Lautner et
PEER-REVIEWED REVIEW ARTICLE bioresources.com
Reza et al. (2015). “TEM wood fiber analysis review,” BioResources 10(3), 6230-6261. 6241
al. 2012). The GL can be easily separated from the rest of the cell, leaving a fuzzy
appearance on the surface of machined wood (Côté et al. 1969; Donaldson 2001; Daniel
2007). This layer consists mainly of cellulose microfibrils aligned in the direction of the
fiber axis (Lautner et al. 2012). The TEM studies on tension wood showed the
progression of lignification in the CML, S1, and S2 layers during the GL formation
(Yoshinaga et al. 2012). Early investigations on the composition of the GL found that it
was primarily cellulose (Norberg and Meier 1966) and was entirely free of lignin
(Blanchette et al. 1994; Wada et al. 1995; Donaldson 2001). However, there are a few
studies claiming that lignin is present in this layer (Yoshida et al. 2002; Joseleau et al.
2004). The S1 layer of the gelatinous fiber is less lignified than normal wood (Prodhan et
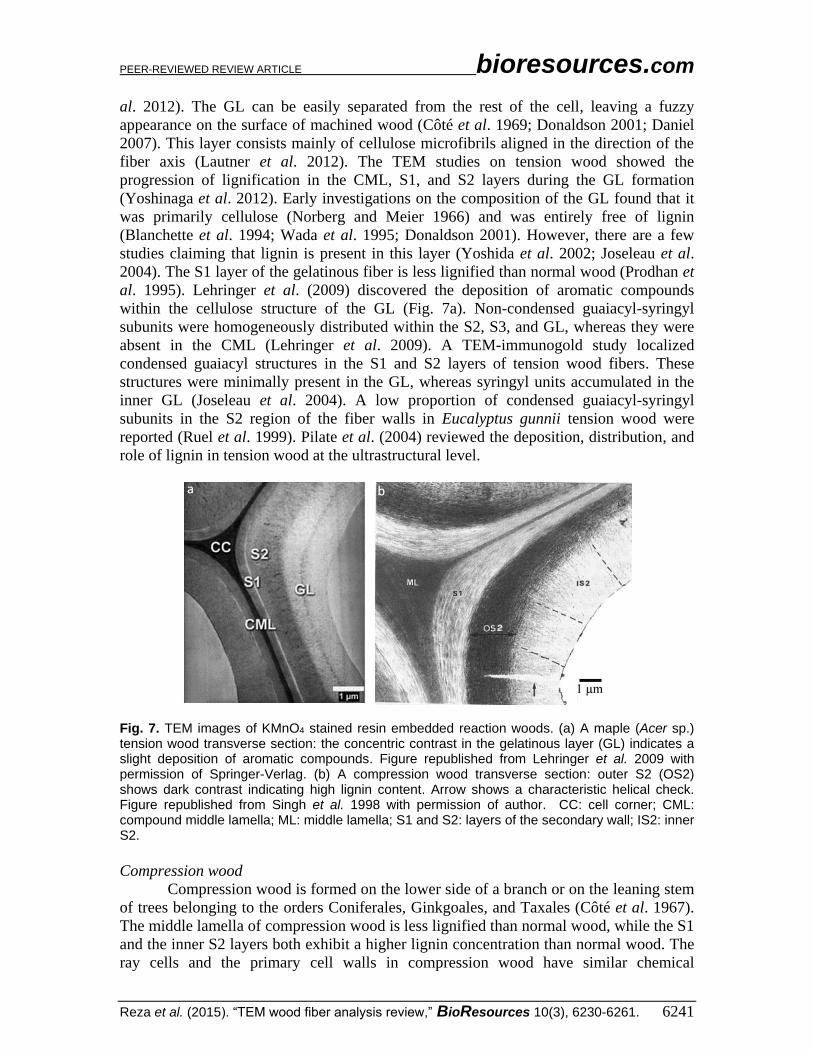
al. 1995). Lehringer et al. (2009) discovered the deposition of aromatic compounds
within the cellulose structure of the GL (Fig. 7a). Non-condensed guaiacyl-syringyl
subunits were homogeneously distributed within the S2, S3, and GL, whereas they were
absent in the CML (Lehringer et al. 2009). A TEM-immunogold study localized
condensed guaiacyl structures in the S1 and S2 layers of tension wood fibers. These
structures were minimally present in the GL, whereas syringyl units accumulated in the
inner GL (Joseleau et al. 2004). A low proportion of condensed guaiacyl-syringyl
subunits in the S2 region of the fiber walls in Eucalyptus gunnii tension wood were
reported (Ruel et al. 1999). Pilate et al. (2004) reviewed the deposition, distribution, and
role of lignin in tension wood at the ultrastructural level.
Fig. 7. TEM images of KMnO4 stained resin embedded reaction woods. (a) A maple (Acer sp.) tension wood transverse section: the concentric contrast in the gelatinous layer (GL) indicates a slight deposition of aromatic compounds. Figure republished from Lehringer et al. 2009 with permission of Springer-Verlag. (b) A compression wood transverse section: outer S2 (OS2) shows dark contrast indicating high lignin content. Arrow shows a characteristic helical check. Figure republished from Singh et al. 1998 with permission of author. CC: cell corner; CML: compound middle lamella; ML: middle lamella; S1 and S2: layers of the secondary wall; IS2: inner S2.
Compression wood
Compression wood is formed on the lower side of a branch or on the leaning stem
of trees belonging to the orders Coniferales, Ginkgoales, and Taxales (Côté et al. 1967).
The middle lamella of compression wood is less lignified than normal wood, while the S1
and the inner S2 layers both exhibit a higher lignin concentration than normal wood. The
ray cells and the primary cell walls in compression wood have similar chemical

PEER-REVIEWED REVIEW ARTICLE bioresources.com
Reza et al. (2015). “TEM wood fiber analysis review,” BioResources 10(3), 6230-6261. 6242
compositions to that of normal wood tracheids (Timell 1982). The deposition of p-
hydroxyphenyl, guaiacyl, and syringyl in Pinus thunbergii compression wood followed
the same sequence as in normal wood with some variations (Terashima and Fukushima
1988; Fukushima and Terashima 1991). The TEM image of the compression wood cell
wall showed that the outer S2 layer was more lignified than the inner portion, thus stained
more intensely with KMnO4 (Fig. 7b) (Singh et al. 1998; Kim and Singh 1999; Kim et al.
2011). KMnO4 stained compression wood showed higher lignin concentration than
normal wood and was more resistant to decay by rot fungi (Blanchette et al. 1994).
Distribution of Other Chemical Components There are many other chemicals that have an important role in the wood cell wall
structure. For example, hemicelluloses, one of the matrix materials, play an important
role in building the three-dimensional structure of plant cell walls. Combination of TEM
and immunogold labeling has proven to be a powerful tool for providing ultrastructural
information of hemicellulose distribution in the wood and fiber cell walls. TEM-
immunogold labeling of Japanese beech showed the distribution of glucuronoxylans, the
main hemicellulosic component of the hardwood, in the secondary wall of xylem cells,
but no labelling was found in the primary wall and middle lamella. An even distribution
was observed in the inner part of the secondary wall (Awano et al. 1998). A uniform
distribution of xylan specific antibody was observed in the mature tracheids of Japanese
cedar; whereas, glucomannan was distributed in the boundary between the S1 and S2
layers. The innermost part of the cell wall showed stronger labeling with glucomannan
than other parts of the cell wall (Kim et al. 2010a, b). When applying this technique to
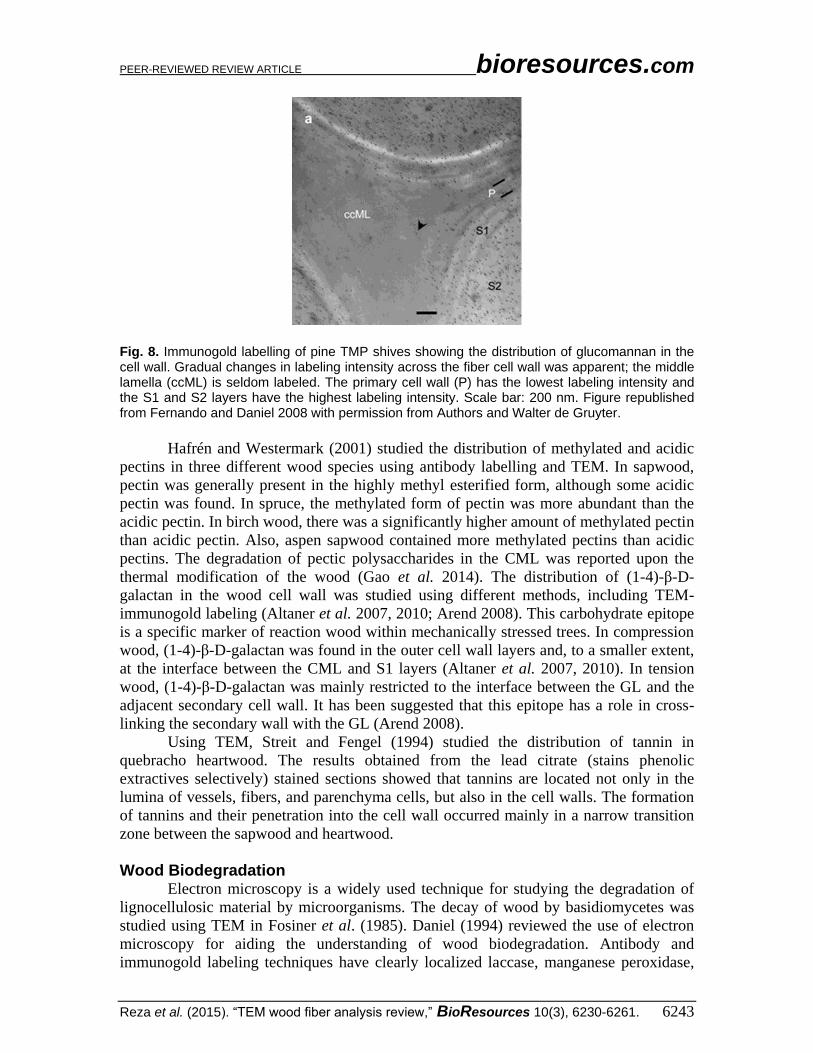
pine TMP shives, this yielded information about the distribution of the glucomannan
hemicellulose in the different cell wall layers (Fig. 8). Apparently a large number of gold
particles were found in the S1 and S2 layers, with less intensity in the primary cell wall.
Neither the middle lamella nor the cell corners were labeled (Fernando and Daniel 2008).
The localization of glucomannan was studied using immunogold labelling followed by
metal replication and was observed with TEM. Glucomannan molecules were distributed
heterogeneously all along the cellulose fibril aggregates of Norway spruce kraft pulp. The
aggregation of cellulose microfibrils upon the removal of the hemicelluloses was
suggested (Duchesne et al. 2003). When applying the same technique to developing
tension wood in poplar trees, this revealed the presence of xyloglucan in the gelatinous
layer (Sandquist et al. 2010).
Studies on differentiating normal and compression wood in Japanese cedar
revealed the temporal and spatial distribution of xylan and mannan hemicelluloses (Kim
et al. 2010a, 2011). The xylan specific antibody was uniformly distributed in the S1 layer
of compression wood, but it showed an uneven distribution in the S2 layer. Xylan
labelling in the inner S2 was mainly detected after beginning of helical cavity in the
compression wood; whereas, mannan labelling was detected in the S1 and S2 layer from
the early stage of S2 formation (Kim et al. 2011). Compared with normal wood,
compression wood had significantly different xylan distribution in the secondary wall,
but similar mannan labelling (Kim et al. 2010a, 2011). The chemical structure of
hemicelluloses in wood cell wall may vary depending on the stage of cell wall
development (Awano et al. 1998; Kim et al. 2010b).
PEER-REVIEWED REVIEW ARTICLE bioresources.com
Reza et al. (2015). “TEM wood fiber analysis review,” BioResources 10(3), 6230-6261. 6243
Fig. 8. Immunogold labelling of pine TMP shives showing the distribution of glucomannan in the cell wall. Gradual changes in labeling intensity across the fiber cell wall was apparent; the middle lamella (ccML) is seldom labeled. The primary cell wall (P) has the lowest labeling intensity and the S1 and S2 layers have the highest labeling intensity. Scale bar: 200 nm. Figure republished from Fernando and Daniel 2008 with permission from Authors and Walter de Gruyter.
Hafrén and Westermark (2001) studied the distribution of methylated and acidic
pectins in three different wood species using antibody labelling and TEM. In sapwood,
pectin was generally present in the highly methyl esterified form, although some acidic
pectin was found. In spruce, the methylated form of pectin was more abundant than the
acidic pectin. In birch wood, there was a significantly higher amount of methylated pectin
than acidic pectin. Also, aspen sapwood contained more methylated pectins than acidic
pectins. The degradation of pectic polysaccharides in the CML was reported upon the
thermal modification of the wood (Gao et al. 2014). The distribution of (1-4)-β-D-
galactan in the wood cell wall was studied using different methods, including TEM-
immunogold labeling (Altaner et al. 2007, 2010; Arend 2008). This carbohydrate epitope
is a specific marker of reaction wood within mechanically stressed trees. In compression
wood, (1-4)-β-D-galactan was found in the outer cell wall layers and, to a smaller extent,
at the interface between the CML and S1 layers (Altaner et al. 2007, 2010). In tension
wood, (1-4)-β-D-galactan was mainly restricted to the interface between the GL and the
adjacent secondary cell wall. It has been suggested that this epitope has a role in cross-
linking the secondary wall with the GL (Arend 2008).
Using TEM, Streit and Fengel (1994) studied the distribution of tannin in
quebracho heartwood. The results obtained from the lead citrate (stains phenolic
extractives selectively) stained sections showed that tannins are located not only in the
lumina of vessels, fibers, and parenchyma cells, but also in the cell walls. The formation
of tannins and their penetration into the cell wall occurred mainly in a narrow transition
zone between the sapwood and heartwood.
Wood Biodegradation Electron microscopy is a widely used technique for studying the degradation of
lignocellulosic material by microorganisms. The decay of wood by basidiomycetes was
studied using TEM in Fosiner et al. (1985). Daniel (1994) reviewed the use of electron
microscopy for aiding the understanding of wood biodegradation. Antibody and
immunogold labeling techniques have clearly localized laccase, manganese peroxidase,
PEER-REVIEWED REVIEW ARTICLE bioresources.com
Reza et al. (2015). “TEM wood fiber analysis review,” BioResources 10(3), 6230-6261. 6244
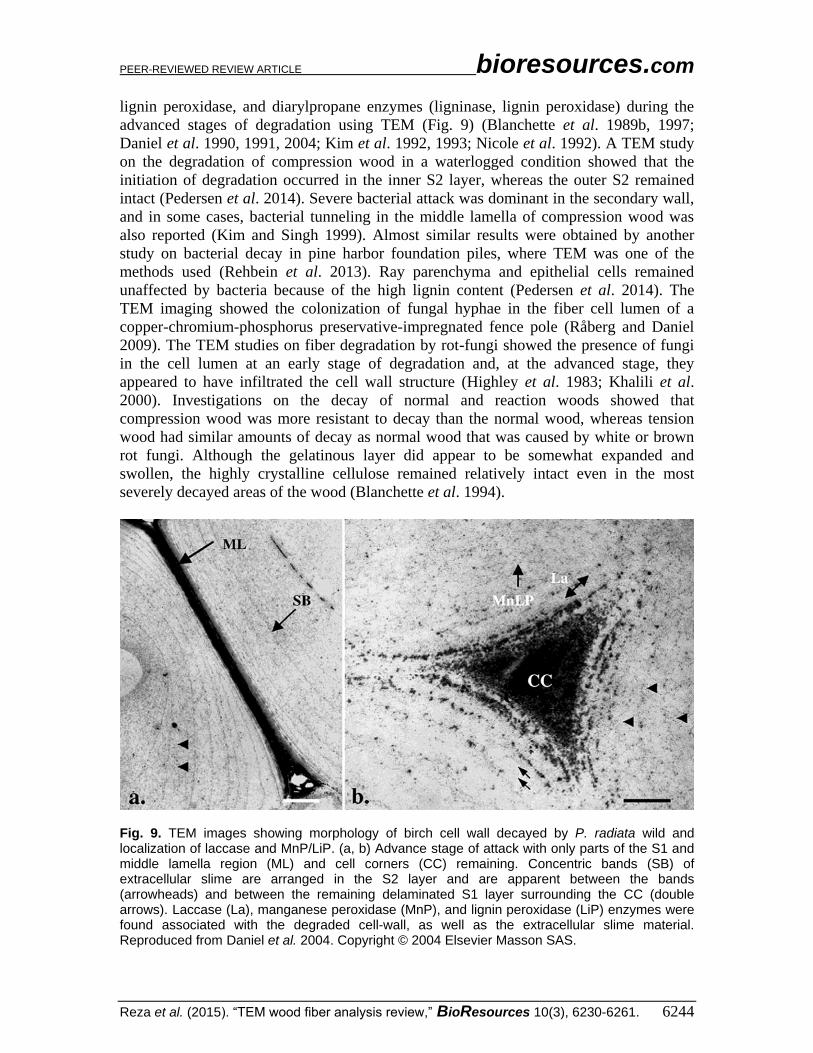
lignin peroxidase, and diarylpropane enzymes (ligninase, lignin peroxidase) during the
advanced stages of degradation using TEM (Fig. 9) (Blanchette et al. 1989b, 1997;
Daniel et al. 1990, 1991, 2004; Kim et al. 1992, 1993; Nicole et al. 1992). A TEM study
on the degradation of compression wood in a waterlogged condition showed that the
initiation of degradation occurred in the inner S2 layer, whereas the outer S2 remained
intact (Pedersen et al. 2014). Severe bacterial attack was dominant in the secondary wall,
and in some cases, bacterial tunneling in the middle lamella of compression wood was
also reported (Kim and Singh 1999). Almost similar results were obtained by another
study on bacterial decay in pine harbor foundation piles, where TEM was one of the
methods used (Rehbein et al. 2013). Ray parenchyma and epithelial cells remained
unaffected by bacteria because of the high lignin content (Pedersen et al. 2014). The
TEM imaging showed the colonization of fungal hyphae in the fiber cell lumen of a
copper-chromium-phosphorus preservative-impregnated fence pole (Råberg and Daniel
2009). The TEM studies on fiber degradation by rot-fungi showed the presence of fungi
in the cell lumen at an early stage of degradation and, at the advanced stage, they
appeared to have infiltrated the cell wall structure (Highley et al. 1983; Khalili et al.
2000). Investigations on the decay of normal and reaction woods showed that
compression wood was more resistant to decay than the normal wood, whereas tension
wood had similar amounts of decay as normal wood that was caused by white or brown
rot fungi. Although the gelatinous layer did appear to be somewhat expanded and
swollen, the highly crystalline cellulose remained relatively intact even in the most
severely decayed areas of the wood (Blanchette et al. 1994).
Fig. 9. TEM images showing morphology of birch cell wall decayed by P. radiata wild and localization of laccase and MnP/LiP. (a, b) Advance stage of attack with only parts of the S1 and middle lamella region (ML) and cell corners (CC) remaining. Concentric bands (SB) of extracellular slime are arranged in the S2 layer and are apparent between the bands (arrowheads) and between the remaining delaminated S1 layer surrounding the CC (double arrows). Laccase (La), manganese peroxidase (MnP), and lignin peroxidase (LiP) enzymes were found associated with the degraded cell-wall, as well as the extracellular slime material. Reproduced from Daniel et al. 2004. Copyright © 2004 Elsevier Masson SAS.

PEER-REVIEWED REVIEW ARTICLE bioresources.com
Reza et al. (2015). “TEM wood fiber analysis review,” BioResources 10(3), 6230-6261. 6245
COMPLEMENTARY TECHNIQUES COUPLED WITH TEM
3D Imaging Electron tomography is a useful technique for revealing 3D information about
wood structure, since TEM micrographs provide only 2D projections of the 3D objects.
In tomography, a series of images are taken at different tilt angles and reconstructed into
a 3D volume.
X-ray tomography on spruce wood has been produced; however, researchers were
only able to observe the features with dimensions over 1.5 µm (Trtik et al. 2007). In
contrast, a TEM having a goniometer with a high enough tilt range (-60º to +60º), can
acquire angular increments of about 1º to 3º, thus providing a high-resolution electron
tomography. In practice, the tilt range is limited, i.e. specimen cannot be tilted ± 90°
which degrades the resolution in the z direction (parallel to the incident electron beam).
However, this problem can be solved by applying dual-axis electron tomography, but the
sample may suffer from beam damage because the sample is continuously exposed to the
electron beam during the acquisition of tilt series. This problem can be overcome to an
extent by using cryo-TEM and the low-dose mode of the automated acquisition software.
The reconstruction software can be found online, and the many of the programs are free
and user friendly. In practice, further image processing is required to separate individual
microfibrils digitally in the tomograms (Ciesielski et al. 2013).
Xu et al. (2007) performed a dual-axis electron tomography to investigate the 3D
organization of cellulose microfibrils in plastic resin-embedded, delignified cell walls of
radiata pine early wood. In this study, Xu and colleagues were able to digitally isolate
individual microfibrils from associated lignin and hemicelluloses (Fig. 10). They stained
the wood sections with several chemicals to enhance contrast and beam stability.
Effective use of electron tomography on ultrathin wood sections would help to resolve
many of the questions regarding the helical organization of microfibrils in different
layers, lamellar (radial/tangential) structure of the S2 layer, and the structure of transition
layers. A 2D projection of an anisotropic, heterogeneous material like wood seems to be
insufficient.
Fig. 10. Models of cellulose microfibril clusters in the radiata pine S2 layer obtained by tracking tomographic slices. (a) Model of a microfibril cluster without associated lignin and hemicelluloses, and (b) model of the same microfibril cluster with residual lignin and hemicelluloses. Figure republished from Xu et al. 2007 with permission given by Springer-Verlag.

PEER-REVIEWED REVIEW ARTICLE bioresources.com
Reza et al. (2015). “TEM wood fiber analysis review,” BioResources 10(3), 6230-6261. 6246
Analytical TEM Energy Dispersive X-ray Spectroscopy (EDX or EDS) and Electron Energy-Loss
Spectrometry (EELS) are the TEM analytical techniques for the elemental analysis or
chemical characterization of specimens. The basic principle of these techniques can be
found in Michler (2008) and Williams and Carter (2009). These techniques have been
used in wood chemistry. Studies of different hardwood species using TEM-EDX showed
higher lignin concentration in the cell corner middle lamella than in the secondary cell
wall (Eriksson et al. 1988; Xu et al. 2006b). The TEM-EDX analysis was used to
determine the quantitative distribution of guaiacyl and syringyl units in the cell wall of
brominated white birch (Saka and Goring 1988). The distribution of impregnated
chemicals within the wood cell wall was also studied using this technique (Wallstörm and
Lindberg 2000). Dünisch et al. (1998) determined the potassium (K) and calcium (Ca)
concentration in phloem, cambium, and xylem cells of spruce by TEM-EDX during the
formation of earlywood and latewood. During cell enlargement, a strong increase of the
K content was detected. An increase of the Ca content of differentiating cells was found
during secondary wall formation, whereas the Ca content of the cell wall decreased
remarkably during its lignification.
Localization and characterization of manganese species during the graft
copolymerization of acrylic acid onto sawdust was performed by TEM and EELS using
KMnO4 as an initiator. The results obtained by EELS showed that MnO2 deposited on
wood participates in the grafting mechanism of acrylic acid (Marchetti et al. 2000). The
high-resolution examination of the distribution of a partially methylated hydroxymethyl
melamine resin in Norway spruce earlywood cell walls was performed using this
technique (Rapp et al. 1999). The nitrogen in the resin produced detectable signals in all
the layers of the lignified cell walls, thus allowing for the quantification of resin that had
penetrated into the different layers. However, the application of these analytical
techniques in wood samples would be limited by the rapid degradation by the electron
beam.
Electron Diffraction The crystal is a set of lattice planes that reflects radiation according to Bragg’s
law (2d sin θ = λ; where the periodicity is d, the diffraction angle is 2θ, and the
wavelength is λ). In TEM, the wavelength of the electron is very small; therefore the
lattice planes will diffract electron when they are almost parallel to the incident beam
(Sawyer et al. 2008). Electron diffraction has proven to be a powerful tool for providing
ultrastructural information of cellulose microfibrils originating from different sources
(Fig. 11) (Preston and Ripley 1954). However, the use of electron diffraction in native
wood is limited because of the presence of both crystalline and amorphous materials in
wood. An unoriented amorphous material gives a diffraction pattern consisting of broad
rings, which poses difficulty to extract diffraction of the crystalline structure. Therefore,
delignification of wood specimen is usually performed before extracting a diffraction
pattern of crystalline cellulose in wood cell wall (Adachi et al. 1991). Microfibrils in a
matrix containing fewer non-cellulosic polymers, such as Valonia, are often preferred to
acquire diffraction (Preston and Ripley 1954). The unlignified/less-lignified gelatinous
layer in tension wood fibers was also found to be a suitable specimen for TEM analysis
(Sugiyama et al. 1986). Furthermore, wood specimens are susceptible to radiation
damage during the acquisition of diffraction pattern. In the case of cellulose, it was
reported that the radiation damage results in an increase of d spacing with increasing

PEER-REVIEWED REVIEW ARTICLE bioresources.com
Reza et al. (2015). “TEM wood fiber analysis review,” BioResources 10(3), 6230-6261. 6247
irradiation doses (Revol 1985). This can be a probable reason for incompatibility between
the results obtained with electron and X-ray diffraction (Sugiyama et al. 1991b;
Nishiyama et al. 2002). However, specimen damage can be reduced to an extent using
low-dose imaging mode and with one of the contemporary cryo-TEM. Electron
diffraction on the algal cell wall showed the co-existence of both Iα and Iβ polymorphs
with variable proportions (Sugiyama et al. 1991a, b). These polymorphs have closely
related molecular conformation, but they have different hydrogen bonding patterns. In
higher plants, cellulose Iβ is thought to be the dominant polymorph (O'Sullivan 1997).
Fig. 11. Ultrastructural features of Microdictyon alga cellulose microfibrils: (a) a thin layer of unstained microfibrils observed under low-dose imaging condition; and (b) electron diffraction collected from an area such as that located in the lower part of “a”. Adapted with permission from Sugiyama et al. 1991b. Copyright 1991 American Chemical Society.
TEM VERSUS OTHER TECHNIQUES
The invention of TEM in 1940s brought in a new era for the wood scientists and
has continued to generate significant contribution to the field. Later, the development of
replication, ultramicrotomy, and embedding in resin added the flexibility of studying
small specimens extracted from a whole tree. The combined effort of these techniques
generated information on wood ultrastructural already in 1950s (Wardrop 1954). The
application of electron diffraction on algal cellulose microfibrils provided details of
cellulose polymorphism and crystal structure (Preston and Ripley 1954; Sugiyama et al.
1991a, b). Electron tomography has been available for over 30 years and has been a
useful technique for exploring 3D biological structures. However, the application of this
technique in wood research has started from last decade (Xu et al. 2007). In a recent
study, Ciesielski and co-workers (2013) visualized individual microfibrils in pretreated
plant cell walls using electron tomography and computational analysis. The development
of energy-filters and corresponding instruments has enabled energy-filtered TEM
(EFTEM) which is a useful technique for two- and three-dimensional imaging, and
chemical analysis at the nanometer scale. An example of zero-loss imaging with a cryo-
TEM equipped with an Omega type energy filter is available in Reza et al. (2014b).
PEER-REVIEWED REVIEW ARTICLE bioresources.com
Reza et al. (2015). “TEM wood fiber analysis review,” BioResources 10(3), 6230-6261. 6248
Following its invention, the addition of new features and instruments has made
TEM one of the leading techniques in biology and material science. Likewise, TEM has
provided a solid foundation in the visualization and discovery into the wood cell wall
structure and will continue to be a major instrument in wood research for years to come.
Although TEM has some issues regarding the preparation of ultrathin specimens, the
resolving power of TEM is reported to be higher than other available techniques for wood
and fiber specimens (Duchesne and Daniel 1999). Electron beam irradiation is one of the
major limiting factors of reaching high-resolution with electron microscopy. This can be
reduced to a tolerable level by using cryo-TEM and low-dose imaging mode. The use of
cryo-sectioning followed by cryo-TEM imaging allows for the investigation of hydrated
specimens without any structural collapse. However, there are many other techniques that
have been used to study wood structure independently. The limitations of TEM could be
minimized by choosing one of those techniques as a complement. Table 1 summarizes
the opportunities and challenges of principal imaging techniques used in wood research.
It is also possible to study hydrated specimens in environmental scanning electron
microscope (ESEM) and low-vacuum scanning electron microscopes (LVSEM).
Scanning electron microscopy has a large depth of field, which produces a 3D-like image
of the specimen surface (e.g. micrographs of compression wood in Burgert et al. 2004);
whereas, in TEM, the image is a 2D projection of the specimen, independent of the
topography, as long as it is transparent to the electron beam. Scanning electron
microscopy, with focused ion beam technology (FIB-SEM), allows 3D imaging of a
volume of interest in the specimen block. However, prolonged exposure to the electron
beam can cause significant artefacts. Furthermore, the 3D FIB-SEM is still in a
developing stage and requires significant upgrading of hardware (beam stability and
detector performance), software (automated), sample preparation technique, and data
processing and interpretation (Bassim et al. 2014). Like TEM, SEM with EDX
technology can be used to perform elemental analysis of the wood specimens
(Westermark et al. 1988). Field emission SEM (FESEM) has been successfully used to
study the microfibril orientation in wood cell walls (Abe et al. 1991).
X-rays are one of the oldest techniques used to study wood structure. High-
resolution information about the average microfibril orientation in the wood cell wall can
be found in Farber et al. (2001). Using synchrotron X-ray microdiffraction, the helical
organization of microfibrils in the spruce S2 layer was studied (Lichtenegger et al. 1999).
Studies on algae and wood cell walls with X-ray diffraction showed the crystalline
structure of cellulose microfibrils with atomic resolution (Nishiyama et al. 2002;
Fernandes et al. 2011). Three-dimensional tomography was also performed using this
technique with very low-resolution (Trtik et al. 2007). Depending on the size of the beam
in Small Angle X-ray Scattering (SAXS), it is possible to either scan the sample with
spatial resolution down to the μm-range or to obtain an average information over a larger
sample volume containing many cells. However, this method cannot distinguish between
two cell types with different microfibril angles (MFA), or even one cell type showing two
MFAs; therefore, the benefit of averaging over several cells requires some previous
knowledge about the system. In addition, issues regarding radiation damage were
reported while analyzing wood specimens (Saxe et al. 2014).
Atomic force microscopy (AFM) has been used as an important complement to
electron microscopy to study the wood ultrastructure for a prolonged duration (Fahlén
and Salmén 2005; Zimmermann et al. 2006). However, there are issues limiting high-
resolution imaging due to the finite size of the AFM tip, which exaggerates the size of
PEER-REVIEWED REVIEW ARTICLE bioresources.com
Reza et al. (2015). “TEM wood fiber analysis review,” BioResources 10(3), 6230-6261. 6249
very small (<50 nm) features (Duchesne and Daniel 1999). Besides imaging, AFM can be
used to study the micro-mechanics of the wood cell wall using the nano-indentation
method (Burgert and Keplinger 2013).
Raman microspectroscopy has been considered as a non-destructive technique to
study the distribution and orientation of wood cell wall materials (Gierlinger et al. 2010;
Hänninen et al. 2011). Nevertheless, the mapping of specimens can be disturbed by laser
induced damage and excess fluorescence (Gierlinger et al. 2012).
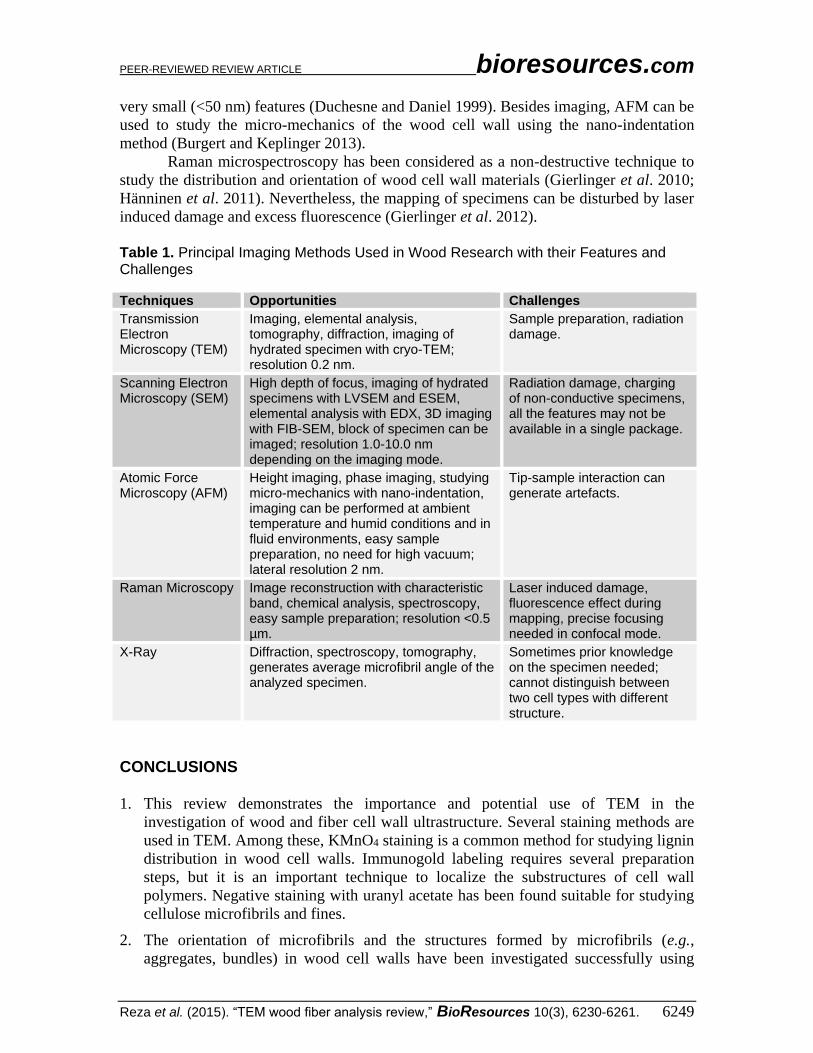
Table 1. Principal Imaging Methods Used in Wood Research with their Features and Challenges Techniques Opportunities Challenges
Transmission Electron Microscopy (TEM)
Imaging, elemental analysis, tomography, diffraction, imaging of hydrated specimen with cryo-TEM; resolution 0.2 nm.
Sample preparation, radiation damage.
Scanning Electron Microscopy (SEM)
High depth of focus, imaging of hydrated specimens with LVSEM and ESEM, elemental analysis with EDX, 3D imaging with FIB-SEM, block of specimen can be imaged; resolution 1.0-10.0 nm depending on the imaging mode.
Radiation damage, charging of non-conductive specimens, all the features may not be available in a single package.
Atomic Force Microscopy (AFM)
Height imaging, phase imaging, studying micro-mechanics with nano-indentation, imaging can be performed at ambient temperature and humid conditions and in fluid environments, easy sample preparation, no need for high vacuum; lateral resolution 2 nm.
Tip-sample interaction can generate artefacts.
Raman Microscopy Image reconstruction with characteristic band, chemical analysis, spectroscopy, easy sample preparation; resolution <0.5 µm.
Laser induced damage, fluorescence effect during mapping, precise focusing needed in confocal mode.
X-Ray Diffraction, spectroscopy, tomography, generates average microfibril angle of the analyzed specimen.
Sometimes prior knowledge on the specimen needed; cannot distinguish between two cell types with different structure.
CONCLUSIONS
1. This review demonstrates the importance and potential use of TEM in the
investigation of wood and fiber cell wall ultrastructure. Several staining methods are
used in TEM. Among these, KMnO4 staining is a common method for studying lignin
distribution in wood cell walls. Immunogold labeling requires several preparation
steps, but it is an important technique to localize the substructures of cell wall
polymers. Negative staining with uranyl acetate has been found suitable for studying
cellulose microfibrils and fines.
2. The orientation of microfibrils and the structures formed by microfibrils (e.g.,
aggregates, bundles) in wood cell walls have been investigated successfully using
PEER-REVIEWED REVIEW ARTICLE bioresources.com
Reza et al. (2015). “TEM wood fiber analysis review,” BioResources 10(3), 6230-6261. 6250
TEM. The molecular structure of microfibrils using electron diffraction in the algal
cell wall provided some details about cellulose polymorphisms and their existence in
the native cell wall.
3. A substantial amount of research has investigated the distribution of lignin using
TEM. This technique is also useful in studying specific features of tension and
compression woods.
4. The distribution of hemicelluloses in the wood cell wall has been studied successfully
using TEM and immunogold labeling. The TEM-immunogold labeling technique has
also been used to localize enzymes during advanced stages of degradation.
5. Some additional features of TEM, such as acquiring tilt series, EDX, EELS, and
diffraction are promising complementary features which have provided additional
information about the wood structure. However, very few studies have been
performed using these technologies in wood. Further research should focus on the 3D
imaging of wood ultrastructure with improved sample preparation methods.
ACKNOWLEDGEMENT
This work was funded by the Multidisciplinary Institute of Digitalization and
Energy (MIDE, http://mide.aalto.fi). Dr. Joseph Campbell is thanked for proof reading
the manuscript.
REFERENCES CITED
Abe, H., Ohtani, J., and Fukazawa, K. (1991). “FE-SEM observations on the
microfibrillar orientation in the secondary wall of tracheids,” IAWA J. 12(4), 431-
438. DOI: 10.1163/22941932-90000546
Adachi, H., Sugiyama, J., Kondo, Y., and Okano, T. (1991). “The difference of cellulose
crystal between softwoods and hardwoods,” Sen'i Gakkaishi 47(11), 580-584.
Alén, R. (2000). “Structure and chemical composition of wood,” Forest Product
Chemistry (Papermaking Science and Technology, Book 3), P. Stenius (ed.), Fapet
Oy, Helsinki, Finland.
Altaner, C., Hapca, A. I., Knox, J. P., and Jarvis, M. C. (2007). “Detection of β-1-4-
galactan in compression wood of Sitka spruce [Picea sitchensis (Bong.) Carrière] by
immunofluorescence,” Holzforschung 61(3), 311-316. DOI: 10.1515/HF.2007.049
Altaner, C. M., Tokareva, E. N., Jarvis, M. C., and Harris, P. J. (2010). “Distribution of
(1→4)-β-galactans, arabinogalactan proteins, xylans and (1→3)-β-glucans in tracheid
cell walls of softwoods,” Tree Physiol. 30(6), 782-793. DOI:10.1093/treephys/tpq021
Arend, M. (2008). “Immunolocalization of (1-4)-β-galactan in tension wood fibers of
poplar,” Tree Physiol. 28(8), 1263-1267. DOI: 10.1093/treephys/28.8.1263
Awano, T., Takabe, K., and M. Fujita, M. (1998). “Localization of glucuronoxylans in
Japanese beech visualized by immunogold labelling,” Protoplasma 202, 213-222.
DOI: 10.1007/BF01282549
Ämmälahti, E., Brunow, G., Bardet, M., Robert, D., and Kilpeläinen, I. (1998).
“Identification of side-chain structures in a poplar lignin using three-dimensional

PEER-REVIEWED REVIEW ARTICLE bioresources.com
Reza et al. (2015). “TEM wood fiber analysis review,” BioResources 10(3), 6230-6261. 6251
HMQC−HOHAHA NMR spectroscopy,” J. Agric. Food Chem. 46(12), 5113-5117.
DOI: 10.1021/jf980249o
Bahr, G. F. (1954). “Osmium tetroxide and ruthenium tetroxide and their reactions with
biologically important substances: Electron stains III,” Exp. Cell Res. 7(2), 457-479.
DOI: 10.1016/S0014-4827(54)80091-7
Bassim, N., Scott, K., and Giannuzzi, L. A. (2014). “Recent advances in focused ion
beam technology and applications,” MRS Bulletin 39(4), 317-325. DOI:
10.1557/mrs.2014.52
Bayley, S. T., Colvin, J. R., Cooper, F. P., and Cecily, A. (1957). “The structure of the
primary epidermal cell wall of Avena coleoptiles,” J. Biophys. Biochem. Cytol. 3(6),
171-182. DOI: 10.1083/jcb.3.2.171
Blanchette, R. A., Abad, A. R., Cease, K. R., Lovrien, R. E., and Leathers, T. D. (1989a).
“Colloidal gold cytochemistry of endo-1,4-β-glucanase, 1,4-β-d-glucan
cellobiohydrolase, and endo-1,4-β-xylanase: ultrastructure of sound and decayed
birch wood,” Appl. Environ. Microbiol. 55(9), 2293-2301.
Blanchette, R. A., Abad, A. R., Farrell, R. L., and Leathers, R. L. (1989b). “Detection of
lignin peroxidase and xylanase by immunocytochemical labeling in wood decayed by
basidiomycetes,” Appl. Environ. Microbiol. 55(6), 1457-1465.
Blanchette, R. A., Krueger, E. W., Haight, J. E., Akhtar, M., and Akin, D. E. (1997).
“Cell wall alterations in loblolly pine wood decayed by the white-rot fungus,
Ceriporiopsis subvermispora,” J. Biotechnol. 53(2-3), 203-213. DOI: 10.1016/S0168-
1656(97)01674-X
Blanchette, R. A., Obst, J. R., and Timell, T. E. (1994). “Biodegradation of compression
wood and tension wood by white and brown rot fungi,” Holzforschung 48(Suppl.),
34-42. DOI: 10.1515/hfsg.1994.48.s1.34
Bland, D. E., Foster, R. C., and Logan, A. F. (1971). “The mechanism of permanganate
and osmium tetroxide fixation and the distribution of lignin in the cell wall of Pinus
radiata,” Holzforschung 25(5), 137-143. DOI: 10.1515/hfsg.1971.25.5.137
Borgin, K., Parameswaran, N., and Liese, W. (1975). “The effect of aging on the
ultrastructure of wood,” Wood Sci. Technol. 9(2), 87-98. DOI: 10.1007/BF00353388
Brändström, J., Bardage, S. L., Daniel, G., and Nilsson, T. (2003). “The structural
organization of the S1 cell wall layer of Norway spruce tracheids,” IAWA J. 24(1),
27-40. DOI: 10.1163/22941932-90000318
Bucur, V. (2003). “Techniques for high resolution imaging of wood structure: A review,”
Meas. Sci. Technol. 14(12), R91-R98. DOI: 10.1088/0957-0233/14/12/R01
Burgert, I., Frühmann, K., Keckes, J., Fratzl, P., and Stanzl-Tschegg, S. (2004).
“Structure–function relationships of four compression wood types: Micromechanical
properties at the tissue and fibre level,” Trees 18(4), 480-485. DOI: 10.1007/s00468-
004-0334-y
Burgert, I., and Keplinger, T. (2013). “Plant micro- and nanomechanics: experimental
techniques for plant cell-wall analysis,” J. Exp. Bot. 64(15), 4617-4633. DOI:
10.1093/jxb/ert255
Capco, D. G., Krochmalnic, G., and Penman, S. (1984). “A new method of preparing
embeddment-free sections for transmission electron microscopy: Applications to the
cytoskeletal framework and other three-dimensional networks,” J. Cell Biol. 98(5),
1879-1885. DOI:10.1083/jcb.98.5.1878
Chafe, S. C. (1974). “On the lamellate structure of the S2 layer,” Protoplasma 79(1-2),
145-158. DOI: 10.1007/BF02055786

PEER-REVIEWED REVIEW ARTICLE bioresources.com
Reza et al. (2015). “TEM wood fiber analysis review,” BioResources 10(3), 6230-6261. 6252
Ciesielski, P. N., Matthews, J. F., Tucker, M. P., Beckham, G. T., Crowley, M. F.,
Himmel, M. E., and Donohoe, B. S. (2013). “Microfibrils, 3D electron tomography of
pretreated biomass informs atomic modeling of cellulose,” ACS Nano. 7(9), 8011-
8019. DOI: 10.1021/nn4031542
Côté, W. A. Jr. (1964). Cellular Ultrastructure of Woody Plants, Syracuse University
Press, New York.
Côté, W. A. (1967). Wood Ultrastructure: An Atlas of Electron Micrographs, University
of Washington Press.
Côté, W. A. (1981). “Ultrastructure-Critical domain for wood behavior,” Wood Sci.
Technol. 15(1), 1-29. DOI: 10.1007/BF00366498
Côté, W. A. Jr., Day, A. C., Kutscha, N. P., and Timell, T. E. (1967). “Studies on
compression wood. V. Nature of the compression wood formed in the early
springwood of conifers,” Holzforschung 21(6), 180-186. DOI:
10.1515/hfsg.1967.21.6.180
Côté, W. A. Jr., Day, A. C., and Timell, T. E. (1969). “A contribution to the ultrastructure
of tension wood fibers,” Wood Sci. Technol. 3(4), 257-271. DOI:
10.1007/BF00352301
Côté, W. A., Koran, Z., and Day, A. C. (1964). “Replica techniques for electron
microscopy of wood and paper,” TAPPI J. 47(8), 477.
Dadswell, H. E., and Wardrop, A. B. (1955). “The structure and properties of tension
wood,” Holzforschung 9(4), 97-104. DOI: 10.1515/hfsg.1955.9.4.97
Daniel, G. (1994). “Use of electron microscopy for aiding our understanding of wood
biodegradation,” FEMS Microbiol. Rev. 13(2-3), 199-233. DOI: 10.1111/j.1574-
6976.1994.tb00043.x
Daniel, G. (2007). Ljungberg Textbook: Pulp and Paper Chemistry and Technology
(Book 1), M. Ek, G. Gellerstedt and G. Henriksson (eds.), KTH, Stockholm.
Daniel, G., Goodell, B., Jellison, J., Paszczynski, A., and Crawford, R. (1991). “Use of
monoclonal antibodies to detect Mn (II)-peroxidase in birch wood degraded by
Phanerochaete chrysosporium,” Appl. Microbiol. Biotechnol. 35(5), 674-680. DOI:
10.1007/BF00169636
Daniel, G., Pettersson, B., Nilsson, T., and Volc, J. (1990). “Use of immunogold
cytochemistry to detect Mn(II)-dependent and lignin peroxidases in wood degraded
by the white-rot fungi Phanerochaete chrysosporium and Lentinula edodes,” Can. J.
Bot. 68(4), 920-933. DOI: 10.1139/b90-118
Daniel, G., Volc, J., and Niku-Paavola, M. L. (2004). “Cryo-FE-SEM & TEM immuno-
techniques reveal new details for understanding white-rot decay of lignocellulose,” C.
R. Biol. 327(9-10), 861-871. DOI: 10.1016/j.crvi.2004.08.003
De Carlo, S., and Harris, J. R. (2011). “Negative staining and cryo-negative staining of
macromolecules and viruses for TEM,” Micron 42(2), 117-131. DOI:
10.1016/j.micron.2010.06.003
de Lhoneux, B., Antoine, R., and Côté, W. A. (1984). “Ultrastructure implications of
gamma-irradiation of wood,” Wood Sci. Technol. 18(3), 161-176. DOI:
10.1007/BF00367531
Ding, S. U., and Himmel, M. E. (2006). “The maize primary cell wall microfibril: A new
model derived from direct visualization,” J. Agric. Food Chem. 54(3), 597-606. DOI:
10.1021/jf051851z
Donaldson, L. A. (1992). “Lignin distribution during latewood formation in Pinus
radiata D. Don,” IAWA J. 13(4), 381-387. DOI: 10.1163/22941932-90001291

PEER-REVIEWED REVIEW ARTICLE bioresources.com
Reza et al. (2015). “TEM wood fiber analysis review,” BioResources 10(3), 6230-6261. 6253
Donaldson, L. A. (1997). “Ultrastructure of transwall fracture surfaces in radiata pine
wood using transmission electron microscopy and digital image processing,”
Holzforschung 51(4), 303-308. DOI: 10.1515/hfsg.1997.51.4.303,
Donaldson, L. A. (2001). “Lignification and lignin topochemistry – an ultrastructural
view,” Phytochem. 57(6), 859-873. DOI: 10.1016/S0031-9422(01)00049-8
Donaldson, L. A. (2002). “Abnormal lignin distribution in wood from severely drought
stressed Pinus radiata trees,” IAWA J. 23(2), 161-178. DOI: 10.1163/22941932-
90000295
Donaldson, L. A., and Singh, A. P. (1998). “Bridge-like structure between cellulose
microfibrils in radiata pine (Pinus radiata D.Don) kraft pulp and holocellulose,”
Holzforschung 52(5), 449-454. DOI: 10.1515/hfsg.1998.52.5.449
Donaldson, L. A. and Xu, P. (2005). “Microfibril orientation across the secondary cell
wall of radiata pine tracheids,” Trees 19(6), 644-653. DOI: 10.1007/s00468-005-
0428-1
Duchesne, I., and Daniel, G. (1999). “The ultrastructure of wood fibre surfaces as shown
by a variety of microscopical methods - A review,” Nord. Pulp. Pap. Res. J. 14(2),
129-139. DOI: 10.3183/NPPRJ-1999-14-02-p129-139
Duchesne, I., Takabe, K., and Daniel, G. (2003). “Ultrastructural localisation of
glucomannan in kraft pulp fibres,” Holzforschung 57(1), 62-68. DOI:
10.1515/HF.2003.010
Dünisch, O., Bauch, J., Müller, M., and Greis, O. (1998). “Subcellular quantitative
determination of K and Ca in phloem, cambium, and xylem cells of spruce (Picea
abies [L.] Karst.) during earlywood and latewood formation,” Holzforschung 52(6),
582-588. DOI: 10.1515/hfsg.1998.52.6.582
Eder, M., Arnould, O., Dunlop, J. W. C., Hornatowska, J., Salmén, L. (2013).
“Experimental micromechanical characterization of wood cell walls,” Wood Sci.
Technol. 47(1), 163-182. DOI: 10.1007/s00226-012-0515-6
Emerton, H. W., and Goldsmith, V. (1956). “The structure of the outer secondary wall of
pine tracheids from kraft pulps,” Holzforschung 10(4), 108-115. DOI:
Emons, A. M., and Mulder, B. M. (2000). “How the deposition of cellulose microfibrils
builds cell wall architecture,” Trends Plant Sci. 5(1), 35-40. DOI: 10.1016/S1360-
1385(99)01507-1
Eriksson, I., Lidbrandt, O., and Westermark, U. (1988). “Lignin distribution in birch
(Betula verrucosa) as determined by mercurization with SEM- and TEM-EDXA,”
Wood Sci. Technol. 22(3), 251-257. DOI: 10.1007/BF00386020
Fahlén, J., and Salmén, L. (2005). “Pore and matrix distribution in the fiber wall revealed
by Atomic force microscopy and image analysis,” Biomacromol. 6(1), 433-438. DOI:
10.1021/bm040068x
Farber, J., Lichtenegger, H. C., Reiterer, A., Stanzl-Tschegg, S., and Fratzl, P. (2001).
“Cellulose microfibril angles in a spruce branch and mechanical implications,” J.
Mater. Sci. 36(21), 5087-5092. DOI: 10.1023/A:1012465005607
Fernandes, A. N., Thomas, L. H., Altaner, C. M., Callow, P., Forsyth, V. T., Apperley, D.
C., Kennedy, C. J., and Jarvis, M. C. (2011). “Nanostructure of cellulose microfibrils
in spruce wood,” Proc. Natl. Acad. Sci. 108(47), E1195-E1203. DOI:
10.1073/pnas.1108942108
Fernando, D., and Daniel, G. (2008). “Exploring Scots pine fibre development
mechanisms during TMP processing: Impact of cell wall ultrastructure

PEER-REVIEWED REVIEW ARTICLE bioresources.com
Reza et al. (2015). “TEM wood fiber analysis review,” BioResources 10(3), 6230-6261. 6254
(morphological and topochemical) on negative behavior,” Holzforschung 62(5), 597-
607. DOI: 10.1515/HF.2008.089
Fosiner, R., Messner, K., Stachelberger, H., and Röhr, M. (1985). “Wood decay by
basidiomycetes: Extracellular tripartite membranous structures,” Trans. Br. Mycol.
Soc. 85(2), 257-266. DOI: 10.1016/S0007-1536(85)80187-X
Frank, J. (2006). Three-Dimensional Electron Microscopy of Macromolecular
Assemblies: Visualization of Biological Molecules in Their Native State, Oxford
University Press, Oxford, New York. DOI:
10.1093/acprof:oso/9780195182187.001.0001
Frey-Wyssling, A., and Mühlethaler, K. (1963). “Die Elementarfibrillen der Cellulose,”
Die Makromolekulare Chemie 62(1), 25-30. DOI: 10.1002/macp.1963.020620103
Fromm, J., Rockel, B., Lautner, S., Windeisen, E., and Wanner, G. (2003). “Lignin
distribution in wood cell walls determined by TEM and backscattered SEM
techniques,” J. Struct. Biol. 143(1), 77-84. DOI: 10.1016/S1047-8477(03)00119-9
Fukushima, K., and Terashima, N. (1991). “Heterogeneity in formation of lignin. Part
XV: Formation and structure of lignin in compression wood of Pinus thunbergii
studied by microautoradiography,” Wood Sci. Technol. 25(5), 371-381. DOI:
10.1007/BF00226177
Gao, J., Kim, J.S., Terziev, N., Allegretti, O., and Daniel, G. (2014). “Chemical and
ultrastructural changes in compound middle lamella (CML) regions of softwoods
thermally modified by the Termovuoto process,” Holzforschung 68(7), 849-859. DOI:
10.1515/hf-2013-0221
Gierlinger, N., Keplinger, T., and Harrington, M. (2012). “Imaging of plant cell walls by
confocal Raman microscopy,” Nat. Protoc. 7(9), 1694-1708. DOI:
10.1038/nprot.2012.092
Gierlinger, N., Luss, S., König, C., Konnerth, J., Eder, M., and Fratzl, P. (2010).
“Cellulose microfibril orientation of Picea abies and its variability at the micron-level
determined by Raman imaging,” J. Exp. Bot. 61(2), 587-595. DOI:
10.1093/jxb/erp325
Goodell, B., Jellison, J., Liu, J., Daniel, G., Paszczynski, A., Fekete, F., Krishnamurthy,
S., Jun, L., and Xu, G. (1997). “Low molecular weight chelators and phenolic
compounds isolated from wood decay fungi and their role in the fungal
biodegradation of wood,” J. Biotechnol. 53(2-3), 133-162. DOI: 10.1016/S0168-
1656(97)01681-7
Greyer, G. (1973). Ultrahistochemie, Gustav Fischer VEB, Stuttgart, Germany.
Hafrén, J., Fujino, T., Itoh, T., Westermark, U., and Terashima, N. (2000).
“Ultrastructural changes in the compound middle lamella of Pinus thunbergii during
lignification and lignin removal,” Holzforschung 54(3), 234-240. DOI:
10.1515/HF.2000.040
Hafrén, J., and Westermark, U. (2001). “Distribution of acidic and esterified
polygalacturonans in sapwood of spruce, birch and aspen,” Nordic Pulp. Pap. Res. J.
16(4), 284-290. DOI: 10.3183/NPPRJ-2001-16-04-p284-290
Harada, H. (1965). “Ultrastructure and organization of gymnosperm cell walls,” W. A.
Côté Jr. (ed.), Cellular Ultrastructure of Woody plants, Syracuse University Press,
Syracuse, New York, pp. 215-233.
Hayat, M. A. (2002). Microscopy, Immunohistochemistry, and Antigen Retrieval Methods
for Light and Electron Microscopy, Kluwer Academic Publishers, Hingham, MA.
DOI: 10.1007/b112626
PEER-REVIEWED REVIEW ARTICLE bioresources.com
Reza et al. (2015). “TEM wood fiber analysis review,” BioResources 10(3), 6230-6261. 6255
Hepler, P. K., and Newcombe, E. H. (1963). “The fine structure of young tracheary
elements arising by redifferentiation of parenchyma in wounded Coleus stem,” J.
Expl. Bot. 14(3), 496-503. DOI: 10.1093/jxb/14.3.496
Highley, T. L., Murmanis, L., and Palmer, J. G. (1983). “Electron microscopy of
cellulose decomposition by brown-rot fungi,” Holzforschung 37(6), 271-277. DOI:
10.1515/hfsg.1983.37.6.271
Hodge, A. J., and Wardrop, A. B. (1950). “An electron-microscopic investigation of the
cell-wall organization of conifer tracheids,” Nature 165(1490), 272-273. DOI:
10.1038/165272a0
Hult, E. L., Iversen, T., and Sugiyama, J. (2003). “Characterization of the supermolecular
structure of cellulose in wood pulp fibers,” Cellulose 10(2), 103-110. DOI:
10.1023/A:1024080700873
Hänninen, T., Kontturi, E., and Vuorinen, T. (2011). “Distribution of lignin and its
coniferyl alcohol and coniferyl aldehyde groups in Picea abies and Pinus sylvestris as
observed by Raman imaging,” Phytochem. 72(14-15), 1889-1895. DOI:
10.1016/j.phytochem.2011.05.005
Jiang, H., Ruokolainen, J., Young, N., Oikawa, T., Nasibulin, A. G., Kirkland, A., and
Kauppinen, E. I. (2012). “Performance and early applications of a versatile double
aberration-corrected JEOL-2200FS FEG TEM/STEM at Aalto University,” Micron
43(4), 545-550. DOI: 10.1016/j.micron.2011.10.004
Joseleau, J. P., Imai, T., Kuroda, K., and Ruel, K. (2004). “Detection in situ and
characterization of lignin in the G-layer of tension wood fibres of Populus deltoids,”
Planta 219(2), 338-345. DOI: 10.1007/s00425-004-1226-5
Joseleau, J. P., and Ruel, K. (1997). “Study of lignification by non invasive techniques in
growing maize internodes – An investigation by Fourier transform infrared, cross-
polarisation-magic angle spinning 13C-nuclear magnetic resonance spectroscopy,”
Plant Physiol. 114(3), 1123-1133. DOI: 10.1104/pp.114.3.1123
Kallavus, U., and Gravitis, J. (1995). “A comparative investigation of the ultrastructure of
steam exploded wood with light, scanning and transmission electron microscopy,”
Holzforschung 49(2), 182-188. DOI: 10.1515/hfsg.1995.49.2.182
Kerr, A. J., and Goring, D. A. I. (1975). “Ultrastructural arrangement of the wood cell
wall,” Cellul. Chem. Technol. 9(6), 563-573.
Khalil, H. S. A., Alwani, M. S., and Omar, A. K. M. (2006). “Chemical composition,
anatomy, lignin distribution, and cell wall structure of Malaysian plant waste fibers,”
BioResources 1(2), 220-232. DOI: 10.15376/biores.1.2.220-232
Khalili, S., Daniel, G., and Nilsson, T. (2000). “Use of soft rot fungi for studies on the
microstructure of kapok (Ceiba pentandra (L.) Gaertn.) fibre cell walls,”
Holzforschung 54(3), 229-233. DOI: 10.1515/HF.2000.039
Khalil, H. S. A., Yusra, A. F. I., Bhat, A. H., and Jawaid, M. (2010). “Cell wall
ultrastructure, anatomy, lignin distribution, and chemical composition of Malayasian
cultivated kenaf fiber,” Ind. Crops Prod. 31(1), 113-121. DOI:
doi:10.1016/j.indcrop.2009.09.008
Khristova, P., Bentcheva, S., and Karar, I. (1998). “Soda-AQ pulp blends from kenaf and
sunflower stalks,” Biores. Technol. 66(2), 99-103. DOI: 10.1016/S0960-
8524(98)00058-3
Kim, J. S., Awano, T., Yoshinaga, A., and Takabe, K. (2010a). “Immunolocalization and
structural variations of xylan in differentiating earlywood tracheid cell walls of
Cryptomeria japonica,” Planta 232(4), 817–824, DOI: 10.1007/s00425-010-1225-7

PEER-REVIEWED REVIEW ARTICLE bioresources.com
Reza et al. (2015). “TEM wood fiber analysis review,” BioResources 10(3), 6230-6261. 6256
Kim, J. S., Awano, T., Yoshinaga, A., and Takabe, K. (2010b). “Temporal and spatial
immunolocalization of glucomannans in differentiating earlywood tracheid cell walls
of Cryptomeria japonica,” Planta 232(2), 545-554. DOI: 10.1007/s00425-010-1189-
7
Kim, J. S., Awano, T., Yoshinaga, A., and Takabe, K. (2011). “Occurrence of xylan and
mannan polysaccharides and their spatial relationship with other cell wall components
in differentiation compression wood tracheids of Cryptomeria japonica,” Planta
233(4), 721-735. DOI: 10.1007/s00425-010-1333-4
Kim, Y. S., Choi, J. H., and Bae, H. J. (1992). “Ultrastructural localization of
extracellular fungal metabolites from Tyromyces palustris using TEM (transmission
electron microscopy) and immunogold labeling,” Mokuzai Gakkaishi 38(5), 490-494.
Kim, Y. S., Goodell, B., and Jellison, J. (1993). “Immunogold labeling of extracellular
metabolites from the white-rot fungus Trametes versicolor,” Holzforschung 47(1),
25-28. DOI: 10.1515/hfsg.1993.47.1.25
Kim, Y. S., Lee, K. H., Kim, J. K., and Singh, A. P. (2014). “Lignin masks the presence
of fibrillar network structure in the cell corner middle lamella (CCML),”
Holzforschung 69(1), 121-126. DOI: 10.1515/hf-2014-0032
Kim, Y. S., and Singh, A. P. (1999). “Micromorphological characteristics of compression
wood degradation in waterlogged archeological pine wood,” Holzforschung 53(4),
381-385. DOI: 10.1515/HF.1999.063
Koch, G., and Schmitt, U. (2013). Cellular Aspects of Wood Formation, J. Fromm (ed.),
Springer, New York.
Krässig, H. A. (1993). Cellulose - Structure, Accessibility and Reactivity, Gordon and
Breach Science Publishers, Yverdon, Switzerland.
Kukkola, E. M., Koutaniemi, S., Gustafsson, M., Karhunen, P., Ruel, K., Lundell, T. K.,
Saranpää, P., Brunow, G., Teeri, T. H., and Fagerstedt, T. V. (2003). “Localization of
dibenzodioxocin substructures in lignifying Norway spruce xylem by transmission
electron microscopy-immunogold labeling,” Planta 217(2), 229-237. DOI:
10.1007/s00425-003-0983-x
Kuo, J. (2007). Electron Microscopy: Methods and Protocols, Humana Press Inc., New
Jersey, USA.
Lautner, S., Zollfrank, C., and Fromm, J. (2012). “Microfibril angle distribution of poplar
tension wood,” IAWA J. 33(4), 431-439. DOI: 10.1163/22941932-90000105
Lehringer, C., Daniel, G., and Schmitt, U. (2009) TEM/FE-SEM studies on tension wood
fibres of Acer spp., Fagus sylvatica L. and Quercus robur L.,” Wood Sci. Technol.
43(7-8), 691-702. DOI: 10.1007/s00226-009-0260-7
Lei, X., Zhao, Y., Li, K., and Pelletier, A. (2012). “Improved surface properties of CTMP
fibers with enzymatic pretreatment of wood chips prior to refining,” Cellulose 19(6),
2205-2215. DOI: 10.1007/s10570-012-9792-3
Lequart, C., Ruel, K., Lapierre, C., Pollet, B., and Kurek, B. (2000). “Abiotic and
enzymatic degradation of wheat straw cell wall: A biochemical and ultrastructural
investigation,” J. Biotechnol. 80(3), 249-259. DOI: 10.1016/S0168-1656(00)00267-4
Lichtenegger, H., Muller, M., Paris, O., Riekel, C., and Fratzl, P. (1999). “Imaging of the
helical arrangement of cellulose fibrils in wood by synchrotron X-ray
microdiffraction,” J. Appl. Crystallogr. 32(6), 1127-1133. DOI:
10.1107/S0021889899010961
Manley, R. S. J. (1964). “Fine structure of native cellulose microfibrils,” Nature
204(4964), 1155-1157. DOI: 10.1038/2041155a0

PEER-REVIEWED REVIEW ARTICLE bioresources.com
Reza et al. (2015). “TEM wood fiber analysis review,” BioResources 10(3), 6230-6261. 6257
Marchetti, V., Ghanbaja, P., and Loubinoux, B. (2000). “Localization and
characterization by TEM and EELS of manganese species during graft
copolymerization of acrylic acid onto sawdust using KMnO4 as initiator,”
Holzforschung 54(5), 553-556. DOI: 10.1515/HF.2000.093
Maurer, A., and Fengel, D. (1990). “A new process for improving the quality and lignin
staining of ultrathin sections from wood tissues,” Holzforschung 44(6), 453-460.
DOI: 10.1515/hfsg.1990.44.6.453
Maurer, A., and Fengel, D. (1991). “Electron microscopic representation of structural
details in softwood cell walls by very thin ultramicrotome sections,” Holz Roh-
Werkstoff 49(2), 53-56. DOI: 10.1007/BF02662800
Ma, J. F., Yang, G. H., Mao, J. Z., and Xu, F. (2011b). “Characterization of anatomy,
ultrastructure and lignin microdistribution in Forsythia suspensa,” Ind. Crops Prod.
33(2), 358-363. DOI: 10.1016/j.indcrop.2010.11.009
Ma, J., Zhang, Z., Yang, G., Mao, J., and Xu, F. (2011a). “Ultrastructural topochemistry
of cell wall polymers in Populus nigra by transmission electron microscopy and
Raman imaging,” BioResources 6(4), 3944-3959. DOI:
Michler, G.H. (2008). Electron Microscopy of Polymers, Springer-Verlag, Berlin,
Germany. DOI: 10.1007/978-3-540-36352-1
Molin, U., and Daniel, G. (2004). “Effects of refining on the fiber structure of kraft pulps
as revealed by FE-SEM and TEM: Influence of alkaline degradation,” Holzforschung
58(3), 226-232. DOI: 10.1515/HF.2004.035
Mueller, S. C., and Brown, J. R. M. (1980). “Evidence for an intramembrane component
associated with a cellulose microfibril-synthesizing complex in higher plants,” J. Cell
Biol. 84(2), 315-326. DOI: 10.1083/jcb.84.2.315
Mühlethaler, K. (1949). “Electron micrographs of plant fibers,” Biochim. Biophys. Acta
3(), 15-25. DOI: 10.1016/0006-3002(49)90075-X
Mühlethaler, M. (1969). “Fine structure of natural polysaccharide systems,” J. Polym.
Sci.. 28(1), 305-316. DOI: 10.1002/polc.5070280124
Nicole, M., Chamberland, H., Geiger, J. P., Lecours, N., Valero, J., Rio, B., and
Ouellette, G. B. (1992). “Immunocytochemical localization of laccase L1 in wood
decayed by Rigidoporus lignosus,” Appl. Environ. Microbiol. 58(5), 1727-1739.
Nishiyama, Y., Langan, P., and Chanzy, H. (2002). “Crystal structure and hydrogen-
bonding system in cellulose Iβ from synchrotron x-ray and neutron fiber diffraction,”
J. Am. Chem. Soc. 124(31), 9074-9082. DOI: 10.1021/ja0257319
Norberg, P. H., and Meier, H. (1966). “Physical and chemical properties of the gelatinous
layer in tension wood fibers of aspen (Populus tremula L.),” Holzforschung 20(6),
174-178. DOI: 10.1515/hfsg.1966.20.6.174
Northcote, D. H., and Lamport, D. T. A. (1960). “Hydroxyproline in primary walls of
higher plants,” Nature 188(4751), 665-666. DOI: 10.1038/188665b0
O'Sullivan, A. C. (1997). “Cellulose: The structure slowly unravels,” Cellulose 4(3), 173-
207. DOI: 10.1023/A:1018431705579
Paszczynski, A., Blanchette, R. L., and Crawford, R. A. (1988). “Delignification of wood
chips and pulps by using natural and synthetic porphyrins: Models of fungal
decay,”Appl. Environ. Microbiol.54(1), 62-68.
Pedersen, N. B., Schmitt, U., Koch, G., Felby, C., and Thygesen, L. G. (2014). “Lignin
distribution in waterlogged archaeological Picea abies (L.) Karst degraded by erosion
bacteria,” Holzforschung 68(7), 791-798. DOI: 10.1515/hf-2013-0228
PEER-REVIEWED REVIEW ARTICLE bioresources.com
Reza et al. (2015). “TEM wood fiber analysis review,” BioResources 10(3), 6230-6261. 6258
Peura, M., Müller, M., Vainio, U., Sarén, M. P., Saranpää, P., and Serimaa, R. (2008).
”X-ray microdiffraction reveals the orientation of cellulose microfibrils and the size
of cellulose crystallites in single Norway spruce tracheids,” Trees 22(1), 49-61. DOI:
10.1007/s00468-007-0168-5
Pilate, G., Chabbert, B., Cathala, B., Yoshinaga, A., Leplé, J. C., Laurans, F., Lapierre,
C., and Ruel, K. (2004). “Lignification and tension wood,” C. R. Biol. 327(9-10),
889-901. DOI: 10.1016/j.crvi.2004.07.006
Preston, R. D., Nicolai, E., Reed, R., and Millard, A. (1948). “An electron microscope
study of cellulose in the wall of Valonia ventricosa,” Nature 162, 665-667. DOI:
10.1038/162665a0
Preston, R. D., and Ripley, G. W. (1954). “Electron diffraction diagrams of cellulose
micro-fibrils in Valonia,” Nature 174, 76-77. DOI:10.1038/174076a0
Prislan, P., Koch, G., Cufar, K., Gricar, J., and Schmitt, U. (2009). “Topochemical
investigations of cell walls in developing xylem of beech (Fagus sylvatica L.),”
Holzforschung 63(4), 482-490. DOI: 10.1515/HF.2009.079
Prodhan, A. K. M. A., Ohtani, J., Funada, R., Abe, H., and Fukazawa, K. (1995).
“Ultrastructural investigation of tension wood fiber in Fraxinus mandshurica Rupr.
var. japonica Maxim,” Ann. Bot. 75(3), 311-317. DOI: 10.1006/anbo.1995.1026
Raghavan, R., Adusumalli, R. B., Buerki, G., Hansen, S., Zimmermann, T., and Michler,
J. (2012). “Deformation of the compound middle lamella in spruce latewood by
micro-pillar compression of double cell walls,” J. Mater. Sci. 47(16), 6125-6130.
DOI: 10.1007/s10853-012-6531-y
Rapp, A. O., Bestgen, H., Adam, W., and Peek, R. D. (1999). “Electron energy loss
spectroscopy (EELS) for quantification of cell-wall penetration of a melamine resin,”
Holzforschung 53(2), 111-117. DOI: 10.1515/HF.1999.018
Rehbein, M., Koch, G., Schmitt, U., and Huckfeldt, T. (2013). “Topochemical and
transmission electron microscopic studies of bacterial decay in pine (Pinus sylvestris
L.) harbor foundation piles,” Micron 44, 150-158. DOI:
10.1016/j.micron.2012.05.012
Revol, J.-F. (1985). “Change of the d spacing in cellulose crystals during lattice
imaging,” J. Mater.Sci. Lett. 4(11), 1347-1349. DOI: 10.1007/BF00720097
Reza, M., Rojas, L. G., Kontturi, E., Vuorinen, T., and Ruokolainen, J. (2014a).
“Accessibility of cell wall lignin in solvent extraction of ultrathin spruce wood
sections,” ACS Sustainable Chem. Eng. 2(4), 804-808. DOI: 10.1021/sc400470m
Reza, M., Ruokolainen, J., and Vuorinen, T. (2014b). “Out-of-plane orientation of
cellulose elementary fibrils on spruce tracheid wall based on imaging with high-
resolution transmission electron microscopy,” Planta 240(3), 565-573. DOI:
10.1007/s00425-014-2107-1
Roelofsen, P. A. (1959). The Plant Cell Wall, Borntraeger, Berlin, Germany. DOI:
10.1016/0003-9861(61)90372-1
Ruel, K., Burlat, V., and Joseleau, J. P. (1999). “Relationship between ultrastructural
topochemistry of lignin and wood properties,” IAWA J. 20(2), 203-211. DOI:
10.1163/22941932-90000681
Ruel, K., Nishiyama, Y., and Joseleau, J. P. (2012). “Crystalline and amorphous cellulose
in the secondary walls of Arabidopsis,” Plant Sci. 193, 48-61. DOI:
0.1016/j.plantsci.2012.05.008
Ruska, E. (1934). “Uber Fortschritte im Bau und in der Leistung des magnetischen
Elektronenmikroskops (On the progress in the construction and performance of the
PEER-REVIEWED REVIEW ARTICLE bioresources.com
Reza et al. (2015). “TEM wood fiber analysis review,” BioResources 10(3), 6230-6261. 6259
magnetic electron microscope),” Z. Phys. 87(9-10), 580-602. DOI:
10.1007/BF01333326
Råberg, U., and Daniel, G. (2009). “Brown rot decay of copper-chromated-phosphorus
impregnated fence poles: Characterization by molecular analysis and microscopy,”
Int. Biodeterior. Biodegrad. 63(7), 906-912. DOI: doi:10.1016/j.ibiod.2009.04.009
Saito, T., Nishiyama, Y., Putaux, J. L., Vignon, M., and Isogai, A. (2006).
“Homogeneous suspensions of individualized microfibrils from TEMPO-catalyzed
oxidation of native cellulose,” Biomacromol. 7(6), 1687-1691. DOI:
10.1021/bm060154s
Saka, S., and Goring, D. A. I. (1988). “The distribution of lignin in white birch wood as
determined by bromination with TEM-EDXA,” Holzforschung 42(3), 149-153. DOI:
10.1515/hfsg.1988.42.3.149
Sandquist, D., Filonova, L., von Schantz, L., Ohlin, M., and Daniel, G. (2010).
“Microdistribution of xyloglucan in differentiating poplar cells,” BioResources 5(2),
796-807. DOI: 10.15376/biores.5.2.796-807
Sawyer, L. C., Grubb, D. T., and Meyers, G. F. (2008). Polymer Microscopy, 3rd Edition,
Springer, New York.
Saxe, F., Eder, M., Benecke, G., Aichmayer, B., Fratzl, P., Burgert, I., and Rüggeberg,
M. (2014). “Measuring the distribution of cellulose microfibril angles in primary cell
walls by small angle X-ray scattering,” Plant Methods 10(1), 25-32. DOI:
10.1186/1746-4811-10-25
Scurfield, G. (1973). “Reaction wood: Its structure and function: Lignification may
generate the force active in restoring the trunks of leaning trees to the vertical,”
Science 179(4074), 647-655. DOI: 10.1126/science.179.4074.647
Singh, A. P., and Daniel, G. (2001). “The S2 layer in the tracheid walls of Picea abies
wood: inhomogeneity in lignin distribution and cell wall microstructure,”
Holzforschung 55(4), 373-378. DOI: 10.1515/HF.2001.062
Singh, A., Daniel, G., and Niisson, T. (2002a). “Ultrastructure of the S2 layer in relation
to lignin distribution in Pinus radiata tracheids,” J. Wood Sci. 48(2), 95-98. DOI:
10.1007/BF00767284
Singh, A., Daniel, G., and Nilsson, T. (2002b). “High variability in the thickness of the
S3 layer in Pinus radiata tracheids,” Holzforschung 56(2), 111-116. DOI:
10.1515/HF.2002.019
Singh, A. P., Kim, Y. S., Chung, G. C., Park, B. D., and Wong, A. H. H. (2003). “TEM
examination of surface characteristics of rubberwood (Hevea brasiliensis) HTMP
fibers,” Holzforschung 57(6), 579-584. DOI: 10.1515/HF.2003.087
Singh, A. P., Sell, J., Schmitt, U., Zimmermann, T., and Dawson, B. (1998). “Radial
striation of the S2 layer in mild compression wood tracheids of Pinus radiata,”
Holzforschung 52(6), 563-566. DOI: 10.1515/hfsg.1998.52.6.563
Solala, I., Antikainen, T., Reza, M., Johansson, L. S., Hughes, M., and Vuorinen, T.
(2013). “Spruce fiber properties after high-temperature thermomechanical pulping
(HT-TMP),” Holzforschung 68(2), 195-201. DOI: 10.1515/hf-2013-0083
Spurr, A. R. (1969). “A low viscosity embedding medium for electron microscopy,” J.
Ultrastruct. Res. 26(1-2), 31-43. DOI: 10.1016/S0022-5320(69)90033-1
Streit, W., and Fengel, F. (1994). “Heartwood formation in Quebracho colorado
(Schinopsis balansae Engl.): Tannin distribution and penetration of extractives into
the cell wall,” Holzforschung 48(5), 361-367. DOI: 10.1515/hfsg.1994.48.5.361

PEER-REVIEWED REVIEW ARTICLE bioresources.com
Reza et al. (2015). “TEM wood fiber analysis review,” BioResources 10(3), 6230-6261. 6260
Studer, D., and Gnaegi, H. (2000). “Minimal compression of ultrathin sections with use
of an oscillating diamond knife,” J. Microsc. 197(1), 94-100. DOI: 10.1046/j.1365-
2818.2000.00638.x
Sugiyama, J., Harada, H., Fujiyoshi, Y., and Uyeda, N. (1985). “Lattice images of
cellulose microfibrils,” Denshi Kenbikyö 20, 143-147.
Sugiyama, J., Otsuka, Y. Murase, H., and Harada, H. (1986). “Toward direct imaging of
cellulose microfibrils in wood,” Holzforschung 40(Suppl.), 31-36.
Sugiyama, J., Persson, J., and Chanzy, H. (1991a). “Combined infrared and electron
diffraction study of the polymorphism of native celluloses,” Macromol. 24(9), 2461-
2466. DOI: 10.1021/ma00009a050
Sugiyama, J., Vuong, R., and Chanzy, H. (1991b). “Electron diffraction study on the two
crystalline phases occurring in native cellulose from an algal cell wall,” Macromol.
24(14), 4168-4175. DOI: 10.1021/ma00014a033
Terashima, N., and Fukushima, K. (1988). “Heterogeneity in formation of lignin-XI: An
autoradiographic study of the heterogeneous formation and structure of pine lignin,”
Wood Sci. Technol. 22(3), 259-270. DOI: 10.1007/BF00386021
Timell, T. E. (1973). “Studies on opposite wood in conifers. Part III: Distribution of
lignin,” Wood Sci. Technol. 7(3), 163-172. DOI: 10.1007/BF00355547
Timell, T. E. (1982). “Recent progress in the chemistry and topochemistry of
compression wood,” Wood Sci. Technol. 16(2), 83-122. DOI: 10.1007/BF00351097
Trtik, P., Dual, J., Keunecke, D., Mannes, D., Niemz, P., Stähli, P., Kaestner, A., Groso,
A., and Stampanoni, M. (2007). “3D imaging of microstructure of spruce wood,” J.
Struct. Biol. 159(1), 46-55. DOI: 10.1016/j.jsb.2007.02.003
Wada, M., Okano, T., Sugiyama, J., and Horii, F. (1995). “Characterization of tension
and normally lignified wood cellulose in Populus maximowiczii,” Cellulose 2(4), 223-
233. DOI: 10.1007/BF00811814
Wallstörm, L., and Lindberg, K. A. H. (2000). “Distribution of added chemicals in the
cell walls of high temperature dried and green wood of Swedish pine, Pinus
sylvestries,” Wood Sci. Technol. 34(4), 327-336. DOI: 10.1007/s002260000050
Wardrop, A. B. (1954). “The fine structure of the conifer tracheid,” Holzforschung 8(1),
12-29. DOI: 10.1515/hfsg.1954.8.1.12
Wardrop, A. B. (1957). “The organization and properties of the outer layer of the
secondary wall in conifer tracheids,” Holzforschung 11(4), 102-110. DOI:
10.1515/hfsg.1957.11.4.102
Westermark, U., Lidbrandt, O., and Eriksson, I. (1988). “Lignin distribution in spruce
(Picea abies) determined by mercurization with SEM-EDXA technique,” Wood Sci.
Technol. 22(3), 243-250. DOI: 10.1007/BF00386019
Williams, D. B., and Carter, C. B. (2009). Transmission Electron Microscopy: A
Textbook for Materials Science, 2nd Edition, Springer, New York.
Xu, P., Donaldson, L. A., Gergely, Z. R., and Staehelin, L. A. (2007). “Dual-axis electron
tomography: a new approach for investigating the spatial organization of wood
cellulose microfibrils,” Wood Sci. Technol. 41(2), 101-116. DOI: 10.1007/s00226-
006-0088-3
Xu, F., Sun, R. C., Lu, Q., and Jones, G. L. (2006b). “Comparative study of anatomy and
lignin distribution in normal and tension wood of Salix gordejecii,” Wood Sci.
Technol. 40(5), 358-370. DOI: 10.1007/s00226-005-0049-2

PEER-REVIEWED REVIEW ARTICLE bioresources.com
Reza et al. (2015). “TEM wood fiber analysis review,” BioResources 10(3), 6230-6261. 6261
Xu, F., Zhong, X. C., Sun, R. C., and Lu, Q. (2006a). “Anatomy, ultrastructure and lignin
distribution in cell wall of Caragana Korshinskii,” Ind. Crops Prod. 24(2), 186-193.
DOI: 10.1016/j.indcrop.2006.04.002
Yoshida, M., Ohta, H., and Okuyama, T. (2002). “Tensile growth stress and lignin
distribution in the cell walls of black locust (Robinia pseudoacacia),” J. Wood Sci.
48(2), 99-105. DOI: 10.1007/BF00767285
Yoshinaga, A., Kusumoto, H., Laurans, F., Pilate, G., and Takabe, K. (2012).
“Lignification in poplar tension wood lignified cell wall layers,” Tree Physiol. 32(9),
1129-1136. DOI: 10.1093/treephys/tps075
Zimmermann, T., and Sell, J. (2003). “Field emission SEM studies on softwood tracheids
and hardwood fibres-A review of activities at the EMPA wood laboratory,” Schweiz.
Z. Forstwes. 154(12), 510-515. DOI: 10.3188/szf.2003.0510
Zimmermann, T., Thommen, V., Reimann, P., and Hug, H. J. (2006). “Ultrastructural
appearance of embedded and polished wood cell walls as revealed by atomic force
microscopy,” J. Struct. Biol. 156(2), 363-369. DOI: 10.1016/j.jsb.2006.06.007
Article submitted: February 27, 2015; Peer review completed: May 15, 2015; Revised
version received and accepted: July 7, 2015; Published: July 21, 2015.
DOI: 10.15376/biores.10.3.