peer-reviewed article bioresources...peer-reviewed article bioresources.com oleszek et al. (2018)....
TRANSCRIPT

PEER-REVIEWED ARTICLE bioresources.com
Oleszek et al. (2018). “Biogas from energy crops,” BioResources 13(4), 8505-8528. 8505
Determination of the Efficiency and Kinetics of Biogas Production from Energy Crops through Nitrogen Fertilization Levels and Cutting Frequency Marta Oleszek a,* and Mariusz Matyka b
The efficiency and kinetics of methane fermentation were evaluated for six energy crops when cultivated at three different nitrogen (N) fertilization levels, specifically, maize, sorghum, sunflower, triticale, reed canary grass (RCG), and Virginia mallow (VM). In the case of the perennials, RCG and VM, the impacts of individual swath and cutting frequency were examined. A new model for predicting the methane yield based on the substrate chemical composition was developed and validated. A raised N fertilization dose increased the biogas, methane yield, and the specific rate of their production. The highest increase in methane yield was observed in VM from 145 to 197 dm3 kg-1 of volatile solids (VS) due to a 15% rise in biodegradability. This resulted from a decrease in the lignin content and favorable changes in the lignin to structural carbohydrates ratio. Moreover, in the case of perennials, more efficient biogas production was observed for the biomass collected at an earlier stage. The results in this investigation are important for the production of high-quality biomass for biogas plants, without competition for arable land areas with food and feed production.
Keywords: Methane fermentation kinetics; Nitrogen fertilization level; Reed canary grass;
Virginia mallow; Biochemical Methane Potential (BMP) model
Contact information: a: Institute of Agrophysics, Polish Academy of Sciences, Doświadczalna 4, 20-290
Lublin, Poland; b: Institute of Soil Sciences and Plant Cultivation, State Research Institute, Czartoryskich
8, 24-100 Pulawy, Poland; *Corresponding author: [email protected]
INTRODUCTION
Energy crops have become the most relevant type of substrate for biogas
production, due to their high methane yield, constant availability, and the possibility of
easy storage in the form of silage. Furthermore, biomass of energy crops is homogenous
and generally free from pathogens. Additionally, ensiled plant biomass does not undergo
seasonal changes, in contrast to some kinds of waste (Drosg et al. 2013). This applies
especially to maize (Zea mays L.), which is currently the most important substrate for
biogas production in Central Europe (Herrmann 2013). However, its high proportion in
biogas crop rotation systems (over 45%) carries a potential risk for negative environmental
impacts (soil erosion, loss of biodiversity, and leaching of nitrate) as well as a low aesthetic
value (Svoboda et al. 2013; Von Cossel et al. 2017). The diversity of biogas crop rotation
systems is recommended to mitigate these negative impacts (Von Cossel et al. 2017). It is
commonly understood that the cultivation of energy crops should not compete with arable
land areas for food and feed production (Oleszek and Matyka 2017). Therefore, the
achievement of a high biomass yield and simultaneously maintaining its good quality is a
challenge today (Krzemińska and Oleszek 2016). High nitrogen (N) fertilization is
PEER-REVIEWED ARTICLE bioresources.com
Oleszek et al. (2018). “Biogas from energy crops,” BioResources 13(4), 8505-8528. 8506
frequently applied to elevate the yield of plants because this element is essential for proper
plant development and growth. Wu et al. (1993) indicates that nitrogen is the most
significant nutrient in increasing plant height. Moreover, nitrogen is an important part of
chlorophyll, which is a molecule that absorbs solar energy for photosynthesis (Kaplan et
al. 2016).
The issue of N fertilization has been explored in studies on biogas production, but
mainly in the aspect of increasing biomass yield, and thus, biogas and energy productivity
per unit area. Effect of N fertilizer doses on the chemical composition of energy crops,
which could affect biogas production, appears to be neglected (Oleszek and Matyka 2017).
There have been few studies on the influence of N fertilization levels on the efficiency of
the methane fermentation process when it is used in the cultivation of energy crops as later
substrates. Von Cossel et al. (2017) studied the effect of increased N fertilization levels on
the methane fermentation of amaranth, and they did not state any significant influence on
the specific methane yield and content of important biomass components such as lignin,
nitrogen, and ash. In contrast, Kaplan et al. (2016) investigated the impact of three different
nitrogen levels on the quality of maize as a feed for livestock, its digestibility, and its gas
production during fermentation with rumen fluid. The results of the study showed that a
raised N fertilization level increased the cobs/stems ratio and decreased the neutral
detergent fiber (NDF) and acid detergent fiber (ADF) content in biomass. These chemical
changes caused the increase in gas production and maize digestibility. Other reports on this
issue are often divergent, and they do not explain the reasons for the recorded effects. One
of the reports indicate that a decrease in the biogas yield from the silage of meadow plants
is caused by raised nitrogen levels, which causes an increase in crude protein (CP)
(Gröblinghoff and Lütke Entrup 2006). In contrast, Kacprzak et al. (2012) observed a
decline in the specific biogas yield from reed canary grass (RCG) after the application of
N fertilization at a dose of 120 kg ha-1, compared to the lower doses of 40 and 80 kg ha-1.
The authors suggest that this finding is potentially caused by an increase in the lignin
content. Massé et al. (2011) also notes a decrease in the specific biogas yield from RCG
with an increase in nitrogen levels from 40 to 160 kg N ha-1. As a potential reason of this
phenomenon, Massé et al. (2011) states that the increase in proteins and lignin is caused
by high nitrogen dose applications. The content of the mentioned components was not
investigated in these papers. Additionally, these assumptions were contrary to the results
of Kaplan et al. (2016) and Oleszek and Matyka (2017), who report a decline in the fiber
fractions and lignin content caused by the highest nitrogen level application.
The dependence of biogas yield on the chemical components has been the subject
of many studies. Many models have been developed that predict the methane yield using
the chemical properties of feedstock. In many cases, lignin is considered the main inhibitor
of methane production (Triolo et al. 2011; Dandikas et al. 2014; Thomsen et al. 2014). A
negative correlation with biogas yield was also found for ash and proteins (Goliński and
Jokś 2007). Nonetheless, there is no universal model for all of the substrates (Tsavkelova
and Netrusov 2012).
In this study it was hypothesized that the N fertilization level and cutting frequency
will significantly affect the methane fermentation efficiency and kinetics due to their
influence on the chemical composition of the tested crops. Therefore, the goal of this study
was to evaluate the impact of the N fertilization level of six energy crops: maize, sorghum,
sunflower, triticale, reed canary grass (RCG), and Virginia mallow (VM), on the specific
biogas and methane yield as well as on the kinetics parameters. In the case of RCG and
VM, the impact of the individual swath and cutting frequency were also tested.

PEER-REVIEWED ARTICLE bioresources.com
Oleszek et al. (2018). “Biogas from energy crops,” BioResources 13(4), 8505-8528. 8507
EXPERIMENTAL
Materials and Methods Field experiments
Field experiments on this subject matter are described in detail by Oleszek and
Matyka (2017). The tested plants were cultivated at the Experimental Station of Institute
of Soil Science and Plant Cultivation in Osiny, Poland (N: 51 27´, E: 21 39´) and Jelcz-
Laskowice, Poland (N: 51 2´ E: 17 21´) starting in 2012 through 2014 in a randomized
complete block design (a "split-plot" system) with four replicates. Three doses of N
fertilization in the form of ammonium nitrate, which is the fastest-acting form of nitrogen,
were applied: 40, 80, and 160 kg N ha-1 in the case of sunflower (Helianthus annuus L.
var. Kornelka), triticale (x Triticosecale Wittm. ex A. Camus. var. Leontino), reed canary
grass (RCG) (Phalaris arundinacea L. var. Bamse), and Virginia mallow (VM) (Sida
hermaphrodita L.); and doses of 80, 120, and 160 kg N ha-1 in the case of maize (Zea Mays
L. var. Ułan) and sorghum (Sorghum bicolor L. var. Rona 1). The VM was harvested twice
in a two-cut system (VM II C), and RCG was harvested twice and thrice in a two-cut (RCG
II C) and a three-cut (RCG III C) system, and the differences between swaths were
determined. After harvest, the plant material was combined, fragmented, and ensiled in
plastic barrels with a volume of 5 L, and stored in the dark until their later use. Ensiling
was conducted at ambient temperature for at least two months to ensure proper material
preservation. To evaluate the effectiveness of ensiling, value of pH was determined. The
sample of silage was blended with water in the proportion of 1:1 and filtered after 2 h.
Subsequently, the pH was measured by CyberScan 6000 Series Meters (Eutech Instruments
Pte Ltd, Singapore).
Methane fermentation
Methane fermentation was conducted according to the VDI 4630 (2006) protocol.
Post fermentation sludge from a mesophilic, agricultural biogas plant that utilized maize
silage, beet pulp, and whey was used as the inoculum. The inoculum was
characterized by total solid (TS) content of 3.0%, a volatile solid (VS) content of 66.5%
TS, and a pH of 7.5. The process parameters were as follows: temperature 37 °C, pH of
approximately 7, total solids (TS) concentration of 40 g L-1, substrate to inoculum ratio
(S/I) of 1:1 (based on the VS), and a working volume of 0.8 L. The fermenters’ content
was mixed once a day, and the biogas volume and methane concentration were determined
according to the method described by Oleszek et al. 2016. The fermentation was finished
when the daily biogas volume was lower than 1% of the total biogas volume (total
fermentation time (tt)). The batch assays were performed in triplicate for each tested silage
and the inoculum as a control. Next, the biogas yield of tested samples was corrected by
subtraction of inoculum biogas yield.
Based on the chemical composition of the biomass investigated previously
(Oleszek and Matyka 2017), the theoretical methane yield (TMY) and biodegradability
(BD) were calculated as in Chen et al. (2014), examples of which are shown in Eqs. 1 and
2,
TMY (dm3 kg-1 VS) = 415 × CL + 424 × HCL + 727 × ADL + 496
× CP + 1014 × CF + 415 × NFC (1)
BD (%) = EMY/TMY (2)

PEER-REVIEWED ARTICLE bioresources.com
Oleszek et al. (2018). “Biogas from energy crops,” BioResources 13(4), 8505-8528. 8508
where EY is the empirical methane yield (dm3 kg-1 VS), TMY is the theoretical methane
yield (dm3 kg-1 VS), CL is the cellulose (% TS), HCL is the hemicelluloses (% TS), ADL
is the acid detergent lignin (% TS), CP is the crude protein (% TS), CF is the crude fat (%
TS), NFC is the non-fiber carbohydrates (% TS), and BD is the biodegradability (%).
Statistical analysis
Statistical analysis was performed in STATISTICA 12 software (Stat Soft Inc.,
Tulsa, OK, USA). For all of the tested parameters, the mean and standard error (SE) from
the three replications were determined. Both Shapiro-Wilk and Lillefors tests were used to
evaluate the normality of the data, while Levene’s test confirmed the equality of the
variances. The significance of the differences between the tested energy crops and swaths
within the same N fertilization level, as well as between the particular N fertilization level
within one energy crop species and swath, were evaluated by a one-way analysis of
variance (ANOVA) and Tukey’s post hoc test. For determining the significance of the
differences between all of the tested samples, the two-way ANOVA and the Tukey’s post
hoc test were applied.
The kinetic parameters, such as the length of the lag phase (λ), the specific biogas
production rate (μm), and the theoretical maximum biogas yield after time tt (A), were
determined using non-linear estimation and the Gompertz equation, as shown in Eq. 3,
𝑦 = 𝐴 𝑒𝑥𝑝 {−𝑒𝑥𝑝 [𝜇𝑚𝑒
𝐴(𝜆 − 𝑡) + 1]} (3)
where y is the experimental biogas yield after time t (dm3 kg-1 VS), A is the theoretical
maximum biogas yield after time tt (dm3 kg-1 VS), λ is the length of the lag phase (d), µm
is the specific biogas production rate (dm3 kg-1 VS d-1), t is the time (d), and e is the Euler
constant = 2.71. The sample size was different for individual crops and depended on total
time of the methane fermentation process (number of days multiplied by three replicates
of batch test for each sample).
To explain the influence of the N fertilization level and swath on the efficiency and
kinetics of the methane fermentation process, the correlation coefficients (R) between the
biogas yield, methane yield, methane content or particular kinetics parameters, and all of
the chemical properties were determined. Next, simple linear regression and successive
stepwise regression analyses were performed with statistically significant variables. The
relative root mean square error (RRMSE), the square of the sample determination
coefficient (R2), and the p value were used to assess the accuracy of the model.
The best model was validated based on the results previously presented by Oslaj et
al. (2010), Menardo et al. (2012), Mahmood and Honermeier (2012), and Li et al. (2013),
using scatter plots of the experimental methane yield (EMY) versus the predicted methane
yield (PMY).
RESULTS
The results showed that both the N fertilization level and cutting frequency significantly
determined methane fermentation efficiency and kinetics (p < 0.05). The species of energy
crops had the highest impact on specific methane yield and kinetic parameters, which was
reflected in the greatest F values from ANOVA (Tables 1 and 3).
PEER-REVIEWED ARTICLE bioresources.com
Oleszek et al. (2018). “Biogas from energy crops,” BioResources 13(4), 8505-8528. 8509
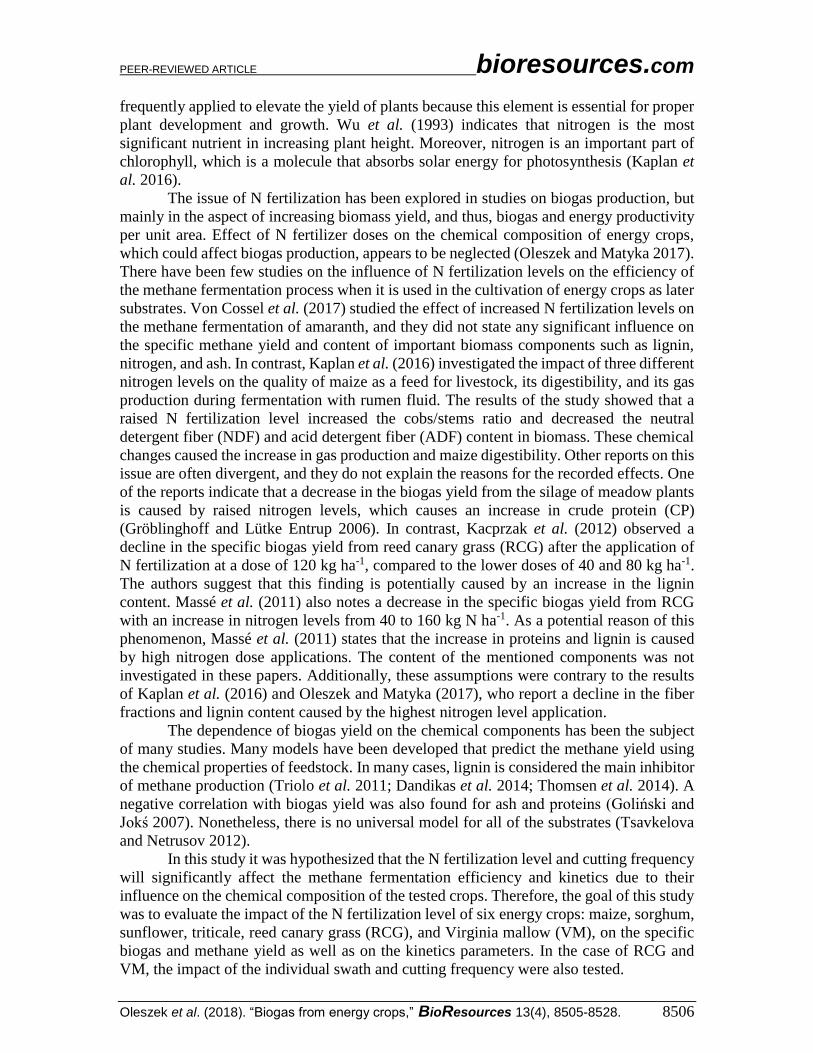
Table 1. Biogas Yield, Methane Yield, Methane Content, and Biodegradability Depended on the Species and Nitrogen Fertilization Level
EBY* (dm3 kg-1 VS)
EMY (dm3 kg-1 VS)
CH4
in biogas (%) TMY
(dm3 kg-1 VS) BD (%)
Species
Maize 471 ± 14 d** 272 ± 7 c 58 ± 1 d 437 ± 1 c 62.2 ± 1.5 b
Sunflower 334 ± 11 bc 160 ± 5 b 48 ± 1 a 484 ± 4 a 33.0 ± 0.7 e
Sorghum 562 ± 14 e 310 ± 7 d 55 ± 1 c 448 ± 1 b 69.2 ± 1.6 a
Triticale 262 ± 14 a 129 ± 5 a 49 ± 1 a 428 ± 1 d 30.2 ± 1.2 e
RCG II C 342 ± 8 bc 167 ± 4 b 49 ± 1 a 427 ± 2 d 39.2 ± 1.1 d
RCG III C 359 ± 8 c 176 ± 4 b 49 ± 0 a 426 ± 1 d 48.2 ± 1.6 c
VM 315 ± 18 b 165 ± 9 b 53 ± 1 b 345 ± 2 e 39.7 ± 2.6 d
p value 0.0000 0.0000 0.0000 0.0000 0.0000
F 132.15 203.12 57.55 2000.00 169.42
N Fertilization Level
N I 352 ± 23 a 187 ± 15 a 53 ± 1 b 425 ± 8 b 43.5 ± 3.3 a
N II 371 ± 22 a 193 ± 13 a 51 ± 1 a 429 ± 9 a 45.1 ± 3.0 b
N III 410 ± 22 b 211 ± 14 b 50 ± 1 a 429 ± 9 a 49.3 ± 3.2 b
p value 0.0000 0.0000 0.0000 0.0002 0.0000
F 26.12 15.88 13.81 10.87 15.89
Species × N Fertilization Level
Maize
N I 470 ± 14 ab 275 ± 13 ab 59 ± 2 a 441 ± 0 62.5 ± 2.9
N II 429 ± 14 a 251 ± 6 a 58 ± 1 a 432 ± 1 58.1 ± 1.4
N III 514 ± 2 b 289 ± 4 b 56 ± 1 a 438 ± 0 65.9 ± 1.0
Sunflower
N I 293 ± 6 a 143 ± 3 a 49 ± 0 b 470 ± 2 30.5 ± 0.6
N II 342 ± 7 b 171 ± 5 b 50 ± 0 b 491 ± 1 34.8 ± 1.0
N III 367 ± 2 b 166 ± 1 b 45 ± 0 a 490 ± 0 33.8 ± 0.2
Sorghum
N I 528 ± 22 a 301 ± 10 a 56 ± 1 a 445 ± 1 67.6 ± 2.3
N II 565 ± 27 a 306 ± 14 a 54 ± 0 a 449 ± 1 68.0 ± 3.0
N III 592 ± 10 a 323 ± 14 a 55 ± 1 a 449 ± 1 72.1 ± 3.0
Triticale
N I 242 ± 18 a 121 ± 14 a 53 ± 1 b 430 ± 3 28.1 ± 3.3
N II 251 ± 10 a 129 ± 3 a 48 ± 1 a 424 ± 1 30.4 ± 0.7
N III 292 ± 37 a 138 ± 8 a 45 ± 1 a 430 ± 2 32.1 ± 1.7
Reed Canary Grass II C
N I 329 ± 11 a 164 ± 10 a 50 ± 1 a 429 ± 2 38.2 ± 2.2
N II 344 ± 17 a 165 ± 7 a 48 ± 0 a 431 ± 2 38.5 ± 1.8
N III 352 ± 17 a 173 ± 7 a 49 ± 1 a 422 ± 3 41.0 ± 1.8
Reed Canary Grass III C
N I 332 ± 7 a 160 ± 1 a 48 ± 1 a 429 ± 2 43.6 ± 1.8
N II 369 ± 7 b 179 ± 3 a 49 ± 0 a 427 ± 1 50.7 ± 3.0
N III 376 ± 4 b 187 ± 2 a 50 ± 0 a 427 ± 1 50.2 ± 1.8
Virginia Mallow
N I 267 ± 9 a 145 ± 3 a 54 ± 1 b 340 ± 4 34.3 ± 1.1
N II 298 ± 11 a 153 ± 6 a 51 ± 1 a 351 ± 1 35.0 ± 1.1
N III 380 ± 20 b 197 ± 12 b 52 ± 1 ab 245 ± 2 49.7 ± 1.4
p value 0.0543 0.0463 0.0001 0.0000 0.0082
F 1.96 2.02 4.47 13.11 2.72 *EBY - experimental biogas yield, EMY - experimental methane yield, TMY - theoretical methane yield, BD - biodegradability, RCG IIC, RCG IIIC - reed canary grass harvested in the two- or three-cut system, VM - Virginia mallow. **Means ± SE (n = 3) with different letters in the column differ significantly in Tukey test at p<0.05
PEER-REVIEWED ARTICLE bioresources.com
Oleszek et al. (2018). “Biogas from energy crops,” BioResources 13(4), 8505-8528. 8510
Influence of the Nitrogen Fertilization Level on Biogas Production The N fertilization positively influenced the biomass biodegradability, as well as
the biogas and methane yield, wherein statistically significant differences were observed
only after the highest N level application (Table 1). Despite the lack of statistically
significant interactions between the N level and species (p > 0.05), the results of the post
hoc test indicated that the influence of the N fertilization on the biogas yield was different
for the same species of energy crop than for the other species.
In the case of sunflower and RCG IIIC, a significant increase in the biogas yield
was observed at a moderate N level. The differences between the N level for sorghum,
triticale, and RCG IIC were not statistically confirmed. In terms of maize, a significant
difference was only observed between the medium and the highest N fertilization doses.
Analogous relationships were observed for the methane yield.
The rise in the N fertilization level caused a general decrease in the methane content
in the biogas for all the tested energy crops. However, the influence varied depending on
the species of the plants (a significant interaction of the species × N level, p > 0.05). The
results of the Tukey post hoc test confirmed the significant decrease in methane content in
the biogas only for sunflower and triticale, and showed the lack of a clear trend for VM.
Influence of the Energy Crops Species on Biogas Production Among all the tested crops, the highest biogas yield was exhibited by sorghum, but
only for the medium N level was it significantly higher than that of maize (Table 1). The
average biogas yield was observed with RCG, sunflower, and VM, while the lowest biogas
yield was observed with triticale. The methane yield was less varied then the biogas yield.
The highest value was noted for sorghum, which was slightly lower for maize, while the
lowest was noted for triticale. There were no significant differences between sunflower,
VM, RCG IIC, and RCG IIIC.
Significant differences between species occurred in terms of the methane content
in the biogas. The majority of the methane was contained in biogas from the maize silage,
and the least was in biogas from sunflower, triticale, RCG IIC, and RCG IIIC.
Influence of the Swath and Cut System on Biogas Production
Among all of the swaths of RCG, the highest biogas and methane yield was noted
for the silage of the second swath of the three-cut system (II/III), and then for the silage of
the first swath common in the two- and three-cut systems (I/II/III) (Table 2). A much lower
biogas and methane yield was obtained from methane fermentation of the biomass
collected in October (third swath of the three-cut system (III/III) and the second swath of
the two-cut system II/II).
In the case of VM, higher biogas and methane production was observed from biomass
collected at an earlier harvest date (I/II) than at the latest date (II/II). The lowest methane
content in the biogas was noted during fermentation of the first swath (I/II), for both RCG
and VM. This parameter increased along with the next swath, although for VM, it was not
statistically significant. A two-way analysis of variance indicated a lack of interaction
between the swath and N fertilization levels in the case of biogas and methane yield, for
both RCG and VM. Nevertheless, the post hoc tests that were conducted separately for the
swaths indicated that a statistically significant increase in the biogas and methane yield
caused by N fertilization occurred only in the case of III/III of RCG and II/II of VM. For
these silages, a significant influence of the N level on the CH4 content was also
demonstrated.

PEER-REVIEWED ARTICLE bioresources.com
Oleszek et al. (2018). “Biogas from energy crops,” BioResources 13(4), 8505-8528. 8511
Table 2. Biogas Yield, Methane Yield, Methane Content, and Biodegradability Depending on the Nitrogen Level and Swath in the Case of RCG and VM
EBY*
(dm3 kg-1 VS) EMY
(dm3 kg-1 VS) CH4
in biogas (%) TMY
(dm3 kg-1 VS) BD (%)
RCG – Swath
I/II/III 385 ± 7 c** 182 ± 3 c 48 ± 0 a 425 ± 1 c 42.9 ± 0.9 b
II/III 451 ± 14 d 224 ± 6 d 50 ± 0 ab 419 ± 2 b 53.4 ± 1.5 c
III/III 241 ± 14 a 121 ± 7 a 50 ± 1 ab 265 ± 4 a 45.5 ± 2.6 b
II/II 299 ± 14 b 152 ± 7 b 51 ± 1 b 429 ± 3 d 35.5 ± 1.6 a
p value 0.0000 0.0000 0.0156 0.0000 0.0000
F 73.90 74.70 4.23 2815.10 30.22
RCG - N Fertilization Level
N I 320 ± 27 a 158 ± 12 a 50 ± 1 a 381 ± 23 a 41.3 ± 1.8 a
N II 355 ± 29 b 173 ± 14 ab 49 ± 0 a 390 ± 20 b 44.3 ± 2.7 b
N III 356 ± 22 b 179 ± 10 b 50 ± 1 a 383 ± 21 a 47.4 ± 2.4 c
p value 0.0176 0.0000 0.1866 0.0001 0.0041
F 4.80 5.92 1.80 13.60 6.96
RCG – Swath × N Fertilization Level
I/II/III × N I 373 ± 6 176 ± 5 48 ± 2 425 ± 3 41.5 ± 1.1
I/II/III × N II 375 ± 11 178 ± 5 48 ± 0 426 ± 2 41.7 ± 1.2
I/II/III × N III 406 ± 5 193 ± 3 48 ± 0 425 ± 4 45.5 ± 1.0
II/III × N I 426 ± 12 206 ± 3 48 ± 1 415 ± 4 49.6 ± 0.8
II/III × N II 487 ± 32 240 ± 14 49 ± 0 421 ± 0 57.1 ± 3.3
II/III × N III 441 ± 5 225 ± 1 51 ± 1 421 ± 1 53.4 ± 0.3
III/III × N I 197 ± 8 98 ± 5 50 ± 0 252 ± 5 39.0 ± 1.1
III/III × N II 246 ± 21 120 ± 9 49 ± 1 278 ± 1 43.3 ± 3.3
III/III × N III 279 ± 6 144 ± 6 51 ± 1 265 ± 3 54.3 ± 2.8
II/II × N I 285 ± 26 151 ± 15 53 ± 1 433 ± 1 34.9 ± 3.5
II/II × N II 314 ± 25 153 ± 10 49 ± 1 435 ± 2 35.2 ± 2.4
II/II × N III 297 ± 32 153 ± 14 52 ± 4 420 ± 2 36.4 ± 3.4
p value 0.2134 0.1221 0.4930 0.0000 0.0368
F 1.52 1.90 0.93 8.20 2.73
VM – Swath
I/II 357 ± 16 b 186 ± 9 b 52 ± 1 a 432 ± 1 b 43.0 ± 2.0
II/II 273 ± 28 a 144 ± 14 a 53 ± 2 a 426 ± 1 a 33.8 ± 3.3
p value 0.0018 0.0022 0.1986 0.0013 0.0034
F 16.01 15.03 1.85 17.5 13.27
VM - N Fertilization Level
N I 267 ± 30 a 145 ± 11 a 55 ± 2 b 431 ± 2 a 33.6 ± 2.6
N II 298 ± 33 a 153 ± 19 a 51 ± 1 a 428 ± 2 a 35.6 ± 4.3
N III 380 ± 17 b 198 ± 10 b 52 ± 1 a 429 ± 2 a 46.1 ± 2.3
p value 0.0024 0.0036 0.0029 0.1826 0.0033
F 10.41 9.34 9.89 2.0 9.58
VM – Swath × Nitrogen Fertilization Level
I/II × N I 318 ± 34 163 ± 13 52 ± 1 434 ± 2 37.6 ± 2.9
I/II × N II 365 ± 14 192 ± 11 52 ± 1 432 ± 1 44.3 ± 2.7
I/II × N III 388 ± 25 203 ± 14 52 ± 1 432 ± 2 47.1 ± 3.2
II/II × N I 215 ± 25 126 ± 12 59 ± 1 429 ± 3 29.5 ± 3.0
II/II × N II 230 ± 25 113 ± 11 49 ± 1 423 ± 1 26.8 ± 2.8
II/II × N III 373 ± 28 192 ± 17 51 ± 1 426 ± 1 45.2 ± 3.8
p value 0.0898 0.0723 0.0007 0.4323 0.0744
F 2.97 3.30 14.36 0.9 3.25
*EBY, EMY, TMY , BD, RCG, VM – see Table 1; I/II/III - first swath common for two- and three-cut system,
I/II - first swath in two-cut system, II/II - second swath in two-cut system, II/III - second swath in three-cut system, III/III - third swath in three-cut system. ** See Table 1.
PEER-REVIEWED ARTICLE bioresources.com
Oleszek et al. (2018). “Biogas from energy crops,” BioResources 13(4), 8505-8528. 8512
Swath III/III of RCG was characterized by an increase in CH4 content, while swath
II/II of VM was characterized by a decrease in CH4 content as a result of the increased
doses of N fertilizer.
The Kinetics of the Methane Fermentation Process The results of methane fermentation assays indicated that the N level, the species
of the energy crops, and the swath influenced the kinetics of the process. These
relationships involved the total fermentation time tt and the kinetics parameters, described
by the Gompertz equation (Eq. 3), such as length of the lag phase (λ), specific biogas
production rate (µm), and theoretical maximum biogas yield after tt time (A).
A high correlation coefficient (in the range of 0.946 to 0.999) of the theoretical
cumulative biogas yield after t time (y) and the experimental cumulative biogas yield
testified to a good fit of the model. Furthermore, the value of the parameter A was close to
the biogas yield obtained experimentally in methane fermentation assays (EBY) (Table 3).
The influence of the nitrogen fertilization level on the kinetics of methane fermentation
The N fertilization level significantly influenced only the theoretical maximum
biogas yield after time tt (A) and the specific biogas production rate (µm) for all of the tested
energy crops (p < 0.05; Table 3). Application of the highest N fertilization dose caused a
slight but statistically significant increase in the parameter µm. This result confirmed the
positive impact of the N fertilization on the biomass decomposition in the methane
fermentation process. Nitrogen fertilization did not significantly influence the length of the
lag phase (λ) (p > 0.05). The exceptions were sunflower and VM, for which slight
prolongation and shortening of the lag phase (λ) occurred, respectively. The total
fermentation time (tt) was extended by one day, as a result of the application of the highest
level of N fertilizer, but it was not a statistically significant change. This dependence was
specific to the plant species. For sunflower and RCG, a significant increase in tt was
observed, while for triticale there was a decrease with increasing doses of N. No significant
differences were noted for maize, VM, or sorghum (Table 3).
The influence of the energy crop species on the kinetics of methane fermentation
The kinetics of methane fermentation were influenced by the energy crop species.
The highest values of A were obtained for sorghum and maize, respectively. A substantially
lower value for parameter A was noted for the other silages, between which there were no
statistically significant differences within any N level (Table 3).
Additionally, the examined species differed in terms of the parameters of λ and µm
(p < 0.05). The greatest µm was determined for maize, and was slightly lower for sorghum.
The lowest biogas production rate was noted for triticale and RCG IIC because of the long
total fermentation time tt and the relatively low biogas yield. This finding demonstrates the
weak digestibility of these silages.
The influence of the swath and cut-system on the kinetics of methane fermentation
Particular swaths of RCG differed significantly in terms of the values of the kinetics
parameters (p < 0.05, Table 4). The highest maximum biogas production after tt (A) was
noted for II/III, as shown in Table 4. The kinetics parameters A, μm, λ, and the total
fermentation time tt, depended on the N fertilization level and swath in the case of reed
canary grass and Virginia mallow, while they were the lowest for III/III. The lowest µm
was observed in the case of II/II and III/III, and the highest was observed for II/III.
PEER-REVIEWED ARTICLE bioresources.com
Oleszek et al. (2018). “Biogas from energy crops,” BioResources 13(4), 8505-8528. 8513
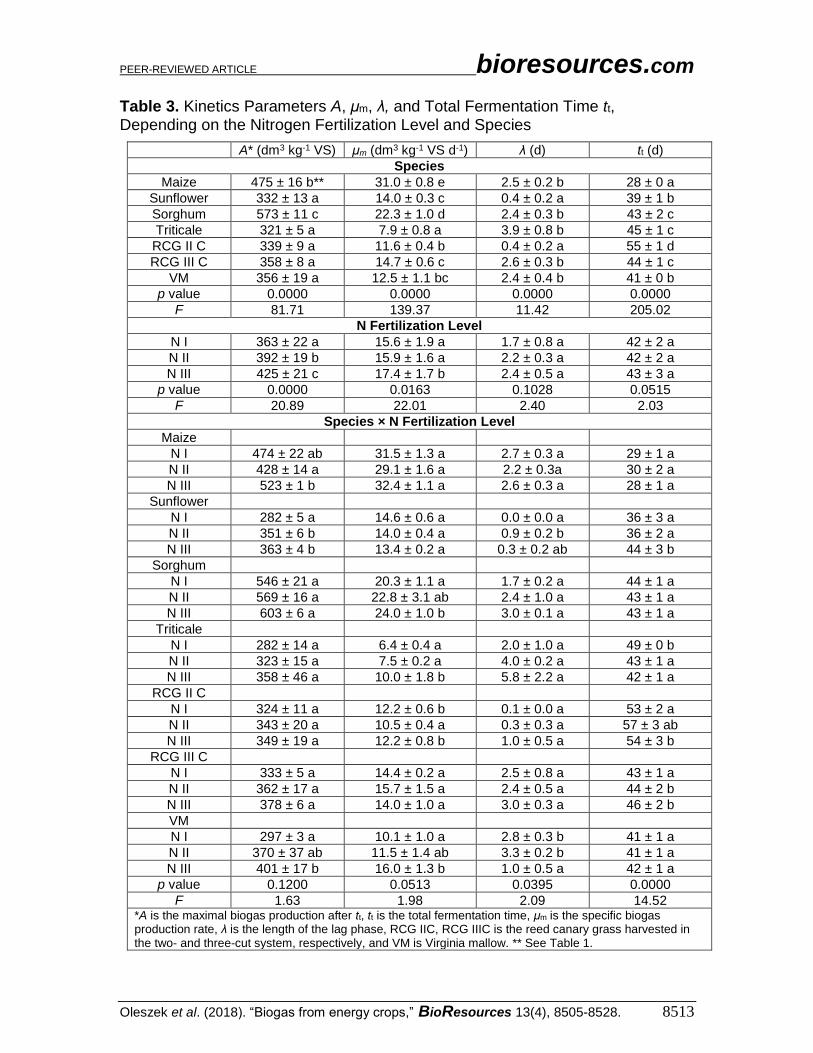
Table 3. Kinetics Parameters A, μm, λ, and Total Fermentation Time tt, Depending on the Nitrogen Fertilization Level and Species
A* (dm3 kg-1 VS) μm (dm3 kg-1 VS d-1) λ (d) tt (d)
Species
Maize 475 ± 16 b** 31.0 ± 0.8 e 2.5 ± 0.2 b 28 ± 0 a
Sunflower 332 ± 13 a 14.0 ± 0.3 c 0.4 ± 0.2 a 39 ± 1 b
Sorghum 573 ± 11 c 22.3 ± 1.0 d 2.4 ± 0.3 b 43 ± 2 c
Triticale 321 ± 5 a 7.9 ± 0.8 a 3.9 ± 0.8 b 45 ± 1 c
RCG II C 339 ± 9 a 11.6 ± 0.4 b 0.4 ± 0.2 a 55 ± 1 d
RCG III C 358 ± 8 a 14.7 ± 0.6 c 2.6 ± 0.3 b 44 ± 1 c
VM 356 ± 19 a 12.5 ± 1.1 bc 2.4 ± 0.4 b 41 ± 0 b
p value 0.0000 0.0000 0.0000 0.0000
F 81.71 139.37 11.42 205.02
N Fertilization Level
N I 363 ± 22 a 15.6 ± 1.9 a 1.7 ± 0.8 a 42 ± 2 a
N II 392 ± 19 b 15.9 ± 1.6 a 2.2 ± 0.3 a 42 ± 2 a
N III 425 ± 21 c 17.4 ± 1.7 b 2.4 ± 0.5 a 43 ± 3 a
p value 0.0000 0.0163 0.1028 0.0515
F 20.89 22.01 2.40 2.03
Species × N Fertilization Level
Maize
N I 474 ± 22 ab 31.5 ± 1.3 a 2.7 ± 0.3 a 29 ± 1 a
N II 428 ± 14 a 29.1 ± 1.6 a 2.2 ± 0.3a 30 ± 2 a
N III 523 ± 1 b 32.4 ± 1.1 a 2.6 ± 0.3 a 28 ± 1 a
Sunflower
N I 282 ± 5 a 14.6 ± 0.6 a 0.0 ± 0.0 a 36 ± 3 a
N II 351 ± 6 b 14.0 ± 0.4 a 0.9 ± 0.2 b 36 ± 2 a
N III 363 ± 4 b 13.4 ± 0.2 a 0.3 ± 0.2 ab 44 ± 3 b
Sorghum
N I 546 ± 21 a 20.3 ± 1.1 a 1.7 ± 0.2 a 44 ± 1 a
N II 569 ± 16 a 22.8 ± 3.1 ab 2.4 ± 1.0 a 43 ± 1 a
N III 603 ± 6 a 24.0 ± 1.0 b 3.0 ± 0.1 a 43 ± 1 a
Triticale
N I 282 ± 14 a 6.4 ± 0.4 a 2.0 ± 1.0 a 49 ± 0 b
N II 323 ± 15 a 7.5 ± 0.2 a 4.0 ± 0.2 a 43 ± 1 a
N III 358 ± 46 a 10.0 ± 1.8 b 5.8 ± 2.2 a 42 ± 1 a
RCG II C
N I 324 ± 11 a 12.2 ± 0.6 b 0.1 ± 0.0 a 53 ± 2 a
N II 343 ± 20 a 10.5 ± 0.4 a 0.3 ± 0.3 a 57 ± 3 ab
N III 349 ± 19 a 12.2 ± 0.8 b 1.0 ± 0.5 a 54 ± 3 b
RCG III C
N I 333 ± 5 a 14.4 ± 0.2 a 2.5 ± 0.8 a 43 ± 1 a
N II 362 ± 17 a 15.7 ± 1.5 a 2.4 ± 0.5 a 44 ± 2 b
N III 378 ± 6 a 14.0 ± 1.0 a 3.0 ± 0.3 a 46 ± 2 b
VM
N I 297 ± 3 a 10.1 ± 1.0 a 2.8 ± 0.3 b 41 ± 1 a
N II 370 ± 37 ab 11.5 ± 1.4 ab 3.3 ± 0.2 b 41 ± 1 a
N III 401 ± 17 b 16.0 ± 1.3 b 1.0 ± 0.5 a 42 ± 1 a
p value 0.1200 0.0513 0.0395 0.0000
F 1.63 1.98 2.09 14.52 *A is the maximal biogas production after tt, tt is the total fermentation time, μm is the specific biogas production rate, λ is the length of the lag phase, RCG IIC, RCG IIIC is the reed canary grass harvested in the two- and three-cut system, respectively, and VM is Virginia mallow. ** See Table 1.

PEER-REVIEWED ARTICLE bioresources.com
Oleszek et al. (2018). “Biogas from energy crops,” BioResources 13(4), 8505-8528. 8514
The findings shown in Table 4 demonstrate a much better digestibility of the silage
by the II/III swath in comparison with silages from biomass collected at a later date. The
swath of II/III and III/III was characterized by the longest λ and simultaneously the shortest
tt. The longest tt of 61 days was noted for the II/II swath (Table 4). Nitrogen fertilization
did not influence the parameters A, µm, and λ of the methane fermentation of RCG, and
only tt slightly extended with increasing doses of N fertilizer.
Both swaths of VM differed significantly in terms of µm and λ (Table 4). A higher
A and a longer tt value were noted for the swath of I/II. An increasing N fertilization level
resulted in an increase in A and tt only in the case of II/II. With the increase in the N
fertilization, the μm parameter also increased, although the differences were not statistically
significant for individual swaths (p > 0.05), but only for the average of the two swaths.
There were no statistically significant differences between the levels of N fertilization in
the case of the λ parameter.
Correlation and Regression Analysis Based on the results of a previous study of Oleszek and Matyka (2017) on the
chemical composition of the tested crops, correlation and regression analyses were
performed. The analysis of the correlation coefficients showed that non-fiber carbohydrates
(NFC), the ratio of the sum of hemicelluloses and cellulose to lignin ((HCL + CL)/ADL),
the volatile solids (VS), and the C/N ratio most strongly positively influenced the biogas
production (Table 5). The strongest negative correlation with the biogas yield was stated
for lignin (ADL), crude ash (CA), total nitrogen (Ntot), crude proteins (CP), and pH. A
slightly weaker but also statistically significant correlation was noted for organic carbon
(Corg) and HCL (p < 0.05, Table 5). There was no significant correlation with crude fat
(CF) and cellulose (CL) (p < 0.05). Analogous results were obtained for the methane yield
and parameter A because of its strong internal correlation with the biogas yield.
The methane content in biogas was directly proportional with the NFC, VS,
and C/N ratio, and was inversely proportional with CP, CF, and pH. There were no
significant correlations (p > 0.05) between the methane content and ADL, Corg, or HCL.
The specific biogas production rate (µm) was negatively correlated with the ADL, CP, and
pH. A positive correlation was stated between µm and VS, Corg, NFC, C/N, and the (HCL
+ CL)/ADL ratio.
Most of the tested chemical properties did not have a significant effect on λ and tt
(p > 0.05). The length of the lag phase (λ) was reduced by increases in TS, VS, Corg, and
CF. The total fermentation time (tt) was extended with a rise in the pH, TS, HCL, and ADL.
An increase in the NFC and (HCL + CL)/ADL ratio caused the shortening of tt.
Additionally, the dependence of the methane yield on the chemical composition of
the tested energy crops was described by regression models. The regression linear trend of
EMY versus particular variables is presented in Table 6.
Concerning the single variables, the most statistically significant model of methane
yield was obtained using NFC and C/N (p < 0.05). Unfortunately, the model accuracy was
relatively weak (RRMSE of 25.93 and 28.95, respectively). The multiple models with few
independent variables proved to be better for the prediction of methane yield than the single
models. The best parameters for the evaluation of the linear regression were obtained for
the models based on HCL, ADL, NFC, CP, and their ratios. Figure 1 presents the
correlation between the methane yield as calculated based on the model: PMY = 20.3
HCL/ADL – 24.2 CP/ADL + 11.1 NFC/ADL + 123.0, and the methane yield obtained
experimentally (EMY).

PEER-REVIEWED ARTICLE bioresources.com
Oleszek et al. (2018). “Biogas from energy crops,” BioResources 13(4), 8505-8528. 8515
Table 4. Kinetics Parameters A, μm, λ, and Total Fermentation Time tt, Depending on the Nitrogen Fertilization Level and Swath in the Case of Reed Canary Grass and Virginia Mallow
A* (dm3 kg-1 VS) μ (dm3 kg-1 VS d-
1) λ (d) tt (d)
RCG – Swath
I/II/III 362 ± 9 c** 15.1 ± 0.8 b 0.1 ± 0.0 a 48 ± 1 b
II/III 449 ± 13 d 20.5 ± 1.3 c 3.7 ± 0.6 b 42 ± 1 a
III/III 262 ± 13 a 8.5 ± 0.7 a 4.2 ± 0.7 b 42 ± 0 a
II/II 315 ± 17 b 8.1 ± 0.3 a 0.8 ± 0.5 a 61 ± 1 c
p value 0.0000 0.0000 0.0000 0.0000
F 45.75 74.94 13.72 45.12
RCG - Nitrogen Fertilization Level
N I 326 ± 21 a 12.4 ± 1.9 a 1.9 ± 0.8 a 47 ± 2 a
N II 356 ± 27 a 13.5 ± 2.0 a 1.9 ± 0.6 a 49 ± 3 b
N III 360 ± 20 a 13.3 ± 1.4 a 2.8 ± 0.7 a 49 ± 3 b
p value 0.0502 0.3286 0.3664 0.0193
F 3.40 1.17 1.05 3.15
RCG – Swath × Nitrogen Fertilization Level
I/II/III × N I 346 ± 5 17.7 ± 0.4 0.2 ± 0.1 45 ± 2
I/II/III × N II 347 ± 14 14.2 ± 1.1 0.0 ± 0.0 50 ± 3
I/II/III × N III 392 ± 4 13.4 ± 1.3 0.0 ± 0.0 50 ± 3
II/III × N I 420 ± 9 19.4 ± 0.7 3.4 ± 1.6 42 ± 0
II/III × N II 486 ± 30 23.2 ± 3.2 3.1 ± 0.6 40 ± 0
II/III × N III 442 ± 10 18.9 ± 1.9 4.6 ± 1.0 45 ± 1
III/III × N I 234 ± 6 6.1 ± 0.6 4.0 ± 2.1 43 ± 1
III/III × N II 252 ± 27 9.8 ± 0.5 4.1 ± 1.1 42 ± 1
III/III × N III 300 ± 6 9.7 ± 0.2 4.4 ± 0.7 43 ± 1
II/II × N I 302 ± 26 6.6 ± 0.8 0.0 ± 0.0 60 ± 3
II/II × N II 338 ± 28 6.8 ± 0.7 0.5 ± 0.5 64 ± 4
II/II × N III 306 ± 38 11.0 ± 0.4 2.0 ± 1.1 58 ± 4
p value 0.2095 0.0320 0.9442 0.0466
F 1.54 2.82 0.27 10.02
VM – Swath
I/II 433 ± 27 b 10.7 ± 0.9 a 3.0 ± 0.8 a 47 ± 0 b
II/II 279 ± 25 a 14.4 ± 2.0 a 1.8 ± 0.6 a 36 ± 0 a
p value 0.0000 0.0591 0.1781 0.0000
F 38.33 4.35 2.05 25.20
VM - Nitrogen Fertilization Level
N I 297 ± 33 a 10.1 ± 1.4 a 2.8 ± 0.7 a 41 ± 3 a
N II 370 ± 65 ab 11.5 ± 1.6 ab 3.3 ± 1.1 a 41 ± 3 a
N III 401 ± 22 b 16.0 ± 2.3 b 1.0 ± 0.4 a 42 ± 2 a
p value 0.0144 0.0456 0.1041 0.1328
F 6.16 4.04 2.75 2.53
VM - Swath × Nitrogen Fertilization Level
I/II × N I 362 ± 24 9.5 ± 1.8 2.8 ± 1.2 47 ± 0
I/II × N II 502 ± 56 11.0 ± 1.7 5.0 ± 1.3 47 ± 1
I/II × N III 436 ± 0 11.6 ± 1.8 1.1 ± 0.4 47 ± 1
II/II × N I 231 ± 21 10.7 ± 2.6 2.8 ± 1.0 35 ± 1
II/II × N II 239 ± 21 12.1 ± 3.1 1.6 ± 1.4 35 ± 1
II/II × N III 366 ± 33 20.5 ± 1.6 1.0 ± 0.7 37 ± 1
p value 0.0237 0.1583 0.1964 0.1328
F 5.20 2.16 1.87 2.53 *A, μm, λ, RCG, VM – see Table 3; I/II/III, I/II, II/II, II/III, III/III – see Table 2; **See Table 1

PEER-REVIEWED ARTICLE bioresources.com
Oleszek et al. (2018). “Biogas from energy crops,” BioResources 13(4), 8505-8528. 8516
Table 5. Correlation Coefficients of the Biogas Yield, Methane Yield, Methane Content in Biogas, and Kinetics Parameters (A, µm, λ, and tt) with Tested Chemical Characteristics
Characteristics Biogas Yield
Methane Yield
Methane Content
A** µm λ tt
TS 0.22* 0.25* 0.23* 0.15 0.23* -0.25* 0.32*
VS 0.53* 0.53* 0.25* 0.52* 0.45* -0.28* -0.11
Corg 0.35* 0.32* 0.08 0.31* 0.23* -0.33* 0.17
CP -0.45* -0.49* -0.33* -0.53* -0.33* -0.19 0.03
C/N 0.52* 0.52* 0.25* 0.54* 0.39* 0.04 0.04
CL 0.01 -0.08 -0.23* 0.03 -0.08 -0.19 0.19
HCL 0.33* 0.29* 0.01 0.33* 0.15 0.04 0.38*
ADL -0.48* -0.49* -0.16 -0.37* -0.64* -0.09 0.63*
NFC 0.53* 0.64* 0.59* 0.51* 0.62* -0.04 -0.54*
(CL + HCL)/ADL 0.56* 0.51* 0.04* 0.44* 0.59* -0.11 -0.27*
CF -0.00 -0.08 -0.32* -0.07 0.01 -0.22* -0.20
pH -0.52* -0.58* -0.33* -0.53* -0.63* -0.05a 0.48*
*Correlation statistically significant (p < 0.05), ** A is the maximal biogas production after tt, tt is the total fermentation time, μm is the specific biogas production rate, λ is the length of the lag phase R > 0.4, 0.4 < R > 0.2, R < 0.2
Table 6. Summary Statistics of Linear Regression Analysis
Variable R2 p RRMSE Equation
HCL 0.085 < 0.0053 32.43 PMY = 2.6 HCL + 133.7
Corg 0.104 < 0.0019 32.08 PMY = 2.9 Corg + 44.5
ADL 0.236 < 0.0000 29.63 PMY = -11.4 ADL + 268.1
CP 0.239 < 0.0000 29.59 PMY = -10.7 CP + 295.3
(CL + HCL)/ADL 0.257 < 0.0000 29.22 PMY = 9.5 (CL + HCL)/ADL + 113.0
C/N 0.271 < 0.0000 28.95 PMY = 3.1 C/N + 87.0
NFC 0.415 < 0.0000 25.93 PMY = 3.3 NFC + 128.8
(CL + HCL)/ADL, NFC 0.602 < 0.0000 21.50 PMY= 8.2 (CL + HCL)/ADL + 3.0 NFC + 69.2
(NFC + HCL)/ADL 0.603 < 0.0000 21.40 PMY = 11.0 (NFC + HCL)/ADL + 114.0
ADL, HCL, NFC 0.673 < 0.0000 19.60 PMY = -5.3 ADL + 4.1 HCL + 3.4 NFC + 79.4
(CL + HCL)/ADL, NFC, CP
0.729 < 0.0000 17.85 PMY = 9.2 (CL + HCL)/ADL + 2.3 NFC – 8.4
CP + 158.0
HCL/ADL, NFC/ADL, CP
0.793 < 0.0000 15.60 PMY = 15.8 HCL/ADL + 8.9 NFC/ADL – 7.1
CP + 176.4
HCL/ADL, NFC/ADL, CP/ADL
0.799 < 0.0000 15.37 PMY=20.3 HCL/ADL – 24.2 CP/ADL + 11.1
NFC/ADL + 123.0
Thirty-eight datasets from the literature were tested to validate the above model.
The predicted values (PMY) versus the experimental values of the methane yield (EMY)
from the various studies were plotted in Fig. 2. Additionally, the validation was performed
for each source of datasets separately. The best prediction was obtained for the results of
Mahmood et al. (2012) with an R2 of 0.64.

PEER-REVIEWED ARTICLE bioresources.com
Oleszek et al. (2018). “Biogas from energy crops,” BioResources 13(4), 8505-8528. 8517
0 50 100 150 200 250 300 350 400 450
PMY (dm3 kg-1 VS)
0
50
100
150
200
250
300
350
400
450
EM
Y (
dm
3 k
g-1
VS
)
R2 = 0.799, RRMSE = 15.37
Fig. 1. EMY versus PMY obtained based on the model: PMY = 20.3 HCEL/ADL – 24.2 CP/ADL + 11.1 NFC/ADL + 123.0
0 50 100 150 200 250 300 350 400 450
EMY (dm3 kg-1 VS)
0
50
100
150
200
250
300
350
400
450
PM
Y (
dm
3 k
g-1
VS
)
PMY = 84.3138 + 0.5256 EMY, R2 = 0.266
Fig. 2. Validation of the suggested model: EMY versus PMY and the linear trend; ◦ - Merando et al. 2012, ▪ - Mahmood et al. 2012, ♦ - Li et al. 2013, and Δ – Oslaj et al. 2010

PEER-REVIEWED ARTICLE bioresources.com
Oleszek et al. (2018). “Biogas from energy crops,” BioResources 13(4), 8505-8528. 8518
DISCUSSION
The Influence of the Nitrogen Fertilization Level on Biogas Production The results of the present study indicated that an increase in biogas and methane
yield with increasing doses of nitrogen were consistent with the results obtained by Kandel
et al. (2013), who investigated the effect of additional nitrogen, phosphorus, and potassium
(NPK) fertilization after the first swath of RCG on biogas production from the biomass of
the second swath. This study showed that the methane yield significantly increases with a
decrease in ADL. Analysis of the correlation coefficient of the biogas and methane yield
with particular chemical properties provided the basis for an explanation of the reasons for
the positive influence of enhanced N levels on the efficiency of methane fermentation.
Among the properties that are positively correlated with the biogas and methane yield, the
(HCL + CL)/ADL ratio has a significant increase, and C/N is shown to decrease when the
N level increases (Oleszek and Matyka 2017). In the case of properties that correlated
negatively, an increase in the N level caused a decrease in the ADL and pH, while there
was an increase in Ntot and CP. According to the above findings, the main cause of the
increase in the biogas and methane yield resulted from rising N levels, which was primarily
a decrease in the ADL as well as favorable changes in the proportion of lignocellulose
components, as expressed in the (HCL + CL)/ADL ratio. Unfavorable changes, from the
biogas production point of view, such as an increase in CP and particularly a decrease in
the C/N ratio, could to some extent reduce the positive effect of improved digestibility of
lignocellulose. The low pH of the silage from plants grown at the highest level of N
fertilization was also noteworthy. Kaplan et al. (2016) confirms that the decrease in the pH
of maize silage caused by increasing the doses of N fertilization increases the gas
production in co-digestion with rumen fluid. This finding is in line with the findings of
Prochnow et al. (2009), which states the close relationship between the silage quality and
the biogas yield.
The influence of the N fertilization level on plant material quality, methane
fermentation efficiency, and kinetics is probably associated with its impact on the
morphological characteristics of plants, such as changes in proportion of leaves to stems
and cobs to stems (in the case of maize) (Kaplan et al. 2016). As reported by Peyraud and
Astigarraga (1998), N fertilization promotes the growth of succulent herbage that is low in
cell wall content. In contrast, a low N fertilization level may accelerate the maturation and
shortening of the growing season because the plants are forced to bloom (Kaplan et al.
2016). Jablonowski et al. (2017) and Kandel et al. (2013) stated that an increase in lignin
follows maturation, which supports the authors’ results of higher lignin content and lower
methane fermentation efficiency associated with the lowest N fertilization level.
Influence of the Energy Crop Species on Biogas Production Among the investigated energy plants, maize is the most often used substrate,
especially in west and central Europe where it has high biomass yield (Oleszek et al. 2016).
Additionally, the highest potential of methane production from maize is due to its low
nutrient demand, high water-use efficiency, and high digestibility (Herrmann 2013; Rath
et al. 2013). High biogas yield from maize silage that was obtained in the present study
(471 ± 14 dm3 kg-1 VS) resulted from favorable chemical properties, which are important
for biogas production. As was reported by Oleszek and Matyka (2017), maize contains
only a small amount of ADL and ash, but a large amount of NFC. Moreover, it was
characterized by the highest ratio of (HCL + CL)/ADL among all of the tested species.
PEER-REVIEWED ARTICLE bioresources.com
Oleszek et al. (2018). “Biogas from energy crops,” BioResources 13(4), 8505-8528. 8519
The average biogas yield of 471 ± 14 dm3 kg-1 VS was close to the results of Mursec
et al. (2009) (362 dm3 kg-1 VS). Luna-delRisco et al. (2011) noted a methane yield of 296
± 31 dm3 kg-1 VS, while Oslaj et al. (2010) obtained a biogas and methane yield in the
range of 515 to 603 and 290 to 330 dm3 kg-1 VS, respectively, while conducting research
on the efficiency of methane fermentation from 15 varieties of maize. Similar values were
noted by Negri et al. (2014), who compared a few varieties that differed in the Food and
Agriculture Organization of the United Nations number (FAO) (300 to 700) and stated that
the biogas yield increases with increases in the FAO value. Zea mays var. ułan, which was
tested in this study, has an FAO of 270, and is defined in Polish conditions as a medium-
late variety. Amon et al. (2007b) investigated the effect of the harvesting dates on the maize
methane yield, as well as the differences between the varieties. The methane yield was in
the range of 268 to 366 dm3 kg-1 VS and decreased with the degree of maturity. However,
it was associated with a rise in the biomass yield, and thus, the methane productivity per
unit area.
The sunflower methane yield (160 dm3 kg-1 VS) proved to be much lower then was
obtained by Mursec et al. (2009) (283 dm3 kg-1 VS), Nassab et al. (2011) (300 dm3 kg-1
VS), and Monlau et al. (2012) (192 dm3 kg-1 VS). The reason for the differences could
have been due to the different chemical composition of the biomass used by the authors,
which resulted from differences in the varieties, harvest data, methods of cultivation,
pretreatment, storage, apparatus, and conditions of the methane fermentation process. For
this reason, a comparison of the results of various laboratories is difficult (Kalač 2011).
The relatively low biogas and methane yield obtained in the present study was probably
due to the highest ADL content among all of the tested plants, which decreases the
following ratio: (HCL + CL)/ADL (Oleszek and Matyka 2017). Additionally, high CA and
low HCL values negatively influenced the biogas yield. The sunflower silage was
distinguished by the highest content of CF, but it only weakly influenced the biogas
production (R = 0.22).
The sorghum methane yield (301 to 323 dm3 kg-1 VS) was slightly higher than that
noted by Barbanti et al. (2014), which was 262 dm3 kg-1 VS. Nonetheless, it should be
mentioned that the authors investigated other varieties than those used in the present study.
An investigation concerning the variety Rona 1 was conducted by Mahmood and
Honermeier (2012), in which the highest results were obtained for the biogas and methane
yield, of 721 and 387 dm3 kg-1 VS, respectively. Comparing the efficiency of the methane
fermentation process of five sorghum varieties, the authors stated that the variety of Rona
1 was characterized by a significantly higher biogas yield than the others by an average of
200 dm3 kg-1 VS. A high biogas yield from sorghum silage is associated with high NFC
content, and simultaneously, low ADL and CP content. Furthermore, sorghum was
distinguished by the lowest CA and the highest VS as well as a high (HCL + CL)/ADL
ratio (Oleszek and Matyka 2017).
The average biogas and methane yield RCG IIC, 342 and 167 dm3 kg-1 VS, as well
as RCG IIIC, 359 and 176 dm3 kg-1 VS, turned out to be lower compared to the results of
other authors (Seppälä et al. 2009; Kacprzak et al. 2012; Kandel et al. 2013). Nevertheless,
similar relationships between the swaths were observed.
Oleszek and Matyka (2017) reported that RCG can be distinguished by the highest
HCL and CL, causing a high ratio of (HCL + CL)/ADL, which was only slightly lower
than in maize. Unfortunately, the low content of NFC and the relatively high content of
ADL resulted in a weak biogas yield. Furthermore, the silages of RCG were characterized
PEER-REVIEWED ARTICLE bioresources.com
Oleszek et al. (2018). “Biogas from energy crops,” BioResources 13(4), 8505-8528. 8520
by an elevated pH. Proper pH of the silage that contains approximately 30% of the dry
matter should not exceed 4.5 (Meeske et al. 2002).
In the last two years, there was an apparent increase in the number of studies on the
biogas production from VM and its cultivation for silage (Nahm and Morhart 2018). The
first attempts with biogas batch assays showed the higher biogas and methane yield (435
and 220 dm3 kg-1 VS, respectively), compared with that obtained in the present study
(Oleszek et al. 2013). Similar results were obtained several years later by Dębowski et al.
(2017) of 381.39 and 166.61 dm3 kg-1 VS, respectively, and Jablonowski et al. (2017),
which were 419.5 and 204.2 dm3 kg-1 VS, respectively. A lower biogas yield of 278 to 265
dm3 kg-1 VS that was more consistent with the present study was obtained by Zieliński et
al. (2013). In the present work, VM was distinguished by the lowest C/N and the highest
CL (Oleszek and Matyka 2017), but the CL did not correlate with the biogas and methane
yield. The property that could negatively influence the biogas production was a high pH of
4.8.
The lowest biogas yield was observed for triticale. As Oleszek and Matyka (2017)
reported, silage of this energy crop was characterized by a low concentration of NFC, a
high content of ADL and one of the lowest ratios of (HCL + CL)/ADL, which reflects low
digestibility. Other authors obtained higher values of the biogas and methane yield. Negri
et al. (2014) noted a biogas yield of 487 dm3 kg-1 VS, and Amon et al. (2007a) noted a
methane yield of 212 to 289 dm3 kg-1 VS, depending on the harvest date. Moreover, they
observed a significant decrease in the methane yield when delaying the harvest date. This
fact and the high content of ADL could suggest that the triticale biomass in the present
study was collected too late and at too high a degree of maturity.
Influence of the Swath and Cut System on Biogas Production The negative correlations of the biogas yield with ADL, CA, and CP helped to
explain the differences in the methane fermentation efficiency of certain swaths of RCG.
The lowest biogas and methane yield was noted for the third swath of RCG collected in
triplicate (III/III), due to the high CA and ADL content. However, the highest ADL was
determined in the swath of II/II due to the high degree of maturity, which also had a
significantly lower biogas yield than the swaths of I/II/III and II/III (p < 0.05). The swath
of I/II/III is distinguished by a high ratio of (HCL + CL)/ADL and by the high content of
CP and thus the low C/N ratio, which could cause the inhibition of methane fermentation
by ammonia production (Wagner et al. 2013). The best biogas and methane yield was noted
for the swath of II/III, and both were caused by the low content of CP and ADL as well as
the high ratios of (HCL + CL)/ADL and C/N.
Mähnert et al. (2005) indicates that the frequency of cutting has a significant impact
on the composition of crude fiber and the digestibility of organic matter, which as a
consequence influences the biogas production. However, the results of the present study
showed that despite the high biogas yield of the swath of II/III, the average biogas yield
from RCG IIIC was not significantly different from RCG IIC (p > 0.05) because of the low
biogas production from the swath of III/III.
The higher methane yield from the first swath (I/II/III) compared to the second
swath (II/II) was confirmed by the results of Seppälä et al. (2009) and Kacprzak et al.
(2012). In contrast, Kandel et al. (2013) did not observe significant differences between
the methane yield of the first and second swath. However, a decline was shown in the
methane yield with plant maturity. As the reason, they gave the decrease in the portion of
leaves in the biomass during vegetation. The leaves contained less ADL and CL and were

PEER-REVIEWED ARTICLE bioresources.com
Oleszek et al. (2018). “Biogas from energy crops,” BioResources 13(4), 8505-8528. 8521
characterized by much higher methane yield than the stalks. The strong dependence of the
methane yield on the maturity in the case of RCG provides the basis for explaining a higher
methane yield obtained in the present study for the swath of II/III (harvested in August)
than the swath of II/II (harvested in October). However, it should be noted that a harvesting
delay is most often aimed at achieving a highest biomass yield, and thus, the productivity
of methane and energy from the area unit.
Oleszek et al. (2014) determined a similar RCG biogas yield of 406 dm3 kg-1 VS.
The authors stated that there is a higher methane production efficiency from the cultivated
variety compared with the wild variety that originates from meadows. This was due to the
much lower content of ADL and crystalline cellulose, which proves that agro-technical
treatments, such as fertilization and systematic cutting, improve the digestibility and the
biogas yield.
Among the two swaths of VM, a higher biogas and methane yield were noted for
I/II, despite the much lower content of NFC and the higher ADL in its silage. The swath of
I/II was also characterized by a lower ratio of (HCL + CL)/ADL compared with the swath
of II/II, however, it simultaneously had a significantly higher C/N ratio (p < 0.05), which
positively correlated with the biogas yield. These results were consistent with the findings
of Jablonowski et al. (2017) in which a higher biogas yield from the first swath compared
to second swath was also obtained, namely 419 and 269 dm3 kg-1 VS, respectively.
Influence of the Chemical Properties on the Efficiency of Methane Fermentation
The influence of the biomass chemical composition was the subject of many
previous studies. Most often the content of lignin was mentioned as a factor that strongly
inhibited the methane fermentation process (Triolo et al. 2011; Li et al. 2013; Wagner et
al. 2013; Dandikas et al. 2014; Godin et al. 2015). Tsavkelova and Netrusov (2011) as well
as Wagner et al. (2013) report that the biodegradation of plant feedstock strongly depends
on the ADL content, which does not decompose under anaerobic conditions, because the
extracellular enzymes require oxygen to depolymerize (Triolo et al. 2011). In addition,
lignin covers cellulose and hemicellulose chains and makes it difficult to break down
(Zheng et al. 2014). The importance of this problem is evident by the scale of research
studies on pretreatment methods that aim at improving the biodegradability of
lignocellulose (Hendriks and Zeeman 2009; Zheng et al. 2014). The lower correlation of
the methane yield and lignin (ADL) obtained in this work compared to other studies could
have been due to the narrow range of ADL content in the tested crops (Tiolo et al. 2011).
The positive effect of NFC on the biogas yield was demonstrated by Godin et al.
(2015), in which a moderately strong, positive correlation coefficient of methane yield
from various grass with water soluble carbohydrates (R = 0.54) was recorded. In contrast
to the present study, these authors found a positive correlation of biogas yield with the CP,
whereas its correlation was negative with CL and HCL.
Nevertheless, in previous literature there are many reports on the negative influence
of CP on biogas production (Goliński and Jokś 2007; Wagner et al. 2013). One of the
reasons for the unprofitable effect of CP could be the ammonia production, which is the
inhibitor of methane fermentation at too high a concentration (Wagner et al. 2013).
Ammonia is formed especially at a low ratio of C/N.
While the decrease in ADL is always desired, the increase in the C/N ratio is
beneficial only to an optimum range of 25 to 30 (Ward et al. 2008). This finding means
that the influence of the concentration of Ntot and CP is dependent upon the C content.
PEER-REVIEWED ARTICLE bioresources.com
Oleszek et al. (2018). “Biogas from energy crops,” BioResources 13(4), 8505-8528. 8522
Moreover, the correlation of biogas and C/N is not straightforward, and both too low and
too high of values of this parameter are unfavorable.
However, this requires an explanation that the best biogas production was observed
for the samples characterized by C/N exceeding an optimal value. It should be taken into
account that the optimum C/N ratio is because methane fermentation microbes consume
carbon thirty times more than nitrogen (Krishania et al. 2013). According to the above
statement, the C/N ratio included only this amount of C and N, which is actually available
for microorganisms. This finding means that in the case of low digestibility and availability
of carbon, the actual C/N ratio can be considerably lower than the value calculated by the
Corg content and the Ntot determined in the silage.
Additionally, it was assumed that improvement in the lignocellulose digestibility,
due to the increasing N fertilization level, could increase in the presence of available C. In
consequence, it might neutralize the drop in C/N that is caused by the rise in N content.
The methane content in the biogas proved to be less dependent on the chemical
composition than biogas and methane yield. Generally, the values of CH4 content fell
within relatively narrow ranges, compared to biogas yield. Therefore, the methane yield
might be high even at low CH4 content in biogas. The NFC content was the only property
of the biomass that moderately positively correlated with the CH4 content (Table 5), but it
was not dependent on the N level. This result was opposite to the observation of Kandel et
al. (2013) of a lower CH4 content in biogas from biomass with a higher digestibility and
NFC content. In contrast, their results could justify the lower CH4 content in biogas from
plants that were cultivated at the highest N level, which was characterized by the best
digestibility (the highest ratio of (HCL + CL)/ADL).
The decrease in the CH4 content with increasing levels of nitrogen was explained
by increases in the CF and CP (negative correlation with the CH4 content). The positive
correlation coefficient (R) between the methane content and NFC justified the high
methane content obtained for sorghum, RCG, and VM.
The negative influence of CP and CF on the CH4 content is contrary to the reports
of Jacobi et al. (2012) and Prochnow et al. (2009), which regard the biogas of the highest
CH4 content from the proteins and lipid-rich substrates. However, Schittenhelm (2008),
Wagner et al. (2013), and Kowalczyk-Juśko et al. (2015) note that the theoretical methane
yield and methane content in biogas are often not confirmed in empirical results, due to
differences in the digestibility and availability of the individual components. Wagner et al.
(2013) explains that lipids are difficult to decompose in a fermenter, due to their low
solubility in water. Furthermore, in the case of lipid-rich substrates, there is a risk of
inhibition caused by an accumulation of long chain fatty acids (Schittenhelm 2008).
The multiple linear regression analysis allowed for the development of a model
used for methane yield predictions that employs the chemical components of the biomass.
The best developed model of methane yield that accounted for the ratio of HCL/ADL,
NFC/ADL, and CP/ADL was characterized by the relatively high regression coefficient R2
= 0.799 and quite favorable RRMSE of 15%. Additionally, the model was assessed using
38 datasets from the literature. The slope and intercept of the linear regression line of the
PMY versus EMY plot was 0.526 and 84.3, respectively (Fig. 2). For comparison, the
perfect fit was characterized by 1 and 0, respectively (y = x). The low slope of the
regression line suggested that the model tended to underestimate the methane yield. The
low R2 of 0.266 for the datasets analyzed together was evidence of a weak prediction by
the tested model, but it could also be the result of the application of various batch assay
conditions. The validation procedure has shown that the model must be improved to

PEER-REVIEWED ARTICLE bioresources.com
Oleszek et al. (2018). “Biogas from energy crops,” BioResources 13(4), 8505-8528. 8523
increase the precision of the prediction of the methane yield. One of the best models to
predict biochemical methane potential was developed by Thomsen et al. (2014). The model
is based on a large dataset from literature and shows a high R2-value of 0.96, but a slightly
lower RRMSE of 19.7% compared to the present study.
The Kinetics of the Methane Fermentation Process
The analysis of the correlation coefficient showed that the increase in the specific
biogas production rate (μm) due to increased doses of N fertilizer was caused primarily by
the decrease in ADL, which led to an increase in the digestibility of the biomass. The strong
negative influence on μm was also characteristic of the pH. The silage of the lower pH
fermented faster and reached a higher biogas yield in a shorter amount of time. The low
pH was evidence of good quality silage, while a pH that exceeded the optimal value could
be the result of the elevated ADL content, which does not promote the ensiling. Jagadabhi
et al. (2011) states that the low pH of substrates favors the methane fermentation process
due to the fast hydrolysis step, for which the optimal pH is between 4 and 6.
The highest μm for maize and sorghum was associated with high NFC content as
well as low ADL and CA content. The high C/N ratio was not less important. The lowest
μm was noted for triticale and the II/II swath of RCG as a result of the high ADL content
and the low (HCL + CL)/ADL ratio. Even though the sunflower was characterized by the
lowest lignocellulose digestibility, its μm was not the lowest due to the high NFC content.
Wahid et al. (2015) confirms the significant influence of the biomass digestibility on the
specific biogas production rate μm.
The low correlation coefficient (R) for the length of the lag phase (λ) testified to the
lack of influence of the chemical composition on this parameter. In contrast, the reduction
in the total fermentation time (tt) due to the increase in the NFC content and decrease in
the ADL was noticeable.
For the μm, the positive effect of the drop of the substrate pH on tt could be the result
of faster and easier hydrolysis (Jagadabhi et al. 2011). In the present study, the total
fermentation time (tt) was in the range of 27 to 60 days, and was longest for triticale and
RCG IIC, and was the shortest for maize. For comparison, Seppälä et al. (2013) noted a
total fermentation time of the plants substrate in the range of 28 to 35 days, while Weiland
(2006) gave a range of 60 to 90 days.
The reports that concern the application of the Gompertz equation (Eq. 3) for
evaluating the methane fermentation kinetics have been rather scarce, but they have
confirmed that this model is appropriate for the description of such processes. Yusuf et al.
(2011) applied the Gompertz equation to compare the cumulative biogas yield from various
types of manure mixed at different proportions. The authors obtained parameters that are
close to the experimental biogas yield. The lag phase (λ) was notably longer than in the
present study (8.6 days). In contrast, the specific biogas production rate (μm) was much
lower (1.2 to 2.2 dm3 kg-1 d-1). However, it should be mentioned that the fermentation
process was conducted at ambient temperatures, which were in the range of 28 to 33 °C.
The authors observed that the parameter μm decreased with an increasing share of bovine
manure in the mixture, which had a higher ADL content than the horse mixture. The
authors stated that the highest μm was characteristic for the mixture of the most optimal
value of C/N. These results are in accordance with the present study, where the greatest μm
was noted for the highest N level associated with the lowest ADL content and the closest
to the optimal C/N ratio.
PEER-REVIEWED ARTICLE bioresources.com
Oleszek et al. (2018). “Biogas from energy crops,” BioResources 13(4), 8505-8528. 8524
Wahid et al. (2015) uses the Gompertz model to report a higher rate of
biodegradation of biomass from the first swath of caraway and chicory, compared to its
biomass from the second swath and that collected at the one-cutting system. The authors
explain this in terms of the high content of the NDF and ADL fraction, which are associated
with the high temperature and intensity of solar radiation in the later vegetation period.
CONCLUSIONS
1. The N fertilization positively influenced the BD, and thus the efficiency and kinetics
of methane production.
2. These results were closely associated with favorable changes in the biomass chemical
composition, such as a decrease in ADL and positive modification of the proportion of
lignocellulose components expressed as the (HCL + CL)/ADL ratio.
3. For perennials, more efficient biogas production was observed for the biomass
collected at an earlier stage.
4. The methane yield was successfully predicted by the ratios of HCL to NFC and CP to
ADL. The validation showed that the model must be improved to increase the
prediction precision.
ACKNOWLEDGMENTS
This work was financially supported by EU HORIZON 2020 research and the
innovation programme, under project BioEcon, Grant No. 669062.
REFERENCES CITED Amon, T., Amon, B., Kryvoruchko, V., Machmüller, A., Hopfner-Sixt, K., Bodiroza, V.,
Hrbek, R., Friedel, J., Pötsch, E, Wagentristl, H., et al. (2007a). “Methane production
through anaerobic digestion of various energy crops grown in sustainable crop
rotations,” Bioresource Technology 98(17), 3204-3212. DOI:
10.1016/j.biortech.2006.07.007
Amon, T., Amon, B., Kryvoruchko, V., Zollitsch, W., Mayer, K., and Gruber, L. (2007b).
“Biogas production from maize and dairy cattle manure—influence of biomass
composition on the methane yield,” Agriculture, Ecosystems and Environment
118(1), 173-182. DOI: 10.1016/j.agee.2006.05.007
Barbanti, L., Di Girolamo, G., Grigatti, M., Bertin, L., and Ciavatta, C. (2014).
“Anaerobic digestion of annual and multi-annual biomass crops,” Industrial Crops
and Products 56, 137-144. DOI: 10.1016/j.indcrop.2014.03.002
Chen, X., Gu, Y., Zhou, X., and Zhang, Y. (2014). “Asparagus stem as a new
lignocellulosic biomass feedstock for anaerobic digestion: Increasing hydrolysis rate,
methane production and biodegradability by alkaline pretreatment,” Bioresource
Technology 164, 78-85. DOI: 10.1016/j.biortech.2014.04.070
Dandikas, V., Heuwinkel, H., Lichti, F., Drewes, J. E., and Koch, K. (2014). “Correlation
PEER-REVIEWED ARTICLE bioresources.com
Oleszek et al. (2018). “Biogas from energy crops,” BioResources 13(4), 8505-8528. 8525
between biogas yield and chemical composition of energy crops,” Bioresource
Technology 174, 316-320. DOI: 10.1016/j.biortech.2014.10.019
Dębowski, M., Zieliński, M., Kisielewska, M., and Krzemieniewski, M. (2017).
“Anaerobic co-digestion of the energy crop Sida hermaphrodita and microalgae
biomass for enhanced biogas production,” International Journal of Environmental
Research 11(3), 243-250. DOI: 10.1007/s41742-017-0024-4
Drosg, B., Braun, R., Bochmann, G., and Al Saedi, T. (2013). “Analysis and
characterisation of biogas feedstocks,” in: The Biogas Handbook, Woodhead
Publishing, Sawston, United Kingdom, pp. 52-84.
Godin, B., Mayer, F., Agneessens, R., Gerin, P., Dardenne, P., Delfosse, P., and Delcarte,
J. (2015). “Biochemical methane potential prediction of plant biomasses: Comparing
chemical composition versus near infrared methods and linear versus non-linear
models,” Bioresource Technology 175, 382-390. DOI:
10.1016/j.biortech.2014.10.115
Goliński, P., and Jokś, W. (2007). “Właściwości chemiczne i biologiczne traw a
produkcja biogazu [Chemical and biological properties of grasses and biogas
production],” Łąkarstwo w Polsce [Grassland Science in Poland] 10(1), 37-47.
Gröblinghoff, F., and Lütke Entrup, N. (2006). “Gräser in Biogasanlagen – erste
Ergebnisse aus Nordrhein–Westfalen [Grasses in biogas plants - first results from
North Rhine-Westphalia],” GFP–Workshop: Futterpflanzen – Perspektiven für die
energetische Nutzung [GFP-Workshop: Forage Plants - Perspectives for Energy
Use], Freising, Germany, (http://www.lfl.bayern.de/ipz/ gruenland/18480), Accessed
30 May 2018.
Hendriks, A. T. W. M., and Zeeman, G. (2009). “Pretreatments to enhance the
digestibility of lignocellulosic biomass,” Bioresource Technology 100(1), 10-18.
DOI: 10.1016/j.biortech.2008.05.027
Herrmann, A. (2013). “Biogas production from maize: Current state, challenges and
prospects. 2. Agronomic and environmental aspects,” BioEnergy Research 6(1), 372-
387. DOI: 10.1007/s12155-012-9227-x
Jablonowski, N. D., Kollmann, T., Nabel, M., Damm, T., Klose, H., Müller, M., Blasing,
M., Seebold, S., Krafft, S., Kuperjans, I., et al. (2017). “Valorization of Sida (Sida
hermaphrodita) biomass for multiple energy purposes,” GCB Bioenergy 9(1), 202-
214. DOI: 10.1111/gcbb.12346
Jacobi, H. F., Ohl, S., Thiessen, E., and Hartung, E. (2012). “NIRS-aided monitoring and
prediction of biogas yields from maize silage at a full-scale biogas plant applying
lumped kinetics,” Bioresource Technology 103(1), 162-172. DOI:
10.1016/j.biortech.2011.10.012
Jagadabhi, P. S., Kaparaju, P., and Rintala, J. (2011). “Two-stage anaerobic digestion of
tomato, cucumber, common reed and grass silage in leach-bed reactors and upflow
anaerobic sludge blanket reactors,” Bioresource Technology 102(7), 4726-4733. DOI:
10.1016/j.biortech.2011.01.052
Kacprzak, A., Matyka, M., Krzystek, L., and Ledakowicz, S. (2012). “Evaluation of
biogas collection from reed canary grass, depending on nitrogen fertilization levels,”
Chemical Process Engineering 33(4), 697-701. DOI: 10.2478/v10176-012-0059-1
Kalač, P. (2011). “The required characteristics of ensiled crops used as a feedstock for
biogas production: A review,” Journal of Agrobiology 28(2), 85-96. DOI:
10.2478/v10146-011-0010-y
Kandel, T. P., Sutaryo, S., Møller, H. B., Jørgensen, U., and Lærke, P. E. (2013).

PEER-REVIEWED ARTICLE bioresources.com
Oleszek et al. (2018). “Biogas from energy crops,” BioResources 13(4), 8505-8528. 8526
“Chemical composition and methane yield of reed canary grass as influenced by
harvesting time and harvest frequency,” Bioresource Technology 130, 659-666. DOI:
10.1016/j.biortech.2012.11.138
Kaplan, M., Baran, Ö., Ünlükara, A., Kale, H., Arslan, M., Kara, K., Beyzi, S. B., Konca,
Y., and Ulas, A. (2016). “The effects of different nitrogen doses and irrigation levels
on yield, nutritive value, fermentation and gas production of corn silage,” Turkish
Journal of Field Crops 2(1), 100-108. DOI: 10.17557/tjfc.82794
Kowalczyk-Juśko, A., Marczuk, A., Dach, J., Szmigielski, M., Zarajczyk, J.,
Jóźwiakowski, K., Kowalczuk, J., Andrejko, D., Ślaska-Grzywna, B., and
Leszczyński, N. (2015). “Thermochemical and biochemical maize biomass
conversion for power engineering,” Przemysł Chemiczny 94(2), 178-181. DOI:
10.15199/62.2015.2.9
Krishania, M., Kumar, V., Vijay, V. K., and Malik, A. (2013). “Analysis of different
techniques used for improvement of biomethanation process: A review,” Fuel 106, 1-
9. DOI: 10.1016/j.fuel.2012.12.007
Krzemińska, I., and Oleszek, M. (2016). “Glucose supplementation-induced changes in
the Auxenochlorella protothecoides fatty acid composition suitable for biodiesel
production,” Bioresource Technology 218, 1294-1297. DOI:
10.1016/j.biortech.2016.07.104
Li, Y., Zhang, R., Liu, G., Chen, C., He, Y., and Liu, X. (2013). “Comparison of methane
production potential, biodegradability, and kinetics of different organic substrates,”
Bioresource Technology 149, 565-569. DOI: 10.1016/j.biortech.2013.09.063
Luna-delRisco, M., Normak, A., and Orupõld, K. (2011). “Biochemical methane
potential of different organic wastes and energy crops from Estonia,” Agronomy
Research 9(1-2), 331-342.
Mahmood, A., and Honermeier, B. (2012). “Chemical composition and methane yield of
sorghum cultivars with contrasting row spacing,” Field Crops Research 128, 27-33.
DOI: 10.1016/j.fcr.2011.12.010
Mähnert, P., Heiermann, M., and Linke, B. (2005). “Batch-and semi-continuous biogas
production from different grass species,” Agricultural Eng. International 7, 1-11.
Massé, D., Gilbert, Y., Savoie, P., Bélanger, G., Paren, G., and Babineau, D. (2011).
“Methane yield from switchgrass and reed canary grass grown in Eastern Canada,”
Bioresource Technology 102(22), 10286-10292. DOI: 10.1016/j.biortech.2011.08.087
Meeske, R., Van der Merwe, G. D., Greyling, J. F., and Cruywagen, C. W. (2002). “The
effect of adding an enzyme containing lactic acid bacterial inoculant to big round bale
oat silage on intake, milk production and milk composition of Jersey cows,” Animal
Feed Science and Technology 97(3-4), 159-167. DOI: 10.1016/S0377-
8401(01)00352-2
Menardo, S., Airoldi, G., and Balsari, P. (2012). “The effect of particle size and thermal
pre-treatment on the methane yield of four agricultural by-products,” Bioresource
Technology 104, 708-714. DOI: 10.1016/j.biortech.2011.10.061
Monlau, F., Barakat, A., Steyer, J. P., and Carrere, H. (2012). “Comparison of seven
types of thermo-chemical pretreatments on the structural features and anaerobic
digestion of sunflower stalks,” Bioresource Technology 120, 241-247. DOI:
10.1016/j.biortech.2012.06.040
Mursec, B., Vindis, P., Janzekovic, M., Brus, M., and Cus, F. (2009). “Analysis of
different substrates for processing into biogas,” Journal of Achievements in Materials
and Manufacturing Engineering 37(2), 652-659.

PEER-REVIEWED ARTICLE bioresources.com
Oleszek et al. (2018). “Biogas from energy crops,” BioResources 13(4), 8505-8528. 8527
Nahm, M., and Morhart, C. (2018). “Virginia mallow (Sida hermaphrodita (L.) Rusby)
as perennial multipurpose crop: Biomass yields, energetic valorization, utilization
potentials, and management perspectives,” GCB Bioenergy 10(6), 393-401. DOI:
10.1111/gcbb.12501
Nassab, A. D. M., Amon, T., and Kaul, H. P. (2011). “Competition and yield in
intercrops of maize and sunflower for biogas,” Industrial Crops and Products 34(1),
1203-1211. DOI: 10.1016/j.indcrop.2011.04.015
Negri, M., Bacenetti, J., Massimo, B., Manfredini, A., Cantore, A., and Bocchi, S.
(2014). “Biomethane production from different crop systems of cereals in Northern
Italy,” Biomass & Bioenergy 63, 321-329. DOI: 10.1016/j.biombioe.2014.01.041
Oleszek, M., Król, A., Tys, J., Matyka, M., and Kulik, M. (2014). “Comparison of biogas
production from wild and cultivated varieties of reed canary grass,” Bioresource
Technology 156, 303-306. DOI: 10.1016/j.biortech.2014.01.055
Oleszek, M., and Matyka, M. (2017). “Nitrogen fertilization level and cutting affected
lignocellulosic crops properties important for biogas production,” BioResources
12(4), 8565-8580. DOI: 10.15376/biores.12.4.8565-8580
Oleszek, M., Matyka, M., Lalak, J., Tys, J., and Paprota, E. (2013). “Characterisation of
Sida Hermaphrodita as a feedstock for anaerobic digestion process,” Journal of
Food, Agricultural and Environment 11(3-4), 1839-1841.
Oleszek, M., Tys, J., Wiącek, D., Król, A., and Kuna, J. (2016). “The possibility of
meeting greenhouse energy and CO2 demands through utilisation of cucumber and
tomato residues,” BioEnergy Research 9(2), 624-632. DOI: 10.1007/s12155-015-
9705-z
Oslaj, M., Mursec, B., and Vindis, P. (2010). “Biogas production from maize hybrids,”
Biomass & Bioenergy 34(11), 1538-1545. DOI: 10.1016/j.biombioe.2010.04.016
Peyraud, J. L., and Astigarraga, L. (1998). “Review of the effect of nitrogen fertilization
on the chemical composition, intake, digestion and nutritive value of fresh herbage:
Consequences on animal nutrition and N balance,” Animal Feed Science and
Technology 72(3-4), 235-259. DOI: 10.1016/S0377-8401(97)00191-0
Prochnow, A., Heiermann, M., Plöchl, M., Linke, B., Idler, C., Amon, T., and Hobbs, P.
J. (2009). “Bioenergy from permanent grassland–A review: 1. Biogas,” Bioresource
Technology 100(21), 4931-4944. DOI: 10.1016/j.biortech.2009.05.070
Rath, J., Heuwinkel, H., and Herrmann, A. (2013). “Specific biogas yield of maize can be
predicted by the interaction of four biochemical constituents,” BioEnergy Research
6(3), 939-952. DOI: 10.1007/s12155-013-9318-3
Schittenhelm, S. (2008). “Chemical composition and methane yield of maize hybrids
with contrasting maturity,” European Journal of Agronomy 29(2), 72-79. DOI:
10.1016/j.eja.2008.04.001
Seppälä, M., Laine, A., and Rintala, J. (2013). “Screening of novel plants for biogas
production in northern conditions,” Bioresource Technology 139, 355-362. DOI:
10.1016/j.biortech.2013.04.014
Seppälä, M., Paavola, T., Lehtomäki, A., and Rintala, J. (2009). “Biogas production from
boreal herbaceous grasses–Specific methane yield and methane yield per hectare,”
Bioresource Technology 100(12), 2952-2958. DOI: 10.1016/j.biortech.2009.01.044
Svoboda, N., Taube, F., Kluß, C., Wienforth, B., Kage, H., Ohl, S., Hartung, E., and
Herrmann A. (2013). “Crop production for biogas and water protection—A trade-
off?,” Agriculture Ecosystems and Environment 177, 36–347 DOI:
10.1016/j.agee.2013.05.024
PEER-REVIEWED ARTICLE bioresources.com
Oleszek et al. (2018). “Biogas from energy crops,” BioResources 13(4), 8505-8528. 8528
Thomsen, S. T., Spliid, H., and Østergård, H. (2014). “Statistical prediction of
biomethane potentials based on the composition of lignocellulosic biomass,”
Bioresource Technology 154, 80-86. DOI: 10.1016/j.biortech.2013.12.029
Triolo, J. M., Sommer, S. G., Møller, H. B., Weisbjerg, M. R., and Jiang, X. Y. (2011).
“A new algorithm to characterize biodegradability of biomass during anaerobic
digestion: Influence of lignin concentration on methane production potential,”
Bioresource Technology 102(20), 9395-9402 DOI: 10.1016/j.biortech.2011.07.026
Tsavkelova, E. A., and Netrusov, A. I. (2012). “Biogas production from cellulose-
containing substrates: A review,” Applied Biochemistry and Microbiology 48(5), 421-
433. DOI: 10.1134/S0003683812050134
VDI 4630 (2006). “Fermentation of organic materials, characterisation of substrate,
sampling, collection of material data, fermentation tests,” VDI Gesellschaft
Energietechnik [Company Energy Technology], Düsseldorf, Germany.
Von Cossel, M., Möhring, J., Kiesel, A., and Lewandowski, I. (2017). “Methane yield
performance of amaranth (Amaranthus hypochondriacus L.) and its suitability for
legume intercropping in comparison to maize (Zea mays L.),” Industrial Crops and
Products 103, 107-121. DOI: 10.1016/j.indcrop.2017.03.047
Wagner, A. O., Lins, P., Malin, C., Reitschuler, C., and Illmer, P. (2013). “Impact of
protein-, lipid- and cellulose-containing complex substrates on biogas production and
microbial communities in batch experiments,” Sci. Total Environ. 458-460, 256-266.
Wahid, R., Ward, A. J., Møller, H. B., Søegaard, K., and Eriksen, J. (2015). “Biogas
potential from forbs and grass-clover mixture with the application of near infrared
spectroscopy,” Bioresource Technology 198, 124-132. DOI:
10.1016/j.biortech.2015.08.154
Ward, A. J., Hobbs, P. J., Holliman, P. J., and Jones, D. L. (2008). “Optimisation of the
anaerobic digestion of agricultural resources,” Bioresource Technology 99(17), 7928-
7940. DOI: 10.1016/j.biortech.2008.02.044
Weiland, P. (2006). “Biomass digestion in agriculture: A successful pathway for the
energy production and waste treatment in Germany,” Engineering in Life Sciences
6(3), 302-309. DOI: 10.1002/elsc.200620128
Wu, P., Dai, Q., and Tao, Q. (1993). “Effect of fertilizer rates on the growth, yield, and
kernel composition of sweet corn,” Communications in Soil Science and Plant
Analysis 24(3-4), 237-253. DOI: 10.1080/00103629309368795
Yusuf, M. O. L., Debora, A., and Ogheneruona, D. E. (2011). “Ambient temperature
kinetic assessment of biogas production from co-digestion of horse and cow dung,”
Research in Agricultural Engineering 57(3), 97-104.
Zheng, Y., Zhao, J., Xu, F., and Li, Y. (2014). “Pretreatment of lignocellulosic biomass
for enhanced biogas production,” Progress in Energy and Combustion Science 42,
35-53. DOI: 10.1016/j.pecs.2014.01.001
Zieliński, M., Grala, A., Dębowski, M., and Dudek, M. (2013). “Respirometric method of
vulnerability assessment on the distribution of plant substrates in a mesophilic
anaerobic digestion,” Ecological Engineering 2013(33), 191-199. DOI:
10.12912/23920629/360
Article submitted: July 4, 2018; Peer review completed: Sept. 9, 2018; Revised version
received and accepted: Sept. 22, 2018: Published: September 26, 2018.
DOI: 10.15376/biores.13.4.8505-8528