peer-reviewed academic journal innovative issues … academic journal innovative issues and...
TRANSCRIPT
Peer-reviewed academic journal
Innovative Issues and Approaches in Social Sciences
IIASS – VOL. 10, NO. 1, JANUARY 2017
Innovative Issues and Approaches in Social Sciences IIASS is a double blind peer review academic journal published 3 times yearly (January, May, September) covering different social sciences: political science, sociology, economy, public administration, law, management, communication science, psychology and education. IIASS has started as a SIdip – Slovenian Association for Innovative Political Science journal and is now being published in the name of CEOs d.o.o. by Zalozba Vega (publishing house).
Typeset This journal was typeset in 11 pt. Arial, Italic, Bold, and Bold Italic; the headlines were typeset in 14 pt. Arial, Bold
Abstracting and Indexing services COBISS, International Political Science Abstracts, CSA Worldwide Political Science Absgtracts, CSA Sociological Abstracts, PAIS International, DOAJ, Google schoolar.
Publication Data: CEOs d.o.o. Innovative issues and approaches in social sciences, 2017, vol. 10, no. 1 ISSN 1855-0541
Additional information: www.iiass.com
Editors: Albin Panič, ret. prof. at University of Ljubljana and director of the Institute of Macroeconomic Analysis and Development of the Republic of Slovenia (Slovenia) - [email protected] Nataša Pržulj, prof. at Imperial College London (UK) [email protected] Warren Master – editor of The Public Manager (USA) [email protected] Lasha Tchantouridze, prof. at University of Manitoba (Canada) [email protected] Editorial board: Ph.D. Daniel Klimovský - Technical university of Košice (Slovakia) [email protected] Ph.D. Michaela Batorova - University of Tampere (Finland) [email protected] Ph.D. Aleksandra Tabaj - University Rehabilitation Institute - Republic of Slovenia (Slovenia) - [email protected] Ph.D. Diana CameliaIancu - National School of Politics and Public Administration Bucharest (Hungary) - [email protected] Ph.Dr. Viera Žúborová - University of St. Cyril and Methodius in Trnava (Slovakia) - [email protected] Ph. D. Dejan Jelovac - School of Advanced Social Studies (Slovenia) - [email protected] Ph. D. Inez Zsófia Koller, - University of Pécs (Hungary) - [email protected] Ph.D. Katarzyna Radzik Maruszak - University of Marie Curie Sklodowska Lublin (Poland) - [email protected] Ph.Dr. Jaroslav Mihalik - University of St. Cyril and Methodius in Trnava (Slovakia) - [email protected] M.A. Simon Delakorda - Institute for Electronic Participation (Slovenia) [email protected] Ph.D. Sandra Jednak - University of Belgrade (Serbia) [email protected] Ph.D. Piotr Sitniewski - Bialystok School of Public Administration (Poland) - [email protected] Ph.D. Uroš Pinterič - Faculty of Social Sciences, University of SS. Cyril and Methodius Trnava (Slovakia) [email protected] Ph.D. Aleksandar Marković - University of Belgrade (Serbia) [email protected] Language editor: M.A.Tanja Kovačič
Innovative Issues and Approaches in Social Sciences, Vol. 8, No. 1
| 4
NUARY 2012

Innovative Issues and Approaches in Social Sciences, Vol. 8, No. 1
| 5
www.thepublicmanager.org
NUARY 2012
The Infrastructural program of Faculty for media –collecting, managing and archiving data on media literacy
»The Infrastructural program of Faculty for media – collecting, managingand archiving data on media literacy« will collect data, analyze trendsand indicators about media literacy in Slovenia throughout a longerperiod of time.
Media literacy is becoming an increasingly important part of EU andnational programs in media and communication sectors. In the last fewyears European institutions have systematically called for measurementand improvement of media literacy. The Resolution of EuropeanParliament clearly assigns European commission to prepare asystematic global overview and reporting of different aspects of medialiteracy in Europe. The infrastructural program will offer support forsuccessful research at the Faculty for media as well as in other nationaland international programs for media and communication research.Gathered and publicly published data presents a basis for differentresearch projects in Slovenija and abroad.
We gather data about media literacy in these contexts:• gathering of data on projects, programms and other activities
concerning media literacy in Slovenia – the creation of asystematical database of projects about media literacy ondifferent levels by different players;
• the creation of a database of best practices in accordance withrecommendations of the European Commission;
• the creation of a database of institutions and organizations (EUand national) that are involved in media literacy research, whichwill enable the international cooperation of researchers;
• gathering of data on Slovenian media literacy for the purpose ofinternational comparison;
• statistical analysis of gathered data.
More information on www.pismenost.si
Keywords: media literacy, public, media, communication, audiovisualcontent

Contents
USE OF FACEBOOK FOR ENHANCING STUDENTENGAGEMENT IN A HIGHER EDUCATION BLENDEDENGINEERING COURSE
Ravi Foogooa, Debra Ferdinand-James 8
SHOULD I TEXT OR SHOULD I TALK? TRANSFORMATIONSOF COMMUNICATIVE PRACTICES BY MOBILE PHONES
Tadej Praprotnik 32
ELECTRONIC MONITORING IN THE WORKPLACE 54Mateja Gorenc 54
CULTURAL CAPITAL AND SCHOOL SUCCESS: A STUDY ONSTUDENTS OF CLASS-XI IN SYLHET CITY CORPORATION,BANGLADESH
Al Amin Rabby, Mohammed Anwar Hossain, Md.AbdulGhani 87
GLOBALIZATION AND INDICATORS OF UNCERTAINTYMatjaž Škabar 105
ASPECTS OF MOTOR DEVELOPMENT IN CHILDREN WITHCEREBRAL PALSY
Erna Žgur 117
NEW MODEL OF QUALITY ASSESSMENT IN PUBLICADMINISTRATION - UPGRADING THE COMMONASSESSMENT FRAMEWORK (CAF)
Mirna Macur, Bojan Radej 127
Innovative Issues and Approaches in Social Sciences, Vol. 10, No. 1
| 8
USE OF FACEBOOK FOR ENHANCING STUDENTENGAGEMENT IN A HIGHER EDUCATION BLENDED
ENGINEERING COURSE
Ravi Foogooa1, Debra Ferdinand-James2
AbstractIn spite of the fact that many universities include blended learning inoffering their programmes, student engagement in courses remains achallenge. This research started off as an investigation into the use ofthe Learning Management System (LMS) by students of an engineeringcourse and into ways to improve student engagement. The heavy usageof social media by the students prompted us to find how Facebook couldbe used in a course in conjunction with an LMS. A closed Facebookgroup was created by the lecturer and used to interact with the class.Data collection was done through an online survey of the students at theend of the class. A social media analytics software was also used toanalyse the interactions on the Facebook group. A journal was also keptfor the lecturer’s thoughts throughout the class. To avoid bias, thesecond author, an educational technologist whose conference paper onSocial Media inspired this one, was involved in the analysis andinterpretation of the data.The results were very encouraging. A majorityof students were actively engaged by the Facebook group. However,this research put into perspective a series of potential issues with theuse of Facebook or any other social media in higher education whichwould warrant further research.
Keywords: social media, higher education, learning managementsystems, student engagement
DOI: http://dx.doi.org/10.12959/issn.1855-0541.IIASS-2017-no1-art1
1 Ravi Foogooa, MBA is a lecturer at the School of Innovative Technologies &Engineering at the University of Technology, Mauritius. His research interests aresustainable software engineering, green ict and blended education. Contact information:[email protected]
2 Debra Ferdinand-James, PhD is an educational technologist at the School ofEducation at the University of West Indies, Trinidad. Her research interests are facultyengagement in blended learning, technology-enhanced learning, mixed methodsresearch, academic writing, and curriculum inclusiveness. Contact information:[email protected]
Innovative Issues and Approaches in Social Sciences, Vol. 10, No. 1
| 9
IntroductionIn today’s hi-tech lifestyle, we blend technology into our lives as aneveryday experience such as for shopping, paying bills, banking,socialising, and communicating (Glazer, 2012). Hence, universitiesworldwide now include blended learning in offering their programmes.Blended learning can be defined as “an integrated and plannedapproach to teaching and learning that appropriately combines face-to-face and online strategies and technologies to advance student-centredlearning” (The University of the West-Indies, 2012, p. 1). But, the use ofa specialised learning management system (LMS) such as Moodlededicated to delivering online sessions for non-technical subjects is achallenge in a Telecommunications Engineering blended program at aUniversity in Mauritius. Students often view such subjects as superfluousdespite the fact they are part of programmes approved by engineeringcouncils. As attendance is flexible at this university that offers blendedprogrammes, many students do not attend F2F classes except for classtests, assignment submissions and other milestones. Registeredstudents have access to lecture notes, reading materials and participateremotely in class discussions via the course’s LMS. Yet, these remote orasynchronous sessions (i.e., delayed student-teacher interaction online)in Moodle also suffer from low student attendance and interaction indelivering a Project Management course in a TelecommunicationsEngineering program. Social media appears to be a viable alternative tothe prescribed LMS discussion tool as youths frequently use it as theirmedium of communication (Facebook, 2013). Social media refers to “aset of online tools that support social interaction among users” (UWI,Social Media Policy, 2013, p.1).The purpose of this research study is toinvestigate how Facebook, a social media platform popular amongMauritian students, can be used to enhance student engagement in aproject management course with low online participation in theprescribed LMS.The research questions which directed this study were as follows:
1) To what extent do students use a prescribed learningmanagement system in a selected blended course?
2) To what extent does the use of the Facebook social media siteenhances student engagement in a selected blended course?
This research was carried out by the first author, who was also thelecturer delivering the Project Management course. Pring (2000) andLouisy (1997) advocated that inside researchers depict a more genuineimage of reality because of their socio-cultural immersion inside the field.In contrast, Tuhiwai-Smith (2004, p. 139) contend that both internal andexternal researchers are ‘problematic’ but attempt to resolve theirdilemma by humbly engaging in critical self-analysis. Thus, I take thestance of Pring (2000) and Louisy (1997) as an inside researcher in
Innovative Issues and Approaches in Social Sciences, Vol. 10, No. 1
| 10
wanting to depict a more genuine account of reality by being socially andculturally immersed in my research. Still, with ample opportunity forproper insight into my research, there can also be the risk of researcherbias. Therefore, the second author, a researcher with experience ineducation technology and not participating directly in the intervention,was able to correct any possible bias in the data collection andinterpretation. The students were informed of the problem of low studentattendance and engagement and that their participation in the researchstudy was voluntary. They were also informed that the prime studyobjective was to enhance student engagement and attendance insuccessfully delivering the module on Project Management for thesemester with the use of Facebook.
Literature ReviewThe growing trend of universities worldwide offering blended programsand courses has prompted an increase in the use of mobile devices toaccess such programmes. Gikas and Grant (2013) indicated thatstudents claimed mobile devices had certain advantages for learning,including the following: quick access to information anywhere andanytime, facilitating communication and collaboration, varied ways oflearning, and opportunities for situated learning. Watson and Ferdinand(2015) supported this view in finding much success in using the onlinedebate as a learning strategy in their online courses which studentscould access via their mobile devices. In contrast, Gikas and Grant(2013) also found that students experience frustrations in accessing theirhigher education programmes using mobile devices that included thefollowing: uncooperative instructors, technical problems on devices, andthe distractive nature of these devices and their applications. Indeveloping countries, other problems related to accessing coursesonline include insufficient bandwidth and unreliable electrical supply(Rooyen, 2015; Hussain, 2012). Although students are more prepared touse technology, recent research showed that some are less inclined tobe involved in courses that use technology than before (Dahlstrom et al.2015). However, it appears that social media as a forum do appeal toMauritian youth, who were inclined to participate using Facebook forclass activities as reported by Ferdinand (2013). The current studywould build on existing research in assessing whether the same holdstrue in using Facebook for class activities as an alternative to theprescribed LMS.
The main uses of social media include communication, collaboration,sharing of internal resources, accessing external resources and self-managed learning (Cheung et al. 2011; Manca & Ranieri 2013).Although social media is supposedly used for social interaction, many
Innovative Issues and Approaches in Social Sciences, Vol. 10, No. 1
| 11
students, out of the 30 minutes spent daily on Facebook, spend moretime observing content rather than actually posting content (Pempek etal. 2009). Social media is also popular in universities in the developingworld – it is used for entertainment as well as to support highereducation with tasks such as resource sharing and communication(Falahah & Rosmala, 2012; Hussain, 2012). Thompson et al. (2014)found that students involved in the use of social media technologiesexhibited a certain sense of personal and group engagement in learning,but evidence of collective intelligence was still lacking.Roblyer et al. (2013) revealed that students were more liable to useFacebook than academics who preferred more traditional technologies.Vie (2008) was more concerned about teachers who are less familiarwith social networking and were thus not able to integrate thesetechnologies into their teaching. Academics seem to perceive Facebookmore as a social tool rather than a pedagogical tool and reported thatSocial media use in higher education in Italy was still limited andrestricted. Some academics appear to have a positive attitude towardsocial media but were reluctant to integrate them into their teaching,especially in an institutional manner. Reasons range from culturalresistance to pedagogical issues and institutional constraints. Overall,academics seem to have mixed feelings about social media with theperceived risks being higher than the perceived usefulness (Manca &Ranieri, 2016). Nevertheless, the current authors are open to exploringthe use of Facebook in taking advantage of its perceived usefulness forclass activities.
Friesen and Lowe (2012) compared social media with television andclaimed that due to their commercial nature, their potential for educationand learning is limited. Similarly, Hew (2011) and Lee (2014) found thatthe use of social media was not related to the use of higher orderthinking skills and was used mainly to connect with people in an onlinespace. Apparently, social media is used more to visualise resourcesrather to critique resources or create new materials (Manca & Ranieri2016). In addition, Kirschner and Karpinski (2010) contended that thesupposed ability of digital natives to multi-task can be detrimental to theirlearning. They found that Facebook users have lower GPAs and studiedfewer hours per week compared to non-users. Conversely, the use ofWeb 2.0 technologies in informal learning spaces revealed that learningdoes occur with students practicing self-regulation learning to this end(Scott et al. 2015).
There are privacy issues both for students and teachers as they discloseinformation on themselves when they add one another as friends aspointed by (Maranto & Barton 2010) (Hew 2011). However, students are
Innovative Issues and Approaches in Social Sciences, Vol. 10, No. 1
| 12
for the institutional use of their data for educational purposes and this isalready exploited in existing learning management systems (Dahlstromet al. 2015). Other researchers such as (Sobaih et al. 2016) reportbarriers which are specific to developing countries. It is thus important toconsider socio-cultural aspects when making use of social media inhigher education.
Balakrishnan and Gan (2016) warned that social media should beincluded only after well-defined goals and clear guidelines for its use aredetermined. They pointed out that students with different learning styleshave different preferences on social media with introverts preferringanonymity and asynchronous communication as compared to extrovertspreferring collaboration and chatting. Moreover, the use of social mediais regulated by the Government for political in Malaysia – “misuse” couldthus result in an offence being committed by lecturers or students. Somestudents are also uncomfortable with the use of informal tools such asFacebook. The current study would help to determine whether thisuneasiness by some students for using Facebook in class activities is aprevailing or decreasing trend.
Although social media such as Facebook is popular among somestudents and academics, its educational usefulness is far from proven -there is ample evidence for it but there is also worrying evidence againstit. The latter warrants further research in discovering how social mediacan enhance student engagement and contribute to higher forms oflearning according to the revised Bloom’s Taxonomy (Krathwohl 2002).The current study would help to add to the limited literature on theperceived usefulness or uselessness of Facebook as an informallearning space for class activities.
Research MethodologyThe research took place in a course on project management withsecond year Telecommunications engineering students. The researchapproach consisted of two parts. The first one involved setting up aclosed group on Facebook for interaction between the students and thelecturer for a period of about 6 weeks (out of a semester of 15 weeks).The second part involved collecting feedback and reflecting on theintervention through the journal of the lecturer, analysis of Facebookposts and via an online survey administered to the students at the end ofthe semester.
Facebook was chosen as it is the most popular social media used byMauritian students. It is also used by older people and in this case, thelecturer also had a Facebook account. One of the problems faced was
Innovative Issues and Approaches in Social Sciences, Vol. 10, No. 1
| 13
the lack of participation of the students on the LMS (powered by Moodle)used by the lecturer in his class. So as the students were active onFacebook, it seemed interesting to move to their social space tostimulate participation.
Thus, although all lecture notes and reading materials were posted onthe LMS, the Facebook group was used for all interactions concerningassignments – there were two assignments given in the course: anindividual feasibility study assignment and a collaborative planningassignment done in groups of three. The assignments were given at thebeginning of the 15-week semester but by mid semester, there wasbarely any progress on the students’ part. Then the Facebook group wascreated, and the students were asked to post their work on theFacebook group for the lecturer to comment. The students were alsorequested to critique the work of their peers. This activity was notmarked but encouraged (the lecturer would only comment any work ifthere had been at least one meaningful comment). Posts concernedmostly the assignments although some discussions were held in thecontext of revision for class test and exams.
The students were informed that the Facebook group was being createdto stimulate participation and also formed part of a research study forpublication by the lecturer. All 23 students volunteered to participate.Two students did not want to post their work on the group at thebeginning and were allowed to request feedback from the lecturerthrough email. Review of students’ progress was not done in face-to-face sessions due to lack of time. Although the Facebook group wascreated and administered by the lecturer, the student representative wasalso made Administrator of the group to promote the collective nature ofthe group. Students like to feel in charge of such interactions.
As there were a substantial number of posts over the duration of theexperiment, the help of software was sought to analyse the posts.Several software for analysis of Facebook posts such as SimplyMeasured, Social Bakers amongst others exist. However, they are moreconcerned with analysis of posts for a Fan page and not for a Facebookgroup. Other software such as Google Analytics are more gearedtowards the analysis of Internet traffic to a website coming fromFacebook. Fortunately, we found one software named Grytics (availableat https://grytics.com/) that allowed the analysis of posts for Facebookgroups. It is available freely but for our research, a ‘pro’ package wastaken to allow analysis for a period up to 90 days. An automatic reportwas generated for the analysis of students’ posts. A survey was alsocarried out with the students at the end of the semester (but before the
Innovative Issues and Approaches in Social Sciences, Vol. 10, No. 1
| 14
exams). The survey was administered electronically with Google Formswhich also provided a summary of responses.The thoughts of the first author were also kept in an electronic diary torecord his own experiences and to allow for reflective thematic analysisof the data and to uncover meaning out of the experiment.
Results & Analysisa. Lecturer thoughts
The group started on May 9, 2016 around mid-semester. Attendancehad been low. No progress had been made on assignments issuedsince Week 1. Moreover, students did not seem to even access theiraccounts on Moodle. After reading a paper on the use of Facebook toteach English in a secondary school in Mauritius, I decided to tryFacebook. Most students are permanently connected to Facebook andso, it seemed a good idea to go and get them in their territory. I askedthe students to add me as their friend so that I could add them to thegroup. I expected some of them to resist due to the age gap and the factthat not everyone wants a teacher as a Facebook friend. I was also waryof letting them into my social space. I usually only add students oncethey leave the university, and I am selective. The first day I wasencouraged by the good response. They seemed to like the idea ofhaving a Facebook group. I uploaded some additional reading to lurethem. It was not necessary – in a few days I had the whole class.Initially, the students were reluctant to post on the group page. Theyappreciated the proximity with the lecturer though. However, theypreferred to use private messaging to ask questions about theirassignments. I also did not have enough time to review assignments inclass. Those who were asking questions were asked to post their workon the Facebook group page. Many of the questions on the Facebookgroup concerned tutorials and notes that were already posted on theLMS. Obviously, these students were not using the course website. I didnot duplicate materials on the Facebook group – all notes, tutorials, mainreadings and assignment submission were left for the course LMS. Thegroup was used mainly for interactions. Nevertheless the response wasso overwhelming that I wondered if I should move the class to theFacebook group.After a week, I was submerged with reviews. This group required aboutone hour of my time every day. Students liked it when I reviewed theirwork in the minutes or hours which followed their post whether it is in themiddle of the day or late at night. However, the reviews took a toll onme. I was tired and started shying away from Facebook itself. Theexpectations of the students were too high though and I could not letthem down. I even reviewed work during weekends. I was extremelypleased with the effort which was being provided by the students.
Innovative Issues and Approaches in Social Sciences, Vol. 10, No. 1
| 15
I needed them to move to another level though. I wanted them tocriticise one another’s work. So I put a rule that I would not reviewinterim work until someone else reviewed the work. This worked but thereviews were not meaningful – it was mostly like “Good work” or even“Nice title”. I told the students that any review would have to be at least20 words. It seemed to do the “trick”. Reviews became more interesting.The more interesting part is that students were inspired by their friends’work. I was weary in case some were upset by the criticism. However,everyone took negative criticism very well, and there were no incidentswhich required my intervention.
The reviews kept coming. I had to take breaks in between them. Thestudents were very sporty when I was late though. There were no nastycomments – merely repeated requests. Some students still had to clarifymy answers in class or in my office. One student told me that he wouldnot post his work on the group as he was using it to participate in acompetition. In the last days, the students resorted to private messagingagain to ask questions on exams. I suppose they need some privacy forsome issues. Overall, it was an extraordinary experience. I needed theformal feedback from survey to confirm the positive results though. Itwould also help to review the delivery of the lecture next semester.
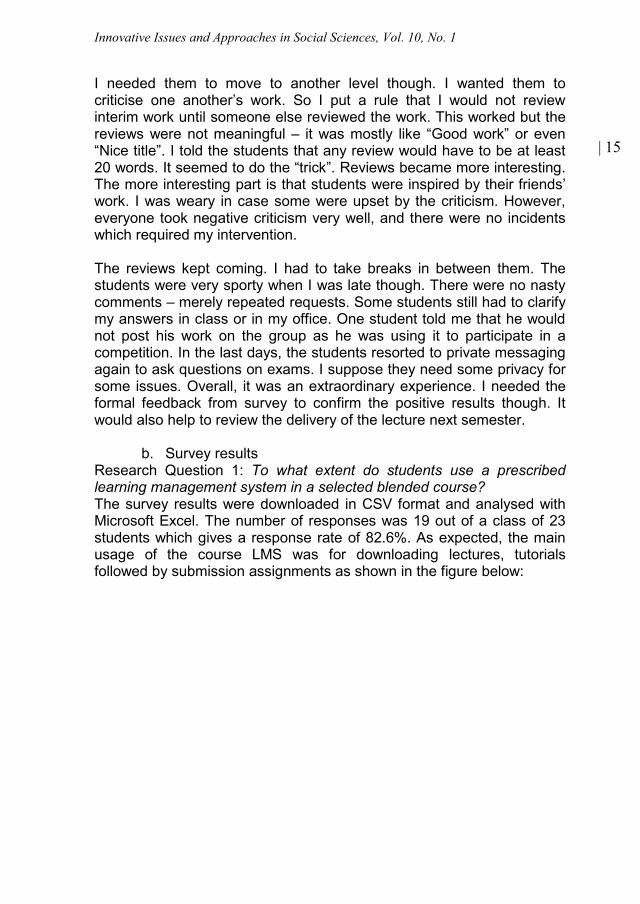
b. Survey resultsResearch Question 1: To what extent do students use a prescribedlearning management system in a selected blended course?The survey results were downloaded in CSV format and analysed withMicrosoft Excel. The number of responses was 19 out of a class of 23students which gives a response rate of 82.6%. As expected, the mainusage of the course LMS was for downloading lectures, tutorialsfollowed by submission assignments as shown in the figure below:
Innovative Issues and Approaches in Social Sciences, Vol. 10, No. 1
| 16
Figure 1: Usage of Moodle course website
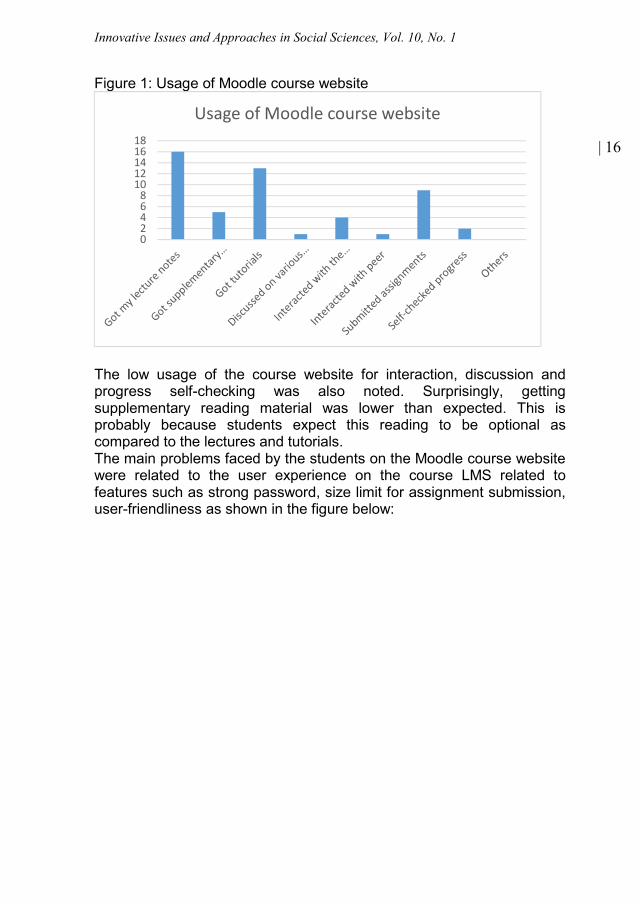
The low usage of the course website for interaction, discussion andprogress self-checking was also noted. Surprisingly, gettingsupplementary reading material was lower than expected. This isprobably because students expect this reading to be optional ascompared to the lectures and tutorials.The main problems faced by the students on the Moodle course websitewere related to the user experience on the course LMS related tofeatures such as strong password, size limit for assignment submission,user-friendliness as shown in the figure below:
02468
1012141618
Usage of Moodle course website
Innovative Issues and Approaches in Social Sciences, Vol. 10, No. 1
| 17
Figure 2: Problems faced on Moodle course website
However, lack of interaction on the LMS also came up high on the list ofproblems. The latter shows that there was an expectation of interactionfrom the students and this expectation was not met by the course LMS.It seems that the possibilities of Moodle for interacting with studentshave not been put to their maximum use in this case. Other contextualproblems such as connection problems and response time were verylow in the list of problems. This shows that students are equipped inmost cases to access the course website. Registration problems reportsby one student was a bit surprising as students were registered by thelecturer due to issues related to automatic student registration. Therewere also a few students who had problems to print the materials postedon the course website. This preference of students for hard copyhandouts is in line with (Foogooa & Panchoo 2012). The problems areprobably related to the difficulty or cost of printing the notes.
0 1 2 3 4 5 6 7 8 9
Registration was tedious
The system was slow
The system did not make me feel secure
It was painful to print the notes afterwards
The lecturer did not give feedback promptly
We did not feel part of the community
The ads on the free hosting disturbed me
Other
Problems faced on Moodle course website
Innovative Issues and Approaches in Social Sciences, Vol. 10, No. 1
| 18
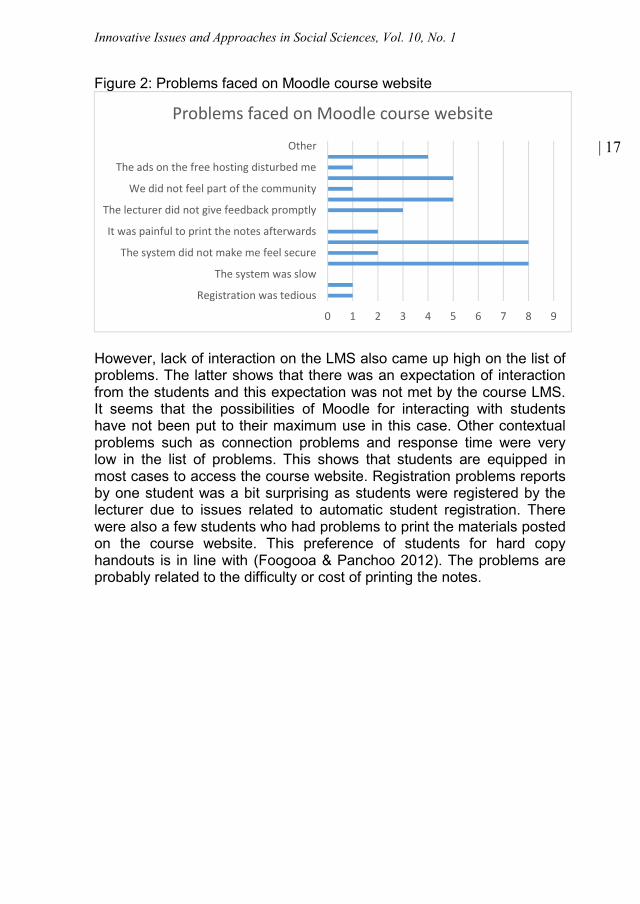
Research Question 2: To what extent does the use of the Facebooksocial media site enhances student engagement in a selected blendedcourse?
The usage of the Facebook group by the students is shown in the figurebelow:Figure 3: Usage of Facebook Group
It is clear that the Facebook met the interaction expectations of thestudents – interacting with the lecturer, getting comments on their workby the lecturer and their peer and commenting on the work of their peerwere among the top uses. This also shows that this interaction may alsohave contributed to the students trying out higher forms of learning asper Bloom’s taxonomy (Krathwohl 2002). It was surprising to see morepeople find additional reading material on the Facebook group than onthe course website. In fact, standard additional reading material wasgenerally posted on the Moodle course website. However, in the courseof interaction with the students, ad-hoc supplementary materials wereposted on the Facebook group following their requests or to make thepoint of some discussions. It would seem that these were more noticedthan the ones on the course LMS. One might conclude that studentsneed to be more convinced for reading supplementary material insteadof expecting automatic compliance to instructions. One comforting resultwas that no respondent complained that he/she did not use theFacebook group at all.However, the usage of the Facebook group was not without its ownproblems as shown in the figure below:
0
5
10
15
20
Usage of Facebook Group
Innovative Issues and Approaches in Social Sciences, Vol. 10, No. 1
| 19
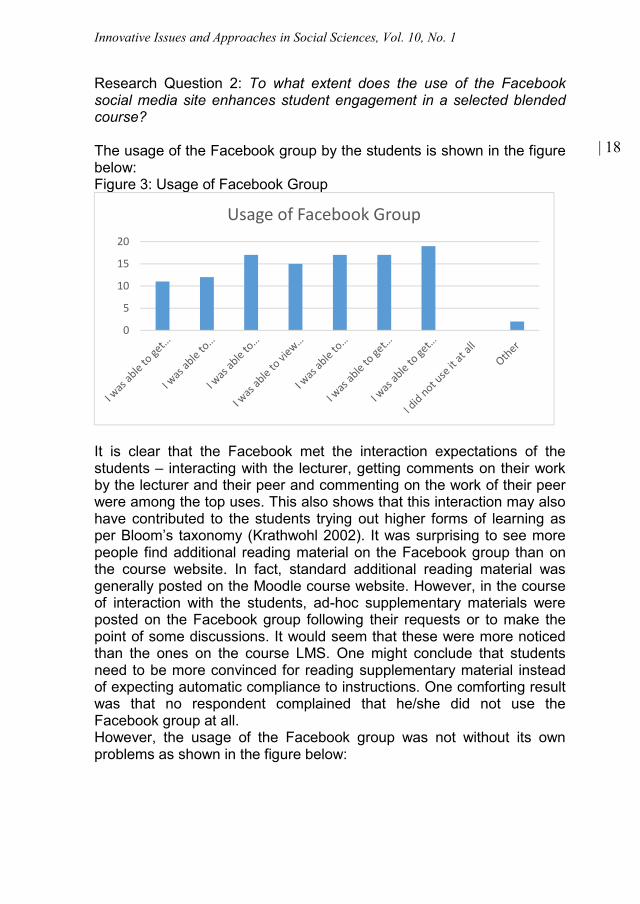
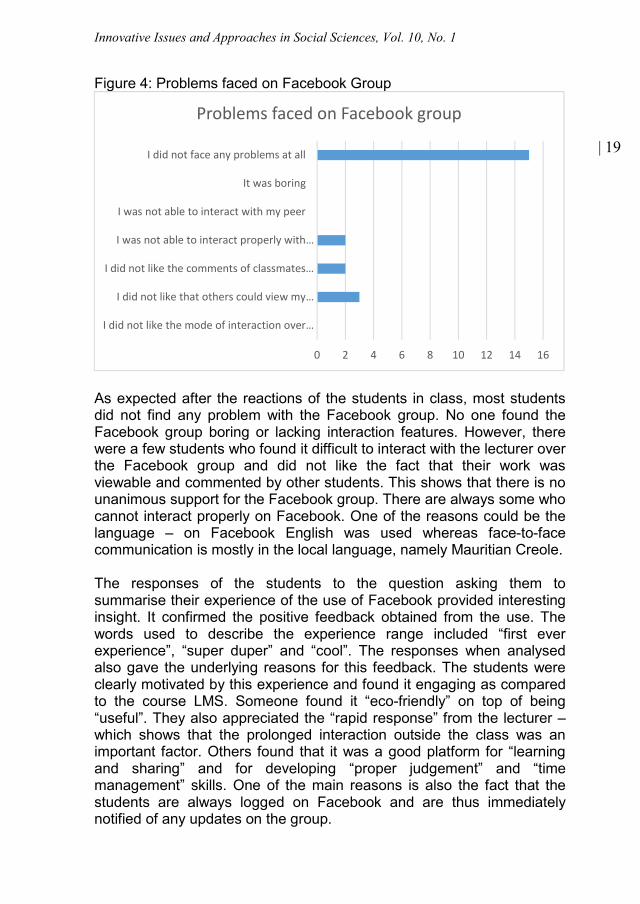
Figure 4: Problems faced on Facebook Group
As expected after the reactions of the students in class, most studentsdid not find any problem with the Facebook group. No one found theFacebook group boring or lacking interaction features. However, therewere a few students who found it difficult to interact with the lecturer overthe Facebook group and did not like the fact that their work wasviewable and commented by other students. This shows that there is nounanimous support for the Facebook group. There are always some whocannot interact properly on Facebook. One of the reasons could be thelanguage – on Facebook English was used whereas face-to-facecommunication is mostly in the local language, namely Mauritian Creole.
The responses of the students to the question asking them tosummarise their experience of the use of Facebook provided interestinginsight. It confirmed the positive feedback obtained from the use. Thewords used to describe the experience range included “first everexperience”, “super duper” and “cool”. The responses when analysedalso gave the underlying reasons for this feedback. The students wereclearly motivated by this experience and found it engaging as comparedto the course LMS. Someone found it “eco-friendly” on top of being“useful”. They also appreciated the “rapid response” from the lecturer –which shows that the prolonged interaction outside the class was animportant factor. Others found that it was a good platform for “learningand sharing” and for developing “proper judgement” and “timemanagement” skills. One of the main reasons is also the fact that thestudents are always logged on Facebook and are thus immediatelynotified of any updates on the group.
0 2 4 6 8 10 12 14 16
I did not like the mode of interaction over…
I did not like that others could view my…
I did not like the comments of classmates…
I was not able to interact properly with…
I was not able to interact with my peer
It was boring
I did not face any problems at all
Problems faced on Facebook group
Innovative Issues and Approaches in Social Sciences, Vol. 10, No. 1
| 20
The responses also provided the reasons for those not liking theFacebook group experience. It would seem that they felt that not all thework submitted was reviewed or reviewed fast enough. It would seemthat there should be an agreement on the expectations of the students interms of delay to review work. As per our records, all work was reviewedwithin a couple of days. It seems that the expectation of the studentswas that review would be done faster than that. However, in an attemptto encourage students to review the work of their peer, the studentswere told at some point in the semester that their work would bereviewed only after at least one peer would have reviewed the work.This probably increased the impression of delay in reviewing of work.
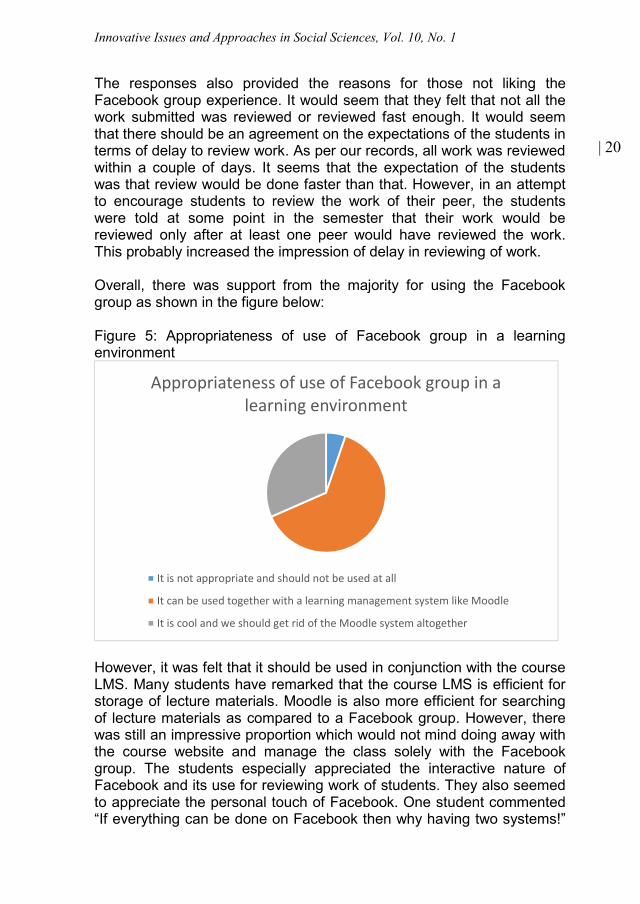
Overall, there was support from the majority for using the Facebookgroup as shown in the figure below:
Figure 5: Appropriateness of use of Facebook group in a learningenvironment
However, it was felt that it should be used in conjunction with the courseLMS. Many students have remarked that the course LMS is efficient forstorage of lecture materials. Moodle is also more efficient for searchingof lecture materials as compared to a Facebook group. However, therewas still an impressive proportion which would not mind doing away withthe course website and manage the class solely with the Facebookgroup. The students especially appreciated the interactive nature ofFacebook and its use for reviewing work of students. They also seemedto appreciate the personal touch of Facebook. One student commented“If everything can be done on Facebook then why having two systems!”
Appropriateness of use of Facebook group in alearning environment
It is not appropriate and should not be used at all
It can be used together with a learning management system like Moodle
It is cool and we should get rid of the Moodle system altogether
Innovative Issues and Approaches in Social Sciences, Vol. 10, No. 1
| 21
Although this seems an interesting option, Facebook is clearly notequipped to manage a class entirely on its own. However, the facilities itoffers to students cannot be neglected either. There was also a smallminority which felt that Facebook is not appropriate and should not beused at all. There is thus a small minority who seem to be in favour ofHew(2011) and Lee(2014). It is nevertheless important that the concernsof the minority are still addressed in class.
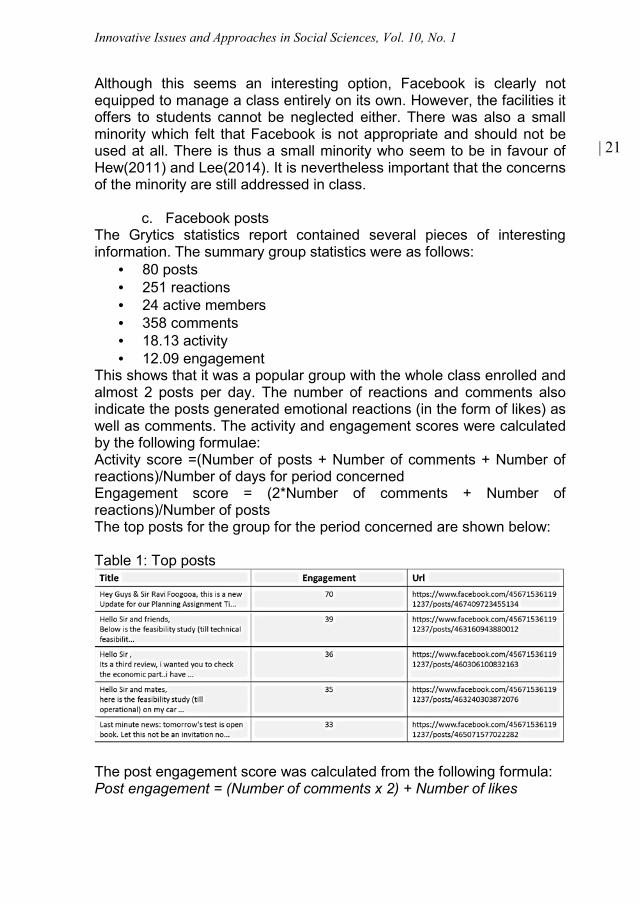
c. Facebook postsThe Grytics statistics report contained several pieces of interestinginformation. The summary group statistics were as follows:
• 80 posts• 251 reactions• 24 active members• 358 comments• 18.13 activity• 12.09 engagement
This shows that it was a popular group with the whole class enrolled andalmost 2 posts per day. The number of reactions and comments alsoindicate the posts generated emotional reactions (in the form of likes) aswell as comments. The activity and engagement scores were calculatedby the following formulae:Activity score =(Number of posts + Number of comments + Number ofreactions)/Number of days for period concernedEngagement score = (2*Number of comments + Number ofreactions)/Number of postsThe top posts for the group for the period concerned are shown below:
Table 1: Top posts
The post engagement score was calculated from the following formula:Post engagement = (Number of comments x 2) + Number of likes
Innovative Issues and Approaches in Social Sciences, Vol. 10, No. 1
| 22
It is worthwhile noting that the top posts for engagement value were fromstudents. The posts concerned the uploading of their work. Theengagement shows that students had a look at the work of their peer. Itis funny that the announcement that the class test was going to be openbook – usually a very popular piece of information only made it to the 5th
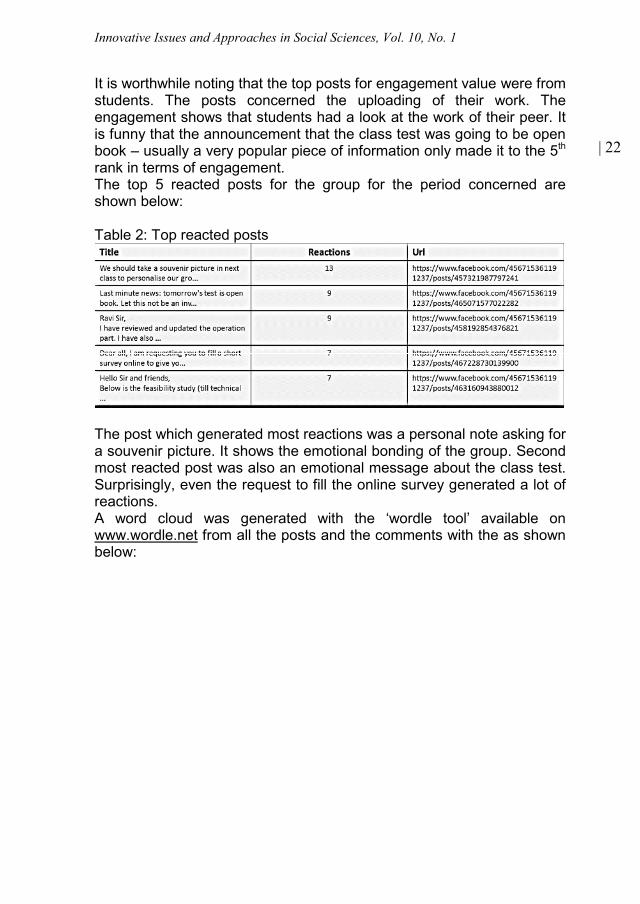
rank in terms of engagement.The top 5 reacted posts for the group for the period concerned areshown below:
Table 2: Top reacted posts
The post which generated most reactions was a personal note asking fora souvenir picture. It shows the emotional bonding of the group. Secondmost reacted post was also an emotional message about the class test.Surprisingly, even the request to fill the online survey generated a lot ofreactions.A word cloud was generated with the ‘wordle tool’ available onwww.wordle.net from all the posts and the comments with the as shownbelow:
Innovative Issues and Approaches in Social Sciences, Vol. 10, No. 1
| 23
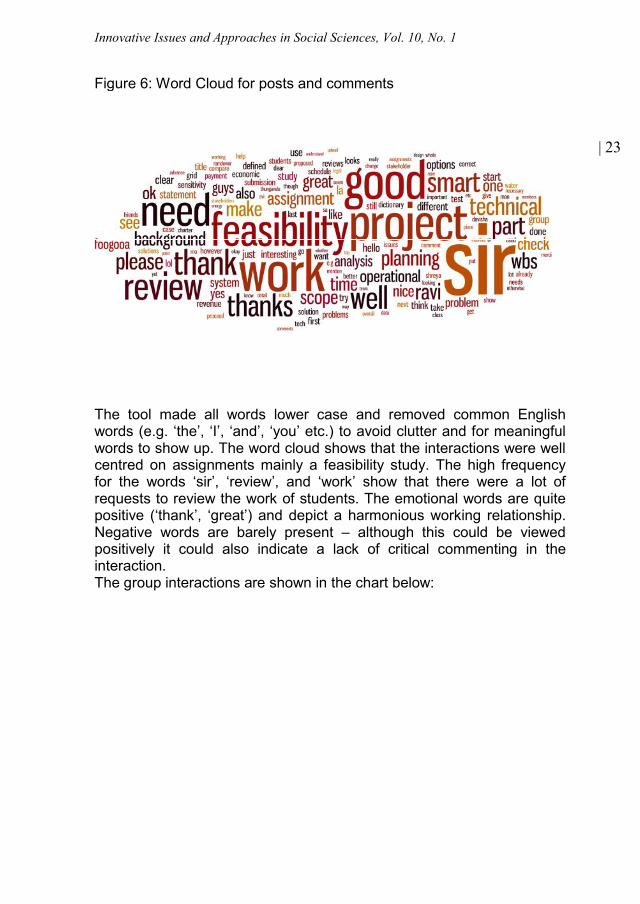
Figure 6: Word Cloud for posts and comments
The tool made all words lower case and removed common Englishwords (e.g. ‘the’, ‘I’, ‘and’, ‘you’ etc.) to avoid clutter and for meaningfulwords to show up. The word cloud shows that the interactions were wellcentred on assignments mainly a feasibility study. The high frequencyfor the words ‘sir’, ‘review’, and ‘work’ show that there were a lot ofrequests to review the work of students. The emotional words are quitepositive (‘thank’, ‘great’) and depict a harmonious working relationship.Negative words are barely present – although this could be viewedpositively it could also indicate a lack of critical commenting in theinteraction.The group interactions are shown in the chart below:
Innovative Issues and Approaches in Social Sciences, Vol. 10, No. 1
| 24
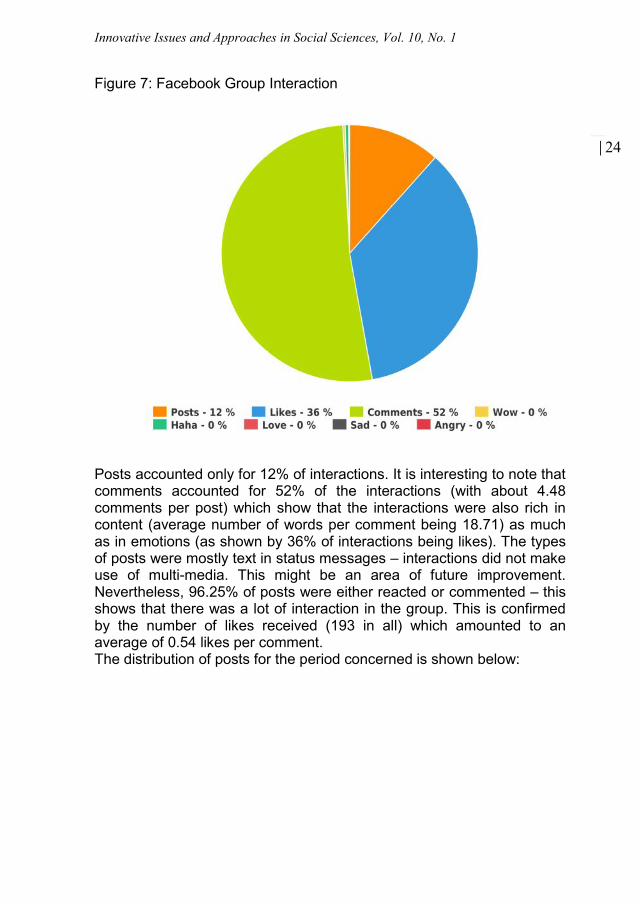
Figure 7: Facebook Group Interaction
Posts accounted only for 12% of interactions. It is interesting to note thatcomments accounted for 52% of the interactions (with about 4.48comments per post) which show that the interactions were also rich incontent (average number of words per comment being 18.71) as muchas in emotions (as shown by 36% of interactions being likes). The typesof posts were mostly text in status messages – interactions did not makeuse of multi-media. This might be an area of future improvement.Nevertheless, 96.25% of posts were either reacted or commented – thisshows that there was a lot of interaction in the group. This is confirmedby the number of likes received (193 in all) which amounted to anaverage of 0.54 likes per comment.The distribution of posts for the period concerned is shown below:
Innovative Issues and Approaches in Social Sciences, Vol. 10, No. 1
| 25
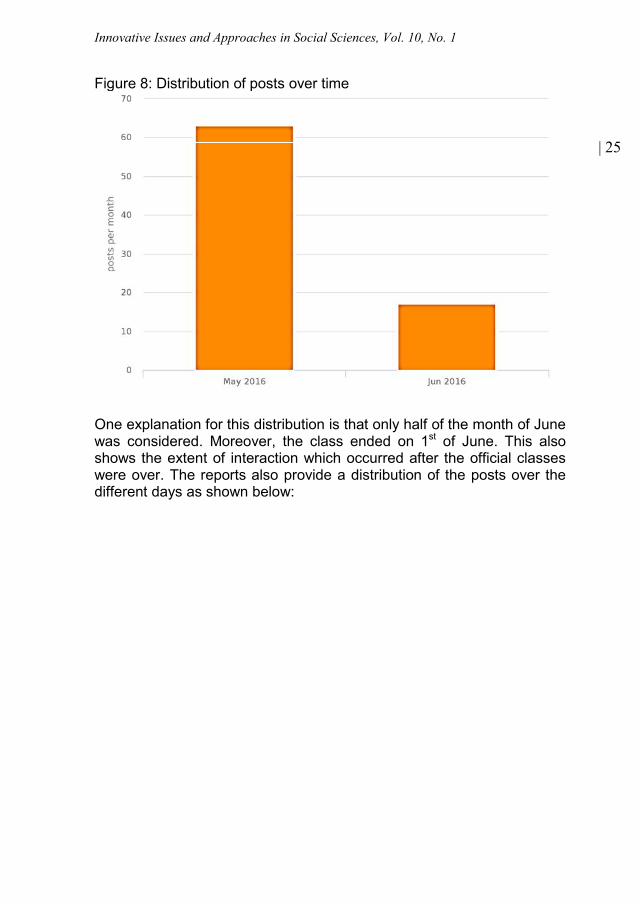
Figure 8: Distribution of posts over time
One explanation for this distribution is that only half of the month of Junewas considered. Moreover, the class ended on 1st of June. This alsoshows the extent of interaction which occurred after the official classeswere over. The reports also provide a distribution of the posts over thedifferent days as shown below:
Innovative Issues and Approaches in Social Sciences, Vol. 10, No. 1
| 26
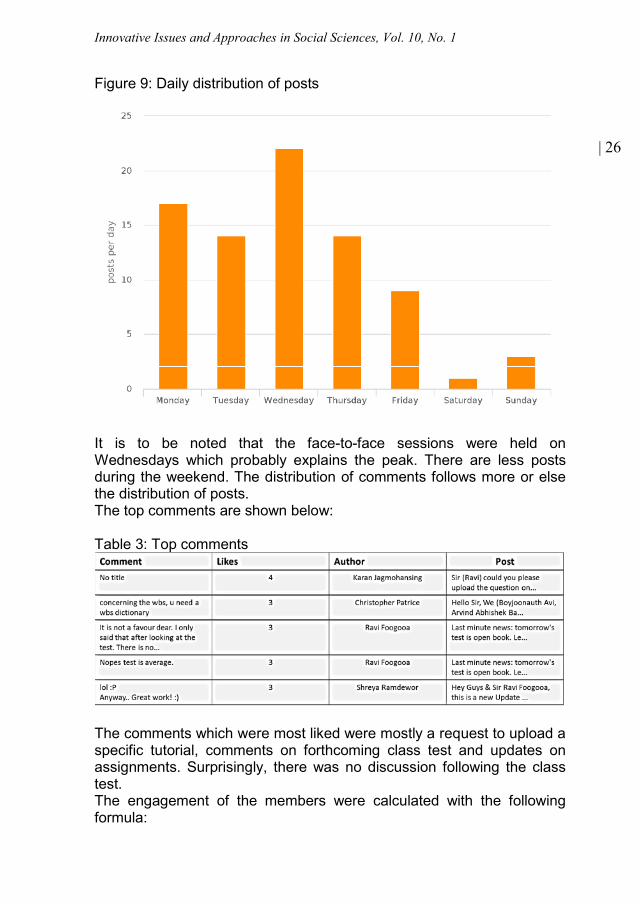
Figure 9: Daily distribution of posts
It is to be noted that the face-to-face sessions were held onWednesdays which probably explains the peak. There are less postsduring the weekend. The distribution of comments follows more or elsethe distribution of posts.The top comments are shown below:
Table 3: Top comments
The comments which were most liked were mostly a request to upload aspecific tutorial, comments on forthcoming class test and updates onassignments. Surprisingly, there was no discussion following the classtest.The engagement of the members were calculated with the followingformula:
Innovative Issues and Approaches in Social Sciences, Vol. 10, No. 1
| 27
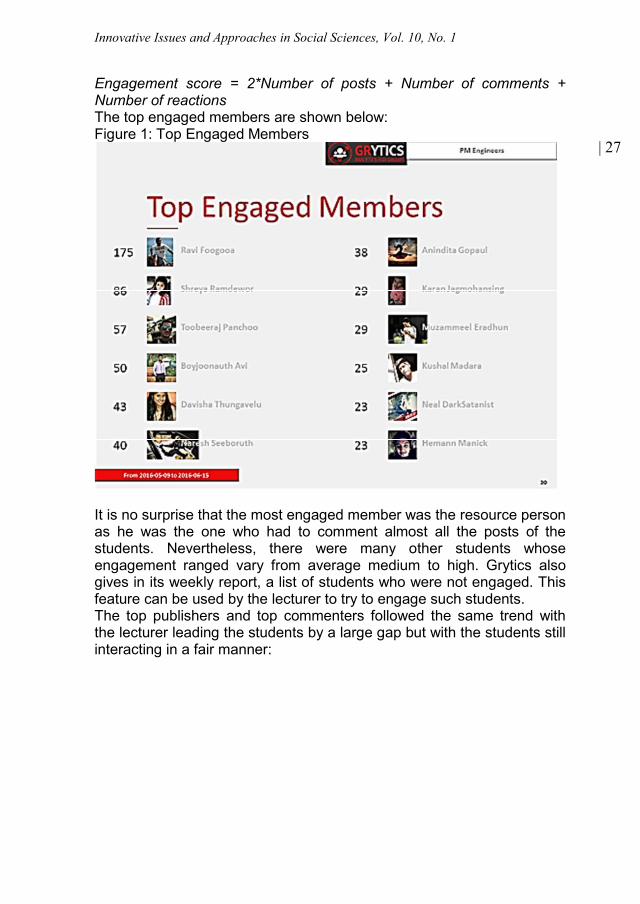
Engagement score = 2*Number of posts + Number of comments +Number of reactionsThe top engaged members are shown below:Figure 1: Top Engaged Members
It is no surprise that the most engaged member was the resource personas he was the one who had to comment almost all the posts of thestudents. Nevertheless, there were many other students whoseengagement ranged vary from average medium to high. Grytics alsogives in its weekly report, a list of students who were not engaged. Thisfeature can be used by the lecturer to try to engage such students.The top publishers and top commenters followed the same trend withthe lecturer leading the students by a large gap but with the students stillinteracting in a fair manner:
Innovative Issues and Approaches in Social Sciences, Vol. 10, No. 1
| 28
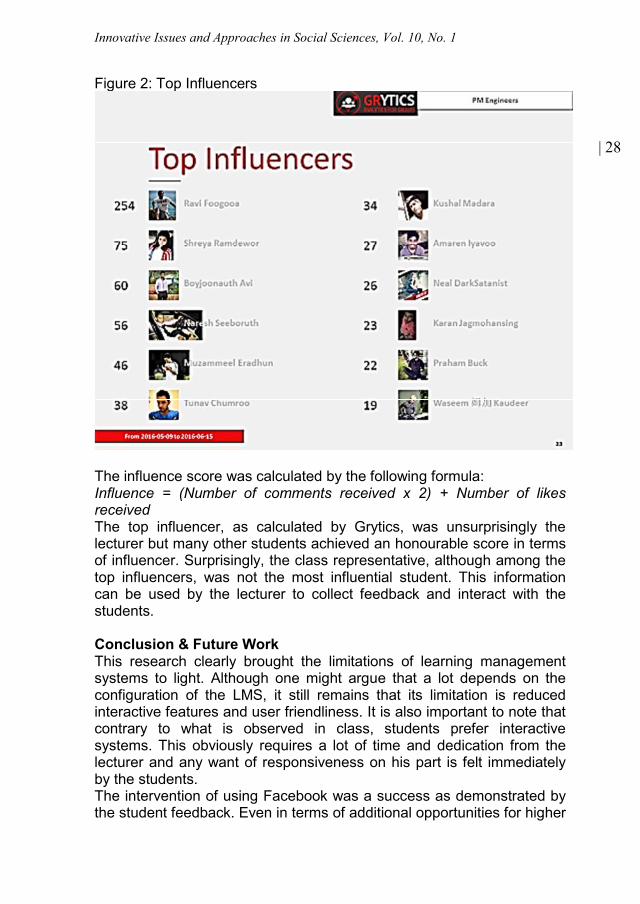
Figure 2: Top Influencers
The influence score was calculated by the following formula:Influence = (Number of comments received x 2) + Number of likesreceivedThe top influencer, as calculated by Grytics, was unsurprisingly thelecturer but many other students achieved an honourable score in termsof influencer. Surprisingly, the class representative, although among thetop influencers, was not the most influential student. This informationcan be used by the lecturer to collect feedback and interact with thestudents.
Conclusion & Future WorkThis research clearly brought the limitations of learning managementsystems to light. Although one might argue that a lot depends on theconfiguration of the LMS, it still remains that its limitation is reducedinteractive features and user friendliness. It is also important to note thatcontrary to what is observed in class, students prefer interactivesystems. This obviously requires a lot of time and dedication from thelecturer and any want of responsiveness on his part is felt immediatelyby the students.The intervention of using Facebook was a success as demonstrated bythe student feedback. Even in terms of additional opportunities for higher
Innovative Issues and Approaches in Social Sciences, Vol. 10, No. 1
| 29
learning, the experience was positive. However, there is still need forfurther research in this regard. One notable limitation of this researchwas about the risks of using Facebook in higher education. A fewstudents expressed reservations about the use of Facebook and furtherresearch is needed to understand the nature of these reservations andwhat can be done about them. The literature has also warned aboutprivacy issues when using Facebook between lecturers and students.One sometimes feels that it would have been nice to have a secondprofile on Facebook dedicated for professional use. However, this is acurrently not allowed. It would also be interesting to investigate into theuse of more interactive social features of learning management systems.
ResourcesBalakrishnan, V. & Gan, C.L. (2016). Students’ learning styles and their
effects on the use of social media technology for learning. Telematicsand Informatics, 33(3), 808–821.
Cheung, C.M.K., Chiu, P.Y., & Lee, M.K.O. (2011). Online socialnetworks: Why do students use facebook? Computers in HumanBehavior, 27(4), 1337–1343.
Dahlstrom, E., Walker, J.D., Dziuban, C. & Morgan, G. (2015). ECARStudy of Undergraduate Students and Information Technology,
Facebook. (2013). Facebook for educators & community leaders: Apractical guide to help teens navigate facebook. Retrieved fromhttps://www.b-ccentre.be/wp-content/uploads/2013/10/Facebook-for-educators-and-community-leaders-sm.pdf
Falahah & Rosmala, D. (2012). Study of Social Networking Usage inHigher Education Environment. Procedia - Social and BehavioralSciences, 67, 156–166.
Ferdinand, D. (2013). Social Media in Education: Bringing yourclassroom to life. In UWI Research Expo 2013.
Foogooa, R. & Panchoo, S. (2012). Use of ICT teaching aids in tertiaryeducation – a case study of Moodle implementation. In 2ndInternational Conference on Higher Education and EconomicDevelopment.
Friesen, N. & Lowe, S. (2012). The questionable promise of social mediafor education: Connective learning and the commercial imperative.Journal of Computer Assisted Learning, 28(3), 183–194.
Gikas, J. & Grant, M.M. (2013). Mobile computing devices in highereducation: Student perspectives on learning with cellphones,smartphones & social media. Internet and Higher Education, 19, 18–26.
Glazer, F. S. (Ed.). (2012). Blended learning: Across the disciplines,across the academy. Sterling, Virginia: Stylus Publishing.
Innovative Issues and Approaches in Social Sciences, Vol. 10, No. 1
| 30
Hew, K.F. (2011). Students’ and teachers' use of Facebook. Computersin Human Behavior, 27(2), 662–676.
Hussain, I. (2012). A Study to evaluate the social media trends amonguniversity students. Procedia - Social and Behavioral Sciences, 64(0),639–645.
Kirschner, P.A. & Karpinski, A.C. (2010). Facebook and academicperformance. Computers in Human Behavior, 26(6), 1237–1245.
Krathwohl, D.R. (2002). A revision of Bloom ’ s taxonomy : An overview., Theory Into Practice,41(4).
Lee, S.M. (2014). The relationships between higher order thinking skills,cognitive density, and social presence in online learning. Internet andHigher Education, 21, 41–52.
Louisy, P. (1997). Dilemmas of insider research in a small countrysetting tertiary education in St Lucia. In M. Crossley & G. Vulliamy(Eds.), Qualitative Educational Research in Developing Countries (pp.199-220). Garland: New York.
Manca, S. & Ranieri, M. (2016). Facebook and the others. Potentialsand obstacles of Social Media for teaching in higher education.Computers and Education, 95, 216–230.
Manca, S. & Ranieri, M. (2013). Is it a tool suitable for learning? A criticalreview of the literature on Facebook as a technology-enhancedlearning environment. Journal of Computer Assisted Learning, 29(6),487–504.
Maranto, G. & Barton, M. (2010). Paradox and Promise: MySpace,Facebook, and the Sociopolitics of Social Networking in the WritingClassroom. Computers and Composition, 27(1), 36–47.
Pempek, T.A., Yermolayeva, Y.A., & Calvert, S.L. (2009). Collegestudents’ social networking experiences on Facebook. Journal ofApplied Developmental Psychology, 30(3), 227–238.
Pring, R. (2003). The virtues and vices of an educational researcher. InSikes, P., Nixon, J., & Carr, W. (Eds.), The Moral Foundations ofEducational Research: Knowledge, Inquiry and Values. MaidenheadPhiladelphia: Open University Press
Roblyer, M.D., McDaniel, M., Webb, M., Herman, J. & Witty, J.V (2013).Findings on Facebook in higher education: A comparison of collegefaculty and student uses and perceptions of social networking sites.Internet and Higher Education, 13(3), pp.134–140.
van Rooyen, A. (2015). Distance Education Accounting Students’Perceptions of Social Media Integration. Procedia - Social andBehavioral Sciences, 176, 444–450.
Scott, K.S., Sorokti, K.H., & Merrell, J.D. (2015). Learning “beyond theclassroom” within an enterprise social network system. The Internetand Higher Education, 29, 75–90.
Innovative Issues and Approaches in Social Sciences, Vol. 10, No. 1
| 31
Sobaih, A.E.E., Moustafa, M.A., Ghandforoush, P. & Khan, M. (2016).To use or not to use? Social media in higher education in developingcountries. Computers in Human Behavior, 58, pp.296–305.
The University of the West Indies (2012). The blended learning policy ofthe St Augustine Campus. St. Augustine, Trinidad: The University ofthe West Indies, Instructional Development Unit.
Thompson, C., Gray, K., & Kim, H. (2014). How social are social mediatechnologies (SMTs)? A linguistic analysis of university students’experiences of using SMTs for learning. Internet and HigherEducation, 21, 31–40.
Thurab-Nkhosi, D. (2013). Blended learning at The University of theWest-Indies, St. Augustine: A first look at policy implementation.Caribbean Teaching Scholar, 3(1), 5-22.
Tuhiwai-Smith, L. (2004). Decolonizing methodologies: Research andindigenous peoples. Zed Books Ltd: New York University of OtagoPress Dunedin.
Vie, S. (2008). Digital divide 2.0: “Generation M” and online socialnetworking sites in the composition classroom. Computers andComposition, 25(1), 9–23.
Watson, F., & Ferdinand, D. (2015). Debating: A dynamic teachingstrategy for motivating students and teachers. The 16th AnnualMidwest Conference on the Scholarship of Teaching and Learning,Indiana University South Bend, Indiana, U.S.A.
Innovative Issues and Approaches in Social Sciences, Vol. 10, No. 1
| 32
SHOULD I TEXT OR SHOULD I TALK?TRANSFORMATIONS OF COMMUNICATIVE
PRACTICES BY MOBILE PHONES
Tadej Praprotnik1
AbstractThis article presents contemporary transformations of communicativepractices among individuals. Communication is a primary vehicle forestablishing and maintaining relationships, so it is of vital importance tounderstand why we communicate in certain ways. The article firstlypresents the global climate of modern relationships, which areconducted by social media platforms. The technological convergence ofvarious devices provides additional support for reinforcingcommunication and networking. Features offered by new media devices(collaboration, networking) are presented, along with current practices,which reflect certain problems at the level of usage. The relationshipbetween society and technology is explored, and the fact that our usageof technologies is a reflection of society’s and individuals’ keyunderstandings and orientations is stressed. In line with these remarksthe article interprets modern conceptions of relationships that arebecoming mere “connections”. Namely, our communication practices oftext messaging and e-mailing are to a certain extent a reflection ofcontemporary orientations. Individuals may like a company, butnevertheless they like distance too. Our modern “connections” aretherefore quite intentional. One of the article’s conclusions is that byusing “poor” mobile devices (smartphones enable us to send messagesof up to 160 characters) we mask/disguise our own unpreparedness toengage in complex and “exhaustive” communication (i.e. face-to-face orphone call conversations). This way our own intentions can be ascribedto “poor” technology. We are not confronted with our own intention to beconnected, but still at a distance. Additionally, the article also stressesother contextual factors for communication practices, from technologicalconstraints to communicative norms. Nevertheless the usage of
1 Tadej Praprotnik, PhD is an Assistant Professor at the Universityof Primorska (The Faculty of Humanities). Contact address:pratadej (at) gmail.com
Innovative Issues and Approaches in Social Sciences, Vol. 10, No. 1
| 33
technologies is at our command and it reflects the type of relationshipswe are looking for.
Keywords: new media, mobile phones, e-mail, text messaging,interpersonal relationships
DOI: http://dx.doi.org/10.12959/issn.1855-0541.IIASS-2017-no1-art2
IntroductionA 16-year-old boy who relies on texting for almost everything saysalmost wistfully, “Someday, someday, but certainly not now, I’d like tolearn how to have a conversation.” (From Shery Turkle, The Flight FromConversation, New York Times, 21 April 2012)
We live in a society that is full of information and full of communication;at least it seems so. In truth we live in a technological universe withendless opportunities for consuming media information, and in a societywith almost endless opportunities to converge with other people, to link,to share, to connect with each other. People have lots of connections,but are they really connected? Are they connected in terms ofrelationships? It seems like everyday people have a little bit too manyconnections and too much information. Do we really want to be closelyconnected? It is an image like we want to have relationships but withlimits. Do we use technologies in a manner that reflect our values? Dowe use technologies in order to be more connected, but still at adistance, in solitude? Do people want to be alone, yet feel connected(Turkle, 2011: 18-19)? The latter question is oriented toward the problemof establishing relationships.
New media devices (social media, mobile phones) were presented andintroduced to mass audience as the perfect communicative vehicle formaintaining or reinforcing communication among people, for improvingour social lives, our connections to other, for improving society as awhole. New media have been presented as means for enabling thebetter organization of society, such that society would be much moreoriented toward the individual. Indeed social media facilitate networking;they are platforms for gathering people together. But the questionremains: what happened with our connections, our relationships, and ourpersonal well-being in modern society? Are we really “upgrading”ourselves into better society, are we happier? The question is hard toanswer, and even hard to grasp in its totality. What does it mean to be“happier”? Indeed, it is an ideological question, a reflection our owncontemporary obsession.
Innovative Issues and Approaches in Social Sciences, Vol. 10, No. 1
| 34
The purpose of this article is not to give a coherent, one-dimensionalanswer to the problems outlined. On the contrary, the article containsseveral perspectives, even opposing ones, and it is thus meant to be astarting point for a further debate upon modern communicationpractices. The author is well-aware of contradictions presented herein,but nevertheless understands such contradictions as the “current stateof the art” and as a precondition for fully reflective reconsideration andunderstanding of contemporary society.
What do we mean when talking about new media?All technology is a black box, without ulterior motivations, intentions, etc.It is our use of technologies that is a part of a problem (and solution aswell). As humans we might be interactive, supportive, engaged, etc., butthe technologies themselves are not. For sure, technologies might have– for example – the quality of engaging individuals in interactivity, butthis is only a potential quality that depends upon the individual. So ourusage of technologies to a certain extent reflects ourselves, our societyas a whole, and the prevalent values within said society. Our intention isnot to criticize modern technologies, nor to criticize individuals fordeveloping “wrong” practices.
Modern society is more and more mediated, especially over the last fewdecades, when we are confronted with so-called new media. Labelssuch as “new media” are ideological ones. The term is also relational tothe term “old media”. So the question is: “What is new about newmedia?” New media has gained currency as a term because of its usefulinclusiveness. It avoids, at the expense of its generality and itsideological overtones, reductions of some of its alternatives. It avoids theemphasis on a purely technical and formal definition, as in “digital” or“electronic media”; the stress on a single, ill-defined, and contentiousquality as in “interactive media”, or the limitation to one set of machinesand practices as in “computer-mediated communication”1. (Lister,Dovey, Giddings, Grant, Kelly, 2009: 11-12). When considering what isnew about new media, Lister, Dovey, Giddings, Grant, and Kelly take theterm to refer to the following:
• New textual experiences: new kinds of genres and textual forms,entertainment, pleasure and patterns of media consumption(computer games, simulations, special-effects cinema).
• New ways of representing the world: media that, in ways that arenot always clearly defined, offer new representationalpossibilities and experiences (immersive virtual environments,screen-based interactive multimedia).
1Further in text abbreviated as CMC.
Innovative Issues and Approaches in Social Sciences, Vol. 10, No. 1
| 35
• New relationships between subjects (users and consumers) andmedia technologies: changes in the use and reception of image-and communication-based media in everyday life and in themeanings that are invested in media technologies.
• New ways of experiencing the relationship between embodiment,identity, and community: shifts in the personal and socialexperience of time, space, and place (at both local and globalscales), which have implications for the ways we experienceourselves and our place in the world.
• New conceptions of the biological body's relationship totechnological media: challenges to received distinctions betweenthe human and the artificial, nature and technology, body and(media as) technological prostheses, the real and the virtual.
• New patterns of organization and production: wider realignmentsand integrations in media culture, industry, economy, access,ownership, control and regulation (Lister, Dovey, Giddings,Grant, Kelly, 2009: 12-13).
Does new automatically mean “better”, or “worse”? The problem oftechnological determinismThe unifying term “new media” refers to a wider range of changes inmedia production, distribution, and use. These changes aretechnological, textual, conventional, and cultural. Since the mid-1980s anumber of concepts have come to the fore that define the keycharacteristics of the field of new media as a whole. Some of the mainterms in discourses about new media are digital, interactive,hypertextual, virtual, networked, and simulated. But we must bear inmind that “what we are calling ‘characteristics’ here (digital, interactive,hypertextual, etc.) can easily be taken to mean the ‘essential qualities’ ofthe medium or technology in question” (Lister, Dovey, Giddings, Grant,Kelly, 2009: 13). So, as they proceed, “it becomes a totalising oroverreaching concept which wholly subsumes the medium in question.There is then a danger that we end up saying, ‘Because a technology islike this (electronic, etc.) it necessarily results in that (networked, etc.).”This process is then dangerously close to essentialism in the sense thata thing is what it is because it possesses an unchanging and separableessence. That kind of reasoning is close to the problematic conceptionsof technological determinism, which has been defined as an approachthat identifies technology as the central causal element in processes ofsocial change (Croteau and Hoynes, 2003, on Wikipedia, 2016). Thisstance ignores the social and cultural circumstances in which thetechnology was developed. Rather than acknowledging that a society orculture interacts with and even shapes the technologies that are used, atechnological determinist view holds that “the uses made of technology
Innovative Issues and Approaches in Social Sciences, Vol. 10, No. 1
| 36
are largely determined by the structure of the technology itself, that itsfunctions follow from its form” (Technological determinism, Wikipedia,2016).
There is a problem in viewing technologies as “revolutionary,transformative”, or as a “threat” to society. This kind of terminology iswell-documented in media discourse. We usually label this type ofdiscourse as a “moral panics”. Younger generations are often thesubject of such discourses and considerations. The use of the internethas long been the subject of several discussions. As Susan Herringacknowledges: “If media producers construct the Internet Generation asself-reliant and ‘in charge’, commentators in the mainstream media oftenrepresent young media users as vulnerable and in need of societalprotection and direction. To a considerable extent, this discourse reflectswhat journalists perceive as the concerns of parents and educatorsabout children who spend time on the Internet and the World Wide Web.For many, especially less technologically savvy, adults, the Internet isunfamiliar, intimidating, and potentially dangerous. Many adults areconcerned about the risk of children being exposed to pornography orlured through interactions in online social spaces into offline encounters,and the occasional cases in which terrible things have happened toyoung Internet users do nothing to allay such fears. News reporting oftensensationalizes these cases, occasionally giving rise to full-blown ‘moralpanics’ in which new media environments are represented as a threat tosocietal values and interests” (Herring, 2008: 74).
In this type of discourse technology is represented in a quitedeterministic way: “Kids ‘are different as a result of . . . exposure to anduse of digital media’, ‘technology has changed the Net Generation’, and‘digital mastery’ will make this generation ‘a force for socialtransformation’.” Thus at the same time that young people arerepresented as powerful — more even than “most kids dare imagine” —they are also shaped by technology, even dependent on it by definitionfor their identity as a generation. “Moreover, technological determinismis problematic in that it glosses over contextual factors and socialmotivations that shape human behavior. Peer groups and socialrelations are arguably more influential during our youth than at any otherlife stage, and young people use and think about technology differentlyaccording to their cultural, economic, and familial contexts” (Herring,2008: 76).
Innovative Issues and Approaches in Social Sciences, Vol. 10, No. 1
| 37
Communication practices in “participative culture”After reconsidering some basic assumptions about new media we wouldlike to move forward to communication practices. For sure, new mediatechnologies impact the organization of our everyday lives, ourcommunicative practices, etc. New media technologies introduce newways of connecting to each other and new ways of maintainingrelationships. They serve as an additional communication channel; herewe would like to stress additional. Do we really perceive newcommunication devices only as new technological channels for sendinginformation to our partners, friends, or children? Do we really use newtechnologies, for example mobile phones, e-mail, or Facebook, tocommunicate the same message and meta-message of concern,interest, or involvement?We are certain that we can use new media in an old-fashioned way; wecould use mobile phones (smart phone) exactly the same as we did usestationary phones (fixed phones, landlines). The usage of certaintechnologies is at our command. But we think that society nowadays ischaracterized by a general transformation that is not the “effect” of newmedia itself but the effect of transformed society as such. We would liketo stress that our usage of technologies is a reflection of a society’s keyunderstandings and orientations. Society is empowered by new valuesthat are introduced correspondingly with the arrival of new media:creativity, participation, collaboration, networking, sharing, linking, etc.All the mentioned activities are characterized by new media.
One of the crucial and defining activities of new media culturesestablished via the Web 2.01 is collaboration. New media technologyfosters new cultural connections and relations. We are faced with thetransformed “intimacy” of new media cultures too, which serves asfurther evidence for a new and unstable, and to some respect a blurring,division between the public and private spheres of communication(Praprotnik, 2014: 138-139). According to this new climate we are facedwith several kinds of activities performed by individuals online: sharing,
1 A Web 2.0 site may allow users to interact and collaborate with each other in a socialmedia dialogue as creators of user-generated content in a virtual community, in contrastto the first generation of Web 1.0-era websites, where people were limited to the passiveviewing of content. Examples of social media sites are Facebook, blogs, wikis, andvideo-sharing sites (e.g., YouTube) (from Wikipedia:https://en.wikipedia.org/wiki/Web_2.0).Some of the most popular social media websites are Facebook (and its associatedFacebook Messenger), WhatsApp, Tumblr, Instagram, Twitter, Baidu Tieba,Pinterest,Linkedin, Google+, YouTube, Viber, and Snapchat. These social media websites havemore than 100,000,000 registered users (from Wikipedia:https://en.wikipedia.org/wiki/Social_media).
Innovative Issues and Approaches in Social Sciences, Vol. 10, No. 1
| 38
collaborating, linking, liking (as in the case of Facebook). There aremany studies that attempt to explain the communicative motivations andcharacteristics of social media, even the construction of “popularity” onsocial networking sites, which is reflected through the number of a user’sFacebook friends (Praprotnik, 2015: 129-130).
Participative culture has a strong influence upon individual's motivationsand engagements. Social media enable the faster dissemination ofinformation and the convergence of various social initiatives. Soparticipation and collaboration are new principles for the organization ofeveryday life. But we would like to add something else: participation andcollaboration in a sense of networking has also become the new“organizational principle” in the private sphere. What do we mean bythis? Networking (connecting) as a process has also become a majororganizational principle within everyday life, among friends, etc. Somepeople have a couple hundred of friends on Facebook. For sure, theirFacebook “friends” have different statuses as “friends”. Nonethelessfriends demand a certain type of interaction, for example the act of likingtheir pictures, commenting on the links they attach (as is commonpractice among Facebook friends). So a person might have a differentnumber of friends, and correspondingly a person also has certainobligations toward said friends. This person must perform certaincommunicative acts in order to maintain these relationships. As we havealready said, a person has the opportunity to regulate the status andnormative expectations of particular relationships among Facebookfriends, but nevertheless the person is forced to manage such a socialnetwork.
Social media enhanced by digitalization facilitates new forms ofinteractions. The sociality of social media enables constant growth inpopularity. Web platforms facilitate the sharing of content among users;their main purpose is therefore to enhance social interaction, and tobuild relationships, self-representation, and collaboration among users.Traditional consumers became prosumers/producers. Web 2.0 platformssuch as LinkedIn, Flickr, Facebook, YouTube, or Twitter have becomedominant communication channels for distribution, consumption, andappropriation of a diverse range of information or media news(Praprotnik, 2016: 86).
So, everybody has the chance to be interconnected to others, be that bye-mail, social media, mobile phones, etc. Technological convergencehas even sped up these processes. Namely, previously distinct mediasuch as telephones and data communications are converging intocommon interfaces on single devices. Most smartphones can make
Innovative Issues and Approaches in Social Sciences, Vol. 10, No. 1
| 39
phone calls and search the web (Technological convergence, Wikipedia,2016). We are thus always connected, always on, always available, andyet still separate. Is this our “dream come true”, our best possiblesolution for ourselves? Let’s take a look at our modern idea of“connection”.
From conversation to connection; what’s wrong with theconnection?The article has the ambition of shedding light on communicationenhanced by mobile phones, which enables sending e-mail, socialnetworking (Facebook), or texting and talking. There are plenty ofcommunication practices, so it is hard to manage them all. The problemarises even when e-communication is accompanied with face-to-facecommunication. Let us quote Sherry Turkle: “My students tell me aboutan important new skill; it involves maintaining eye contact with someonewhile you text someone else; it’s hard, but it can be done” (Turkle, 2012:1). As Turkle pointed out: “Technology-enabled, we are able to be withone another, and also elsewhere, connected to wherever we want to be”(Turkle, 2012: 1). As Turkle acknowledged: “in the silence of connection,people are comforted by being in touch with a lot of people-carefully keptat bay. We can’t get enough of one another if we can use technology tokeep one another at distance we can control: not too close, not too far,just right” (Turkle, 2012: 1). Electronic devices provide us with a differentcommunication setting, in which we can at any moment decide how tocontinue the communication or eventually end it. Contemporarycommunication (text messaging, email, posting, etc.) lets us present theself we want to be. We can edit, and we can delete. A similar situation isto be found within social networking sites (Bebo, Facebook, Flickr, etc.)1.Sherry Turkle in her book Alone Together (2011) cited her intervieweeAudrey: “The phone, it's awkward. I don't see the point. Too much just arecap and sharing feelings. With a text ... I can answer on my own time. Ican respond. I can ignore it. So it really works with my mood. I'm notbound to anything, no commitments ... I have control over theconversation and also more control over what I say” (Turkle, 2011:190).We would like to stress that the meanings of particular communicationdevices has changed too. As Turkle says: “The telephone was once away to touch base or ask a simple question. But once you have accessto e-mail, instant messaging, and texting, things change. Although westill use the phone to keep up with those closest to us, we use it lessoutside this circle. Not only do people say that a phone call asks toomuch, they worry it will be received as demanding too much” (Turkle,
1 The list of social networking sites can be found at:https://en.wikipedia.org/wiki/List_of_social_networking_websites
Innovative Issues and Approaches in Social Sciences, Vol. 10, No. 1
| 40
2011:188). It is an impression as we are demanding less from eachother, or, as the subtitle of Turkle's book reads: “Why we expect morefrom technology and less from each other”.
So in texting messages we have a feeling that we are in control of theinteraction, as well as of our own self-image. But relationships are (orought to be) more than just intentionally fabricated words or picturesdesigned by Facebook or some sentences sent by Blackberry. Tocommunicate means to provide information as well as to buildrelationships. Let us quote Duncan: “people do not relate then talk,people relate in talk” (Duncan, 1967: 249). Communication has aninformational as well as relational aspect. By communicating with you, Iestablish relations with you too. In transmitting information we alsotransmit relational aspect of the communication, for example: “I see youas a trustworthy person so I decide to provide you with my deepestthoughts and feelings”. The level of disclosure reflects the level of therelationship: deep relationship, deep self-disclosure (Praprotnik, 2015:131).
So let’s ask once again: what is “wrong” with text messaging, emailingletters, etc.? Nothing at all. They are additional communicationaldevices. On the other hand human relationships are rich, sometimesmessy and demanding; we are often “exhausted” from relationships.Sherry Turkle states that we as a society have transformed the basicframes of our relationships. Turkle describes that shift by saying it is “themove from conversation to connection”. Let us quote her: “We aretempted to think that our little ‘sips’ of online connection add up to a biggulp of real conversation. But they don’t. E-mail, Twitter, Facebook, all ofthese have their places — in politics, commerce, romance andfriendship. But no matter how valuable, they do not substitute forconversation. Connecting in sips may work for gathering discrete bits ofinformation or for saying, ‘I am thinking about you.’ Or even for saying, ‘Ilove you.’ But connecting in sips doesn’t work as well when it comes tounderstanding and knowing one another” (Turkle, 2012: 2). We wouldlike to add just one more sentence from Sherry Turkle: “We createtechnology to provide the illusion of companionship without the demandsof friendship” (Quotes by Sherry Turkle, 2016).
We think her considerations are of utmost relevance, indeed. “Online,we easily find ‘company’ but are exhausted by the pressures ofperformance. We enjoy continual connection but rarely have eachother's full attention” (Turkle, 2011: 280). We want to add somethingelse: Our usage of technologies in terms of “companionship withoutfriendship” we can understand as a true, honest attitude. It is maybe

Innovative Issues and Approaches in Social Sciences, Vol. 10, No. 1
| 41
unwelcomed, but it is nonetheless there. Maybe this attitude is not justour “incorrect” usage of technologies. That kind of usage reflects to acertain extent our “inner” (honest, sincere) motivations, too. Withoutmaking an impression on our interlocutor. By sending a text message oremail our negative face does not reveal so much, or, conversely, bytexting we can easily construct an impression of a perpetually nice,available, and patient colleague. That kind of image is possible becausenew media technologies do not reveal so much information about thecurrent circumstances in which the relationship takes place. By textingwe do not have to fake something in order to keep up our positive face.Our performance is not so revealing, especially the performance of ournegative face. But if we take into account that our persona is aconstruction of positive and negative face (i.e. I have the motivation tobe perceived as a nice, available person, but I also have the need toorganize my life on my own and not to be intruded upon by others), wecan say that new media connections can be viewed as incomplete, i.e.as revealing only “half” of our persona. Nevertheless it is quite a problemwhen young people use texting as their primary means for maintainingrelationships, since real life confronts us with much more complex anduncontrolled interactions. Experiences that concern the balance ofpositive and negative face are therefore of crucial importance.
We thus agree with Turkle's observation that texting is not a substitutefor conversation, but anyway we would like to stress the significance ofestablished norms developed within communication. Particularly withinsmaller groups we can develop certain norms that can ensure betterrelationships and where a mere connection has a better chance of“counting” as a conversation. So what we are pointing at here arecontextual factors, which are of great importance when considering how“rich” or “poor” a particular medium is. The medium is not “poor” (only)because of its technological constraints, the medium becomes “poor”because we use it in a “poor” manner. We must however bear in mindthat our “poor” manner is perhaps quite intentional.
Our well-being is not a simple reflection of a more or less “perfect”technology; our well-being is a reflection of our estimation andimpression of the extent to which our needs are accomplished/satisfied.Whether or not the communicative goals of communicators are fulfilled isa result of the overlap in the communicative intention of bothinterlocutors. It is important to ask yourself: Do I have the same intentionas you when we talk to each other or when we text each other?
Nevertheless, the technological characteristics of mobile communication(text messaging, email) have certain technological constraints, be that
Innovative Issues and Approaches in Social Sciences, Vol. 10, No. 1
| 42
the length of a message or some other technological property, forexample (a)synchronicity. There is a clear distinction between talking byphone and texting a message in terms of the construction of the“message” itself. We correspondingly also have a clear distinctionbetween “real time” chat (Internet Relay Chat) and discussion forums oremails, which do not take place in real time. So let us quote DavidCrystal's remarks on various types of computer-mediatedcommunication; here the stress is on different communication“activities”, which are predominant in various CMC settings: “In contrastto the Web, the situations of e-mail, chatgroups, and virtual worlds,though expressed through the medium of writing, display several of thecore properties of speech. They are time-governed, expecting ordemanding an immediate response; they are transient, in the sense thatmessages may be immediately deleted (as in e-mails) or be lost toattention as they scroll off the screen (as in chatgroups); and theirutterances display much of the urgency and energetic force which ischaracteristic of face-to-face conversation. The situations are not allequally ‘spoken’ in character. We ‘write’ e-mails, not ‘speak’ them. Butchatgroups are for ‘chat’, and people certainly ‘speak’ to each otherhere–as do people involved in virtual worlds” (Crystal, 2001: 29).
Given the fact that lots of people are “always on”, even when in a hurry,they have developed certain characteristics of speech – they are time-governed, “demanding” a relatively immediate response, etc. Thereforethere is no time for reflection and complexity. As Turkle acknowledges:“On our mobile devices, we often talk to each other on the move andwith little disposable time – so little, in fact, that we communicate in anew language of abbreviation in which letters stand for words andemoticons for feelings. We don't ask the open-ended ‘How are you?’Instead, we ask the more limited ‘Where are you?’ and ‘What's up?’These are good questions for getting someone's location and making asimple plan. They are not so good for opening a dialogue aboutcomplexity of feeling” (Turkle, 2011:19).
For sure, texting is not by default “poorer” in transmitting socio-emotionalaspects of interlocutors; these kinds of considerations were popularwhen CMC first emerged. In that period several theories emerged thatattempted to explain the “social effectiveness” of CMC: One of these isthe technologically deterministic view, which holds that, unlike FTFinteraction, the limitations that characterize CMC as a technology restrictits utility as a channel of rich and varied social information. The otherperspective emerged from the notion that verbal and textual content canconvey rich social information just as FTF interaction does.
Innovative Issues and Approaches in Social Sciences, Vol. 10, No. 1
| 43
Several theories have stressed the social disadvantages of CMC, withthe probability of highly-developed personal relationships found to berelatively low online. These findings were generally explained by the“cues filtered-out” perspective, an umbrella term for several relatedtheories that posit that the lack of non-verbal cues in CMC causes it tobe more impersonal than FTF interaction. In social presence theoryCMC is thought to convey little social immediacy or relevance comparedto FTF communication due to the former's inability to transmit non-verbalcues. CMC is thus more impersonal. Media richness theory also focuseson CMC's predominantly lexical mode of interaction, deeming it a leanmedium compared to FTF interaction, which has multiple cues and ahigh degree of personalization (Hian, Chuan, Trevor, Detenber, 2004: 2).There are other theories that address the level of CMC’s “sociability” too,for example the Social Identification/Deindividuation (SIDE) model andthe Social Information Processing (SIP) theory by Joseph Walther.Walther articulated another theory in 1996 that is an extension of boththe SIDE and SIP perspectives; Walther's hyper-personalcommunication model introduces factors that explain how the CMCenvironment can allow the individual to experience a level of closenessabove the norm experienced in FTF conditions. Walther describes threeconditions necessary for hyper-personal communication to occur: 1) thereceiver's idealization of the other due to over-attributions, whereby thereceiver assigns magnified positive values to their partners; 2) thesender's selective self-presentation, in which the sender has theadvantage of being able to optimally edit their message beforetransmitting; 3) feedback loop or reciprocity of interactions, whereby theinterplay of idealization and self- presentation becomes a dynamicprocess and creates a self-reinforcing cycle. If these conditions are met,people can develop a sense of closeness and rapport in their CMCinteractions (Hian, Chuan, Trevor, Detenber, 2004: 2).
So CMC and mobile texting are capable of transmitting the sameamount of social information as FTF conversation. Both are certainlycapable of establishing relationships. But we nevertheless think that thispossibility is just a theoretical one. What kind of “meaning” do we ascribeto e-mail, to a telephone call, to a text message? What are we referringto when we talk about the “meaning”? Does a telephone call count as“hard” – “a person has something personally important to say to me”?Does sending a message count as “light” – “a person just wants to sayhello to me”? These kinds of considerations are of vital importance. Themeanings we ascribe to particular channel of communication are ofcourse the result of our already accomplished communication acts withothers. Let us pose another question: Do we often send a message bymobile phone with the sentence: “Hi darling, I am all yours. Please send
Innovative Issues and Approaches in Social Sciences, Vol. 10, No. 1
| 44
me a message telling me what’s bothering you lately”. Do we text eachother in that manner? We think it is not a common practice. For sure, itis not so convenient to text a message for such complex issues. So theconstraints are both technological as well as contextual. Over the yearsof using technological devices we have adopted communicative normsin order to communicate effectively and to be relevant for our on-linepartners. We usually obey these norms in order to be polite, cooperative,etc. Devices are not the only thing that is less than apt for various typesof relational communication, but also the norms that govern the specificcommunication setting (text message, email, etc.).
But, more crucial, do we actually want to communicate in a “hard” way?Do we want to be engaged in complex issues? Sometimes yes, indeed.Here is the possible, rather cynical – but nevertheless serious –interpretation: sometimes we enjoy using mobile phones because thetechnological constraints of our phones mask/hide our ownunpreparedness to engage in deep, complex communication. We canascribe our own inability and unpreparedness to engage in complexrelationships to “poor” technology, which lets us send messages of up to160 characters. So, we can say to ourselves: “Thank God I have a (lazy)smartphone, which can’t send longer and more complex messages”.This way we can rid of the guilt that we are responsible for the poorrelationship.
I text, therefore I am? The dark side of texting“You and I can talk any way we want on the Internet; the question iswhat kind of conversation are we looking for” (Crystal, 2001: 17).
Conversation is different from texting; there are different kinds of normsgoverning conversation as well as texting. There are also different setsof expectations between interlocutors, different sets of rules on how tomanage conversation. When is it proper to introduce a new topic inconversation, how to signal to your interlocutor that there's nothing elseto talk about it, how to transform conversation into closing section withclosing adjacency pair of goodbyes. This has been much discussedwithin ethnomethodology and discursive studies (Schegloff, E.A., Sacks,H., 1999: 263-274).
Conversation is not a predictable practice; we are confronted withpeople and with different sets of expectations, with different sets ofnorms about what kinds of conversation we are looking for, etc. We areoften confronted with intercultural communication, since our culturalbackground influences our attitudes toward conversation: how to

Innovative Issues and Approaches in Social Sciences, Vol. 10, No. 1
| 45
express involvement, how to show that we are listening to ourinterlocutor, etc.
These kinds of conversation skills are formed within conversation andthey are a must for successfully conducting and managing ourrelationships, which are formed within communication.
What about texting: “When we communicate on our digital devices, welearn different habits. As we ramp up the volume and velocity of onlineconnections, we start to expect faster answers. To get these, we askone another simpler questions; we dumb down our communications,even on the most important matters.[ ] And we use conversation withothers to learn to converse with ourselves. So our flight fromconversation can mean diminished chances to learn skills of self-reflection. These days, social media continually asks us what’s ‘on ourmind’, but we have little motivation to say something truly self-reflective.Self-reflection in conversation requires trust. It’s hard to do anything with3,000 Facebook friends except connect”. (Turkle, 2012).
As Turkle says in her article: “We expect more from technology and lessfrom one another and seem increasingly drawn to technologies thatprovide the illusion of companionship without the demands ofrelationship. Always-on/always-on-you devices provide three powerfulfantasies: that we will always be heard; that we can put our attentionwherever we want it to be; and that we never have to be alone. Indeedour new devices have turned being alone into a problem that can besolved. When people are alone, even for a few moments, they fidget andreach for a device. Here connection works like a symptom, not a cure,and our constant, reflexive impulse to connect shapes a new way ofbeing. Think of it as ‘I share, therefore I am.’ We use technology todefine ourselves by sharing our thoughts and feelings as we’re havingthem. We used to think, ‘I have a feeling; I want to make a call.’ Now ourimpulse is, ‘I want to have a feeling; I need to send a text.’ So, in order tofeel more, and to feel more like ourselves, we connect. But in our rush toconnect, we flee from solitude, our ability to be separate and gatherourselves. Lacking the capacity for solitude, we turn to other people butdon’t experience them as they are. It is as though we use them, needthem as spare parts to support our increasingly fragile selves. We thinkconstant connection will make us feel less lonely. The opposite is true. Ifwe are unable to be alone, we are far more likely to be lonely. If we don’tteach our children to be alone, they will know only how to be lonely”(Turkle, 2012).

Innovative Issues and Approaches in Social Sciences, Vol. 10, No. 1
| 46
Turkle cites the texted apology — or what she calls “saying ‘I’m sorry’and hitting send” — as a vivid example of what is lost when we typeinstead of speak. “A full-scale apology means I know I’ve hurt you, I getto see that in your eyes. You get to see that I’m uncomfortable, and withthat, the compassion response kicks in. There are many steps andthey’re all bypassed when we text.” When the apology takes place overthe phone rather than in person, the visual cues are lost, of course, butthe voice — and the sense of hurt and contrition it can convey — ispreserved.
Part of the appeal of texting in these situations is that it is less painful —but the pain is the point. The complexity and messiness of humancommunication gets short-changed (Kluger, 2012). Let us enumerateone more example: “Texting an obligatory birthday greeting means youdon’t have to fake an enthusiasm you’re not really feeling. Texting afriend to see what time a party starts means you don’t also have to ask‘How are you?’ and, worse, get an answer” (Kluger, 2012).The sentence “you don't have to fake an enthusiasm” is worth repeating.This seems like one of the “magical” benefits of online communicationwhen compared to face-to-face communication. Let us quote Rodney H.Jones, who compared both communications in terms of “primaryinvolvement”:
“If I am having a face to face converstion with you about your uncle'scancer, for instance, although I may be able to think about a lot of otherthings and even engage in a number of side involvements like smokingor eating, I would not be able to listen to music on my walkman, read amagazine, write a letter or engage in a totally unrelated conversationwith someone unknown to you and at the same time sustain theappropriate display of involvement warranted by the situation. Newcommunication technologies, on the other hand, allow users to display‘primary involvement’ along a number of attentional tracks at once andnot risk offending anybody” (Jones, 2002: 15-16). One of the main waysnew communication technologies alter context is by creating a new kindof interactional accessibility involving new ways of being present andmonitoring others' presence (Jones, 2002: 17).
Innovative Issues and Approaches in Social Sciences, Vol. 10, No. 1
| 47
Cultural-based motivations and the usage of mobile phones“The technology cannot save us from ourselves; it can only reflect all toocandidly who we are” (Barber, 2002)
The very idea of what comprises the basic characteristics ofrelationships is changing slightly, as researchers acknowledge thatmodern relationships are more optional, ephemeral, and short-lived. Wetend to understand relationships as not eternal; people understandrelationships more as a shopping-mall where you can pick up the “right”person for a certain period of time and for certain type of relationship.And our usage of technologies is also somehow a reflection of ourperception of what relationships mean to us. So when considering theeffects we must bear in mind the following idea: “Effects are produced bypeople themselves, individually and in institutions, in interaction withmedia but not by the media directly” (Mc Quail, 1996: 522).
Our relationships are a reflection of our attitudes and ideas about whatrelationships are all about. We can add a rhetorical question: “tell mehow you use technology and I will tell you what kind of relationships youare looking for?” For sure, our types of usage are not completelyindividual, since we have to obey communication norms for certaincommunication technologies. What is ours is the very choice of how todevelop a relationship, which communication channel is appropriate forconducting our relationship, etc. Ours are our visions of relationships. Inline with our visions and attitudes about relationships we can pick up the“right” technologies, which will to a certain degree frame ourrelationships.
Additionally, the culture within which the individual lives to a certaindegree influences their usage of technologies. The study “Gender andMobile Phones in Cross-National Context” (Baron, Campbell, 2011: 1)investigated gender patterns identified in a cross-national study ofmobile phone use by university students in Sweden, the USA, Italy,Japan, and Korea. Data were collected using a convenience sample of18-24 year old students between October 2007 and December 2008.There were a total of 2001 subjects who completed the survey, of which524 were male and 1477 were female (Baron, Campbell, 2011: 16-17).The data were analysed with respect to the purpose of communication,politeness issues, contact management and volume of use. Resultsindicated a number of gendered usage and attitudinal patterns. Asresearchers suggested, in some cases cultural variables may provemore explanatory than gender. We will present just one section –contact management – in order to question which factors predominateregarding the use of mobile phones. Namely, the search also
Innovative Issues and Approaches in Social Sciences, Vol. 10, No. 1
| 48
investigated the “pretending to talk” strategy. It is a strategy for avoidingacquaintances and strangers and was particularly prevalent in the US,where males in the sample were numerically more likely than females touse the strategy at least once a month (15% of American males and11.7% of females reported pretending at least once per month to betalking on their phone to avoid people they knew – compared with 3.0%of Swedish males and 1.4% of Italian males). To avoid conversation witha stranger 14.3% of American males and 15.4% of American femalespretended to be talking compared with only 1.7% of Swedish males and3.5% of Swedish females (Baron, Campbell, 2012: 20-21). Whensummarizing male and female behavior we get an interesting picture thatsomehow points to culture-dependent behavior. Namely, the distinctionbetween American and Italian behavior for avoiding acquaintances atleast once a month by pretending to talk on their phones is stark: 12.6%of Americans in the sample versus 2.1% of Italians. The Italian pattern isconsistent with the very small proportion of Italians who found itappropriate to talk on their phones at a family dinner (3.1%). Baron andCampbell concluded that these data support the notion of Italy as aculture that strongly values communication with friends or familymembers in one's physical presence. Gender-based differences weremore meaningful with respect to using the mobile phones to avoidstrangers. This strategy (pretending to talk as well as playing with otherfunction of phone) was generally employed more often by females thanby males. Given females' greater vulnerability in potential encounterswith strangers these findings are not surprising (Baron, Campbell, 2012:24).
Conclusion: Do we always get what we want? Probably yesEvery technology has certain advantages as well as certain limitations.By limitations we mean that, while enabling certain communicationtechnology, also introduces additional level of activity and availability.Facebook is such a case. Our signals of positive face are accompaniedwith signals of negative face. We can actively construct and signals ourpositive face (to be nice, available, good-looking, etc.), but as a counter-part we have to control our negative face in the same amount. If ourFacebook friend posts a new picture, it is nice that we react, comment,and acknowledge that action. A similar thing happens whencommunicating by mobile phone. Our availability is a huge problem. Wemight be always on, always available, but we are available also insituations when we do not want to be. Even in romantic relationshipspotential availability might be a source of dissatisfaction. As Miller-Ott,Kelly and Duran (2012) reported in their study The Effects of Cell PhoneUsage Rules on Satisfaction in Romantic Relationships: “cell phonesplay an important role in romantic relationships, although they can be a
Innovative Issues and Approaches in Social Sciences, Vol. 10, No. 1
| 49
source of uncertainty and conflict in relationships. Although cell phoneshelp relational partners stay connected, expectations that partners willalways be available and accessible to one another may decrease thequality of their relationship” (Miller-Ott, Kelly and Duran 2012).
So texting has some limitations and it is a source for frustration too. Buttexting is our choice and maybe it is a time to admit that texting gives usa “space” and maybe this is what we really want. In choosing to text weare choosing to have some amount of distance. “These days, looking atsociable robots and digitized friends, one might assume that what wewant is to be always in touch and never alone, no matter who or what weare in touch with ... But if we pay attention to the real consequences ofwhat we think we want, we may discover what we really want. We maywant some stillness and solitude” (Turkle, 2011: 285).
We are not going to judge texting as “improper” communication, whichdiminishes our “inner” psychological needs. It is just “texting”. Instead,we would like to go back to the early days of the internet, whenanonymity was one of the great fascinations. Anonymity has at least adual effect; it reduces the level of social pressure on the individual, andat the same time the level of unpleasant communication sometimesincreases with the “liberation” of the individual (Boudourides, 1995: 3-4).But on the other hand the very lack of social and visual connection is thecondition for the growth of user’s own “imagination”. Anonymity issupposed to be a part of the magic attraction in CMC. As one of theparticipants said, she does not hide her identity because she is afraid ofcontact with other people, but because anonymity is part of the magicitself (Baym, 1998: 55). Some other people claim that a huge turn hasbeen made in the field of internet because the very possibility ofsatisfaction (sexual games are an example) functions as realsatisfaction. Some active participants in sexual games have stated thatthe essence and fascination of the game is not in meeting someone andactually doing something with them, but that there is a great fascinationfor them in disclosing their own fantasies when typing alone. In thissense the potential possibility itself already fulfils a satisfaction. The veryidea that you are able to do something but you do not do it gives youmore satisfaction than the act itself. You never go “all the way”; you justrepeat a certain type of the game. You announce all the time but younever go through with it (Poster, 1998: 191-192). We may think that ourusage of technologies perfectly reflects our intimate needs. Maybe, asTurkle concludes, we want some solitude and a distance: “We defendconnectivity as a way to be close, even as we effectively hide from eachother” (Turkle, 2011: 281). And we can mask our true motivations behind“limited” (i.e. poor, weak) technology. We can ascribe the media the
Innovative Issues and Approaches in Social Sciences, Vol. 10, No. 1
| 50
inability to support relationships in order to disguise our ownunpreparedness to establish integral relationships.
Concerning distance, it is true that modern technologies let us repeatcertain types of relationships, even if we could go “off-line” or, let us say,face-to-face. Potential anonymity or a distance is obviously “a goodreason” that is worth defending. Some people enjoy distance andanonymity. How better to idealize than through CMC (and to someextent via texting too), where one is left to paint their own mental pictureof someone? Brittney G. Chenault cited the article "E-mail romance?Can the Internet help your love life?" (Glamour, February 1996), in whichthe author gives examples from office romances, such as one that"Vicky" describes. She exchanged increasingly sexy and intimate e-mailwith a colleague in another department of the corporation: "Every dayour dialogue got more explicit. When that message sign blipped, I'd bepractically orgasmic." However, according to Vicky, in face-to-faceencounters, nothing changed: "I'd see him in the hall and blush likecrazy, but he'd be totally normal. Rocklike. It was bizarre!"
When Vicky finally got "fed up" with the situation, she pulled the man intoher office and asked him if they indeed were going to "get together." Hisresponse was: "I don't know what to say. Maybe, maybe not. Can't wejust do this e-mail thing for now?" Vicky pulled the plug on therelationship, feeling like she was "electronically had" by a man throughhis "romantic cowardice behind a computer screen" (Chenault, 1998).So in reconsidering our contemporary life and relationships it is notproductive to evaluate our communication practices as good or bad; theyare reflections of who we are and who we want to be. If we constantlyask ourselves whether technology has ruined our relationships, we put amask on ourselves and ascribe the problems to technology. We hide ourtrue intentions and motivations behind ourselves. Maybe we really wantsome solitude; maybe we want to be less attached to each other, atleast some of the time. But the consequences of such solitude gonevertheless in different directions; we are alone, but we mightsometimes even be lonely. To be alone is fine, it is refreshing, but weought to be able to live alone and not feel lonely at the same time. Howwe will cope with that problem is another question. Maybe we have tocut off constant connectivity with other people and find a connection withourselves.
Innovative Issues and Approaches in Social Sciences, Vol. 10, No. 1
| 51
ReferencesBarber, Benjamin R. (2002): The Ambiguous Effects Of Digital
Technology On Democracy In A Globalizing WorldBeitrag zum Kongress "Gut zu Wissen", Heinrich-Böll-Stiftung, 5/2002
http://www.wissensgesellschaft.org/themen/demokratie/democratic.htmlBaron, Naomi S., Campbell, Elise M. (2012): Gender and mobile phones
in cross-national context, Language Sciences. 34 (2012), Elsevier,pp.:13-27.
Available at:http://www.american.edu/ctrl/upload/Gender_and_Mobile_Phones.pdf(13.09. 2016), Doi: 10.1016/j.langsci2011.06.018
Baym, Nancy K. (1998). The Emergence of On-Line Community. InSteven G. Jones (ed.): Cybersociety 2.0.; Revisiting Computer-Mediated Communication and Community. Thousand Oaks, London,New Delhi: New Media Cultures, SAGE Publications ( 35-68).
DOI: http://dx.doi.org/10.4135/9781452243689.n2Boudourides, Moses A. (1995): Social and Psychological Effects in
Computer-Mediated Communication. Contributed paper at the2nd Workshop/Conference "Neties'95", Greece,. Available at:http://www.duth.gr/ mboudour/mab/csi.html (12. 09. 2016)
Croteau, David; Hoynes, William (2003). Media Society: Industries,Images and Audiences (third edition) ed.). Thousand Oaks: PineForge Press. pp. 305–307.
Crystal, David (2001): Language and the Internet. Cambridge:Cambridge University Press. Available at:
http://medicine.kaums.ac.ir/uploadedfiles/files/language_and_%20the_internet.pdf (13. 09. 2016)
Duncan, H. D. (1967): The search for a social theory of communicationin American Sociology.Human communication theory. New York: Holt,Rinehart and Winston.
Herring, Susan, C. (2008): Questioning the Generational Divide:Technological Exoticism and Adult Constructions of Online YouthIdentity. In David Buckingham (ed.): Youth Identity and Digital Media.Cambridge: The John D. And Catherine T. MacArthur FoundationSeries on Digital Media and Learning. The MIT Press (71-92).Available at:http://www.distans.hkr.se/anders/exa_marcus/youth%20identity%20and%20digital%20media/kap4.pdf (20. 11. 2014)
doi: 10.1162/dmal.9780262524834.071Hian, Lee Bee, Chuan, Sim Li, Trevor, Tan Mon Kiat, Detenber,
Benjamin H. (2004): Getting to Know You: Exploring the Developmentof Relational Intimacy in Computer-mediated Communication. Journalof Computer-Mediated Communication, Volume 9, Issue 3, April 2004.
Innovative Issues and Approaches in Social Sciences, Vol. 10, No. 1
| 52
Available at: http://onlinelibrary.wiley.com/doi/10.1111/j.1083-6101.2004.tb00290.x/full (13. 09. 2016)
DOI: 10.1111/j.1083-6101.2004.tb00290.xJones, Rodney H. (2002): The Problem of Context in Computer-
Mediated Communication. A paper presented at the GeorgetownRoundtable on Language and Linguistics,
Available at:http://personal.cityu.edu.hk/~enrodney/Research/ContextCMC.doc(13. 09. 2016).
Kluger, Jeffrey (2012): We Never Talk Anymore: The Problem with TextMessaging, Available at: http://techland.time.com/2012/08/16/we-never-talk-anymore-the-problem-with-text-messaging/ (15.09. 2016)
Lister, Martin; Dovey, John; Giddings, Seth; Grant, Iain; Kelly, Kieran(2009): New Media: a critical introduction- Second edition. Londonand New York: Routledge, Taylor&Francis Group.
McQuail, D. (1999): Media effects. In A. and J. Kuper (ed.): SocialScience Encyclopedia, Second Edition. London and New York:Routledge (521-523).
Miller-Ott, Aimee E.; Kelly, Lynne, Duran, Robert L. (2012): The Effectsof Cell Phone Usage Rules on Satisfaction in Romantic Relationships.Communication Quarterly. Vol. 60, No.1, pp.: 17-34.
Available at:http://www.tandfonline.com/doi/abs/10.1080/01463373.2012.642263
DOI:10.1080/01463373.2012.642263Poster, Mark (1998): Virtual Ethnicity: Tribal Identity in an Age of Global
Communications. In Steven G. Jones (ed.): Cybersociety 2.0.;Revisiting Computer-Mediated Communication and Community.Thousand Oaks, London, New Delhi: New Media Cultures, SAGEPublications (184-211).
DOI: http://dx.doi.org/10.4135/9781452243689.n7Praprotnik, Tadej (2014): Free-floating identities: social pain or social
gain? Innovative Issues and Approaches in Social Sciences. Vol.: 7,No.: 3, pp.: 132-147.
Available at :http://www.iiass.com/pdf/IIASS-2014-no3-art07.pdf (13.09. 2016)
DOI:http://dx.doi.org/10.12959/issn.1855-0541.IIASS-2014-no3-art07Praprotnik, Tadej (2015): From Anonymity to Self-Disclosure;
recontextualisation of communication in new media. Innovative Issuesand Approaches in Social Sciences. Vol.: 8, No.: 1, pp.: 128-141.
Available at :http://www.iiass.com/pdf/IIASS-2015-no1-art08.pdf (13.09. 2016)
DOI:http://dx.doi.org/10.12959/issn.1855-0541.IIASS-2015-no1-art08
Innovative Issues and Approaches in Social Sciences, Vol. 10, No. 1
| 53
Praprotnik, Tadej (2016): Digitalization and new media landscape.Innovative Issues and Approaches in Social Sciences. Vol. 9, No. 2,pp.: 85-99.
Available at: http://www.iiass.com/pdf/IIASS-2016-no2-art5.pdf(15.09.2016)
DOI:http://dx.doi.org/10.12959/issn.1855-0541.IIASS-2016-no2-art5Quotes by Sherry Turkle (2016), Available at:
http://likesuccess.com/author/sherry-turkle (21.09.2016)Shegloff, Emanuel A.; Sacks, H. (1999): Openings up Closings. In Adam
Jaworski; Nikolas Coupland (eds.): The Discourse Reader. Londonand New York: Routledge (263-274).
Turkle, Sherry (2011): Alone Together; Why We Expect More fromTechnology and Less from Each Other. New York: Basic Books.
Turkle, Sherry (2012), The Flight From Conversation. The New YorkTimes, 21. April 2012. Available at:http://www.nytimes.com/2012/04/22/opinion/sunday/the-flight-from-conversation.html?_r=2 (13. 09. 2016).
Wikipedia, Social media. Available at:https://en.wikipedia.org/wiki/Social_media (03. 11. 2016)Wikipedia, the list of social networking sites, Available at:
https://en.wikipedia.org/wiki/List_of_social_networking_websites (03.11. 2016)
Wikipedia, technological convergence, Available at:https://en.wikipedia.org/wiki/Technological_convergence (03. 11.2016)
Wikipedia, technological determinism, Available at:https://en.wikipedia.org/wiki/Technological_determinism#Explanation(03. 11. 2016)
Wikipedia, Web 2.0, Available at: https://en.wikipedia.org/wiki/Web_2.0(03. 11. 2016)
Innovative Issues and Approaches in Social Sciences, Vol. 10, No. 1
| 54
ELECTRONIC MONITORING IN THE WORKPLACE
Mateja Gorenc1
AbstractSupervision in the workplace is essential as in this way we discovererrors, theft and observe workers. However, supervision makesemployees feel they do not have enough privacy. With the developmentof information technology, employers are getting new possibilities withwhich to control employees in the workplace. Slovenian legislation laysdown conditions for the use of modern technology as well as the limits ofpermissible use. Abuse occurs mainly in the case of unauthorized use oftechnology in the areas of video, mobile, Internet and e-mail surveillanceas well as the use of biometrics. The survey results show that 63% ofSlovenian companies do not use information technology for surveillancein the workplace, and that 90% of executives / managers take intoaccount moral and ethical principles when carrying out the controls.
Keywords: electronic surveillance, electronic communication,supervision of employees, workplace privacy
DOI: http://dx.doi.org/10.12959/issn.1855-0541.IIASS-2017-no1-art3
1 IntroductionIn the Republic of Slovenia, privacy is a constitutional right of everyindividual; therefore, monitoring employees is unconstitutional. At thesame time, this right is protected by various kinds of laws, the mostimportant being the Law on Personal Data Protection and adopted in thelaw implemented on European Directives. In compliance with the law, itis only admissible to monitor employees in so far as they are notifiedabout this in writing and give their written consent to it. Withoutnotification and written consent, continuous monitoring without a specificreason is not permitted. In Slovenia, it is prohibited by law to monitoremployees in any way without informing them beforehand (Drozg, 2015).
2 Privacy in the workplaceThe issue of privacy in the workplace leads to a conflict of two rights,namely the employer’s right to his or her property and the worker's rightto his or her privacy. Workers are offered the use of resources and
1 Mateja Gorenc, Doctor of Business Sciences, employed in the sector of informationtechnologies ([email protected])
Innovative Issues and Approaches in Social Sciences, Vol. 10, No. 1
| 55
information provided by the employers in exchange for which theworkers provide their knowledge and personal data necessary for theimplementation of the work process. Thus, the employers have thepersonal data of the workers, while the workers have the employers'trade secrets. Labour legislation requires workers to perform work underthe direction and supervision of the employers. Thus, employers areentitled to control the workers, but the workers must be informed inadvance of the rules. Monitoring is therefore a completely legal andlegitimate right of the employers (Havliček, 2012).
3 Employees controlThere are reasons for and against the control of the employees. Themost important advantage is the security of the data necessary for thesuccess of the company. Controlling computers is possible with anumber of different types of software for controlling computer networks.They can monitor operations and employee productivity. Such softwareprovides security, blocks certain websites, informs administrators ofpotential threats, and monitors the use of computers and the Internet.Supervising of office computers can protect the data on them andensure that employees use computers for work purposes. The softwareis very useful and can be further adjusted to the needs of the company.It offers a worthwhile tool for ensuring the security and integrity ofcorporate data. Although the monitoring of computers in the workplacehas become almost indispensable, employees often do not understandthe reasons for this and feel exploited.
Forms of control over employees include:• Personality and psychological testing, research of personality
traits, religious and other beliefs;• Supervision of arrival and departure from the workplace
(registration card, biometrics, etc.).• General video surveillance over the work and movements of the
worker;• Control of telephone calls and other acoustic control (e.g.
monitoring meetings);• Control over the use of the Internet;• Control over e-mail;• Control over the use of input-output devices (keyboard, printer,
mouse, display, etc.);• Control over the location and movement of workers within office
premises;• Control of movements of workers during the use of official cars
(e.g. GPS);
Innovative Issues and Approaches in Social Sciences, Vol. 10, No. 1
| 56
• Control over the worker's diet and any addictions (e.g. testing fordrug use);
• Supervision of dress, behaviour and labour unions.
4 Electronic controlElectronic control over the work of employees is one of the mostcontroversial topics in the privacy law and information law in general.Employers, on the one hand, have the legal right to control the work ofemployees (e.g. under the provisions of the Labour Relations Act andthe Civil Servants Act), on the other hand, the law strongly protects theprivacy of individuals in the workplace (e.g. The Law on Protection ofPersonal Data). The right to privacy and personal integrity derives fromthe Constitution. Employers can, under the Law on Labour Relations,collect process and use the personal data of workers only if prescribedby law or if it is necessary in order to exercise the rights and obligationsarising from employment. Since the boundary between what is privateand what is the employer’s in the workplace is very thin, it is generallyunclear what the employer, with regard to electronic surveillance ofemployees, can and cannot do.
Employees must be informed in advance of the employer’s rulesregarding the use of phone, email and the Internet as well as when andin what cases their communications can be controlled. The employer,however, cannot afford excessive restriction of the right to privacy andthe right to communicate with the outside world. It also applies that theemployee must agree to the supervision and that the control should beobjectively justified and proportionate. As the employee is at adisadvantage, the employer must receive voluntary consent withoutcoercion.
5 Means to supervise employees and the admissibility ofsupervision of electronic communications in SloveniaIn accordance with the labour legislation, workers must perform theirwork under the supervision and instruction of the employer, so theemployer is, in principle, entitled to supervise their employees. This ishis legitimate and legal right. However, the employer should familiarizethe employees with the rules of using the telephone, e-mail or theInternet in advance, as well as in which cases their communication canbe controlled. The restriction should not unduly restrict the right toprivacy or to communicate with the external environment, andsupervision must be justifiable and proportionate. In addition, theemployee must voluntarily accept the supervision. At this point, it shouldbe noted that with a statement of agreement, the employer acquires theright to monitor e-mail or other comparable communications that the
Innovative Issues and Approaches in Social Sciences, Vol. 10, No. 1
| 57
employees exchange among themselves – i.e. within the company,however, the employer is not permitted to monitor e-mails thatemployees receive from a third person.
5.1 ComputerThe computer provides an overview of everything typed or viewed on itin real time (or ever before). With the help of a computer, one can figureout what their employees were doing on the computer throughout theirworking hours and the time they spent doing it. Supervision of computeractivities is very comprehensive and multi-faceted.
5.2 E-mailThe owner of the server (or the one hiring the server) has the possibilityto read all the e-mails located on it. An employer who reads anemployee’s sent or received messages on the company computerviolates the fundamental rights of workers as laid down in Article 8 of theEuropean Convention on Human Rights, which applies irrespective ofwhether the worker has been informed in advance that a company'scomputer may not be used for non-professional purposes.
Having a look at the employee’s e-mail is permissible according to legalsources, case-control and practice, provided that the conditions set outin Article 37 of the Constitution (the legal basis, the court order, only fora limited period, necessary for the institution, course of criminalproceedings or for the security of the country) and with the agreement ofthe participants of communication. Having a look at the employee’s e-mail is possible even in exceptional situations, such as:• Death of an individual, the said data in his part of e-mail is necessaryfor the organization's operations and may cause considerablecommercial damage and cannot be obtained otherwise;• Court order;• Commission and passed record access, audit trail;• Unavoidably necessary intervention for safety reasons.
In addition, an employer may block a selected type of e-mail on theserver (e.g. e-mail with the letters "FW" in their subject, mail that is toolarge), but must notify the employees in advance. An employer may noteither physically or through online 'spy' programs find out which sites theemployees visited in the past, from whom they received e-mails or whothey sent them.
5.3 The InternetServer control enables the monitoring of sites visited by employees onthe Internet during working hours. It also gives information on how much
Innovative Issues and Approaches in Social Sciences, Vol. 10, No. 1
| 58
time the workers spent on each site and which websites they visited themost. The employer may, in advance, technically restrict access to theInternet, but may not subsequently check and restrict URLs, size orformat of attachments. The employer cannot monitor the websites visitedby the user, since the list of websites visited by the user exists under thecollection of personal data. Examples of hard-core provisions:• Use of the Internet by employees may be controlled;• As part of regular maintenance checks or by order of the responsibleperson, IT officers may review the accesses of individuals to differentURLs and produce a report on the review of the use of the World WideWeb.
5.6 PhonePhone calls allow the reconstruction of the entire working day with theacquisition of dialled numbers, received calls numbers, time and cost ofconversations. In this way, it is possible to control the activities ofemployees and the use of the phone. In most cases, the employer mayonly require a statement of calls from the provider of telecommunicationsservices, which does not constitute a breach of the Act on the Protectionof Personal Data, since the acquisition of the statement of calls is his /her right to property. However, if the employer attempted to determine towhom the called numbers belong, this is already the processing ofpersonal data and therefore the limit to which the employer may use thelist of calls. Exceeding the amount by which an individual may use thebusiness phone which is a frequent employees’ violation is thereforenecessary and must be determined with methods that will not disclosepersonal information and it is especially recommended to employers thatthe rules of phoning be determined in advance and on the basis of thewritten consent of the individual. By doing this, they protect themselvesin advance against most potential problems.
5.7 The camcorderVideo surveillance cameras can record all events in a given areaincluding whether employees are in their working spaces, how theycirculate and where they go, whether they use the equipment the rightway, and even if they are honest and not stealing, etc. Videosurveillance is covered in the Personal Data Protection Act (PDPA-1) inarticle 74. In compliance with PDPA-1, the employer must, at theintroduction of video surveillance, put a notice in a prominent position.This notice must be put up on time (before implementing videosurveillance) and in a clear, visible place. PDPA-1 allows for videosurveillance of access to official office or business premises and videosurveillance of workspaces, each of them under different conditions.
Innovative Issues and Approaches in Social Sciences, Vol. 10, No. 1
| 59
Video surveillance within the premises (offices, canteens, productionfacilities, etc.) can only be carried out in exceptional cases – such aswhen this is strictly necessary for the safety of people or property or forthe protection of classified information and trade secrets, and thispurpose cannot be achieved by milder means. Under these conditions,video surveillance can still only be used in those parts of the workingpremises, where the previously listed items should be protected. It isprohibited to perform video surveillance in work areas outside theworkplace, particularly in changing rooms, lifts and sanitary areas.Before the implementation of video surveillance, employees must beinformed of the implementation in writing before the introduction of videosurveillance, however, the employer must consult with representativetrade unions at the employer’s place of business.
5.8 Smart cards (also RFID cards, and contactless cards)Smart cards are plastic cards, which contain a chip in order to control allof the employees’ movements in the workplace. This chip can beembedded in work clothes (e.g. a button), often without the knowledge ofemployees.
5.9 BiometricsTechnologies are also being developed to ensure the monitoring ofemployees through the reading of biometric data (fingerprints, eyes,DNA).
5.10 Psychometric methods / intelligence testsSuch methods reveal the psychological profile of an individual. Medicaltesting reveals the psychological and physical condition of an individual.
6 Purpose and objective of the researchSurveillance in the workplace has always been implemented and, in thefuture, it will be even stricter. The purpose of the study is to determinewhether employers monitor employees in the workplace, or useinformation technology to control their employees and whether theyrespect moral and ethical principles when carrying out such controls.
The aim of the research is to determine:• Do employers monitor employees at work?• Do employers take into account the moral and ethical principles
in the implementation of the control?• Do employers use information technology for surveillance in the
workplace?• Do companies use special software to monitor all the visited
websites used by employees?
Innovative Issues and Approaches in Social Sciences, Vol. 10, No. 1
| 60
• Do they have any particular computer software installed in everycomputer to monitor the browsing of Internet services at aspecific time?
• Does the company have a key logger?• Do you have built-in monitoring of electronic files in the
computers in your company (e.g. to monitor the transfer of filesthat are not work-related)?
• Do businesses store and read the e-mails of employees?• Does the company have special software to monitor e-mail?• Does the company have cameras to monitor what employees are
doing on the computer?
The basic thesis of the research is as follows: "Employers useinformation technology to control employees and take into account themoral and ethical principles in the implementation of the control."
The creation of the fundamental thesis was incited by pondering whetheremployers in Slovenia monitor employees with information technologyand whether they take into account the moral and ethical principles forthe control. The main reasons for staff monitoring are: stopping theleakage of sensitive information, stopping violations of laws, limitinglegal liability, controlling and reversing the loss of key communications,monitoring productivity in the workplace, preventing economic espionageand unauthorized entry into the information system as well as protectingthe network against overload.
7 Survey resultsData collection for the quantitative research was performed with anonline questionnaire. The multiple choice answers were based on a formknown as the Likert scale. Respondents were asked to circle one of thefive responses indicating intense validity or invalidity of the selectedargument with a score of 1 meaning that the argument does not applyand 5 meaning that the argument fully applies. The sample was randomand representative of Slovenian companies. 274 different Sloveniancompanies responded to the online survey, of which 102 companiesresponded by filling out the survey and of these 90 questionnaires,(32.8%) were valid. The questionnaire was conducted in the periodsfrom 1 June 2015 to 30 June 2015 and from 21 September 2015 to 9October 2015. Table 1 shows the composition of the sample accordingto demographic variables.
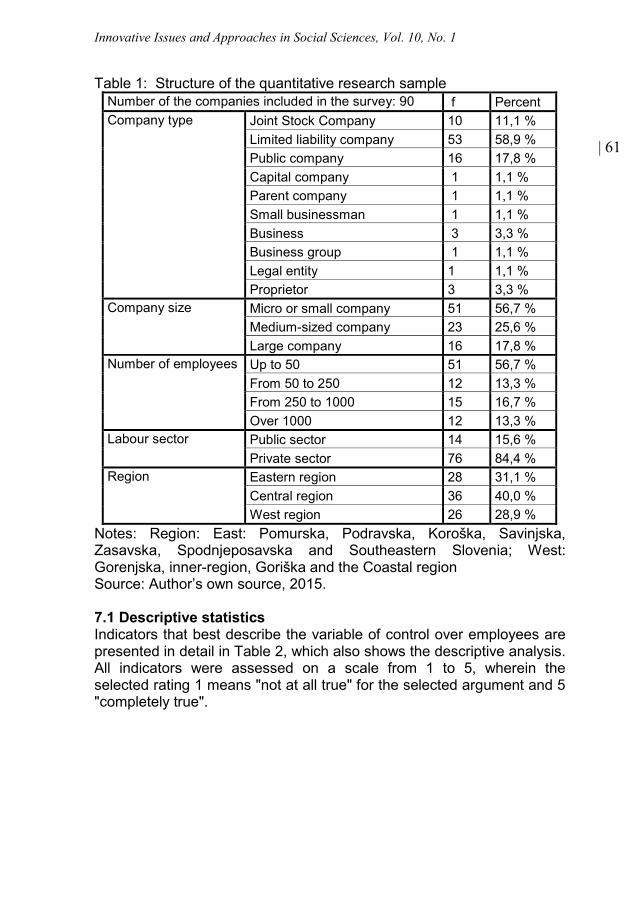
Innovative Issues and Approaches in Social Sciences, Vol. 10, No. 1
| 61
Table 1: Structure of the quantitative research sampleNumber of the companies included in the survey: 90 f PercentCompany type Joint Stock Company 10 11,1 %
Limited liability company 53 58,9 %Public company 16 17,8 %Capital company 1 1,1 %Parent company 1 1,1 %Small businessman 1 1,1 %Business 3 3,3 %Business group 1 1,1 %Legal entity 1 1,1 %Proprietor 3 3,3 %
Company size Micro or small company 51 56,7 %Medium-sized company 23 25,6 %Large company 16 17,8 %
Number of employees Up to 50 51 56,7 %From 50 to 250 12 13,3 %From 250 to 1000 15 16,7 %Over 1000 12 13,3 %
Labour sector Public sector 14 15,6 %Private sector 76 84,4 %
Region Eastern region 28 31,1 %Central region 36 40,0 %West region 26 28,9 %
Notes: Region: East: Pomurska, Podravska, Koroška, Savinjska,Zasavska, Spodnjeposavska and Southeastern Slovenia; West:Gorenjska, inner-region, Goriška and the Coastal regionSource: Author’s own source, 2015.
7.1 Descriptive statisticsIndicators that best describe the variable of control over employees arepresented in detail in Table 2, which also shows the descriptive analysis.All indicators were assessed on a scale from 1 to 5, wherein theselected rating 1 means "not at all true" for the selected argument and 5"completely true".
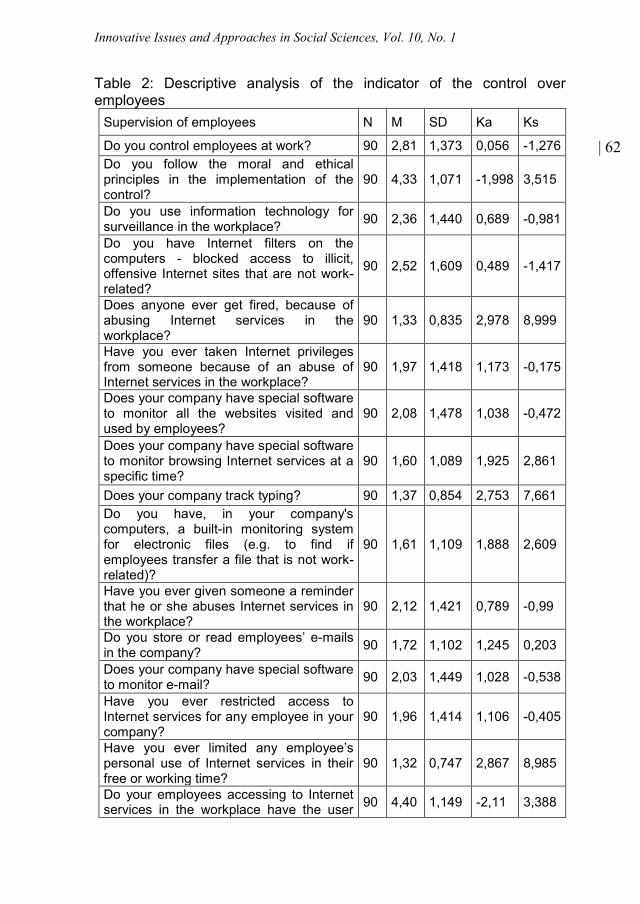
Innovative Issues and Approaches in Social Sciences, Vol. 10, No. 1
| 62
Table 2: Descriptive analysis of the indicator of the control overemployees
Supervision of employees N M SD Ka Ks
Do you control employees at work? 90 2,81 1,373 0,056 -1,276Do you follow the moral and ethicalprinciples in the implementation of thecontrol?
90 4,33 1,071 -1,998 3,515
Do you use information technology forsurveillance in the workplace? 90 2,36 1,440 0,689 -0,981
Do you have Internet filters on thecomputers - blocked access to illicit,offensive Internet sites that are not work-related?
90 2,52 1,609 0,489 -1,417
Does anyone ever get fired, because ofabusing Internet services in theworkplace?
90 1,33 0,835 2,978 8,999
Have you ever taken Internet privilegesfrom someone because of an abuse ofInternet services in the workplace?
90 1,97 1,418 1,173 -0,175
Does your company have special softwareto monitor all the websites visited andused by employees?
90 2,08 1,478 1,038 -0,472
Does your company have special softwareto monitor browsing Internet services at aspecific time?
90 1,60 1,089 1,925 2,861
Does your company track typing? 90 1,37 0,854 2,753 7,661Do you have, in your company'scomputers, a built-in monitoring systemfor electronic files (e.g. to find ifemployees transfer a file that is not work-related)?
90 1,61 1,109 1,888 2,609
Have you ever given someone a reminderthat he or she abuses Internet services inthe workplace?
90 2,12 1,421 0,789 -0,99
Do you store or read employees’ e-mailsin the company? 90 1,72 1,102 1,245 0,203
Does your company have special softwareto monitor e-mail? 90 2,03 1,449 1,028 -0,538
Have you ever restricted access toInternet services for any employee in yourcompany?
90 1,96 1,414 1,106 -0,405
Have you ever limited any employee’spersonal use of Internet services in theirfree or working time?
90 1,32 0,747 2,867 8,985
Do your employees accessing to Internetservices in the workplace have the user 90 4,40 1,149 -2,11 3,388
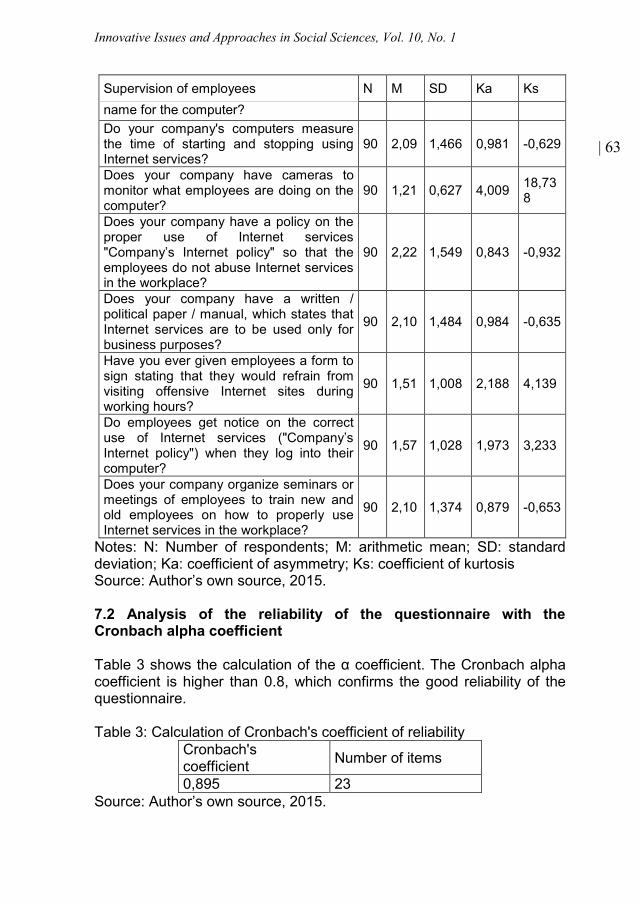
Innovative Issues and Approaches in Social Sciences, Vol. 10, No. 1
| 63
Supervision of employees N M SD Ka Ksname for the computer?Do your company's computers measurethe time of starting and stopping usingInternet services?
90 2,09 1,466 0,981 -0,629
Does your company have cameras tomonitor what employees are doing on thecomputer?
90 1,21 0,627 4,009 18,738
Does your company have a policy on theproper use of Internet services"Company’s Internet policy" so that theemployees do not abuse Internet servicesin the workplace?
90 2,22 1,549 0,843 -0,932
Does your company have a written /political paper / manual, which states thatInternet services are to be used only forbusiness purposes?
90 2,10 1,484 0,984 -0,635
Have you ever given employees a form tosign stating that they would refrain fromvisiting offensive Internet sites duringworking hours?
90 1,51 1,008 2,188 4,139
Do employees get notice on the correctuse of Internet services ("Company’sInternet policy") when they log into theircomputer?
90 1,57 1,028 1,973 3,233
Does your company organize seminars ormeetings of employees to train new andold employees on how to properly useInternet services in the workplace?
90 2,10 1,374 0,879 -0,653
Notes: N: Number of respondents; M: arithmetic mean; SD: standarddeviation; Ka: coefficient of asymmetry; Ks: coefficient of kurtosisSource: Author’s own source, 2015.
7.2 Analysis of the reliability of the questionnaire with theCronbach alpha coefficient
Table 3 shows the calculation of the α coefficient. The Cronbach alphacoefficient is higher than 0.8, which confirms the good reliability of thequestionnaire.
Table 3: Calculation of Cronbach's coefficient of reliabilityCronbach'scoefficient Number of items
0,895 23Source: Author’s own source, 2015.
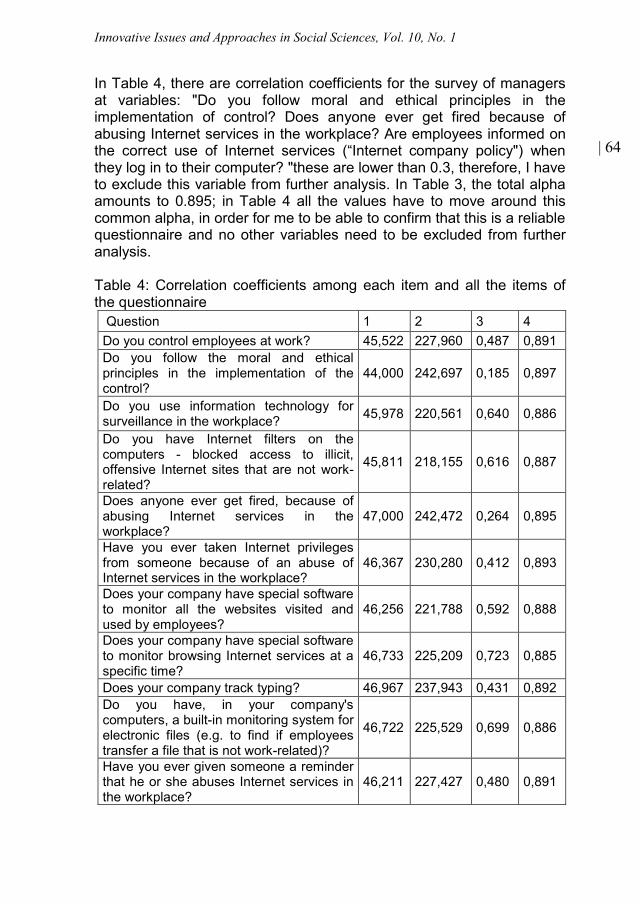
Innovative Issues and Approaches in Social Sciences, Vol. 10, No. 1
| 64
In Table 4, there are correlation coefficients for the survey of managersat variables: "Do you follow moral and ethical principles in theimplementation of control? Does anyone ever get fired because ofabusing Internet services in the workplace? Are employees informed onthe correct use of Internet services (“Internet company policy") whenthey log in to their computer? "these are lower than 0.3, therefore, I haveto exclude this variable from further analysis. In Table 3, the total alphaamounts to 0.895; in Table 4 all the values have to move around thiscommon alpha, in order for me to be able to confirm that this is a reliablequestionnaire and no other variables need to be excluded from furtheranalysis.
Table 4: Correlation coefficients among each item and all the items ofthe questionnaire
Question 1 2 3 4Do you control employees at work? 45,522 227,960 0,487 0,891Do you follow the moral and ethicalprinciples in the implementation of thecontrol?
44,000 242,697 0,185 0,897
Do you use information technology forsurveillance in the workplace? 45,978 220,561 0,640 0,886
Do you have Internet filters on thecomputers - blocked access to illicit,offensive Internet sites that are not work-related?
45,811 218,155 0,616 0,887
Does anyone ever get fired, because ofabusing Internet services in theworkplace?
47,000 242,472 0,264 0,895
Have you ever taken Internet privilegesfrom someone because of an abuse ofInternet services in the workplace?
46,367 230,280 0,412 0,893
Does your company have special softwareto monitor all the websites visited andused by employees?
46,256 221,788 0,592 0,888
Does your company have special softwareto monitor browsing Internet services at aspecific time?
46,733 225,209 0,723 0,885
Does your company track typing? 46,967 237,943 0,431 0,892Do you have, in your company'scomputers, a built-in monitoring system forelectronic files (e.g. to find if employeestransfer a file that is not work-related)?
46,722 225,529 0,699 0,886
Have you ever given someone a reminderthat he or she abuses Internet services inthe workplace?
46,211 227,427 0,480 0,891
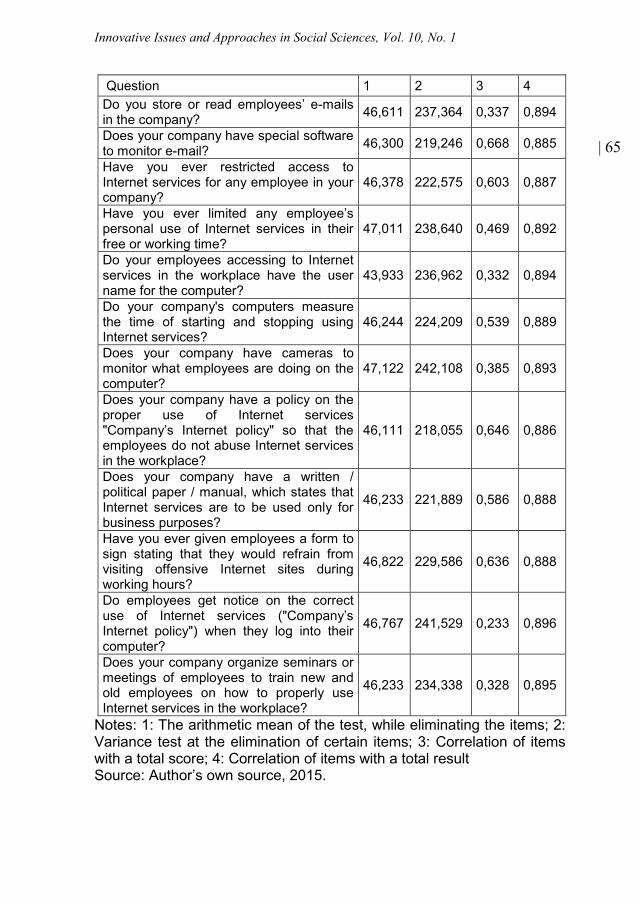
Innovative Issues and Approaches in Social Sciences, Vol. 10, No. 1
| 65
Question 1 2 3 4Do you store or read employees’ e-mailsin the company? 46,611 237,364 0,337 0,894
Does your company have special softwareto monitor e-mail? 46,300 219,246 0,668 0,885
Have you ever restricted access toInternet services for any employee in yourcompany?
46,378 222,575 0,603 0,887
Have you ever limited any employee’spersonal use of Internet services in theirfree or working time?
47,011 238,640 0,469 0,892
Do your employees accessing to Internetservices in the workplace have the username for the computer?
43,933 236,962 0,332 0,894
Do your company's computers measurethe time of starting and stopping usingInternet services?
46,244 224,209 0,539 0,889
Does your company have cameras tomonitor what employees are doing on thecomputer?
47,122 242,108 0,385 0,893
Does your company have a policy on theproper use of Internet services"Company’s Internet policy" so that theemployees do not abuse Internet servicesin the workplace?
46,111 218,055 0,646 0,886
Does your company have a written /political paper / manual, which states thatInternet services are to be used only forbusiness purposes?
46,233 221,889 0,586 0,888
Have you ever given employees a form tosign stating that they would refrain fromvisiting offensive Internet sites duringworking hours?
46,822 229,586 0,636 0,888
Do employees get notice on the correctuse of Internet services ("Company’sInternet policy") when they log into theircomputer?
46,767 241,529 0,233 0,896
Does your company organize seminars ormeetings of employees to train new andold employees on how to properly useInternet services in the workplace?
46,233 234,338 0,328 0,895
Notes: 1: The arithmetic mean of the test, while eliminating the items; 2:Variance test at the elimination of certain items; 3: Correlation of itemswith a total score; 4: Correlation of items with a total resultSource: Author’s own source, 2015.
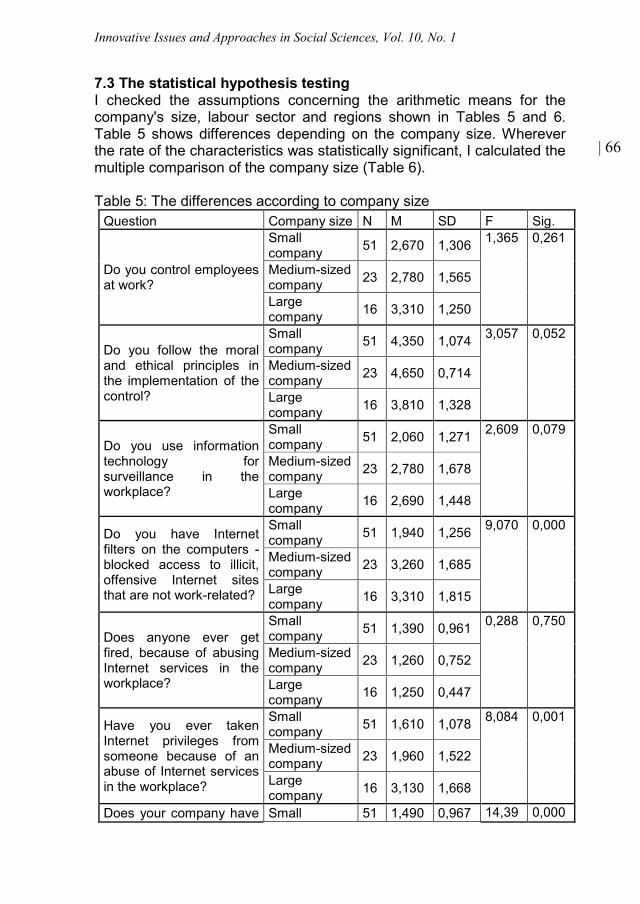
Innovative Issues and Approaches in Social Sciences, Vol. 10, No. 1
| 66
7.3 The statistical hypothesis testingI checked the assumptions concerning the arithmetic means for thecompany's size, labour sector and regions shown in Tables 5 and 6.Table 5 shows differences depending on the company size. Whereverthe rate of the characteristics was statistically significant, I calculated themultiple comparison of the company size (Table 6).
Table 5: The differences according to company sizeQuestion Company size N M SD F Sig.
Do you control employeesat work?
Smallcompany 51 2,670 1,306 1,365 0,261
Medium-sizedcompany 23 2,780 1,565
Largecompany 16 3,310 1,250
Do you follow the moraland ethical principles inthe implementation of thecontrol?
Smallcompany 51 4,350 1,074 3,057 0,052
Medium-sizedcompany 23 4,650 0,714
Largecompany 16 3,810 1,328
Do you use informationtechnology forsurveillance in theworkplace?
Smallcompany 51 2,060 1,271 2,609 0,079
Medium-sizedcompany 23 2,780 1,678
Largecompany 16 2,690 1,448
Do you have Internetfilters on the computers -blocked access to illicit,offensive Internet sitesthat are not work-related?
Smallcompany 51 1,940 1,256 9,070 0,000
Medium-sizedcompany 23 3,260 1,685
Largecompany 16 3,310 1,815
Does anyone ever getfired, because of abusingInternet services in theworkplace?
Smallcompany 51 1,390 0,961 0,288 0,750
Medium-sizedcompany 23 1,260 0,752
Largecompany 16 1,250 0,447
Have you ever takenInternet privileges fromsomeone because of anabuse of Internet servicesin the workplace?
Smallcompany 51 1,610 1,078 8,084 0,001
Medium-sizedcompany 23 1,960 1,522
Largecompany 16 3,130 1,668
Does your company have Small 51 1,490 0,967 14,39 0,000

Innovative Issues and Approaches in Social Sciences, Vol. 10, No. 1
| 67
Question Company size N M SD F Sig.special software tomonitor all the websitesvisited and used byemployees?
company 9Medium-sizedcompany 23 3,220 1,650
Largecompany 16 2,310 1,621
Does your company havespecial software tomonitor browsing Internetservices at a specifictime?
Smallcompany 51 1,350 0,820 3,427 0,037
Medium-sizedcompany 23 1,830 1,193
Largecompany 16 2,060 1,482
Does your company tracktyping?
Smallcompany 51 1,290 0,807 1,387 0,255
Medium-sizedcompany 23 1,300 0,703
Largecompany 16 1,690 1,138
Do you have, in yourcompany's computers, abuilt-in monitoring systemfor electronic files (e.g. tofind if employees transfera file that is not work-related)?
Smallcompany 51 1,310 0,678 5,042 0,008
Medium-sizedcompany 23 1,870 1,359
Largecompany 16 2,190 1,515
Have you ever givensomeone a reminder thathe or she abuses Internetservices in theworkplace?
Smallcompany 51 1,800 1,184 4,755 0,011
Medium-sizedcompany 23 2,220 1,565
Largecompany 16 3,000 1,592
Do you store or reademployees’ e-mails in thecompany?
Smallcompany 51 1,780 1,101 0,510 0,602
Medium-sizedcompany 23 1,520 0,994
Largecompany 16 1,810 1,276
Does your company havespecial software tomonitor e-mail?
Smallcompany 51 1,880 1,306 0,646 0,527
Medium-sizedcompany 23 2,260 1,685
Largecompany 16 2,190 1,559
Have you ever restrictedaccess to Internetservices for any employeein your company?
Smallcompany 51 1,630 1,131 3,582 0,032
Medium-sizedcompany 23 2,260 1,544
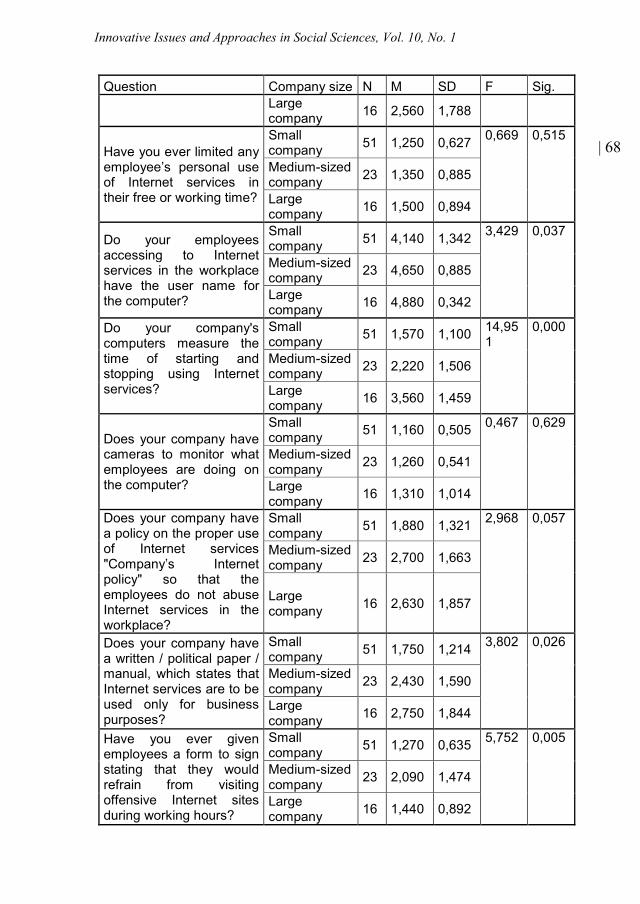
Innovative Issues and Approaches in Social Sciences, Vol. 10, No. 1
| 68
Question Company size N M SD F Sig.Largecompany 16 2,560 1,788
Have you ever limited anyemployee’s personal useof Internet services intheir free or working time?
Smallcompany 51 1,250 0,627 0,669 0,515
Medium-sizedcompany 23 1,350 0,885
Largecompany 16 1,500 0,894
Do your employeesaccessing to Internetservices in the workplacehave the user name forthe computer?
Smallcompany 51 4,140 1,342 3,429 0,037
Medium-sizedcompany 23 4,650 0,885
Largecompany 16 4,880 0,342
Do your company'scomputers measure thetime of starting andstopping using Internetservices?
Smallcompany 51 1,570 1,100 14,95
10,000
Medium-sizedcompany 23 2,220 1,506
Largecompany 16 3,560 1,459
Does your company havecameras to monitor whatemployees are doing onthe computer?
Smallcompany 51 1,160 0,505 0,467 0,629
Medium-sizedcompany 23 1,260 0,541
Largecompany 16 1,310 1,014
Does your company havea policy on the proper useof Internet services"Company’s Internetpolicy" so that theemployees do not abuseInternet services in theworkplace?
Smallcompany 51 1,880 1,321 2,968 0,057
Medium-sizedcompany 23 2,700 1,663
Largecompany 16 2,630 1,857
Does your company havea written / political paper /manual, which states thatInternet services are to beused only for businesspurposes?
Smallcompany 51 1,750 1,214 3,802 0,026
Medium-sizedcompany 23 2,430 1,590
Largecompany 16 2,750 1,844
Have you ever givenemployees a form to signstating that they wouldrefrain from visitingoffensive Internet sitesduring working hours?
Smallcompany 51 1,270 0,635 5,752 0,005
Medium-sizedcompany 23 2,090 1,474
Largecompany 16 1,440 0,892
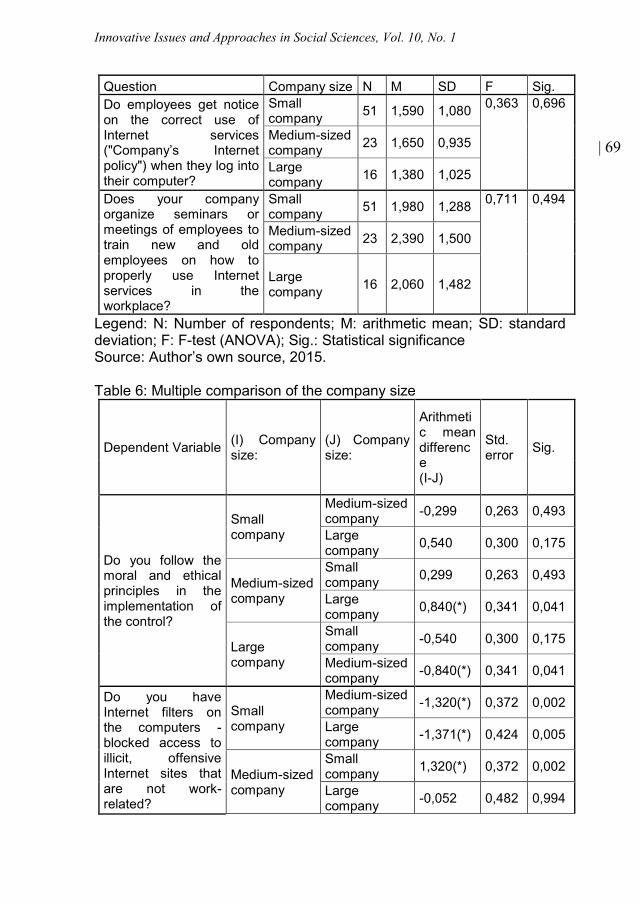
Innovative Issues and Approaches in Social Sciences, Vol. 10, No. 1
| 69
Question Company size N M SD F Sig.Do employees get noticeon the correct use ofInternet services("Company’s Internetpolicy") when they log intotheir computer?
Smallcompany 51 1,590 1,080 0,363 0,696
Medium-sizedcompany 23 1,650 0,935
Largecompany 16 1,380 1,025
Does your companyorganize seminars ormeetings of employees totrain new and oldemployees on how toproperly use Internetservices in theworkplace?
Smallcompany 51 1,980 1,288 0,711 0,494
Medium-sizedcompany 23 2,390 1,500
Largecompany 16 2,060 1,482
Legend: N: Number of respondents; M: arithmetic mean; SD: standarddeviation; F: F-test (ANOVA); Sig.: Statistical significanceSource: Author’s own source, 2015.
Table 6: Multiple comparison of the company size
Dependent Variable (I) Companysize:
(J) Companysize:
Arithmetic meandifference(I-J)
Std.error Sig.
Do you follow themoral and ethicalprinciples in theimplementation ofthe control?
Smallcompany
Medium-sizedcompany -0,299 0,263 0,493
Largecompany 0,540 0,300 0,175
Medium-sizedcompany
Smallcompany 0,299 0,263 0,493
Largecompany 0,840(*) 0,341 0,041
Largecompany
Smallcompany -0,540 0,300 0,175
Medium-sizedcompany -0,840(*) 0,341 0,041
Do you haveInternet filters onthe computers -blocked access toillicit, offensiveInternet sites thatare not work-related?
Smallcompany
Medium-sizedcompany -1,320(*) 0,372 0,002
Largecompany -1,371(*) 0,424 0,005
Medium-sizedcompany
Smallcompany 1,320(*) 0,372 0,002
Largecompany -0,052 0,482 0,994
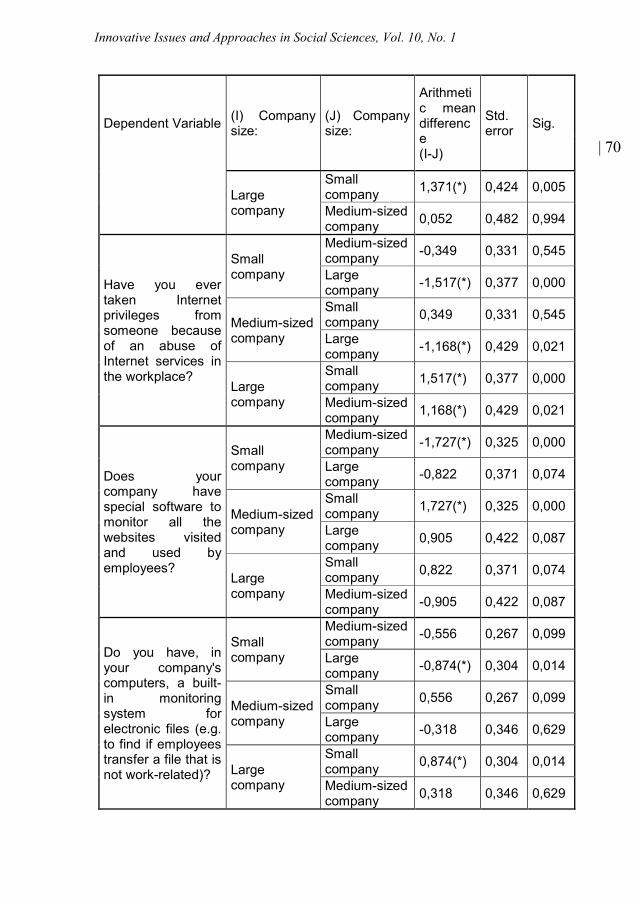
Innovative Issues and Approaches in Social Sciences, Vol. 10, No. 1
| 70Dependent Variable (I) Company
size:(J) Companysize:
Arithmetic meandifference(I-J)
Std.error Sig.
Largecompany
Smallcompany 1,371(*) 0,424 0,005
Medium-sizedcompany 0,052 0,482 0,994
Have you evertaken Internetprivileges fromsomeone becauseof an abuse ofInternet services inthe workplace?
Smallcompany
Medium-sizedcompany -0,349 0,331 0,545
Largecompany -1,517(*) 0,377 0,000
Medium-sizedcompany
Smallcompany 0,349 0,331 0,545
Largecompany -1,168(*) 0,429 0,021
Largecompany
Smallcompany 1,517(*) 0,377 0,000
Medium-sizedcompany 1,168(*) 0,429 0,021
Does yourcompany havespecial software tomonitor all thewebsites visitedand used byemployees?
Smallcompany
Medium-sizedcompany -1,727(*) 0,325 0,000
Largecompany -0,822 0,371 0,074
Medium-sizedcompany
Smallcompany 1,727(*) 0,325 0,000
Largecompany 0,905 0,422 0,087
Largecompany
Smallcompany 0,822 0,371 0,074
Medium-sizedcompany -0,905 0,422 0,087
Do you have, inyour company'scomputers, a built-in monitoringsystem forelectronic files (e.g.to find if employeestransfer a file that isnot work-related)?
Smallcompany
Medium-sizedcompany -0,556 0,267 0,099
Largecompany -0,874(*) 0,304 0,014
Medium-sizedcompany
Smallcompany 0,556 0,267 0,099
Largecompany -0,318 0,346 0,629
Largecompany
Smallcompany 0,874(*) 0,304 0,014
Medium-sizedcompany 0,318 0,346 0,629
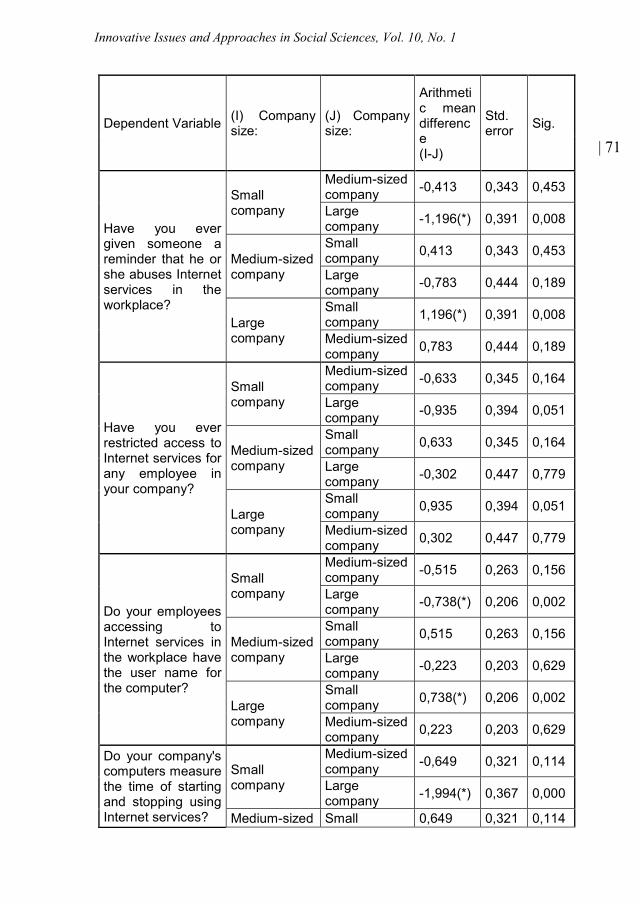
Innovative Issues and Approaches in Social Sciences, Vol. 10, No. 1
| 71Dependent Variable (I) Company
size:(J) Companysize:
Arithmetic meandifference(I-J)
Std.error Sig.
Have you evergiven someone areminder that he orshe abuses Internetservices in theworkplace?
Smallcompany
Medium-sizedcompany -0,413 0,343 0,453
Largecompany -1,196(*) 0,391 0,008
Medium-sizedcompany
Smallcompany 0,413 0,343 0,453
Largecompany -0,783 0,444 0,189
Largecompany
Smallcompany 1,196(*) 0,391 0,008
Medium-sizedcompany 0,783 0,444 0,189
Have you everrestricted access toInternet services forany employee inyour company?
Smallcompany
Medium-sizedcompany -0,633 0,345 0,164
Largecompany -0,935 0,394 0,051
Medium-sizedcompany
Smallcompany 0,633 0,345 0,164
Largecompany -0,302 0,447 0,779
Largecompany
Smallcompany 0,935 0,394 0,051
Medium-sizedcompany 0,302 0,447 0,779
Do your employeesaccessing toInternet services inthe workplace havethe user name forthe computer?
Smallcompany
Medium-sizedcompany -0,515 0,263 0,156
Largecompany -0,738(*) 0,206 0,002
Medium-sizedcompany
Smallcompany 0,515 0,263 0,156
Largecompany -0,223 0,203 0,629
Largecompany
Smallcompany 0,738(*) 0,206 0,002
Medium-sizedcompany 0,223 0,203 0,629
Do your company'scomputers measurethe time of startingand stopping usingInternet services?
Smallcompany
Medium-sizedcompany -0,649 0,321 0,114
Largecompany -1,994(*) 0,367 0,000
Medium-sized Small 0,649 0,321 0,114
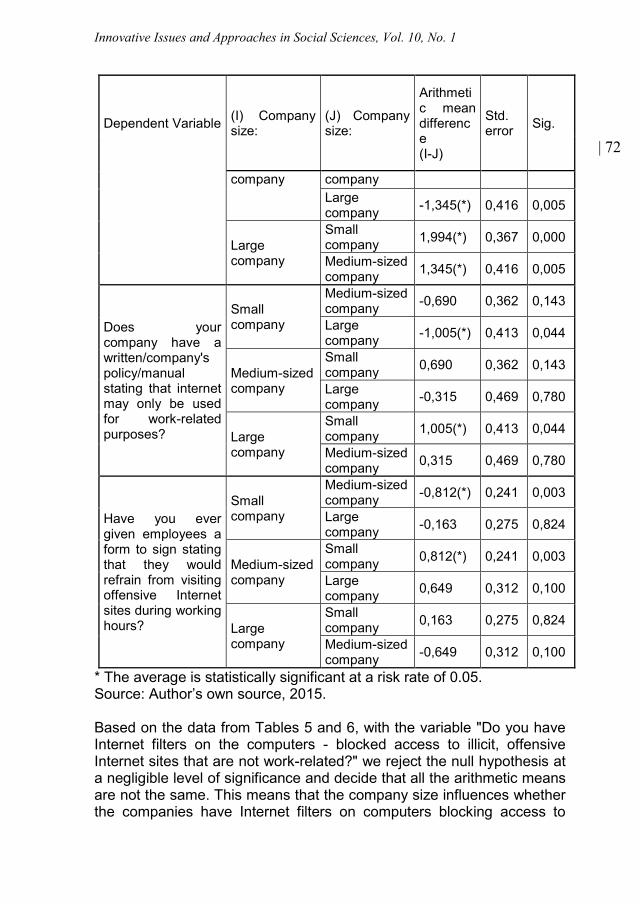
Innovative Issues and Approaches in Social Sciences, Vol. 10, No. 1
| 72Dependent Variable (I) Company
size:(J) Companysize:
Arithmetic meandifference(I-J)
Std.error Sig.
company companyLargecompany -1,345(*) 0,416 0,005
Largecompany
Smallcompany 1,994(*) 0,367 0,000
Medium-sizedcompany 1,345(*) 0,416 0,005
Does yourcompany have awritten/company'spolicy/manualstating that internetmay only be usedfor work-relatedpurposes?
Smallcompany
Medium-sizedcompany -0,690 0,362 0,143
Largecompany -1,005(*) 0,413 0,044
Medium-sizedcompany
Smallcompany 0,690 0,362 0,143
Largecompany -0,315 0,469 0,780
Largecompany
Smallcompany 1,005(*) 0,413 0,044
Medium-sizedcompany 0,315 0,469 0,780
Have you evergiven employees aform to sign statingthat they wouldrefrain from visitingoffensive Internetsites during workinghours?
Smallcompany
Medium-sizedcompany -0,812(*) 0,241 0,003
Largecompany -0,163 0,275 0,824
Medium-sizedcompany
Smallcompany 0,812(*) 0,241 0,003
Largecompany 0,649 0,312 0,100
Largecompany
Smallcompany 0,163 0,275 0,824
Medium-sizedcompany -0,649 0,312 0,100
* The average is statistically significant at a risk rate of 0.05.Source: Author’s own source, 2015.
Based on the data from Tables 5 and 6, with the variable "Do you haveInternet filters on the computers - blocked access to illicit, offensiveInternet sites that are not work-related?" we reject the null hypothesis ata negligible level of significance and decide that all the arithmetic meansare not the same. This means that the company size influences whetherthe companies have Internet filters on computers blocking access to
Innovative Issues and Approaches in Social Sciences, Vol. 10, No. 1
| 73
illicit, offensive Internet sites that are not work-related. They have thebiggest impact on Internet filters blocking access to illicit, offensiveInternet sites that are not work-related in large and medium-sizedcompanies.
Based on data from Tables 5 and 6 with the variable: "Have you evertaken Internet privileges from someone because of an abuse of Internetservices in the workplace?" we reject the null hypothesis at a negligiblelevel of significance and decide that all the arithmetic means are not thesame. This means that the company size influences whether thecompany has ever taken away Internet privileges because of the abuseof Internet services in the workplace. They have the biggest impact onInternet privileges because of Internet services abuse in the workplacein small and large companies.
Based on data from Tables 5 and 6 with the variable: "Does yourcompany have special software to monitor all the websites visited andused by employees?" we reject the null hypothesis at a negligible levelof significance and decide that all the arithmetic means are not thesame. This means that the company size influences whether thecompany has special software to monitor all websites visited and usedby employees. They have the greatest impact on software to monitor allwebsites visited and used by employees in medium-sized companies.
Based on data from Tables 5 and 6 with the variable: "Does yourcompany have special software to monitor all the browsing byemployees at a specific time?" we reject the null hypothesis at anegligible level of significance and decide that all the arithmetic meansare not the same. This means that company size influences whether acompany has special software to monitor all websites visited and usedby employees. They have the greatest impact on software to monitor allwebsites visited and used by employees at a specific time in largecompanies.
Based on data from Tables 5 and 6 with the variable: "Do you have, inyour company's computers, a built-in monitoring system for electronicfiles (e.g. to find if employees transfer a file that is not work-related)?" wereject the null hypothesis at a negligible level of significance and decidethat all the arithmetic means are not the same. This means that thecompany size influences whether the company has computers with built-in monitoring of electronic files (e.g. to find if employees have transferreda file that is not work-related). They have the greatest impact on themonitoring of electronic files (e.g. to find out if employees havetransferred files that are not work-related) in large companies.
Innovative Issues and Approaches in Social Sciences, Vol. 10, No. 1
| 74
Based on data from Tables 5 and 6 with the variable: "Have you everrestricted access to Internet services for any employee in yourcompany?" we reject the null hypothesis at a negligible level ofsignificance and decide that all the arithmetic means are not the same.This means that the company size influences whether the employershave ever restricted access to Internet services for some employees intheir companies. They have the greatest impact on restricted access toInternet services in large companies.
Based on data from Tables 5 and 6 with the variable: "Do youremployees accessing to Internet services in the workplace have the username for the computer?" we reject the null hypothesis at a negligiblelevel of significance and decide that all the arithmetic means are not thesame. This means that the company size influences whether theemployees accessing to Internet services in the workplace have a username for the computer. They have the greatest impact on theemployees accessing Internet services in the workplace with a username for the computer in large companies.
Based on data from Tables 5 and 6 with the variable: "Do yourcompany's computers measure the time of starting and stopping usingInternet services?" we reject the null hypothesis at a negligible level ofsignificance and decide that all the arithmetic means are not the same.This means that the company size influences whether the companymeasures time of entry into Internet services and time off from theInternet service providers on the computers. They have the greatestimpact on the measuring the time of starting and stopping using Internetservices in medium-sized and large companies.
Based on data from Tables 5 and 6 with the variable: "Does yourcompany have a written/company's policy/manual stating that internetmay only be used for work-related purposes?" we reject the nullhypothesis at a negligible level of significance and decide that all thearithmetic means are not the same. This means that the company sizeinfluences whether companies have written / political paper / manuals,which state that Internet services are to be used only for officialpurposes. They have the greatest impact on whether companies havewritten / political paper / manuals, which state that Internet services areused only for official purposes in large companies.
Based on data from Tables 5 and 6 with the variable: "Have you evergiven employees a form to sign stating that they would refrain fromvisiting offensive Internet sites during working hours?" we reject the nullhypothesis at a negligible level of significance and decide that all the
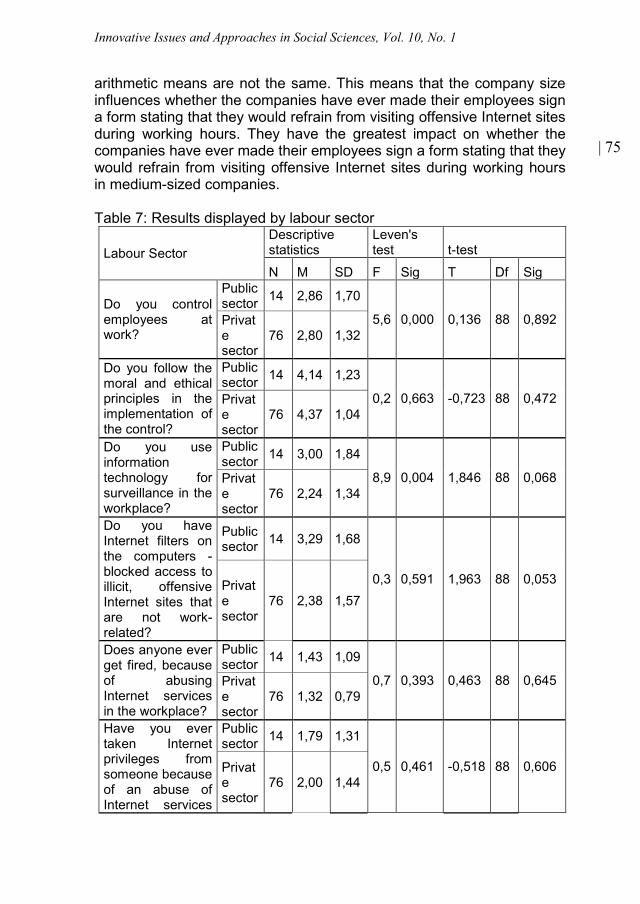
Innovative Issues and Approaches in Social Sciences, Vol. 10, No. 1
| 75
arithmetic means are not the same. This means that the company sizeinfluences whether the companies have ever made their employees signa form stating that they would refrain from visiting offensive Internet sitesduring working hours. They have the greatest impact on whether thecompanies have ever made their employees sign a form stating that theywould refrain from visiting offensive Internet sites during working hoursin medium-sized companies.
Table 7: Results displayed by labour sector
Labour SectorDescriptivestatistics
Leven'stest t-test
N M SD F Sig T Df Sig
Do you controlemployees atwork?
Publicsector 14 2,86 1,70
5,6 0,000 0,136 88 0,892Privatesector
76 2,80 1,32
Do you follow themoral and ethicalprinciples in theimplementation ofthe control?
Publicsector 14 4,14 1,23
0,2 0,663 -0,723 88 0,472Privatesector
76 4,37 1,04
Do you useinformationtechnology forsurveillance in theworkplace?
Publicsector 14 3,00 1,84
8,9 0,004 1,846 88 0,068Privatesector
76 2,24 1,34
Do you haveInternet filters onthe computers -blocked access toillicit, offensiveInternet sites thatare not work-related?
Publicsector 14 3,29 1,68
0,3 0,591 1,963 88 0,053Privatesector
76 2,38 1,57
Does anyone everget fired, becauseof abusingInternet servicesin the workplace?
Publicsector 14 1,43 1,09
0,7 0,393 0,463 88 0,645Privatesector
76 1,32 0,79
Have you evertaken Internetprivileges fromsomeone becauseof an abuse ofInternet services
Publicsector 14 1,79 1,31
0,5 0,461 -0,518 88 0,606Privatesector
76 2,00 1,44
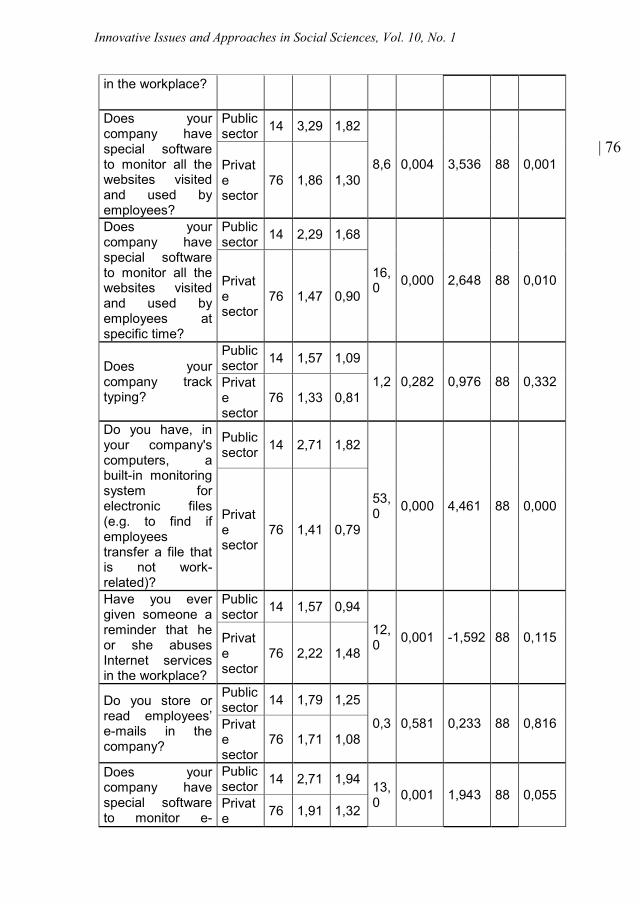
Innovative Issues and Approaches in Social Sciences, Vol. 10, No. 1
| 76
in the workplace?
Does yourcompany havespecial softwareto monitor all thewebsites visitedand used byemployees?
Publicsector 14 3,29 1,82
8,6 0,004 3,536 88 0,001Privatesector
76 1,86 1,30
Does yourcompany havespecial softwareto monitor all thewebsites visitedand used byemployees atspecific time?
Publicsector 14 2,29 1,68
16,0 0,000 2,648 88 0,010Privat
esector
76 1,47 0,90
Does yourcompany tracktyping?
Publicsector 14 1,57 1,09
1,2 0,282 0,976 88 0,332Privatesector
76 1,33 0,81
Do you have, inyour company'scomputers, abuilt-in monitoringsystem forelectronic files(e.g. to find ifemployeestransfer a file thatis not work-related)?
Publicsector 14 2,71 1,82
53,0 0,000 4,461 88 0,000Privat
esector
76 1,41 0,79
Have you evergiven someone areminder that heor she abusesInternet servicesin the workplace?
Publicsector 14 1,57 0,94
12,0 0,001 -1,592 88 0,115Privat
esector
76 2,22 1,48
Do you store orread employees’e-mails in thecompany?
Publicsector 14 1,79 1,25
0,3 0,581 0,233 88 0,816Privatesector
76 1,71 1,08
Does yourcompany havespecial softwareto monitor e-
Publicsector 14 2,71 1,94 13,
0 0,001 1,943 88 0,055Private 76 1,91 1,32
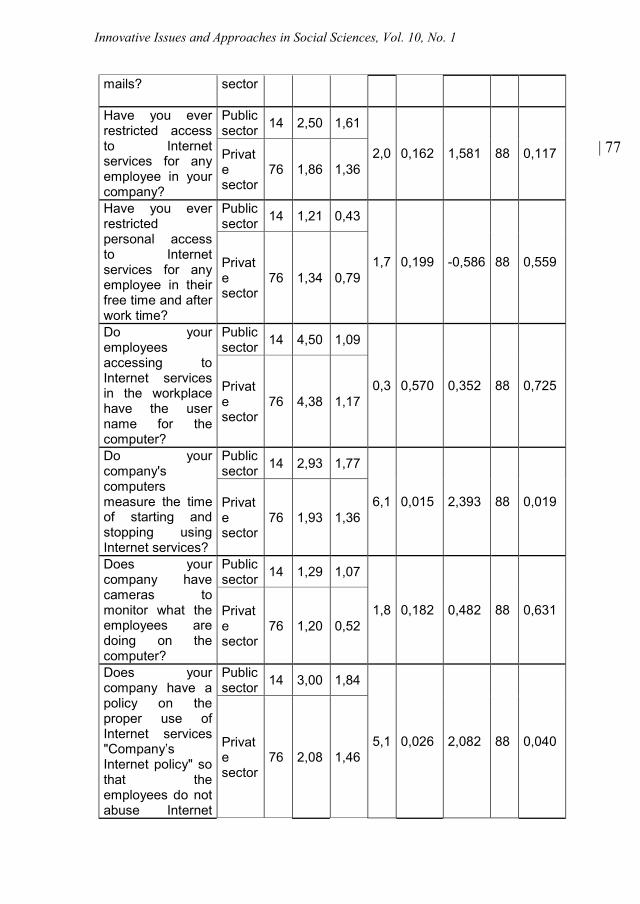
Innovative Issues and Approaches in Social Sciences, Vol. 10, No. 1
| 77
mails? sector
Have you everrestricted accessto Internetservices for anyemployee in yourcompany?
Publicsector 14 2,50 1,61
2,0 0,162 1,581 88 0,117Privatesector
76 1,86 1,36
Have you everrestrictedpersonal accessto Internetservices for anyemployee in theirfree time and afterwork time?
Publicsector 14 1,21 0,43
1,7 0,199 -0,586 88 0,559Privatesector
76 1,34 0,79
Do youremployeesaccessing toInternet servicesin the workplacehave the username for thecomputer?
Publicsector 14 4,50 1,09
0,3 0,570 0,352 88 0,725Privatesector
76 4,38 1,17
Do yourcompany'scomputersmeasure the timeof starting andstopping usingInternet services?
Publicsector 14 2,93 1,77
6,1 0,015 2,393 88 0,019Privatesector
76 1,93 1,36
Does yourcompany havecameras tomonitor what theemployees aredoing on thecomputer?
Publicsector 14 1,29 1,07
1,8 0,182 0,482 88 0,631Privatesector
76 1,20 0,52
Does yourcompany have apolicy on theproper use ofInternet services"Company’sInternet policy" sothat theemployees do notabuse Internet
Publicsector 14 3,00 1,84
5,1 0,026 2,082 88 0,040Privatesector
76 2,08 1,46

Innovative Issues and Approaches in Social Sciences, Vol. 10, No. 1
| 78
services in theworkplace?
Does yourcompany have awritten/company'spolicy/manualstating thatinternet may onlybe used for work-related purposes?
Publicsector 14 2,71 1,68
2,6 0,113 1,703 88 0,092Privatesector
76 1,99 1,43
Have you evergiven employeesa form to signstating that theywould refrain fromvisiting offensiveInternet sitesduring workinghours?
Publicsector 14 1,93 1,39
4,4 0,038 1,704 88 0,092Privatesector
76 1,43 0,91
Do employees getnotice on thecorrect use ofInternet services("Company’sInternet policy")when they log intotheir computer?
Publicsector 14 1,36 0,84
1,7 0,197 -0,828 88 0,410Privatesector
76 1,61 1,06
Does yourcompany organizeseminars ormeetings ofemployees to trainnew and oldemployees onhow to properlyuse Internetservices in theworkplace?
Publicsector 14 2,21 1,72
2,6 0,114 0,337 88 0,737Privatesector
76 2,08 1,31
Legend: N: Number of respondents; M: arithmetic mean; SD: standarddeviation; F: Result of Leven's test; T: Result of t-test; Sig.: Statisticalsignificance; Df: Degrees of freedomSource: Author’s own source, 2015.
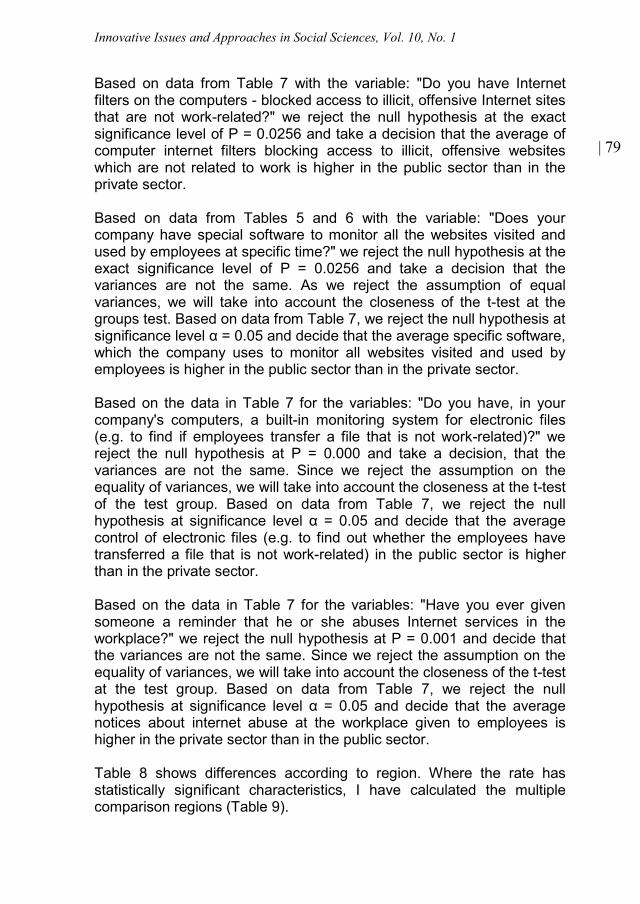
Innovative Issues and Approaches in Social Sciences, Vol. 10, No. 1
| 79
Based on data from Table 7 with the variable: "Do you have Internetfilters on the computers - blocked access to illicit, offensive Internet sitesthat are not work-related?" we reject the null hypothesis at the exactsignificance level of P = 0.0256 and take a decision that the average ofcomputer internet filters blocking access to illicit, offensive websiteswhich are not related to work is higher in the public sector than in theprivate sector.
Based on data from Tables 5 and 6 with the variable: "Does yourcompany have special software to monitor all the websites visited andused by employees at specific time?" we reject the null hypothesis at theexact significance level of P = 0.0256 and take a decision that thevariances are not the same. As we reject the assumption of equalvariances, we will take into account the closeness of the t-test at thegroups test. Based on data from Table 7, we reject the null hypothesis atsignificance level α = 0.05 and decide that the average specific software,which the company uses to monitor all websites visited and used byemployees is higher in the public sector than in the private sector.
Based on the data in Table 7 for the variables: "Do you have, in yourcompany's computers, a built-in monitoring system for electronic files(e.g. to find if employees transfer a file that is not work-related)?" wereject the null hypothesis at P = 0.000 and take a decision, that thevariances are not the same. Since we reject the assumption on theequality of variances, we will take into account the closeness at the t-testof the test group. Based on data from Table 7, we reject the nullhypothesis at significance level α = 0.05 and decide that the averagecontrol of electronic files (e.g. to find out whether the employees havetransferred a file that is not work-related) in the public sector is higherthan in the private sector.
Based on the data in Table 7 for the variables: "Have you ever givensomeone a reminder that he or she abuses Internet services in theworkplace?" we reject the null hypothesis at P = 0.001 and decide thatthe variances are not the same. Since we reject the assumption on theequality of variances, we will take into account the closeness of the t-testat the test group. Based on data from Table 7, we reject the nullhypothesis at significance level α = 0.05 and decide that the averagenotices about internet abuse at the workplace given to employees ishigher in the private sector than in the public sector.
Table 8 shows differences according to region. Where the rate hasstatistically significant characteristics, I have calculated the multiplecomparison regions (Table 9).
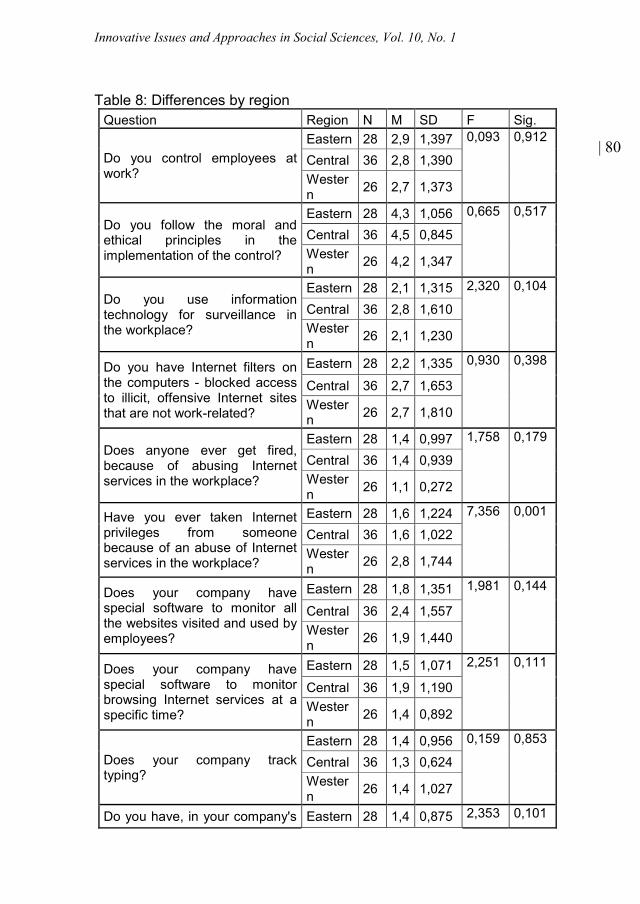
Innovative Issues and Approaches in Social Sciences, Vol. 10, No. 1
| 80
Table 8: Differences by regionQuestion Region N M SD F Sig.
Do you control employees atwork?
Eastern 28 2,9 1,397 0,093 0,912
Central 36 2,8 1,390Western 26 2,7 1,373
Do you follow the moral andethical principles in theimplementation of the control?
Eastern 28 4,3 1,056 0,665 0,517
Central 36 4,5 0,845Western 26 4,2 1,347
Do you use informationtechnology for surveillance inthe workplace?
Eastern 28 2,1 1,315 2,320 0,104
Central 36 2,8 1,610Western 26 2,1 1,230
Do you have Internet filters onthe computers - blocked accessto illicit, offensive Internet sitesthat are not work-related?
Eastern 28 2,2 1,335 0,930 0,398
Central 36 2,7 1,653Western 26 2,7 1,810
Does anyone ever get fired,because of abusing Internetservices in the workplace?
Eastern 28 1,4 0,997 1,758 0,179
Central 36 1,4 0,939Western 26 1,1 0,272
Have you ever taken Internetprivileges from someonebecause of an abuse of Internetservices in the workplace?
Eastern 28 1,6 1,224 7,356 0,001
Central 36 1,6 1,022Western 26 2,8 1,744
Does your company havespecial software to monitor allthe websites visited and used byemployees?
Eastern 28 1,8 1,351 1,981 0,144
Central 36 2,4 1,557Western 26 1,9 1,440
Does your company havespecial software to monitorbrowsing Internet services at aspecific time?
Eastern 28 1,5 1,071 2,251 0,111
Central 36 1,9 1,190Western 26 1,4 0,892
Does your company tracktyping?
Eastern 28 1,4 0,956 0,159 0,853
Central 36 1,3 0,624Western 26 1,4 1,027
Do you have, in your company's Eastern 28 1,4 0,875 2,353 0,101
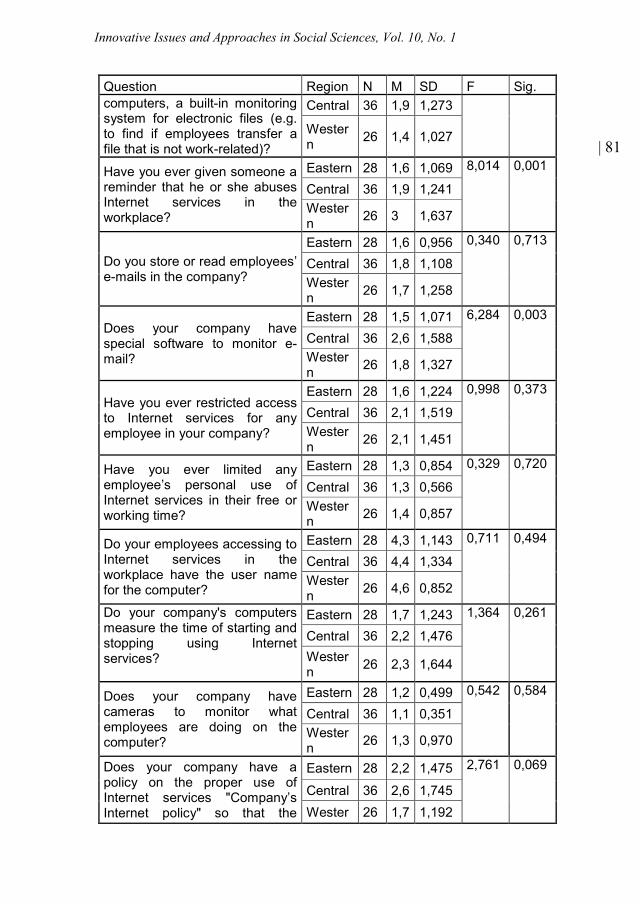
Innovative Issues and Approaches in Social Sciences, Vol. 10, No. 1
| 81
Question Region N M SD F Sig.computers, a built-in monitoringsystem for electronic files (e.g.to find if employees transfer afile that is not work-related)?
Central 36 1,9 1,273
Western 26 1,4 1,027
Have you ever given someone areminder that he or she abusesInternet services in theworkplace?
Eastern 28 1,6 1,069 8,014 0,001
Central 36 1,9 1,241Western 26 3 1,637
Do you store or read employees’e-mails in the company?
Eastern 28 1,6 0,956 0,340 0,713
Central 36 1,8 1,108Western 26 1,7 1,258
Does your company havespecial software to monitor e-mail?
Eastern 28 1,5 1,071 6,284 0,003
Central 36 2,6 1,588Western 26 1,8 1,327
Have you ever restricted accessto Internet services for anyemployee in your company?
Eastern 28 1,6 1,224 0,998 0,373
Central 36 2,1 1,519Western 26 2,1 1,451
Have you ever limited anyemployee’s personal use ofInternet services in their free orworking time?
Eastern 28 1,3 0,854 0,329 0,720
Central 36 1,3 0,566Western 26 1,4 0,857
Do your employees accessing toInternet services in theworkplace have the user namefor the computer?
Eastern 28 4,3 1,143 0,711 0,494
Central 36 4,4 1,334Western 26 4,6 0,852
Do your company's computersmeasure the time of starting andstopping using Internetservices?
Eastern 28 1,7 1,243 1,364 0,261
Central 36 2,2 1,476Western 26 2,3 1,644
Does your company havecameras to monitor whatemployees are doing on thecomputer?
Eastern 28 1,2 0,499 0,542 0,584
Central 36 1,1 0,351Western 26 1,3 0,970
Does your company have apolicy on the proper use ofInternet services "Company’sInternet policy" so that the
Eastern 28 2,2 1,475 2,761 0,069
Central 36 2,6 1,745Wester 26 1,7 1,192
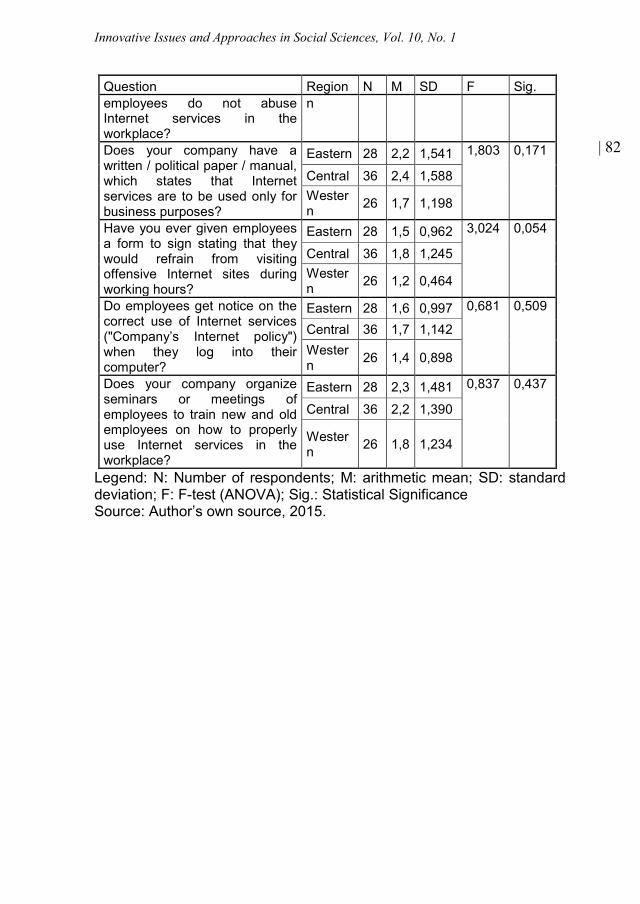
Innovative Issues and Approaches in Social Sciences, Vol. 10, No. 1
| 82
Question Region N M SD F Sig.employees do not abuseInternet services in theworkplace?
n
Does your company have awritten / political paper / manual,which states that Internetservices are to be used only forbusiness purposes?
Eastern 28 2,2 1,541 1,803 0,171
Central 36 2,4 1,588Western 26 1,7 1,198
Have you ever given employeesa form to sign stating that theywould refrain from visitingoffensive Internet sites duringworking hours?
Eastern 28 1,5 0,962 3,024 0,054
Central 36 1,8 1,245Western 26 1,2 0,464
Do employees get notice on thecorrect use of Internet services("Company’s Internet policy")when they log into theircomputer?
Eastern 28 1,6 0,997 0,681 0,509
Central 36 1,7 1,142Western 26 1,4 0,898
Does your company organizeseminars or meetings ofemployees to train new and oldemployees on how to properlyuse Internet services in theworkplace?
Eastern 28 2,3 1,481 0,837 0,437
Central 36 2,2 1,390
Western 26 1,8 1,234
Legend: N: Number of respondents; M: arithmetic mean; SD: standarddeviation; F: F-test (ANOVA); Sig.: Statistical SignificanceSource: Author’s own source, 2015.
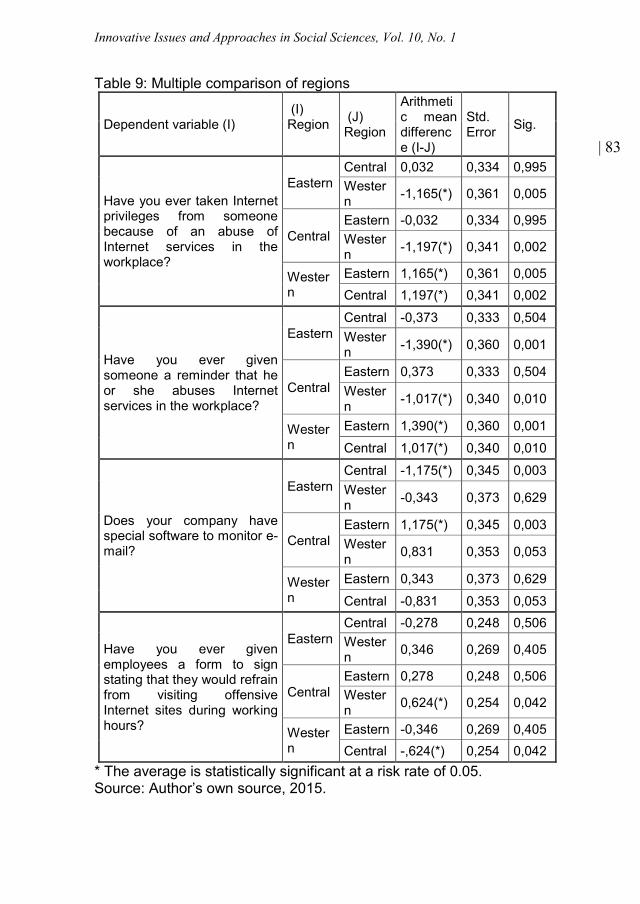
Innovative Issues and Approaches in Social Sciences, Vol. 10, No. 1
| 83
Table 9: Multiple comparison of regions
Dependent variable (I)(I)Region (J)
Region
Arithmetic meandifference (I-J)
Std.Error Sig.
Have you ever taken Internetprivileges from someonebecause of an abuse ofInternet services in theworkplace?
EasternCentral 0,032 0,334 0,995Western -1,165(*) 0,361 0,005
CentralEastern -0,032 0,334 0,995Western -1,197(*) 0,341 0,002
Western
Eastern 1,165(*) 0,361 0,005Central 1,197(*) 0,341 0,002
Have you ever givensomeone a reminder that heor she abuses Internetservices in the workplace?
EasternCentral -0,373 0,333 0,504Western -1,390(*) 0,360 0,001
CentralEastern 0,373 0,333 0,504Western -1,017(*) 0,340 0,010
Western
Eastern 1,390(*) 0,360 0,001
Central 1,017(*) 0,340 0,010
Does your company havespecial software to monitor e-mail?
EasternCentral -1,175(*) 0,345 0,003Western -0,343 0,373 0,629
CentralEastern 1,175(*) 0,345 0,003Western 0,831 0,353 0,053
Western
Eastern 0,343 0,373 0,629
Central -0,831 0,353 0,053
Have you ever givenemployees a form to signstating that they would refrainfrom visiting offensiveInternet sites during workinghours?
EasternCentral -0,278 0,248 0,506Western 0,346 0,269 0,405
CentralEastern 0,278 0,248 0,506Western 0,624(*) 0,254 0,042
Western
Eastern -0,346 0,269 0,405Central -,624(*) 0,254 0,042
* The average is statistically significant at a risk rate of 0.05.Source: Author’s own source, 2015.

Innovative Issues and Approaches in Social Sciences, Vol. 10, No. 1
| 84
Based on data from Tables 5 and 6 with the variable: "Have you evertaken Internet privileges from someone because of an abuse of Internetservices in the workplace?" we reject the null hypothesis at a negligiblelevel of significance and decide that all the arithmetic means are not thesame. This means that region will influence whether someone has takenaway the internet privileges because of the abuse of Internet services inthe workplace. They have the greatest impact on taking Internetprivileges for abusing Internet services in the workplace in the westernregion.
Based on data from Tables 5 and 6 with the variable: "Does yourcompany have special software to monitor e-mail?" we reject the nullhypothesis at a negligible level of significance and decide that all thearithmetic means are not the same. This means that region influenceswhether any one of the employees has ever been given a formal noticeon abusing Internet services in the workplace. They have the greatestimpact on giving the employees formal notices on abusing Internetservices in the workplace in the western region.
Based on data from Tables 5 and 6 with the variable: "Have you evertaken Internet privileges from someone because of an abuse of Internetservices in the workplace?" we reject the null hypothesis at a negligiblelevel of significance and decide that all the arithmetic means are not thesame. This means that region influences whether the company hasspecific software to monitor e-mails. The greatest impact on thecompany having specific software to monitor e-mails is in the centralregion.
8 ConclusionThe rapid development of technology has enabled many new ways ofworking and communication as well as a number of control options,which may result in conflict between employees, employers and thirdparties. Most employers would like to control how employees actuallywork, what they do and how much of their working time is spent on non-work related activities. For this purpose, the employers superviseactivities on company computers, which can even be connected throughvideo surveillance via video cameras. Many companies keep importantdata on business computers, networks and databases. This datarepresents a potential security risk, which is another reason for theprotection and control of communications. At the same time, theemployer must take into account that the employee has a right to privacyeven in the workplace.
Innovative Issues and Approaches in Social Sciences, Vol. 10, No. 1
| 85
The research problem was founded on the supervision of employees inSlovenia and to what extent employers use information technology forthis control and take into account the moral and ethical principles whencarrying out the control. From the research, we can conclude that almosthalf of employers do not supervise employees in the workplace.Employers should monitor employees more in the workplace in order tostop the leakage of sensitive information, stop violations of laws, limitlegal liability, increase productivity in the workplace, prevent economicespionage and unauthorized entry in the company's information systemand protect their network against an overload. Employers should useinformation technology to supervise employees. Employers should tellemployees that supervision is useful for business operations andtherefore also necessary. However, it should be noted that control of theemployees may only be carried out in accordance with the law and theemployees must be informed about it. If these two requirements are notmet, the company’s employees should report the infringements of thecontrol to the Information Commissioner.
Monitoring is essential and always present; it is also understandable andlogical. The control becomes dangerous when someone abuses it. It istherefore particularly important that individuals especially are aware oftheir rights and the possibilities of protection offered to them by law. Oneof their rights is notifying the Information Commissioner. The InformationCommissioner has published the 10 most common violations of thePDPA-I in labour relations:
• Insight into employees’ e-mails and control over the use of theInternet;
• Obtaining employees’ health data;• Improper exercise of sick leave supervision;• Unfounded video surveillance of workspaces;• Employers fail to notify employees in writing of the introduction of
video surveillance;• Employers do not adequately protect the employees’ personal
data records;• Unfounded tracking of the employees with GPS devices, mobile
phones, etc.• Unfounded control of the employees’ telephone calls;• Employers do not allow workers to be aware of their own
personal data;• Excessive collection of employees’ personal data.
Innovative Issues and Approaches in Social Sciences, Vol. 10, No. 1
| 86
ResourcesDrozg, Ingrid (2015): Ali je dovoljeno zaposlene elektorsko nadzirati.
Available at: http://www.racunovodski-servis-zeus.si/aktualne-informacije-in-novice/e-nadzor-zaposleni (20.07.2015)
Evropska konvencija o varstvu človekovih pravic (2015): Available at:http://www.echr.coe.int/Documents/Convention_SLV.pdf (20.07.2015)
Havliček, Mojca (2012): E-pošta in zasebnost na delovnem mestu.Računalniške novice. Available at:http://eudace.eu/knjiznica/clanki/2013021410315019/ (20.07.2015)
Informacijski pooblaščenec (2015): Letno poročilo informacijskegapooblaščenca za leto 2014. Available at:
https://www.ip-rs.si/fileadmin/user_upload/Pdf/porocila/Letno_porocilo_IP_2014.pdf(20.07.2015)
Informacijski pooblaščenec (2015): Varstvo osebnih podatkov. Availableat: https://www.ip-rs.si/pogosta-vprasanja/varstvo-osebnih-podatkov/#c302 (20.07.2015)
Informacijski pooblaščenec (2015): Zlata pravila zasebnosti nadelovnem mestu. Available at: https://www.ip-rs.si/fileadmin/user_upload/Pdf/brosure/Zasebnost_na_delovnem_mestu.pdf (20.07.2015)
Kazenski zakonik. Uradni list Republike Slovenije, št. 55/2008.Zakon o delovnih razmerjih. Uradni list Republike Slovenije, št. 21/2013.Zakon o elektronskih komunikacijah. Uradni list Republike Slovenije, št.
109/2012.Zakon o javnih uslužbencih. Uradni list Republike Slovenije, št. 63/2007.Zakon o varstvu osebnih podatkov. Uradni list Republike Slovenije, št.
94/2007.
Innovative Issues and Approaches in Social Sciences, Vol. 10, No. 1
| 87
CULTURAL CAPITAL AND SCHOOL SUCCESS: ASTUDY ON STUDENTS OF CLASS-XI IN SYLHET
CITY CORPORATION, BANGLADESH
Al Amin Rabby1, Mohammed Anwar Hossain2, Md.Abdul Ghani3
AbstractThis research aims to investigate how the aspects of cultural capitalcause educational success of college students coming from differentsocioeconomic backgrounds in Sylhet City, Bangladesh. It employssample survey of 210 Higher Secondary level students from threeeducational institutions of Sylhet City to collect data. Findings report thatcultural capital has no significant relation with students’ educationalsuccess. Family economic condition and parental education put greaterinfluence on students’ educational improvement. It is therefore essentialto note that family income is more important than cultural capital toachieve a good result. The findings of this research contrast withBourdieu’s study in France as cultural capital marginally influenceseducational success of the students. A number of students receiveproper caring from schools and families that advance them at achievingmore rewards which tend to perpetuate social inequality in Bangladesh.Higher family income and parental education of higher class furthercontribute to creating uneven success among the students.
Keywords: Cultural capital, Bangladesh, education, Bourdieu, school-success
DOI: http://dx.doi.org/10.12959/issn.1855-0541.IIASS-2017-no1-art4
1. IntroductionAccess to education is a universal basic human right whichencompasses the very basis of decent living. In modern unequal society,life chances of individuals mostly depend on divergence in earnings,assets, schooling and authority (Simkus and Andrka, 1982). In a lessdeveloped country such as Bangladesh, social position depends onindividual’s education and income opportunities that eventually bringdesirable jobs and standard of living (Kabir, 2014; Alam, 1997). In recent
1Assistant Professor, Department of Sociology, Shahjalal University of Science and Technology, Sylhet-3114, Bangladesh
2Associate Professor, Department of Sociology, Shahjalal University of Science and Technology, Sylhet-3114, Bangladesh
3Professor, Department of Sociology, Shahjalal University of Science and Technology, Sylhet-3114, Bangladesh

Innovative Issues and Approaches in Social Sciences, Vol. 10, No. 1
| 88
time, educational outcome of the students in both public and privateinstitutions varies from socio-economic and educational background oftheir parents (Ali et.al, 1999; Khandker and Samad, 1995). Individual’squality, attitudes, values, behavior and social goal might have influenceon school success. Educational success is related to students’ grade,academic learning and continuing enrolments (Portes, 1998). This studywill seek to examine the cultural factors that contribute to student’sachievements in the schools of Bangladesh and thus legitimatingeducational inequality.
Research about family background and schools effect as achievementscomes into spotlight after the seminal work of Coleman in 1966 thathighlights family environment than school factors for children’s successin USA (Coleman, Campbell, & Hobson, 1966). For Hyneman (1976),family factors play less significant role for educational success of thestudents in the developing countries. Later, Baker et al. (1999) show thatfamily factors such as parental education, family income and wealth aremore important in explaining educational success instead of schoolfactors (Buchmann & Hannum, 2001). For Bourdieu (1977) and Jenkins(1992), parents prepare children with keenness, efficiency, educationand opportunities that might pose a potential to perform better at schoolsand to achieve a higher status in society (cited in Smith, 2001). Culturalcapital can create the necessary condition to obtain diverse academicsuccess and economic benefits. Furthermore, cultural capital theoriesinform that students must possess the ability to understand the dominantculture to attain more from educational institutions. A better learning ofthe key aspects of a culture like art and presentation at home givesstudents the chances to improve performance at school. Also,transmitted cultural capitals from bourgeois families are highly cherishedin schools (Bourdieu, 1996). Schools foster the mainstream culture andrecognize students endowed with cultural capital as gifted ones thanthose who lack educational assistance at home (DiMaggio, 1982; Lynchand Lodge, 2002a). Generally, the social position of a family shapes thepossibility of success in schools (Bourdieu, 1996; Bourdieu, 1977). It istherefore important to change the notion that schools may not assureacademic success and higher social expectations unless students arefluent to work out the aspects of culture (Bourdieu, 1996).
Moreover, education in Bangladesh has three major stages- primary,secondary and higher. The primary education is a five-year cycle. Theentry age in primary education is five and this is free and compulsory forall (MOE, 2014). Secondary level is also for five years and then highersecondary level is for two years. After higher secondary certificateexamination, students get entrance for the university education.
Innovative Issues and Approaches in Social Sciences, Vol. 10, No. 1
| 89
Simultaneously, Madrasa education (religious) and British curriculumbased English medium education are recognized by the government aswell (MOE, 2014). Although there is a universal and mandatory primaryeducation, secondary to university education is not free of charge (WB,2013). Children with higher grades in their Secondary School Certificate(SSC) get admitted to well-recognized both government and privatecolleges for their Higher Secondary education. Variations in SSC gradesnegatively influence the chance of getting admission in good institutions(WB, 2013).
Upon this analysis, this research intends to investigate how the aspectsof cultural capital cause educational success of college students comingfrom different socioeconomic backgrounds in Sylhet City, Bangladesh.Additionally, the study will try to explain whether the education systemreproduces social inequality in terms of occupational and economicopportunities in Bangladesh.
2. Literature Review2.1 The theoretical relationship between cultural capital and schoolsuccessCultural Capital has gained widespread popularity since Pierre Bourdieuarticulated it in his influential work Cultural Reproduction and SocialReproduction (1973). Subsequently, he elaborates the theory in otherpioneering publications Outline of a theory of Practice (1977), The StateNobility (1996) and Distinctions (1984). Bourdieu attempts to explaindifferences in educational outcomes in France during the 1960s.According to Bourdieu (1977), children gifted with cultural capital interms of parental tutoring, schooling, economic condition and otherbenefits are likely to enhance academic success and social status. Healso considers cultural capital as the vehicle through which backgroundinequalities are transformed into differential academic rewards which inturn lead to unequal social and economic advancement. It is argued thatfamily transmits cultural capital to future generations so that they acquireacademic excellence. Similarly, class position of the family greatlyinfluences educational achievements which, in turn, perpetuate andlegitimate domination of the upper class students over occupation andresources (Bourdieu, 1996:5). For Katsillis and Rubinson (1990), familybackground directly affects cultural capital. It means that highersocioeconomic status of a family directly results in greater amount ofcultural capital that improves the possibility of children’s school success.Put simply, economic capital can be reducible to cultural capital such asthe ability to understand and conduct practices (Bourdieu, 1977).However, family setting indirectly underpins inequality by providing thestudents with congenial ambience for achieving academic rewards from
Innovative Issues and Approaches in Social Sciences, Vol. 10, No. 1
| 90
parental cultural capital (Lynch and Lodge, 2002a and Reay, 2010). Inmany cases, parents play the key role to children’s cultural participationthrough paying for lessons, providing transportation to and from theclass or as Bourdieu (1984) argued by demonstrating an interest inculture to the children at home (Dumais, 2002). Parental resources andfamily support are important factors to influence students’ success(Kabir, 2014 and Lynch and Lodge, 2002b). For instance, the students ofmarginal families perform worse in schools due to lack of cultural capitaland social support (Darmody, Byrne and McGinnity, 2012; Devine,2009). Additionally, schooling can transfer the effect of father’s status onson’s status as well as the effect of educational attainment onoccupational status and income. But academic ability strongly affectseducational achievement and occupational status through fosteringaspiration regardless of socioeconomic condition (Hallinan, 1988 andDiMaggio, 1982).
2.2 Empirical outcomes of cultural capital and school successFor Jenkins (1992), cultural capital refers to individuals’ educationalqualification and ability to carry out different tasks. DiMaggio quantifiescultural capital by an index with self-reported involvement of the pupils inart, music and literature (DiMaggio, 1982). For measuring attitudes ofthe students, he rates their interest in specific artistic activities andoccupations. Afterwards, John and Richard (1990) apply DiMaggio’sdefinition to measure cultural capital with a set of variables includinghigh culture and other activities as to whether cultural capital variablesshow consistent results together. High culture activities includeattendance at the theatre and lectures and visits to museums andgalleries. These items have been considered the basic indicators ofcultural capital in France and the United States and appear to hold inGreece as well (John and Richard, 1990).
Furthermore, the ability to use information technology, after Emmison &Frow (1998), can be recognized a form of cultural capital. The authorsstate that “a familiarity with, and a positive disposition towards the use ofbourgeoisie technologies of the information age can be seen as anadditional form of cultural capital bestowing advantage on those familiesthat possess them” (Emmison & Frow, 1998, 41-43). For Acevedo andGladys Lopez (2002), family cultural capital consists in parentaleducational qualification, number of books in the family, number ofnewspaper read, languages used in family and the like. De Graff et al(2000) identify beaux arts participation and reading habits as thesources of parental cultural capital. In addition, cultural capital ofstudents, according to Dunuls (2002), depends on the number ofacademic activities they participate in.
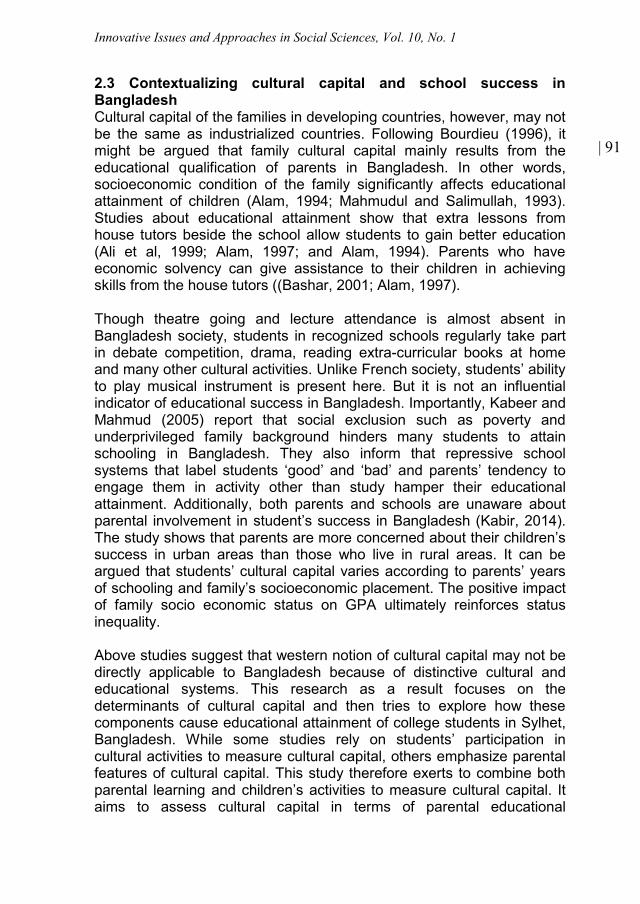
Innovative Issues and Approaches in Social Sciences, Vol. 10, No. 1
| 91
2.3 Contextualizing cultural capital and school success inBangladeshCultural capital of the families in developing countries, however, may notbe the same as industrialized countries. Following Bourdieu (1996), itmight be argued that family cultural capital mainly results from theeducational qualification of parents in Bangladesh. In other words,socioeconomic condition of the family significantly affects educationalattainment of children (Alam, 1994; Mahmudul and Salimullah, 1993).Studies about educational attainment show that extra lessons fromhouse tutors beside the school allow students to gain better education(Ali et al, 1999; Alam, 1997; and Alam, 1994). Parents who haveeconomic solvency can give assistance to their children in achievingskills from the house tutors ((Bashar, 2001; Alam, 1997).
Though theatre going and lecture attendance is almost absent inBangladesh society, students in recognized schools regularly take partin debate competition, drama, reading extra-curricular books at homeand many other cultural activities. Unlike French society, students’ abilityto play musical instrument is present here. But it is not an influentialindicator of educational success in Bangladesh. Importantly, Kabeer andMahmud (2005) report that social exclusion such as poverty andunderprivileged family background hinders many students to attainschooling in Bangladesh. They also inform that repressive schoolsystems that label students ‘good’ and ‘bad’ and parents’ tendency toengage them in activity other than study hamper their educationalattainment. Additionally, both parents and schools are unaware aboutparental involvement in student’s success in Bangladesh (Kabir, 2014).The study shows that parents are more concerned about their children’ssuccess in urban areas than those who live in rural areas. It can beargued that students’ cultural capital varies according to parents’ yearsof schooling and family’s socioeconomic placement. The positive impactof family socio economic status on GPA ultimately reinforces statusinequality.
Above studies suggest that western notion of cultural capital may not bedirectly applicable to Bangladesh because of distinctive cultural andeducational systems. This research as a result focuses on thedeterminants of cultural capital and then tries to explore how thesecomponents cause educational attainment of college students in Sylhet,Bangladesh. While some studies rely on students’ participation incultural activities to measure cultural capital, others emphasize parentalfeatures of cultural capital. This study therefore exerts to combine bothparental learning and children’s activities to measure cultural capital. Itaims to assess cultural capital in terms of parental educational
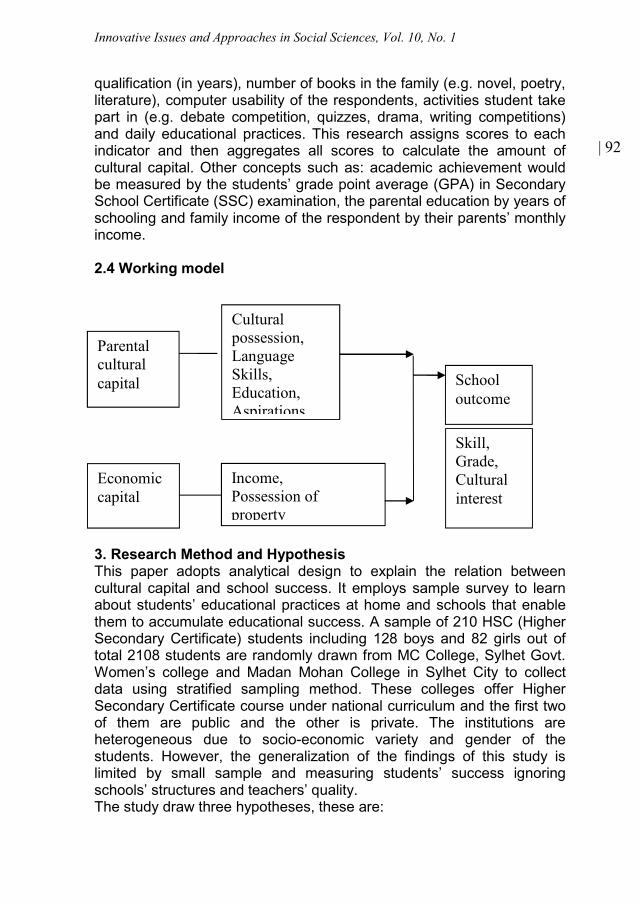
Innovative Issues and Approaches in Social Sciences, Vol. 10, No. 1
| 92
qualification (in years), number of books in the family (e.g. novel, poetry,literature), computer usability of the respondents, activities student takepart in (e.g. debate competition, quizzes, drama, writing competitions)and daily educational practices. This research assigns scores to eachindicator and then aggregates all scores to calculate the amount ofcultural capital. Other concepts such as: academic achievement wouldbe measured by the students’ grade point average (GPA) in SecondarySchool Certificate (SSC) examination, the parental education by years ofschooling and family income of the respondent by their parents’ monthlyincome.
2.4 Working model
3. Research Method and HypothesisThis paper adopts analytical design to explain the relation betweencultural capital and school success. It employs sample survey to learnabout students’ educational practices at home and schools that enablethem to accumulate educational success. A sample of 210 HSC (HigherSecondary Certificate) students including 128 boys and 82 girls out oftotal 2108 students are randomly drawn from MC College, Sylhet Govt.Women’s college and Madan Mohan College in Sylhet City to collectdata using stratified sampling method. These colleges offer HigherSecondary Certificate course under national curriculum and the first twoof them are public and the other is private. The institutions areheterogeneous due to socio-economic variety and gender of thestudents. However, the generalization of the findings of this study islimited by small sample and measuring students’ success ignoringschools’ structures and teachers’ quality.The study draw three hypotheses, these are:
Culturalpossession,LanguageSkills,Education,Aspirations,
Parentalculturalcapital School
outcome
Skill,Grade,Culturalinterest
Economiccapital
Income,Possession ofproperty
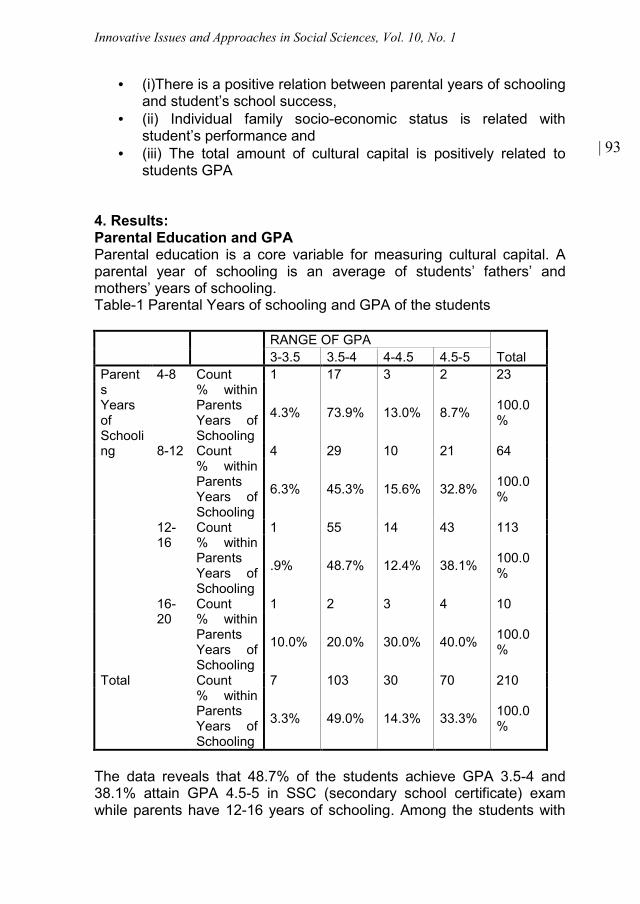
Innovative Issues and Approaches in Social Sciences, Vol. 10, No. 1
| 93
• (i)There is a positive relation between parental years of schoolingand student’s school success,
• (ii) Individual family socio-economic status is related withstudent’s performance and
• (iii) The total amount of cultural capital is positively related tostudents GPA
4. Results:Parental Education and GPAParental education is a core variable for measuring cultural capital. Aparental year of schooling is an average of students’ fathers’ andmothers’ years of schooling.Table-1 Parental Years of schooling and GPA of the students
RANGE OF GPATotal3-3.5 3.5-4 4-4.5 4.5-5
ParentsYearsofSchooling
4-8 Count 1 17 3 2 23% withinParentsYears ofSchooling
4.3% 73.9% 13.0% 8.7% 100.0%
8-12 Count 4 29 10 21 64% withinParentsYears ofSchooling
6.3% 45.3% 15.6% 32.8% 100.0%
12-16
Count 1 55 14 43 113% withinParentsYears ofSchooling
.9% 48.7% 12.4% 38.1% 100.0%
16-20
Count 1 2 3 4 10% withinParentsYears ofSchooling
10.0% 20.0% 30.0% 40.0% 100.0%
Total Count 7 103 30 70 210% withinParentsYears ofSchooling
3.3% 49.0% 14.3% 33.3% 100.0%
The data reveals that 48.7% of the students achieve GPA 3.5-4 and38.1% attain GPA 4.5-5 in SSC (secondary school certificate) examwhile parents have 12-16 years of schooling. Among the students with
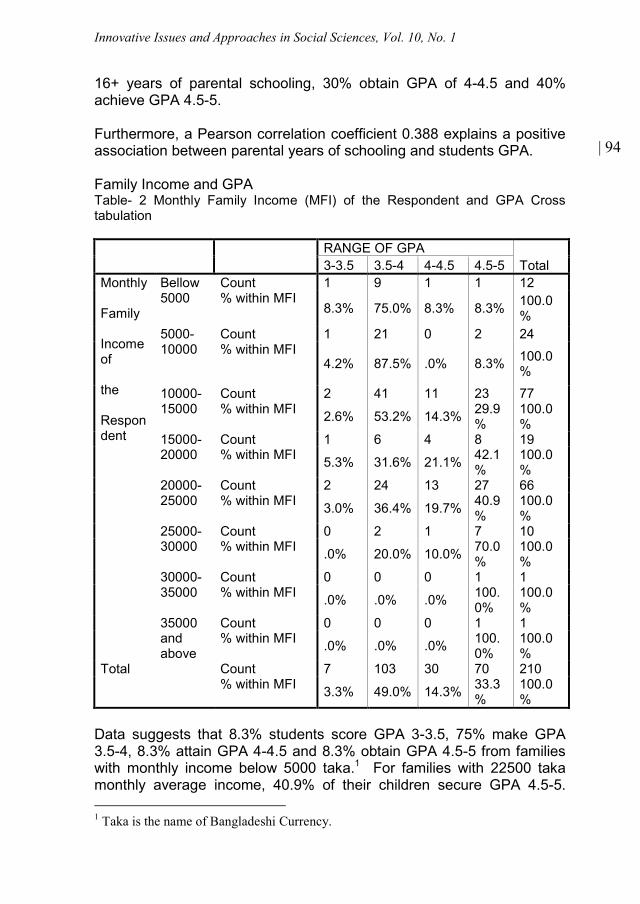
Innovative Issues and Approaches in Social Sciences, Vol. 10, No. 1
| 94
16+ years of parental schooling, 30% obtain GPA of 4-4.5 and 40%achieve GPA 4.5-5.
Furthermore, a Pearson correlation coefficient 0.388 explains a positiveassociation between parental years of schooling and students GPA.
Family Income and GPATable- 2 Monthly Family Income (MFI) of the Respondent and GPA Crosstabulation
RANGE OF GPATotal3-3.5 3.5-4 4-4.5 4.5-5
Monthly
Family
Incomeof
the
Respondent
Bellow5000
Count 1 9 1 1 12% within MFI
8.3% 75.0% 8.3% 8.3% 100.0%
5000-10000
Count 1 21 0 2 24% within MFI
4.2% 87.5% .0% 8.3% 100.0%
10000-15000
Count 2 41 11 23 77% within MFI 2.6% 53.2% 14.3% 29.9
%100.0%
15000-20000
Count 1 6 4 8 19% within MFI 5.3% 31.6% 21.1% 42.1
%100.0%
20000-25000
Count 2 24 13 27 66% within MFI 3.0% 36.4% 19.7% 40.9
%100.0%
25000-30000
Count 0 2 1 7 10% within MFI .0% 20.0% 10.0% 70.0
%100.0%
30000-35000
Count 0 0 0 1 1% within MFI .0% .0% .0% 100.
0%100.0%
35000andabove
Count 0 0 0 1 1% within MFI .0% .0% .0% 100.
0%100.0%
Total Count 7 103 30 70 210% within MFI 3.3% 49.0% 14.3% 33.3
%100.0%
Data suggests that 8.3% students score GPA 3-3.5, 75% make GPA3.5-4, 8.3% attain GPA 4-4.5 and 8.3% obtain GPA 4.5-5 from familieswith monthly income below 5000 taka.1 For families with 22500 takamonthly average income, 40.9% of their children secure GPA 4.5-5.
1 Taka is the name of Bangladeshi Currency.
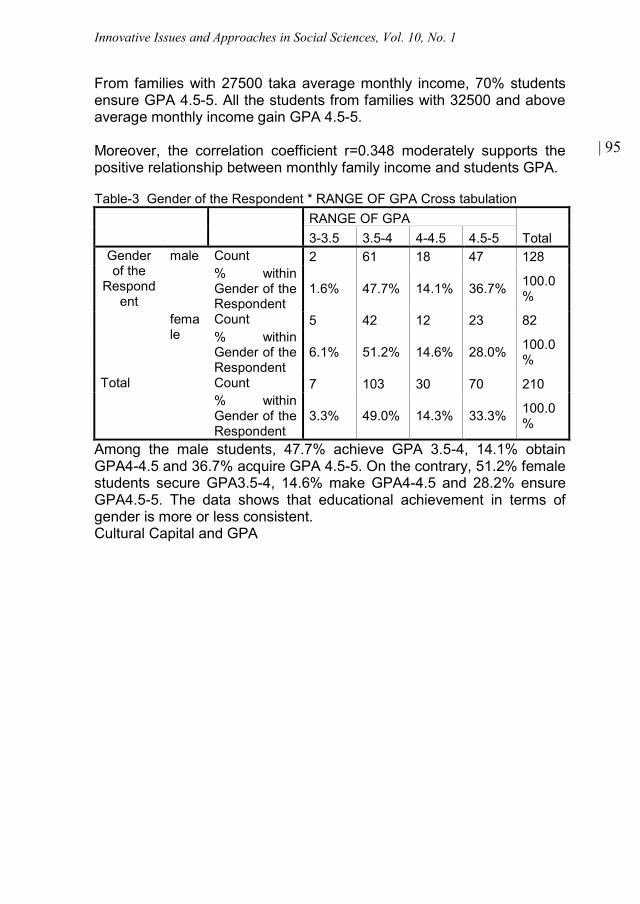
Innovative Issues and Approaches in Social Sciences, Vol. 10, No. 1
| 95
From families with 27500 taka average monthly income, 70% studentsensure GPA 4.5-5. All the students from families with 32500 and aboveaverage monthly income gain GPA 4.5-5.
Moreover, the correlation coefficient r=0.348 moderately supports thepositive relationship between monthly family income and students GPA.
Table-3 Gender of the Respondent * RANGE OF GPA Cross tabulationRANGE OF GPA
Total3-3.5 3.5-4 4-4.5 4.5-5Genderof the
Respondent
male Count 2 61 18 47 128% withinGender of theRespondent
1.6% 47.7% 14.1% 36.7% 100.0%
female
Count 5 42 12 23 82% withinGender of theRespondent
6.1% 51.2% 14.6% 28.0% 100.0%
Total Count 7 103 30 70 210% withinGender of theRespondent
3.3% 49.0% 14.3% 33.3% 100.0%
Among the male students, 47.7% achieve GPA 3.5-4, 14.1% obtainGPA4-4.5 and 36.7% acquire GPA 4.5-5. On the contrary, 51.2% femalestudents secure GPA3.5-4, 14.6% make GPA4-4.5 and 28.2% ensureGPA4.5-5. The data shows that educational achievement in terms ofgender is more or less consistent.Cultural Capital and GPA
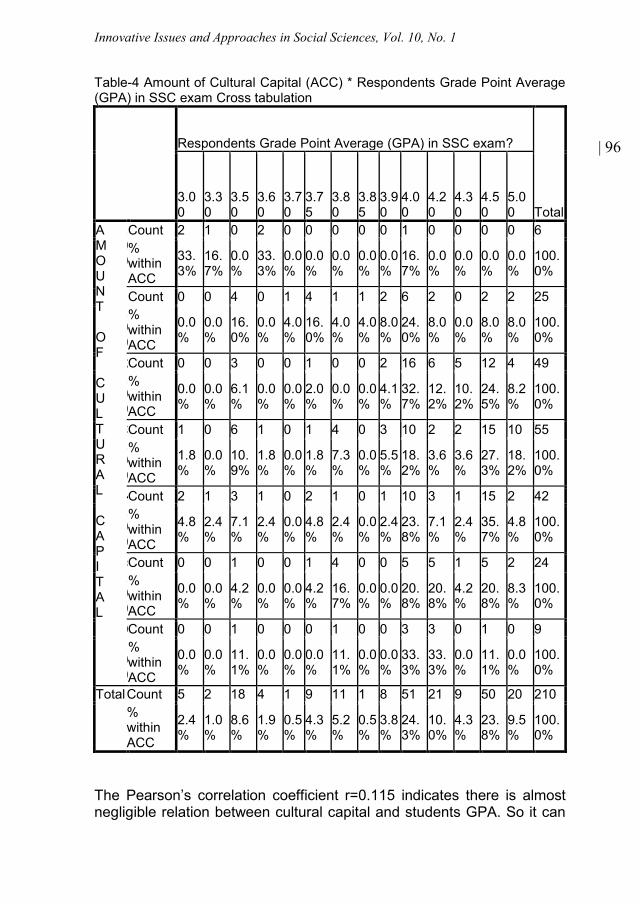
Innovative Issues and Approaches in Social Sciences, Vol. 10, No. 1
| 96
Table-4 Amount of Cultural Capital (ACC) * Respondents Grade Point Average(GPA) in SSC exam Cross tabulation
Respondents Grade Point Average (GPA) in SSC exam?
Total3.00
3.30
3.50
3.60
3.70
3.75
3.80
3.85
3.90
4.00
4.20
4.30
4.50
5.00
AMOUNT
OF
CULTURAL
CAPITAL
.00
Count 2 1 0 2 0 0 0 0 0 1 0 0 0 0 6%withinACC
33.3%
16.7%
0.0%
33.3%
0.0%
0.0%
0.0%
0.0%
0.0%
16.7%
0.0%
0.0%
0.0%
0.0%
100.0%
1.00
Count 0 0 4 0 1 4 1 1 2 6 2 0 2 2 25%withinACC
0.0%
0.0%
16.0%
0.0%
4.0%
16.0%
4.0%
4.0%
8.0%
24.0%
8.0%
0.0%
8.0%
8.0%
100.0%
2.00
Count 0 0 3 0 0 1 0 0 2 16 6 5 12 4 49%withinACC
0.0%
0.0%
6.1%
0.0%
0.0%
2.0%
0.0%
0.0%
4.1%
32.7%
12.2%
10.2%
24.5%
8.2%
100.0%
3.00
Count 1 0 6 1 0 1 4 0 3 10 2 2 15 10 55%withinACC
1.8%
0.0%
10.9%
1.8%
0.0%
1.8%
7.3%
0.0%
5.5%
18.2%
3.6%
3.6%
27.3%
18.2%
100.0%
4.00
Count 2 1 3 1 0 2 1 0 1 10 3 1 15 2 42%withinACC
4.8%
2.4%
7.1%
2.4%
0.0%
4.8%
2.4%
0.0%
2.4%
23.8%
7.1%
2.4%
35.7%
4.8%
100.0%
5.00
Count 0 0 1 0 0 1 4 0 0 5 5 1 5 2 24%withinACC
0.0%
0.0%
4.2%
0.0%
0.0%
4.2%
16.7%
0.0%
0.0%
20.8%
20.8%
4.2%
20.8%
8.3%
100.0%
6.00
Count 0 0 1 0 0 0 1 0 0 3 3 0 1 0 9%withinACC
0.0%
0.0%
11.1%
0.0%
0.0%
0.0%
11.1%
0.0%
0.0%
33.3%
33.3%
0.0%
11.1%
0.0%
100.0%
TotalCount 5 2 18 4 1 9 11 1 8 51 21 9 50 20 210%withinACC
2.4%
1.0%
8.6%
1.9%
0.5%
4.3%
5.2%
0.5%
3.8%
24.3%
10.0%
4.3%
23.8%
9.5%
100.0%
The Pearson’s correlation coefficient r=0.115 indicates there is almostnegligible relation between cultural capital and students GPA. So it can
Innovative Issues and Approaches in Social Sciences, Vol. 10, No. 1
| 97
be said that cultural capital is not a significant factor to influence theeducational achievement of the student. The result provokes moreanalyses to find out influential factors responsible for students success.
4.1 Indexing Cultural CapitalThis study constructs a composite six-point index to compute culturalcapital based on the following activities:
• Borrowing book from library• Taking musical or art courses outside class• Visiting museum• Attending concert• participating in schools annual program and• Computer usability of the respondents.
The reliability coefficient of the scale alpha (α) = 0.72. The total value ofthe index ranges from 0 to 6 in which higher values suggest highercultural capital and zero for little or no cultural capital. For six indicators1
of the index, each question sets yes=1 and no=0; thus the total culturalcapital is computed by adding all the scores achieved by an individualstudent. The average amount of cultural capital is 2.76, which is very lowwhereas only 3.7 percent students have highest amount of culturalcapital. More than 64 percent students’ cultural capital score is 3 or lessthan that score. This reports that the high culture indicators are notconsistent with the students’ cultural capital in the context of Sylhet city.
4.2 Analysis of the Multiple Regressions: This model uses the followingindependent variables as predicators of the dependent variable theGrade point average (GPA) of the students.
Monthly family income of the respondents (X1)Parents years of schooling(X2)Cultural capital(X3).
1Six questions for measuring cultural capital:a. Do you borrow books from the public library?b. Do you take part in musical or art courses outside classes?c. Do you visit museums?d. Do you attend concerts?e. Do you participate in school’s annual programs? andf. Can you use computer?
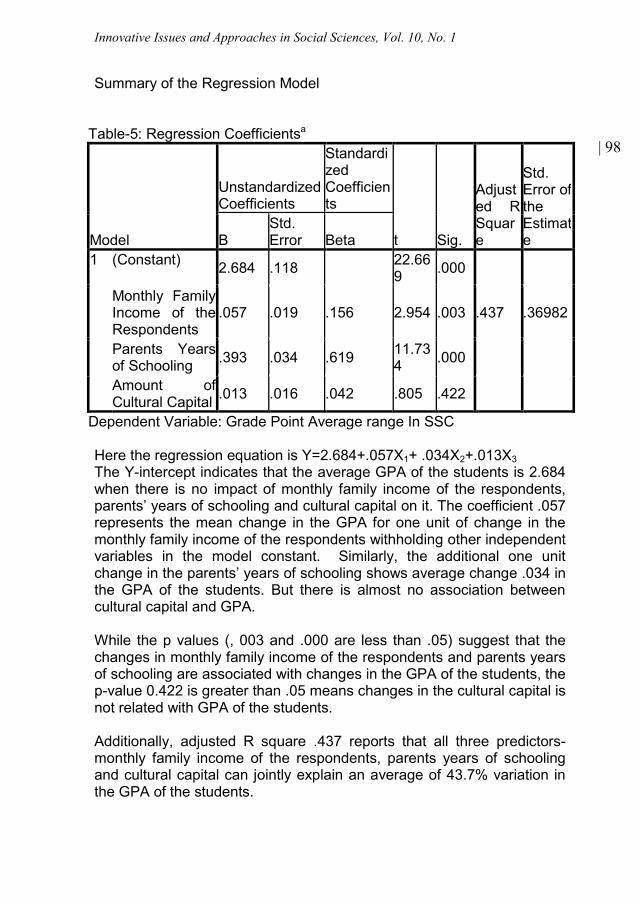
Innovative Issues and Approaches in Social Sciences, Vol. 10, No. 1
| 98
Summary of the Regression Model
Table-5: Regression Coefficientsa
Model
UnstandardizedCoefficients
StandardizedCoefficients
t Sig.
Adjusted RSquare
Std.Error oftheEstimateB
Std.Error Beta
1 (Constant) 2.684 .118 22.669 .000
Monthly FamilyIncome of theRespondents
.057 .019 .156 2.954 .003 .437 .36982
Parents Yearsof Schooling .393 .034 .619 11.73
4 .000
Amount ofCultural Capital .013 .016 .042 .805 .422
Dependent Variable: Grade Point Average range In SSC
Here the regression equation is Y=2.684+.057X1+ .034X2+.013X3The Y-intercept indicates that the average GPA of the students is 2.684when there is no impact of monthly family income of the respondents,parents’ years of schooling and cultural capital on it. The coefficient .057represents the mean change in the GPA for one unit of change in themonthly family income of the respondents withholding other independentvariables in the model constant. Similarly, the additional one unitchange in the parents’ years of schooling shows average change .034 inthe GPA of the students. But there is almost no association betweencultural capital and GPA.
While the p values (, 003 and .000 are less than .05) suggest that thechanges in monthly family income of the respondents and parents yearsof schooling are associated with changes in the GPA of the students, thep-value 0.422 is greater than .05 means changes in the cultural capital isnot related with GPA of the students.
Additionally, adjusted R square .437 reports that all three predictors-monthly family income of the respondents, parents years of schoolingand cultural capital can jointly explain an average of 43.7% variation inthe GPA of the students.
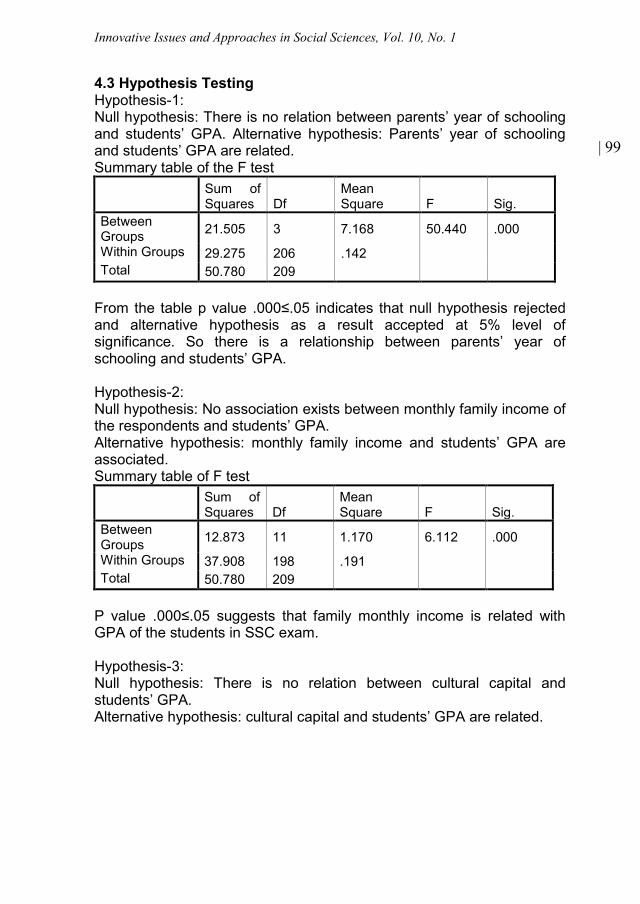
Innovative Issues and Approaches in Social Sciences, Vol. 10, No. 1
| 99
4.3 Hypothesis TestingHypothesis-1:Null hypothesis: There is no relation between parents’ year of schoolingand students’ GPA. Alternative hypothesis: Parents’ year of schoolingand students’ GPA are related.Summary table of the F test
Sum ofSquares Df
MeanSquare F Sig.
BetweenGroups 21.505 3 7.168 50.440 .000
Within Groups 29.275 206 .142Total 50.780 209
From the table p value .000≤.05 indicates that null hypothesis rejectedand alternative hypothesis as a result accepted at 5% level ofsignificance. So there is a relationship between parents’ year ofschooling and students’ GPA.
Hypothesis-2:Null hypothesis: No association exists between monthly family income ofthe respondents and students’ GPA.Alternative hypothesis: monthly family income and students’ GPA areassociated.Summary table of F test
Sum ofSquares Df
MeanSquare F Sig.
BetweenGroups 12.873 11 1.170 6.112 .000
Within Groups 37.908 198 .191Total 50.780 209
P value .000≤.05 suggests that family monthly income is related withGPA of the students in SSC exam.
Hypothesis-3:Null hypothesis: There is no relation between cultural capital andstudents’ GPA.Alternative hypothesis: cultural capital and students’ GPA are related.
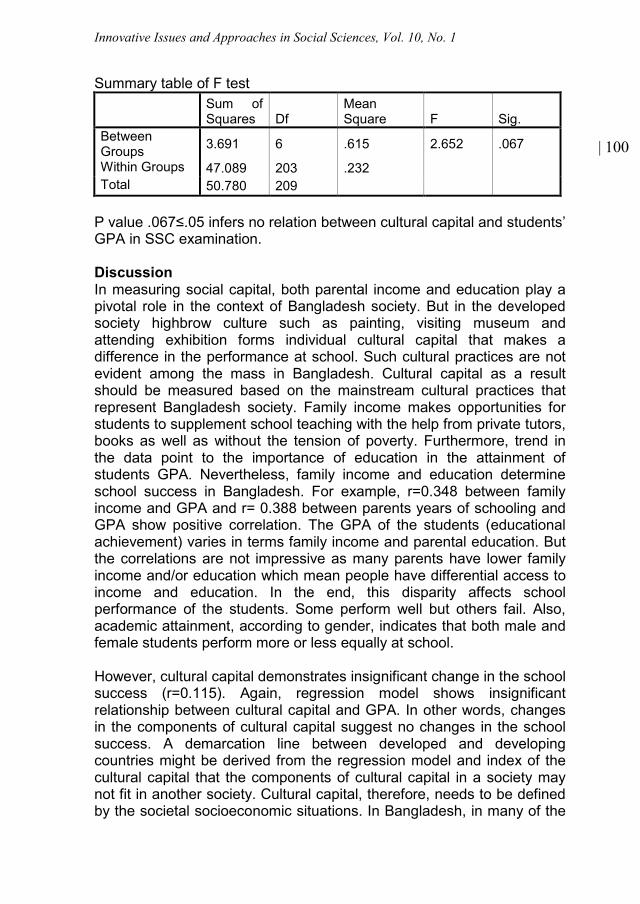
Innovative Issues and Approaches in Social Sciences, Vol. 10, No. 1
| 100
Summary table of F testSum ofSquares Df
MeanSquare F Sig.
BetweenGroups 3.691 6 .615 2.652 .067
Within Groups 47.089 203 .232Total 50.780 209
P value .067≤.05 infers no relation between cultural capital and students’GPA in SSC examination.
DiscussionIn measuring social capital, both parental income and education play apivotal role in the context of Bangladesh society. But in the developedsociety highbrow culture such as painting, visiting museum andattending exhibition forms individual cultural capital that makes adifference in the performance at school. Such cultural practices are notevident among the mass in Bangladesh. Cultural capital as a resultshould be measured based on the mainstream cultural practices thatrepresent Bangladesh society. Family income makes opportunities forstudents to supplement school teaching with the help from private tutors,books as well as without the tension of poverty. Furthermore, trend inthe data point to the importance of education in the attainment ofstudents GPA. Nevertheless, family income and education determineschool success in Bangladesh. For example, r=0.348 between familyincome and GPA and r= 0.388 between parents years of schooling andGPA show positive correlation. The GPA of the students (educationalachievement) varies in terms family income and parental education. Butthe correlations are not impressive as many parents have lower familyincome and/or education which mean people have differential access toincome and education. In the end, this disparity affects schoolperformance of the students. Some perform well but others fail. Also,academic attainment, according to gender, indicates that both male andfemale students perform more or less equally at school.
However, cultural capital demonstrates insignificant change in the schoolsuccess (r=0.115). Again, regression model shows insignificantrelationship between cultural capital and GPA. In other words, changesin the components of cultural capital suggest no changes in the schoolsuccess. A demarcation line between developed and developingcountries might be derived from the regression model and index of thecultural capital that the components of cultural capital in a society maynot fit in another society. Cultural capital, therefore, needs to be definedby the societal socioeconomic situations. In Bangladesh, in many of the
Innovative Issues and Approaches in Social Sciences, Vol. 10, No. 1
| 101
families students lack of libraries, reading habit, computer facility andattendance in extra-curricular activities. In many other families, musicalpractices, visiting and understanding paintings are almost absent orrestricted. Consequently, the components of western high culture fail toexplain school success in the context of Bangladesh. They can evendeteriorate the performance of the students because of a grossmismatch with the national curriculum. The socioeconomic condition andcultural practices largely determine the educational attainment ofstudents in a society.
The success of students at school in closely related to parental culturalcapital. For instance, parents visiting museum, learning history, solvingmath problems and desire for life gradually transfer to children. Parentalpractices make an environment in the families to enrich children withmotivation, primary learning and readymade opportunities. The studentscan succeed at school from the families in which a culture of learningexists. Regular learning facilitates students to be familiar with manythings that sharpen their memory and understanding. From the verybeginning of the life, family learning atmosphere gradually enablesstudents to look at the different aspects of every day practices frommultiple perspectives. A learning ambience therefore creates anopportunity for students to learn and organize their lives, compared tothose who miss out the same environment. Lack of education, familyincome and social organization restrict many parents to achieve skills,knowledge and aspirations that eventually hinder future generations toadvance further. Socioeconomic volatility and systemic disruption interms of insecurity of income and occupation, disorganized schoolsystem and curriculum restrain millions of poor families to ensure aminimum standard of life. They are out of cultural and socioeconomicmilieu, trapped into a cycle of poverty. A number of lucky families fosterlearning atmosphere through which some students can translate thisfavourable settings into success at school.
ConclusionThis research examines the variation in academic attainment of collegestudents in terms of their cultural capital. Findings report that culturalcapital has no significant relation with students’ educational success.Although parental education and family income significantly impactstudents’ school success, cultural capital is not a very important factor toimprove students’ academic achievement in Bangladesh. Comparatively,family economic condition and parental education put greater influenceon students’ educational improvement. It is therefore important to notethat family income is more important than cultural capital to achieve agood result. The results of this research contrast with Bourdieu’s study in
Innovative Issues and Approaches in Social Sciences, Vol. 10, No. 1
| 102
France as cultural capital marginally influences educational success ofthe students.
The failure of cultural capital to enhance school success can beattributable to improper schooling and parental guiding. Both schoolsand families as a result struggle to create a congenial ambience forstudents for fostering learning and skills to perform better at schooland/or occupation. A number of students receive proper caring fromschools and families that advance them at achieving more rewardswhich tend to perpetuate social inequality in Bangladesh. Higher familyincome and parental education of higher class further contribute tocreating uneven success among the students. But most of the parents’lack of education that makes students depends on private tutors toimprove GPA. Parents’ higher income allows students to receive privatetutoring for higher achievements. This paper thus recommends thatcultural capital must be defined from a society’s own cultural contexts. Inaddition to school factors, community environment, awareness and theimportance of education should be taken into account in the futureattempts to evaluate the role of cultural capital in students’ achievement.
ReferencesAcevedo, Gladys Lopez (2002); Learning Outcomes and School cost-
effectiveness in Maxico: The PARE Program; in Journal ofEducational Planning and Administration, Vol-XVI, No-1, pp-31-53,January-2002.India.
Alam, Mahmudul (1997); Basic Educational achievement in RuralBangladesh: level, Pattern and Socioeconomic Determinants;Research Report no-145, Bangladesh Institute of DevelopmentStudies (BIDS), Dhaka.
Alam, Mahmudul (1994); Performance of secondary Education Sub-sector in Bangladesh: 1981-1990, An Evaluation, in The DevelopmentStudies, Vol: XXII, No-1, March-1994, Dhaka.
Alam, Mahmudul & Salimullah,M (1993); Secondary SchoolPerformance in Bangladesh:Individual, Family and School leveldeterminants (in Bangla),in Bangladesh Unnon Somikha,11th Annualpublication-1400 Bd, Bangladesh Institute Of DevelopmentStudies(BIDS), Dhaka-1993.
Ali, et al. (1999); Changing Educational Structure In Rural Bangladesh;in The Chittagong University Journal of Social Science, Vol-XIX, No-1,, June-1999, pp 35-49.
Bourdieu, Pierre (1977). Outline of a Theory of Practice. Cambridge andNew York: Cambridge University Press, London-1977.
Innovative Issues and Approaches in Social Sciences, Vol. 10, No. 1
| 103
Bourdieu, P (1996), The State Nobility: Elite Schools in the Field ofPower. Trans. Lauretta C. Clough. Stanford: Stanford UniversityPress’
Buchmann, Claudia and Hannum, Emaily (2001); Education andStratification in Developing Countries: A Review of Theories andResearch in Annual Sociological Review Vol-27:pp-77-102,downloaded from www.annualreviews.org. Access date 28/05/2007.
Coleman, J., Campbell, E. Q., & Hobson, C. J. (1966). Equality ofeducational opportunity. Washington, DC: US Government PrintingOffice.
De Graaf et al. (2000); Parental cultural capital and EducationalAttainment in the Netherlands: A refinement of the cultural capitalPerspective. In Sociology of education2000, vol.73 (April);pp 92-111.
Darmody, Merike, Byrne, Delma&McGinnity, Frances (2014)Cumulativedisadvantage? Educational careers of migrant students inIrish secondary schools, Race Ethnicity and Education, 17:1, 129-151,DOI: 10.1080/13613324.2012.674021.
Devine, Dympna (2009) Mobilizing capitals? Migrant children'snegotiation of their everyday lives in school, British Journal ofSociology of Education, 30:5, 521-535,DOI:10.1080/01425690903101023.
DiMago, Paul (1982); Cultural Capital and School Success: The Impactof Status Culture participation on the Grades of US. High SchoolStudents; in American Sociological Review, Vol-47, no-2:, April-1982.Pp-189-201.
Dumals, Susan A. (2002); Cultural capital, Gender, and SchoolSuccess: the Role of Habitus. In Sociology of education2002, vol.753(January);pp 44-68.
Emmison, M., & Frow, J., (1998) “Information Technology as CulturalCapital” in Australian Universities Review, Issue 1/1998, p. 41-45.
Hallinan,M.T. (1988); Equality of Educational Opportunity; in AnnualSociological Review Vol-14:pp-249-268, downloaded fromwww.annualreviews.org. Access date 28/05/2007.
Jenkins, Richard (1992); Pierre Bourdieu; Routledge, London and NewYork-1992.
Kabeer, Naila & Mahmud, Simeen (2005); educational Exclusion andhousehold livelihood in Urban Bangladesh: Explaining theConnections with Children’s work; Research Report no-178,Bangladesh Institute of Development Studies (BIDS), Dhaka.
Kabir, Ariful Haq(2014), Parental Involvement in the Secondary Schoolsin Bangladesh: Challenges and a Way Forward, International Journalof Whole Schooling, Vol 10, No.1, 2014.
Innovative Issues and Approaches in Social Sciences, Vol. 10, No. 1
| 104
Katsillis, John and Rubinson, Richard (1990); Cultural Capital, StudentAchievement and Educational Reproduction: The Case of Greece; inAmerican Sociological Review, Vol-55, no-2:, April-1990, pp-270-279.
Khandker, Shahidur R. & Samad, Hussain,A.(1995); EducationalAchievement and School Efficiency in Rural Bangladesh, in TheDevelopment Studies, Vol-XXIII, No-1&2, June-1995. Dhaka.
Kerckhoff, Alan C. et.al. (1982); Dimensions of Educational andOccupational Attainment in Great Britain; in American SociologicalReview, April-1982, Vol-47, no-2:pp-347-364,
Lynch, Kathleen and Lodge, Anne (2002a) ‘The Class Act: a one-actplay in four stages’ in Lynch, K. and Lodge, A. (2002) Equality andPower in Schools:Redistribution, Recognition and Representation.(Chapter 3) London: Routledge.
Lynch, Kathleen and Lodge, Anne (2002b) ‘The Grouping Process:Selecting in and Selecting Out’ in Lynch, K. and Lodge, A. (2002)Equality and Power in Schools: Redistribution, Recognition andRepresentation. (Chapter 4) London: Routledge.
Portes, Alejandro (1998); Social Capital: Its Origin and Application inModern Sociology; in Annual Sociological Review Vol-24: pp-1-24,downloaded from www.annualreviews.org. Access date 27/05/2007.
Reay, D. (2010), ‘Sociology, social class and education’, in Apple, M. etal. (Eds) The Routledge International Handbook of the Sociology ofEducation. London: Routledge:396-404.
Smith, Philip (2001); Cultural Theory: An introduction; BlackwellPublishers, Massachusetters-02148, USA-2001.
World Bank (WB) (2013), Bangladesh Education Sector Review SeedingFertile Ground: Education That Works for Bangladesh, September2013, Report No. 80613-BD.
Simkus, Albert and Andrka, Rudolf (1982), Inequalities in EducationalAttainment in Hungary, 1923-1973 American Sociological ReviewVol. 47, No. 6 (Dec., 1982), pp. 740-751
Innovative Issues and Approaches in Social Sciences, Vol. 10, No. 1
| 105
GLOBALIZATION AND INDICATORS OFUNCERTAINTY
Matjaž Škabar1
AbstractThe aim of this research is to explore the influence of culture, whichunderstood in a broader sense, as focused towards the uncertainties inmodern societies. Using theory and empirical data, we will determine thelogic and dynamics of changes and the attitude towards changes anduncertainties in modern societies. This article, based on a theoreticalthesis, empirically tests the correlation between the index ofglobalization and different indicators of individualism, as well as theattitude towards uncertainty and reflectiveness. We managed to provethe correlation between the globalization index and indicators ofindividualism. However, when we look at the links between the indicatorsof uncertainty and reflexivity, the correlations prove to be complex andinconsistent.
Keywords: globalisation, uncertainty, indicators
DOI: http://dx.doi.org/10.12959/issn.1855-0541.IIASS-2017-no1-art5
IntroductionFlexibility, the ability to coordinate and adapt to changes, whether theyare continuous or discontinuous, is becoming an important aspect of oureveryday life. This change must be embraced by societies as a whole,as well as by organizations and individuals. Changes (and relatedcrises) occur on all levels and consequently have an effect on socialchanges on the macro, mezzo and micro levels of society. Even ifchanges have become a constant and a rule in these times of upheavalthat we live in, this does not mean that experiencing them has becomeany less risky and painful. They require giving up and surmounting someobsolete ideas, related behaviours, norms and methods of assessingsocial reality.
It is also becoming obvious that there is no single or permanent way ofdealing with problems and challenges that arise in modern societies.Clearly, there cannot be just one, superior (permanent) way of dealing
1 Matjaž Škabar, Ph.D., Buiness School Erudio, Litostrojska cesta 40, 1000 Ljubljana,matjaz.s (at) erudio.si.
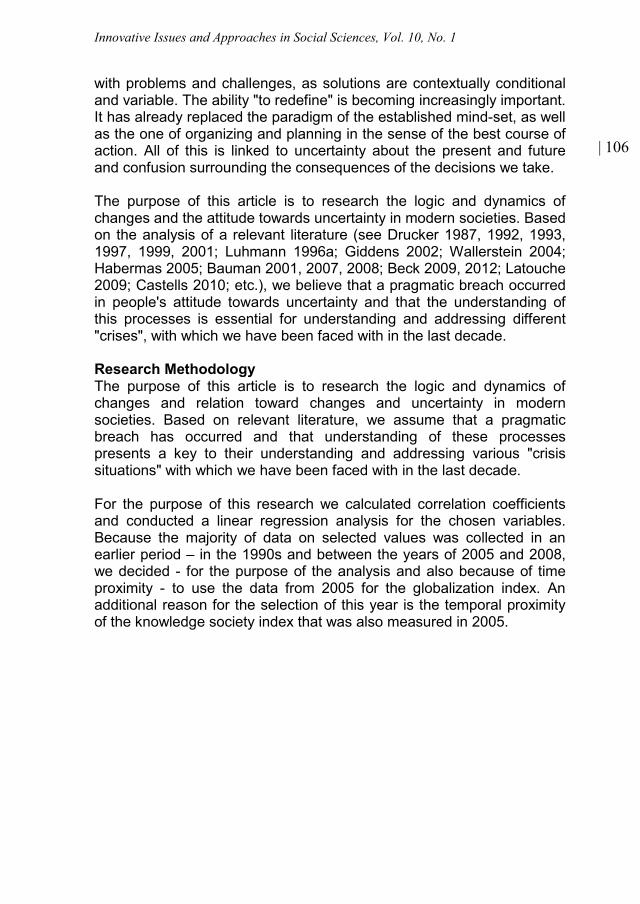
Innovative Issues and Approaches in Social Sciences, Vol. 10, No. 1
| 106
with problems and challenges, as solutions are contextually conditionaland variable. The ability "to redefine" is becoming increasingly important.It has already replaced the paradigm of the established mind-set, as wellas the one of organizing and planning in the sense of the best course ofaction. All of this is linked to uncertainty about the present and futureand confusion surrounding the consequences of the decisions we take.
The purpose of this article is to research the logic and dynamics ofchanges and the attitude towards uncertainty in modern societies. Basedon the analysis of a relevant literature (see Drucker 1987, 1992, 1993,1997, 1999, 2001; Luhmann 1996a; Giddens 2002; Wallerstein 2004;Habermas 2005; Bauman 2001, 2007, 2008; Beck 2009, 2012; Latouche2009; Castells 2010; etc.), we believe that a pragmatic breach occurredin people's attitude towards uncertainty and that the understanding ofthis processes is essential for understanding and addressing different"crises", with which we have been faced with in the last decade.
Research MethodologyThe purpose of this article is to research the logic and dynamics ofchanges and relation toward changes and uncertainty in modernsocieties. Based on relevant literature, we assume that a pragmaticbreach has occurred and that understanding of these processespresents a key to their understanding and addressing various "crisissituations" with which we have been faced with in the last decade.
For the purpose of this research we calculated correlation coefficientsand conducted a linear regression analysis for the chosen variables.Because the majority of data on selected values was collected in anearlier period – in the 1990s and between the years of 2005 and 2008,we decided - for the purpose of the analysis and also because of timeproximity - to use the data from 2005 for the globalization index. Anadditional reason for the selection of this year is the temporal proximityof the knowledge society index that was also measured in 2005.
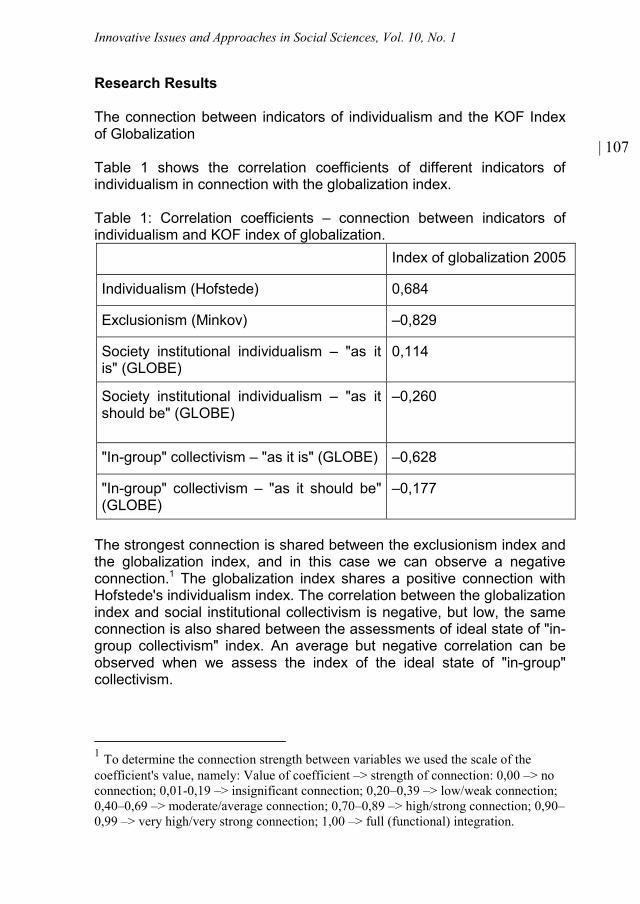
Innovative Issues and Approaches in Social Sciences, Vol. 10, No. 1
| 107
Research Results
The connection between indicators of individualism and the KOF Indexof Globalization
Table 1 shows the correlation coefficients of different indicators ofindividualism in connection with the globalization index.
Table 1: Correlation coefficients – connection between indicators ofindividualism and KOF index of globalization.
Index of globalization 2005
Individualism (Hofstede) 0,684
Exclusionism (Minkov) –0,829
Society institutional individualism – "as itis" (GLOBE)
0,114
Society institutional individualism – "as itshould be" (GLOBE)
–0,260
"In-group" collectivism – "as it is" (GLOBE) –0,628
"In-group" collectivism – "as it should be"(GLOBE)
–0,177
The strongest connection is shared between the exclusionism index andthe globalization index, and in this case we can observe a negativeconnection.1 The globalization index shares a positive connection withHofstede's individualism index. The correlation between the globalizationindex and social institutional collectivism is negative, but low, the sameconnection is also shared between the assessments of ideal state of "in-group collectivism" index. An average but negative correlation can beobserved when we assess the index of the ideal state of "in-group"collectivism.
1 To determine the connection strength between variables we used the scale of thecoefficient's value, namely: Value of coefficient –> strength of connection: 0,00 –> noconnection; 0,01-0,19 –> insignificant connection; 0,20–0,39 –> low/weak connection;0,40–0,69 –> moderate/average connection; 0,70–0,89 –> high/strong connection; 0,90–0,99 –> very high/very strong connection; 1,00 –> full (functional) integration.
Innovative Issues and Approaches in Social Sciences, Vol. 10, No. 1
| 108
The p-value is low (p = 2,39 E – 10), based on its level we can assumethat changes of the independent variable are linked to changes of thedependent variable. As we can make out from the regression equation (y= kx + n) 1, the globalization index rises in correlation with the increase ofthe individualism index, where k = 0,4453. Variability around the trendline is not entirely the same, allowing us to talk about heteroscedasticity.This means that values don’t vary around the regression line withconstant variance. The model estimates that when the value of theindividualization index equals 0, the globalization index reaches thevalue of 48,824. This presents an extrapolation of the selected values,because the lowest individualism index value is 6.
The p-value is low (p = 8,25 E – 18), and based on its level we canassume that changes of the independent variable are connected tochanges of the dependent variable. As we can make out from theregression equation (y = kx + n), the globalization index decreases incorrelation with the increase of the monumentalism index, where k = –0,454. Variability around the trend line is not entirely the same, andbecause of this we can talk about heteroscedasticity, which means thatvalues don’t vary around the regression line with constant variance. Themodel estimates that at the monumentalism index with the value of 0,the value of the globalization index reaches 90,504.
The Connection Between the KOF-Index of Globalization and Indicatorsof the Attitude Towards Uncertainty
The calculation of the correlation coefficient of connectivity between theY variable (KOF-index of globalization 2005) and X variables:
• Uncertainty avoidance (Hofstede, 2005) – n = 79,• Uncertainty avoidance (GLOBE Project, 2004) – n = 54,• Neuroticism (McRea, 2005) – n = 45
1 In this case, k and n are random real numbers that represent a linear function. Thenumber n denotes the intersection between the graph and the ordinate axis (theinterception on the Y axis). The number k corresponds to the direction of the line,therefore it is referred to as the slope of the line.
Innovative Issues and Approaches in Social Sciences, Vol. 10, No. 1
| 109
Table 2: Correlation coefficients – the connection between individualismindicators and the KOF-index of globalization
Globalization index 2005
Uncertainty avoidance (Hofstede) 0,0022
Uncertainty avoidance – "as it is"(GLOBE)
0,494
Uncertainty avoidance – "as it should be"(GLOBE)
–0,740
Neuroticism (McRea) 0,2202
The connection between the index of globalization and Hofstede'suncertainty index with its value close to 0, and a high p value (p =0,984317), which is higher than the risk level α = 0,05, is an interestingfinding. This means that the differences in average value samples arenot statistically typical; we can also say that they are insignificant. TheGLOBE project research team which consisted of Hofstede and otherresearchers, had given the uncertainty index the same name, but theyobviously measured something else – because in both cases we comeacross the correlation with the globalization index. In the case of theuncertainty avoidance index which describes factual checks, thisconnection is relatively strong and positive; meanwhile, the ideal state,connected with uncertainty avoidance, presents a stronger, but negativeconnection. In both cases, the p-value is lower than the risk level α =0,05 (in the first case p = 0,000168 and in the second p = 1,43 E – 40),which means that the differences in average value samples arestatistically typical. We can observe a similar case in the correlationbetween the neuroticism index and the globalization index from 2005,where correlation is observed at a 0,05 level, and we can observe just aweak connection. For the purpose of more transparent conclusionsabout potential influences, we carried out a regression analysis forvariables, between which we discovered a moderate connection.
As we can see from the regression equation (y = kx + n), theglobalization index increases in correlation with the increase ofuncertainty avoidance index "as it is", where k = 0,1154. Variabilityaround the trend line is not exactly the same, and because of this wecan talk about heteroscedastics, which means that values don't varyaround the regression line with constant variation. The model estimates
Innovative Issues and Approaches in Social Sciences, Vol. 10, No. 1
| 110
that at index value 0 of the uncertainty avoidance index, the value of theglobalization index is 21,14.
We can see from the regression equation (y = kx + n) that theglobalization index decreases in correlation with the increase of theuncertainty avoidance index, which describes the desired, ideal state –"as it should be", where k = –0,1741. The model estimates that at 0value of uncertainty avoidance index "as it should be", the globalizationindex value is 149,27.
Table 3 shows the correlation between KOF index of globalization andindicators of reflexion. Calculation of correlation coefficient of connectionbetween Y variable (KOF index of globalization 2005) and variables X:Secular-rational vs. traditional values (Inglehart in Baker, 2000) – n = 47,Self-expression values vs. survival values (Inglehart in Baker, 2000) – n= 47,Monumentalism (Minkov, 2011) – n = 43
Table 3: Correlation coefficients – connection between reflexivenessindicators and the KOF-index of globalization
Index of globalization 2005
Secular vs. traditional values 0,493
Self-expression vs. survival values 0,662
Monumentalism –0,501
*Correlations are common at a 0,05 rate.
This time, all three dimensions are connected to the index ofglobalization. However, the connection between them is not particularlystrong. Therefore, we can classify them as moderate correlations. Thestrongest connection is presented between the index of globalizationand the level of self-expression values, and to a lesser extent thepresence of secular values – however, both connections are positive.Connection between monumentalism and the index of globalization isalso mild, but the connection is negative. We conducted a regressionanalysis of all considered variables for a better conclusion of potentialinfluences.
The p-value is low (p = 0,000492); it may therefore be concluded that thechange in independent variables affects the dependent variables. As wecan observe from the regression equation (y = kx + n), the index of
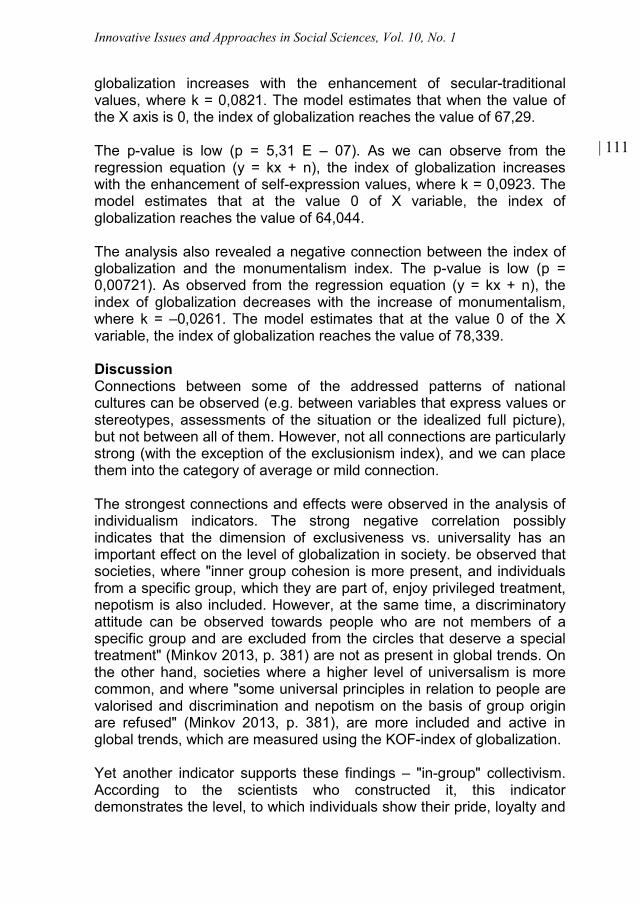
Innovative Issues and Approaches in Social Sciences, Vol. 10, No. 1
| 111
globalization increases with the enhancement of secular-traditionalvalues, where k = 0,0821. The model estimates that when the value ofthe X axis is 0, the index of globalization reaches the value of 67,29.
The p-value is low (p = 5,31 E – 07). As we can observe from theregression equation (y = kx + n), the index of globalization increaseswith the enhancement of self-expression values, where k = 0,0923. Themodel estimates that at the value 0 of X variable, the index ofglobalization reaches the value of 64,044.
The analysis also revealed a negative connection between the index ofglobalization and the monumentalism index. The p-value is low (p =0,00721). As observed from the regression equation (y = kx + n), theindex of globalization decreases with the increase of monumentalism,where k = –0,0261. The model estimates that at the value 0 of the Xvariable, the index of globalization reaches the value of 78,339.
DiscussionConnections between some of the addressed patterns of nationalcultures can be observed (e.g. between variables that express values orstereotypes, assessments of the situation or the idealized full picture),but not between all of them. However, not all connections are particularlystrong (with the exception of the exclusionism index), and we can placethem into the category of average or mild connection.
The strongest connections and effects were observed in the analysis ofindividualism indicators. The strong negative correlation possiblyindicates that the dimension of exclusiveness vs. universality has animportant effect on the level of globalization in society. be observed thatsocieties, where "inner group cohesion is more present, and individualsfrom a specific group, which they are part of, enjoy privileged treatment,nepotism is also included. However, at the same time, a discriminatoryattitude can be observed towards people who are not members of aspecific group and are excluded from the circles that deserve a specialtreatment" (Minkov 2013, p. 381) are not as present in global trends. Onthe other hand, societies where a higher level of universalism is morecommon, and where "some universal principles in relation to people arevalorised and discrimination and nepotism on the basis of group originare refused" (Minkov 2013, p. 381), are more included and active inglobal trends, which are measured using the KOF-index of globalization.
Yet another indicator supports these findings – "in-group" collectivism.According to the scientists who constructed it, this indicatordemonstrates the level, to which individuals show their pride, loyalty and
Innovative Issues and Approaches in Social Sciences, Vol. 10, No. 1
| 112
cohesiveness towards organizations or families to which they belong.The data analysis shows that the societies where "in-group" collectivismis more present, are less included in global trends than societies wherethe estimated level of "in-group" collectivism in not so high. It isinteresting that the desired state ("as it should be") concerning thisphenomenon does not affect the inclusion in global trends.
Based on the findings above, the following thesis may be put forth: in thecase of this indicator, the state of affairs (what actually exists in reality) ismore important than the wishes. Wishes referring to the future do notnecessarily indicate that the society will move in that direction, and atthis point we have to set out a particular and important point when wetalk about wishes: it is possible, that in societies with a higher level ofexclusivism, the projection of desired states functions in an "in-group"manner.
Hofstede's index of individualism, which was used in this analysis,reveals, that the focus on an individual, a so called value orientation,where people see and define themselves as individuals, is positivelyconnected to social participance in global trends. Further researchshould involve group analysis and the determination of specificcharacteristics of potential interest groups.
Although the results of indicators of individualism and globalization indexanalysis are clear, this is not the case with the interpretation of indicatorsof relation towards uncertainty. At first, we are faced with an insignificantconnection between Hofstede's index of uncertainty avoidance and theindex of globalization. It was assumed that the connection exists. It wasalso assumed that societies with a lower level of uncertainty avoidanceare more included in global trends (inclusion in this vast, open,unpredictable and insecure world). But the results show thatexperiencing stress in a workplace, strictly following organizations’ rules,as well as an individual’s long/short term intention to stay and work in anorganization, which Hofstede measured in his avoidance dimension, hasalmost no connection to the index of globalization. We can observesimilar results with a weak correlation in the case of neuroticism – so ahigher level of "anxiety, angry hostility, depression, confidence,impulsiveness and vulnerability" (McRea in Minkov 2013, pp. 284) is notconnected to a higher level of inclusion in global networks.
A similar situation is also manifest in the analysis of the connectionbetween selected indicators of reflectiveness. The strongest connectionin this category is shown in the case of Inglehart and Baker's self-expression vs. survival values. The stronger self-expression values are
Innovative Issues and Approaches in Social Sciences, Vol. 10, No. 1
| 113
present, the stronger the integration into global trends. We also comeacross a similar pattern when we look into connections between secularvs. traditional values and integration into global trends. Contrary to this,Minkov's index of monumentalism shows a negative, mildly strongconnection with integration into global trends. "The cultural syndromethat represents pride and undoubtable Me: the conviction that isnecessary to have an unaltered identity and to follow some strongvalues, beliefs and norms" is negatively connected with the level ofglobalization. However similar to Inglehart's and Baker's indicators, onlya small part of this index’s variability can be explained by the existenceof monumentalism.
ConclusionBased on the analysis of examined data the following conclusions maybe drawn: the increase in the level of knowledge society creates a statewhere a higher structure of life and fewer unexpected events becomemore common. But on the other hand, this raises people's desire for aless structured life with more unexpected events. We also assumed that,on a larger scale, higher social insecurity and dynamics of social changeare dependent of inability to uniformly and permanently counter theproblems and challenges of modern age. But the results showed thatthis does not play such an important role. We can see that lowering ofthe range of monolithic societies (one of their main characteristics is alsoan aspiration towards integrity and internal consistency respectively)creates a slight drop in structured life with less unexpected events (thisleads to a rise in insecurity), but the connection is weak. Therefore, itmay not be claimed that monumentalism has a great impact on a level oflife's structure. Furthermore, no strong correlation or causal relationshipbetween monumentalism and desired state of structure of life werenoted. As social flexibility increases, life also evidently becomesincreasingly less structured, this correlation is mild, rather than strong.We can conclude that a mild connection between both phenomenaexists – both the factual and the desirable state of structured life andinsecurity are moderately connected with monumentalism vs. fluximidity,but other factors probably affect them more.
Innovative Issues and Approaches in Social Sciences, Vol. 10, No. 1
| 114
ReferencesBAUMAN, ZYGMUNT (2008) The Art of Life. Polity Press.BAUMAN, ZYGMUNT (2001) Community: Seeking Safety in Insecure
World, Polity Press.BAUMAN, ZYGMUNT (2007): Liqid Times: Living in an Age of
Uncertainity, Polity Press.BECK, URLICH (1992) Risk Society. Towards a New Modernity. SAGE
Publications.
BECK, URLICH (1996) World Risk Society as Cosmopolitan Society?Ecological Questions in a Framework of Manufactured Uncertainities.Theory, Culture and Society, 13 (4), pp. 1–32.
BECK, URLICH and BECK-GERNISHEIM, ELIZABETH (2001)Institutionalized Individualism and its Social and PoliticalConsequences, SAGE.
BECK, URLICH and CIRONIN, CIANAN (2006) Cosmopolitan Vision.Polity Press.
BECK, URLICH (2009): Družba tveganja: na poti v neko drugo moderno,Knjižna zbirka Temeljna dela, založba Krtina.
BECK, URLICH (2012): Twenty Observations on a World in Turmoil.Polity Press.
CASTELLS, MANUEL (2010) The Rise of the Network Society: TheInformation Age: Economy, Society and Culture, Volume 1, BlackwellPublishing Ltd.
DRUCKER, PETER FERDINAND (1987) The Coming of NewOrganization. Harvard Business Review on Knowledge Management,1–21. Harvard Business School press, Boston.
DRUCKER, PETER FERDINAND (1992) The Age of Discontinuity. NewBrunswick, London.
DRUCKER, PETER FERDINAND (1993) Post-Capitalist Society.HarperBusiness, New York.
DRUCKER, PETER FERDINAND (1997) Introduction: Towards the NewOrganization. V: Hesselbein, M. et. al (eds): Organisation of theFuture, Jossey-Bass, San Francisco.
DRUCKER, PETER FERDINAND (1999) Management Changes for 21stCentury. Butterworth-Hainemann, Oxford.
DRUCKER, PETER FERDINAND (2001) The Essential Drucker. HarperCollins, New York.
GIDDENS, ANTHONY (1979) Central Problem in Social Theory: Action,Structure and Contradiction in Social Analysis, University of CaliforniaPress.
GIDDENS, ANTHONY (2002) Runaway World: How Globalisation isReshaping Our Lives. Profile Books.

Innovative Issues and Approaches in Social Sciences, Vol. 10, No. 1
| 115
HABERMAS, JURGEN (2005) Prihodnost človeške narave. Vedeti aliverjetni. Studia Humanitatis, Ljubljana.
HOFSTEDE, GEERT (2001) Culture's Consequences: ComparingValues, Behaviors, Institutions and Organisations Across Nations(2nd. edition). Thousand Oaks, CA, Sage.
HOFSTEDE, GEERT (2005) Cultures and Organizations: Software ofthe Mind. 2nd Edition. McGraw Hill.
INGLEHART, ROBERT and BAKER, E. WAYNE (2000) Modernization,Cultural Change and the Persistance of Traditional Values. AmericaSociological Review, 65 (1), 19–51.
INGLEHART, ROBERT (2007) The Worldviews of Islamic Public inGlobal Perspective. V: Moaddel, M. (ed.): Values and Perceptions ofthe Islamic and Middle East Publics: Findings form Values Survey.New York: Palgrave Macmillan, pp. 25–46.
LATOUCHE, SERGE (2009) Preživeti razvoj. Ljubljana: Založba cf.LUHMANN, NIKLAS (1996) Social Systems. Stanford University Press.LUHMANN, NIKLAS (1996a) Modern Society Shocked by its Risk,
University of Hong Kong, Department of Sociology Occasional Papers17, Hong Kong.
LUHMANN, NIKLAS (2000) Familiarity, Confidence, Trust: Problemsand Alternatives. V: Gambetta, D. (ed.): Trust: Making and BreakingCooperative Relations. Department of Sociology, University of Oxford,pp. 94–107.
LUHMANN, NIKLAS (2008) Risk. A Socological Theory. TransactionPublishers.
MCCRAE, R. ROBERT and TERRACCIANO, ANTONIO (2005)Personality Profiles of Culture: Aggregate Personality Traits. Journalof Personality and Social Psychology, 89 (3), 407–425.
MINKOV, MARK (2011) Cultural Differences in a Globalized World.Bingley, UK, Emerald.
MINKOV, MARK (2013) Cross-cultural Analysis: The Science and Art ofComparing the World's Modern Societies and Their Cultures. SAGE.
WALLERSTEIN, IMMANUEL (2004) Zaton ameriške moči. Ljubljana:Založba /*cf.
WALLERSTEIN, IMMANUEL (2005) Uvod v analizo svetovnih sistemov,Založba /*cf, Ljubljana.
SourcesECONOMIC FREEDOM NETWORK. Economic Freedom of the World
Data, Economic Freedom Network, Fraser Institute. 2013. Accessedat: http://www.freetheworld.com/datasets_efw.html (11. 11. 2013).
KOF SWISS ECONOMIC INSTITUTE. KOF Globalization. 2013.Accessed at: http://globalization.kof.ethz.ch/ (12. 11. 2013).

Innovative Issues and Approaches in Social Sciences, Vol. 10, No. 1
| 116
WORLD BANK. World Development Reports. 2013. Accessed at:http://econ.worldbank.org/WBSITE/EXTERNAL/EXTDEC/EXTRESEARCH/EXTWDRS/0,,contentMDK:20227703~pagePK:478093~piPK:477627~theSitePK:477624,00.html (11. 11. 2013).
ZN. Understanding Knowledge Societies. United Nations, Department ofEconomics and Social Affairs, Devision for Public Administration andDevelopment Management. 2005. Accessed at:http://unpan1.un.org/intradoc/groups/public/documents/un/unpan020643.pdf (10. 11. 2013).
WORLD VALUES SURVEY. Accessed at:http://www.worldvaluessurvey.org/ (12. 1. 2014).
Innovative Issues and Approaches in Social Sciences, Vol. 10, No. 1
| 117
ASPECTS OF MOTOR DEVELOPMENT IN CHILDRENWITH CEREBRAL PALSY
Erna Žgur1
AbstractChild’s motor development is not an isolated process but it ratherinvolves numerous other developmental aspects, such as cognitive andconative. The research is focused on defining the developmentalprinciples of motor abilities and skills in children with prominent motordeficits who were diagnosed with cerebral palsy (CP). The researchcompares the motor maturity between two groups of children with CP;the younger group (up to 10 years of age) and the older group (10 – 16years of age). The research included 78 primary school children withdifferent forms of CP (diplegia, hemiplegia, mixed forms), aged between6 and 16. The discriminant analysis used in the research showed thatthere is a statistically significant relationship between age and motormaturity in children with CP. The structural matrix confirmed the differenthierarchical representation of the motor components (strength,coordination, precision and graphomotor skills) for the selected motormodel, in relation to children’s age. The function of explosive strengthshowed significant differences between younger and older children asregards their motor maturity. We can conclude that there is a significantdevelopmental difference between the groups of younger and olderchildren with CP, in relation to their motor maturity (different hierarchicalrepresentation), with the most obvious difference in motor ability ofexplosive strength.
Keywords: children with cerebral palsy, motor abilities and skills.
DOI: http://dx.doi.org/10.12959/issn.1855-0541.IIASS-2017-no1-art6
IntroductionDue to irregular brain development, people with CP usually manifestdifferent forms of motor system dysfunction. A disorder can be mild,manifested as rigidity and clumsiness related to movement or individualelements of movement. In case of major trauma to the motor areas ofthe brain, motor dysfunction results more prominent and complex,
1 Erna Žgur, PhD, Assistant Professor of Special and Rehabilitation Pedagogy at the Faculty of Education,University of Ljubljana, Department of Special and Rehabilitation Pedagogy. Contact address:[email protected]
Innovative Issues and Approaches in Social Sciences, Vol. 10, No. 1
| 118
entailing greater movement difficulties or difficulties with numerous,interconnected elements related to movement; difficulties inmaintenance of upright position and consequently with more demandingcognitive tasks (process of learning, development of speech andcommunication, social, and emotional relationship). For inclusion ofchildren in school, a suitable neuro-motor maturity is required for thesatisfactory development of cognitive knowledge, gross and fine motorskills (Logar, Jones, Žgur, Andlovec, Groleger, 2014), enabling thecompletion of visual motor coordination processes which are necessaryfor the development of wider dimensions of learning (in Žagar, 2012).Children with CP can also have simultaneous multiple deficits (motor,sensory, perceptual, etc.), having thus major difficulties in learningachievement.
Aspect of learning achievement and learning progressFor successful learning, children with multiple deficits need a structured,guided teaching (Miller and Bachard, 2006; Ornik Vovk, Murn,Werdoing, 2011). Children with multiple deficits (including children withCP) need more time to develop and suitably maintain their cognitive,motor, work and social communication abilities, through appropriatelearning and therapeutic treatment (Žgur, 2014). Incomplete or lessdeveloped central nervous system causes immaturity in development ofsensory motor abilities, which is reflected in insufficient motordevelopment (Gibson, Blandford, 2005). The latter hinders the processof maturation of gross and fine motor abilities and skills, essential in theprocess of acquisition of basic school knowledge (Rosenbaum,Rosenbloom, 2012). Children with CP develop less sophisticatedsensory perceptual abilities, which, together with the visual motorcoordination, represent an important base for the development offocused attention, identification ability, ability to follow the schoollessons, etc.; all elements essential for school work. Incompleteneurologic processes cause incomplete and short attention span whichconsequently influences the insufficient memory formation, needed forretaining knowledge. Excessive excitation of sensory-perceptual systemcan lead to the low frustration tolerance, which is reflected in school(peer), as well as in wider social relations (social cohesion andacceptance). Immaturity of sensor perceptual processes additionallyincreases the difficulties in self-perception formation (in Žagar, 2012).These deficits, as well as some other, especially health problems,consequently diminish the possibilities for suitable learning and exercise.Children therefore often remain on the level of incomplete learningstrategies which are thus less successful, slower, and less automated.The role of the maturation of motor processes in students with CP isextremely important, whereby it is important to balance the maturity of
Innovative Issues and Approaches in Social Sciences, Vol. 10, No. 1
| 119
both, motor abilities and skills (Dolenc Velicković, 2010, Jekovec-Vrhovšek, Neubauer, 2011). Teachers themselves can help children bygiving them more attention, emphasizing the more coherentdevelopment of body scheme and visualization. In collaboration withother experts (e.g. physiotherapists, occupational therapists, sportsteachers), attention is focused on relational principle, important inunderstanding spatial relations, orientation relations (body perception,perception of body parts, relations between the body and space, etc.).Complete development of sensory-motor processes enables an optimalinsight, perception and internalization of different information, feelings,better intrapersonal and interpersonal interactions, communication,motivation, major lifelong work preparation, which provides moreindependence in different types of situation learning, in work and in life.
Motor abilities and skillsEach human motor action can be divided into different elements of motorabilities or skills. In some cases they are pure motor abilities, in someothers pure motor skills. Most human movement presents mixed formsof abilities and skills which are interconnected and complementary(Gallahue, 2010). Motor development is important as it often determinesthe balance, efficiency and performance.For the purposes of this study, a nomothetic classification of motorabilities was used (Pistotnik, 1999): flexibility, strength, coordination,speed, balance, and precision.
Cerebral palsyCerebral palsy is a combination of specific signs which indicatedisorders affecting child’s motor abilities, posture and balance control(Miller and Bachrach, 2006, Katušić, 2012). It is also a term used todescribe motor deficits as a result of brain damage in early childhood.CP is static, unchanged, non-progressive brain disorder, which meansthat it does not increase and spread to other parts of the brain (Bax andGoldstein, 2005). The term CP indicates a motor disorder, whereby aperson can have numerous other accompanying disorders (learningdifficulties, hyperactivity disorders, attention deficit, hearing and speechdisorder, epilepsy, difficulty of swallowing or chewing, etc. (Baxter,2006). CP is not a disease, it is not contagious, it is non-progressive, butlifelong.
Aim and goalThe research focuses on the differentiation of the incidence ofdifferences in motor development in older and younger students withCP. Additionally, it focuses on hierarchically constructed model of motorfunctions in individuals with CP. For students with CP, school time
Innovative Issues and Approaches in Social Sciences, Vol. 10, No. 1
| 120
represents, as for other students, period of intensive learning andknowledge acquisition, but also period of motor functions development.
Research hypothesisIn the research we tested the hypothesis that there is a statisticallysignificant relationship between the age of the children with CP and thedevelopment of their motor abilities and skills.
MethodsSampleThe sample consisted of 78 children with CP attending 1 to 9 years ofprimary schools of equivalent educational standards, aged between 6and 16. It included children with neurological signs of CP, classified intothe following categories: hemiplegia, diplegia, other (mixed) forms.47.5% of children were diagnosed with hemiplegia, 33.8% with diplegiaand 18.7% with other (mixed) forms.
The observed variablesThe variables were defined in accordance with the theory of CP. For thepurposes of this study, a nomothetic classification of motor skills andabilities was used: flexibility, precision, balance, strength, coordination,speed, stability (postural) control, manipulation and locomotion (Table1).
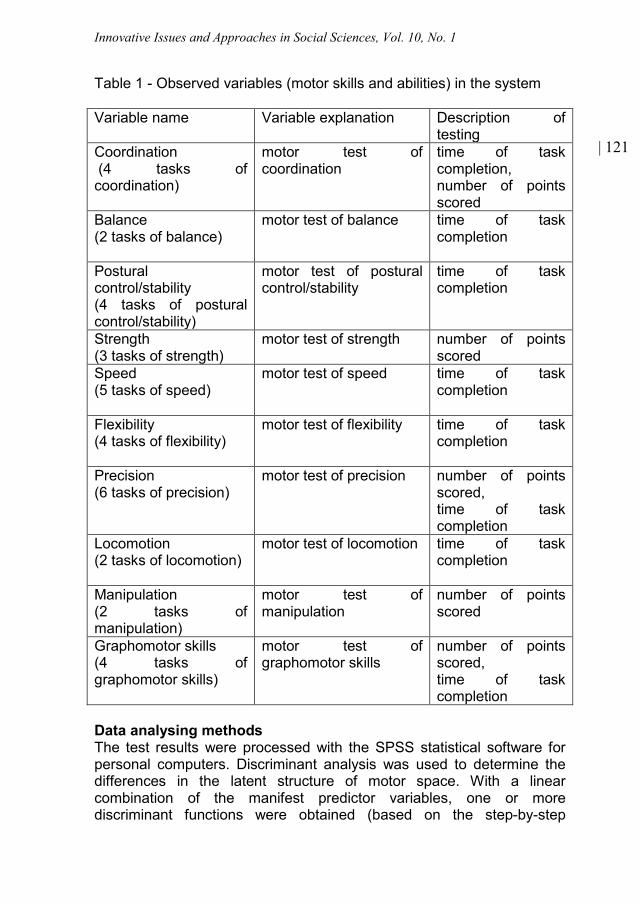
Innovative Issues and Approaches in Social Sciences, Vol. 10, No. 1
| 121
Table 1 - Observed variables (motor skills and abilities) in the system
Variable name Variable explanation Description oftesting
Coordination(4 tasks ofcoordination)
motor test ofcoordination
time of taskcompletion,number of pointsscored
Balance(2 tasks of balance)
motor test of balance time of taskcompletion
Posturalcontrol/stability(4 tasks of posturalcontrol/stability)
motor test of posturalcontrol/stability
time of taskcompletion
Strength(3 tasks of strength)
motor test of strength number of pointsscored
Speed(5 tasks of speed)
motor test of speed time of taskcompletion
Flexibility(4 tasks of flexibility)
motor test of flexibility time of taskcompletion
Precision(6 tasks of precision)
motor test of precision number of pointsscored,time of taskcompletion
Locomotion(2 tasks of locomotion)
motor test of locomotion time of taskcompletion
Manipulation(2 tasks ofmanipulation)
motor test ofmanipulation
number of pointsscored
Graphomotor skills(4 tasks ofgraphomotor skills)
motor test ofgraphomotor skills
number of pointsscored,time of taskcompletion
Data analysing methodsThe test results were processed with the SPSS statistical software forpersonal computers. Discriminant analysis was used to determine thedifferences in the latent structure of motor space. With a linearcombination of the manifest predictor variables, one or morediscriminant functions were obtained (based on the step-by-step
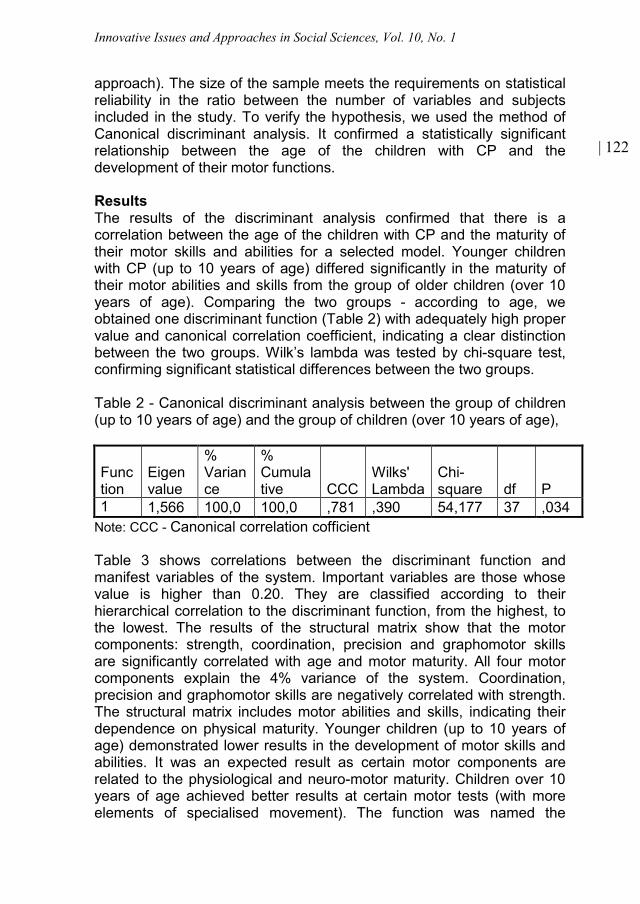
Innovative Issues and Approaches in Social Sciences, Vol. 10, No. 1
| 122
approach). The size of the sample meets the requirements on statisticalreliability in the ratio between the number of variables and subjectsincluded in the study. To verify the hypothesis, we used the method ofCanonical discriminant analysis. It confirmed a statistically significantrelationship between the age of the children with CP and thedevelopment of their motor functions.
ResultsThe results of the discriminant analysis confirmed that there is acorrelation between the age of the children with CP and the maturity oftheir motor skills and abilities for a selected model. Younger childrenwith CP (up to 10 years of age) differed significantly in the maturity oftheir motor abilities and skills from the group of older children (over 10years of age). Comparing the two groups - according to age, weobtained one discriminant function (Table 2) with adequately high propervalue and canonical correlation coefficient, indicating a clear distinctionbetween the two groups. Wilk’s lambda was tested by chi-square test,confirming significant statistical differences between the two groups.
Table 2 - Canonical discriminant analysis between the group of children(up to 10 years of age) and the group of children (over 10 years of age),
Function
Eigenvalue
%Variance
%Cumulative CCC
Wilks'Lambda
Chi-square df P
1 1,566 100,0 100,0 ,781 ,390 54,177 37 ,034Note: CCC - Canonical correlation cofficient
Table 3 shows correlations between the discriminant function andmanifest variables of the system. Important variables are those whosevalue is higher than 0.20. They are classified according to theirhierarchical correlation to the discriminant function, from the highest, tothe lowest. The results of the structural matrix show that the motorcomponents: strength, coordination, precision and graphomotor skillsare significantly correlated with age and motor maturity. All four motorcomponents explain the 4% variance of the system. Coordination,precision and graphomotor skills are negatively correlated with strength.The structural matrix includes motor abilities and skills, indicating theirdependence on physical maturity. Younger children (up to 10 years ofage) demonstrated lower results in the development of motor skills andabilities. It was an expected result as certain motor components arerelated to the physiological and neuro-motor maturity. Children over 10years of age achieved better results at certain motor tests (with moreelements of specialised movement). The function was named the
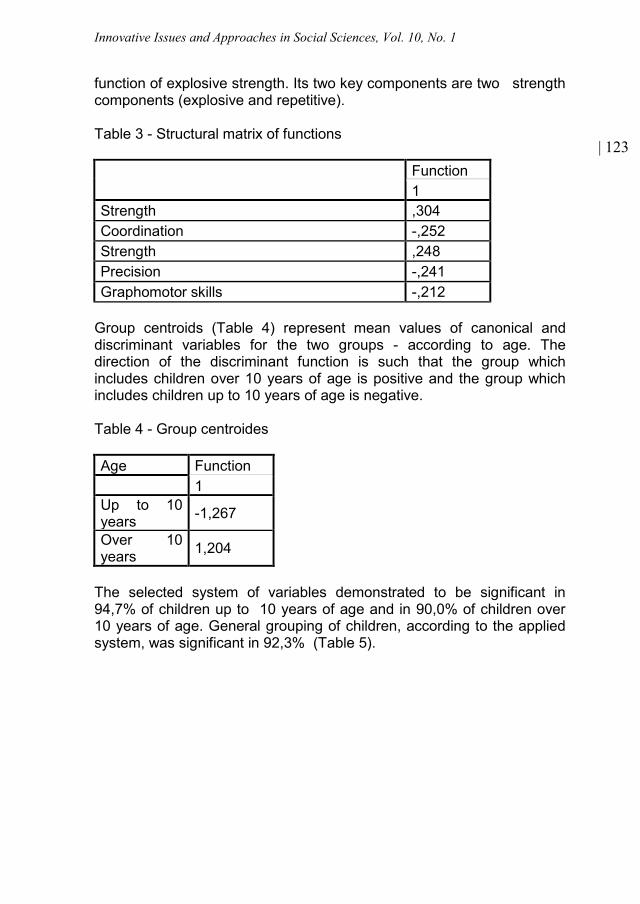
Innovative Issues and Approaches in Social Sciences, Vol. 10, No. 1
| 123
function of explosive strength. Its two key components are two strengthcomponents (explosive and repetitive).
Table 3 - Structural matrix of functions
Function1
Strength ,304Coordination -,252Strength ,248Precision -,241Graphomotor skills -,212
Group centroids (Table 4) represent mean values of canonical anddiscriminant variables for the two groups - according to age. Thedirection of the discriminant function is such that the group whichincludes children over 10 years of age is positive and the group whichincludes children up to 10 years of age is negative.
Table 4 - Group centroides
Age Function1
Up to 10years -1,267
Over 10years 1,204
The selected system of variables demonstrated to be significant in94,7% of children up to 10 years of age and in 90,0% of children over10 years of age. General grouping of children, according to the appliedsystem, was significant in 92,3% (Table 5).
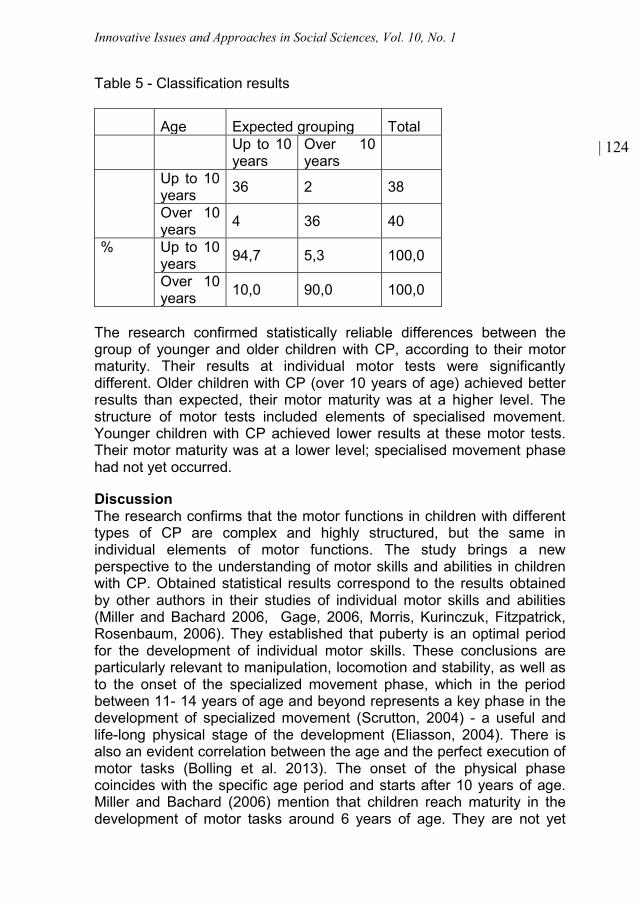
Innovative Issues and Approaches in Social Sciences, Vol. 10, No. 1
| 124
Table 5 - Classification results
Age Expected grouping TotalUp to 10years
Over 10years
Up to 10years 36 2 38
Over 10years 4 36 40
% Up to 10years 94,7 5,3 100,0
Over 10years 10,0 90,0 100,0
The research confirmed statistically reliable differences between thegroup of younger and older children with CP, according to their motormaturity. Their results at individual motor tests were significantlydifferent. Older children with CP (over 10 years of age) achieved betterresults than expected, their motor maturity was at a higher level. Thestructure of motor tests included elements of specialised movement.Younger children with CP achieved lower results at these motor tests.Their motor maturity was at a lower level; specialised movement phasehad not yet occurred.
DiscussionThe research confirms that the motor functions in children with differenttypes of CP are complex and highly structured, but the same inindividual elements of motor functions. The study brings a newperspective to the understanding of motor skills and abilities in childrenwith CP. Obtained statistical results correspond to the results obtainedby other authors in their studies of individual motor skills and abilities(Miller and Bachard 2006, Gage, 2006, Morris, Kurinczuk, Fitzpatrick,Rosenbaum, 2006). They established that puberty is an optimal periodfor the development of individual motor skills. These conclusions areparticularly relevant to manipulation, locomotion and stability, as well asto the onset of the specialized movement phase, which in the periodbetween 11- 14 years of age and beyond represents a key phase in thedevelopment of specialized movement (Scrutton, 2004) - a useful andlife-long physical stage of the development (Eliasson, 2004). There isalso an evident correlation between the age and the perfect execution ofmotor tasks (Bolling et al. 2013). The onset of the physical phasecoincides with the specific age period and starts after 10 years of age.Miller and Bachard (2006) mention that children reach maturity in thedevelopment of motor tasks around 6 years of age. They are not yet
Innovative Issues and Approaches in Social Sciences, Vol. 10, No. 1
| 125
ready for more demanding and complex motor tasks, accordingly, theirresults are poorer, as confirmed for the selected motor model. In thecourse of their development, maturely different forms of movementpatterns occur, in relation to age and motor maturity.
The latter was also confirmed in the study, since suitable forms of motormaturity were observed in much older children with CP, with theprevalence of muscle strength; less as regards coordination, precisionand other graphomotor elements. Therefore, research results may helpthe experts (physical education teachers and sports trainers) studyingthe population of people with multiple motor deficits (Žgur, 2016). Theresults of this research can serve as the support for the teachers, whowork with children with CP on all education levels. Grater considerationof suitability of motor tasks (optimality of the tasks with regard to themotor maturity) enables and encourages a child’s school progress, sinceit is built on their abilities, taking into account the level of their neuro-motor development.
ReferencesBolling, S., Tarja, V., Helena, M., Wivi, F., Ilona, AR., Leena, H. (2013):
Measuring quality of life of Finnisf children with cerebral palsy. Journalof pediatric Rehabilitation Medicine. Vol: 6, No: 3; pp121-127.
Dolenc Velicković, Tatjana (2010): Neuro-Developmental treatment forearly Intervention, Lectures and demonstrations. In K, Žiberna (ed.):8-th Interantional Congress on Cerebral Palsy. An open-mindedapproach to the therapeutic options, Bled, SLO, pp. 19.
Eliasson, A.C., Krumlinde-Sundholm, L., Rosblad, B., et al. (2004):The Manual Ability Classification System (MACS) for children withcerebral palsy: scale development and evidence of validity andreability. Department of Woman and Child Health, KarolinskaInstitute, Sweden 2004: 549-554.
Gage J.R. (2006). The Treatment of Gait Problems in Cerebral Palsy.Mac Keith Press, Clinical in Developmental Medicine, Cambridge:University press, UK.
Gallahue D.L. (2010). Levels and stages of movement skillslearning: practical implications for parents, teachers, coaches andtherapists. In Rado, Pišot, Vesna, Štemberger, R. Šimunič, D.Dolenc, Rado, Malej (eds.): The 6th interantional scientific andexpert symposium. Contemporary views on the motordevelopment of a Child, Portorož: 29-30.
Gibson, S., Blandford, S. (2005): Managing Special education Needs. Apractical guide for primary and secondary schools. Paul ChapmanPublishing, A SAGE Publications Publishing, London, pp. 13-21.
Jekovec-Vrhovšek, Maja, Neubauer, David (2011): Otrok s cerebralno
Innovative Issues and Approaches in Social Sciences, Vol. 10, No. 1
| 126
paralizo raste in odrašča. Rehabilitacija. Vol.: 10, No: 2, pp 65-70.Katušić, A. (2012): Cerebralna paraliza: redefiniranje reklasifikacija.
Hrvatska Revija za rehabilitacijska istraživanja. Vol.: 48, No: 1, pp:117-126.
Logar, Svetlana, Jones, Diana, Žgur, Erna, Andlovec, Sabina, Groleger,Katja (2014): Gibalno ovirani otroci. V Natalija Volk Ornik (ur.) (2011):Kriteriji za opredelitev vrste in stopnje primanjkljajev, ovir oz. motenjotrok s posebnimi potrebami. Ljubljana: Zavod RS za šolstvo, 19‒20.
Miller F., Bachard S.J. (2006): Cerebral Palsy. A Complete Guide forCare giving. Baltimore. A Johns Hopkins press helath book, USA,pp. 25-29, 87-89, 112-119.
Morris, C., Kurinczuk, J., Fitzpatrick, R., Rosenbaum, P.L. (2006):Reliability of the Manual Ability Classification System for Childrenwith Cerebral Palsy. In Developmental Medicine & ChildNeurology. The official journal of the American Academy forCerebral Palsy and Developmental Medicine, the British PaediatricNeurology Association, London Press, MacKeith, UK, pp. 48.
Ornik Vovk, Natalija, Murn, Tatjana, Werdoing, Alenka (2011): Delo zotroki s posebnimi potrebami, učnimi težavami in posebej nadarjenimiotroci. Založba Forum Media d.o.o.
Pistotnik, Borut (1999): Osnove gibanja: osnove gibalne izobrazbe.Gibalne sposobnosti in osnovna sredstva za njihov razvoj v športnipraksi. Ljubljana, Fakulteta za šport.
Rosenbaum, P., Rosenbloom, L. (2012): Cerebral Palsy – fromdiagnosis to adult life. London: Mac Keith Pres: 3-13.
Scrutton. D. (2004): Management of the motor disorders of children withcerebral palsy. London: MacKeith Press: Distributed by CambridgeUniversity Press, UK.
Webster, R., Blatchford, P. (2013): The educational experiences ofpupils with a Statement for special educational needs in mainstreamprimary schools: results from a systematic observation study. In S.Hegarty (ed.): European Journal of Special Needs Education. Vol: 28,No: 4, pp: 463–479.
Žagar, D. (2012): Drugačni učenci. Ljubljana: Znanstvena založbaFilozofske fakultete.
Žgur, Erna (2014): Zgodnja obravnava otrok z več primanjkljaji=Earlychildhood intervention for children with multiple deficits. V Tatjana,DEVJAK (ur.): Sodobni pedagoški izzivi v teoriji in praksi. Ljubljana:Pedagoška fakulteta, 2014, str. 467-478.
Žgur, Erna, Batista, Diana (2016): Hipoterapija in njena pozitivna vlogana kognitivne in konativne vidike razvoja: prispevek na X. strokovniposvet o razvoju področja aktivnosti in terapije s pomočjo konja vSloveniji, Vipava, 30. 9.
Innovative Issues and Approaches in Social Sciences, Vol. 10, No. 1
| 127
NEW MODEL OF QUALITY ASSESSMENT IN PUBLICADMINISTRATION - UPGRADING THE COMMON
ASSESSMENT FRAMEWORK (CAF)
Mirna Macur1, Bojan Radej2
AbstractIn our study, we developed new model of quality assessment in publicadministration. The Common Assessment Framework (CAF) isfrequently used in continental Europe for this purpose. Its use has manybenefits, however we believe its assessment logic is not adequate forpublic administration. Upgraded version of CAF is conceptually different:instead of analytical and linear CAF we get the instrument that measuresorganisation as a network of complex processes. Original and upgradedassessment approaches are presented in the paper and compared inthe case of self-assessment of selected public administrationorganisation. The two approaches produced different, sometimescontradictory results. The upgraded model proved to be logically moreconsistent and it produced higher interpretation capacity.
Keywords: self-assessment; CAF; Common Assessment framework;evaluation; EFQM.
DOI: http://dx.doi.org/10.12959/issn.1855-0541.IIASS-2017-no1-art7
1 Associate professor Mirna Macur, PhD works at National Institute of Public Health,Health Data Center. Contact address: [email protected]
2 Bojan Radej, MA, independent researcher, publicist and founder of SlovenianEvaluation Society (http://www.sdeval.si) Contact address: [email protected]
Innovative Issues and Approaches in Social Sciences, Vol. 10, No. 1
| 128
Introduction
The quality of performance in public administration organisationsis assessed either externally (the citizens’ or users’ perspective) orinternally, by employees themselves. An internal assessment in publicorganisation is a systematic review of organisation's processes, which isimplemented through its own resources and for its own purposes(Harvey 2009). Internal assessment tools range from relatively simple tocomplex ones, encompassing questionnaires about employeesatisfaction, competence management models, complaints procedures1,learning from the best, internal audit, SWOT and PEST analysis,scorecards in achievements and the improvement of businessprocesses (Harrington 1991).
The Common Assessment framework (CAF) was launched in2000 by the European Public Administration Network as a first Europeanquality management instrument tailored specially for and developed bypublic sector organisations. CAF is a framework for internal evaluationdesigned to detect strengths and weaknesses of public organisationsand focus on dilemmas of its internal organisation and modes ofoperation. One of the studies of CAF effectiveness concludes that “CAFworks” and further states that the frame “greatly influences changes inpublic management” in five countries of EU (Staes et al. 2011), includingSlovenia. We believe CAF has many advantages and gives an importantinsight into public administration organisation, but we were not able tolocate any external studies of CAF effectiveness to verify this conclusionindependently. The EIPA, which represents a resource centre for CAFusers, confirmed our observation that, as at the end of 2012, no externalevaluation of CAF’s effectiveness had been prepared yet. Furthermore,poor external communication is one of the most prominent self reportedshortcomings in self-assessments carried out through CAF (Staes et al.2011).
Motives for this article gave us CAF users themselves. Authorsconducted focus group with CAF users and discussion revealed manystrengths and weaknesses of the proposed instrument. Although theywere highly motivated to score each enabler and result separately, theirinitial enthusiasm faded away when quantitative scores weresummarised in conclusion. Assessment team made its best to gather allrelevant data for detailed analysis of CAF criteria, but final synthesis wasusually hard to do – it was missing or it was descriptive, without clear
1 Complaints usually come from clients, but internal complaint and suggestionprocedures can be implemented inside of the organisation to serve employees and givemanagement of the organisation useful information on needed changes.
Innovative Issues and Approaches in Social Sciences, Vol. 10, No. 1
| 129
arguments, and therefore not useful for middle and upper management.Another factor needs to be taken in account is the division of analyticalpart of self-assessment and its synthesis; synthesis of the results isdone by management and not by assessment team. That perhapsexplains Staes’ (Staes et al., 2011) finding, that almost one fifth of theCAF users are interested primarily in getting some sort of quality award.
Furthermore, CAF's generic character is also questioned from apurely paradigmatic ground. The CAF is derived from EFQM – EuropeanFoundation for Quality Management, which was developed in 1988 toincrease competitiveness of private sector organisations. The EIPAadapted the model into CAF to be used for self-assessment in publicadministrations. Such adaptation could cause a problem since there is acrucial difference between the missions of public and private sectororganisations. The latter are simple in their mission to producehomogenous result - profit. Public organisations are complex – theypursue various objectives, which are not homogeneous, they mayinclude more stakeholders than the private ones, and they are lessautonomous in their work (they need to work in the public interest andtake into account various legislations, strategic plans and impositions).Thus self-assessments in private sector organisations are outcomeoriented. Public sector organisations have several main goals, which areincommensurable, i.e. they don’t share a common denominator andtherefore need to be assessed separately. This brings forward theprocess - oriented logic in the assessment (Radej, 2011; Radej et al.,2011). Processes have an important role in standard CAF but theyrepresent only one ninth of the model and are placed among Enablersinstead of between Enablers and Results. Furthermore, processes instandard CAF are understood in an object, static way instead of processway. Therefore, we believe that process assessment in standard CAFversion is not valid and we propose upgraded CAF version that takesinto account processes between Enablers and Results. The articlecompares original and upgraded CAF on the case of evaluation oforganisation O, one of the public administration organisations inSlovenia. It is assumed that the upgraded model offers more informationto middle and top management because its mission goes beyond thefragmented perspective with a numerous object criteria, which is putforward with the standard CAF.
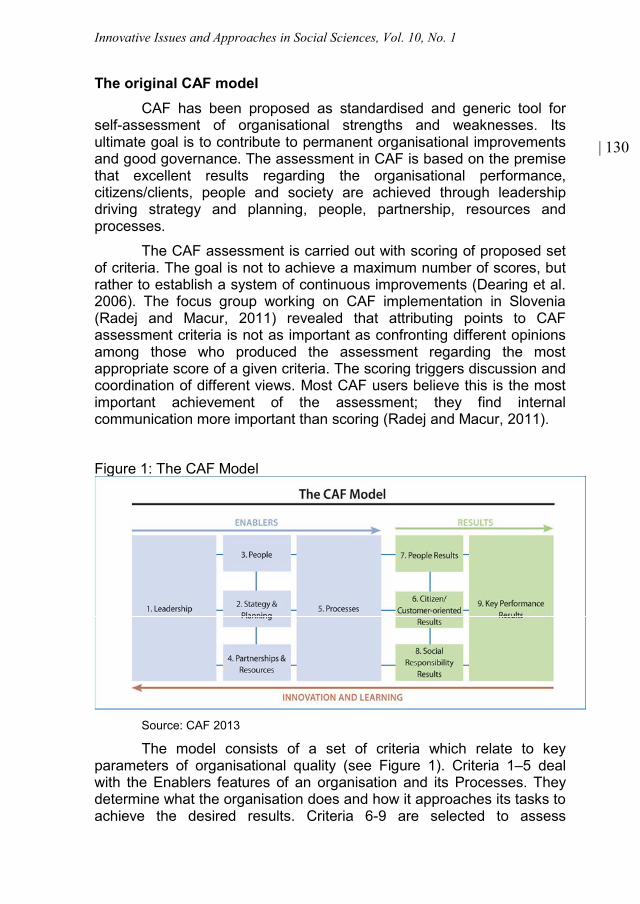
Innovative Issues and Approaches in Social Sciences, Vol. 10, No. 1
| 130
The original CAF modelCAF has been proposed as standardised and generic tool for
self-assessment of organisational strengths and weaknesses. Itsultimate goal is to contribute to permanent organisational improvementsand good governance. The assessment in CAF is based on the premisethat excellent results regarding the organisational performance,citizens/clients, people and society are achieved through leadershipdriving strategy and planning, people, partnership, resources andprocesses.
The CAF assessment is carried out with scoring of proposed setof criteria. The goal is not to achieve a maximum number of scores, butrather to establish a system of continuous improvements (Dearing et al.2006). The focus group working on CAF implementation in Slovenia(Radej and Macur, 2011) revealed that attributing points to CAFassessment criteria is not as important as confronting different opinionsamong those who produced the assessment regarding the mostappropriate score of a given criteria. The scoring triggers discussion andcoordination of different views. Most CAF users believe this is the mostimportant achievement of the assessment; they find internalcommunication more important than scoring (Radej and Macur, 2011).
Figure 1: The CAF Model
Source: CAF 2013
The model consists of a set of criteria which relate to keyparameters of organisational quality (see Figure 1). Criteria 1–5 dealwith the Enablers features of an organisation and its Processes. Theydetermine what the organisation does and how it approaches its tasks toachieve the desired results. Criteria 6-9 are selected to assess
Innovative Issues and Approaches in Social Sciences, Vol. 10, No. 1
| 131
organisational results. Each criterion is further broken down into a list ofsub-criteria – 28 in total. The sub-criteria are illustrated by “assessmentexamples” explaining the context of sub-criteria in detail and suggestingpotential areas to be addressed in order to explore how theadministration meets the requirements included in the sub-criteria.Conclusions drawn from the assessment of the Enablers and ResultsCriteria are fed into the managerial practices that constitute thecontinuous innovation and learning cycle accompanying organisationson their path towards excellence (CAF 2013). CAF's consistency isachieved by establishing a cross-connection between the enablers andtheir results (logical consistency) as well as providing feedback in termsof results to enablers in a form of an improvements plan in anorganisation as a consequence of evaluation findings (managementconsistency) (Staes and Thijs 2005; CAF 2006).
The PDCA-cycle1 is applied for scoring of criteria (see theManual for details). The enablers and the results are not two separateentities in the organisation as they play part in a cause-effectrelationship that connects the left and right side of the model shown inFigure 1. The enablers represent causes and results represent effects;feedback from the latter to the former is also part of the process. Theassessment conclusions are made according to 9 major CAF criteria intowhich the scores of sub-criteria are aggregated. At the end of theassessment, the organisation prepares a plan of priority measures inorder to reduce its weaknesses and enhance its strengths. Thesemeasures are part of the assessment report as well as the newassessment plan. This brings the CAF cycle to an end, integrating it intothe process of permanent improvement, which allows the organisation tooperate on a higher level of self-reflection.
CAF is designed to raise the importance of organisationalprocesses, which are placed at the centre of the CAF model (Figure 1).However, the standard CAF admits that the consistency of self-assessment is a problem since different causes of changes influenceeach other and their interconnection is difficult to recognise (CAF 2006).This is serious problem and well known in social research as a problemof equifinality – that there are alternative ways of attaining the sameobjectives, as a problem of multilinearity – that alternative objectives canbe achieved from the same inputs (Cicchetti, Rogosch, 1996) and intheory of evaluation concerning assessment of indirect impacts (Radej etal., 2012; Radej 2011).
1 PDCA: Plan, Do, Check, Act.
Innovative Issues and Approaches in Social Sciences, Vol. 10, No. 1
| 132
To accomplish a holistic assessment of an organisation in thepublic administration, one cannot do it directly by simply assessing 9criteria. An organisation is not a machine that can be dissembled intomajor components that need to be maintained in the best possible wayin order to work perfectly as a whole. In a complex organisation like oneoperating in the public administration, independently observed criteriaand sub-criteria can suggest excellent performance, but the organisationas a whole can still show poor performance due to conflicts betweenenabling factors of organisation. Organisation in public administrationserves conflicting goals, such as to meet expectations of citizens and tosave public money. In comparison with private organisations, they arenot autonomous in defining their inputs and goals. However, they arerelatively autonomous in making decisions on transforming inputs(enablers) into results. This means that knowing a public organisationmostly means knowing its internal processes, how synergistically ittransforms its inputs into outputs. Currently, the CAF models internalprocesses only as one of nine criteria (measured as outputs), thus notrecognising processes as a central focus for internal self-assessment.
Upgrading the standard CAF model – research designSince processes are central for an organisation in the public
administration with complex internal structure, the CAF model should beupgraded accordingly. The idea behind the proposed upgrading is quitesimple – if an organisation achieves high scores in the enablers’ criteriaand low scores in the results criteria, its overall performance is not assuccessful as in the case of low enablers scores and high end-resultsscores. A public organisation with excellent enablers and excellent end-results is not very successful in its processes because its only successis not doing anything wrong to spoil the realisation of excellent potentialsin its enablers. The total scores in different criteria and sub-criteria donot represent information about the success of the organisation – theyfirst need to be placed in wider conceptual frame of internal relations inwhich they functionally operate. In the upgraded framework, asuccessful organisation is the one that manages to achieve positivedifference between the end-results scores and the enablers scores. Thelarger the difference, the more successful is the transformation oforganisational enablers into results and greater is the organisation’smerit for good results. The underlying assumption here is, of course, thatbetter results are at the same level of enablers’ quality possible onlythrough the higher quality of transformation processes. So the upgradedCAF model does not focus merely on the overall scores of a model butalso on the distribution of scores among the enablers and the results.
Innovative Issues and Approaches in Social Sciences, Vol. 10, No. 1
| 133
It is therefore sensible to propose assessing the process from thedifference between two objects, Enablers scores (e) and the Resultsscores (r). Such a setting is in line with the CAF original design whichrequires assessment of a relationship between the Enablers and theResults scores. Comparison of scores at the enablers side (e) with theresults side (r) evaluates the change as an added value of organisationalprocesses. This is achieved by grouping original CAF’s 9 criteria intothree pillars of organisational quality for enablers and for results of theassessment: Employees, Partnerships and the Society. 1 This makespossible to form an assessment matrix of nine sub-processes, eachdescribing its own aspect of transforming (e) into (r).
The logic of upgraded CAF model is presented in Matrix 1. Thelines of this matrix belong to three major enablers in the organisation,whereas the columns represent the three groups (employees,partnerships and society) as results. The three pillars have constitutivemeaning for the organisation.
Matrix 1: Self-assessment in processes
resultsscores
enablersscores
Employees(r1)
Partnerships(r2)
Society (r3)
Employees (e1) Sub-process11 = r1 – e1 Sub-process12 = r2 – e1 Sub-process13 = r3 – e1Partnerships (e2) Sub-process21 = r1 – e2 Sub-process22 = r2 – e2 Sub-process23 = r3 – e2Society (e3) Sub-process31 = r1 - e3 Sub-process32 = r2 - e3 Sub-process33 = r3 – e3
The matrix of processes is read from the left to the right side. Thesub-processs11 shows by how many scores are results by employeeshigher or lower than the score of the quality of employees as Enablers;the same is done for every other sub-process. The sub-processs11evaluates the organisational human resource management. By analogy,the Sub-processs22 represents the evaluation of processes towardsclients and citizens – this is a core process for which any publicorganisation is founded. The sub-processs33 evaluates socialresponsibility of the public organisation as assessment of its strategicgoals and the wider social vision according to general expectations.
1 1st criteria on the Enablers side (Leadership) is regrouped into other three enablers atthe level of sub-criteria (1.1 and 1.2 is added to Society Enablers, 1.3 is added to PeopleEnablers, 1.4 is added to Partnership Enablers). The 9th criterion is regrouped at thelevel of sub-criteria as follows: 9.1 is added to the Partnership Results (i.e. Citizen/ClientResults), 9.2 is added to the People Results.
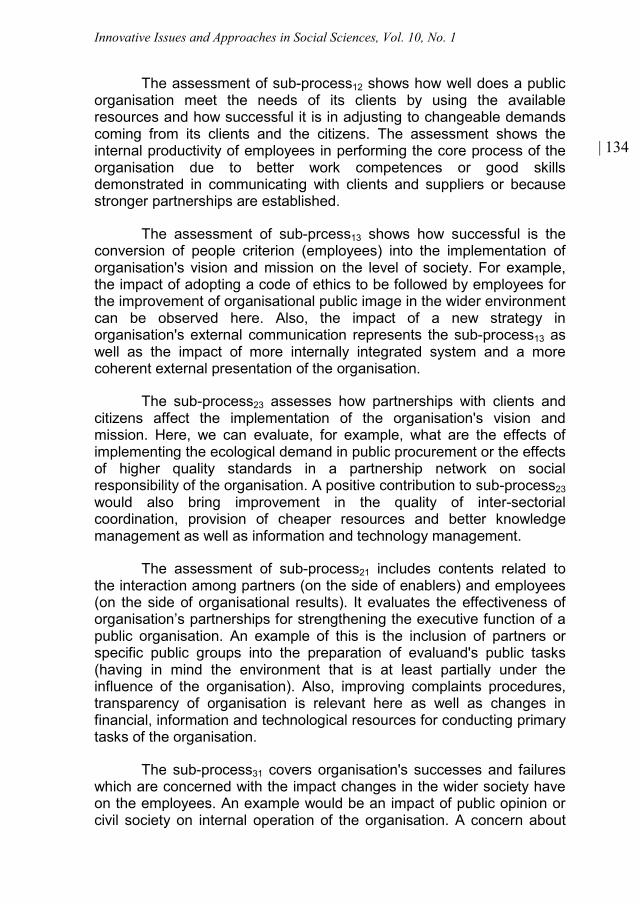
Innovative Issues and Approaches in Social Sciences, Vol. 10, No. 1
| 134
The assessment of sub-process12 shows how well does a publicorganisation meet the needs of its clients by using the availableresources and how successful it is in adjusting to changeable demandscoming from its clients and the citizens. The assessment shows theinternal productivity of employees in performing the core process of theorganisation due to better work competences or good skillsdemonstrated in communicating with clients and suppliers or becausestronger partnerships are established.
The assessment of sub-prcess13 shows how successful is theconversion of people criterion (employees) into the implementation oforganisation's vision and mission on the level of society. For example,the impact of adopting a code of ethics to be followed by employees forthe improvement of organisational public image in the wider environmentcan be observed here. Also, the impact of a new strategy inorganisation's external communication represents the sub-process13 aswell as the impact of more internally integrated system and a morecoherent external presentation of the organisation.
The sub-process23 assesses how partnerships with clients andcitizens affect the implementation of the organisation's vision andmission. Here, we can evaluate, for example, what are the effects ofimplementing the ecological demand in public procurement or the effectsof higher quality standards in a partnership network on socialresponsibility of the organisation. A positive contribution to sub-process23would also bring improvement in the quality of inter-sectorialcoordination, provision of cheaper resources and better knowledgemanagement as well as information and technology management.
The assessment of sub-process21 includes contents related tothe interaction among partners (on the side of enablers) and employees(on the side of organisational results). It evaluates the effectiveness oforganisation’s partnerships for strengthening the executive function of apublic organisation. An example of this is the inclusion of partners orspecific public groups into the preparation of evaluand's public tasks(having in mind the environment that is at least partially under theinfluence of the organisation). Also, improving complaints procedures,transparency of organisation is relevant here as well as changes infinancial, information and technological resources for conducting primarytasks of the organisation.
The sub-process31 covers organisation's successes and failureswhich are concerned with the impact changes in the wider society haveon the employees. An example would be an impact of public opinion orcivil society on internal operation of the organisation. A concern about
Innovative Issues and Approaches in Social Sciences, Vol. 10, No. 1
| 135
free access to public information is also part of this process. In thissegment, the matrix describes the success of the organisation inadjusting to changing demands of external environment – strategicresponses with long-term consequences and deep structuralinterventions are expected here. The adjustment in organisations havinghigh organisational culture (the ones who strive to solve internalconflicts) and reaching consensus about the needed changes will bemore successful compared to adjustments in organisations showing lowcohesive strength.
The sub-process32 describes the assessment of effect changes inexternal conditions, mission and management style have on results inthe field of partnerships. It presents success of the organisation inconverting the external environment factors into changes in the field ofpartnerships as well as its success in adjusting its core activity tochanges in the global environment.
Every sub-process describes one aspect of convertingorganisational enablers into results; all of them together reflect theorganisational complexity because they are interrelatedheterogeneously. We therefore find the assessment of these processesto be of key importance when it comes to self-assessment.
Instead of assessing processes by employing technicallyunrelated object criteria, which is what the original CAF (2006 and 2013)suggests, one needs to assess processes through a correlation ofcoterminous sub-processes. For this purpose, Matrix 1 is converted intoa correlation matrix (see Matrix 2). It compares the scores of two sub-processes lying symmetrically to the diagonal of the matrix 1 – e.g., thecomparisons of scores on the sub-process12 with scores in the sub-process21 etc. Matrix 2 gave a holistic insight into the relationshipbetween the pillars of the organisation (in the case of sub-process12:between employees and partnerships). The organisational quality isbased on three pillars. They have constitutive meaning for theorganisation – if one pillar fails, the entire organisation fails. For example– an organisation cannot exist without its employees; it also cannot stopsupplying useful impacts to its end users, i.e. directly or indirectly tosociety in general. Due to their integrity the poor results concerningcitizens cannot be neutralised by improved results on the side ofemployees. Integrity is crucial because the tree pillars are notnecessarily mutually supportive – quite the contrary, they are oftenengaged in a sharp conflict. If organisation, for example, raises salariespaid to employees, this will reduce funds for citizens’ services (budgetand other conditions remaining the same).
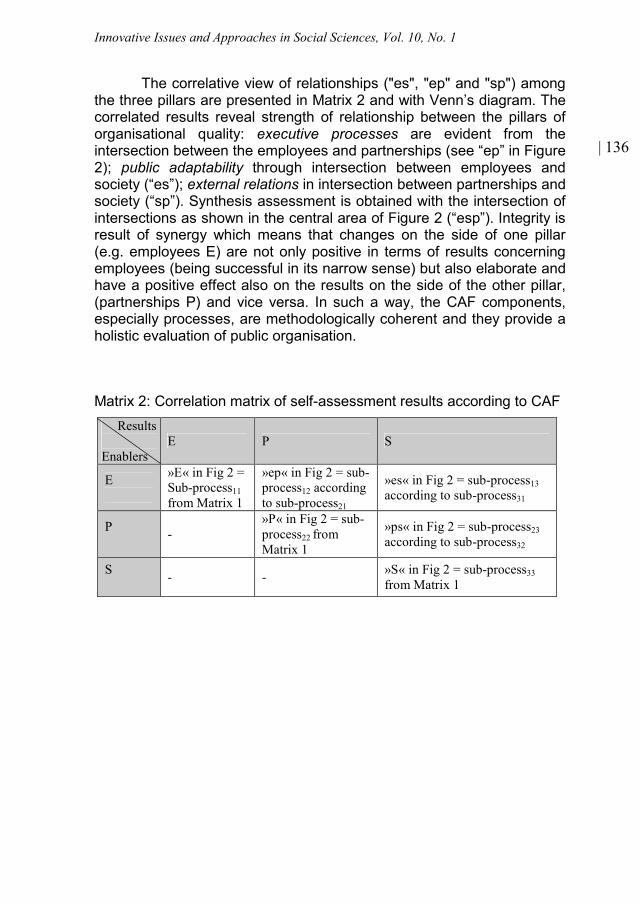
Innovative Issues and Approaches in Social Sciences, Vol. 10, No. 1
| 136
The correlative view of relationships ("es", "ep" and "sp") amongthe three pillars are presented in Matrix 2 and with Venn’s diagram. Thecorrelated results reveal strength of relationship between the pillars oforganisational quality: executive processes are evident from theintersection between the employees and partnerships (see “ep” in Figure2); public adaptability through intersection between employees andsociety (“es”); external relations in intersection between partnerships andsociety (“sp”). Synthesis assessment is obtained with the intersection ofintersections as shown in the central area of Figure 2 (“esp”). Integrity isresult of synergy which means that changes on the side of one pillar(e.g. employees E) are not only positive in terms of results concerningemployees (being successful in its narrow sense) but also elaborate andhave a positive effect also on the results on the side of the other pillar,(partnerships P) and vice versa. In such a way, the CAF components,especially processes, are methodologically coherent and they provide aholistic evaluation of public organisation.
Matrix 2: Correlation matrix of self-assessment results according to CAFResults
EnablersE P S
E »E« in Fig 2 =Sub-process11from Matrix 1
»ep« in Fig 2 = sub-process12 accordingto sub-process21
»es« in Fig 2 = sub-process13according to sub-process31
P -»P« in Fig 2 = sub-process22 fromMatrix 1
»ps« in Fig 2 = sub-process23according to sub-process32
S - - »S« in Fig 2 = sub-process33from Matrix 1
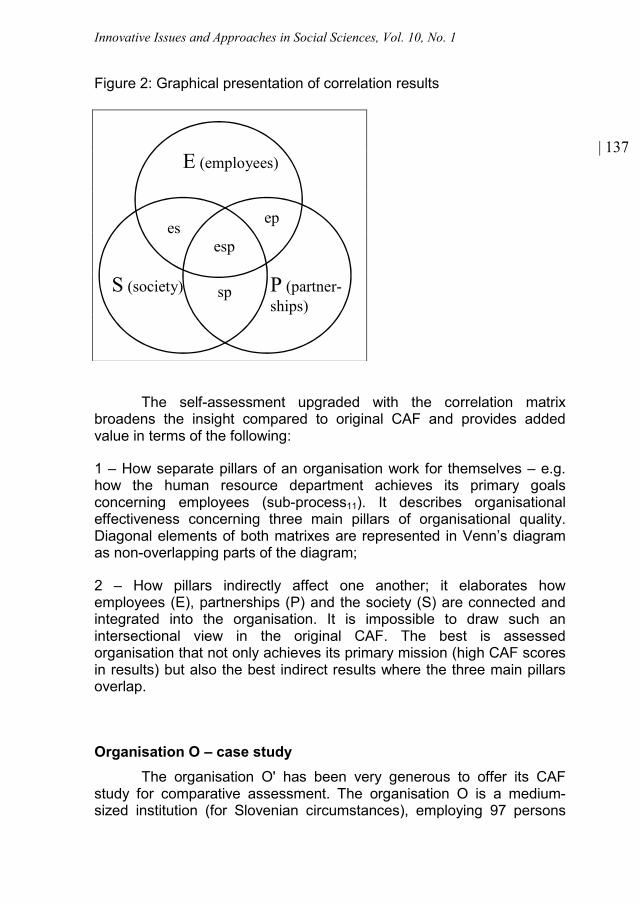
Innovative Issues and Approaches in Social Sciences, Vol. 10, No. 1
| 137
Figure 2: Graphical presentation of correlation results
The self-assessment upgraded with the correlation matrixbroadens the insight compared to original CAF and provides addedvalue in terms of the following:
1 – How separate pillars of an organisation work for themselves – e.g.how the human resource department achieves its primary goalsconcerning employees (sub-process11). It describes organisationaleffectiveness concerning three main pillars of organisational quality.Diagonal elements of both matrixes are represented in Venn’s diagramas non-overlapping parts of the diagram;
2 – How pillars indirectly affect one another; it elaborates howemployees (E), partnerships (P) and the society (S) are connected andintegrated into the organisation. It is impossible to draw such anintersectional view in the original CAF. The best is assessedorganisation that not only achieves its primary mission (high CAF scoresin results) but also the best indirect results where the three main pillarsoverlap.
Organisation O – case studyThe organisation O' has been very generous to offer its CAF
study for comparative assessment. The organisation O is a medium-sized institution (for Slovenian circumstances), employing 97 persons
E (employees)
P (partner-ships)
S (society)
epes
sp
esp
Innovative Issues and Approaches in Social Sciences, Vol. 10, No. 1
| 138
and structured on two-levels with five internal departments. Theorganisation O is highly positioned within the public administrationhierarchy as it is responsible for legal, financial and administrativesupport to very important Slovenian ministry. Consequently, theorganisation O is more directly involved into events taking place in thesociety at macro level than most comparable organisations in the publicadministration. Its performance is intensively monitored by the mediaand it is involved with a wide range of clients, most of them being part ofthe public administration as well. The organisation O is exposed toinfluences from the narrow and wider environment, and vice-versa – ithas relatively strong capacities to impact the external environment. Suchinvolvement emphasises the importance of strategic management in theorganisation O and puts its employees under a great amount of stress.
The organisation O performed a self-assessment with the originalCAF in 2009 for the first time in order to learn more about itself andobtain new experiences. Nevertheless, the internal evaluators previouslyunderwent a training course and were also assisted by an experiencedand authorised external CAF evaluator. CAF’s sub-criteria scores wereestimated according to the manual (CAF 2006) by five employees whowere members of the assessment group. The Executive Managementpersonnel of organisation O were not involved in the scoring process.The sample study has been presented on the most disaggregated levelof scoring of “illustrative cases” that belong to each sub-criterion,together with comments provided by assessors. The sample study ispresented here at the most aggregated level – only for criteria scores.So we needed first to aggregate them into the sub-criteria scores foreach of the assessors separately. A common score for each sub-criterion was not agreed upon among assessors so we had to calculatethe average score from each of them. Sometimes (not frequently) weencountered big differences among individual assessor’s scores. Thesewere not eliminated as outliers. At the end, the average scores1 for 28sub-criteria were produced. Further aggregation produced 9 majorgroups of CAF criteria scores as presented in Table 1.
The scores obtained by assessors were double checked andthen rearranged from the linear framework (CAF list of criteria and sub-criteria in Table 1) into a relational framework in line with Venn’sintersectional diagram showing the three pillars or areas of assessment(employees, partnerships and society; Figure 2). To that end, we had tofurther rearrange 9 CAF criteria into three pillars on the Enablers side
1 If some scores on sub-criterion were not produced by individual assessor, it was left outalso from average calculation and was separated from cases that were scored with 0 insome dimensions.
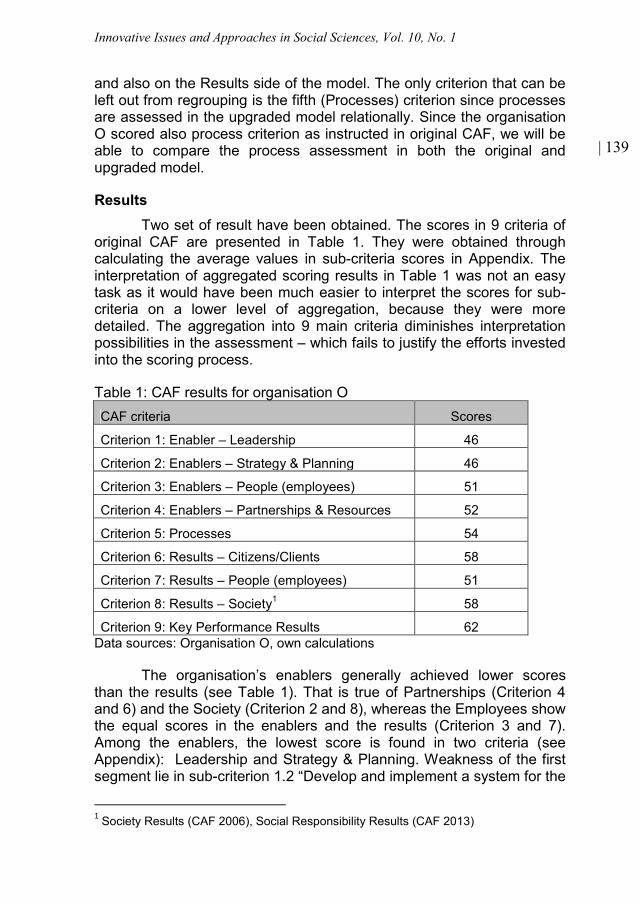
Innovative Issues and Approaches in Social Sciences, Vol. 10, No. 1
| 139
and also on the Results side of the model. The only criterion that can beleft out from regrouping is the fifth (Processes) criterion since processesare assessed in the upgraded model relationally. Since the organisationO scored also process criterion as instructed in original CAF, we will beable to compare the process assessment in both the original andupgraded model.
ResultsTwo set of result have been obtained. The scores in 9 criteria of
original CAF are presented in Table 1. They were obtained throughcalculating the average values in sub-criteria scores in Appendix. Theinterpretation of aggregated scoring results in Table 1 was not an easytask as it would have been much easier to interpret the scores for sub-criteria on a lower level of aggregation, because they were moredetailed. The aggregation into 9 main criteria diminishes interpretationpossibilities in the assessment – which fails to justify the efforts investedinto the scoring process.
Table 1: CAF results for organisation OCAF criteria Scores
Criterion 1: Enabler – Leadership 46
Criterion 2: Enablers – Strategy & Planning 46
Criterion 3: Enablers – People (employees) 51
Criterion 4: Enablers – Partnerships & Resources 52
Criterion 5: Processes 54
Criterion 6: Results – Citizens/Clients 58
Criterion 7: Results – People (employees) 51
Criterion 8: Results – Society1 58
Criterion 9: Key Performance Results 62Data sources: Organisation O, own calculations
The organisation’s enablers generally achieved lower scoresthan the results (see Table 1). That is true of Partnerships (Criterion 4and 6) and the Society (Criterion 2 and 8), whereas the Employees showthe equal scores in the enablers and the results (Criterion 3 and 7).Among the enablers, the lowest score is found in two criteria (seeAppendix): Leadership and Strategy & Planning. Weakness of the firstsegment lie in sub-criterion 1.2 “Develop and implement a system for the
1 Society Results (CAF 2006), Social Responsibility Results (CAF 2013)
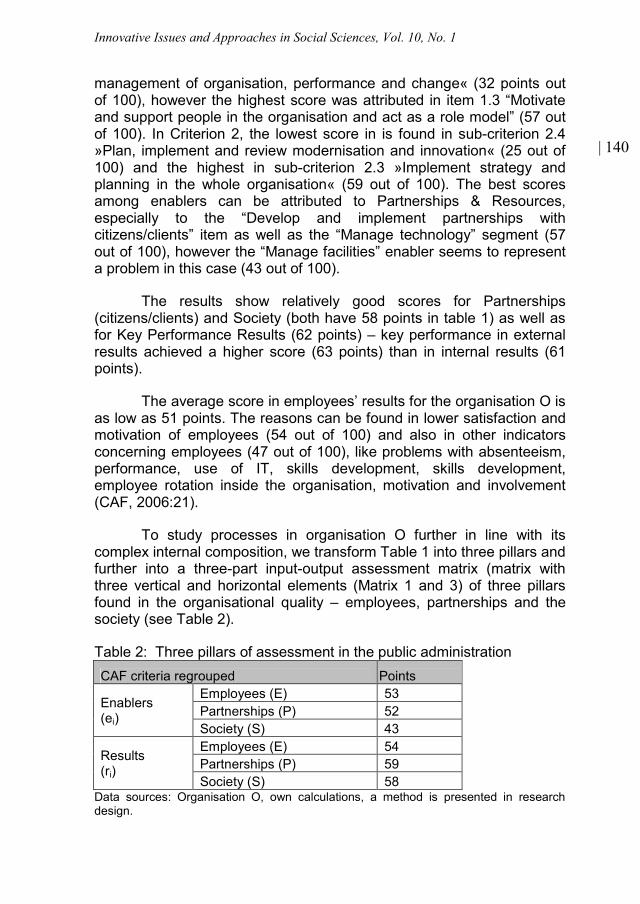
Innovative Issues and Approaches in Social Sciences, Vol. 10, No. 1
| 140
management of organisation, performance and change« (32 points outof 100), however the highest score was attributed in item 1.3 “Motivateand support people in the organisation and act as a role model” (57 outof 100). In Criterion 2, the lowest score in is found in sub-criterion 2.4»Plan, implement and review modernisation and innovation« (25 out of100) and the highest in sub-criterion 2.3 »Implement strategy andplanning in the whole organisation« (59 out of 100). The best scoresamong enablers can be attributed to Partnerships & Resources,especially to the “Develop and implement partnerships withcitizens/clients” item as well as the “Manage technology” segment (57out of 100), however the “Manage facilities” enabler seems to representa problem in this case (43 out of 100).
The results show relatively good scores for Partnerships(citizens/clients) and Society (both have 58 points in table 1) as well asfor Key Performance Results (62 points) – key performance in externalresults achieved a higher score (63 points) than in internal results (61points).
The average score in employees’ results for the organisation O isas low as 51 points. The reasons can be found in lower satisfaction andmotivation of employees (54 out of 100) and also in other indicatorsconcerning employees (47 out of 100), like problems with absenteeism,performance, use of IT, skills development, skills development,employee rotation inside the organisation, motivation and involvement(CAF, 2006:21).
To study processes in organisation O further in line with itscomplex internal composition, we transform Table 1 into three pillars andfurther into a three-part input-output assessment matrix (matrix withthree vertical and horizontal elements (Matrix 1 and 3) of three pillarsfound in the organisational quality – employees, partnerships and thesociety (see Table 2).
Table 2: Three pillars of assessment in the public administrationCAF criteria regrouped Points
Enablers(ei)
Employees (E) 53Partnerships (P) 52Society (S) 43
Results(ri)
Employees (E) 54Partnerships (P) 59Society (S) 58
Data sources: Organisation O, own calculations, a method is presented in researchdesign.
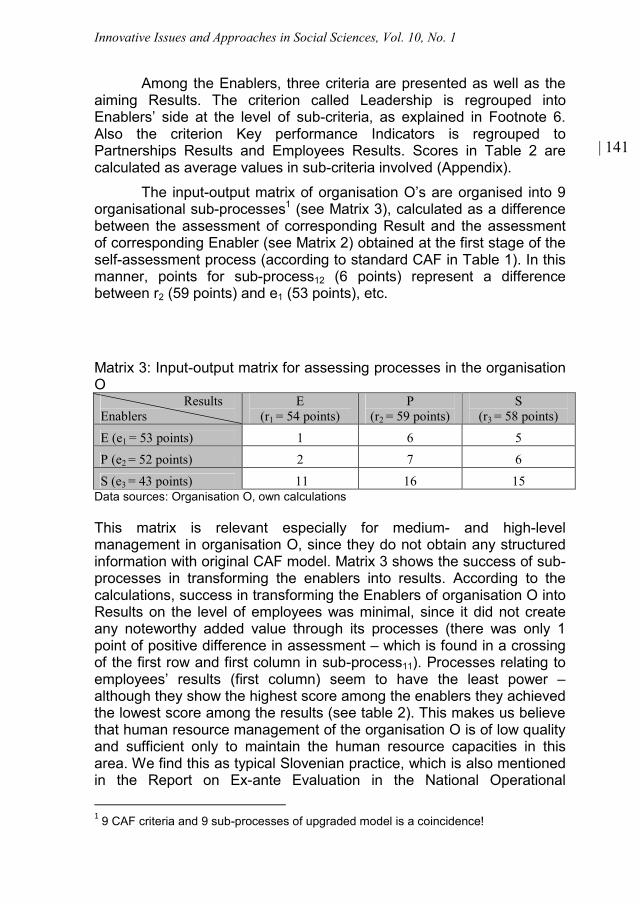
Innovative Issues and Approaches in Social Sciences, Vol. 10, No. 1
| 141
Among the Enablers, three criteria are presented as well as theaiming Results. The criterion called Leadership is regrouped intoEnablers’ side at the level of sub-criteria, as explained in Footnote 6.Also the criterion Key performance Indicators is regrouped toPartnerships Results and Employees Results. Scores in Table 2 arecalculated as average values in sub-criteria involved (Appendix).
The input-output matrix of organisation O’s are organised into 9organisational sub-processes1 (see Matrix 3), calculated as a differencebetween the assessment of corresponding Result and the assessmentof corresponding Enabler (see Matrix 2) obtained at the first stage of theself-assessment process (according to standard CAF in Table 1). In thismanner, points for sub-process12 (6 points) represent a differencebetween r2 (59 points) and e1 (53 points), etc.
Matrix 3: Input-output matrix for assessing processes in the organisationO
ResultsEnablers
E(r1 = 54 points)
P(r2 = 59 points)
S(r3 = 58 points)
E (e1 = 53 points) 1 6 5P (e2 = 52 points) 2 7 6S (e3 = 43 points) 11 16 15
Data sources: Organisation O, own calculations
This matrix is relevant especially for medium- and high-levelmanagement in organisation O, since they do not obtain any structuredinformation with original CAF model. Matrix 3 shows the success of sub-processes in transforming the enablers into results. According to thecalculations, success in transforming the Enablers of organisation O intoResults on the level of employees was minimal, since it did not createany noteworthy added value through its processes (there was only 1point of positive difference in assessment – which is found in a crossingof the first row and first column in sub-process11). Processes relating toemployees’ results (first column) seem to have the least power –although they show the highest score among the enablers they achievedthe lowest score among the results (see table 2). This makes us believethat human resource management of the organisation O is of low qualityand sufficient only to maintain the human resource capacities in thisarea. We find this as typical Slovenian practice, which is also mentionedin the Report on Ex-ante Evaluation in the National Operational
1 9 CAF criteria and 9 sub-processes of upgraded model is a coincidence!
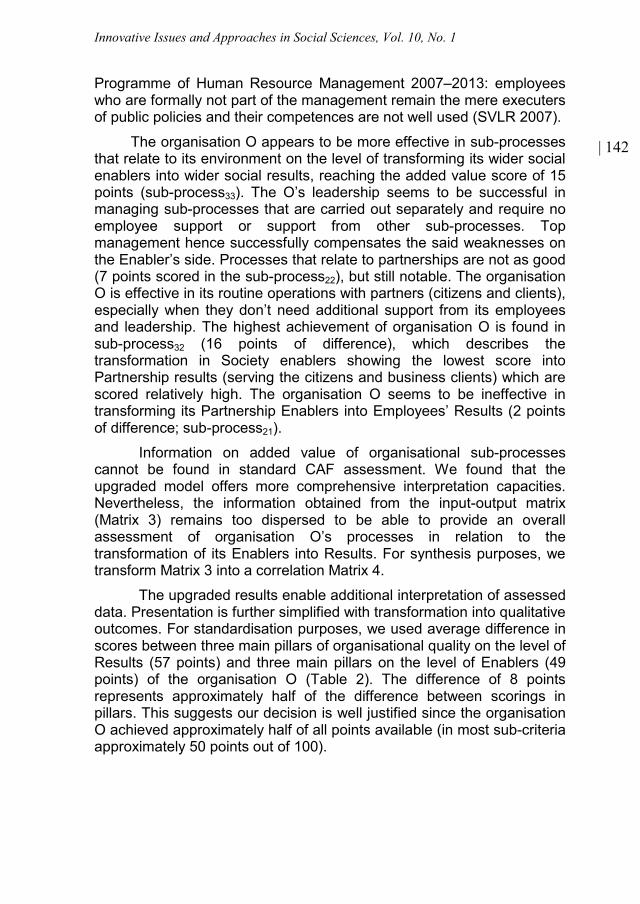
Innovative Issues and Approaches in Social Sciences, Vol. 10, No. 1
| 142
Programme of Human Resource Management 2007–2013: employeeswho are formally not part of the management remain the mere executersof public policies and their competences are not well used (SVLR 2007).
The organisation O appears to be more effective in sub-processesthat relate to its environment on the level of transforming its wider socialenablers into wider social results, reaching the added value score of 15points (sub-process33). The O’s leadership seems to be successful inmanaging sub-processes that are carried out separately and require noemployee support or support from other sub-processes. Topmanagement hence successfully compensates the said weaknesses onthe Enabler’s side. Processes that relate to partnerships are not as good(7 points scored in the sub-process22), but still notable. The organisationO is effective in its routine operations with partners (citizens and clients),especially when they don’t need additional support from its employeesand leadership. The highest achievement of organisation O is found insub-process32 (16 points of difference), which describes thetransformation in Society enablers showing the lowest score intoPartnership results (serving the citizens and business clients) which arescored relatively high. The organisation O seems to be ineffective intransforming its Partnership Enablers into Employees’ Results (2 pointsof difference; sub-process21).
Information on added value of organisational sub-processescannot be found in standard CAF assessment. We found that theupgraded model offers more comprehensive interpretation capacities.Nevertheless, the information obtained from the input-output matrix(Matrix 3) remains too dispersed to be able to provide an overallassessment of organisation O’s processes in relation to thetransformation of its Enablers into Results. For synthesis purposes, wetransform Matrix 3 into a correlation Matrix 4.
The upgraded results enable additional interpretation of assesseddata. Presentation is further simplified with transformation into qualitativeoutcomes. For standardisation purposes, we used average difference inscores between three main pillars of organisational quality on the level ofResults (57 points) and three main pillars on the level of Enablers (49points) of the organisation O (Table 2). The difference of 8 pointsrepresents approximately half of the difference between scorings inpillars. This suggests our decision is well justified since the organisationO achieved approximately half of all points available (in most sub-criteriaapproximately 50 points out of 100).
Innovative Issues and Approaches in Social Sciences, Vol. 10, No. 1
| 143
Matrix 4: Correlation matrix for assessing processes in the organisationO
ResultsEnablers E P S
E»E« == very weak=
»ep« == very weak :weak =
»es« = medium :weak =
P - »P« = medium ==
»ps« = very strong:weak =
S - - »S« = very strong ==
Data sources: Organisation O, own calculationsThe key in labels of sub-processes’ integration:(a) Assessment of causal link (Enabler with Result): very weak = 0 to 0.3 times
average difference between Result and Enabler assessment; weak = 0.4 to0.8; medium = 0.9 to 1.4; strong = 1.5 to 1.9; very strong: more than 1.9times the difference
(b) Assessment of intersections’ value: = very weak intersection; = weakintersection; = medium intersection; = strong intersection; = very strong intersection
Excessive details are reduced from Matrix 4 with the help ofstandardisation and with qualitative transformation of findings. This way,we can concentrate on basic main messages at this high level ofgenerality. The interpretation of diagonal cells in the correlation matrix isequal to the interpretation of the same cells in the input-output matrix.However, the findings in diagonal cells of Matrix 4 are new – they showsynergy in the organisation O from the intersectional point of viewregarding their correlates: Executive processes (“ep”, in Figure 2),Adaptability to public demands (“es” in Figure 2) and Externalrelationships (“ps” in Figure 2). With the assessment of strength incorrelation links, we finally obtained the assessment of intersection fieldsin Figure 3, which were previously described as indicators of integrity i.e.internal coherence of sub-processes in the organisation O.
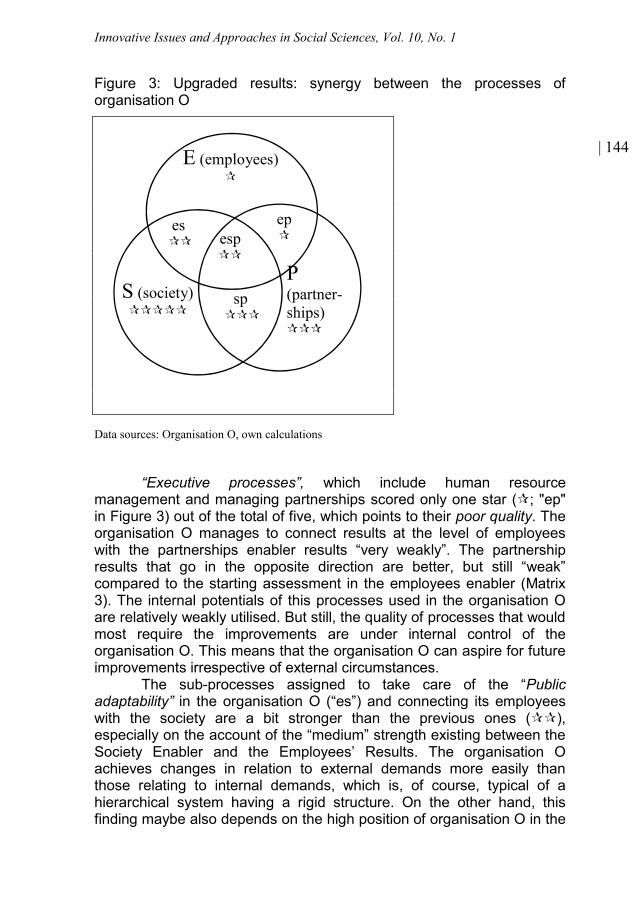
Innovative Issues and Approaches in Social Sciences, Vol. 10, No. 1
| 144
Figure 3: Upgraded results: synergy between the processes oforganisation O
Data sources: Organisation O, own calculations
“Executive processes”, which include human resourcemanagement and managing partnerships scored only one star (; "ep"in Figure 3) out of the total of five, which points to their poor quality. Theorganisation O manages to connect results at the level of employeeswith the partnerships enabler results “very weakly”. The partnershipresults that go in the opposite direction are better, but still “weak”compared to the starting assessment in the employees enabler (Matrix3). The internal potentials of this processes used in the organisation Oare relatively weakly utilised. But still, the quality of processes that wouldmost require the improvements are under internal control of theorganisation O. This means that the organisation O can aspire for futureimprovements irrespective of external circumstances.
The sub-processes assigned to take care of the “Publicadaptability” in the organisation O (“es”) and connecting its employeeswith the society are a bit stronger than the previous ones (),especially on the account of the “medium” strength existing between theSociety Enabler and the Employees’ Results. The organisation Oachieves changes in relation to external demands more easily thanthose relating to internal demands, which is, of course, typical of ahierarchical system having a rigid structure. On the other hand, thisfinding maybe also depends on the high position of organisation O in the
E (employees)
P(partner-ships)
S (society)
ep
es
sp
esp
Innovative Issues and Approaches in Social Sciences, Vol. 10, No. 1
| 145
public administration hierarchy which puts it under stronger pressure interms of its socially responsibility1.
In organisation O's “External processes” – the ones connectingPartnerships with the Society – are the most integrated (). Themain credit goes to the “very strong” relationship between the SocietyEnablers and Partnership Results in the organisation O (see Matrix 3).Weaknesses of this organisation concerning the Leadership andStrategy & Planning (see Appendix) are compensated by the ability ofthe organisation O to respond to client demands and needs2. Theorganisation O is relatively successful in adjusting its core activity to thechanging external conditions on which it has no direct influence. On thecontrary, these sub-processes relatively “weakly” compensate forweaknesses in Partnership Enablers shown at the level of SocietyResults. The organisation O is therefore more successful in respondingto external conditions instead of creating its own external conditionsespecially given its narrow environment – among its direct clients andsuppliers on which it could have some direct impact. Part of the reasonsfor weaknesses in leadership can be increasing demand in publicdomain – connected with inadequate inclusion of partnerships intomatters that exceed the core activity of organisation O and have to dowith wider impacts on the society as a result of organisation O’s strategyand mission.
The integration assessment of sub-processes in organisation Ocan be made by taking into account all three intersections defining theExecutive, Adaptability and External processes. The level of integrity intrilateral intersectional area as shown in Figure 3 can be assessed asthe average value of the three bilateral intersections formed by “ep”,“es”, and “sp” – which is at the level of two stars from the total of five, sowe evaluated the level of integrity in the organisation O as “weak” ().
1 It should be noted that it was an internal assessment and therefore could be biased interms of the internal and external achievements.2 The term clients refers to external clients and business partners.
Innovative Issues and Approaches in Social Sciences, Vol. 10, No. 1
| 146
Discussion of resultsThe upgraded model produced a new insight into the
organisational (sub) processes and facts, which are not visible whenapplying the standard CAF procedure. Findings in the two models aredifferent: the standard CAF model shows that Leadership is the mostsensitive spot in the organisation O, although it proved to be verysuccessful in some processes. However, its priorities need to bedirected more towards the employees (human resource management),whose transformation of enablers (with relatively high scores) intoresults is not very successful. The potential of its employees is relativelypoorly utilised.
Weaknesses in organisation's processes of the most internalnature (human resource management and processes) make hard tobelieve that its relative success in external processes makes theorganisation stronger on the inside as well. Its “social responsibility”does not seem to be addressed in a sustainable way. However, thespotted weaknesses do not put the organisation O in a disadvantage,because its biggest potential lies in activities that depend on its owninternal processes (human resource management and processes).Although there is a doubt whether organisation O’s level of excellence inits external processes can be maintained in a sustainable way, itdefinitely has prerequisites for such an achievement.
We can now compare the Process assessment in standard CAF(54 points in Criterion 5) and calculated value of the processes in theupgraded model. The “esp” process in Figure 3 was estimated by usingthe two-star symbol (), which means approximately 40 points out of100. Our process assessment result is significantly lower than thatachieved by the standard CAF. Precise measurements should notproduce so diverse results. Standard CAF seems to be week inunderstanding causes and consequences for change of theorganisational processes, which should and is its priority. Standard CAFresults (table 1) suggest that leadership of the organisation is weak,however organisation O shows to be very successful in Society Results,for which Leadership is responsible. The reasons for this can be seen ina process approach – Leadership is successful in leadership processesthat don’t need support of the employees. Key problems of theorganisation O do not lie in the Enablers, that show the least scores intable 1 but in Enablers, that score the most: employees and internalprocesses of human resource management.
Innovative Issues and Approaches in Social Sciences, Vol. 10, No. 1
| 147
Conclusions
Discrepancies between conclusions of internal assessment (CAF)and external assessment of public administration (public opinionsurveys, some international comparable indicators) are significant andgive the impression that self-assessment according to CAF serves self-affirmation. Staes et al. therefore argue, that CAF nowadays servesbetter narrow interests of managers in public administrations than thoseof employees, and the least to a wider society that public administrationserves. Let us not forget that CAF results remain internal and not publicinformation.
Our motives to upgrade standard CAF came from CAF usersthemselves, who welcome the framework for its analytical purposes, butsynthesis of findings is hard to do. CAF users recognise that conclusionspresented with summarised quantitative scores are not clear enoughand are merely descriptive if not missing.
We also believe that proposed framework is inadequate for publicadministration since it originates in private sector. CAF does not reflectthe complex structure of public administration, it cannot ensure causalintegrity of the assessment, and its results reveal nothing about theinternal consistency of the organisation.
We upgraded CAF taking into account Burke-Litwin’s model andWeisboard’s input-output approach. Upgraded model is conceptuallydifferent – instead of analytical and linear CAF we get the instrumentthat measures organisation as a network of complex processes.Different results of the two models can therefore be expected.
In the article both types of self-assessment are presented andcalculated in the case of public administration organisation O. Our casestudy shows that the standard CAF results and upgraded CAF findingsessentially contradict each other. The results of conventionalassessment are trivial and can lead to inconsistent conclusions. Theupgraded version, which was developed as an application of originalmeso evaluation logic (Radej, 2011; Radej et al., 2012), proved to bemore logically consistent in fulfilling the original causal intentions of CAFand also to produce interpretation capacity that is superior to the originalCAF.

Innovative Issues and Approaches in Social Sciences, Vol. 10, No. 1
| 148
APPENDIX: Organisation O – CAF criterion calculations (according tothe CAF 2006 manual)
Criterion 1 Enablers – LEADERSHIP 46Sub-criterion 1.1. Provide directions for the organisation by developing its
mission, vision and values39
Sub-criterion 1.2. Develop and implement a system for the management oforganisation, performance and change
32
Sub-criterion 1.3. Motivate and support people in the organisation and actas a role model
57
Sub-criterion 1.4. Manage the relations with politicians and otherstakeholders in order to ensure shared responsibility
55
Criterion 2 Enablers – STRATEGY AND PLANNING 46Sub-criterion 2.1. Gather information relating to the present and future
needs of stakeholders48
Sub-criterion 2.2. Develop, review and update strategy and planning takinginto account the needs of stakeholders and availableresources
52
Sub-criterion 2.3. Implement strategy and planning in the wholeorganisation
59
Sub-criterion 2.4. Plan, implement and review modernisation andinnovation
25
Criterion 3 Enablers – PEOPLE 51Sub-criterion 3.1. Plan, manage and improve human resources
transparently with regard to strategy and planning54
Sub-criterion 3.2. Identify, develop and use competencies of employees,aligning individual and organisational goals
51
Sub-criterion 3.3. Involve employees by developing open dialogue andempowerment
48
Criterion 4 Enablers – PARTNERSHIPS AND RESOURCES 52Sub-criterion 4.1. Develop and implement key partnership relations 51Sub-criterion 4.2. Develop and implement partnerships with
citizens/clients57
Sub-criterion 4.3. Manage finances 52Sub-criterion 4.4. Manage information and knowledge 50Sub-criterion 4.5. Manage Technology 57Sub-criterion 4.6. Manage facilities 43
Criterion 5 Enablers – PROCESSES 54Sub-criterion 5.1. Identify, design and improve processes on an ongoing
basis61
Sub-criterion 5.2. Develop and deliver citizen/client-oriented services andproducts
68
Innovative Issues and Approaches in Social Sciences, Vol. 10, No. 1
| 149
Sub-criterion 5.3. Innovate processes involving citizens/clients 34
Criterion 6 CITIZEN/CLIENT ORIENTED RESULTS 58Sub-criterion 6.1. Results of citizen/client satisfaction measurement 58Sub-criterion 6.2. Indicators of citizen/client-oriented measurement 57
Criterion 7 PEOPLE RESULTS 51Sub-criterion 7.1. Results of people satisfaction and motivation
measurement54
Sub-criterion 7.2. Indicators of people results 47
Criterion 8 Enablers – PEOPLE 58Sub-criterion 8.1. Results of societal measurements perceived by the
stakeholders59
Sub-criterion 8.2. Indicators of societal performance established by theorganisation
57
Criterion 9 KEY PERFORMANCE RESULTS 62Sub-criterion 9.1. External Results: outputs and outcomes to goals 63Sub-criterion 9.2. Internal results 61
Data sources Organisation O, 2009; unpublished material & owncalculations
AcknowledgementsBoth authors would like to thank the participants of CAF paneldiscussion. Public administrators were invited to join in and those usingCAF showed a great deal of interest in the discussion and provided animportant insight into CAF’s strengths and weaknesses.The data used in the article was obtained from the public administrationorganisation. The organisation and person, who provided the data, arekept anonymous.
Innovative Issues and Approaches in Social Sciences, Vol. 10, No. 1
| 150
ReferencesBurke, W. W., Litwin, G. H. (1992). A Causal Model of Organisational
Performance and Change. Journal of Management, 18(3), pp. 523-545.
CAF 2006. CAF Resource Centre – European Institute of PublicAdministration. Available at:http://www.eipa.eu/files/File/CAF/Brochure2006/English_2006.pdf,[IX/2011].
CAF 2013. Improving Public Organisation through Self-Assessment.CAF Resource Centre – European Institute of Public Administration(EIPA), EUPAN. Available at:http://www.eipa.eu/files/File/CAF/CAF_2013.pdf , [VI/2013].
CGIAR. 2003. Performance Measurement of Research Institutions andResearch Programs – A Sourcebook. Washington: CGIARSecretariat, draft.
Cicchetti D., Rogosch, F.A. Equifinality and multifinality in developmentalpsychopathology. Cambridge University Press: Development andPsychopathology, 8/4(1996), pp. 597-600.
Cummings, T.G., Worley., C.G. (2009) Organization Development andChange. Mason: Cengage Learning, 9th edition.
Dearing, E., Staes, P., Prorouk, T. (ed.) (2006): CAF works – betterservice for citizens by using CAF. Wien: Austrian Federal Chancellery.Available at:http://www.eipa.eu/files/repository/product/CAFworks_EN.pdf ,[IX/2012].
Dawis, E. P., Dawis, J. F., Wei-Pin Koo (2001) Architecture ofComputer-based Systems using Dualistic Petri Nets. Systems, Man,and Cybernetics, 2001 IEEE International Conference, 3(2001),pp.1554-1558.
EFQM History. Retrieved from http://www.efqm.org/about-us/our-history[IIX/2013].
Harrington, J.H. (1991) Business Process Improvement: TheBreakthrough Strategy for Total Quality, Productivity, andCompetitiveness. New York: McGraw-Hill, 278 pages.
Harvey L., 2009 Analytic Quality Glossary. Quality ResearchInternational.
Leontief, W. 1970. Environmental Repercussion and the EconomicStructure: An Input-Output Approach. Review of Economics andStatistics 52, pp. 262–271.
Poročilo o predhodnem vrednotenju za Operativni program razvojačloveških virov 2007-2013. Ljubljana: Služba Vlade RS za lokalnosamoupravo in regionalni razvoj. Retrieved fromhttp://www.arhiv.svlr.gov.si/fileadmin/svlsrp.gov.si/pageuploads/KOHE
Innovative Issues and Approaches in Social Sciences, Vol. 10, No. 1
| 151
ZIJA/Predhodno_vrednotenje_ESS_4_porocilo_-_KONCNO.pdf[VI/2010].
Radej, B. (2011): Agregacijski problem kompleksnih družbenihvrednotenj. Ljubljana: Slovensko društvo evalvatorjev, Delovni zvezkiSDE 3/4(2011).
Radej, B., Golobič, M., Macur, M., Dragoš, S. (2011): Vrednotenjepolitik: obzorja nove miselnosti. Ljubljana: Vega.
Radej, B., Golobič, M., Macur, M. (2012): Kompleksna družba v radikalnisredini. Ljubljana: Biotehniška fakulteta, Oddelek za krajinskoarhitekturo.
Radej, B., Macur., M. (2011): Poročilo Fokusne skupine za CAF, ki se jesestala 17. XI. 2011. Ljubljana, Fakulteta za uporabne družbeneštudije in Slovensko društvo evalvatorjev, 24. XI., 3 str.
SVLR. 2007. Operativni program razvoja človeških virov za obdobje2007–2013. Ljubljana: Služba Vlade Republike Slovenije za lokalnosamoupravo in regionalno politiko.
Staes, P., Thijs, N., Stoffels, A., Geldof, S. (2011). Five Years of CAF2006: From Adolescence to Maturity –What Next? A study on the use,the support and the future of the Common Assessment Framework.EIPA, CAF Resource Centre, 160 pages. Retrieved fromhttp://www.eipa.eu/CAF/Articles/CAFworks_EN.pdf, [X/2011].
Staes, P., Thijs, N. (2005). Report on the state of affairs of the C.A.Fafter five years. EIPASCOPE, 2005/3, 41–49. Retrieved fromhttp://www.eipa.eu/cms/repository/eipascope/Scope2005_3_6.pdf,[X/2011].
Weisbord, M.R. (1976). Organizational Diagnosis: Six Places to Look forTrouble with or without a Theory. Group & Organization Studies 1/4(December 1976), pp. 430–447.
Innovative Issues and Approaches in Social Sciences, Vol. 10, No. 1
| 152
Innovative Issues and Approaches in Social Sciences (IIASS)
Editorial correspondenceAll correspondence or correspondence concerning any general questions,article submission or book reviews should be addressed to [email protected]/58
Subscription to IIASSIIASS is available free of any charge at http://www.iiass.com under: You cansign in for a free newsletter.
AdvertisingPlease find our advertising policy at http://www.iiass.com For additionalquestions or inquiries you can contact us on e-mail [email protected].
LanguageThe objective of academic journal is to provide clear communication with aninternational audience. Style and elegance is secondary aim. In this manner weallow US and UK spelling as long as it is consistent within the article. Authorsare responsible for language editing before submitting the article.
Notes for ContributorsPlease refer to www.iiass.com for detailed instructions. Sample layout can bedownloaded from http://www.iiass.com/uploaded_articles/IIASS_layout.doc
Scope:IIASS is electronic peer reviewed international journal covering all socialsciences (Political science, sociology, economy, public administration, law,management, communication science, etc.). Journal is open to theoretical andempirical articles of established scientist and researchers as well as ofperspective young students. All articles have to pass blind peer review.
IIASS welcomes innovative ideas in researching established topics or articlesthat are trying to open new issues that are still searching for its scientificrecognition.
CopyrightIIASS is exclusively electronic peer reviewed journal that is published threetimes a year (initially in January, May and September). IIASS is an open accessJournal under Attribution-NonCommercialCC BY-NC licence (seehttp://creativecommons.org/licenses/ ). This license lets others remix, tweak,and build upon your work non-commercially, and although their new works mustalso acknowledge you and be non-commercial, they don’t have to license theirderivative works on the same terms.
By submitting your article you agree to the above mentioned copyright licence.
Additional information is available on: www.iiass.com