peer-review of grant proposals. an analysis of economic
TRANSCRIPT

Institute of Education
Peer-review of grant proposals. An analysis of Economic and Social Research Council grant applications John Jerrim
Department of Social Science Working Paper No. 16-05 August 2019

Disclaimer Any opinions expressed here are those of the author(s) and not those of the UCL Institute of Education. Research published in this series may include views on policy, but the institute itself takes no institutional policy positions. DSS Workings Papers often represent preliminary work and are circulated to encourage discussion. Citation of such a paper should account for its provisional character. A revised version may be available directly from the author. Department of Quantitative Social Science, UCL Institute of Education, University College London, 20 Bedford Way, London WC1H 0AL, UK

3
Peer-review of grant proposals. An analysis of Economic and Social Research Council grant applications John Jerrim1 Abstract
Peer-review is widely used throughout academia, most notably in the publication of journal articles and the allocation of research grants. Yet peer-review has been subject to much criticism, including being slow, unreliable, subjective and potentially prone to bias. This paper contributes to this literature by investigating the consistency of peer-reviews and the impact they have upon a high-stakes outcome (whether a research grant is funded). Analysing data from 4,000 social science grant proposals and 15,000 reviews, this paper illustrates how the peer-review scores assigned by different reviewers have only low levels of consistency (a correlation between reviewer scores of only 0.2). Reviews provided by ‘nominated reviewers’ (i.e. reviewers selected by the grant applicant) appear to be overly generous and do not correlate with the evaluations provided by independent reviewers. Yet a positive review from a nominated reviewer is strongly linked to whether a grant is awarded. Finally, a single negative peer-review is shown to reduce the chances of a proposal being funding from around 55% to around 25% (even when it has otherwise been rated highly).
Keywords: Peer-review; reliability; grants; scientific funding
Acknowledgements: I am grateful to the ESRC, one of the seven Research Councils of UKRI, for sharing their data. This project would not have been possible without their support.
Contact details: John Jerrim ([email protected]) Department of Social Science, UCL Institute of Education, University College London, 20 Bedford Way London, WC1H 0AL
1 Department of Social Science, Institute of Education, University College London [email protected]

4
1. Introduction
Peer-review is part and parcel of academic life. It is the main quality assurance mechanism
used by journals to decide which papers to publish and by funding bodies in awarding research
grants (Jerrim and De Vries 2015). The outcomes of peer-review thus have major consequences
for the trajectory of academic careers. By successfully navigating the peer-review process, an
academic publishes their papers in top journals, generates funding for their university and thus
their reputation and promotion opportunities are enhanced as a result. Developing a better
understanding of the peer-review process is therefore an issue of substantial interest to
academics, funding bodies and research users alike. The central goal of this paper is to further
our knowledge and understanding of peer-review by investigating specific aspects of the grant
allocation process used by the largest grant-awarding social science funder in the UK.
Several previous studies have investigated different aspects of peer-review, including the
consistency of scores awarded by different reviewers (Mayo et al 2006; Marsh, Jayasinghe and
Bond 2008; Pier et al 2018), potential biases (Marsh, Jayasinghe and Bond 2008; Reinhart
2009; Severin et al 2019) and the impact of interventions designed to improve the quality of
peer-reviews (McNutt et al 1990; Justice et al 1998; van Rooyen et al 1998; van Rooyen 1999).
Yet such studies have been more common within the medical (rather than the social) sciences.
For instance, Pier et al (2018) replicated the entire grant allocation process used by the National
Institutes of Health (NIH). They found ‘no agreement among reviewers examining the same
application’. Similarly, in a small-scale study of medical research applications, Mayo et al
(2006) concluded that ‘there is a considerable amount of chance associated with funding
decisions’. Reviewing 496 medical or biological grant applications, Reinhart (2009) found
reliability of peer-reviews was fair and could find no evidence of systematic bias. In contrast,
a meta-analysis of inter-rater reliability of journal peer-reviews by Bornmann, Mutz and Daniel
(2010) found inter-rater reliability to be low (Cohen’s Kappa = 0.17). Marsh, Jayasinghe and
Bond (2008) have conducted one of the largest studies in this area. Analysing over 2,000 grant
applications submitted to the Australia Research Council, with a total of over 10,000 reviews,
they found reliability of peer-review scores to be low, with those from nominated reviewers
particularly problematic (a similar conclusion has recently been reached by Severin et al 2019
in their analysis of Swiss National Science Foundation grants). However, there was some

5
evidence that reviewers provided somewhat more reliable ratings of individual researchers than
of their grant proposals. Other studies have considered whether other elements of the grant
allocation process improves the consistency of funding decisions; for instance, Fogelholm et
al (2012) conclude that ‘panel discussion does not improve reliability of peer review for
medical research grant proposals’ while Obrecht, Tibelius and D’Aloisio (2007) state that
‘committee discussion and rating of proposals offered no improvement to fairness and
effectiveness over and above that attainable from the pre-meeting evaluations’.
This paper aims to add new empirical evidence to this literature via an analysis of peer-review
scores (and ultimate funding decisions) made by the Economic and Social Research Council
(ESRC) – the largest grant-awarding social science research funder in the UK. Specifically, I
analyse administrative data held by this body on over 4,000 research proposals, which have
received more than 15,000 peer-reviews, to address three specific issues.
First, how consistent are peer-reviews across different reviewers? In other words, how strongly
do the review scores awarded by reviewer A correlate with those from reviewer B? This in turn
provides new evidence on how much ‘noise’ there is in peer-reviews within what can be
considered a high-stakes setting (i.e. in determining the allocation of large amounts of public
money to different research projects).
Research Question 1. How consistent are peer-review scores across different peer
reviewers?
Second, an interesting feature of the peer-review procedure used by the ESRC is that applicants
can nominate some of their reviewers2. A similar approach is used by other research councils
in the UK (e.g. the Medical Research Council), other research funders (e.g. Leverhulme Trust)
and by some academic journals (e.g. the British Medical Journal – see Lomangino 2018 for a
discussion of recent controversy around this issue). Yet relatively little is known about whether
such nominated reviewers provide unbiased perspectives upon research proposals and the
extent that their comments influence the final funding decisions made. This paper will shed
new light on this important issue and, in turn, allow recommendations to be made about their
use in deciding the allocation of research funds.
2 The ESRC advises applicants that they should contact their nominated reviewers in advance to seek their permission. Other UKRI research councils, such as the Engineering and Physical Science Research Council, advise applicants not to contact their nominated reviewer in advance.

6
Research Question 2. Do nominated reviewers provide more positive scores than
independent reviewers? Do nominated reviewers provide useful, additional information
to the review process, over and above independent reviewers? To what extent do the
evaluations of nominated reviewers influence final funding decisions?
Finally, most academics will have faced a situation where their research paper or funding
proposal has seemingly been rejected due to a single negative review (despite positive
comments received from other reviewers). But how much power does a single reviewer really
have over the funding allocation decision? Can a single reviewer really stop a proposal that
otherwise received strong support receiving research funding? This paper will contribute new
evidence on this matter by investigating how the probability of receiving ESRC research
funding varies between proposals with and without a single negative peer review.
Research Question 3. To what extent does a single negative peer-review reduce the
probability of a favourable funding outcome?
To trail my key findings, I find only a weak association between the scores of different peer-
reviewers; correlations stand at around 0.2. There is consequently a lot of ‘noise’ in peer-
reviews. Yet the scores provided by peer-reviewers are strongly associated with the probability
of successfully obtaining a research grant, with positive peer-reviews seemingly a necessary
(but not sufficient) condition for an application’s success.
At the same time, nominated reviewers are found to almost always evaluate proposals highly.
Moreover, the scores they provide bare almost no relation to those from independent (i.e. non-
nominated) reviewers. The information provided by nominated peer-reviewers hence
potentially adds bias while doing little to reduce the noise. Consequently, the evidence suggests
that UK research funders should consider whether the other possible benefits of allowing
applicants to nominate reviewers (e.g. increasing buy-in to the grant allocation process)
outweighs the drawbacks.
Finally, I find evidence that a single negative review may undermine the funding prospects of
a proposal that has otherwise been evaluated highly. Specifically, a single negative review is
associated with up to a 30-percentage point decrease in the probability of receiving an ESRC
grant.
The paper now proceeds as follows. Section 2 provides an overview of the ESRC application,
peer-review and grant awarding process. This is followed in section 3 by a description of the

7
data and my empirical approach. Results are presented in section 4, with discussion and
conclusions following in section 5.
2. The ESRC peer-review and grant-awarding procedure
The ESRC has several funding streams, with some differences in the grant-awarding
procedures between them. The description provided in this section focuses upon the ‘Open
Call’ for research grants of up to one-million pounds (around a third of ESRC proposals go
through this scheme). Other schemes follow a broadly similar procedure, though with some
important differences at particular stages3.
Application and submission
For the ESRC Open Call, academics must first generate a project proposal. This includes a six-
page case for support, two-page ‘pathways to impact’ statement4, two-page justification of
resources and a set of statements (each of approximately 500 words) providing a non-academic
summary, research objectives, academic beneficiaries, impact summary, staff-duties and
ethical statement. The total length of a typical proposal, including each of the above, is hence
around 7,000 words (roughly the same length as a standard social science research paper).
The applicant will then submit their proposal to the ESRC. When doing so, they can choose to
nominate two academic reviewers and two ‘user’ reviewers (these individuals are not usually
academics but potential users of the research outcomes). General guidance about the suitability
of potential reviewers is provided by the UK research councils5, with individuals from the same
organisation (or with other potential conflicts of interest) to be avoided.
Peer-review
After some initial screening checks by the ESRC, the proposal is then sent out for peer-review.
This is usually done in batches of around five, in the expectation that the ESRC will receive
3 For instance, there is an interview stage for ESRC research centres, while awards for the Future Leaders / New Investigator grants are not only based upon the project proposal but also the applicant’s track record and academic potential. 4 This statement describes how applicants will ‘act to enable the research to connect with others and make a difference conceptually and instrumentally’. https://esrc.ukri.org/research/impact-toolkit/developing-pathways-to-impact/?_ga=2.152184825.1305920688.1553508319-271472340.1553508319 5 See nominated reviewer section of https://je-s.rcuk.ac.uk/handbook/index.htm

8
back three useable reviews. Reviewers are selected by ESRC case officers, who draw upon the
ESRC’s Peer Review college, personal knowledge and online databases to find suitable
individuals. The ESRC has a single-blind peer-review policy, with potential reviewers seeing
the name of the applicant and the project abstract before deciding whether to undertake the
review. Applicants, on the other hand, never find out the identity of reviewers. If the potential
reviewer agrees to complete the review, then the full proposal is sent to them.
The intention is that all proposals receive at least three peer-reviews, though occasionally some
proposals only receive two6. More than three reviews may be sought by the ESRC where this
is felt necessary to make a sound funding decision. This could be due, for instance, to a proposal
being inter-disciplinary, having a particularly complex component or where the written
comments provided were not sufficiently informative. The data used in this paper suggests that
four reviews is actually the modal number for Open Call proposals (46%), though three reviews
is also common (35%), while five (15%) and six or more (3%) is rare.
Reviewers of research proposals are asked to comment upon the following criteria:
• Originality; potential contribution to knowledge
• Research design and methods
• Value for money
• Outputs, dissemination and impact
For each of these areas, reviewers are also asked to indicate an appropriate score descriptor
using a six-point scale7. These scores are assumed to be a proxy for the content and tone of the
comments provided by a reviewer:
1. Poor
2. Fair/some weakness
3. Satisfactory
4. Good
5. Excellent
6. Outstanding
6 The database used in this paper suggests that receiving less than three reviews is rare. 7 For further details about this six-point scale, see page 3 of https://esrc.ukri.org/files/funding/guidance-for-peer-reviewers/faqs-for-peer-review-college-members/

9
They are also asked to provide an overall grade for the proposal using this six-point scale.
Proposals that score (on average) below 4.5 for the overall grade across reviewers are typically
rejected at this stage. However, this is not a hard rule, with some proposals scoring below 4.5
being referred to the Grant Assessment Panel (see below). Yet, in reality, very few Open Call
proposals with average peer-review scores below 4.5 get funded (just 3% - see section 3 for
further details). Applicants whose proposal achieve an average peer-review score above 4.5
then get an opportunity to write a two-page response to the reviewers’ comments. These
responses, along with the proposal and peer-reviews, are then referred to the Grant Assessment
Panel.
The Grant Assessment Panels (GAP)
The Grant Assessment Panels are groups of around 15-20 individuals, comprised mostly of
senior academics, though also a handful of research users8. Applications to become a GAP
member are opened on a regular basis, with the final decision about GAP composition made
by the ESRC. Members of the GAPs have a strong track record within their field, long-standing
experience of peer-review and knowledge of research exchange and impact. Social Science
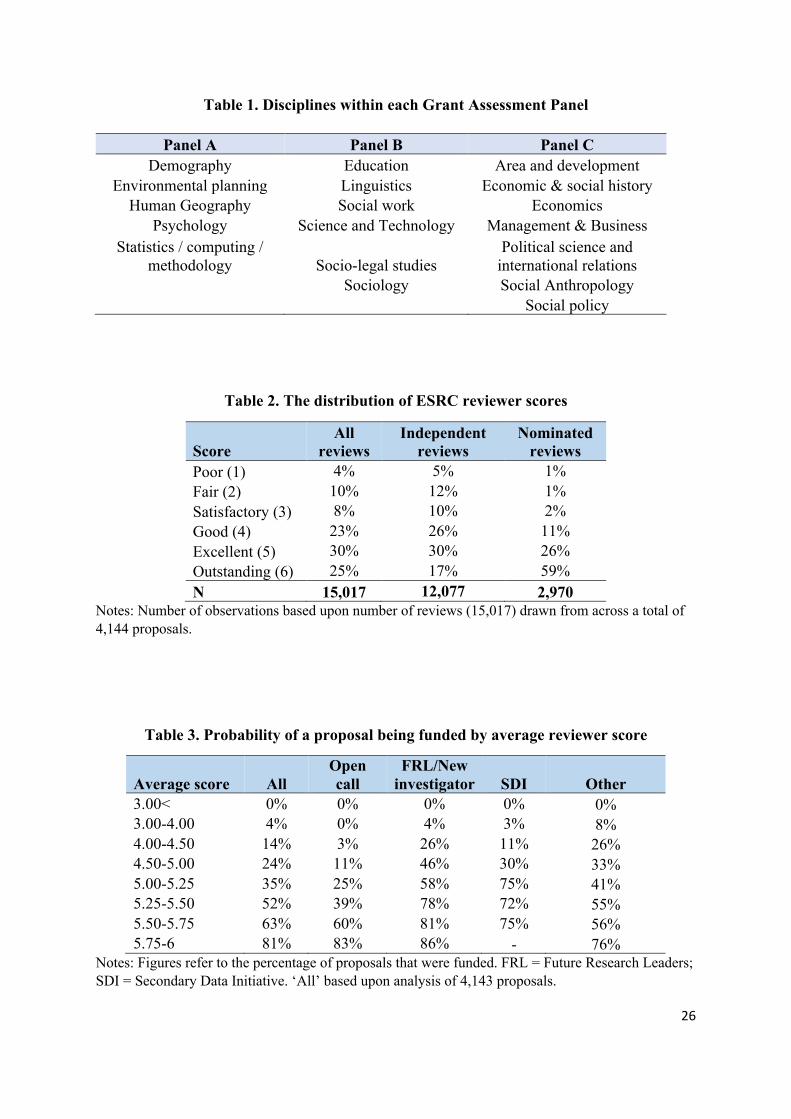
disciplines are organised into the three groups illustrated in Table 1, with a fourth panel (Panel
D) covering the ESRC’s Secondary Data Analysis research call.
<< Table 1 >>
Proposals are first sent to two GAP members (known as ‘introducers’) who review the
proposals, peer-review comments, applicant responses and overall scores. Based upon the peer-
reviews, their own opinion of the proposal and the response to the reviews provided by the
principal applicant, introducers rate each proposal using a ten-point scale9. Those proposals
with the highest introducer scores are then sent to other panel members before the next GAP
meeting (which occur three times a year).
At the GAP meeting proposals are discussed and a decision made as to whether the project is
‘fundable’. Proposals are then ranked in order of priority for funding, with this list then sent on
to the Grants Delivery Group.
8 The panel membership as of September 2018 can be found at https://esrc.ukri.org/files/about-us/governance-and-structure/membership-of-the-grant-assessment-panels/ 9 See https://je-s.rcuk.ac.uk/handbook/pages/IntroducerAssessment/ESRC_Introducer_Assessment_Guidance.htm

10
The Grants Delivery Group (GDG)
The GDG is comprised of the chairs of the four GAPs along with a member of the ESRC (who
act as the GDC chair). It represents the final step of the grant allocation process. The GDG
agree the final funding decision for each proposal, based upon recommendations made by the
GAP and the budget available.
At the end of the process, which typically takes 26 weeks or longer, applicants receive
comments on their proposal from the GAP outlining the rationale for their recommendation.
Note that the ESRC does not usually consider re-submission of the same proposal (it only does
so under exceptional circumstances and by invitation only). Hence the decision made by the
end of this process is usually final.
3. Data
The data used in this paper is drawn from administrative information routinely gathered by the
ESRC through their application management system. It covers grants where the initial
application was processed between the 2013/14 and 2018/19 financial years10. The total
number of funding proposals in the database provided by the ESRC was 6,653. This, however,
includes several proposals where there were no peer-review scores (either coded as missing or
N/A within the database). This analysis hence focuses upon the subset of applications where at
least one peer-review score was available. The final sample size is therefore 4,144 funding
proposals with a total of 15,047 reviews.
It should be noted that the database available for analysis only includes data pertaining to parts
of the grant decision making process outlined in section 2. They key pieces of information used
within the analysis are:
• The number of peer-reviews each proposal received
• Overall grade descriptor from each peer-reviewer (1 = poor to 6 = outstanding)
• Whether each reviewer was nominated by the applicant
10 Any grant application that involved the author (either as an applicant or as a reviewer) was also excluded from the database that the ESRC provided. Information for the 2018/19 financial year was partial as the data was received part way through this period.
11
• The final funding decision (although the database includes some information on the
stage the application progressed to, the focus in this paper is a simple binary measure
of whether funding for the grant was approved by the ESRC or not)
Other information included in the database, which will sometimes be controlled for within the
analyses, include the university of the principal applicant, the primary subject area of the
proposal and the funding stream (e.g. Open call, Future Research Leaders etc).
It is also worth noting what information is not included in the database. First, only overall peer-
review grades are available and not those for the separate sub-domains. Hence, although one
can investigate the consistency of overall peer-review scores, it is not possible to investigate
discrepancy in reviewers’ views about (for instance) value for money, research methodology
and potential impact and dissemination plans. Second, no data is available on the scores
awarded to proposals by ‘introducers’; the individuals who essentially link the peer-review
process to the Grant Assessment Panels (see section 2). This is unfortunate, as this information
would have allowed investigation of the role that introducers play in funding decisions,
including the influence that their scores/views have over and above those of the peer-reviewers.
Third, no data is available about the characteristics of peer-reviewers (or those who declined
to provide peer-reviews). Hence it is not possible to consider a range of potentially interesting
and important issues, such as who declines to provide a peer-review, potential conflicts of
interest and potential reviewer bias by selected characteristics (e.g. do the peer-review scores
of men/women depend upon the gender of their reviewer)? Finally, on a similar matter, no data
is available on the characteristics of applicants (e.g. gender, age, academic position). Hence it
is not possible to investigate how such factors are associated with peer-review scores and
whether they are related to the final funding decision made (e.g. are women more or less likely
to have their proposal funded than men, even after differences in review scores are taken into
account?).
Despite these limitations, important and interesting analyses remain possible with the data
available. To illustrate this point, this section concludes by presenting a set of simple (yet
previously unpublished) descriptive statistics about the ESRC peer-review scores.
Table 2 begins by documenting the distribution of overall peer-review scores, including
differences between nominated and ‘independent’ (i.e. non-nominated) reviewers. Overall,
around half of ESRC peer-reviews assigns one of the two top grades. On the other hand, only
12
around a fifth are rated as satisfactory (3) or below. There are, however, substantial differences
between independent and nominated reviewers. In particular, more than half (59%) of
nominated reviews awarded the top grade (‘outstanding’ – 6) which is over three-times more
than for independent reviews (17%). Likewise, very few nominated reviewers give a negative
review; just 4% say the proposal is satisfactory (3) or below, compared to 27% of independent
reviews. There is hence evidence that reviewers selected by applicants provide much more
favourable evaluations of research proposals.
<< Table 2 >>
Table 3 then illustrates the probability of a proposal being funded depending upon its review
score, with results presented separately by funding call. Focusing upon the Open Call, strong
peer-review scores are clearly necessary (though not sufficient) to obtain research funding.
Only proposals with a mean score of more than 5.5 were funded on more than 50% of
occasions. Indeed, even 20% of proposals with almost unanimously positive peer-reviews
(average scores between 5.75 and 6.0) did not go on to receive funding. At the other extreme,
proposals with an average peer-review score less than ‘excellent’ (5) have only a 15% chance
of being funded within the Open Call.
<< Table 3 >>
It is also interesting to note that the link between average review scores and the probability of
a bid being successful is stronger for some finding streams than others. For instance, almost
half of Future Research Leaders / New Investigator grants with an average review score
between 4.5 and 5.0 receive funding, which is much higher than within the Open Call (11%).
This may be due to Future Research Leaders / New Investigator grants being targeted at early-
career researchers, with the academic potential of the applicant (as well as the quality of the
research idea/proposal) part of the funding criteria. Alternatively, it could be that funding
panels are more forgiving to early-career researchers for having rough-edges to their proposals.
Regardless, Table 3 helps demonstrates that the importance of peer-review assessments varies
between the different ESRC funding streams.
4. Methodology
Consistency of peer-reviews

13
A set of descriptive statistics are used to illustrate the consistency of peer-review scores. First,
I simply cross-tabulate the scores awarded to proposals by the first two peer reviewers (with
analogous results for all pair-wise comparisons between all reviewers provided in Appendix
A)11. Second, the polychoric correlation between reviewer scores is calculated, providing a
single (yet widely understood) measure of agreement between different assessors1213. Third, a
well-known and often used measure of the internal consistency of a set of items (peer-review
scores in this setting) is Cronbach’s alpha (Streiner 2003). I will hence discuss the value of this
statistic when there are four or five reviewers. Fourth, weighted Kappa statistics are reported,
which attempt to establish whether the association between reviewer scores is better than could
be expected by chance14. Kappa values can vary between -1 (perfect disagreement) and +1
(perfect agreement), with 0 indicating that there is no agreement between reviewers (over and
above what could be expected by chance). The rules of thumb given by Landis and Koch (1977)
are used to aid interpretation of these results:
• Kappa = 0.01–0.20 = ‘slight’ agreement
• Kappa = 0.21–0.40 = ‘fair’ agreement
• Kappa = 0.41–0.60 = ‘moderate’ agreement
• Kappa = 0.61–0.80 = ‘substantial’ agreement
• Kappa = 0.81–0.99 = ‘almost perfect’ agreement
Finally, one can view the ESRC peer-review database as having a hierarchical structure, with
peer-reviews (level 1) nested within grant proposals (level 2). I exploit this fact to estimate a
multi-level (random-effects) model, separating out the variation in reviewer scores that occur
within grant proposals to variation that occurs between different grant proposals. This can be
summarised by the intra-cluster correlation (ICC), with larger values indicating less variation
11 ESRC peer-reviewers are assigned a number when they first complete a review. Reviewer numbers in the database provided have been sorted by this number. This is likely to mean that the first two peer-reviewers are likely to be more senior academics with a longer history of completing ESRC peer-reviews. I provide the cross-tabulation between just the scores awarded by reviewers 1 and 2 to provide a simple, widely understood flavour of the level of agreement. Appendix A provides cross-tabulations for all possible combinations of reviewers. 12 The polychoric correlations and kappa statistics presented have been calculated between each possible pair of reviewers. A weighted average of these correlations is then presented in the results tables (weighted by sample size). 13 Note that polychoric (rather than Pearson) correlation is used to account for the categorical nature of ESRC peer-review scores. This is a technique for estimating the correlation between two latent variables that are assumed to be continuous and normally distributed, based upon observed ordinal data. 14 Weighted Kappa statistics give more weight when disagreement between reviews is of increased gravity (cells are further away from the leading diagonal on the cross-tabulation). Hence a difference between two reviewers who score a proposal 5 and 2 is treated as lower agreement than two reviewers who score a proposal a 4 and 3. (Unweighted Kappa would treat these two situations equally).

14
within proposals and more between different proposals. In other words, a higher ICC will
indicate greater levels of agreement.
The influence of nominated reviews
To examine the influence nominated reviewers have upon funding outcomes, I exploit the fact
that many funding proposals (42%) were not evaluated by a nominated reviewer. This can
occur for several reasons, including (a) the grant applicant choosing to not nominate a reviewer;
(b) the ESRC not approaching a nominated reviewer and (c) the nominated reviewer not
responding to a review request.
Within this part of the analysis I focus upon proposals that received either three or four reviews;
these are the modal categories and proposals that receive a greater or fewer number of reviews
are somewhat unusual15. This reduces the number of grant proposals from 4,144 to 3,157.
Proposals falling within the following funding streams were then also dropped, due to either
almost no proposals or almost all proposals having at least one nominated reviewer:
• Secondary Data Initiative (n = 319)
• Education systems 2015/2016 (n = 96)
• Knowledge exchange open call (n = 71)
• NCRM methods projects (n = 51)
This leaves a final analytic sample of 2,620 proposals, most of which were submitted to the
ESRC open call (1,533).
Now say there are two grant proposals (A and B) which achieve equal peer-review scores (e.g.
6,6,5,5). However, one of the scores received by proposal A was from a nominated reviewer,
while proposal B received only independent reviews. It has already been shown how nominated
reviewers tend to provide generous review scores (see Table 2). Logically, it hence follows that
the evidence in favour of proposal B is stronger than the evidence in favour of proposal A. In
other words, obtaining a particular set of scores from only independent reviewers is more
challenging than getting the same set of scores from a mix of independent and nominated
reviewers. If this is routinely taken into account in grant awarding procedures (e.g. GAP
meetings) then one would anticipate that the likelihood of receiving funding would be lower if
15 Robustness tests have been conducted including (a) just focusing upon proposals with three reviews and (b) focusing upon proposals with between 3 and 6 reviews. This resulted in little change to the substantive conclusions reached.

15
a proposal had a nominated reviewer (conditional upon reviewer scores). In other words, one
should be able to observe a discount or downweighing if a nominated reviewer assessed a
proposal.
I operationalise this analysis through the following logistic regression model, estimated upon
a sample of 2,610 proposals that received either three or four peer reviews:
!"#$%(() = + + -./ + 0. 1234 + 5. 67$ + 8. 9:;<2=% + >. ?3@@ + A. B2C_9="42E (1)
Where:
F = A binary indicator of whether the proposal received ESRC funding (1) or not (0),
N = A dummy variable indicating whether at least one nominated reviewer evaluated the
proposal (1) or not (0).
Year = A vector of dummy variables indicating the financial year in which the funding
application was made.
Uni = A vector of university group dummy variables. These capture the difference between the
following university groups: Oxbridge, Golden Triangle, Other Russell Group, New
universities, 1994 group, other).
Subject = A set of dummy variables reflecting primary subject classification of the proposal.
Call = A set of dummy variables reflecting the specific ESRC funding call.
B2C_9="42E = A set of dummy variables capturing the scores awarded by all reviewers.
The coefficient of interest (-) illustrates the link between having a nominated reviewer and the
chances of receiving funding – conditional upon all reviewer scores. If the views of nominated
reviewers are discounted (or downweighed) when the final grant decisions are made (e.g. GAP
meetings) then one would anticipate this coefficient to be less than one (when expressed as an
odds ratio or a risk ratio). In other words, proposals with equal review scores should be less
likely to be successful when one of those evaluations has come from a nominated reviewer.
I then go on to consider whether it matters what score the nominated reviewer provides. For
instance, does one only gain a funding advantage if their nominated reviewer awards the
proposal the maximum score (relative to the counterfactual of not having a nominated reviewer
evaluate the proposal)? This is addressed by estimation of model (2):

16
!"#$%(() = + + -./ + 0. 1234 + 5. 67$ + 8. 9:;<2=% + >. ?3@@ + A. FC#_G7H (2)
Where:
N = A set of dummy variables. The reference group is no nominated reviewer. Dummy
variables are then added for where the nominated reviewer awarded the proposal a score of (a)
4 or less; (b) 5 and (c) 6.
FC#_G7H = A set of dummy variables capturing the average score the proposal received across
independent (non-nominated) reviewers.
The - coefficient from model (2) thus illustrate how much advantage is gained by receiving a
given nominated reviewer score (relative to not having a nominated reviewer evaluate the
proposal) given that the proposals were submitted in the same financial year, from the same
type of university, within the same subject area, to the same funding call and rated as of equal
overall quality by independent reviewers. Note that, if nominated reviewers are simply ignored
when ESRC panel members make funding decisions (i.e. introducers and GAP members) one
would anticipate that these - coefficients would be close to one (when presented as an odds or
risk ratio).
Appendix B tests the robustness of the conclusions reached by tackling the problem in a
different way. Specifically, it considers whether proposals with equal scores from independent
reviewers differ in their funding probabilities depending upon whether it was evaluated by a
nominated reviewer. The substantive conclusion reached from this robustness test is consistent
with the key findings presented in the following section.
To what extent does a single negative review reduce the chances of a positive outcome?
My final aim is to estimate the power that a single reviewer has over the final funding outcome;
to what extent does a single negative peer-review reduce a proposal’s chance of success? This
is a particularly important issue in this context where reviewers are not blinded – they know
exactly who the applicants are. Hence, if a single negative review has a substantial impact upon
the outcome, then unscrupulous reviewers could use their power to undermine a proposal from
an applicant that they do not like. Moreover, given the noise and inconsistency of opinions
across peer-reviewers (see Table 2) receiving a single negative review is to some extent a
matter of chance. The goal of this analysis will hence be an attempt to estimate the

17
counterfactual; how much more likely would it have been that my grant application would have
been funded, had I not received that one negative review?
To begin, I simply compare the funding outcomes of proposals with four positive reviews to
proposals with three positive and one negative review. The issue with this approach is that the
proposal with the single negative review could genuinely be of lower quality than the proposal
with four positive reviews. It is hence likely that this comparison will provide an upper-bound
for the impact of a sole negative review.
To try and overcome this issue, I draw upon the fact that one can almost guarantee nominated
reviewers will provide a positive review (recall Table 2). I then compare the funding outcomes
of proposals that received:
• Two strong independent plus one strong nominated review versus proposals with two
strong and one weak independent review.
• Three strong independent plus one strong nominated review to proposals with three
strong and one weak independent review.
The intuition behind this approach is that, had a nominated reviewer been assigned instead of
the weak independent reviewer, then the proposal would have almost certainly received four
strong reviews. In other words, these proposals received the same number of positive responses
from independent reviewers, the only reason they differ is because one proposal was evaluated
by a nominated reviewer while the other proposal was not. I argue that this is hence likely to
get closer to the true effect of a single negative review.
A series of robustness tests are conducted in Appendix C, where the chief advantage is a larger
sample size. The key findings are consistent with the results reported below.
5. Results
Consistency of peer-reviews
Table 4 presents cross-tabulations between the scores awarded by the first two reviewers of
each proposal, with panel (a) including all reviewers and panel (b) comparing the scores of the
first nominated and first independent reviewers. All figures refer to column percentages. For
instance, amongst those proposals that reviewer 1 graded as outstanding (6), 26% of the second
reviewers also awarded a 6, 35% awarded a 5 (excellent), 21% a 4 (good) and 17% a 3
(satisfactory) or below.

18
<< Table 4 >>
The overall message to be taken from these cross-tabulations is that the association between
reviewer scores appears to be quite weak. In particular, the scores assigned by reviewer 2 are
typically only slightly higher if reviewer 1 provided a higher score. This is particularly the case
in panel (b) for the association between the scores given by independent and nominated
reviewers. The bottom row of panel (b) reinforces this point by demonstrating how the average
scores awarded to proposals across independent reviewers are only slightly higher when
nominated reviewers score a proposal 4 (average independent score 4.09), 5 (4.26) or 6 (4.38).
Table 5 formalises this finding by presenting the overall summary measures of consistency
described in the methodology section. The correlation between reviewer scores is low, standing
at around 0.2 – even if one restricts the analysis to just independent reviewers. This correlation
falls to just 0.07 when comparing the scores awarded by independent and nominated reviewers,
indicating that they are barely associated at all. Similarly, Kappa statistics are all well-below
0.2 which, according to the rules of thumb provided by Landis and Koch (1977), mean that
there is only ‘slight’ agreement between reviewers. Meanwhile, the Kappa statistic for the link
between independent and nominated reviewer scores is 0.03; this is no better than one would
expect purely by chance. Meanwhile, the intra-cluster correlation (ICC) stands at around 0.17;
the vast majority (83%) of the variation that occurs in peer-review scores occurs within
proposals while relatively little (17%) occurring between proposals. Finally, Cronbach’s alpha
stands at 0.44 for the internal consistency between four reviewers and 0.48 for five reviewers16.
This suggests that, even when a proposal receives five peer-reviews (which is rare)17, internal
consistency is low; on the boundary of the ‘poor’ and ‘unacceptable’ classifications often used
to interpret Cronbach’s alpha in the literature (see Streiner 2003).
<< Table 5 >>
Together, these results demonstrate that there are only low levels of agreement (and hence a
great deal of noise) in the scores awarded by ESRC peer-reviewers. This is consistent with the
findings from previous research into the consistency of peer-reviews (Bornmann, Mutz and
Daniel 2010). The very low levels of agreement between independent and nominated reviewers
16 These figures increase marginally to 0.48 (four reviewers) and 0.53 (five reviewers) when nominated reviewers are excluded. 17 In total, 8% of proposals (across all funding calls) receives two reviews, 43% three reviews, 33% four reviews, 12% five reviews and 4% six or more reviews.

19
does not help this situation. Indeed, the results presented in Tables 4 and 5 suggest that
nominated reviewers may actually increase (rather than reduce) the noise in the peer-review
process. Meanwhile, inconsistent use of nominated reviewers (some proposals receive a
nominated review while others do not) may inadvertently introduce bias into the funding
decisions made.
The influence of nominated reviews
One may be less concerned about the inconsistency between nominated and independent
reviewers, and the disproportionately high scores awarded by nominated individuals, if this is
taken into account in other parts of the grant-awarding process. This begs the question, to what
extent do nominated reviewers influence final funding outcomes? Results from the logistic
regression model used to investigate this issue are presented in Table 6.
<< Table 6 >>
The key finding is that the estimated odds ratio sits almost exactly on one. This suggests that
there is no discount/downweighing placed upon the views expressed by nominated reviewers;
proposals with equal review scores are just as likely to be funded regardless of whether a
nominated reviewer provided one of the assessments or not. In other words, the scores (and
hence presumably also the review comments) provided by nominated reviewers are treated no
differently than those provided by independent reviewers – despite them generally being much
more favourable (recall Table 2). This consequently means that there is a substantial advantage
to having a nominated reviewer judge one’s grant application as they are disproportionately
likely to strongly support the proposal.
Table 7 takes this analysis a step further by illustrating how the odds of receiving funding varies
by the score that the nominated reviewer gave (compared to not having a nominated reviewer).
Estimates are conditional upon the average score awarded by the independent reviewers and a
set of background controls (funding stream, financial year, university type and primary subject
classification).
<< Table 7 >>
As already noted in Table 2, just 15% of nominated reviewers award scores of 4 (good) or
below. However, a proposal that receives such a score from a nominated reviewer has less
chance of being funded than proposals where no nominated reviewer assessed the application.

20
Specifically, the estimated odds ratio is 0.29 (risk ratio 0.35), meaning that the small number
of proposals that do not receive strong endorsement from their nominated reviewer are much
less likely to be awarded funding than those proposals without a nominated review.
At the other extreme, a nominated review score of 6 (which Table 2 illustrated is awarded by
almost 60% of nominated reviewers) provides a major boost to the funding probability. The
estimated odds-ratio is 2.53 (risk ratio 1.89) suggesting that proposals receiving a nominated
review score of 6 are almost twice as likely to be awarded the grant than proposals without a
nominated reviewer (over and above the scores given by independent reviewers). In other
words, the probability of a proposal being funded increases from around 20% to around 40%.
On the other hand, a nominated review score of 5 (excellent) is somewhat neutral, not
appreciably increasing or decreasing the probability of success (in comparison to not having a
nominated reviewer).
In summary, having one’s proposal reviewed by a nominated reviewer is strongly associated
with a positive funding outcome – as it almost guarantees applicants will receive at least one
strong review - with no evidence that these are treated any differently from independent
reviews when the final funding decisions are made. Hence, not only are nominated reviewers
disproportionately likely to provide very positive reviews, their comments/scores have the
same influence upon funding outcomes as those derived from another source (i.e. independent
reviewers).
To what extent does a single negative review reduce the chances of a positive outcome?
To begin, I restrict the analysis to proposals with four reviews. I then compare the funding
outcomes of proposals with:
(a) Four strong reviews (minimum of 5,5,5,5)
(b) Three strong reviews (minimum of 5,5,5) and one weak review (maximum of 3)
The results are presented in Table 8, with large differences in funding success rates observed.
Specifically, there is a difference of 34 percentage points; 56% of proposals with four positive
peer-reviews go on to be funded compared to 22% of proposals with a single weak review.
Although this is likely to be an upper bound on the impact of a single negative review, the
difference in funding success rates are nevertheless substantial.
<< Table 8 >>

21
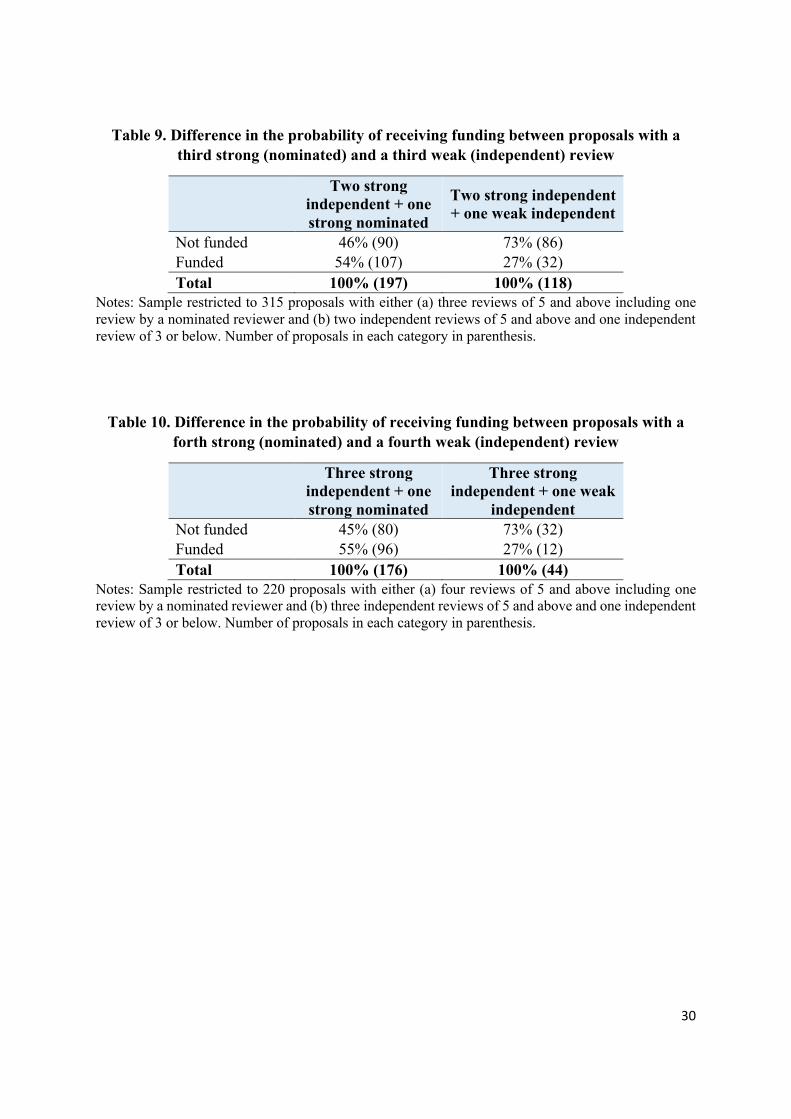
Table 9 provides a similar comparison, though now focusing upon proposals with:
(a) Two strong independent reviews and one strong nominated review
(b) Two strong independent reviews and one weak independent review
The intuition behind this approach is that, were the final weak independent review under (b)
replaced by a nominated reviewer, then these proposals would have achieved a very similar set
of scores.
<< Table 9 >>
There is again a substantial difference in the chances of these proposals being funded –
approximately 27 percentage points. In particular, there is a 54% chance that a proposal with
three strong reviews (two independent and one nominated) is funded compared to a 27%
chance for a proposal that received two strong and one weak independent review. The results
in Table 10 replicate this analysis for proposals that received a total of four reviews. Despite
the small sample size, a similar difference (28 percentage points) is observed. The robustness
tests conducted in Appendix C, where the sample size is larger, is consistent with this result.
Consequently, there is strong evidence that each individual reviewer has quite a lot of power
over the final funding decision, with just one negative review seriously denting the chances of
a positive outcome.
<< Table 10 >>
6. Conclusions
Peer-review has a central role within academia. It is the main quality assurance process that
research papers are subjected to prior to publication. Similarly, peer-review is an important part
of the process that determines the allocation of research funds in several countries. In the UK,
this not only includes peer-review of grant proposals conducted by almost every research
funder, but also the allocation of core government funding distributed based upon the results
of the Research Excellence Framework. Yet the limitations of peer-review are well-known
(Smith 2006), with some even arguing that a lottery would be a better way to allocate scientific
research funds (Roumbanis 2019).
This paper has attempted to contribute to this literature by undertaking the first large-scale
analysis of the peer-reviews and funding decisions made by the biggest grant-awarding social
science research funder in the UK (the Economic and Social Research Council). In doing so, it

22
adds new evidence on the (in)consistency of the evaluations provided by peer-reviewers, as
well as considering potential issues with grant applicants nominating some of their own
reviewers. Similarly, most academics will have experienced a situation where their proposal
receives a single negative review (while otherwise being evaluated positively). Yet little
previous research has considered the extent that a single negative review reduces the
probability of a positive outcome. This paper hence makes this contribution to the existing
evidence base.
The results suggest that there is a great deal of inconsistency (and hence a lot of noise) in the
opinions offered by different peer-reviewers. The correlation between the scores of two
independent reviewers is only around 0.2, with around 80% of the variation in peer-review
scores occurring within (rather than between) proposals. There is also evidence that allowing
applicants to nominate some of their reviewers (a practise that is common amongst several UK
research funders and some academic journals) may introduce additional noise into the grant-
awarding process, given their tendency to provide positive peer-reviews. Specifically,
nominated reviewers have around a 60% chance of awarding a proposal the top score
(compared to a 17% chance for independent reviewers) with this then significantly increasing
the chances that the grant is awarded (relative to proposals that were not evaluated by a
nominated reviewer).
Finally, there is evidence that a single negative review substantially reduces the chances of an
otherwise positively-evaluated proposal getting funded. Specifically, a single negative review
reduces the chances of a positive funding outcome by up to 30 percentage points.
What, then, do these results imply for policy and practise? There may be a few basic steps that
could be put into place that might improve the peer-review and grant awarding process in the
UK. In particular, the combination of only a single (rather than double) blind review process
and the ability to nominate reviewers appears problematic. The former means that perspective
reviewers know exactly whose proposal they are reviewing, which clearly has the potential to
introduce bias. Academics are only human and may (either consciously or sub-consciously)
provide overly favourable responses to individuals they may know and like, and unfavourable
responses to those that they don’t. Yet, as shown in this paper, this would then have a significant
impact upon the final funding decision reached. Likewise, the latter (nominated reviewers)
have been shown to provide scores that essentially bare no relationship with the scores of
independent reviewers, with a clear tendency to provide much more positive responses. They

23
hence potentially add bias to the peer-review process without reducing noise. Indeed, a similar
result obtained by Marsh, Jayasinghe and Bond (2008) led the Australian Research Council to
end their use of nominated reviewers more than a decade ago.
Yet this paper may also provide the stimulus for a much more radical re-think about how public
money is allocated to research, including the substantial costs of the current approach. There
are large opportunity costs to writing lengthy grant proposals, which often entail as much work
as the production of at least one additional research paper. Given that roughly four in every
five proposals the ESRC receives is rejected, this potentially represents a significant amount
of research output lost. Indeed, the Royal Swedish Academy of Sciences estimated that the
total amount of time spent on grant writing in Sweden in 2010 that did not have any direct
results equated to approximately sixty lost years of academic research (Roumbanis 2019).
There are, of course, limitations to this paper, with a great deal more work needed upon grant
allocation mechanisms and peer-review. First, this paper has focused upon peer-review in
research funding (rather than of academic papers) and been specific to a single funder. Future
work may hence seek to generalise the results presented to further settings. Second, I have
focused upon overall consistency of peer-review in terms of final grades. Yet it would be
interesting to consider levels of (dis)agreement between different components of funding
proposals – such as methodology, dissemination plans and value for money. Likewise, further
work should seek to investigate how each of these components is related to the final funding
decision made. Third, this paper has not investigated issues such as potential conflicts of
interest and who decides to turn down opportunities to review (e.g. to what extent are
nominated reviewers more likely to respond positively to review requests than independent
reviewers). Likewise, I have not been able to investigate potential bias in reviews (e.g. do
female applicants receive better or worse review scores if their application is assessed by a
woman or man) or in final grant applications (e.g. are women less likely to be awarded grants
than men even when they are awarded equal peer-review scores). Clearly, these are important
areas ripe for further research. Fourth, this paper has used quantitative analysis only. Yet the
actual comments provided by reviewers are equally (or potentially more) important, as are the
GAP meetings where funding recommendations are made. Future mixed-methods research into
grant-allocation procedures is hence critical in order to gain a more holistic picture. Finally, it
is important to recognise that it is not possible to reach any firm conclusions about whether the
eventual funding decisions made were ‘correct’. Indeed, such statements are unlikely to ever

24
be possible, given the necessary uncertainty, risk and unforeseen circumstances involved in
academic research.
References
Bornmann, L.; Mutz, R. and Daniel, H-D. (2010) A reliability-generalization study of journal peer reviews: A multilevel meta-analysis of inter-rater reliability and its determinants. PLoS ONE 5(12):e14331.
Fogelholm, M.; Leppinen, S.; Auvinen, A.; Raitanen, J.; Nuutinen, A. and Vaananen, K. (2012) Panel discussion does not improve reliability of peer review for medical research grant proposals. Journal of Clinical Epidemiology 65:47–52
Jerrim, J. and De Vries, R. (2015) The limitations of quantitative social science for informing public policy. Evidence & Policy 13(1): 117-133.
Justice AC, Cho MK, Winker MA, Berlin JA, Rennie D, the PEER investigators. (1998) Does masking author identity improve peer review quality: a randomised controlled trial. JAMA 280: 240-2
Landis, J. and Koch, G. (1977) The measurement of observer agreement for categorical data Biometrics 33 (1): 159-174.
Lomangino, K. (2018) Uncovering new peer review problems – this time at The BMJ. Accessed 02/04/2019 from https://www.healthnewsreview.org/2018/04/uncovering-new-peer-review-problems-this-time-at-the-bmj/
McNutt RA, Evans AT, Fletcher RH, Fletcher SW. (1990) The effects of blinding on the quality of peer review. A randomized trial. JAMA 263: 1371-6
Marsh, H.W.; Jayasinghe, U.W. and Bond, N.W. (2008) Improving the peer-review process for grant applications: Reliability, validity, bias, and generalizability. American Psychologist 63:160–168.
Mayo, N.; Brophy, J.; Goldberg, M.; Klein, M.; Miller, S.; Platt, R. and Ritchie, J. (2006) Peering at peer review revealed high degree of chance associated with funding of grant applications Journal of Clinical Epidemiology 59 (8): 842-848.
Obrecht M.; Tibelius K, and D’Aloisio G. (2007) Examining the value added by committee discussion in the review of applications for research awards. Research Evaluation 16: 70–91
Pier, E.; Brauer, M.; Filut, A.; Kaatz, A.; Raclaw, J.; Nathan, M.; Ford, C. and Carnes, M. 2018. Low agreement among reviewers evaluating the same NIH grant applications. Proceedings of the National Academy of Sciences 115(12): 2952-2957.
Reinhart, M. (2009) Peer review of grant applications in biology and medicine. Reliability, fairness, and validity. Scientometrics 81:789–809.
Roumbanis, L. (2019) Peer review or lottery? A critical analysis of two different forms of decision-making mechanisms for allocation of research grants Science, Technology and Human Values https://doi.org/10.1177/0162243918822744

25
van Rooyen S, Godlee F, Evans S, Smith R, Black N. (1998) Effect of blinding and unmasking on the quality of peer review: a randomised trial. JAMA 280: 234-7
van Rooyen S, Godlee F, Evans S, Black N, Smith R. (1999) Effect of open peer review on quality of reviews and on reviewers' recommendations: a randomised trial. BMJ 318: 23-7
Severin, A.; Martins, J.; Delavy, F.; Jorstad, A.; Egger, M. (2019) Potential bias in peer review of grant applications at the Swiss National Science Foundation. Accessed 02/04/2019 from https://peerj.com/preprints/27587/
Smith R. (2006) Peer review: a flawed process at the heart of science and journals. Journal of the Royal Society of Medicine 99(4): 178–182.
Streiner, D. (2003) ‘Starting at the beginning. An introduction to coefficient Alpha and internal consistency’, Journal of Personality Assessment 80(1): 99–103.
26
Table 1. Disciplines within each Grant Assessment Panel
Panel A Panel B Panel C Demography Education Area and development
Environmental planning Linguistics Economic & social history Human Geography Social work Economics
Psychology Science and Technology Management & Business Statistics / computing /
methodology Socio-legal studies Political science and
international relations Sociology Social Anthropology Social policy
Table 2. The distribution of ESRC reviewer scores
Score All
reviews Independent
reviews Nominated
reviews Poor (1) 4% 5% 1% Fair (2) 10% 12% 1% Satisfactory (3) 8% 10% 2% Good (4) 23% 26% 11% Excellent (5) 30% 30% 26% Outstanding (6) 25% 17% 59% N 15,017 12,077 2,970
Notes: Number of observations based upon number of reviews (15,017) drawn from across a total of 4,144 proposals.
Table 3. Probability of a proposal being funded by average reviewer score
Average score All Open call
FRL/New investigator SDI Other
3.00< 0% 0% 0% 0% 0% 3.00-4.00 4% 0% 4% 3% 8% 4.00-4.50 14% 3% 26% 11% 26% 4.50-5.00 24% 11% 46% 30% 33% 5.00-5.25 35% 25% 58% 75% 41% 5.25-5.50 52% 39% 78% 72% 55% 5.50-5.75 63% 60% 81% 75% 56% 5.75-6 81% 83% 86% - 76%
Notes: Figures refer to the percentage of proposals that were funded. FRL = Future Research Leaders; SDI = Secondary Data Initiative. ‘All’ based upon analysis of 4,143 proposals.

27
Table 4. Cross-tabulation between the scores of reviewer 1 and reviewer 2
(a) All reviewers
Reviewer 1 score 2 3 4 5 6
Reviewer 2 score
2 26 20 13 11 10 3 10 10 11 9 7 4 25 26 26 24 21 5 25 28 33 33 35 6 14 16 18 22 26
Total % 100% 100% 100% 100 100 Total N 624 358 1,056 1,240 857
(b) Independent and nominated review scores
Nominated reviewer 4 5 6
Independent reviewer 1
2 16 16 14 3 10 7 10 4 27 30 29 5 34 32 28 6 13 15 20
Total % 100 100 100 Total N 184 470 874
Average independent review score 4.09 4.26 4.38
Notes: Scores below 4 not presented for nominated reviewers due to small cell size. Average independent review score is the average score across all non-nominated reviewers.

28
Table 5. Measures of agreement between reviewers
Any two reviewers
Two independent
reviewers
One independent and one nominated reviewer
Polychoric correlation 0.17 0.19 0.11 Weighted Kappa 0.10 0.12 0.05 Intra-cluster correlation 0.17 0.18 -
Note: Intra-cluster correlation treats reviews as nested within grant proposals and includes all reviews. The polychoric correlations and weighted Kappa statistics have been calculated across all possible pairs of reviewers. The final values of the polychoric correlation and Kappa statistics is the average across these different combinations (weighted by sample size).
Table 6. The probability of receiving ESRC funding, conditional upon all reviewer scores
Model 1 Odds-ratio SE Had a nominated reviewer 0.99 0.15 Controls Funding call Y Year dummies Y University group Y Subject Y Scores of all reviewers Y
Notes: Estimates based upon a logistic regression, controlling for funding call, year of application, university group, subject and the scores received from all reviewers (both nominated and independent). Sample restricted to proposals that received either 3 or 4 reviews. Funding calls included in the analysis were the ESRC open call, Future Research Leaders / New Investigator, GCRF, DFID co-funded and other. Analysis based upon 2,610 funding proposals.

29
Table 7. The probability of receiving ESRC funding by the score given by the nominated reviewer
Odds-ratio SE No nominated reviewer (ref group) Score below 5 0.29 0.09 Score between 5 - 5.99 1.26 0.22 Score 6 2.53 0.38 Controls Funding call Y Year dummies Y University group Y Subject Y Average scores independent reviewers Y
Notes: Estimates based upon a logistic regression, controlling for funding call, year of application, university group, subject and the average score the proposal received from ‘independent’ (i.e. not nominated) reviewers. Sample restricted to proposals that received either 3 or 4 reviews. Funding calls included in the analysis were the ESRC open call, Future Research Leaders / New Investigator, GCRF, DFID co-funded and other. Analysis based upon 2,610 funding proposals.
Table 8. The association between receiving a single negative review and the probability of a successful funding application. Comparison of proposals with 4 strong reviews to
those with 3 strong and 1 weak review.
Four strong reviews
Three strong and one weak review
Not funded 44% (88) 78% (127) Funded 56% (114) 22% (35) Total 100 (202) 100 (162)
Notes: Sample restricted to 364 proposals with four reviews, and with at least three of the reviewers awarding a score of a 5 or 6. The reference group comprises of proposals that received a score of 5 or 6 from all four reviewers. The group of interest (one negative review) received a score of 5 or 6 from three reviewers, and a score of 3 or less from the other reviewer. Number of proposals in each category in parenthesis.
30
Table 9. Difference in the probability of receiving funding between proposals with a third strong (nominated) and a third weak (independent) review
Two strong
independent + one strong nominated
Two strong independent + one weak independent
Not funded 46% (90) 73% (86) Funded 54% (107) 27% (32) Total 100% (197) 100% (118)
Notes: Sample restricted to 315 proposals with either (a) three reviews of 5 and above including one review by a nominated reviewer and (b) two independent reviews of 5 and above and one independent review of 3 or below. Number of proposals in each category in parenthesis.
Table 10. Difference in the probability of receiving funding between proposals with a forth strong (nominated) and a fourth weak (independent) review
Three strong
independent + one strong nominated
Three strong independent + one weak
independent Not funded 45% (80) 73% (32) Funded 55% (96) 27% (12) Total 100% (176) 100% (44)
Notes: Sample restricted to 220 proposals with either (a) four reviews of 5 and above including one review by a nominated reviewer and (b) three independent reviews of 5 and above and one independent review of 3 or below. Number of proposals in each category in parenthesis.

31
Appendix A. Cross-tabulations between all pairs of reviewers
Review 1 and reviewer 2
Reviewer 1 2 3 4 5 6
Reviewer 2
2 26 20 13 11 10 3 10 10 11 9 7 4 25 26 26 24 21 5 25 28 33 33 35 6 14 16 18 22 26
Total 100 100 100 100 100 N 624 358 1,056 1,240 857
Review 1 and reviewer 3
Reviewer 1 2 3 4 5 6
Reviewer 3
2 24 18 12 9 9 3 11 11 9 8 5 4 23 24 26 25 20 5 24 24 31 33 34 6 18 23 22 25 31
Total 100 100 100 100 100 N 565 323 983 1152 797
Review 1 and reviewer 4
Reviewer 1 2 3 4 5 6
Reviewer 4
2 20 11 13 10 12 3 8 9 7 5 4 4 21 19 18 23 18 5 26 23 26 26 23 6 25 38 36 37 42
Total 100 100 100 100 100 N 311 167 504 608 460

32
Review 1 and reviewer 5
Reviewer 1 2 3 4 5 6
Reviewer 5
2 13 4 7 9 4 3 4 7 3 3 5 4 18 17 18 17 18 5 21 24 28 27 24 6 45 48 45 44 49
Total 100 100 100 100 100 N 101 46 174 186 158
Review 2 and reviewer 3
Reviewer 2 2 3 4 5 6
Reviewer 3
2 21 17 13 10 9 3 10 13 9 7 7 4 27 24 27 21 21 5 24 26 32 33 32 6 17 20 19 29 30
Total 100 100 100 100 100 N 554 358 917 1200 791
Review 2 and reviewer 4
Reviewer 2 2 3 4 5 6
Reviewer 4
2 18 12 14 13 8 3 8 4 9 3 7 4 20 28 18 20 19 5 28 22 24 26 24 6 26 34 35 38 42
Total 100 100 100 100 100 N 295 170 473 650 462

33
Review 2 and reviewer 5
Reviewer 2 2 3 4 5 6
Reviewer 5
2 10 9 9 5 8 3 8 3 3 3 4 4 23 14 21 16 15 5 24 31 17 29 25 6 34 43 50 46 48
Total 100 100 100 100 100 N 86 58 146 224 151
Review 3 and reviewer 4
Reviewer 3 2 3 4 5 6
Reviewer 4
2 22 17 15 11 6 3 9 5 7 4 5 4 17 27 22 19 19 5 23 23 24 29 24 6 29 28 32 36 45
Total 100 100 100 100 100 N 270 151 449 617 562
Review 3 and reviewer 5
Reviewer 3 2 3 4 5 6
Reviewer 5
2 12 7 8 8 5 3 3 7 5 4 3 4 17 30 17 16 17 5 29 30 17 27 26 6 40 27 54 45 48
Total 100 100 100 100 100 N 101 44 133 198 189

34
Review 4 and reviewer 5
Reviewer 4 2 3 4 5 6
Reviewer 5
2 10 10 8 9 5 3 7 6 3 3 3 4 21 24 19 20 12 5 27 20 26 24 26 6 35 40 44 44 54
Total 100 100 100 100 100 N 86 50 129 172 228

35
Nominated reviewer and independent reviewer 1
4 5 6
Independent Reviewer 1
2 16 16 14 3 10 7 10 4 27 30 29 5 34 32 28 6 13 15 20
Total 100 100 100 N 184 470 874
Nominated reviewer and independent reviewer 2
Nominated reviewer 4 5 6
Independent Reviewer 2
2 17 16 13 3 11 9 10 4 32 25 23 5 29 34 33 6 10 15 21
Total 100 100 100 N 191 468 956
Nominated reviewer and independent reviewer 3
Nominated reviewer 4 5 6
Independent Reviewer 3
2 13 14 13 3 13 8 8 4 29 25 23 5 29 34 34 6 16 18 22
Total 100 100 100 N 171 421 799

36
Nominated reviewer and independent reviewer 4
Nominated reviewer 4 5 6
Independent Reviewer 4
2 26 19 14 3 5 6 9 4 31 27 23 5 19 30 33 6 19 19 21
Total 100 100 100 N 98 226 433
Nominated reviewer and independent reviewer 5
Nominated reviewer 4 5 6
Independent Reviewer 5
2 35 17 12 3 5 4 7 4 25 30 22 5 25 38 37 6 10 11 22
Total 100 100 100 N 20 47 121

37
Appendix B. The link between nominated reviewers and funding outcomes. Robustness test.
Logistic regression is used to compare differences in funding outcomes between proposals that
were and were not evaluated by at least one nominated reviewer. Specifically, the first logistic
regression model is specified as:
!"#$%(() = + + -./ + 0. 1234 + 5. 67$ + 8. 9:;<2=% + >. ?3@@ (1)
Where:
F = A binary indicator of whether the proposal received ESRC funding (1) or not (0),
N = A dummy variable indicating whether at least one nominated reviewer evaluated the
proposal (1) or not (0).
Year = A vector of dummy variables indicating the financial year in which the funding
application was made.
Uni = A vector of university group dummy variables. These capture the difference between the
following university groups: Oxbridge, Golden Triangle, Other Russell Group, New
universities, 1994 group, other.
Subject = A set of dummy variables reflecting primary subject classification of the proposal.
Call = A set of dummy variables reflecting the specific ESRC funding call.
The parameter of interest from model (1) is -. This illustrates whether proposals which were
evaluated by at least one nominated reviewer were more likely to get funded than proposals
that did not receive a nominated review. Estimates will be presented as odds-ratios within
results tables, with probability differences and risk-ratios presented in the text.
One of the limitations with model (1) is that applicants who nominate reviewers (or where the
ESRC approaches a nominated reviewer) could write stronger grant proposals than those who
do not. In other words, proposal quality is an omitted variable from model (1) which could
confound the results. Consequently, a second specification of this model is estimated where an
additional control is added for the average score the proposal received across all ‘independent’

38
(i.e. non-nominated) reviewers. For instance, for a proposal that received three independent
reviews and one nominated review, this variable will capture the average grade awarded by the
three independent reviewers18. Hence this model attempts to control for a comparable measure
of research quality across proposals with and without nominated reviewers. Formally, the
second model is specified:
!"#$%(() = + + -./ + 0. 1234 + 5. 67$ + 8. 9:;<2=% + >. ?3@@ + A. FC#_G7H (2)
Where:
FC#_G7H = A set of dummy variables capturing the average score the proposal received across
independent (non-nominated) reviewers.
Estimates are presented in Appendix Table B1. The results from the first model specification
illustrate that proposals that received at least one nominated review were more likely to receive
funding than those proposals that did not receive a nominated review. The estimated odds-ratio
is 2.28 (risk-ratio 1.92) meaning that proposals that received a peer-review from a nominated
reviewer were around twice as likely to have their funding application accepted. This is a
substantial difference, increasing the probability of winning an ESRC grant from around 15%
to around 30%.
Results from the second specification suggests that some of this association is due to proposals
that received a nominated peer-review generally being of higher quality. Once the scores of
independent reviewers have been controlled, the odds-ratio falls to 1.52 (risk ratio 1.41). This
nevertheless remains a substantial and statistically significant difference, with proposals that
are reviewed by at least one nominated reviewer being around 40% more likely to receive
ESRC funding (even when independent reviewers have awarded the proposal the same score).
18 For another proposal that received four independent reviews, this variable will take the average across all four reviews.

39
Table B1. The probability of receiving ESRC funding by whether the proposal was assessed by at least one nominated reviewer
Model 1 Model 2 Odds-ratio SE Odds-ratio SE Had a nominated reviewer 2.28 0.27 1.52 0.2 Controls Funding call Y Y Year dummies Y Y University group Y Y Subject Y Y Average scores independent reviewers - Y
Notes: Estimates based upon a logistic regression, controlling for funding call, year of application, university group and subject. Model 2 additionally controls for the average score the proposal received from ‘independent’ (i.e. not nominated) reviewers. Sample restricted to proposals that received either 3 or 4 reviews. Funding calls included in the analysis were the ESRC open call, Future Research Leaders / New Investigator, GCRF, DFID co-funded and other. Analysis based upon 2,610 funding proposals.

40
Appendix C. Robustness tests for the impact of a single negative review
To begin I restrict the sample to proposals with at least three reviews19. I then compare the
probability of successfully receiving funding for proposals that received three ‘positive’
reviews from reviewers 1, 2 and 320 (defined as a review score of either 5 or 6) to those that
received two ‘positive’ and one ‘negative’ review (defined as a score of 3 or below) from
reviewers 1, 2 and 3. In summary, the two groups being compared are:
• Proposals with three positive reviews (minimum of 5,5,5) from reviewers 1,2 and 3.
• Two positive reviews (minimum of 5, 5) and one negative review (maximum of 3) from
reviewers 1, 2 and 3.
There remain some limitations with this approach. In particular, proposals that receive a
negative review could genuinely be of lower quality than those proposals that receive
unanimously positive reviews. Two approaches are used to tackle this issue.
First, logistic regression models are estimated that include controls for various markers of
proposal quality and some background characteristics (e.g. subject area, funding call).
Importantly, this includes controls for (a) whether the proposal was evaluated by a nominated
reviewer; (b) the average score awarded to the proposal by those who gave it a ‘positive’ score21
and (c) the scores the proposal received from further reviewers (reviewers 4 and 5) where
additional reviews were received. Together, this should illustrate the impact that otherwise
positively evaluated proposals are affected by a single negative review.
Table C1 illustrates the probability of success for those with (a) three positive reviews (a
minimum score of 5,5,5 from reviewers 1,2 and 3) and those with (b) two positive (minimum
score of 5,5) and one negative (maximum score of 3) reviews from reviewers 1, 2 and 3.
19 This is the minimum number of reviews the ESRC usually requires. Proposals with two or fewer reviews can therefore be considered somewhat atypical. 20 Reviewers are assigned a unique number the first time they complete an ESRC review. The reviewer number on the database provided by the ESRC then corresponds to this unique reviewer number, with “reviewer 1” being the individual with the lowest unique value. As new reviewers are assigned higher unique numbers, it is likely that reviewers 1, 2 and 3 are likely to be more senior academics, with more experience of conducting ESRC peer-reviews, than reviewers 4 and 5. This also means that reviewers 1, 2 and 3 are more likely to be independent reviewers and reviewers 4 and 5 nominated reviewers. 21 This essentially controls for differences in the probability of receiving the top score (a six) between the two groups.

41
Table C1. The association between receiving a single negative review and the probability of a successful funding application
Three positive reviews from reviewers 1,2,3
Two positive and one negative review from reviewers 1,2,3
Not funded 49% (362) 80% (451) Funded 51% (378) 20% (113) Total 100% (740) 100% (564)
Notes: OR refers to odds-ratio and SE the standard error. Sample restricted to proposals that received at least three reviews. Three positive reviews refer to proposals that received scores of 5 or 6 from reviewers 1,2 and 3. Two positive and one negative review refers to scores that received a 5 or 6 from two of the first three reviewers and a score of 1, 2 or 3 from the other reviewer. Based upon an analysis of 1,304 proposals where at least two out of reviewers 1, 2 and 3 awarded a score of a 5 or 6.
There is clearly a substantial difference in the probability that such proposals get funded.
Around half (51%) of proposals with three positive reviews from reviewers 1, 2 and 3 get
funded, compared to a fifth (20%) of those with a single negative review. This represents a
large, statistically significant gap of around 30 percentage points.
Of course, part of this difference could be due to genuine differences in research proposal
quality (i.e. the person who gave the single negative review to a proposal could be correct).
Table C2 hence presents results from a set of logistic regression models which attempt to
control (as far as possible) for this issue, along with a set of other potential background
differences between proposals. Importantly, including additional controls for whether the
proposal had a nominated reviewer (model 2), the scores received from the positive reviewers
(model 3) and the scores awarded by subsequent reviewers (model 4) does not alter this result.
Specifically, the odds-ratio remains stable at around 0.25 (risk ratio = 0.39) throughout the
various model specifications. This therefore strengthens the evidence that a single negative
peer review can significantly reduce the probability that a proposal gets funded.

42
Table C2. The association between receiving a single negative review and the probability of a successful funding application
Model 1 Model 2 Model 3 Model 4 Model 5 OR SE OR SE OR SE OR SE OR SE One negative review amongst reviews 1,2 and 3 0.24 0.03 0.24 0.03 0.23 0.03 0.24 0.03 0.19 0.03
Controls Had nominated reviewer - Yes Yes Yes Yes Average score across reviewers 1, 2 and 3 - - Yes Yes Yes Reviewer 4 and 5 scores - - - Yes Yes Funding call - - - - Yes Financial year - - - - Yes University group - - - - Yes Subject - - - - Yes
Notes: OR refers to odds-ratio and SE the standard error. Sample restricted to proposals with at least three reviews, and with at least two of reviewers 1/2/3/ awarding a score of a 5 or 6. The reference group comprises of proposals that received a score of 5 or 6 from reviewers 1/2/3. The group of interest (one negative review from reviewers 1, 2 or 3) received a score of 5 or 6 from two of the three, and a score of 3 or less from the other reviewer. Reviewer 4 and 5 scores enter the model as categorical (dummy) variables and include a category for missing data (i.e. the proposal did not receive scores from a fourth / fifth reviewer). Models 1 and 2 based upon 1,304 funding proposals. Proposals with more than 5 reviewers dropped from the analysis in models 3, 4 and 5, with the sample size falling to 1,226 proposals.