peer and leadership effects in academic and athletic ... · additionally, we find evidence of...
TRANSCRIPT
1
Peer and Leadership Effects in Academic and Athletic
Performance
May 2, 2007
Scott E. Carrell* Dartmouth College
Richard L. Fullerton*
USAF Academy
Robert N. Gilchrist* Adams State College
James E. West* USAF Academy
Abstract: Many previous peer effects in higher education studies have assumed that peer groups form at the roommate, dorm floor, or dorm-level. Random assignment of students into squadrons at the US Air Force Academy allows us to identify the peer group with which students spend a majority of their time interacting. Using the squadron as the peer group, we find peer effects of much larger magnitude than those found in the previous literature. In separate estimations, we find for freshman students, a 100-point increase in the peer group average SAT verbal score increases individual GPA by 0.45 grade points and a 1-point increase in peer group GPA increases individual GPA by 0.65 grade points. Our results demonstrate the critical importance of properly identifying the relevant peer group when estimating peer effects. As evidence of this, we find that geographic proximity of students in dorm halls alone, as in Foster (forthcoming), does not generate measurable peer effects. We also find smaller peer effects at the roommate level, which virtually disappear once we control for the squadron-level peer effects. Our models correct for the endogeneity of individual and peer outcomes and rule out “common shocks” as the mechanism driving the peer effects.
The views expressed in this article are those of the authors and do not necessarily reflect the official policy or position of the
United States Air Force, Department of Defense, or the U.S. Government.
JEL Classifications: Z13
Key Words: Peer Effects * Carrell: Department of Economics, Dartmouth College, 301 Rockefeller Hall, Hanover, NH, 03755 (e-mail: [email protected]); Fullerton and West: Department of Economics and Geography, USAF Academy, 2354 Fairchild Hall, USAFA, CO 80840 (e-mail: [email protected] & [email protected]); Gilchrist: Department of Chemistry,
Computer Science, and Mathematics, Adams State College, 208 Edgemont Blvd. Alamosa, CO 81102. Special thanks goes to USAFA personnel: Col William Carpenter, Rolland Stoneman, Kathleen O’Donnell, Jau Tsau, and Kate Carson for their assistance in obtaining the data and background information required for this project. Thanks also go to Doug Staiger, Bruce Sacerdote, Andrew Samwick, Pascaline Dupas, Josh Angrist, Caroline Hoxby, Larry Katz, Omari Swinton, Changhui Kang, and all other participants at the NBER Summer Institute, Western Economic Association Annual Meetings, and Dartmouth College seminar for their helpful comments and suggestions.
2
I. Introduction
Justification for education policy decisions such as integration, busing, school choice, ability
grouping, and affirmative action in admissions are predicated upon the assumption of large
positive peer effects in educational outcomes. To date, the most convincing studies, in which
students have been randomly assigned to roommates or classrooms have typically found only
very small, positive, and nonlinear peer effects (see Sacerdote, 2001; Zimmerman, 2003; Hoxby
& Weingarth, 2006; and Stinebrickner & Stinebrickner, 2006). In two recent studies, Foster
(forthcoming) and Lyle (forthcoming) find little evidence of peer effects in academic
performance at the University of Maryland and U.S. Military Academy respectively. Both draw
into question the very existence of peer effects in higher education academic achievement.
These studies have typically assumed peer group formation at the roommate, dorm floor, or
dorm level.1 But evidence suggests that college students quickly establish networks of friends
and study partners that extend beyond the roommate, dorm floor, or dorm level (Stinebrickner &
Stinebrickner, 2006). To the extent this is true, works in the previous literature have likely
underestimated the total magnitude of peer effects, as the influence of peers who reside outside
these more narrowly measured groups would be omitted.
Previous works estimating peer effects in higher education typically report estimates from
reduced form models in which own academic performance is a function of exogenous
characteristics of peers (Sacerdote, 2001; Zimmerman, 2004; Kremer & Levy, 2003; Foster,
forthcoming; Lyle, forthcoming; Stinebrickner & Stinebrickner, 2006). Reduced form estimates
are useful in testing for the presence of peer effects, whether those effects be via the preexisting
1 The one notable exception is Lyle (forthcoming) who estimates peer effects at the U.S. Military Academy (USMA). However, as we discuss later in the text, the USMA sorts individuals into peer groups based on pre-treatment characteristics, which results in a potentially large negative selection bias in his estimates.
3
ability or attributes of peers, as Manski (1993) calls exogenous peer effects, or via the
simultaneous performance of peers, as Manski (1993) calls endogenous peer effects. However,
unless reduced form coefficients are decomposed into properly identified structural parameters, it
is not possible to discern between exogenous and endogenous peer effects. Lyle (forthcoming)
notes that contemporaneous models of peer effects, which regress individual performance on the
performance of peers using ordinary least squares, are subject to large positive biases in the
presence of common shocks to the group.
The statistical properties of our data set enable us to identify with much greater precision the
known peer group and correct for common shocks. Conditional on a few demographic
characteristics2, students at the United States Air Force Academy (USAFA) are randomly
assigned to one of 36 squadrons. The students of a squadron live in adjacent dorm rooms, dine
together, compete in intramural sports together and perform military training together. As a
result, the squadron to which an individual student belongs, made up of roughly 120 students
(freshmen to seniors), comprise the peer group in which a student spends a vast majority of
his/her time. As students have no ability to influence the squadron into which they are placed,
self-selection is not present. In addition, the USAFA collects copious amounts of demographic
data and high school performance data on all students during their admission process. This data
enables us to identify structural equations and estimate contemporaneous peer effects using 2
stage least squares (2SLS). Since 2SLS purges endogenous explanatory variables of any
endogeneity, our results are robust with respect to common shocks to the group (Lyle,
forthcoming).
2 Females, minorities, athletes, and students who attended a military preparatory school are randomly sorted into squadrons first, to ensure diversity across squadrons
4
Using the squadron as the peer group, we find peer effects of much larger magnitude than
those found in the previous literature. For freshman students, our models estimate that a 1-point
increase in peer grade point average (GPA) increases individual GPA by 0.65 grade points on a
scale of 0.0 to 4.0. Additionally, we find evidence of positive leadership effects from the
upperclassmen “supervisors” within the squadron. A 1-point increase in the junior class GPA
within a squadron increases individual freshman GPA by 0.23 grade points. Both the peer and
leadership effects from the freshman year continue into the sophomore year after reassignment to
a new squadron, providing evidence of persistence in the effects. We also find similar results in
athletic performance.
In contrast, we find only moderate evidence of peer influence at the roommate level, as
previously found by Sacerdote (2001) and Zimmerman (2003). Furthermore, the roommate peer
effects disappear when the broader squadron level peer performance is included as an
explanatory variable. We view this result as empirical evidence of the importance of properly
identifying the relevant peer group when estimating peer influence.
The remainder of the paper proceeds as follows. Section II reviews the challenges in
measuring peer effects and describes the evaluation strategy used in this paper. Section III
describes the squadron system at the USAFA. Section IV presents the data and its relevance for
the measurement of peer effects. Section V presents the reduced form results. Section VI
presents the 2SLS results and discusses robustness. Section VII concludes.
II. Measuring Peer Effects
Manski (1993) distinguishes three types of peer influence: 1) endogenous effects, 2)
exogenous effects, and 3) correlated effects. Endogenous effects occur when individual behavior
varies with the behavior of the group. Exogenous or contextual effects occur when individual
5
behavior varies with the pre-treatment group characteristics. Finally, correlated effects are those
driven by common treatments. For example, in college academic achievement measured by a
GPA, the endogenous effects are those that vary with the average GPA performance of the peer
group. Exogenous effects are those that vary with the socio-economic status or the high school
performance of the peer group. Correlated effects are those that are driven by common shocks,
such as teachers or dorm room quality.
Measuring the importance of each of these effects is difficult for two main reasons. First, it
is difficult to separate out the individual and group influence on one another (Vidgor & Nechyba,
2004). This problem is often referred to as the endogeneity problem (Moffitt, 2001; Sacerdote,
2001) or the reflection problem (Manski, 1993). The second issue in measuring peer influence
occurs because individuals tend to self-select into peer groups. In the presence of self-selection,
it is difficult to distinguish the peer effects from the selection effects (Sacerdote, 2001).
The endogeneity problem is typically handled by finding suitable instruments for peer
behavior that are exogenous with respect to the stochastic error component of the dependent
variable. A more recent strategy in the education peer effects literature has used previous peer
achievement as an instrument for current achievement (Betts & Zau, 2004; Burke & Sass, 2004;
Hanushek, et al., 2003; Vidgor & Nechyba, 2004).
The selection problem has been handled in two main ways. A first strategy (widely used in
the primary education peer effects literature) is to exploit the variation across classrooms or
cohorts within a school (see Hoxby & Weingarth, 2006; Vidgor & Nechyba, 2004; Betts & Zau,
2004; Burke & Sass, 2004; Hanushek, et al., 2003). This has typically been accomplished using
large administrative panel data sets while employing a series of fixed effects models. The second
strategy, used by a growing literature measuring peer effects in higher education, is to exploit
6
situations where individuals are randomly assigned to peer groups (Boozer & Cacciola, 2001;
Foster, forthcoming; Sacerdote, 2001; Zimmerman, 2003; Lyle, forthcoming).
In this paper, we use the random assignment of USAFA students to squadrons as the main
source of identification of peer effects. Our analysis provides several new insights compared to
the previous literature. First, the randomization process at the USAFA allows us to measure peer
effects at multiple peer group levels: roommate pairs, classmates within the same squadron, and
upper classmen within the squadron. Second, our vast amount of exogenous pre-treatment data
allows us to correct for endogeneity. Third, reassignment to new squadron peer groups in the
sophomore year allows us to test for the persistence in the peer effects over time. Finally, we
measure peer effects in both academic and athletic outcomes.
We estimate peer effects using two separate approaches; reduced form equations, and two-
stage least squares. In the first approach, we regress individual outcomes on pre-treatment
variables to avoid simultaneous equation bias or the reflection problem. We use a variety of
own, roommate, peer (other freshmen in squadron), and upperclassmen pre-treatment variables.
Freshman GPA is presumed to be exogenous with respect to such variables as SAT scores (both
math and verbal), academic composite (to include high school GPA, class rank, quality of
school, size of school), fitness scores, and leadership composite scores required for entry to
USAFA. Our specification uses the linear-in-means model common to the peer effects literature.
While we recognize the potential policy limitations of linear-in-means models (Hoxby &
Weingarth, 2006; Weinberg, 2005), we use it to identify the average peer effect across our entire
population.
In our second set of specifications, we identify the endogenous peer effect by specifying the
freshman GPA as a function of roommate, peer (other freshmen), freshman GPA of current
7
upperclassmen, and own pre-treatment variables. We estimate these equations using two-stage
least squares (2SLS) as in Foster (forthcoming) and Hoxby & Weingarth (2006) with all
roommate, squadron level peer, and upper class average pre-treatment and demographic
characteristics as first stage regressors. This methodology allows us to use all the pre-treatment
characteristics of the group to identify how individual performance varies with the average
performance of the peer group corrected for the effects of common shocks to the group.
In general, we find strong, robust peer effects of much larger magnitude than those found in
previous studies. We credit this to randomized peer group formation, the copious amounts of
data that USAFA keeps on all students, and the nature of the squadron structure, which allows us
to cleanly identify the group of possible peers for freshman students.
III. The Air Force Academy Squadron and Rank Structure: A Natural Experiment
The Air Force Academy is a fully accredited undergraduate institution of higher education
with an approximate enrollment of 4,200 students. There are 32 majors offered including the
humanities, social sciences, basic sciences, and engineering. The average SAT for the 2005
entering class was 1309 with an average high school GPA of 3.60 (Princeton Review, 2006).
Applicants are selected for admission on the basis of academic, athletic, and leadership potential.
In addition, applicants must receive a nomination from a legal nominating authority including
Members of Congress, the Vice President, or President of the United States, and other related
sources. All students attending the Air Force Academy receive 100% scholarship to cover their
tuition, room, and board. Additionally, each student receives a monthly stipend of $845 to cover
books, uniforms, computer, and other living expenses. All students are required to graduate
8
within four years3 and serve a five-year commitment as a commissioned officer in the United
States Air Force following graduation.
Students are grouped in 36 squadrons, each comprised of approximately 120 students.
Students of a squadron live in adjacent dorm rooms, dine together, compete in intramural sports
together and perform military training together. Members of each squadron perform various
leadership roles within the squadron based on their relative seniority (freshman, sophomore,
junior, or senior class).4 For their first 7 months in the academy (from September through the
end of March), freshman students are not allowed to enter the premises of another squadron.
Hence, interaction with students from other squadrons is extremely limited for the freshman.5 At
the start of the sophomore year, each student is reassigned to a new squadron and remains in that
squadron for the remaining three years. This practice originated in response to the 1965 USAFA
cheating scandal as an attempt to break up peer groups.6
Overall, significant amounts of social, academic, athletic, and leadership interactions take
place early and often within each squadron. This forms a solid foundation to measure the “total
peer effect” (Sacerdote, 2001) or total social influence for each individual. In theory, any
3Special exceptions are given for religious missions, medical “set-backs”, and other instances beyond the control of the individual. 4 Upperclassmen within the squadron act as the military training instructors, called cadre, during “basic cadet training” and serve in various leadership roles throughout the academic year. The seniors are the “leaders.” Their primary role is to “develop” the juniors, “shape” the sophomores, and “inspire” the freshmen. The juniors are the “workers” within the squadron. Their primary role is to “develop” the sophomores and “train” the freshmen. In practice, the juniors supervise the freshmen within the squadron. The sophomores are the “role models” within the squadron and act as mentors and “coach” the freshmen. Finally, the freshmen are the “followers” and “learn and live loyalty” and “lead by example” (ODS, 2004). 5 Students are intermixed during academic classes and can meet with students from other squadrons at the library, gym, church, and what would be considered the student union. Additionally, freshman students who are on intercollegiate athletic teams or participate in club sports are intermixed with students from other squadrons during practice times and on team trips. 6 See Malmstrom (2006) for further details.
9
member of the squadron could potentially help a freshman student with his/her coursework. As
freshman students are junior, probationary members of a squadron, we would expect the primary
peer group of freshman students to be that of other freshman students within the same squadron.
However it is plausible that more senior members of a squadron could provide academic
assistance as well as being mentors and leaders to the freshmen.
Measuring peer effects among USAFA students is made easy by the way the Academy splits
students between squadrons. Upon admission, conditional on a few demographic characteristics,
freshman students are randomly assigned to a squadron, and randomly assigned to a roommate
within their squadron. This structure creates a natural experiment for estimating peer influence.
The overwhelming majority of entering students do not know anybody currently enrolled at
USAFA. Sibling students are deliberately separated. The appointment process, by which each
member of the U.S. Congress and Senate nominate candidates from their congressional district
or state, insures geographic diversity.
As freshman roommate and squadron assignments are accomplished without any input from
freshman students, self-selection into squadrons is not a concern. In attempting to develop an
ability to work with peers of all abilities and backgrounds, USAFA does not ask any questions of
incoming students as to their likes, dislikes, or roommate preferences. One might argue that the
effect the institution is trying to achieve in bypassing student preferences (and, fortunately for us,
self-selection bias) is a behavioral model similar to the Rainbow model outlined in Hoxby &
Weingarth (2006) where students benefit from interacting with all types of peers.
Students are re-assigned to a new squadron at the start of their sophomore year and remain
in that squadron for the next three years. This feature of the USAFA system enables us to test
for the persistence of freshman peer effects on sophomore performance. It must be noted,
10
however, that at the onset of their sophomore year, students with a 3.5 or greater cumulative
freshman GPA (approximately 16 percent of all students) or a cumulative freshman military
performance average (MPA) of 3.15 or greater (approximately 17 percent of all students) are
randomly assigned to a sophomore squadron first. This mechanism ensures a relatively even
spread of the top performers across all 36 squadrons.7 To correct for this sorting mechanism, we
employ control variables similar to Sacerdote (2001), Zimmerman (2003), and Lyle
(forthcoming).8
IV. Data
The Dataset
Data on students’ pre-Academy characteristics and on their performance while at the
Academy were provided by USAFA Institutional Research and Assessment and de-identified by
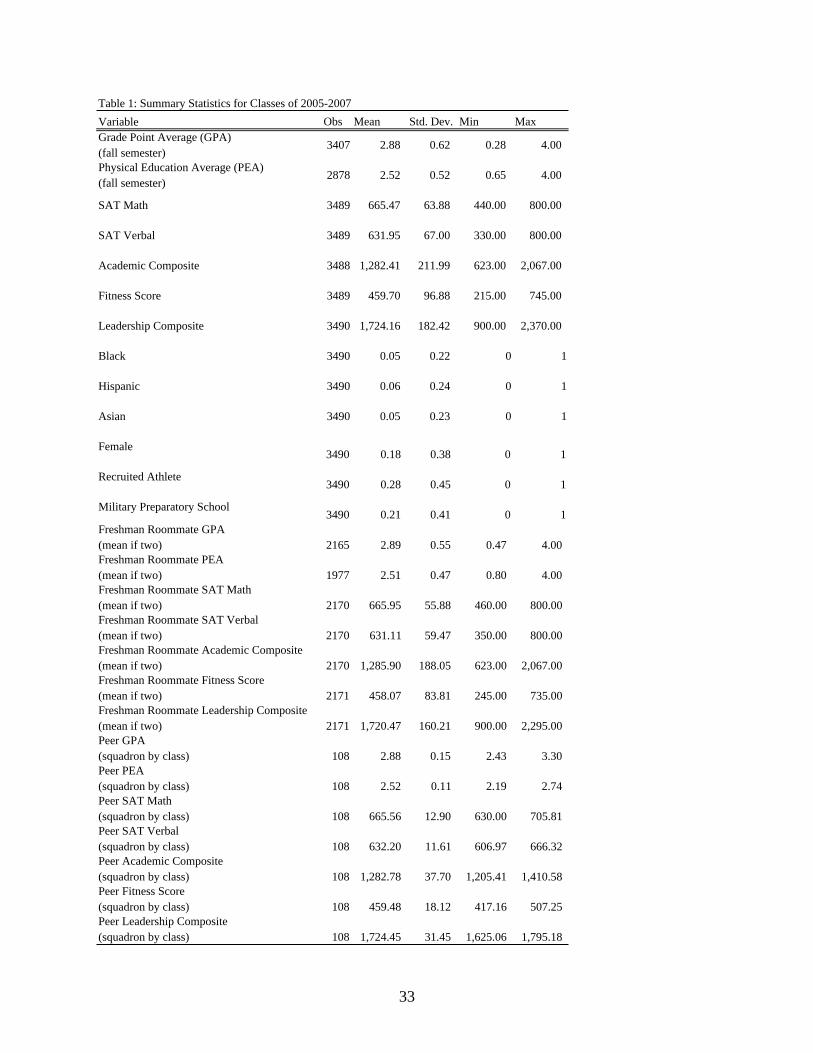
the USAFA Institutional Review Board. A complete list of summary statistics is provided in
Table 1.9
Our dataset includes all students in the graduating classes of 2000 through 2007. Eighteen
percent of the sample is female, 5-percent is black, 6-percent is Hispanic and 5-percent is Asian.
Twenty-seven percent are recruited athletes and 2-percent attended a military preparatory school.
Seven-percent of students at USAFA have a parent who graduated from a service academy and
17-percent have a parent who served in the military.
7 The mechanism of spreading high ability members across squadrons in the sophomore year has the effect of reducing the variance in ability across squadrons. 8 A full discussion of our data and potential selection bias is conducted in the data section of the study. 9 As fully discussed in the next section, due to concerns with potential non-random placement of students into squadrons prior to the class of 2005, the summary statistics provided only include the graduating classes of 2005-2007.
11
Pre-Academy (pre-treatment) data includes whether students were recruited as athletes,
whether they attended a military preparatory school, and measures of their academic, athletic and
leadership aptitude. Pre-treatment academic aptitude is measured through SAT verbal and SAT
math scores and an academic composite computed by the USAFA admissions office, which is a
weighted average of an individual’s high school GPA, class rank, and the quality of the high
school attended. The sample mean SAT math, SAT verbal, and academic composite are 665,
643, and 1282 with respective standard deviations of 64, 67, and 212. The measure of pre-
treatment athletic aptitude consists of a score on a fitness test (fitness score), required by all
applicants prior to entrance.10 The sample mean fitness score is 460 with a standard deviation of
97. The measure of pre-treatment leadership aptitude is a leadership composite computed by the
USAFA admissions office, which is a weighted average of high school and community activities
(e.g., student council offices, Eagle Scout, captain of sports team, etc.). The sample mean
leadership composite is 1,724 with a standard deviation of 183.
Our outcome performance data contains each individual’s freshman and sophomore
academic and athletic performance as measured by a grade point average (GPA) and a physical
education average (PEA).11 Both the GPA and PEA are computed on a zero to 4.0 scale. The
GPA comprises traditional academic coursework, while the PEA consists of scores on a physical
fitness test (pull-ups, long jump, sit-ups, push-ups, and a 600-yard run), time on an aerobic
fitness test (1.5 mile run), and grades in physical education courses.
10 The fitness score measures timed scores in pull-ups, sit-ups, push-ups and a 600-yard shuttle run, in addition to a standing long jump and a basketball throw. 11 Students also earn a military performance average (MPA); however, we do not use this measure because military performance is primarily determined within the squadron through peer and leadership evaluations (i.e., room inspections, squadron scores in marching, etc.).
12
GPA is a consistent measure of academic performance across all students in our sample,
since students at USAFA spend their entire freshman year taking required core courses and do
not select their own coursework. The USAFA Registrar generates the fall semester academic
schedules for the freshmen without any input from the affected students (the one exception is the
choice of the foreign language requirement). Students have no ability to choose their professors.
Core courses are taught in small sections of 20-25 students, with students from all squadrons
mixed across classrooms. Faculty teaching the same course use an identical syllabus and give
the same exams during a common testing period. This institutional characteristic assures there is
no self-selection of students into courses or towards certain professors.
Are Squadron and Freshman Roommate Assignment Truly Random?
We obtained the algorithm that placed students into squadrons for the classes of 2005
through 2007 from the USAFA Admissions Office.12 The algorithm prevents siblings as well as
students within the same graduating class or with the same last name from being placed in the
same squadron. Additionally, females, minorities, athletes, and students who attended a military
preparatory school are randomly sorted into squadrons first, to ensure diversity across squadrons.
The rest of the students, however, are then randomly assigned to a squadron. Of prime
importance to our study is that students are indeed not placed into squadrons or with (freshman)
roommates based on pre-treatment performance. For each graduating class, we test for
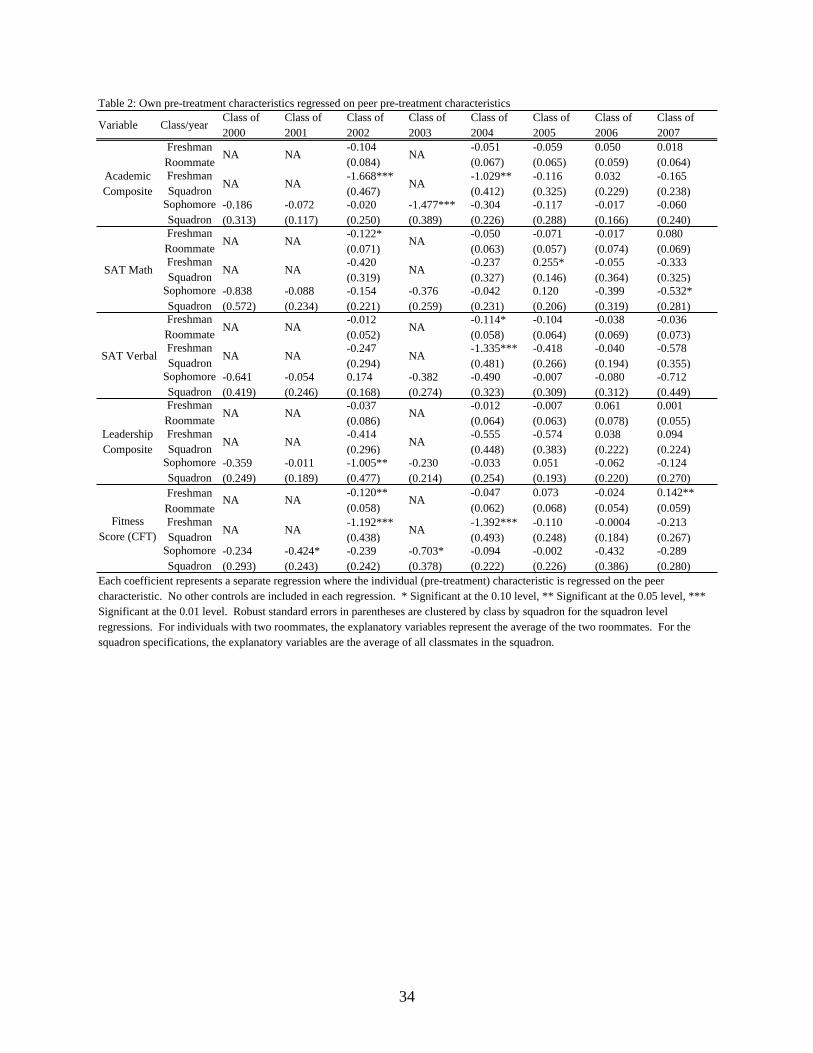
randomness in the squadron and roommate assignments in Table 2, which shows how individual
12 We have been unable to obtain the algorithm that placed students into squadrons prior to the class of 2005. However, we were informed that the algorithm was rewritten starting in 2000 when the admissions office migrated from a Unisys to an Oracle-based system. The timing of the migration from Unisys to Oracle is consistent with the observed changes in squadron selection bias between the classes of 2004 and 2005. Officials in the USAFA Admissions Office acknowledge the possibility of minor changes being implemented to the sorting algorithm when it was migrated from Unisys to Oracle, and that such changes could have been implemented without office memoranda documenting such a change.
13
pre-treatment characteristics are correlated with roommate and squadron pre-treatment
characteristics (academic composite, SAT math, SAT verbal, fitness score, and leadership
composite).
Freshman squadron placements were unavailable for the graduating classes of 2000, 2001,
and 2003; therefore, results for these classes only include sophomore squadron assignments. We
were not able to find any official USAFA records for freshman roommate assignment; however,
using a log of issuing and returning dorm room keys, we were able to successfully match
approximately 2/3 of freshman students as roommates. We considered individuals as roommates
if students were issued a key to the same room for a minimum of 2 overlapping months.
The negative and highly significant coefficients on the freshman squadron peer academic
and peer athletic composite variables for the classes of 2002 and 2004 indicates a negative
selection effect on freshman squadron placements during these years (Table 2). These results
suggest that USAFA personnel may have sorted students into squadrons based on pre-treatment
characteristics during these years with the intention of balancing each squadron’s overall
academic and/or athletic ability. Sophomore squadron placements appear to have the same
negative selection for the class of 2003 (Table 2). This negative selection, which reduces or
eliminates exogenous variation in pre-treatment characteristics across groups, would lead to
negatively biased peer effects estimates.13
There appears to be little evidence of squadron selection effects in the data for the classes of
2005 through 2007, with all but one selection coefficient statistically insignificant at the 0.05-
13 Lyle (forthcoming, p.19) notes, “It is possible that the scrambling process reduces the variation in average pretreatment ability measures to the extent that no effect is identifiable.”
14
level (Table 2).14 At the roommate level, the one exception is a positive and significant
coefficient on the roommate fitness score for the class of 2007, indicating a potential positive
selection of roommates on athletic ability. However, this positive coefficient diminishes and is
statistically insignificant when including a squadron fixed-effect, indicating that within
squadrons, where roommates are assigned, there appears to be no positive selection.
Based on these findings and the absence of specific information regarding the squadron
assignment process prior to the class of 2005, we restrict our sample to the classes 2005 through
2007. By doing so, we ensure that there is adequate exogenous variation in the mean pre-
treatment characteristics across peer groups.
V. Reduced Form Estimates
Method
We begin by analyzing the peer and leadership effects using the traditional reduced form
linear-in-means model where we regress individual outcomes on roommate and peer pre-
treatment characteristics. Specifically, we estimate the following equation for academic
performance:
(1) iscisc
sc
ik
ksc
r
isciscX
n
X
XGPA ++++=1
210,
14 At the 0.10-level, SAT math is positive and significant for the class of 2005 and negative and significant at the 0.10-level for the class of 2007. However, with 45 selection regressions and random sampling, one would expect at least 4 coefficients to be significant at the 0.10-level. Additionally, there is no evidence of selection bias on academic ability when performing these same regressions using the USAFA admission office’s total academic composite, which combines SAT math, SAT verbal, high school GPA, class rank, and the quality of high school attended.
15
where GPAisc is the freshman fall semester GPA for individual i in squadron s, and graduating
class c. r
iscX are the pre-treatment characteristics of individual i’s roommate15 and
1sc
ik
ksc
n
X
are
the average pre-treatment characteristics of all other classmates in squadron s except individual i.
Xisc is a vector of individual i’s specific (pre-treatment) characteristics, including SAT math,
SAT verbal, academic composite, fitness score, leadership composite, race/ethnicity, gender,
recruited athlete, and whether they attended a military preparatory school. isc is the error term.
We include graduating class fixed effects to control for unobserved mean differences across
years in GPA. Given the potential for error correlation across individuals within a given
squadron and class, we correct all standard errors to reflect clustering at the squadron by class
level.
Reduced Form Results
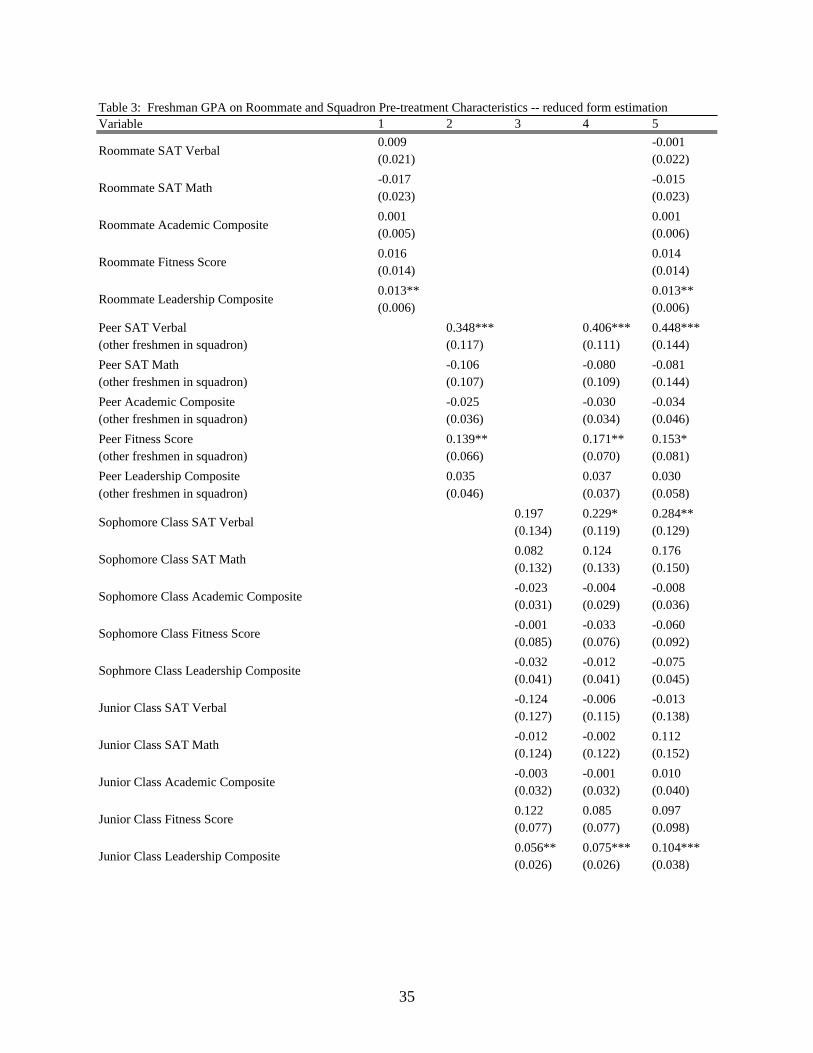
We estimate various specifications of equation (1) using ordinary least squares (OLS) for
freshman academic performance, with results shown in Table 3.16 For Specification 1, we
estimate the peer influence at the roommate level using the full array of roommate-level
academic, athletic, and leadership pre-treatment measures.17 We find insignificant coefficients
for the roommate SAT verbal, SAT math, academic composite and fitness score variables;
however, the coefficient on the roommate leadership composite is positive and significant
(0.013) at the 0.05-level. The effect is relatively small; the model predicts a one-standard
deviation increase in the roommate leadership composite results in an increased freshman fall
15Average GPA is used for individual with two roommates. 16 SAT scores, academic composite, leadership composite and fitness scores have all been divided by 100 prior to estimating the regressions. 17 For student who only have a reported ACT score, we converted the ACT scores to SAT scores using conversions from the College Board (Dorans, 1999).
16
semester GPA of 0.02 grade points. The F-statistic (1.53) for the five roommate variables is
statistically insignificant, indicating that roommate pre-treatment characteristics alone do not
provide statistically significant explanatory power. Own SAT verbal (0.059), SAT math (0.240),
academic composite (0.109) and fitness score (0.045) are all positive and highly significant. The
own leadership composite is positive and statistically insignificant.
For Specification 2, we estimate the model using the average pre-treatment characteristics
of individual i’s peers (other freshmen) in squadron s. Of the five peer variables estimated, two
coefficients are statistically significant, peer SAT verbal (0.348) and peer fitness score (0.139).
The F-statistic (2.32) on the five peer variables is significant at the 0.05-level providing evidence
that this broader peer group plays a more important role than that of roommates. Compared to
previous studies, the magnitude of peer SAT verbal is quite large, and similar to Zimmerman
(2003), the reduced form academic peer effect appears to be driven through SAT verbal scores
versus other academic pre-treatment measures. The model predicts a 1-standard deviation
increase in the peer SAT verbal score results in an increased own GPA of 0.04 grade points.
Next, we estimate Specification 3 using the average pre-treatment characteristics of the
three upper classes in the squadron to measure the leadership effects from the upperclassmen
within the squadron. Of the 15 upper class variables estimated, only the junior class leadership
composite (0.059) is individually significant; however, all fifteen variables are jointly significant
at the 0.05-level. This result implies that the characteristics of upperclassmen, as a whole, play
an important role in freshman academic performance. In Specification 4 we estimate the model
using all peer and upper class pre-treatment characteristics. The model shows that the peer pre-
treatment characteristics are jointly significant at the 0.01-level and the upper class
characteristics are jointly significant at the 0.05-level.
17
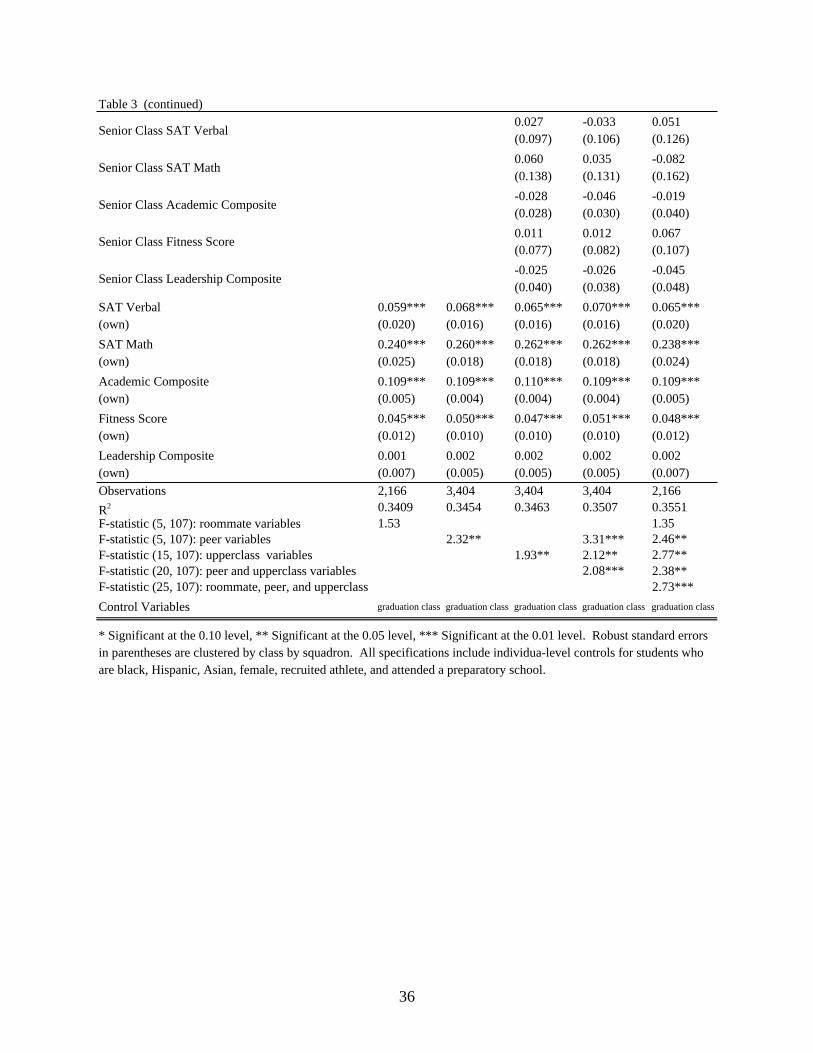
Finally, in Specification 5 we estimate the model using pre-treatment characteristics of
individual i’s roommates, peers, and upperclassmen. In total, we estimate 25 different effects
with 5 each for roommate(s), peers, sophomores, juniors, and seniors within the squadron.
Overall, there are five positive and statistically significant coefficients: 1) roommate leadership
composite (0.013), 2) peer SAT verbal (0.448), 3) peer fitness score (0.153), 4) sophomore class
SAT verbal (0.284), and 5) junior class leadership composite (0.104). The positive results for
the roommate leadership composite, peer SAT verbal, and peer fitness test variables provide
evidence of positive peer influence and the positive results for the sophomore class SAT verbal
and junior class leadership composite variables provide evidence of positive leadership effects
within the squadron. All 25 roommate, peer, and upper class pre-treatment characteristics are
jointly significant at the 0.01-level (F-statistic = 2.73), providing evidence that peers and leaders
play a significant role in the academic performance of the freshman within the squadron
The reduced form results provide strong evidence of positive social spillovers in academic
performance.18 As in Zimmerman (2003) we find the peer effects are linked more closely with
SAT verbal scores versus other academic pre-treatment measures. These results also show that
other non-academic measures, such as the athletic and leadership measures, appear to be linked
with positive peer influence; however, it is difficult to theoretically explain why each of these
effects should be significant compared to those that are insignificant. Two possible explanations
arise. First, the insignificant coefficients may be due to non-linearities in the effects across
different types of individuals (i.e., ability, race, or gender). For example, Hoxby & Weingarth
(2006) find strong evidence of non-linearities in peer influence across high versus low achieving
18 For brevity we do not show the reduced form estimates on athletic performance. In these specifications, we find only one positive and statistically significant effect (junior class leadership composite). However, the peer and upper class pre-treatment characteristics are jointly significant at the 0.05-level.
18
students in elementary and middle school. Second, it could be that the positive coefficients on
the pre-treatment variables are estimating primarily an endogenous effect. Sacerdote (2001)
supports this hypothesis in finding that peer effects at Dartmouth are primarily driven through
roommate performance versus roommate background characteristics.
To estimate own freshman academic performance as a direct function of peer academic
performance, we use 2 stage least squares (2SLS) with the full set of roommate, peer, and upper
class pre-treatment characteristics as exogenous instruments. This model assumes that peer
background characteristics do not affect own freshman academic performance directly and work
strictly through their effect on peer performance (Moffitt, 2001).
VI. 2SLS estimates of peer effects
Method
For freshman students, we estimate the following model using two-stage least squares
(2SLS) with the following explanatory variables:
(2)
isciscsc
scsc
sc
ik
ksc
r
iscisc
XFreshGPA
FreshGPAFreshGPAn
GPA
GPAGPA
++
+++++=
35
24
13210
1
where GPAisc is the freshman, fall semester, GPA for individual i in squadron s, and graduating
class c. r
iscGPA is the GPA of individual i’s roommate19 and
1sc
ik
ksc
n
GPA
is the average GPA of all
other freshman peers in squadron s except individual i. As both roommate and squadron
classmate GPA are endogenous to our dependent variable, we instrument for r
iscGPA and
19 Average GPA is used for individual with two roommates.

19
1sc
ik
ksc
n
GPA
using all roommate and squadron level peer and upper class average pre-treatment
and demographic characteristics.20
FreshGPAsc 1, FreshGPAsc 2, and FreshGPAsc 3 , are the average freshman cumulative
GPA for the sophomores, juniors, and seniors in squadron s, respectively. Because these GPAs,
high school performance data, and demographic characteristics were known historical data as of
time period c, they are formally exogenous with respect to the dependent variable, isc
GPA . Xisc
is the vector of individual specific (pre-treatment) characteristics for individual i and isc is the
error term. We include graduating class fixed effects to control for unobserved mean differences
across years in GPA and we correct all standard errors to reflect clustering at the squadron by
class level.
When performing 2SLS estimation, the strength of first stage excluded instruments is of
critical importance in obtaining consistent estimates (Staiger and Stock, 1997; Stock, Wright,
and Yogo, 2002; Shea, 1997; Hahn and Hausman, 2003). If instruments are weak, 2SLS
estimated coefficients are biased toward inconsistent OLS estimates. Following one definition of
weak instruments provided by Stock, Wright, and Yogo (2002), instruments are considered weak
if the bias of 2SLS estimates under weak instruments relative to the inconsistency of OLS
estimates exceeds 10%. A null hypothesis of weak instruments can be rejected in favor of strong
instruments if the F-statistic measuring joint explanatory power of exogenous instruments
20 The complete set of instruments includes roommate and each class’s average: academic composite, fitness score, leadership composite, SAT Verbal, SAT Math, black, Hispanic, Asian, female, attended a military preparatory school, and was a recruited athlete. Roommate demographic characteristics are entered as dummy variables and class demographic characteristics are in percentages.
20
excluded from the final structural equation is sufficiently large, around 10.21 In the presence of
multiple endogenous explanatory variables, individual F-statistics computed for each explanatory
variable are insufficient to assess the strength of the instruments should the instruments be
sufficiently collinear (Shea, 1997). For our specifications which contain multiple endogenous
explanatory variables (roommate and squadron peer effects), we provide the Cragg-Donald weak
identification statistic. The relevant critical value for the bias of 2SLS estimates to be 10% of the
inconsistency of OLS estimates given our large number of instruments is 11.05.22 When using
the full array of exogenous instruments available, our instruments are not weak, implying the
bias of our 2SLS estimates is less than 10% of inconsistency of OLS estimates at a high degree
of statistical significance.
Table 4 presents results for freshman academic performance and Table 5 presents results for
freshman athletic performance, where we estimate equation (2) replacing all grade point
averages (GPAs) with physical education averages (PEAs).23
2SLS Results for Freshman Academic Performance
Table 4, Specifications 1 and 2 estimate the peer influence at the roommate level only.
Specification 1 uses only roommate level excluded instruments, while Specification 2 includes
the full array of roommate, peer, and upper class excluded instruments. In both specifications,
the coefficient on roommate GPA is positive, but it is only statistically significant in
Specification 2, when using the full set of instruments. This result provides evidence that the full
set of peers in the squadron likely play a role. For Specification 2, the positive and significant
21 Critical values can be found in Stock, Wright, and Yogo (2002), Table 1. 22 Critical values can be found in Stock and Yogo (2002), Table 1. 23 Empirical studies have shown Limited Information Maximum Likelihood (LIML) estimation to be more robust with respect to weak instruments than 2SLS (Staiger and Stock, 1997; Stock, Wright, and Yogo, 2002). For a robustness check, we also computed LIML estimates and found nearly identical results in all specifications.
21
coefficient (0.119) on roommate GPA indicates that, on average, an individual’s GPA increases
0.07 grade points with a 1-standard deviation (0.55) increase in roommate GPA. The magnitude
of the coefficient is nearly identical to that found by Sacerdote (2001).24 Results also show that
own SAT math, SAT verbal, academic composite, and fitness score are positive and highly
significant, while the own leadership composite is statistically insignificant.
In Specification 3 we add to the model the average GPA of all other freshmen in squadron s,
except individual i (Peer GPA). The estimated coefficient for the peer GPA variable (0.639) is
large, positive, and highly significant, while the magnitude of the coefficient on roommate GPA
(0.046) diminishes and is no longer statistically significant.25 Compared to previous studies, the
magnitude of the peer effect estimated is quite large.26 The model estimates a 1-standard
deviation increase in peer GPA (0.15) results in a 0.10 increase in own GPA. This result
provides strong evidence that the broader peer group of all freshmen within the squadron play a
more important role in academic performance than just that of roommates and shows the
importance of properly identifying the relevant peer group when estimating peer influence.
Hence, previous studies, which have assumed peer group formation at the roommate, dorm floor,
or dorm level, have likely underestimated the total magnitude of the peer effects present.27
24 Sacerdote (2001) found a 1-point increase in roommate GPA resulted in a 0.120 increase in own GPA. 25 Because roommates are also included in the peer GPA variable, the coefficient on roommate GPA variable should be interpreted as a roommate’s effect beyond their average effect in the peer GPA variable. 26 Compared to the roommate effects estimated by Sacerdote (2001), the magnitude of the coefficient is roughly five times larger. In terms of a 1-standard deviation increase in peer GPA, the effect is roughly twice as large. 27 In alternate specifications (not shown) we estimate the model without roommate characteristics to include those students in the squadron in which we were unable to match roommates. The result for the Peer GPA variable (0.6027) is large, positive, and highly significant.
22
To estimate the leadership effects within the squadron, we add the average freshman
cumulative GPA of the sophomore, junior and senior class within the squadron in Specification
4. Results for all three upperclassmen GPA variables are positive, but only the coefficient on the
junior class GPA (0.228) is statistically significant. We estimate a 1-standard deviation increase
in the junior class (freshman) GPA results in a 0.02 increase in own GPA. Results for the Peer
GPA variable remain positive and highly significant. The model estimates that a 1-point
increase in peer GPA increases individual GPA by 0.65 grade points.28
The specifications contained in Table 4 make the restrictive assumption that all pre-
treatment peer characteristics affect own GPA through peer GPA. If one or more pre-treatment
peer characteristics instead affected own GPA directly, then the estimated coefficient on the peer
GPA variable would not be a consistent estimator of the endogenous peer effect due to
misspecification/omitted variable bias. As an empirical test of whether some of our instruments
should instead be included as exogenous explanatory variables, we use the Hanson-Sargon test of
overidentifying restrictions. All specifications estimating the squadron-level peer effect fail to
reject the Hanson-Sargon test at a 5% level of significance. To further test our instrument set,
we add peer SAT verbal as an explanatory variable in Specification 5. We chose peer SAT
verbal because it had the most explanatory power in the reduced form. This specification allows
for the possibility that prior verbal abilities of peers directly affect individual GPA. Results for
the peer GPA variable remain virtually unchanged (0.663) and the coefficient on peer SAT
verbal is small, negative and statistically insignificant (-0.022). Hence, we do not find evidence
that some of our instruments would be more properly used as exogenous explanatory variables.
28Appendix A also shows first stage results for both roommate and peer GPA and for Specification 4.
23
We also tested (not shown) the sensitivity of the peer effect results to various other
specifications and instrument sets. For example, the coefficient on the peer GPA variable is
0.606 when excluding roommate instruments, 0.515 when excluding upperclassmen instruments,
0.552 when using peer SAT verbal as the sole excluded instrument, and 0.733 when including a
squadron fixed effect.
The results in Table 4 provide strong evidence of positive peer influence in academic
performance at the squadron by classmate level and positive leadership effects from the junior
class within the squadron. The results are larger in magnitude than previous studies, which we
attribute to proper identification of the relevant peer group in our estimations. Next, our unique
data set allows us to test for the presence of peer effects across another dimension, athletic
performance, as measured by scores on the physical fitness test, 1.5 mile run, and grades in
physical education courses.
2SLS Results for Freshman Athletic Performance
In Table 5, Specifications 1 and 2 we estimate the peer athletic influence at the roommate
level only. Again, the roommate peer effect is statistically significant in Specification 2, when
using the full array of roommate, peer, and upper class excluded instruments. For Specification
2, the positive and significant coefficient (0.102) on roommate PEA indicates that, on average,
an individual’s PEA increases 0.05 points with a 1-standard deviation increase in roommate PEA
(0.55). The own academic composite, CFT score, and leadership composite are all positive and
significant and SAT verbal is negative and significant in predicting athletic performance.
For Specification 3, we add to the model the peer PEA variable. The estimated coefficient
(0.418) is positive and highly significant while the magnitude of the coefficient on the roommate
PEA (0.062) diminishes and is no longer statistically significant. A 1-standard deviation
24
increase in peer PEA (0.11) results in a 0.05 increase in own PEA. Again, this result provides
further evidence that the broader peer group plays a more important role in predicting
performance and exemplifies the importance of properly identifying the relevant peer group
when estimating peer effects.
We add the average freshman cumulative PEA of the sophomore, junior, and senior classes
within the squadron in Specification 4. The peer PEA variable remains positive and highly
significant (0.430), with only small changes in the magnitude of the effect. The junior class has
a positive leadership effect on freshman performance (0.143). A 1-standard deviation increase in
the junior class PEA increases individual PEA by 0.02 grade points.
Results in Tables 4 and 5 provide strong evidence of peer and leadership influences in both
academic and athletic performance. Similar to previous studies, we find moderate evidence of
peer influence at the roommate level. These roommate effects virtually disappear once we
estimate the effects at the proper peer group (squadron) level. Our models estimate that a 1-point
increase in peer GPA increases individual GPA by 0.65 grade points and a 1-point increase in the
junior class GPA within a squadron increases individual GPA by 0.23 grade points. We also find
similar results for athletic performance.
We attribute these results to the proper identification of the relevant peer group when
estimating peer effects. Unlike Foster (forthcoming), where peer group formations were
assumed to form in dorm “hall-floor wings,” the squadron structure at USAFA allows us to
identify the known peer group in which students spend a majority of their time. To test this
assertion, we next conduct falsification tests by computing artificial or false peer groups using
students from different squadrons whose dorm rooms are geographically co-located.
Falsification Tests
25
The unique dorm structure at USAFA provides the opportunity to empirically test for false
peer effects. All 4,200 students at USAFA live in one of only two dorm halls. Squadrons 1-21
reside in Vandenberg Hall and squadrons 22-36 reside in Sijan Hall. While all members of a
respective squadron are geographically located in the same area of the dorm, squadrons located
in the same dorm hall and floor are adjacent to one another with no visible partitions. Therefore,
to test for the importance of proper identification of the relevant peer group, we are able to
construct false peer groups of students whose dorm rooms are located in the same section of the
dorm hall, but are not necessarily in the same squadron. We construct these groups using student
dorm room assignments at the start of the fall semester. Each dorm room is identified by the hall
(Vandenberg or Sijan), floor (2, 3, 5, and 6), section (A to G), and room number. In total, there
are 39 identifiable dorm/floor/sections with which we construct false peer groups. These
groupings are analogous to hall-floor wings as defined by Foster (forthcoming). During the three
years in our sample, 92.3% of the hall/floor/sections contain students from different squadrons
and the average false peer group is made up of 66.6% of members from an individual’s actual
squadron. We construct and test for two separate false peer groups: 1) freshman students in the
same hall/floor/section, and 2) all students within the same hall/floor/section.
Table 6a presents results for this analysis for freshman student outcomes. Specifications 1
and 2 show results for academic outcomes and Specifications 3 and 4 show results for athletic
outcomes. In all four specifications, the average performance (GPA or PEA) of the false peer
group has no statistically significant effect on individual performance. Similar to results found by
Foster (forthcoming), these results show that geographic proximity of individuals alone does not
generate positive peer effects.
26
To further test the importance of the squadron peer group structure, in Table 6b we
sequentially restrict the sample to only include observations where the false peer group more
closely approximates the actual (squadron) peer group.29 For example, in Specification 2, we
estimate the model using a sub-sample of data in which 60% or more of the false peer group are
members of the actual peer group. Moving rightward across the columns of Table 6b, the peer
effect grows in magnitude and statistical significance as the false peer group converges to the
actual peer group. We note with interest that the peer effect is not statistically significant until
the false peer group contains a minimum of 80% of the actual peer group (Specification 4). In
Specification 6, when false peer groups contain at least 95% of the actual peer group, the
coefficient (0.572) is roughly equal that estimated in Table 4 (although we recognize the sample
size is relatively small). These results provide further empirical evidence of the importance of
properly identifying the relevant peer group when estimating peer effects and indicate that
measurement error in peer group composition likely bias downward estimated magnitudes of
peer effects.
Estimation of Peer & Leadership Effects for Sophomore Students
With evidence of positive peer and leadership effects in freshman academic and athletic
performance, we look for persistence of freshman peer effects in sophomore performance. It is
possible to statistically separate freshman peer effects from sophomore peer effects on
sophomore performance because all students are (conditionally) randomly assigned to a new
squadron at the beginning of their sophomore year.
29 Results are shown for False Peer 1 (other freshman) for academic performance. Results are generally consistent when using False Peer 2 (all students) for academic performance. However, results are statistically insignificant in all specifications when restricting the samples for athletic performance.
27
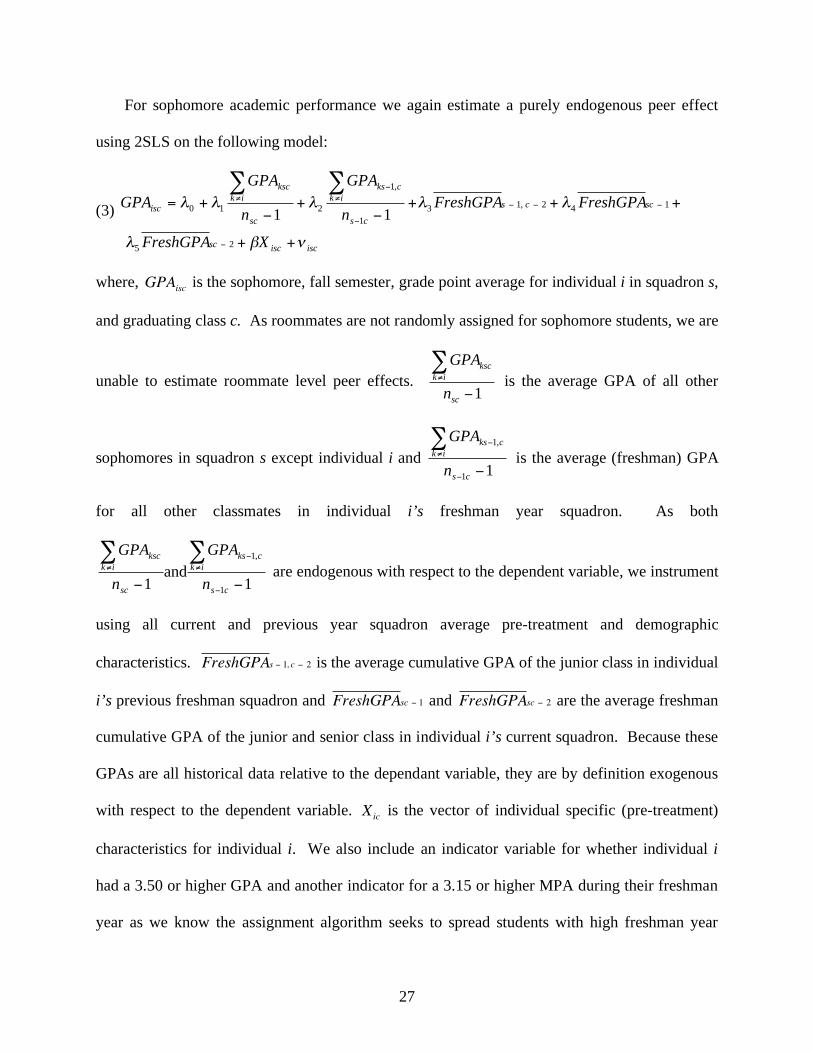
For sophomore academic performance we again estimate a purely endogenous peer effect
using 2SLS on the following model:
(3)
isciscsc
sccs
cs
ik
cks
sc
ik
ksc
isc
XFreshGPA
FreshGPAFreshGPAn
GPA
n
GPA
GPA
++
+++++=
25
14
2,13
1
,1
21011
where, GPAisc is the sophomore, fall semester, grade point average for individual i in squadron s,
and graduating class c. As roommates are not randomly assigned for sophomore students, we are
unable to estimate roommate level peer effects. 1
sc
ik
ksc
n
GPA
is the average GPA of all other
sophomores in squadron s except individual i and 1
1
,1
cs
ik
cks
n
GPA
is the average (freshman) GPA
for all other classmates in individual i’s freshman year squadron. As both
1and
1 1
,1
cs
ik
cks
sc
ik
ksc
n
GPA
n
GPA
are endogenous with respect to the dependent variable, we instrument
using all current and previous year squadron average pre-treatment and demographic
characteristics. FreshGPAs 1, c 2 is the average cumulative GPA of the junior class in individual
i’s previous freshman squadron and FreshGPAsc 1 and FreshGPAsc 2 are the average freshman
cumulative GPA of the junior and senior class in individual i’s current squadron. Because these
GPAs are all historical data relative to the dependant variable, they are by definition exogenous
with respect to the dependent variable. Xic is the vector of individual specific (pre-treatment)
characteristics for individual i. We also include an indicator variable for whether individual i
had a 3.50 or higher GPA and another indicator for a 3.15 or higher MPA during their freshman
year as we know the assignment algorithm seeks to spread students with high freshman year
28
performance uniformly throughout all squadrons.30 isc is the error term. Again, we include
graduating class year fixed effects and correct all standard errors to reflect clustering at the
squadron by class level. Estimates of equation (3) are found in Table 7.
Results for Sophomore Performance
Specifications 1 and 2 are estimates of academic performance and Specifications 3 and 4 are
estimates of athletic performance. For Specification 1, the positive and statistically significant
coefficients for both the previous peer GPA (0.332) and current peer GPA (0.503) indicate that
both peer groups exhibit positive influence. The magnitude of the effect for the previous peer
GPA is roughly one-half that found during the freshman year, indicating a persistent, but
diminished effect. Next, to test for leadership effects, we add to the model in Specification 2 the
junior class’s freshman GPA from individual i’s freshman year squadron as well as the junior
and senior class average (freshman) GPA from the current squadron.31 The positive and
significant coefficient on the previous year’s junior class freshman GPA (0.162) indicates
persistence in the leadership effects from the previous year. The statistically insignificant
coefficients for the current squadron junior and senior class indicate that the upperclassmen in
the new squadron play a diminished role during the sophomore year.
In Specifications 3 and 4, we estimate equation (3) for athletic performance by replacing all
GPA measures with PEA. Similar to the academic results, we find positive effects for both the
previous peer PEA (0.248) and current peer PEA (0.360). A 1-standard deviation in the previous
peer PEA variable results in a 0.03 increase in own PEA and a 1-standard deviation increase in
30 Our empirical estimates show that this selection mechanism reduced the variance in average Peer GPA across squadrons. Controlling for this observable selection mechanism should reduce the negative bias in the current peer group estimate. Estimates for previous year’s peer group are unaffected by the sorting mechanism. 31 We instrument for the previous year peer GPA with the previous year squadron level pre-treatment characteristics.
29
current peer PEA results in a 0.04 increase in own PEA. Lastly, we add to the model the
previous junior class PEA, current junior class PEA and current senior class PEA in
Specification 4. Estimated coefficients for all three of these leadership variables are small,
negative, and statistically insignificant.
The results shown in Table 7 provide evidence that both the current and previous peer
groups play an important role in both academic and athletic performance. The previous peer
group’s effect appears to diminish in size, but persists the following year after reassignment to a
new squadron. Unfortunately, our data do not contain performance information beyond the
sophomore year, so we are unable to estimate the persistence in the peer influence in later years.
VII. Conclusion
We examine a data set of students from the graduating classes of 2005 through 2007 at the
United States Air Force Academy for evidence of peer and leadership effects in academic and
athletic performance. The random assignment of freshmen to squadrons and roommates and the
random reshuffle into new squadrons at the start of the sophomore year allows us to identify peer
and leadership influences at three distinct peer-group levels: roommate pairs, squadron
classmates, and squadron upperclassmen.
Using the squadron as the peer group, we find peer effects of much larger magnitude than
those found in the previous literature. We find that, for freshman students, a 100-point increase
in the peer group average SAT verbal score increases individual GPA by 0.45 grade points and a
1-point increase in peer group GPA increases individual GPA by 0.65 grade points. We also find
evidence of positive leadership effects from the upper class “supervisors” within the squadron.
30
A 1-point increase in the junior class GPA within a squadron increases individual GPA by 0.23
grade points. Both the peer and leadership effects continue into the sophomore year after
reassignment to a new squadron, providing evidence of persistence in the effects.
In contrast, we find only moderate evidence of peer influence at the roommate level (as in
Sacerdote (2001) and Zimmerman (2003)), and roommate peer effects virtually disappear when
the broader squadron level peer performance is included as an explanatory variable.
These results have two important implications. First, they demonstrate the importance of
properly identifying the relevant peer group when estimating peer effects. Second, in contrast
with previous findings, they suggest that large positive peer effects may exist in higher education
outcomes.
While the Air Force Academy classes include a disproportionate number of students
whose parents were in the military themselves, the rest of the students are drawn from the same
pool as other selective academic institutions throughout the United States. But the educational
experience for students at the Air Force Academy is different than most traditional colleges and
universities, and questions could be raised about whether our results can be generalized to the
population of US college students. Because students at USAFA are taught to foster teamwork,
our peer effects estimates could be larger than those expected at other institutions. However,
institutional social constraints at USAFA (i.e., mandatory study periods, inability to attend
fraternity parties, and big penalties for underage drinking) may result in smaller
counterproductive peer influences. If true, properly measured peer groups in other institutional
settings could exhibit larger peer effects that we find at USAFA. Further information regarding
peer group formation at other institutions would be required to empirically test which effect
dominates.
31
Bibliography
Becker, Gary S. and Kevin M. Murphy. (2000). Social Economics: Market Behavior in a Social Environment. Cambridge, MA: Harvard University Press.
Betts J.R. & Zau A. (2004). Peer Groups and Academic Achievement: Panel Evidence
from Administrative Data. Unpublished Manuscript. Boozer, M.A. & Cacciola, S.E. (2001). Inside the ‘Black Box’ of Project STAR:
Estimation of Peer Effects Using Experimental Data. Unpublished manuscript. Burke, M.A. & Sass, T.R. (2004). Classroom Peer Effects and Student Achievement.
Presented at the American Economic Association Annual Meetings, Jan 2005. Carrell, Scott E., Malmstrom, F.V., & West, J.E., (2005). Peer Effects in Academic
Cheating. Presentation to NBER Higher Education Working Group. Dorans, Neil J., (1999) Correspondences Between ACT and SAT I Scores. College Board
Report No. 99-1, ETS RR No. 99-2. Foster, Gigi, (2006). It’s not your peers, and it’s not your friends: some progress towards
understanding educational peer effects. Forthcoming, Journal of Public Economics. Glaeser, E.L., Sacerdote, B.L., and Scheinkman, J.A., (2003). The Social Multiplier.
Journal of the European Economic Association, 1, 345 - 353 Graham, Bryan S. (2004). Identifying Social Interactions through Excess Variance
Contrasts. Working paper. Hahn, J. & Hausman J.H. (2003). Weak Instruments: Diagnosis and Cures in Empirical
Econometrics. Recent Advances in Econometric Methodology for Policy Analysis, 93, 2, 118-123.
Hanushek, E.A., Kain, J.F., Markham, J.M. & Rivkin, S.G. (2003). Does Peer Ability
Affect Student Achievement? Journal of Applied Econometrics, 18, 527-544. Hoxby, Caroline M., and Weingarth, G., (2006). Taking Race Out of the Equation:
School Reassignment and the Structure of Peer Effects. Working Paper. Kremer, Michael, and Levy, Dan M. (2003). Peer Effects and Alcohol Use Among
College Students. NBER Working Paper 9876. Lyle, David S. (2006). Estimating and Interpreting Peer and Role Model Effects from
Randomly Assigned Social Groups at West Point, Forthcoming, Review of Economics and Statistics.
32
Malmstrom, F.V. (March 2006). The 1965 USAFA Cheating Scandal, Checkpoints, (34)4, 36-41.
Manski, C.F. (1993). Identification and Endogenous Social Effects: The Reflection
Problem. Review of Economic Studies, 60, 531-542. Moffitt, Robert A. (2001). Policy Interventions, Low-Level Equilibria, and Social
Interactions. In Social Dynamics, edited by Seven N. Durlauf and H. Peyton Young. Brookings Institution Press, Washington D.C.
Sacerdote, B. (2001). Peer Effects with Random Assignment: Results for Dartmouth
Roommates. Quarterly Journal of Economics, 116, 681-704. Shea, J. (1997). Instrument Relevance in Multivariate Linear Models: A Simple
Measure, The Review of Economics and Statistics, 79(2), 348-352. Staiger, D. & Stock J.H. (1997). IV Regression with Weak Instruments. Econometrica,
65, 3, 557-86. Stock, J.H., Wright J.H., & Yogo, M. (2002). A Survey of Weak Instruments and Weak
Identification in GMM. Journal of Business and Economics Statistics, 20, 4, 518-29. Stock, J.H., and Yogo, M. (2002). Testing for Weak Instruments in Linear IV
Regression, Technical Working Paper 284, National Bureau of Economic Research Stanard, C.I. & Bowers, W.J. (1970). The college fraternity as an opportunity structure
for meeting academic demands. Social Problems, 17, 371-390. Stinebrickner, R. & Stinebrickner, T.R. (2006). What can be learned about peer effects
using college reoomates? Evidence from new survey data and students form disadvantaged backgrounds. Journal of Public Economics, 90, 1435-1454.
U.S. News and World Report (2006). America’s Best Colleges 2006. Accessed on 19
June 2006 at http://www.usnews.com/usnews/rankguide/rghome.htm Vidgor, J. & Nechyba, T. (2004). Peer Effects in North Carolina Public Schools.
Unpublished manuscript. Weinberg, Bruce A. (2005). Social Interactions and Endogenous Association.
Unpublished manuscript. Zimmerman, D.J. (2003). Peer Effects in Academic Outcomes: Evidence From a
Natural Experiment. The Review of Economics and Statistics, 85,1, 9–23
33
Variable Obs Mean Std. Dev. Min Max
Grade Point Average (GPA)
(fall semester)3407 2.88 0.62 0.28 4.00
Physical Education Average (PEA)
(fall semester)2878 2.52 0.52 0.65 4.00
SAT Math 3489 665.47 63.88 440.00 800.00
SAT Verbal 3489 631.95 67.00 330.00 800.00
Academic Composite 3488 1,282.41 211.99 623.00 2,067.00
Fitness Score 3489 459.70 96.88 215.00 745.00
Leadership Composite 3490 1,724.16 182.42 900.00 2,370.00
Black 3490 0.05 0.22 0 1
Hispanic 3490 0.06 0.24 0 1
Asian 3490 0.05 0.23 0 1
Female3490 0.18 0.38 0 1
Recruited Athlete3490 0.28 0.45 0 1
Military Preparatory School3490 0.21 0.41 0 1
Freshman Roommate GPA
(mean if two) 2165 2.89 0.55 0.47 4.00
Freshman Roommate PEA
(mean if two) 1977 2.51 0.47 0.80 4.00
Freshman Roommate SAT Math
(mean if two) 2170 665.95 55.88 460.00 800.00
Freshman Roommate SAT Verbal
(mean if two) 2170 631.11 59.47 350.00 800.00
Freshman Roommate Academic Composite
(mean if two) 2170 1,285.90 188.05 623.00 2,067.00
Freshman Roommate Fitness Score
(mean if two) 2171 458.07 83.81 245.00 735.00
Freshman Roommate Leadership Composite
(mean if two) 2171 1,720.47 160.21 900.00 2,295.00
Peer GPA
(squadron by class) 108 2.88 0.15 2.43 3.30
Peer PEA
(squadron by class) 108 2.52 0.11 2.19 2.74
Peer SAT Math
(squadron by class) 108 665.56 12.90 630.00 705.81
Peer SAT Verbal
(squadron by class) 108 632.20 11.61 606.97 666.32
Peer Academic Composite
(squadron by class) 108 1,282.78 37.70 1,205.41 1,410.58
Peer Fitness Score
(squadron by class) 108 459.48 18.12 417.16 507.25
Peer Leadership Composite
(squadron by class) 108 1,724.45 31.45 1,625.06 1,795.18
Table 1: Summary Statistics for Classes of 2005-2007
34
Table 2: Own pre-treatment characteristics regressed on peer pre-treatment characteristics
Variable Class/yearClass of
2000
Class of
2001
Class of
2002
Class of
2003
Class of
2004
Class of
2005
Class of
2006
Class of
2007
Freshman
RoommateNA NA
-0.104
(0.084)NA
-0.051
(0.067)
-0.059
(0.065)
0.050
(0.059)
0.018
(0.064)
Freshman
SquadronNA NA
-1.668***
(0.467)NA
-1.029**
(0.412)
-0.116
(0.325)
0.032
(0.229)
-0.165
(0.238)Sophomore
Squadron
-0.186
(0.313)
-0.072
(0.117)
-0.020
(0.250)
-1.477***
(0.389)
-0.304
(0.226)
-0.117
(0.288)
-0.017
(0.166)
-0.060
(0.240)
Freshman
RoommateNA NA
-0.122*
(0.071)NA
-0.050
(0.063)
-0.071
(0.057)
-0.017
(0.074)
0.080
(0.069)Freshman
SquadronNA NA
-0.420
(0.319)NA
-0.237
(0.327)
0.255*
(0.146)
-0.055
(0.364)
-0.333
(0.325)Sophomore
Squadron
-0.838
(0.572)
-0.088
(0.234)
-0.154
(0.221)
-0.376
(0.259)
-0.042
(0.231)
0.120
(0.206)
-0.399
(0.319)
-0.532*
(0.281)Freshman
RoommateNA NA
-0.012
(0.052)NA
-0.114*
(0.058)
-0.104
(0.064)
-0.038
(0.069)
-0.036
(0.073)Freshman
SquadronNA NA
-0.247
(0.294)NA
-1.335***
(0.481)
-0.418
(0.266)
-0.040
(0.194)
-0.578
(0.355)Sophomore
Squadron
-0.641
(0.419)
-0.054
(0.246)
0.174
(0.168)
-0.382
(0.274)
-0.490
(0.323)
-0.007
(0.309)
-0.080
(0.312)
-0.712
(0.449)Freshman
RoommateNA NA
-0.037
(0.086)NA
-0.012
(0.064)
-0.007
(0.063)
0.061
(0.078)
0.001
(0.055)Freshman
SquadronNA NA
-0.414
(0.296)NA
-0.555
(0.448)
-0.574
(0.383)
0.038
(0.222)
0.094
(0.224)Sophomore
Squadron
-0.359
(0.249)
-0.011
(0.189)
-1.005**
(0.477)
-0.230
(0.214)
-0.033
(0.254)
0.051
(0.193)
-0.062
(0.220)
-0.124
(0.270)
Freshman
RoommateNA NA
-0.120**
(0.058)NA
-0.047
(0.062)
0.073
(0.068)
-0.024
(0.054)
0.142**
(0.059)
Freshman
SquadronNA NA
-1.192***
(0.438)NA
-1.392***
(0.493)
-0.110
(0.248)
-0.0004
(0.184)
-0.213
(0.267)Sophomore
Squadron
-0.234
(0.293)
-0.424*
(0.243)
-0.239
(0.242)
-0.703*
(0.378)
-0.094
(0.222)
-0.002
(0.226)
-0.432
(0.386)
-0.289
(0.280)
Each coefficient represents a separate regression where the individual (pre-treatment) characteristic is regressed on the peer
characteristic. No other controls are included in each regression. * Significant at the 0.10 level, ** Significant at the 0.05 level, ***
Significant at the 0.01 level. Robust standard errors in parentheses are clustered by class by squadron for the squadron level
regressions. For individuals with two roommates, the explanatory variables represent the average of the two roommates. For the
squadron specifications, the explanatory variables are the average of all classmates in the squadron.
Leadership
Composite
Fitness
Score (CFT)
Academic
Composite
SAT Math
SAT Verbal
35
Variable 1 2 3 4 5
Roommate SAT Verbal0.009
(0.021)
-0.001
(0.022)
Roommate SAT Math-0.017
(0.023)
-0.015
(0.023)
Roommate Academic Composite0.001
(0.005)
0.001
(0.006)
Roommate Fitness Score0.016
(0.014)
0.014
(0.014)
Roommate Leadership Composite0.013**
(0.006)
0.013**
(0.006)
Peer SAT Verbal
(other freshmen in squadron)
0.348***
(0.117)
0.406***
(0.111)
0.448***
(0.144)
Peer SAT Math
(other freshmen in squadron)
-0.106
(0.107)
-0.080
(0.109)
-0.081
(0.144)
Peer Academic Composite
(other freshmen in squadron)
-0.025
(0.036)
-0.030
(0.034)
-0.034
(0.046)
Peer Fitness Score
(other freshmen in squadron)
0.139**
(0.066)
0.171**
(0.070)
0.153*
(0.081)
Peer Leadership Composite
(other freshmen in squadron)
0.035
(0.046)
0.037
(0.037)
0.030
(0.058)
Sophomore Class SAT Verbal0.197
(0.134)
0.229*
(0.119)
0.284**
(0.129)
Sophomore Class SAT Math0.082
(0.132)
0.124
(0.133)
0.176
(0.150)
Sophomore Class Academic Composite -0.023
(0.031)
-0.004
(0.029)
-0.008
(0.036)
Sophomore Class Fitness Score -0.001
(0.085)
-0.033
(0.076)
-0.060
(0.092)
Sophmore Class Leadership Composite -0.032
(0.041)
-0.012
(0.041)
-0.075
(0.045)
Junior Class SAT Verbal-0.124
(0.127)
-0.006
(0.115)
-0.013
(0.138)
Junior Class SAT Math-0.012
(0.124)
-0.002
(0.122)
0.112
(0.152)
Junior Class Academic Composite -0.003
(0.032)
-0.001
(0.032)
0.010
(0.040)
Junior Class Fitness Score 0.122
(0.077)
0.085
(0.077)
0.097
(0.098)
Junior Class Leadership Composite 0.056**
(0.026)
0.075***
(0.026)
0.104***
(0.038)
Table 3: Freshman GPA on Roommate and Squadron Pre-treatment Characteristics -- reduced form estimation
36
Senior Class SAT Verbal0.027
(0.097)
-0.033
(0.106)
0.051
(0.126)
Senior Class SAT Math0.060
(0.138)
0.035
(0.131)
-0.082
(0.162)
Senior Class Academic Composite -0.028
(0.028)
-0.046
(0.030)
-0.019
(0.040)
Senior Class Fitness Score 0.011
(0.077)
0.012
(0.082)
0.067
(0.107)
Senior Class Leadership Composite -0.025
(0.040)
-0.026
(0.038)
-0.045
(0.048)
SAT Verbal
(own)
0.059***
(0.020)
0.068***
(0.016)
0.065***
(0.016)
0.070***
(0.016)
0.065***
(0.020)
SAT Math
(own)
0.240***
(0.025)
0.260***
(0.018)
0.262***
(0.018)
0.262***
(0.018)
0.238***
(0.024)
Academic Composite
(own)
0.109***
(0.005)
0.109***
(0.004)
0.110***
(0.004)
0.109***
(0.004)
0.109***
(0.005)
Fitness Score
(own)
0.045***
(0.012)
0.050***
(0.010)
0.047***
(0.010)
0.051***
(0.010)
0.048***
(0.012)
Leadership Composite
(own)
0.001
(0.007)
0.002
(0.005)
0.002
(0.005)
0.002
(0.005)
0.002
(0.007)
Observations 2,166 3,404 3,404 3,404 2,166
R2 0.3409 0.3454 0.3463 0.3507 0.3551
F-statistic (5, 107): roommate variables 1.53 1.35
F-statistic (5, 107): peer variables 2.32** 3.31*** 2.46**
F-statistic (15, 107): upperclass variables 1.93** 2.12** 2.77**
F-statistic (20, 107): peer and upperclass variables 2.08*** 2.38**
F-statistic (25, 107): roommate, peer, and upperclass 2.73***
Control Variables graduation class graduation class graduation class graduation class graduation class
* Significant at the 0.10 level, ** Significant at the 0.05 level, *** Significant at the 0.01 level. Robust standard errors
in parentheses are clustered by class by squadron. All specifications include individua-level controls for students who
are black, Hispanic, Asian, female, recruited athlete, and attended a preparatory school.
Table 3 (continued)
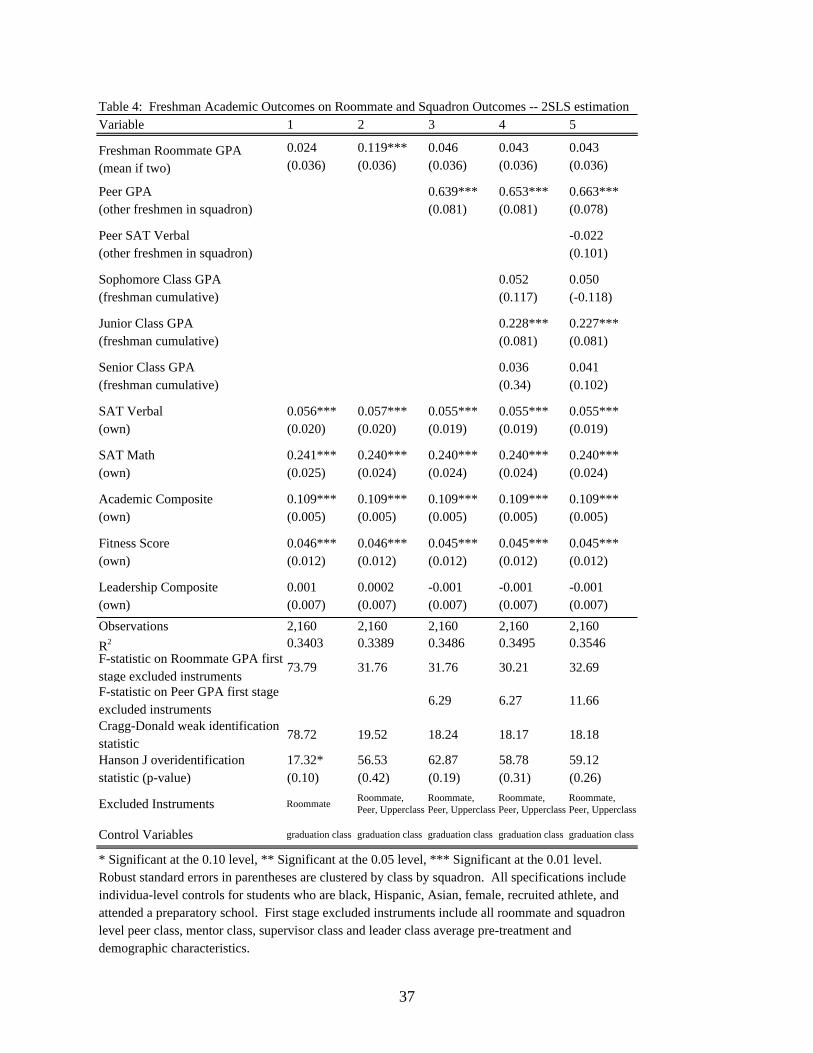
37
Variable 1 2 3 4 5
Freshman Roommate GPA
(mean if two)
0.024
(0.036)
0.119***
(0.036)
0.046
(0.036)
0.043
(0.036)
0.043
(0.036)
Peer GPA
(other freshmen in squadron)
0.639***
(0.081)
0.653***
(0.081)
0.663***
(0.078)
Peer SAT Verbal
(other freshmen in squadron)
-0.022
(0.101)
Sophomore Class GPA
(freshman cumulative)
0.052
(0.117)
0.050
(-0.118)
Junior Class GPA
(freshman cumulative)
0.228***
(0.081)
0.227***
(0.081)
Senior Class GPA
(freshman cumulative)
0.036
(0.34)
0.041
(0.102)
SAT Verbal
(own)
0.056***
(0.020)
0.057***
(0.020)
0.055***
(0.019)
0.055***
(0.019)
0.055***
(0.019)
SAT Math
(own)
0.241***
(0.025)
0.240***
(0.024)
0.240***
(0.024)
0.240***
(0.024)
0.240***
(0.024)
Academic Composite
(own)
0.109***
(0.005)
0.109***
(0.005)
0.109***
(0.005)
0.109***
(0.005)
0.109***
(0.005)
Fitness Score
(own)
0.046***
(0.012)
0.046***
(0.012)
0.045***
(0.012)
0.045***
(0.012)
0.045***
(0.012)
Leadership Composite
(own)
0.001
(0.007)
0.0002
(0.007)
-0.001
(0.007)
-0.001
(0.007)
-0.001
(0.007)
Observations 2,160 2,160 2,160 2,160 2,160
R2 0.3403 0.3389 0.3486 0.3495 0.3546
F-statistic on Roommate GPA first
stage excluded instruments73.79 31.76 31.76 30.21 32.69
F-statistic on Peer GPA first stage
excluded instruments6.29 6.27 11.66
Cragg-Donald weak identification
statistic78.72 19.52 18.24 18.17 18.18
Hanson J overidentification
statistic (p-value)
17.32*
(0.10)
56.53
(0.42)
62.87
(0.19)
58.78
(0.31)
59.12
(0.26)
Excluded Instruments RoommateRoommate,
Peer, Upperclass
Roommate,
Peer, Upperclass
Roommate,
Peer, Upperclass
Roommate,
Peer, Upperclass
Control Variables graduation class graduation class graduation class graduation class graduation class
Table 4: Freshman Academic Outcomes on Roommate and Squadron Outcomes -- 2SLS estimation
* Significant at the 0.10 level, ** Significant at the 0.05 level, *** Significant at the 0.01 level.
Robust standard errors in parentheses are clustered by class by squadron. All specifications include
individua-level controls for students who are black, Hispanic, Asian, female, recruited athlete, and
attended a preparatory school. First stage excluded instruments include all roommate and squadron
level peer class, mentor class, supervisor class and leader class average pre-treatment and
demographic characteristics.
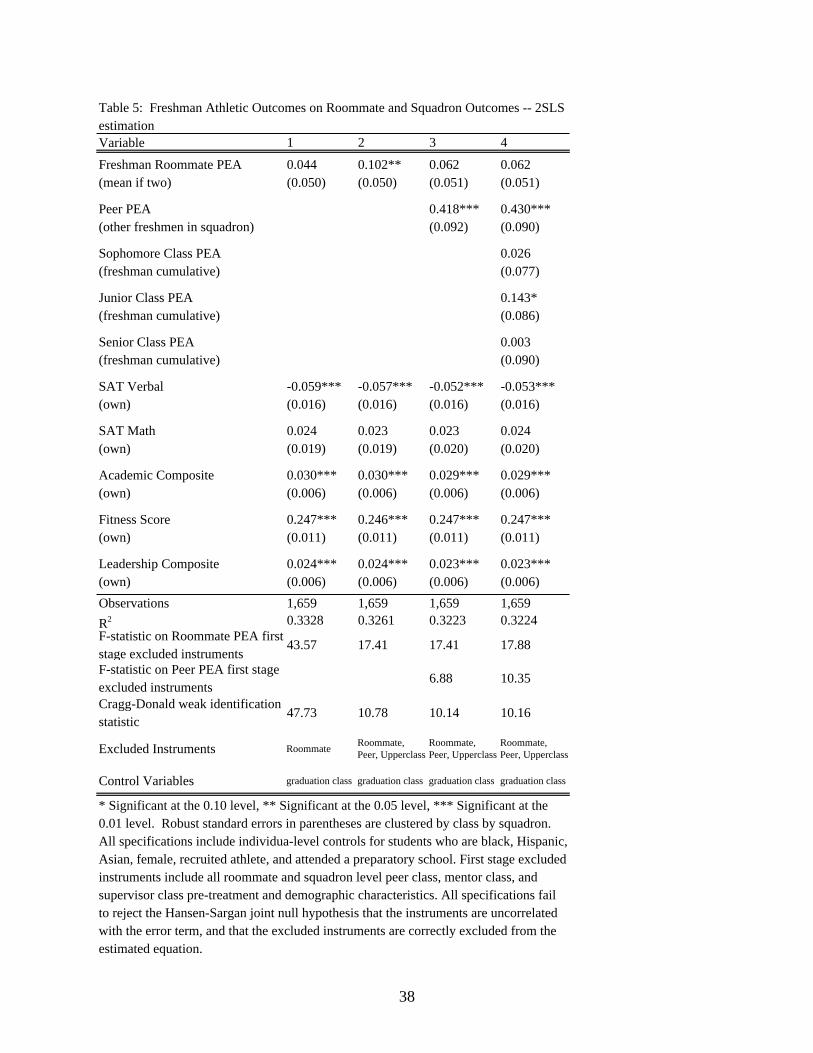
38
Variable 1 2 3 4
Freshman Roommate PEA
(mean if two)
0.044
(0.050)
0.102**
(0.050)
0.062
(0.051)
0.062
(0.051)
Peer PEA
(other freshmen in squadron)
0.418***
(0.092)
0.430***
(0.090)
Sophomore Class PEA
(freshman cumulative)
0.026
(0.077)
Junior Class PEA
(freshman cumulative)
0.143*
(0.086)
Senior Class PEA
(freshman cumulative)
0.003
(0.090)
SAT Verbal
(own)
-0.059***
(0.016)
-0.057***
(0.016)
-0.052***
(0.016)
-0.053***
(0.016)
SAT Math
(own)
0.024
(0.019)
0.023
(0.019)
0.023
(0.020)
0.024
(0.020)
Academic Composite
(own)
0.030***
(0.006)
0.030***
(0.006)
0.029***
(0.006)
0.029***
(0.006)
Fitness Score
(own)
0.247***
(0.011)
0.246***
(0.011)
0.247***
(0.011)
0.247***
(0.011)
Leadership Composite
(own)
0.024***
(0.006)
0.024***
(0.006)
0.023***
(0.006)
0.023***
(0.006)
Observations 1,659 1,659 1,659 1,659
R2 0.3328 0.3261 0.3223 0.3224
F-statistic on Roommate PEA first
stage excluded instruments43.57 17.41 17.41 17.88
F-statistic on Peer PEA first stage
excluded instruments6.88 10.35
Cragg-Donald weak identification
statistic47.73 10.78 10.14 10.16
Excluded Instruments RoommateRoommate,
Peer, Upperclass
Roommate,
Peer, Upperclass
Roommate,
Peer, Upperclass
Control Variables graduation class graduation class graduation class graduation class
* Significant at the 0.10 level, ** Significant at the 0.05 level, *** Significant at the
0.01 level. Robust standard errors in parentheses are clustered by class by squadron.
All specifications include individua-level controls for students who are black, Hispanic,
Asian, female, recruited athlete, and attended a preparatory school. First stage excluded
instruments include all roommate and squadron level peer class, mentor class, and
supervisor class pre-treatment and demographic characteristics. All specifications fail
to reject the Hansen-Sargan joint null hypothesis that the instruments are uncorrelated
with the error term, and that the excluded instruments are correctly excluded from the
estimated equation.
Table 5: Freshman Athletic Outcomes on Roommate and Squadron Outcomes -- 2SLS
estimation
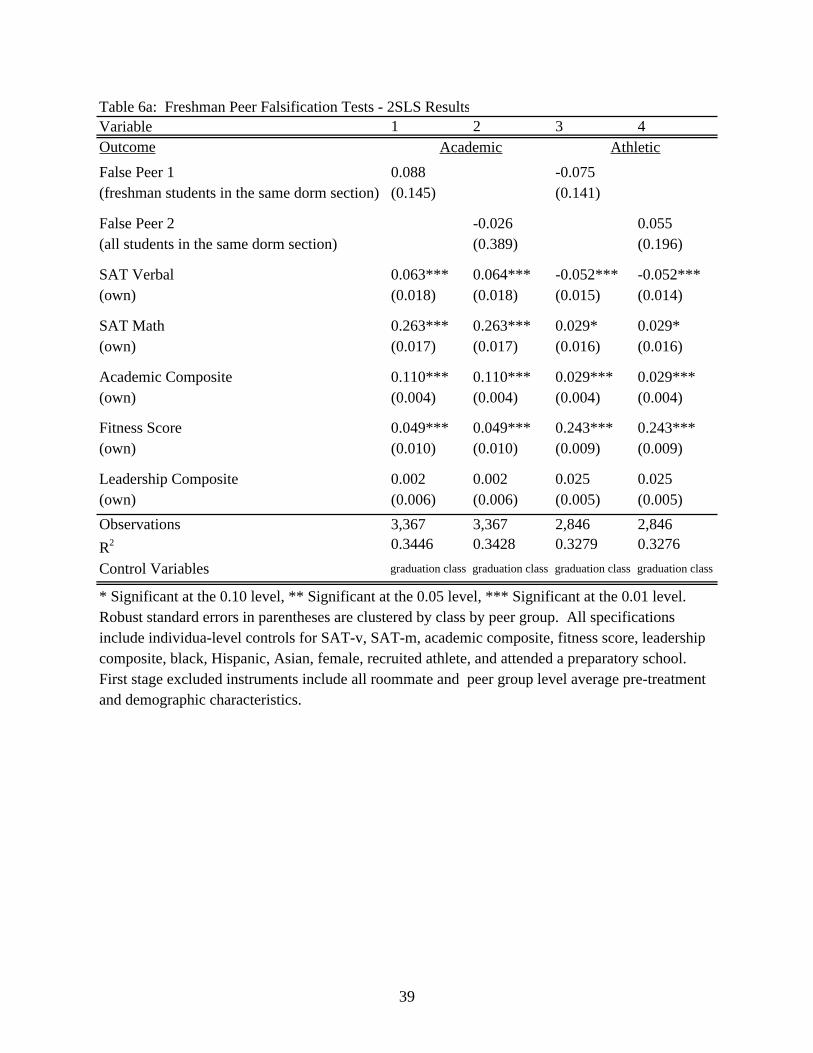
39
Table 6a: Freshman Peer Falsification Tests - 2SLS Results
Variable 1 2 3 4
Outcome
False Peer 1
(freshman students in the same dorm section)
0.088
(0.145)
-0.075
(0.141)
False Peer 2
(all students in the same dorm section)
-0.026
(0.389)
0.055
(0.196)
SAT Verbal
(own)
0.063***
(0.018)
0.064***
(0.018)
-0.052***
(0.015)
-0.052***
(0.014)
SAT Math
(own)
0.263***
(0.017)
0.263***
(0.017)
0.029*
(0.016)
0.029*
(0.016)
Academic Composite
(own)
0.110***
(0.004)
0.110***
(0.004)
0.029***
(0.004)
0.029***
(0.004)
Fitness Score
(own)
0.049***
(0.010)
0.049***
(0.010)
0.243***
(0.009)
0.243***
(0.009)
Leadership Composite
(own)
0.002
(0.006)
0.002
(0.006)
0.025
(0.005)
0.025
(0.005)
Observations 3,367 3,367 2,846 2,846
R2 0.3446 0.3428 0.3279 0.3276
Control Variables graduation class graduation class graduation class graduation class
Academic Athletic
* Significant at the 0.10 level, ** Significant at the 0.05 level, *** Significant at the 0.01 level.
Robust standard errors in parentheses are clustered by class by peer group. All specifications
include individua-level controls for SAT-v, SAT-m, academic composite, fitness score, leadership
composite, black, Hispanic, Asian, female, recruited athlete, and attended a preparatory school.
First stage excluded instruments include all roommate and peer group level average pre-treatment
and demographic characteristics.
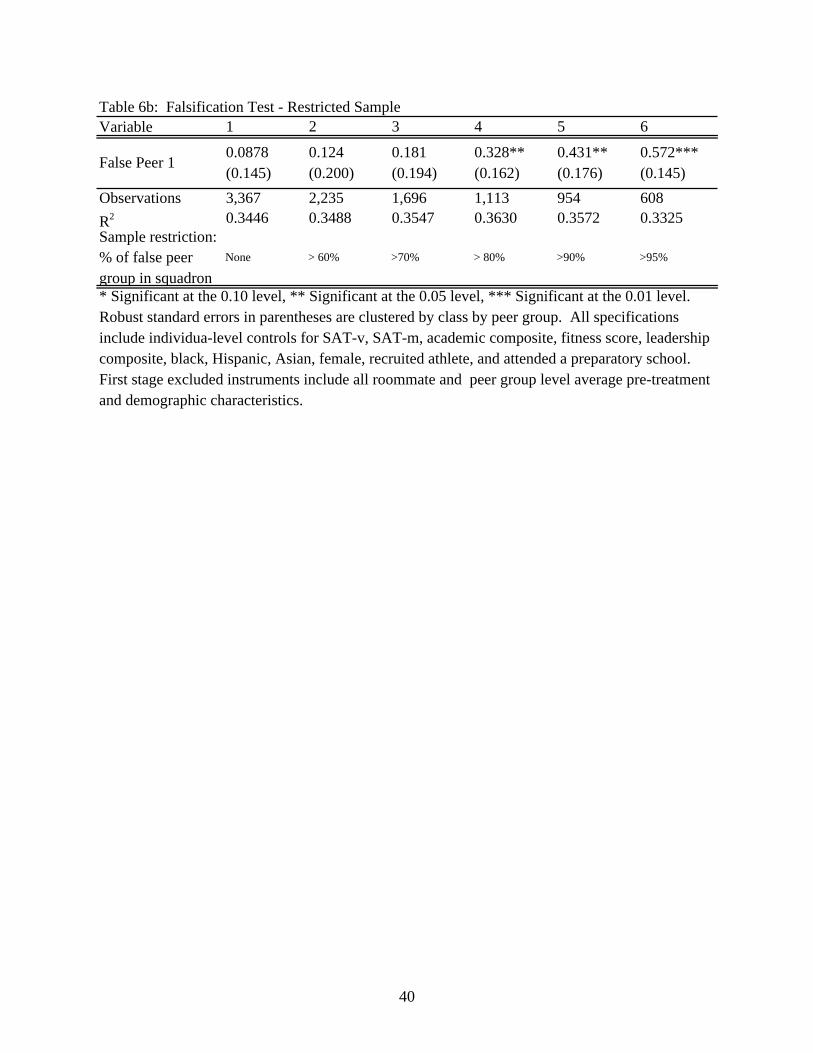
40
Table 6b: Falsification Test - Restricted Sample
Variable 1 2 3 4 5 6
False Peer 1 0.0878
(0.145)
0.124
(0.200)
0.181
(0.194)
0.328**
(0.162)
0.431**
(0.176)
0.572***
(0.145)
Observations 3,367 2,235 1,696 1,113 954 608
R2 0.3446 0.3488 0.3547 0.3630 0.3572 0.3325
Sample restriction:
% of false peer
group in squadron
None > 60% >70% > 80% >90% >95%
* Significant at the 0.10 level, ** Significant at the 0.05 level, *** Significant at the 0.01 level.
Robust standard errors in parentheses are clustered by class by peer group. All specifications
include individua-level controls for SAT-v, SAT-m, academic composite, fitness score, leadership
composite, black, Hispanic, Asian, female, recruited athlete, and attended a preparatory school.
First stage excluded instruments include all roommate and peer group level average pre-treatment
and demographic characteristics.
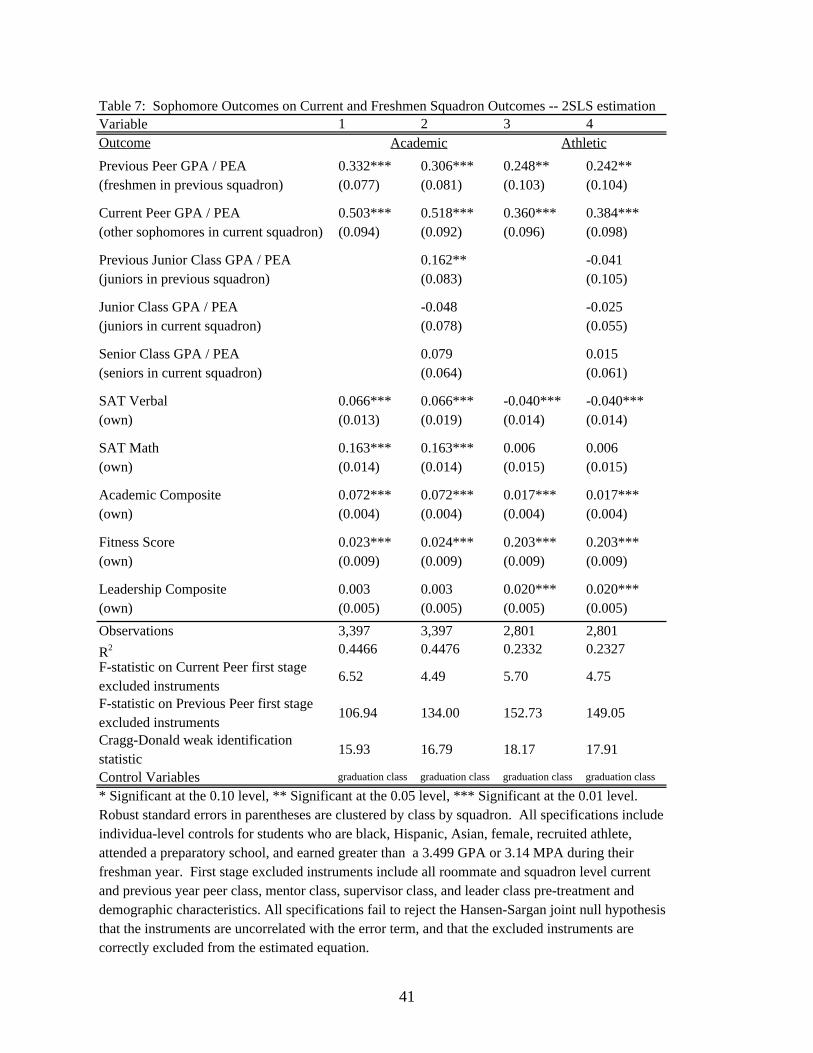
41
Variable 1 2 3 4
Outcome
Previous Peer GPA / PEA
(freshmen in previous squadron)
0.332***
(0.077)
0.306***
(0.081)
0.248**
(0.103)
0.242**
(0.104)
Current Peer GPA / PEA
(other sophomores in current squadron)
0.503***
(0.094)
0.518***
(0.092)
0.360***
(0.096)
0.384***
(0.098)
Previous Junior Class GPA / PEA
(juniors in previous squadron)
0.162**
(0.083)
-0.041
(0.105)
Junior Class GPA / PEA
(juniors in current squadron)
-0.048
(0.078)
-0.025
(0.055)
Senior Class GPA / PEA
(seniors in current squadron)
0.079
(0.064)
0.015
(0.061)
SAT Verbal
(own)
0.066***
(0.013)
0.066***
(0.019)
-0.040***
(0.014)
-0.040***
(0.014)
SAT Math
(own)
0.163***
(0.014)
0.163***
(0.014)
0.006
(0.015)
0.006
(0.015)
Academic Composite
(own)
0.072***
(0.004)
0.072***
(0.004)
0.017***
(0.004)
0.017***
(0.004)
Fitness Score
(own)
0.023***
(0.009)
0.024***
(0.009)
0.203***
(0.009)
0.203***
(0.009)
Leadership Composite
(own)
0.003
(0.005)
0.003
(0.005)
0.020***
(0.005)
0.020***
(0.005)
Observations 3,397 3,397 2,801 2,801
R2 0.4466 0.4476 0.2332 0.2327
F-statistic on Current Peer first stage
excluded instruments6.52 4.49 5.70 4.75
F-statistic on Previous Peer first stage
excluded instruments106.94 134.00 152.73 149.05
Cragg-Donald weak identification
statistic15.93 16.79 18.17 17.91
Control Variables graduation class graduation class graduation class graduation class
Academic Athletic
* Significant at the 0.10 level, ** Significant at the 0.05 level, *** Significant at the 0.01 level.
Robust standard errors in parentheses are clustered by class by squadron. All specifications include
individua-level controls for students who are black, Hispanic, Asian, female, recruited athlete,
attended a preparatory school, and earned greater than a 3.499 GPA or 3.14 MPA during their
freshman year. First stage excluded instruments include all roommate and squadron level current
and previous year peer class, mentor class, supervisor class, and leader class pre-treatment and
demographic characteristics. All specifications fail to reject the Hansen-Sargan joint null hypothesis
that the instruments are uncorrelated with the error term, and that the excluded instruments are
correctly excluded from the estimated equation.
Table 7: Sophomore Outcomes on Current and Freshmen Squadron Outcomes -- 2SLS estimation
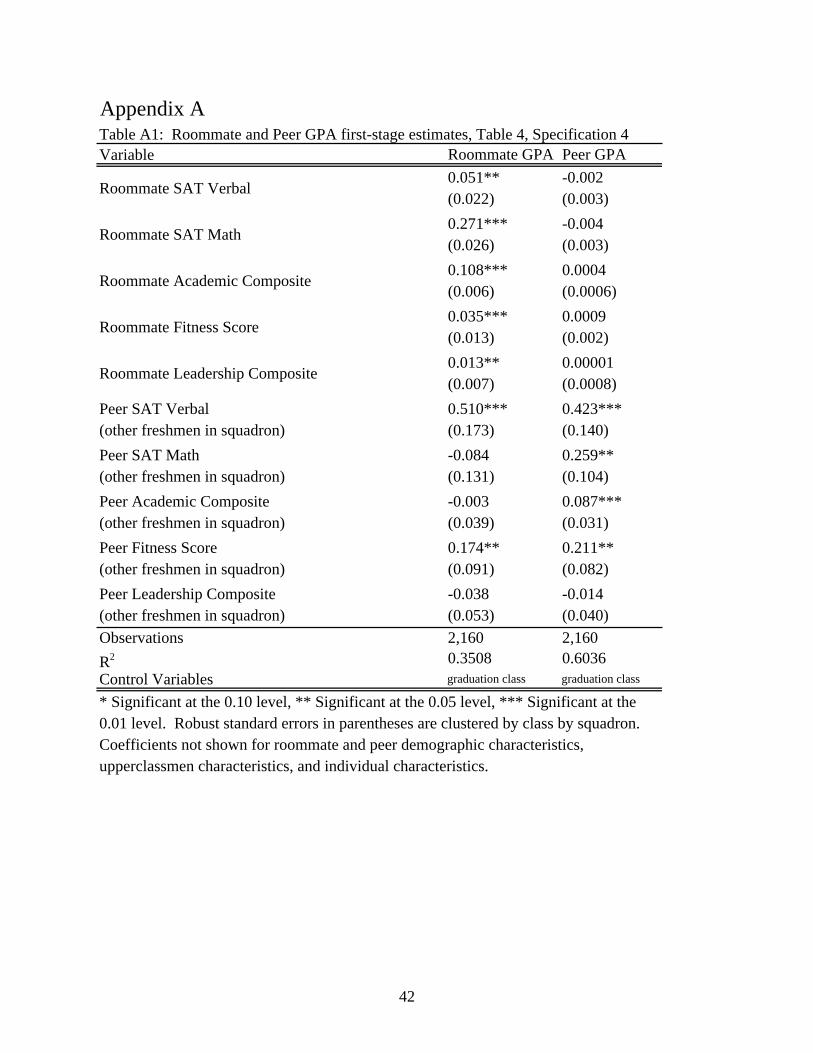
42
Appendix A
Variable Roommate GPA Peer GPA
Roommate SAT Verbal0.051**
(0.022)
-0.002
(0.003)
Roommate SAT Math0.271***
(0.026)
-0.004
(0.003)
Roommate Academic Composite0.108***
(0.006)
0.0004
(0.0006)
Roommate Fitness Score0.035***
(0.013)
0.0009
(0.002)
Roommate Leadership Composite0.013**
(0.007)
0.00001
(0.0008)
Peer SAT Verbal
(other freshmen in squadron)
0.510***
(0.173)
0.423***
(0.140)
Peer SAT Math
(other freshmen in squadron)
-0.084
(0.131)
0.259**
(0.104)
Peer Academic Composite
(other freshmen in squadron)
-0.003
(0.039)
0.087***
(0.031)
Peer Fitness Score
(other freshmen in squadron)
0.174**
(0.091)
0.211**
(0.082)
Peer Leadership Composite
(other freshmen in squadron)
-0.038
(0.053)
-0.014
(0.040)
Observations 2,160 2,160
R2 0.3508 0.6036
Control Variables graduation class graduation class
* Significant at the 0.10 level, ** Significant at the 0.05 level, *** Significant at the
0.01 level. Robust standard errors in parentheses are clustered by class by squadron.
Coefficients not shown for roommate and peer demographic characteristics,
upperclassmen characteristics, and individual characteristics.
Table A1: Roommate and Peer GPA first-stage estimates, Table 4, Specification 4