pedelec user study: safety insights into an emerging vehicle
TRANSCRIPT

9th International Cycling Safety Conference
4–6th November 2020, Lund, Sweden
ABSTRACT 1
The aim of this study is to understand the real-world use of both bicycles and Pedelecs in order 2 to contribute to an increased road safety of both vehicle types. Due to a lack of in-depth 3 information in the user research thus far, a quantitative user study was conducted (survey 4 details: period June/ July 2020, countries GER, CH, NL, FR, UK and USA; participants: N = 3026, 5 Ø age 44.07 years, 49.6 % female, bicycle or Pedelec owner). 6
The survey results indicate that Pedelecs compared to bicycles are used more for everyday 7 purposes (+20 % commuting and errands), more frequently (+50 %), and more for traveling 8 longer distances (+60 %). The riders try to compensate for their higher accident exposure by 9 increasing their visibility in road traffic (e.g. light-reflecting vests +9 %) and by wearing a helmet 10 (+9 %). Most accidents occur in urban areas (70 %) and at intersections (29 %), which motivates 11 the improvement of traffic and bicycle infrastructure. Car- and truck-side systems such as 12 turning assistants, reverse driving assistance, and dismounting warning systems can effectively 13 mitigate potential conflicts as well. Single bicycle accidents occur second most frequently after 14 passenger car accidents. In comparison, single Pedelec accidents are 13% less frequent, but 15 accidents involving other vulnerable road users are more frequent. Therefore, the infrastructure 16 should be adapted to the increasingly multimodal use and anti-lock braking systems (ABS) 17 should be used to achieve short braking distances. In 18 % of the cases, the injured cyclists and 18 Pedelec riders did not receive direct medical help, which can be reduced by eCall systems. 19
If these challenges regarding road safety are solved, the user study shows that both bicycles and 20 Pedelecs can be established even more strongly as a sustainable and safe means of transport in 21 the mobility mix of the future. 22
Keywords: Pedelec, safety, user study, accident analysis. 23
24
Pedelec user study: Safety insights into an emerging vehicle
Dr. O. Maier*, Dr. S. Hattula*, S. Schneider*, J. Moennich#, T. Lich#
* Bosch eBike Systems Robert Bosch GmbH
Gerhard-Kindler-Strasse 3, 72770 Reutlingen, Germany
e-mail: [email protected]
# Bosch Accident Research Robert Bosch GmbH
Robert-Bosch-Campus 1, 71272 Reutlingen, Germany

2
1 INTRODUCTION 25
Two-wheelers, with and without electric drive, are the means of transport of the moment. 26 Already in the past years and again strengthened by the SARS-COV-2 pandemic since the year 27 2020, the bicycle industry undergoes a dynamic growth. In the future, it can be assumed that 28 every second bicycle sold in Europe will be a Pedelec (acronym for pedal electric cycle). The 29 prerequisite for this strong spread of the Pedelec is the increasing diffusion into different types. 30 In 2020, according to statistics from the German two-wheeler industry association, the 31 distribution was as follows: eCity/Urban 28 %, eTrekking 35.5 %, eCargo 4 %, eMTB 30 %, eRoad 32 0.5 %, and S-Pedelecs 0.5 % (Eisenberger, 2021). It should be noted that the eCargo and eMTB 33 types have the highest growth rates, whereas the S-Pedelec has little appeal due to stricter 34 regulation in the L1e-B class. The quality and safety awareness of buyers is encouraging, which 35 ensures that Pedelecs are purchased with high equipment standards. This fact given in 36 combination with the available electrical energy and computing power on Pedelecs pave the 37 way for assistance systems to increase safety in cycling. 38
Bosch eBike Systems has already launched the world's first production-ready ABS (acronym for 39 anti-lock braking system) for Pedelecs in 2018 (Bosch eBike Systems, ABS, 2021). ABS enables 40 controlled braking even under difficult conditions. The ABS for Pedelecs was developed by 41 Bosch, based on the already established ABS for motorcycles. The combination of front wheel 42 ABS and rear wheel lift-off control makes Pedelec riding safer. During difficult braking 43 manoeuvres, the braking pressure of the front brake is regulated and thus an optimum is found 44 in the trade-off between stability and deceleration in the given riding situation. In addition to 45 the ABS, Bosch eBike Systems launched the Help Connect feature via App as a passive safety 46 system in 2020 (Bosch eBike Systems, Help Connect, 2021). In the event of a fall, an emergency 47 call is made. This alerts a trained service team that is available around the clock and immediately 48 notifies emergency services in case needed. 49
This manuscript examines the road safety on the market development of Pedelecs, considering 50 both the specifics of Pedelec use, which were collected in the form of a quantitative user study, 51 and the benefits of safety systems. In addition to the introduction, the manuscript is divided into 52 four chapters. Chapter 2 gives an overview about the current state-of-the-art and explains the 53 materials and methods used for gaining the results. Chapter 3 describes in detail the new 54 insights on Pedelec usage characteristics, safety behaviour, accident experience and future role. 55 Chapter 4 discusses the implications of the findings on Pedelec road safety and deduces 56 recommendations for action. Chapter 5 summarizes the manuscript and draws conclusions on 57 the presented content. 58
59

3
2 MATERIAL AND METHOD 60
2.1 Official accident statistics 61
The road safety of Pedelecs is essential for the long-term establishment of this mode of 62 transport. It should be noted that in most countries, Pedelecs are not specifically included in 63 official accident statistics or have only been included for a relatively short period of time (e.g. in 64 Germany since 2014, (Gehlert, 2014)). Furthermore, the development of accident statistics is 65 just as dynamic as the development of the Pedelec market, which is why short-term trends must 66 be distinguished from long-term trends. 67
For example, the strong increase in accident figures according to DESTATIS1 for bicycle and 68 Pedelec accidents in Germany in 2018 and 2019, which can be seen in Figure 1, is basically due 69 to a dry and warm climate (Kirsche, Lux, & Friedrich, Deutschlandwetter im Jahr 2018, 2018) 70 (Kirsche & Friedrich, Deutschlandwetter im Jahr 2019, 2019), which leads to increased bicycle 71 and Pedelec use. The opposite influence of climate on accident occurrence is evident in 2010, in 72 which a very pronounced phase with wintry conditions prevailed in Germany over the year as a 73 whole (esp. Jan.-March and Nov.-Dec.) (Kirsche & Lux, Deutschlandwetter im Jahr 2010, 2010). 74 Such a climatic constellation causes that less bicycles and (in 2010 still hardly existing) Pedelecs 75 are ridden and at the same time the drivers of motorized vehicles such as cars act more 76 cautiously in traffic. 77
In general, the trend of bicycle accidents has been increasing for more than ten years (e.g. in 78 Germany for bicycle and Pedelec accidents with personal injury2 by +18% since 2004, see Figure 79 1), whereby the number of bicycle and Pedelec riders killed in Europe (Adminaité-Fodor & Jost, 80 2020) in general and in Germany (see Figure 1) in particular is at the same level as in 2004. 81 Compared to motor vehicles, motorcycles and pedestrians, there is a need for action for bicycles 82 and Pedelecs. 83
84
85
Figure 1: Official bicycle and Pedelec accidents in Germany since 2004, Source: DESTATIS 86
87
1 German Federal Statistical Office (DESTATIS) on “traffic accidents” published annually 2 Accidents with personal injury are those in which persons were injured or killed, irrespective of the amount of damage to property, cf. DESTATIS on “Verkehrsunfälle, Grundbegriffe der Verkehrsunfall-statistik”, published on 26.03.2021.

4
Figure 2 and Figure 3 show the age distribution of bicycle and Pedelec users (Nobis & Kuhnimhof, 88 2019) as well as the age distribution of riders who were involved in accidents and killed in 89 Germany according to DESTATIS. Older riders on bicycles and Pedelecs are at increased risk of 90 fatal accidents. Furthermore, the use of bicycles is very similar across all age groups, with a 91 noticeable difference among schoolchildren (10-19 years). In contrast, Pedelec use varies greatly 92 across age groups and is found primarily in the age group 50 years or older. The age distribution 93 of users of bicycles and Pedelecs coincides with the age distribution of riders involved in 94 accidents, which leads to the following conclusions: 95
• The general accident risk correlates with use (independent of age). 96 • The risk of a fatal accident correlates with age (independent of use) 97
98
Consequently, it is necessary to (1) understand the actual use of bicycles and Pedelecs in detail, 99 and (2) identify further age-specific risk factors in order to deduce recommendations for action. 100 The aim of this paper is to give new insights on these questions through the results of a detailed 101 user study and thus contribute to an increased road safety of bicycles and Pedelecs. 102
103
104
Figure 2: Age distribution of bicycle casualties and users, 105 according to DESTATIS and (Nobis & Kuhnimhof, 2019) 106
107
108
Figure 3: Age distribution of Pedelec casualties and users, 109 according to DESTATIS and (Nobis & Kuhnimhof, 2019) 110
5
2.2 User study 111
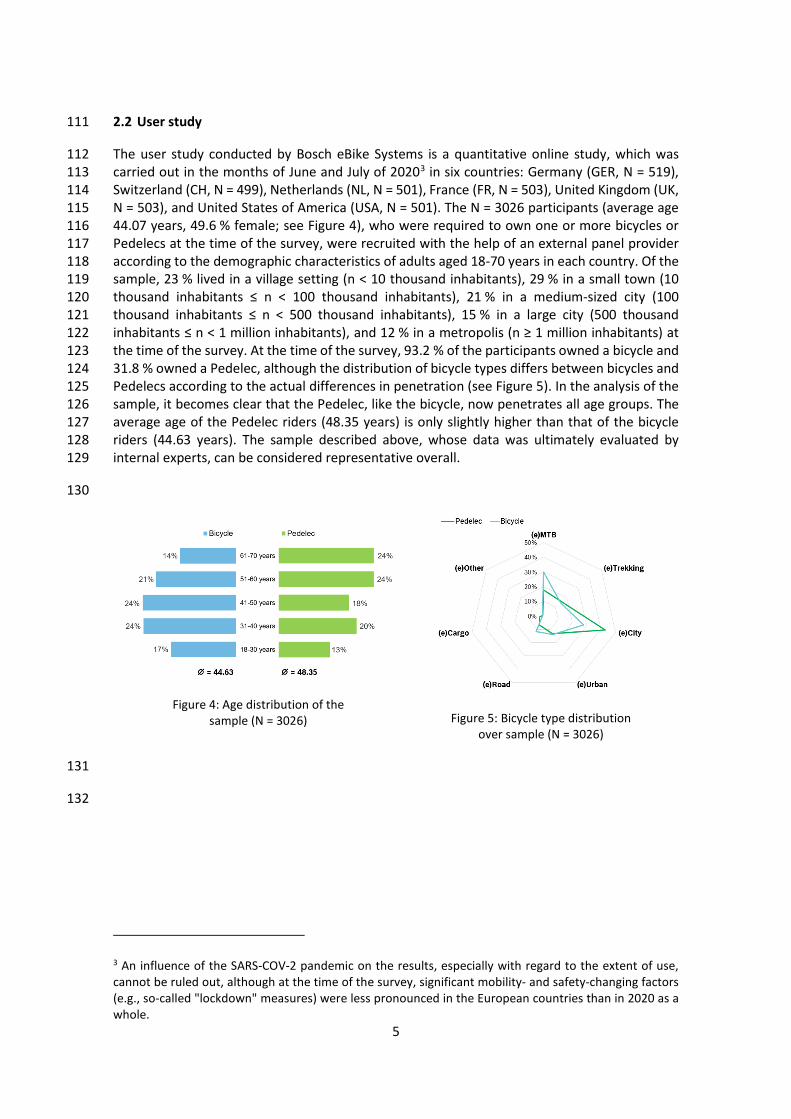
The user study conducted by Bosch eBike Systems is a quantitative online study, which was 112 carried out in the months of June and July of 20203 in six countries: Germany (GER, N = 519), 113 Switzerland (CH, N = 499), Netherlands (NL, N = 501), France (FR, N = 503), United Kingdom (UK, 114 N = 503), and United States of America (USA, N = 501). The N = 3026 participants (average age 115 44.07 years, 49.6 % female; see Figure 4), who were required to own one or more bicycles or 116 Pedelecs at the time of the survey, were recruited with the help of an external panel provider 117 according to the demographic characteristics of adults aged 18-70 years in each country. Of the 118 sample, 23 % lived in a village setting (n < 10 thousand inhabitants), 29 % in a small town (10 119 thousand inhabitants ≤ n < 100 thousand inhabitants), 21 % in a medium-sized city (100 120 thousand inhabitants ≤ n < 500 thousand inhabitants), 15 % in a large city (500 thousand 121 inhabitants ≤ n < 1 million inhabitants), and 12 % in a metropolis (n ≥ 1 million inhabitants) at 122 the time of the survey. At the time of the survey, 93.2 % of the participants owned a bicycle and 123 31.8 % owned a Pedelec, although the distribution of bicycle types differs between bicycles and 124 Pedelecs according to the actual differences in penetration (see Figure 5). In the analysis of the 125 sample, it becomes clear that the Pedelec, like the bicycle, now penetrates all age groups. The 126 average age of the Pedelec riders (48.35 years) is only slightly higher than that of the bicycle 127 riders (44.63 years). The sample described above, whose data was ultimately evaluated by 128 internal experts, can be considered representative overall. 129
130
Figure 4: Age distribution of the sample (N = 3026)
Figure 5: Bicycle type distribution over sample (N = 3026)
131
132
3 An influence of the SARS-COV-2 pandemic on the results, especially with regard to the extent of use, cannot be ruled out, although at the time of the survey, significant mobility- and safety-changing factors (e.g., so-called "lockdown" measures) were less pronounced in the European countries than in 2020 as a whole.

6
3 RESULTS 133
The results presented are divided into four subsections. The first subchapter deals with bicycle 134 and Pedelec use in general, whereas the second subchapter focuses on the safety behaviour of 135 users in particular. Subchapter three focuses on accident experience and compares this with the 136 usage characteristics found. The concluding fourth subchapter looks into the future and shows 137 the potential role of the Pedelec in the mobility mix. 138
3.1 Usage characteristics 139
Bicycle and Pedelec usage characteristics are presented in this subsection based on categories: 140 trip characteristics, route profiles, and environmental conditions. 141
3.1.1 Trip characteristics 142
The starting point for the analysis of bicycle or Pedelec use is the question about the use cases 143 that respondents do by bicycle or Pedelec: 144
"What are the specific occasions/ situations you are using your bike/ Pedelec?" 145
146
The results of the study are shown in Figure 6, where it is striking that Pedelecs are used more 147 frequently for commuting (+19 %) and errands (+13 %) than bicycles. Conversely, Pedelecs are 148 used less as sports equipment than bicycles (-14 %). 149
150
151
Figure 6: Use cases of bicycle and Pedelec (N = 3026) 152
153
The results indicate greater use of the Pedelec as an everyday vehicle compared to the bicycle. 154 This can be proven by the questions about frequency of use and distance typically travelled: 155
"Do you ride a Pedelec more often (in terms of frequency of use) than a "regular" bicycle?" 156
"How many kilometres do you travel approximately on your bike/ Pedelec per year on average 157 (i.e., sum of all distances)?" 158
159

7
The survey results show that Pedelecs are used more frequently (+67 %) and for longer distances 160 (+60 %) than bicycles across all countries. It is interesting to note the strong difference in 161 absolute distances travelled between the individual countries (see Figure 7). In NL, followed by 162 GER and FR, the greatest distances in absolute terms are covered by bicycle and Pedelec. 163
164
165
Figure 7: Mileage of bicycle and Pedelec in km per year (median, N = 3026) 166
167
3.1.2 Route profiles 168
The survey results regarding route profiles were similar to a large extent between bicycle and 169 Pedelec. Of interest are the results to the questions about topography and sub-terrain, i.e., road 170 surface: 171
"What type of terrain do you predominantly ride on when you travel the routes by bicycle/ 172 Pedelec?" 173
"What types of surfaces are you predominantly traveling on when you travel the routes by 174 bicycle/ Pedelec?" 175
176
Most trips are made with both types of vehicles on flat surfaces (see Figure 8) and on asphalt 177 (see Figure 9). Pedelecs are used slightly more often (+6 %) in hilly topography, but less on trails 178 (-6 %). The latter finding is consistent with the reduced use of Pedelecs for athletic use compared 179 to bicycles from the use case analysis. The former finding is consistent with similar studies 180 (Dozza, Werneke, & Mackenzie, 2013) and can be seen as a consequence of the increased use 181 of Pedelecs as an everyday vehicle, in which route choice is more limited than for recreational 182 trips (e.g. commuting or shopping). 183
184
185
Figure 8: Topography of bicycle and Pedelec trips (N = 3026) 186

8
187
188
Figure 9: Road surface of bicycle and Pedelec trips (N = 3026) 189
190
3.1.3 Environmental conditions 191
Based on the results of the trip characteristics and route profiles, it can be assumed that due to 192 the use of the Pedelec as an everyday vehicle, it is subject to a higher exposure to challenging 193 environmental conditions. The two relevant questions in this context about the season and 194 weather conditions during bicycle and Pedelec use confirm this assumption: 195
"At what time of year do you ride your bicycle/ Pedelec at least occasionally?" 196
"In which of the following weather conditions do you ride your bicycle/ Pedelec at least 197 occasionally?" 198
199
Bicycles and Pedelecs are used to a comparable extent in good weather conditions (see Figure 200 10) and in the seasons of spring (88 % to 87 %), summer (94 % to 92 %), and fall (75 % to 77 %). 201 According to Figure 10, bad weather conditions such as especially rain (+5 %), fog (+8 %), and 202 changing conditions (+6 %) expose Pedelec riders more often than bicycle riders. Due to the 203 modal shift towards Pedelecs for commuting, Pedelecs are also more likely to be used in winter 204 conditions than bicycles (37 % to 31 %). 205
206
207
Figure 10: Weather conditions for bicycle and Pedelec use (N = 3026) 208
209
From the survey results on the riding profiles, it can be summarized that Pedelecs are used more 210 than bicycles for everyday purposes, are used more frequently, are used to travel longer 211

9
distances and are used more independently of the weather. Due to the associated higher 212 exposure to accidents, the next subchapter is devoted to the safety behaviour of users. 213
3.2 Safety behaviour 214
The safety behaviour is analysed based on the user’s accident anxiety and riding behaviour 215 adaption, the used safety products, and the readiness for preventive maintenance. 216
3.2.1 Accident anxiety and riding behaviour adaption 217
The survey result regarding... 218
"How worried are you about being involved in an accident with your bike/ Pedelec?" 219
220
... shows a high level of uncertainty among users. Only 21 % of the respondents for bicycles and 221 24 % for Pedelecs consider their individual accident risk to be low, whereas 39 % of the 222 respondents for both bicycles and Pedelecs consider their individual accident risk to be high. The 223 pronounced subjectively perceived uncertainty of bicycle and Pedelec riders has a considerable 224 influence on their riding behaviour, as the survey results show in response to the following 225 question: 226
"To what extent does your concern about being involved in an accident with your bicycle/e-227 bike influence your driving behaviour?" 228
229
According to Figure 11, cyclists particularly avoid certain routes (53 %), weather conditions 230 (52 %), high speeds (42 %) and certain journey times (38 %) in response to concerns about 231 accidents. Apart from avoiding high speeds (also 42 %) and reducing motor assistance by 232 choosing a suitable riding mode (17 %), avoidance behaviour is less pronounced among Pedelec 233 riders than among cyclists (difference of 7 % to 11 %), which can be explained by the use of the 234 Pedelec as an everyday vehicle. Pedelec riders do not have the possibility to avoid certain 235 weather conditions, routes, or riding times. 236
237
238
Figure 11: Adaptation of cycling and Pedelec riding behavior across all countries (N = 2357) 239
240

10
The comparison of the individual countries is interesting (cf. Figure 12). In NL, for example, 241 where the bicycle is already the most established everyday vehicle and the cycling infrastructure 242 is the most developed (Castro, Kahlmeier, & Gotschi, 2018), 42 % of respondents perceive the 243 risk of accidents as low, while at the same time adapting their cycling behaviour significantly 244 less. For example, only 31 % of respondents avoid certain routes and only 19 % avoid certain 245 driving times. It follows that a high subjective safety of users can go hand in hand with the use 246 of bicycles and Pedelecs as everyday vehicles, provided that the general conditions are bicycle- 247 and Pedelec-friendly. 248
249
250
Figure 12: Adaptation of bicycle and Pedelec riding behavior for individual countries 251 (NGER = 405, NCH = 389, NNL = 293, NFR = 417, NUK = 434, NUSA = 419) 252
253
3.2.2 Used safety products 254
Due to the subjective uncertainty in combination with limited possibilities to adapt the riding 255 behaviour, especially among Pedelec riders, the question arises whether and in what form the 256 respondents make use of safety products such as a helmet. The survey result to the question... 257
"How often do you wear the following products while riding your bike/ Pedelec?" 258
259
... shows that Pedelec riders generally use safety products on their vehicle (e.g. +14 % rear view 260 mirrors) and on themselves as riders more often than cyclists (cf. Figure 13). The respondents 261 across all countries state that they always wear a helmet on their Pedelec (+4 %) and often wear 262 a helmet (+5 %) compared to their bicycle4. A similar picture emerges for the use of both light-263 reflecting waistcoats (+5 % always and +4 % frequently) and clothing with sewn-in light 264 reflectors (+3 % always and + 6 % frequently). These data suggest that Pedelec riders, due to 265 their subjectively perceived uncertainty in combination with their increased exposure to 266 accidents, try to reduce their individual accident risk by increasing their visibility in road traffic 267 and by wearing a helmet. 268
269
4 The figures for bicycles and pedelecs in GER (33% of respondents always wear a helmet) are in line with the figures collected by (Nobis & Kuhnimhof, 2019) (34% of respondents always wear a helmet).

11
270
Figure 13: Safety products worn when using bicycle and Pedelec (N = 3026) 271
272
3.2.3 Preventive maintenance 273
In addition to the safety products used, the maintenance of the bicycle or Pedelec is another 274 effective safety measure. The readiness for maintenance as well as the type of maintenance 275 were surveyed with the following questions: 276
"How regularly is your bike/ Pedelec maintained?" 277
"And who usually carries out the maintenance on your bike/ Pedelec?" 278
279
The survey result for both questions is very encouraging, especially for the Pedelec. 67 % of 280 respondents follow the typical manufacturer recommendation to service the Pedelec at least 281 once a year. Maintenance is carried out by trained experts in specialist shops by 54 % of 282 respondents. Compared to the Pedelec, the results for the bicycle with 55 % annual 283 maintenance interval and 38 % maintenance by specialist dealers are lower but seem justified 284 due to the lower frequency of use and mileage. 285
3.3 Accident experience 286
The following subchapter presents the accident experience by the respondents. Of the entire 287 sample, in response to the question... 288
"Have you ever been involved in an accident yourself as a rider of a bicycle/ Pedelec?" 289
290
... 15 % of the respondents stated that they had been involved in a bicycle (Accident, Bicycle = 317; 291 14.5 %) or Pedelec accident (Accident, Pedelec = 127; 15.2 %) at least once. The accident analyses 292 presented in the following are based on the statements of this subset of the total sample (Accident 293 = 444) and present the course of the accident, starting from the trip purpose, through the 294 environmental and traffic conditions, to the consequences and recording of the accident. 295
3.3.1 Trip purpose 296
The use cases for bicycle and Pedelec use that preceded the accident were surveyed with the 297 following question: 298

12
"For what specific occasion were you using a bicycle/ Pedelec when this most recent accident 299 involving you as a bicycle/ Pedelec rider occurred in terms of time?" 300
301
The study result shows that the distribution of use cases for bicycle and Pedelec largely coincides 302 with the identified distribution of use cases for all bicycle and Pedelec trips, as expected (cf. 303 Figure 14 with Figure 6). Pedelec riders have more accidents in everyday situations than cyclists. 304 In addition to commuting to work (+14 %), the transport of children (+17 %) is particularly 305 noticeable. However, this does not mean that transporting children is dangerous. With a 306 Pedelec, this is merely made easier and is used more than with bicycles, as the electric drive 307 compensates for the weight of the children and a possible trailer. Thus, (ADAC, 2021) 308 recommends that users enquire at specialist retailers whether and how child seats and trailers 309 are possible with the respective Pedelec model. In addition, children should always wear a 310 suitable helmet. 311
312
313
Figure 14: Use cases of bicycle and Pedelec with accident consequences (N = 444) 314
315
In line with the identified use cases, Pedelec riders were asked... 316
"At what time of day did the last accident with you as a bicycle/e-bike rider occur?" 317
318
... were involved in an accident more evenly throughout the day (30 % in the morning, 40 % at 319 midday, 25 % in the evening and 5 % at night) and thus more frequently in the morning (+8 %) 320 and in the evening (+4 %) compared to cyclists. 321
3.3.2 Environmental conditions 322
When asked about the location, road surface and weather conditions at the time of the 323 accident.... 324
"Where did this last accident with you as a cyclist/ Pedelec rider happen?" 325
"Can you remember the road surface of the location of your last accident with you as a cyclist/ 326 Pedelec rider?" 327
13
"What were the weather conditions like at the time of the last accident involving you as a 328 cyclist/ Pedelec rider?" 329
330
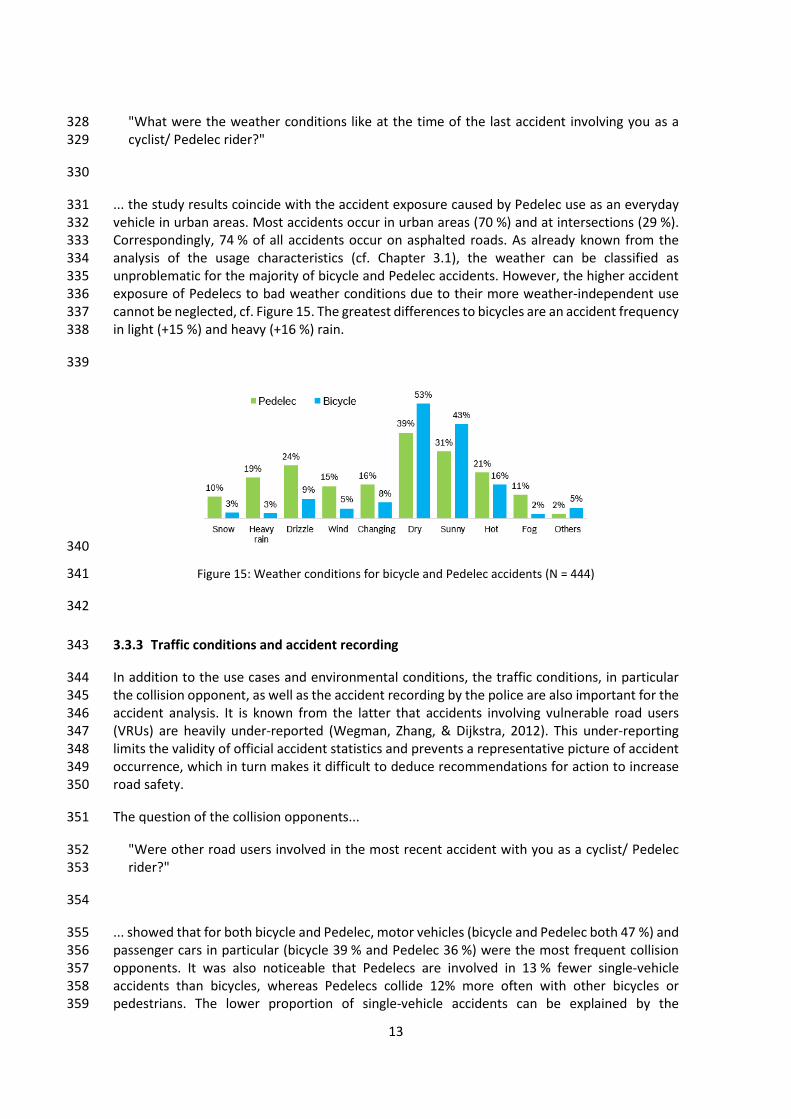
... the study results coincide with the accident exposure caused by Pedelec use as an everyday 331 vehicle in urban areas. Most accidents occur in urban areas (70 %) and at intersections (29 %). 332 Correspondingly, 74 % of all accidents occur on asphalted roads. As already known from the 333 analysis of the usage characteristics (cf. Chapter 3.1), the weather can be classified as 334 unproblematic for the majority of bicycle and Pedelec accidents. However, the higher accident 335 exposure of Pedelecs to bad weather conditions due to their more weather-independent use 336 cannot be neglected, cf. Figure 15. The greatest differences to bicycles are an accident frequency 337 in light (+15 %) and heavy (+16 %) rain. 338
339
340
Figure 15: Weather conditions for bicycle and Pedelec accidents (N = 444) 341
342
3.3.3 Traffic conditions and accident recording 343
In addition to the use cases and environmental conditions, the traffic conditions, in particular 344 the collision opponent, as well as the accident recording by the police are also important for the 345 accident analysis. It is known from the latter that accidents involving vulnerable road users 346 (VRUs) are heavily under-reported (Wegman, Zhang, & Dijkstra, 2012). This under-reporting 347 limits the validity of official accident statistics and prevents a representative picture of accident 348 occurrence, which in turn makes it difficult to deduce recommendations for action to increase 349 road safety. 350
The question of the collision opponents... 351
"Were other road users involved in the most recent accident with you as a cyclist/ Pedelec 352 rider?" 353
354
... showed that for both bicycle and Pedelec, motor vehicles (bicycle and Pedelec both 47 %) and 355 passenger cars in particular (bicycle 39 % and Pedelec 36 %) were the most frequent collision 356 opponents. It was also noticeable that Pedelecs are involved in 13 % fewer single-vehicle 357 accidents than bicycles, whereas Pedelecs collide 12% more often with other bicycles or 358 pedestrians. The lower proportion of single-vehicle accidents can be explained by the 359

14
predominantly urban use of the Pedelec on a road with good grip (see previous section on 360 environmental conditions), but also shows, as determined for example in (Schepers, Klein Wolt, 361 Helbich, & Fishman, 2020) or (Twisk, Stelling, Van Gent, De Groot, & Vlakveld, 2021), that the 362 Pedelec is easy to control (supported for example by a good technical state). On the other hand, 363 the confined traffic space and the resulting lack of opportunities for VRUs to avoid each other 364 seems to be critical. 365
Due to the deviating distribution of the collision opponents as well as Pedelec-specific trends 366 such as the increased use of leasing offers, which in some cases contractually require the police 367 to record the accident, the following question is of particular interest: 368
"Were the police called at your last accident involving you as a bicycle/Pedelec rider?" 369
370
The study result shows that in 79 % of bicycle accidents the police were not notified and 371 consequently the accident was not recorded in the official accident statistics. In contrast, the 372 under-reporting rate for Pedelec accidents is significantly lower by 24 % and amounts to 55 % in 373 absolute terms. These different under-reporting rates show another problem area in accident 374 research in the context of bicycles and Pedelecs. If the under-reporting rates of both vehicle 375 types differ, comparative statements based on official accident statistics are difficult. This 376 applies in particular to accidents with low injury severity of the participants, as is often the case 377 in solo accidents of VRUs as well as in accidents of VRUs among themselves. The latter also 378 explains the discrepancy between the collision opponents shown in DESTATIS and the collision 379 opponents found above. 380
3.3.4 Accident consequence 381
The injury severity determined in this user study based on the following question.... 382
"What were the consequences for you personally of the last accident with you as a cyclist/ 383 Pedelec rider in terms of time?" 384
385
... shows Figure 16. As expected, the average injury severity is lower for bicycles and Pedelecs 386 when corrected for age in comparison to the official accident statistics according to DESTATIS. 387 The higher proportion of seriously injured Pedelecs compared to bicycles (+7 %) is also striking, 388 which can be explained by the higher accident exposure of the Pedelec as an everyday vehicle, 389 especially in urban areas (in particular collisions with other road users). Compared to the official 390 accident statistics presented in Chapter 2.1, the age factor does not have an effect here, as the 391 sample for bicycles and Pedelecs is almost equally distributed in the respective age categories. 392 The explanation for the higher proportion of non-injured Pedelec users than bicyclists is the 393 better technical condition of Pedelecs, as well as the greater riding experience of Pedelec users, 394 e.g. as commuters. 395
Another interesting question regarding the consequence of accidents is: 396
"At the time of the last accident involving you as a cyclist/ Pedelec rider, were your injuries 397 directly treated?" 398
399

15
The study result shows that of the cyclists and Pedelec riders involved in accidents, 36 % received 400 no help, 23 % received first aid and 41 % received subsequent medical care. Compared to Figure 401 16, the difference between non-injured and non-assisted riders is 18 %. 402
403
404
Figure 16: Injury severity in bicycle and Pedelec accidents (N = 444) 405
3.4 Future role 406
The following subchapter analyses the planned and actual modal shift to the Pedelec, as well as 407 the planned and actual distances travelled with the Pedelec. In addition, the views and wishes 408 of the participants are presented, which can be understood as recommendations for action to 409 establish the Pedelec even more strongly as a sustainable and safe means of transport in the 410 mobility mix of the future. 411
3.4.1 Modal shift 412
The study results to the questions… 413
"Which of the following means of transport do you think can replace the Pedelec?" 414
"And which distances that you used to travel by car do you now do with your Pedelec?" 415
416
... show that the expected benefits of respondents who do not yet own a Pedelec and the actual 417 benefits of respondents who already own a Pedelec are largely the same, see Table 1 and 2. 418
What is striking in the evaluation of the modal shift is the clear preference to replace the 419 conventional bicycle with a Pedelec. Consequently, more mixed traffic is to be expected on the 420 traffic infrastructure in general and on the cycling infrastructure in particular. In addition, it can 421 be assumed that some of the bicycles will continue to be owned but will be used significantly 422 less than before (cf. use cases in chapter 3.1). 423
424

16
Table 1: Modal shift from selected modes of transport to Pedelec (N = 3026) 425
Substitution of… Expectation Reality Difference Bicycle (conventional) 60 % 59 % -1 % Scooter and Moped 39 % 39 % 0 % Second passenger car 23 % 24 % +1 % First passenger car 18 % 20 % +2 %
426
The evaluation of the distances previously travelled by passenger car and now by Pedelec shows 427 that the expectations of future Pedelec users are significantly lower than the distances actually 428 travelled. Remarkable are the marked distances of >10 km, which are covered by 46 % of the 429 Pedelec owners. This result, in combination with the application cases found, underlines the use 430 of the Pedelec not only as an intra-urban, but also as an inter-urban commuting vehicle and 431 motivates the expansion of cycle paths. 432
433
Table 2: Substituted distances from car by Pedelec (N = 3026) 434
Distances formerly travelled by passenger car …
Expectation Reality Difference
<1 km 17 % 9 % -8 % 1-5 km 42 % 30 % -12 % 5-10 km 49 % 49 % 0 % 10-20 km 24 % 32 % +8 % >20 km 9 % 14 % +5 %
435
3.4.2 User views and wishes 436
The views and wishes of the participants asked in the user study were asked in a closed form via 437 pre-formulated statements, which the respondents could agree with: 438
"To what extent do you agree with the following statements?" 439
440
The statement "I would like to see better cycle lanes" received the highest level of agreement 441 at 69 %, which fits with the general weakness identified by the user study: traffic and cycling 442 infrastructure. Another 56 % agree with the statement "I wish there was a better charging 443 infrastructure for eBikes", which underlines the use of the Pedelec as an everyday vehicle, as 444 well as the frequent use and long distances of Pedelecs. 55 % of the respondents agree with the 445 statement "I would like to see politics promote eBike riding more" and see politics as responsible 446 for improving the framework conditions for Pedelecs. 447
Despite these user views and desires, as well as the previously perceived low level of safety, 448 62 % agree with the statement "I think eBikes are good". Another 58 % affirm the statement 449 "eBikes can describe a solution to the traffic problem in cities" and 56 % agree with the 450 statement "eBikes are environmentally friendly". The acceptance for the Pedelec with all its 451 advantages is consequently given among the respondents. 452

17
4 DISCUSSION 453
4.1 Cycling safety 454
Since the spread of Pedelecs will still increase significantly, the course of the accident figures is 455 also very variable. Furthermore, a comparison with bicycles based on official accident statistics 456 - due to the different under-reporting rates (cf. chapter 3.3) - can only be an approximation. In 457 such a comparison between bicycles and Pedelecs, it makes sense to relate the accident figures 458 to other parameters, e.g. to the number of vehicles used and their mileage (cf. chapter 3.4). 459
Since bicycles and Pedelecs are not registered in most countries and thus also in GER, it is not 460 possible to directly conclude on the vehicle fleet size in the field. Considering an average use of 461 seven years (Juris, 2021), it is possible to determine the fleet size in the field based on the annual 462 sales figures5. 463
In Figure 17, it can be seen how the stock of bicycles is continuously decreasing over the last few 464 years and being replaced by Pedelecs. Furthermore, a trend reversal in the total stock (bicycles 465 plus Pedelecs) can be observed from 2015 onwards. The increase is due to the growing 466 popularity of Pedelecs. It can be assumed that bicycles will continue to be replaced by Pedelecs 467 in the coming years and that new user groups for Pedelecs will also be developed. 468
469
470
Figure 17: Vehicle stock according to sales figures of Bicycle 471 and Pedelec based on 7 years of use 472
473
The evaluation of accidents with personal injury according to DESTATIS in GER in 2019, in 474 relation to every 100k vehicles in the field6, shows that significantly fewer accidents with 475 personal injury per 100k vehicles occur with Pedelecs than with bicycles (cf. Table 3). This is 476 remarkable because the average mileage, as determined in chapter 3.1, is not included in this 477 analysis. 478
5 Sales figures of bicycles and Pedelecs according to the German two-wheeler industry association (ZIV), cf. https://www.ziv-zweirad.de/presse-medien/pressemitteilungen/ 6 Stock figures and mileage for motorized two-wheelers and passenger cars according to vehicles registered with the German Federal Motor Transport Authority (KBA)

18
The distance travelled plays an important role when considering accident frequency, as a vehicle 479 that travels significantly longer distances typically has a higher accident exposure, as can be seen 480 in the example of the passenger car. As the user study shows, Pedelecs are used for significantly 481 longer distances compared to bicycles (in GER, for example, factor 2, cf. chapter 3.1)7. Table 4 482 below shows the calculated number of accidents with personal injury per billion vehicle km. 483 When using the average mileage for GER (see above as well as KBA), the risk for bicycles is about 484 a factor of 3 higher than for Pedelecs. Pedelecs are at a level like that of motorised two-wheelers. 485
486
Table 3: Accidents regarding vehicle stock in GER in 2019 487
Involvement of … Accidents with causalities
Vehicle stock
Accidents with causalities
per 100k vehicles Pedelec 10.806 5.090.000 212 Bicycle 77.480 23.580.000 329
Two-wheeler (with license plate) 26.938 4.506.410 598
Passenger car 236.675 47.715.977 496 488
Table 4: Accidents regarding vehicle stock and average mileage in GER in 2019 489
Involvement of … Mileage per year per vehicle in km
Total milage in billion km
Accidents with causalities per 1
billion km Pedelec 1.000 5,1 2.123 Bicycle 500 11,8 6.572
Two-wheeler (with license plate) 2.218 10,0 2.695
Passenger car 13.602 649,0 365 490
For the derivation of recommendations for action, it can be concluded that measures to increase 491 road safety should focus equally on bicycles and Pedelecs, even if the vehicle-specific risk is 492 lower for Pedelecs. The lower accident risk with Pedelecs can be justified on the basis of the 493 user study with the following aspects: 494
• Predominantly new vehicles, as the trend towards Pedelecs is still young and leasing 495 offers have a fixed term (cf. chapter 3.3). 496
• Regular maintenance, as most Pedelec manufacturers and suppliers of electric drives 497 recommend a maintenance interval of one year at a trained specialist dealer (cf. chapter 498 3.2) 499
• High-quality components, as there is a high willingness to pay for Pedelecs, especially 500 due to the substitution of expensive means of transport in the course of the modal shift 501 (cf. chapter 3.4). 502
7 Further studies in this context show that the values determined in the user study for the Pedelec are rather conservative (cf. e.g. (Castro, Alberto, & et al., 2019)), while those for the bicycle are rather optimistic (cf. e.g. (Castro, Kahlmeier, & Gotschi, 2018)).
19
• Active lighting devices, as a direct energy supply via the battery of the electric drive as 503 well as switching on and off via the human-machine interface of the Pedelec is possible. 504 Especially in bad weather conditions (see chapter 3.1), lighting devices can make a 505 significant contribution to road safety (DEKRA, 2020). 506
507
It is important to emphasise that despite the lower vehicle-specific risk of Pedelecs, potential 508 safety-enhancing measures should - if possible - be addressed directly. First and foremost these 509 are: 510
• Transport infrastructure, as Pedelecs have a higher accident exposure due to their use 511 as everyday vehicles and the lack of infrastructure to adapt their driving behaviour (cf. 512 chapter 3.1). In particular, the multimodal use of traffic space should be taken into 513 account, a continuous cycle path network with sufficient cycle path width8 should be 514 created and intelligent traffic infrastructure solutions (e.g. "green wave" concepts) 515 should be implemented (cf. chapter 3.2). 516
• Short-term transport infrastructure measures can be (1) the opening of cycle paths 517 outside built-up areas for so-called S-Pedelecs9 in order to make inter-urban commuting 518 safer until the completion of cycle lanes (cf. Chapter 3.4) and (2) increasing the usability 519 of the cycle infrastructure, e.g. by making appropriate clearing and gritting concepts 520 available for winter conditions (cf. Chapter 3.1, (DEKRA, 2020) and (ADAC, Radfahren im 521 Winter, 2021)). 522
• Helmet recommendation, especially for older users, as they have a limited physical 523 capacity (e.g. balance problems) and the consequences of accidents are more serious 524 (e.g. higher vulnerability) (Malczyk, 2015). The importance of recommending helmets 525 for older people is also underlined by the results of the survey in (Nobis & Kuhnimhof, 526 2019), which coincides with the user study presented here (cf. chapter 3.2), but also 527 shows the helmet-wearing rate across the age of the riders. For example, the helmet 528 wearing rate decreases sharply for the over 50s and ends at a low 22 % for the over 80s 529 who always wear a helmet (compared to the average of 34 % across all age groups). 530
• Riding training, especially for new and returning riders, as they are often inexperienced 531 riders with insufficient riding experience - see also (ADAC, Sicher auf dem Pedelec 532 unterwegs, 2021). Examples include dealing with complex traffic situations in urban 533 areas or the use of Pedelecs regardless of weather conditions (see chapter 3.1). 534 Furthermore, the newcomers are not yet used to the newer technology, e.g. brakes. 535
536
4.2 Vehicle based systems 537
The electrical energy present in Pedelecs offers new functional possibilities, such as on-site 538 safety systems, which are divided into active and passive safety systems. Passive safety systems 539 serve to protect against serious injuries in the event of an accident. They reduce the risk of injury 540 and mitigate the consequences of an accident. Examples of passive safety systems already 541 available on bicycles or Pedelecs are the helmet, the airbag (Hövding, 2021) and eCall systems, 542 such as the Help Connect feature from Bosch eBike Systems. The latter addresses, among others, 543
8 Cf. for GER (ADAC, Test: Sind Radwege breit genug?, 2021). 9 Light motorized vehicles of category L1e-B, with motor assistance up to 45 km/h, limited assistance ratio

20
the 18 % of cyclists and Pedelec riders who were injured but did not receive direct help, as 544 identified in chapter 3.3. 545
Active safety systems help to avoid accidents and make a preventive contribution to road safety. 546 The most popular example is ABS, which stabilises the vehicle in critical situations and optimises 547 deceleration. The primary aim of ABS is to prevent wheel lock-up, which often occurs with 548 uncontrolled wheels due to over-braking on slippery surfaces and/or in bad weather conditions 549 (see chapter 3.2). Due to the unfavourable ratio of centre of gravity height to wheelbase, the 550 additional function of rear wheel lift-up control (RLC) is of particular interest for Pedelecs in case 551 of over-braking on non-slippery surfaces (see chapter 3.3). The aim of RLC is to reduce the risk 552 of an endo (acronym for end over front) around the vehicle's transverse axis during braking. In 553 the case of Pedelecs, the special challenge arises that the risk minimisation of an endo must also 554 function optimally in hilly topography (cf. chapter 3.1). Assuming a full ABS penetration on 555 Pedelecs in the field up to every third crash involving a Pedelec could be avoided in Germany (cf. 556 (Moennich et al.)). ABS with the additional function RLC are available on the Pedelec market 557 from (BluBrake, 2021) and Bosch eBike Systems. 558
In addition to Pedelecs, other motorised road users (e.g. cars, trucks) should also push for vehicle 559 systems to protect VRUs. The focus should be on conflict situations in the intersection area (see 560 chapter 3.3). The legal obligation to fit turning assistants10 as standard equipment on trucks and 561 buses from 2022 is to be welcomed (EU, 2019), although a retrofitting requirement would be 562 desirable. Also to be welcomed are the activities of EuroNCAP, which are increasingly raising the 563 requirements for automated emergency brakes (AEB) in the event of an imminent collision with 564 VRUs (EuroNCAP, 2021). Due to the challenging driving task during parking, an increasing spread 565 of parking assistants with emergency braking function (cf. e.g. (ADAC, Test: Parkassistenten mit 566 Notbremsfunktion, 2021)) as well as dismounting warning systems (cf. e.g. (ADAC, 567 Ausstiegswarner, 2021)) are recommended. In this context, it is also interesting to see which 568 future safety potentials result from connecting the traffic participants and infrastructure (cf. e.g. 569 (Uittenbogaard & et al., 2021)). 570
571
10 Turning Assistant, which detects VRUs in front of and beside the vehicle and warns driver when turning.

21
5 CONCLUSIONS 572
The motivation for conducting the quantitative user study was a partially unclear accident 573 situation, caused by limited official statistics based on police reports. In particular, it was 574 assumed that accidents with collisions and high injury severity were overestimated. The aim of 575 the study was to obtain a more representative view of bicycle and Pedelec safety by interviewing 576 users. The focus was to examine safety fears and safety behaviour, as well as accident 577 experiences. 578
The results of the study show that Pedelecs compared to bicycles are used more for everyday 579 purposes, more often in terms of frequency, more to cover long distances and more in all 580 weather conditions. Due to the associated higher exposure to accidents and the lack of 581 possibilities to adapt their riding behaviour, Pedelec riders try to reduce their individual accident 582 risk by increasing their visibility in road traffic and wearing a helmet. 583
For both bicycles and Pedelecs, motor vehicles and commercial vehicles are the most frequent 584 collision opponents. It is striking that Pedelecs are less involved in single vehicle accidents than 585 bicycles, whereas Pedelecs collide more frequently with other bicycles or pedestrians. The lower 586 proportion of single-vehicle accidents can be explained by the fact that Pedelecs are primarily 587 used in urban areas on roads with good grip and that they are easy to handle (new, high quality 588 and regularly maintained vehicles). Critical, on the other hand, seems to be the cramped urban 589 traffic space and the associated potential for conflict with motorised traffic, as well as the 590 multimodal use of the cycling infrastructure with a lack of possibilities for VRUs to avoid each 591 other. 592
Furthermore, the study results show that in 79 % of bicycle accidents and in 55 % of Pedelec 593 accidents, the police were not notified and consequently the accident was not included in the 594 official accident statistics. The high and at the same time different under-reporting rates 595 motivate studies such as the one presented here and point to a new problem area in accident 596 research in the context of bicycles and Pedelecs. If the under-recording rates of both vehicle 597 types differ, comparative statements based on official accident statistics are difficult. 598
The presented user study shows that bicycles and Pedelecs are basically used in a similar way in 599 many respects. For this reason, measures to increase road safety should be oriented first and 600 foremost to the needs of bicycles, as they are more widespread and have a higher accident risk 601 in terms of both number of users and mileage. In addition, Pedelecs, which are increasingly used 602 as everyday vehicles, can use the additional available electrical energy and computing power to 603 make the Pedelec even safer through vehicle safety systems. 604
605

22
REFERENCES 606
ADAC. (25. 04 2021). Von Sicher auf dem Pedelec unterwegs: https://www.adac.de/rund-ums-607 fahrzeug/zweirad/fahrrad-ebike-pedelec/vorschriften-verhalten/fahr-tipps-pedelec/ abgerufen 608
ADAC. (25. 04 2021). Von Test: Sind Radwege breit genug?: https://www.adac.de/rund-ums-609 fahrzeug/tests/fahrrad/radwegbreiten/ abgerufen 610
ADAC. (25. 04 2021). Von Radfahren im Winter: https://www.adac.de/rund-ums-611 fahrzeug/zweirad/fahrrad-ebike-pedelec/vorschriften-verhalten/radfahren-winter/ abgerufen 612
ADAC. (26. 04 2021). Von Ausstiegswarner: https://www.adac.de/rund-ums-613 fahrzeug/tests/assistenzsysteme/ausstiegswarner/ abgerufen 614
ADAC. (25. 04 2021). Von Test: Parkassistenten mit Notbremsfunktion: 615 https://www.adac.de/rund-ums-fahrzeug/tests/assistenzsysteme/parkassistent-616 bremsfunktion/ abgerufen 617
Adminaité-Fodor, D., & Jost, G. (2020). How safe is walking and cycling in Europe? Brussels: 618 European Transport Safety Council. 619
BluBrake. (25. 04 2021). Von ABS for E-bikes: https://blubrake.it/ abgerufen 620
Bosch eBike Systems. (25. 04 2021). Von Help Connect: https://www.bosch-621 ebike.com/de/produkte/help-connect abgerufen 622
Bosch eBike Systems. (25. 04 2021). Von ABS: https://www.bosch-ebike.com/de/produkte/abs 623 abgerufen 624
Castro, A., Kahlmeier, S., & Gotschi, T. (2018). Exposure-adjusted road fatality rates for cycling 625 and walking in European countries. Paris: OECD/ITF. 626
Castro, Alberto, & et al. (2019). Physical activity of electric bicycle users compared to 627 conventional bicycle users and non-cyclists: Insights based on health and transport data from an 628 online survey in seven European cities. Transportation Research Interdisciplinary Perspectives. 629
DEKRA. (2020). Verkehrssicherheitsreport 2020 – Mobilität auf zwei Rädern. Stuttgart: DEKRA 630 Automobil GmbH. 631
Dozza, M., Werneke, J., & Mackenzie, M. (2013). e-BikeSAFE: A naturalistic cycling study to 632 understand how electrical bicycles change cycling behaviour and influence safety. International 633 Cycling Safety Conference. Helmond. 634
Eisenberger, D. (2021). Zahlen – Daten – Fakten zum deutschen Fahrrad- und E-Bike-Markt 2020. 635 Berlin: Zweirad-Industrie-Verband. 636
EU. (2019). Road safety: Commission welcomes agreement on new EU rules to help save lives. 637 Brussels: European Comission. 638
EuroNCAP. (26. 04 2021). Von AEB Cyclist: https://www.euroncap.com/en/vehicle-safety/the-639 ratings-explained/vulnerable-road-user-vru-protection/aeb-cyclist/ abgerufen 640
Gehlert, T. (2014). Unfallforschung kompakt: Neues Risiko Pedelec? Berlin: Unfallforschung der 641 Versicherer. 642

23
Hövding. (25. 04 2021). Von Airbag für Radfahrer: https://hovding.com/de/ abgerufen 643
Juris. (25. 04 2021). Von AfA-Tabelle: 644 https://www.bundesfinanzministerium.de/Content/DE/Standardartikel/Themen/Steuern/Weit645 ere_Steuerthemen/Betriebspruefung/AfA-Tabellen/Ergaenzende-AfA-Tabellen/AfA-646 Tabelle_AV.html abgerufen 647
Kirsche, U., & Friedrich, A. (2019). Deutschlandwetter im Jahr 2019. Offenbach: Deutscher 648 Wetterdienst. 649
Kirsche, U., & Lux, G. (2010). Deutschlandwetter im Jahr 2010. Offenbach: Deutscher 650 Wetterdienst. 651
Kirsche, U., Lux, G., & Friedrich, A. (2018). Deutschlandwetter im Jahr 2018. Offenbach: 652 Deutscher Wetterdienst. 653
Malczyk, A. (2015). Untersuchungen zur Schutzwirkung des Fahrradhelms. Berlin: 654 Unfallforschung der Versicherer. 655
Moennich, J., Lich, T., Maier, O., Georgi, A. (2018). Benefit estimation of an Antilock-Braking 656 System (ABS) for Pedelecs based on simulation of real world accidents. Proceedings, 7th 657 International Cycling Safety Conference, ICSC2018. 10-11 October 2018, Barcelona, Spain. 658
Nobis, C., & Kuhnimhof, T. (2019). Mobilität in Deutschland – MiD Ergebnisbericht. Bonn: 659 Bundesministerium für Verkehr und digitale Infrastruktur. 660
Schepers, P., Klein Wolt, K., Helbich, M., & Fishman, E. (2020). Safety of e-bikes compared to 661 conventional bicycles: What role does cyclists’ health condition play? Journal of Transport & 662 Health. 663
Twisk, D., Stelling, A., Van Gent, P., De Groot, J., & Vlakveld, W. (2021). Speed characteristics of 664 speed pedelecs, pedelecs and conventional bicycles in naturalistic urban and rural traffic 665 conditions. Accident Analysis & Prevention,. 666
Uittenbogaard, J., & et al. (2021). CAN BIKE-TO-CAR COMMUNICATION PREVENT CYCLIST 1 667 FATALITIES? International Cycling Safety Conference. Lund. 668
Wegman, F., Zhang, F., & Dijkstra, A. (2012). How to make more cycling good for road safety? 669 Accident Analysis & Prevention, 19-29. 670